By Ovi
All of the Crude plus Condensate (C + C) production data for the US state charts comes from the EIAʼs Petroleum Supply monthly PSM which provides updated information up to October 2023.
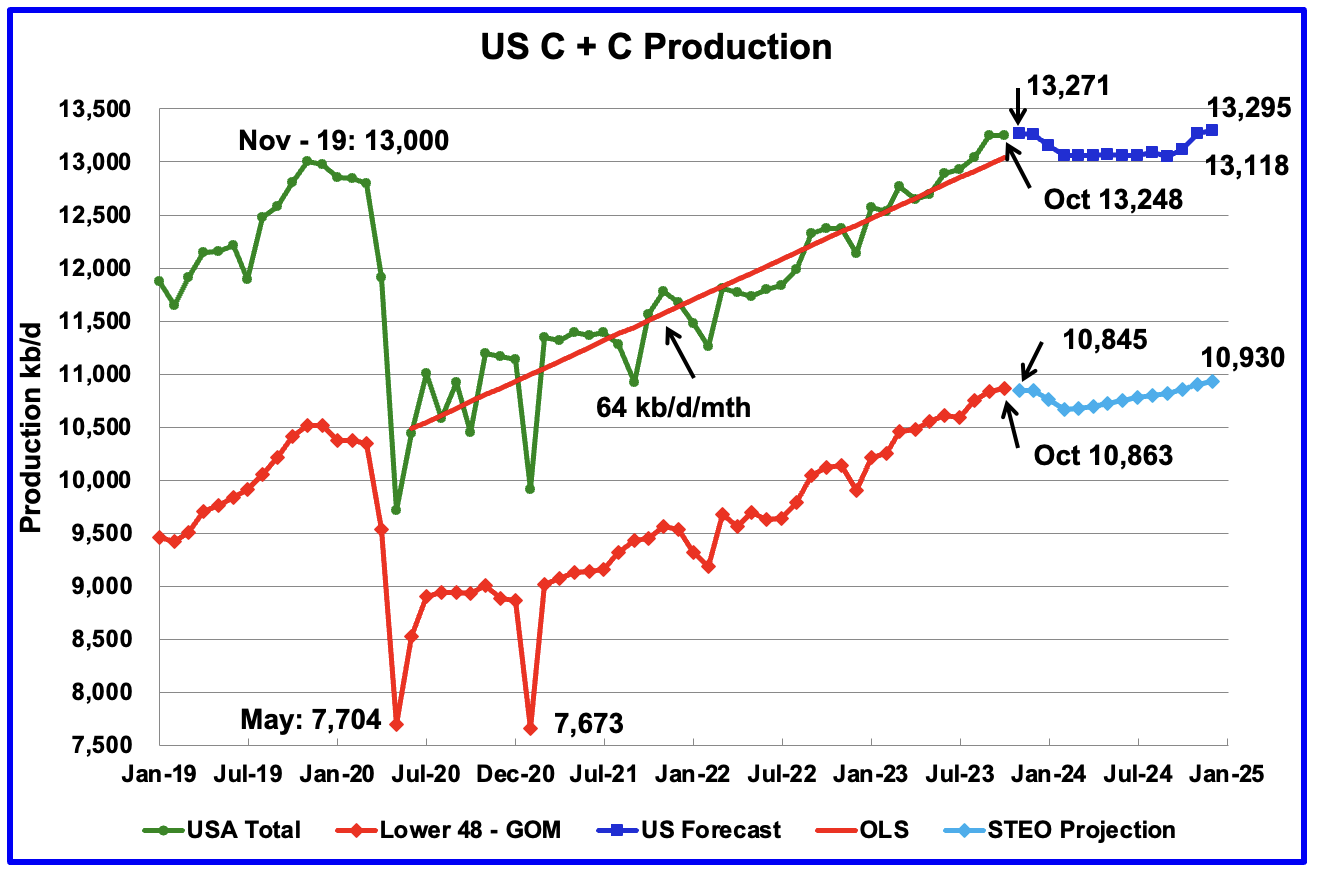
U.S. October oil production decreased by 4 kb/d to 13,248 kb/d. The decrease was primarily due to decreases in the GOM and North Dakota being partially offset by increases in Texas and New Mexico. Note that September production was revised up from 13,236 kb/d to 13,252 kb/d.
The dark blue graph, taken from the December 2023 STEO, is the forecast for U.S. oil production from November 2023 to December 2024. Output for December 2024 is expected to reach 13,295 kb/d which is 145 kb/d lower than forecast last month.
The red OLS line from June 2020 to October 2023 indicates a monthly production growth rate of 64 kb/d/mth or 768 kb/d/yr. Clearly the growth rate going forward into 2024, shown by the dark blue graph, is flat and significantly lower than seen in the previous June 2020 to October 2023 time period. From November 2023 to December 2024, production is expected to grow by 24 kb/d. Production is expected to fall from December 2023 to October 2024 before beginning to rise.
While overall US oil production decreased by 4 kb/d, the Onshore L48 had a production increase of 25 kb/d to 10,863 kb/d in October.
The light blue graph is the STEO’s projection for output to December 2024 for the Onshore L48. From November 2023 to December 2024, production is expected to increase by 85 kb/d to 10,930 kb/d. However note that the December 2024 production was revised down by 139 kb/d from 11,069 kb/d.
Oil Production Ranked by State
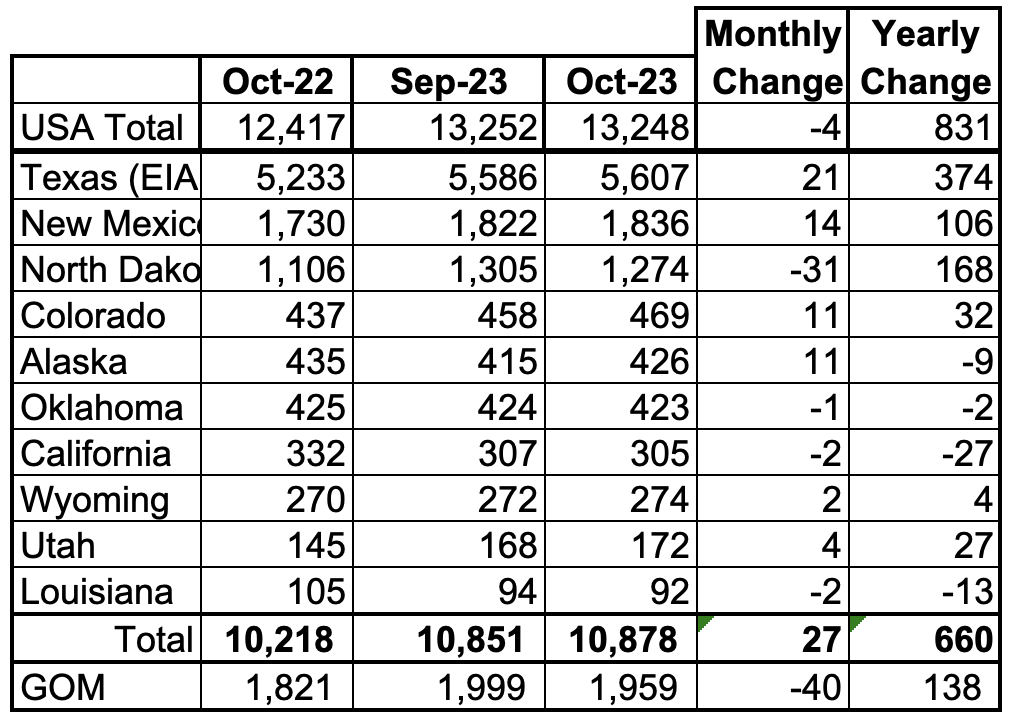
Listed above are the 10 states with the largest US oil production along with the Gulf of Mexico. These 10 states accounted for 82.1% of all U.S. oil production out of a total production of 13,248 kb/d in October 2023.
On a YoY basis, US production increased by 831 kb/d with the majority, 648 kb/d coming from Texas, New Mexico and North Dakota. GOM production dropped by 40 kb/d MoM while YOY it is up 138 kb/d.
State Oil Production Charts
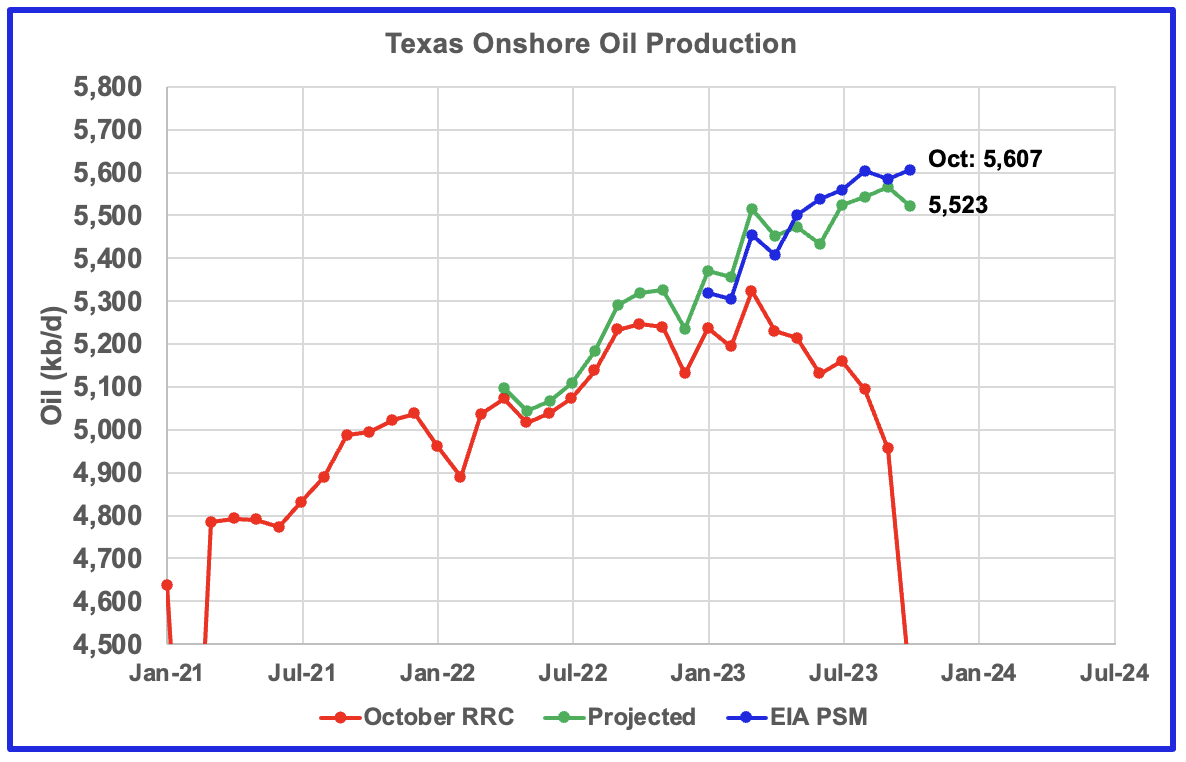
Texas production increased by 21 kb/d in October to 5,607 kb/d. However, relative to September’s production reported last month, 5,573 kb/d, October output was up by 34 kb/d.
The red graph shows Texas October oil production as reported by the Texas Rail Road Commission (RRC). The Green graph is a projection for Texas production using a methodology based on two months of production data, September and October, from the Texas RRC. The October estimate is low by 84 kb/d while the September estimate is low by 20 kb/d, 5,566 kb/d vs 5,586 kb/d. Next month the EIA’s October estimates will be revised and will be re-compared against the blue graph.
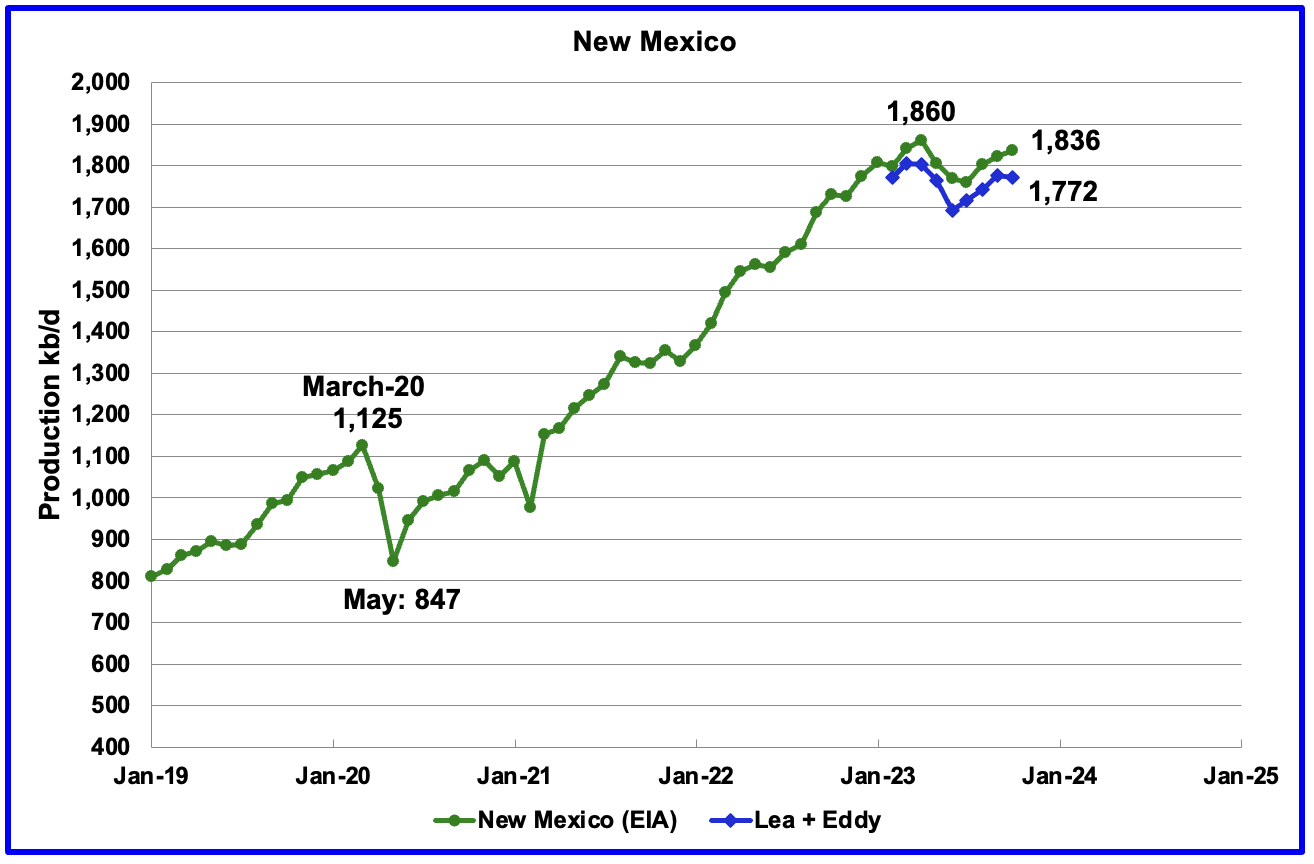
New Mexico’s October production rose by 14 kb/d to 1,836 kb/d. The combined output from Lea and Eddy counties dropped by 5 kb/d. It is interesting to see that the Lea + Eddy production trend is similar to the EIA’s except for the last month. The current gap between the New Mexico production report and the EIA’s is 64 kb/d and the majority of that gap will be closed over the next six months as the producers update their information. Part of the 64 kb/d gap comes from four additional New Mexico counties, San Juan,Sandoval, Chaves and Rio Arriba that produce close to 30 kb/d.
Of the EIA’s 1,836 kb/d output from New Mexico, 1,772 kb/d (96.5%) came from the Lea and Eddy counties. The Lea and Eddy county production data for October is not complete and will be updated over the next three months.
More production information from these two counties is reviewed in the special Permian section further down.
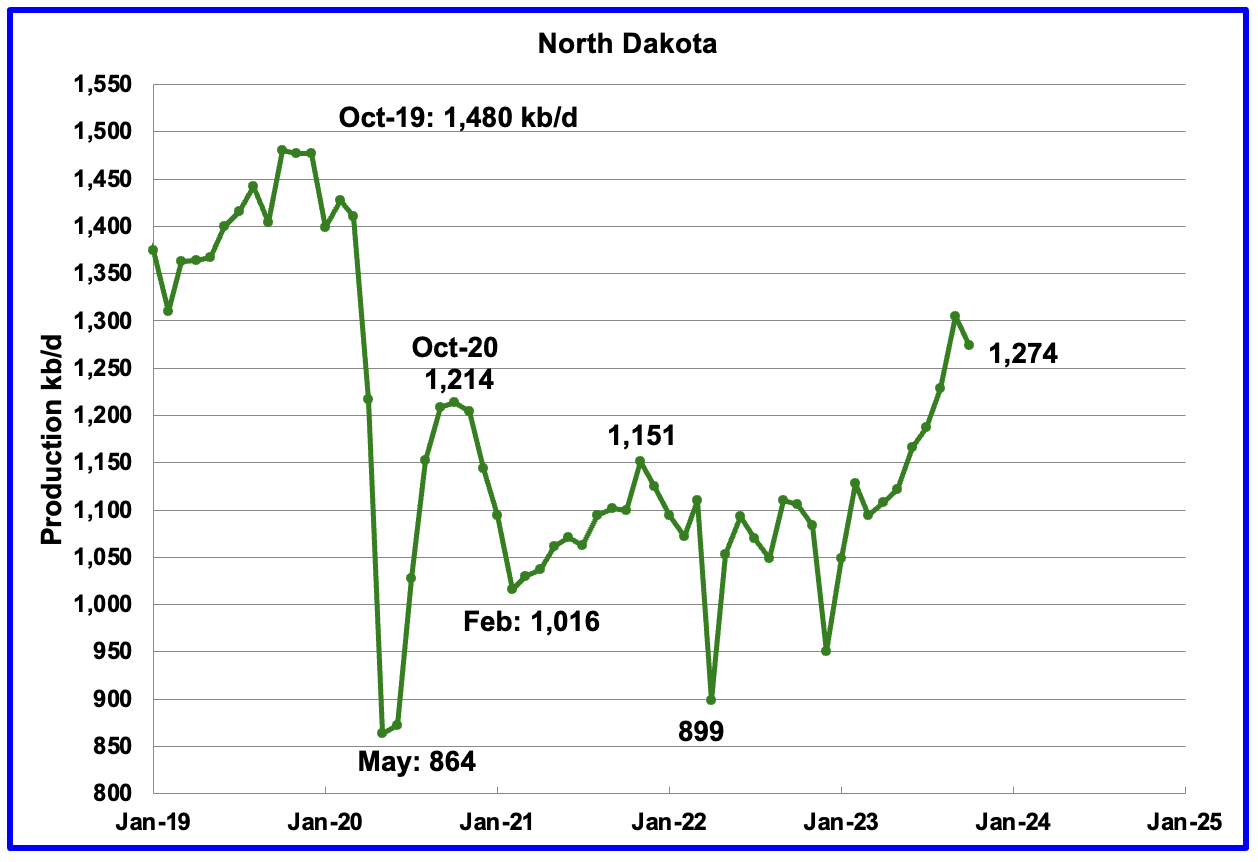
October’s output decreased by 31 kb/d to 1,274 kb/d.
According to this source, production growth for October was lower due to October bad weather.
“North Dakota oil and gas production both fell in October, largely due to bad weather, the state’s top oil regulator says.
There were 18,619 wells producing in October, another all-time high.
The state’s figures lag two months as officials collect and analyze data from energy companies.
Most of October’s drop was due to a period of heavy snow at the end of October, state Department of Mineral Resources Director Lynn Helms said during his monthly report.
“Somewhere between 50,000 and 90,000 barrels (of oil) a day shut in, and it took a full month to completely recover from that,” he said.”
This last statement Implies that November will also be down.
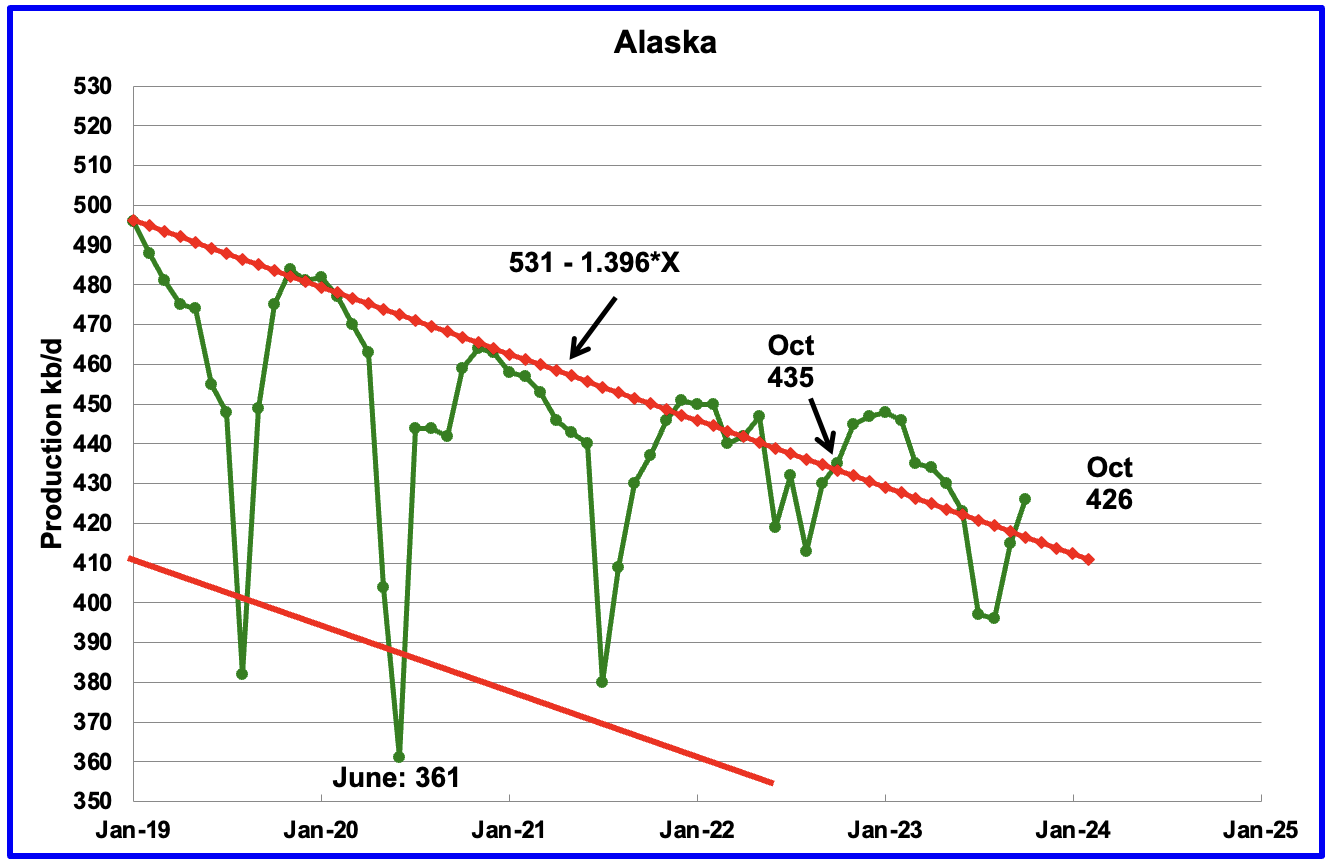
Alaskaʼs October output increased by 11 kb/d to 426 kb/d. Production YoY is down by 9 kb/d. The weekly EIA report continues to show December Alaska production is in the 430 kb/d to 440 kb/d range.
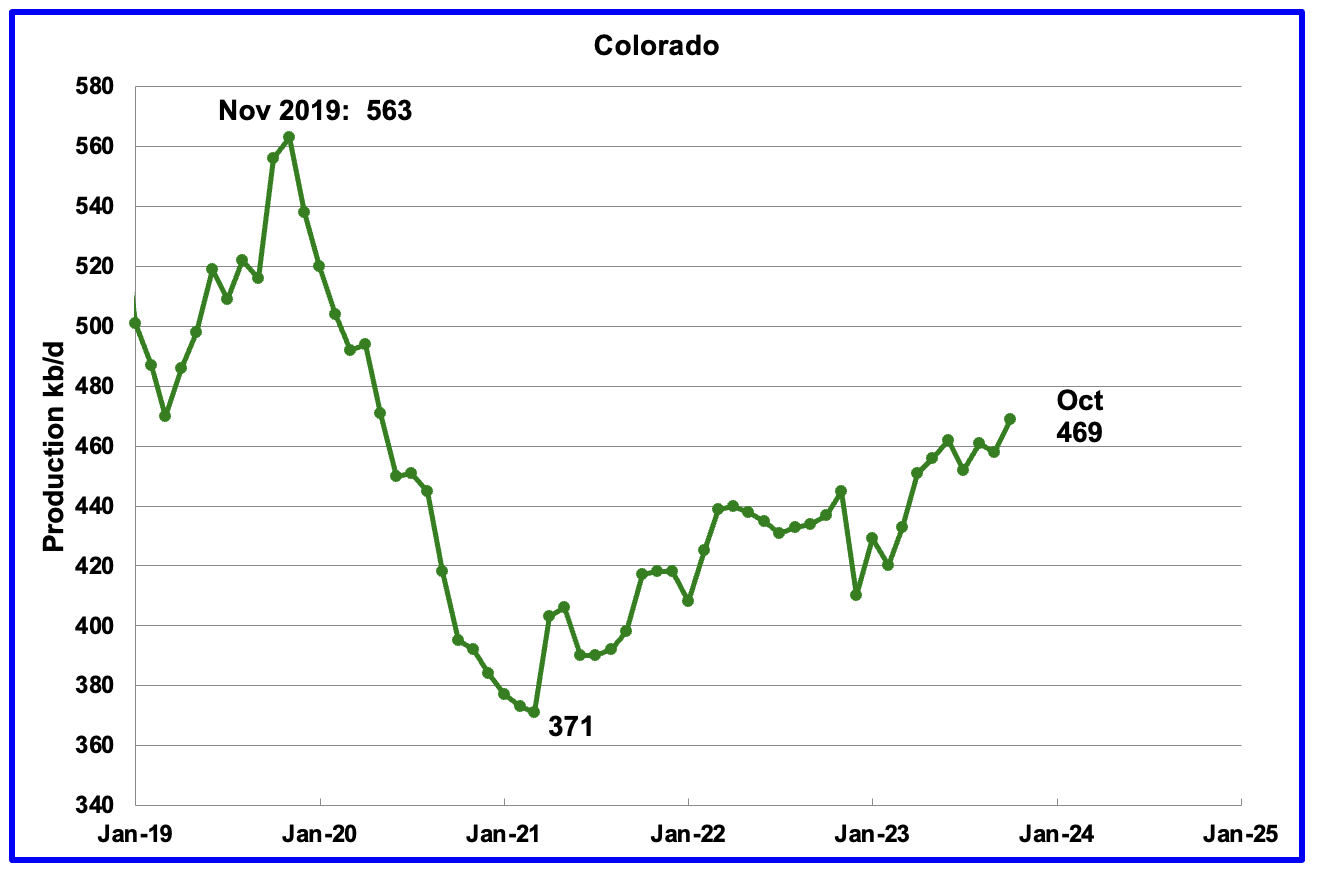
Coloradoʼs October production increased by 11 kb/d to 469 kb/d.
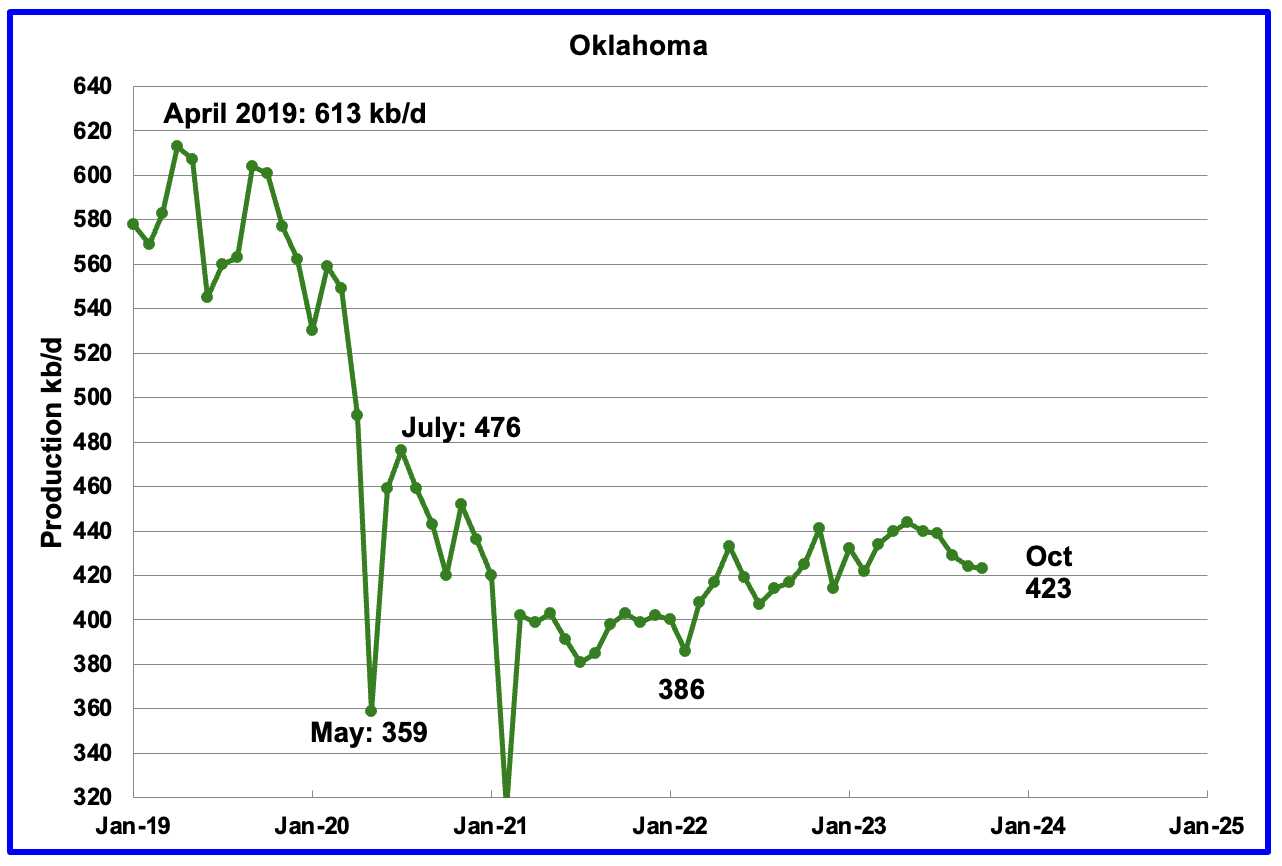
Oklahoma’s output in October decreased by 1 kb/d to 423 kb/d. Production remains 53 kb/d below the post pandemic July 2020 high of 476 kb/d. Output may be in a plateau/declining phase.
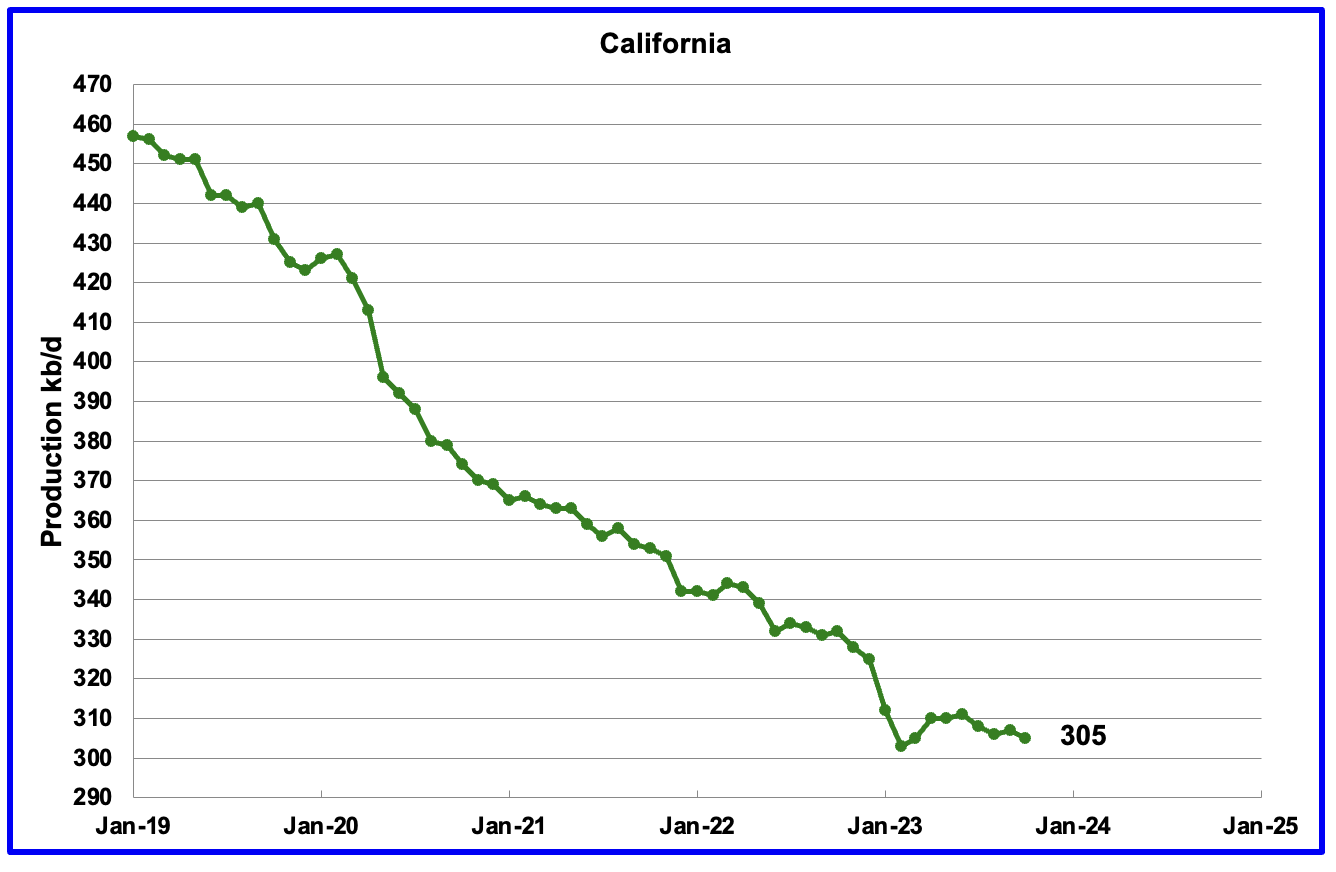
Californiaʼs October production declined 2 kb/d to 305 kb/d.
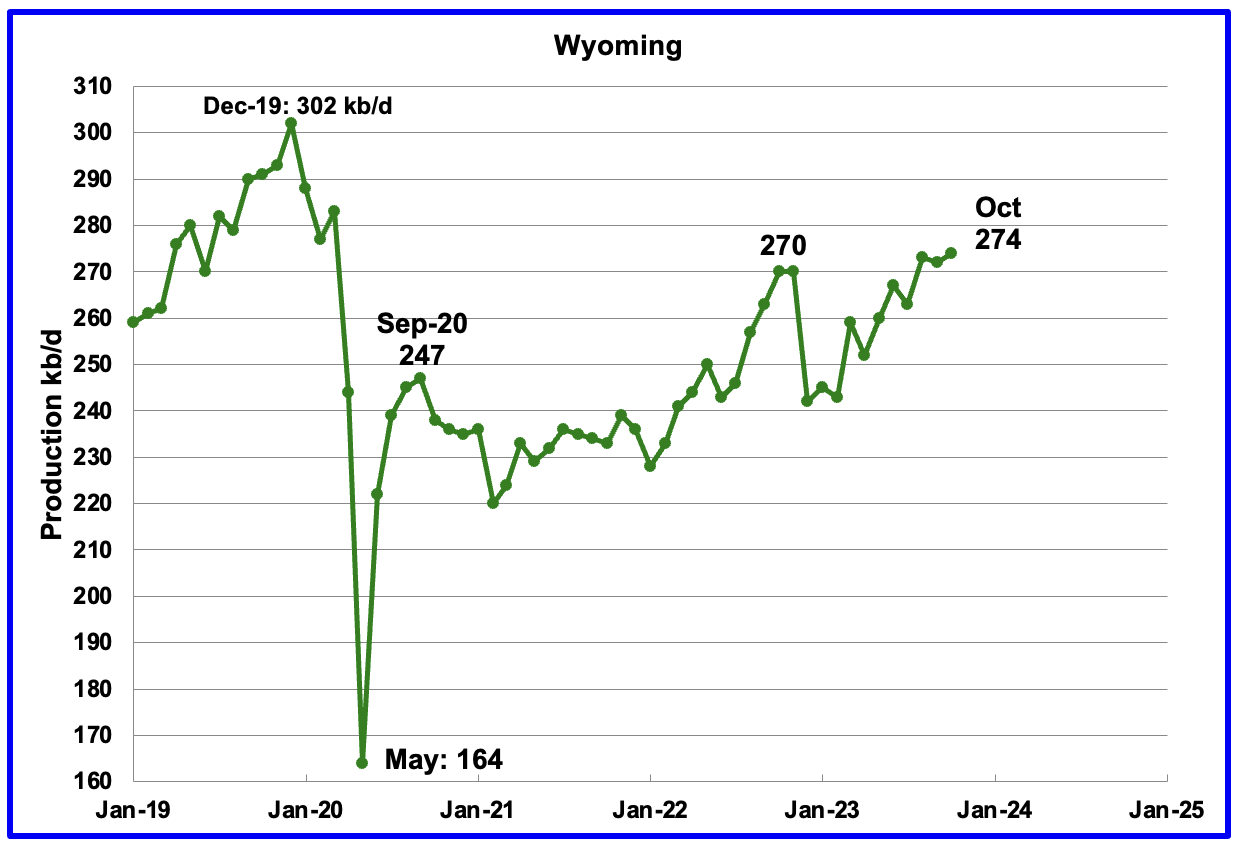
Wyoming’s oil production has been rebounding since March 2023. October’s oil production rose to 274 kb/d, a post pandemic record high, exceeding November 2022 by 4 kb/d.
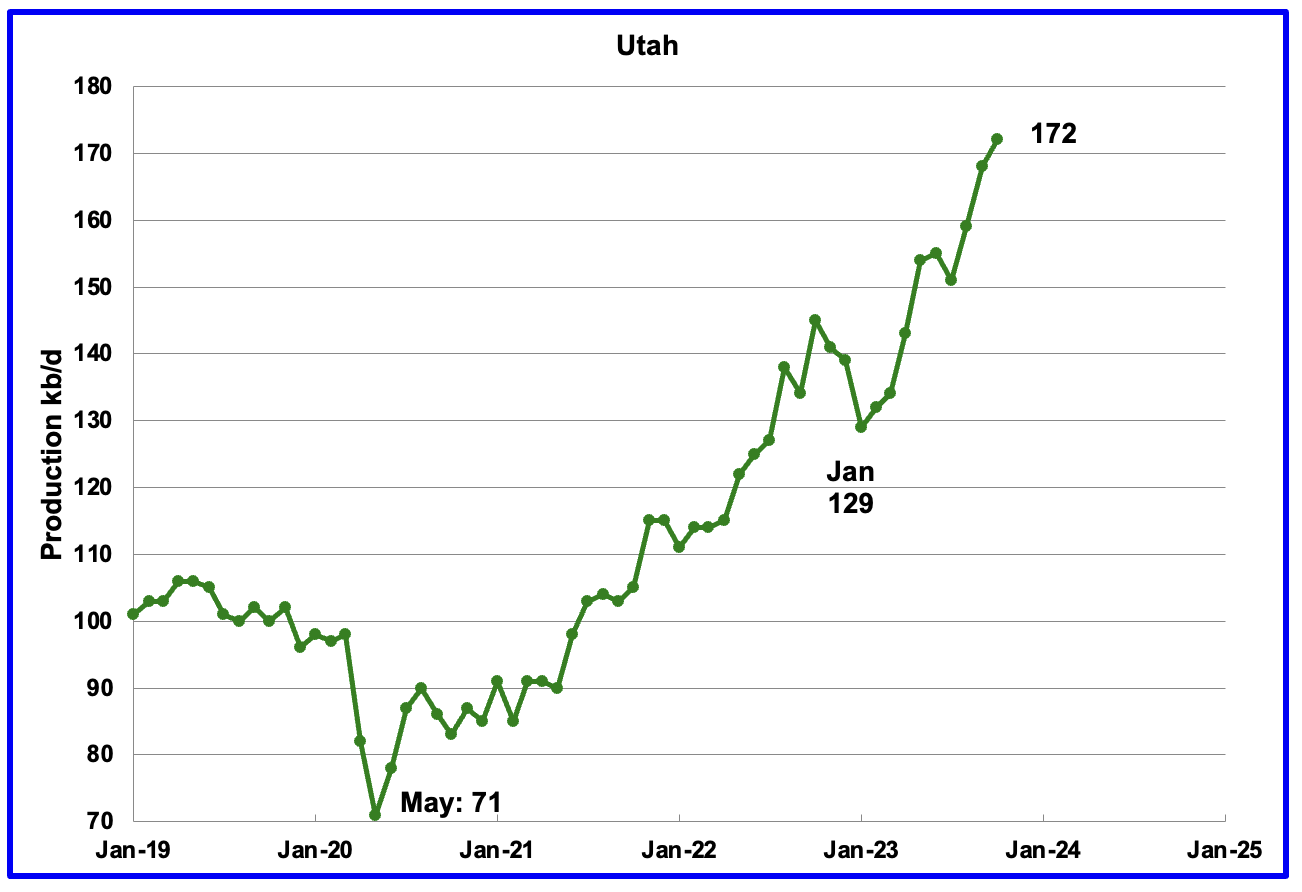
October’s production increased by 4 kb/d to 172 kb/d to another record high. For the first 4 months of 2023, Utah had 7 rigs operating. Since May the number of operational rigs has bounced between 8 and 9, which may account for the increased production.
The increased production since February has come from the Uinta basin.
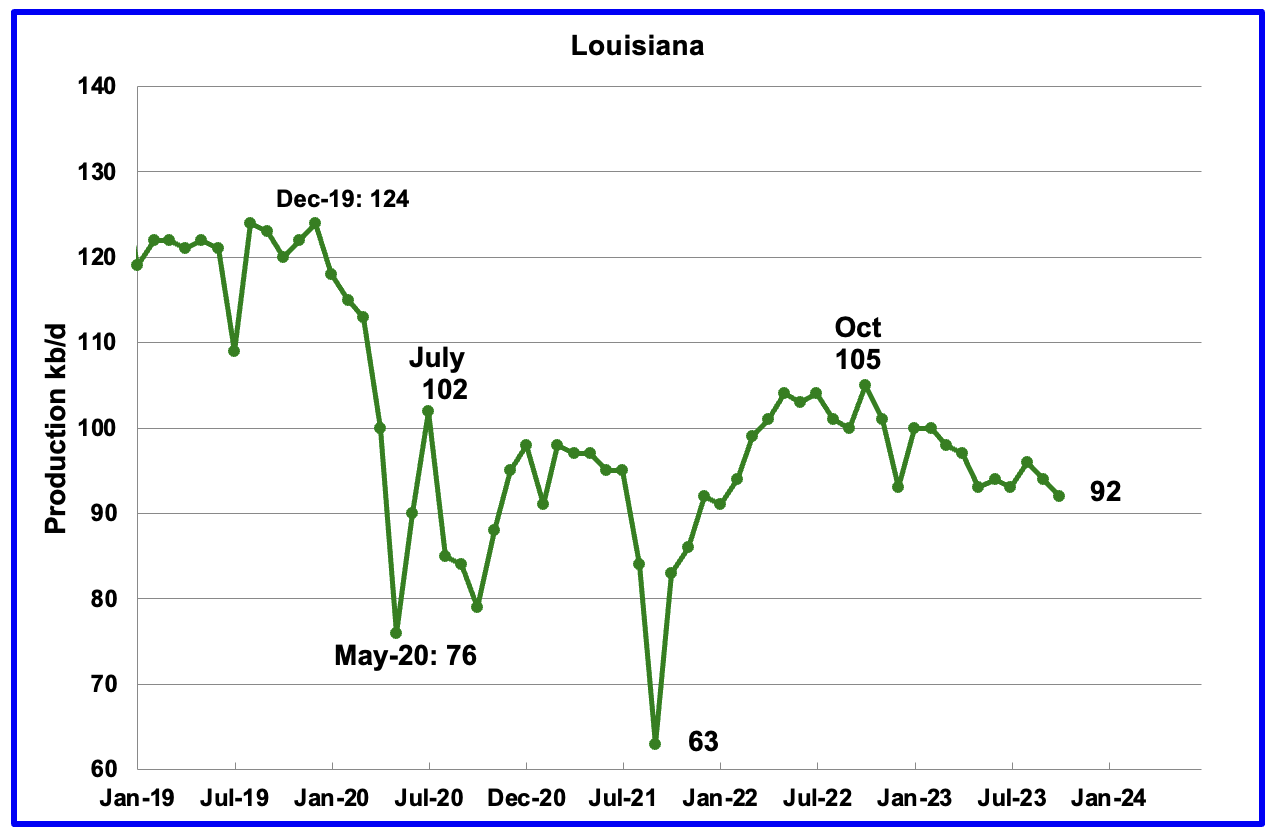
Louisiana’s output entered into a slow decline phase in October 2022. October’s production decreased by 2 kb/d to 92 kb/d and is 13 kb/d lower than October 2022.
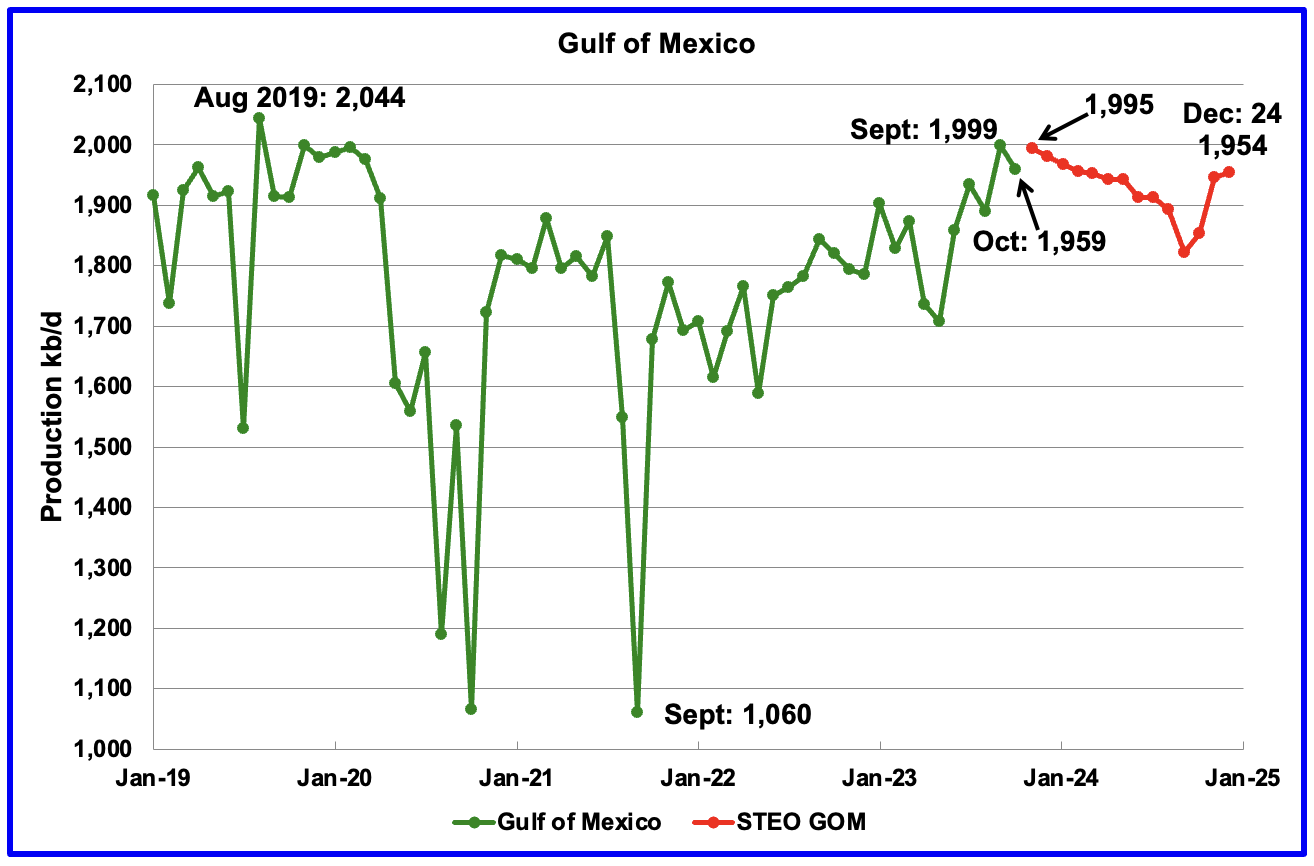
GOM production decreased by 40 kb/d in October to 1,959 kb/d but is expected to add 36 kb/d in November to 1,995 kb/d.
The December 2023 STEO projection for the GOM output has been added to this chart. It projects that over the next eleven months production will fall to 1,822 kb/d before rebounding to 1,954 kb/d in December 2024.
It is not known if the GOM decline shown after November 2023 is related to a combination of extensive maintenance and a general decline of wells. Also disappointing production from some highly touted wells could be an issue according to this source.
“PowerNap looks like an even bigger disappointment and is declining towardsn zero having produced less than 5% of its original reserve estimate.”
A Different Perspective on US Oil Production
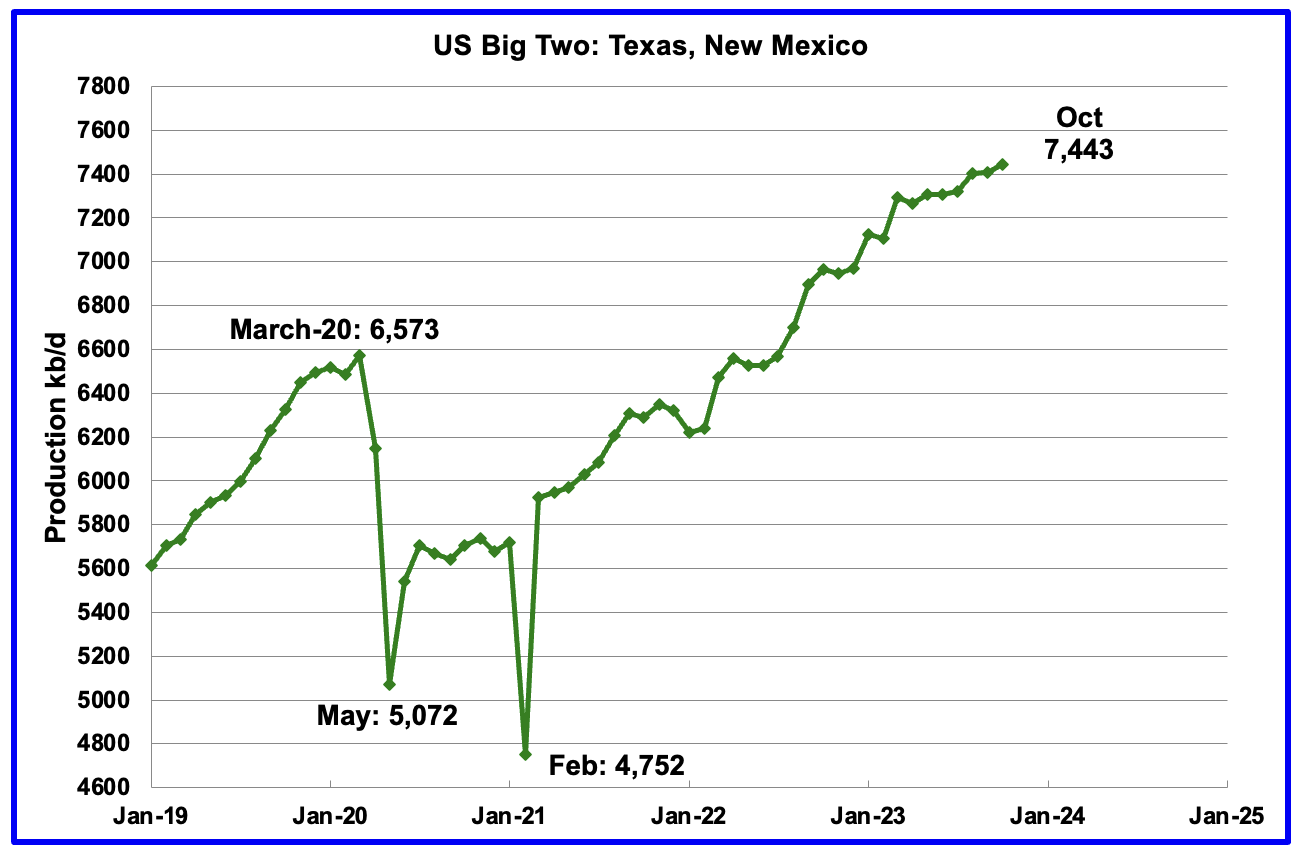
The Big Two states’ combined oil output for Texas and New Mexico.
October’s production in the Big Two states increased by a combined 35 kb/d to 7,443 kb/d with Texas adding 21 kb/d while New Mexico added 14 kb/d. October production of 7,443 kb/d is 53 kb/d higher than reported last month for September.
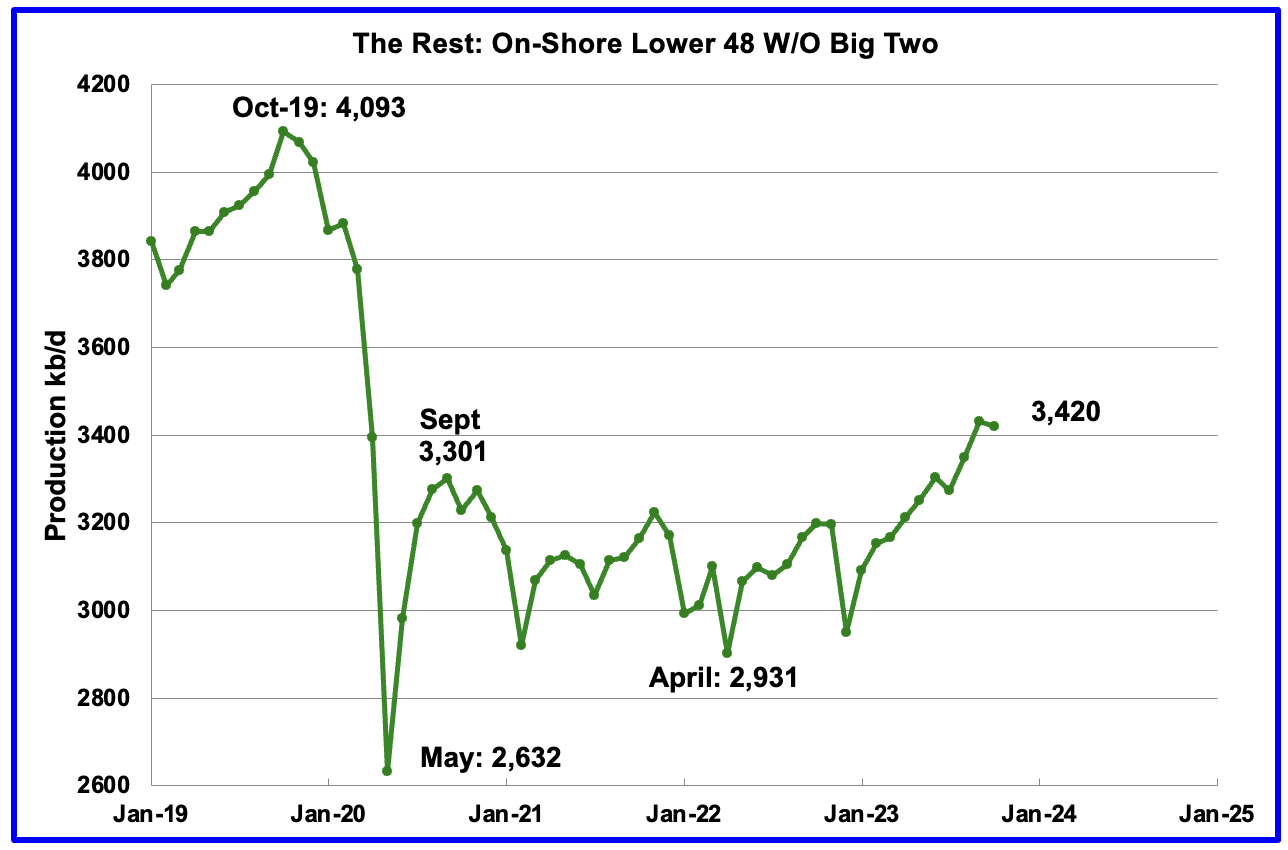
Oil production by The Rest
October’s production in The Rest decreased by 10 kb/d to 3,420 kb/d.
The main takeaway from The Rest chart is that current production is 673 kb/d below the high of October 2019 and this appears to be a permanent loss that will never be recovered.
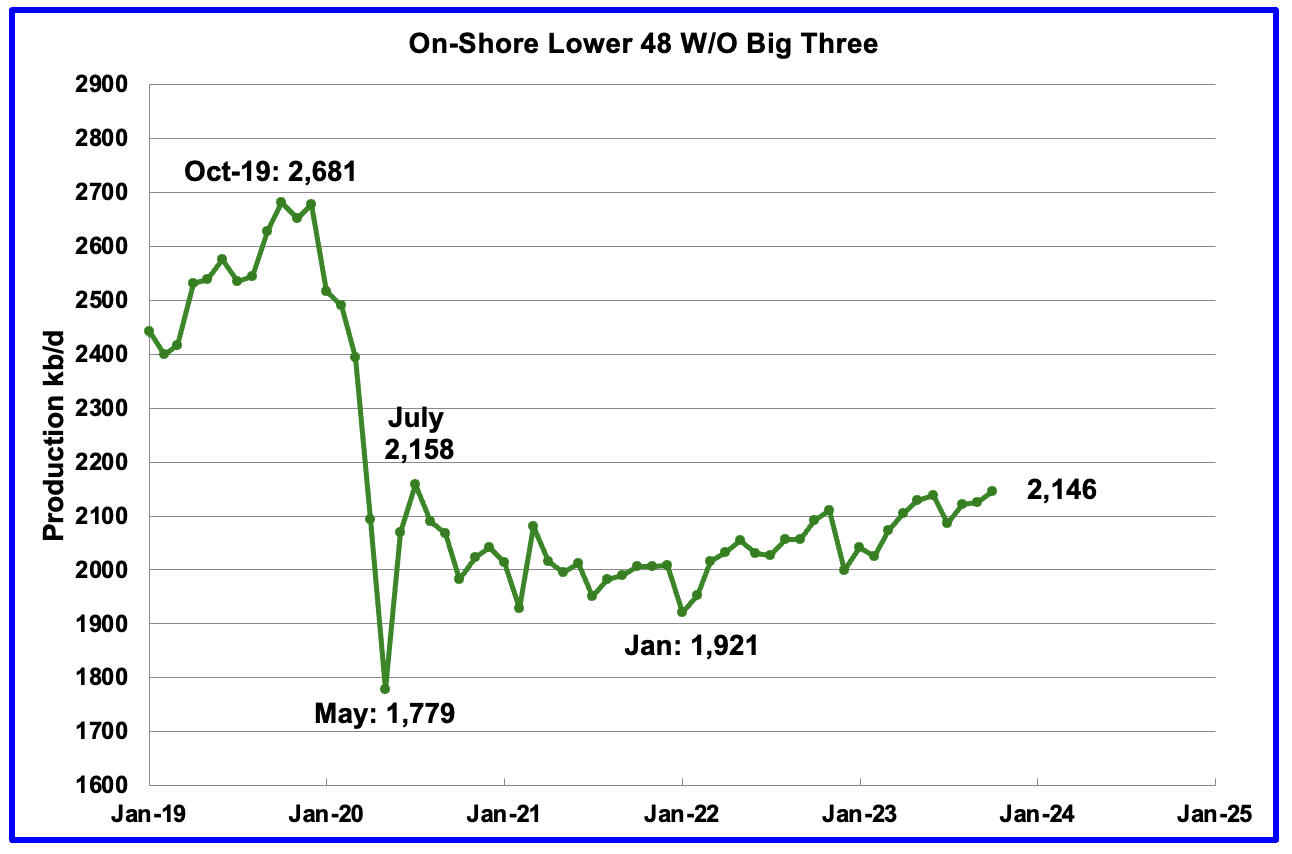
The On-Shore lower 48 W/O the big three, Texas, New Mexico and North Dakota, shows a slow rising trend from the low of January 2022. October’s production increased by 21 kb/d to 2,146 kb/d. The majority came from Colorado, 11 kb/d and West Virginia 7 kb/d. It is just 12 kb/d lower than the post covid rebound to 2,158 in July 2020.
Permian Basin Report by Main Counties and Districts
This special monthly Permian section was recently added to the US report because of a range of views on whether Permian production will continue to grow or will peak over the next year or two. The issue was brought into focus recently by the Goehring and Rozencwajg Report which indicated that a few of the biggest Permian oil producing counties were close to peaking or past peak. Also comments by posters on this site have similar beliefs from hands on experience.
This section will focus on the four largest oil producing counties in the Permian, Lea, Eddy, Midland and Martin. It will track the oil and natural gas production and the associated Gas Oil Ratio (GOR) on a monthly basis. The data is taken from the state’s government agencies for Texas and New Mexico. Typically the data for the latest two or three months is not complete and is revised upward as companies submit their updated information. Note the natural gas production shown in the charts that is used to calculate the GOR is the gas coming from both the gas and oil wells.
Of particular interest will be the charts which plot oil production vs GOR for a county to see if a particular characteristic develops that indicates the field is close to entering the bubble point phase. While the GOR metric is best suited for characterizing individual wells, counties with closely spaced horizontal wells may display a behaviour similar to individual wells due to pressure cross talking . For further information on the bubble point and GOR, there are a few good thoughts on the intricacies of the GOR in an earlier POB comment. Also check this EIA topic on GOR.
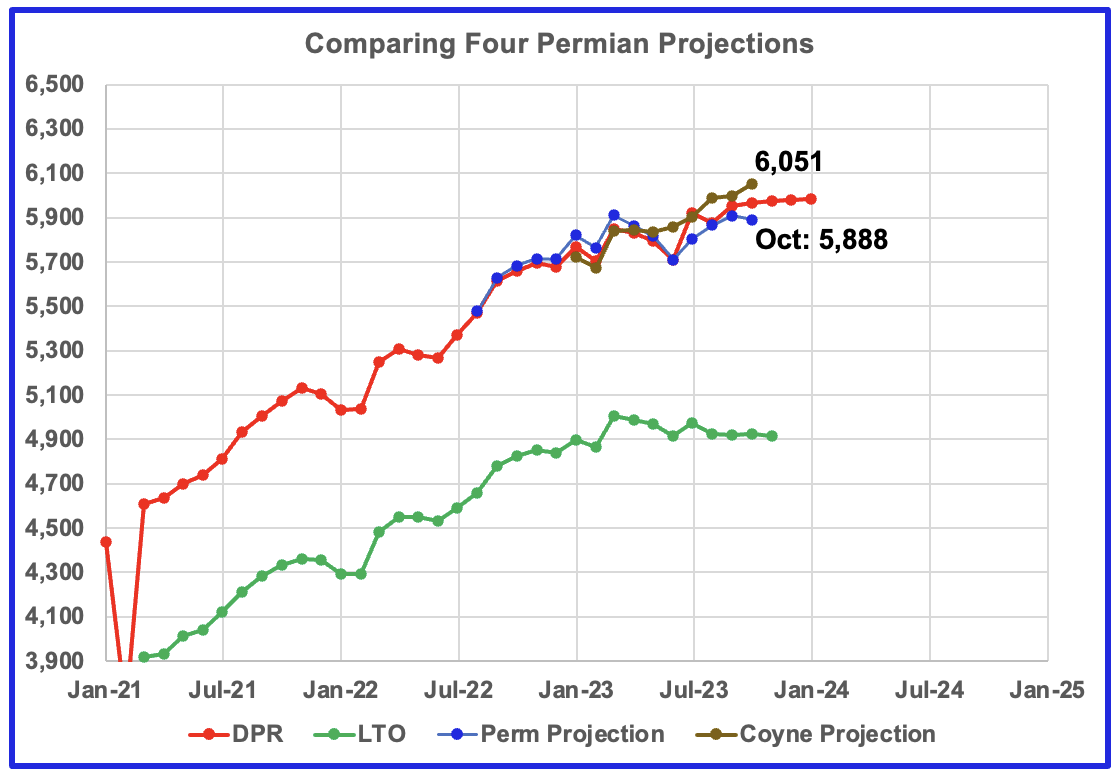
This chart shows four oil production projections for the Permian basin. The gap between the DPR and LTO projections is there because the DPR projection includes both LTO oil along with oil from conventional wells in the basins that it covers.
The red and green graphs show oil production as published by the EIA’s DPR and the LTO offices. Comparing the two, it appears that the LTO office believes Permian LTO production is currently is in a plateau phase while the DPR office is showing a small increase in growth before plateauing. The brown and blue markers are projections by D Coyne and yours truly respectively based on different methodologies.
The blue graph only uses two months of production data from New Mexico and the Texas RRC, September and October, to make its October projection. Note the projection for October is required because the October production data from the States is incomplete. A few more months of data is required to refine and modify the methodology. The blue graph is similar to the DPR and LTO graphs in the sense that it is also indicating that Permian production may be entering a plateau phase.
New Mexico Permian
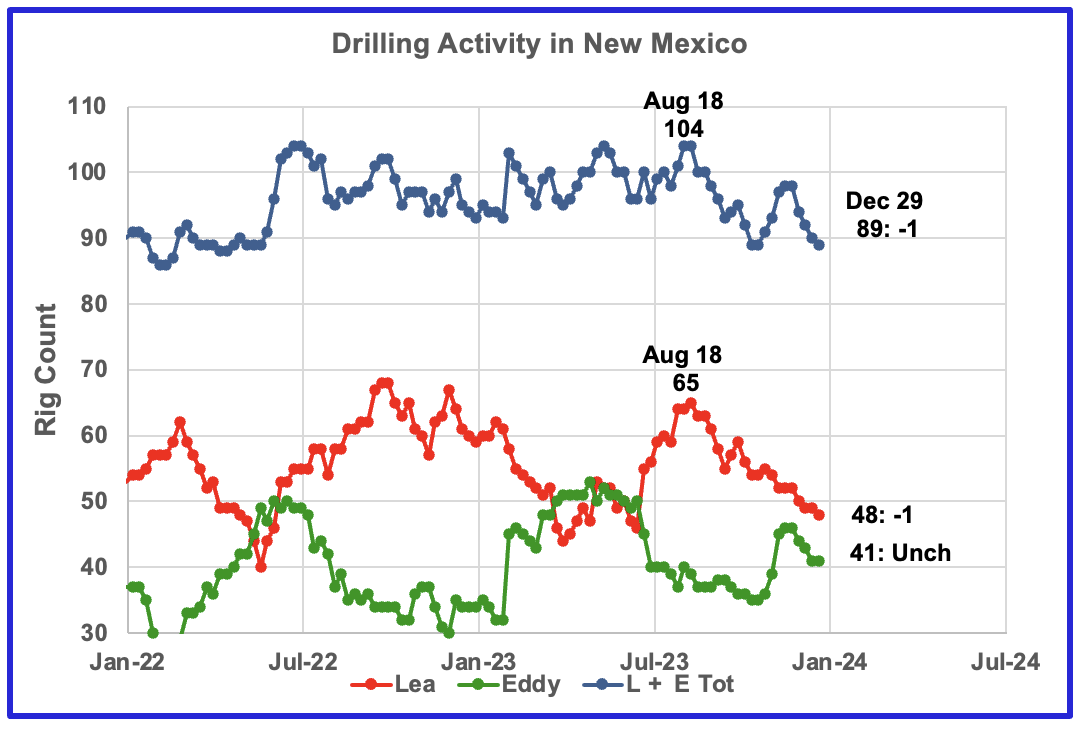
Over the past 4 months drilling activity in Lea has fallen each month. For the week ending December 29, the rig count in Lea dropped by one and was unchanged in Eddy. Since August, the New Mexico rig count has dropped from 104 in August to 89 at the end of December.
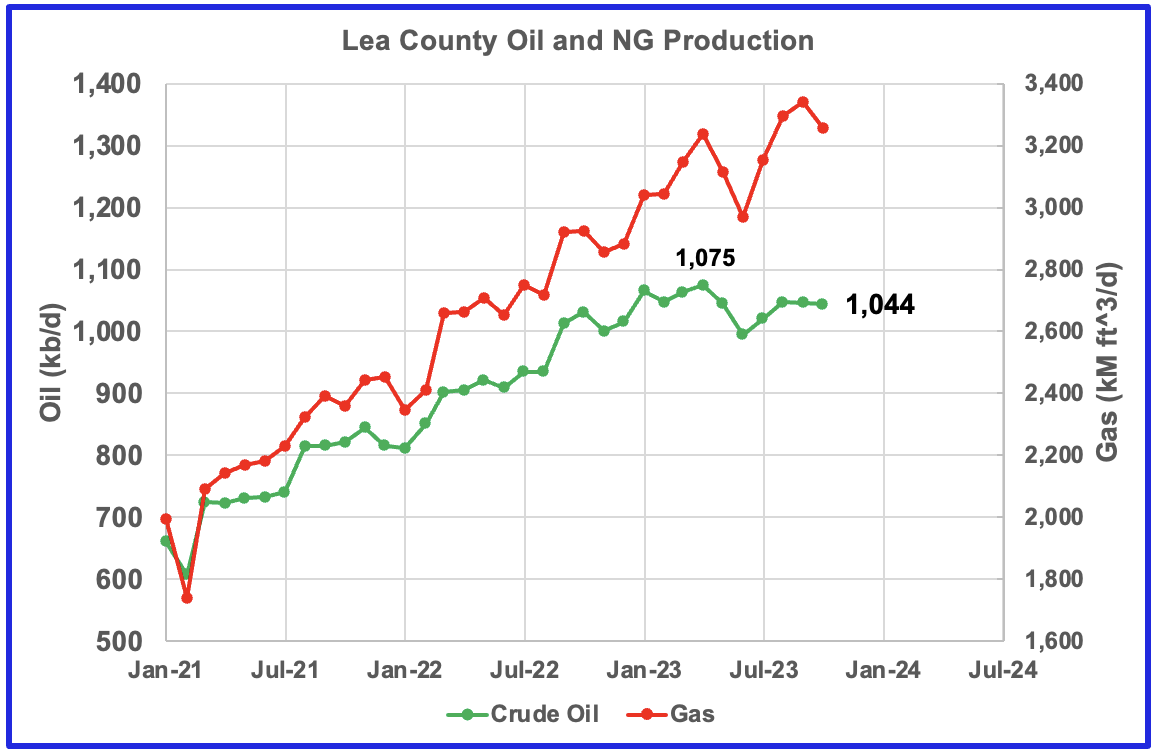
From June to September gas production rose faster than oil production in Lea county. However October saw a reversal and NG production dropped faster than oil production and the GOR dropped, next chart.
October oil production was 1044 kb/d and relatively unchanged since August, even though the rig count has dropped by 17.
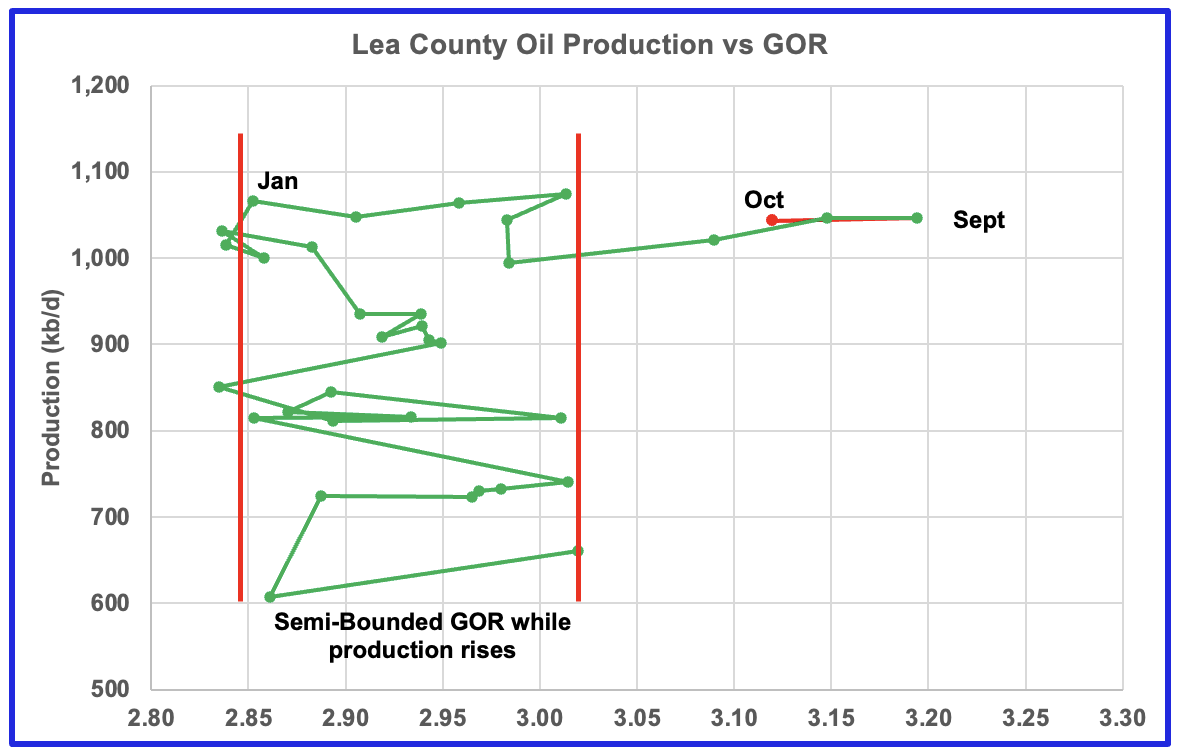
After much zigging and zagging, oil production in Lea county stabilized above 1,000 kb/d while the GOR started to increase in January 2023 and exceeded the semi-bounded GOR in July 2023 while production remained relatively flat. The data for the last four months, July to October, is incomplete.
This zigging and zagging GOR pattern within a semi-bounded GOR while oil production increases to some stable level and then moves out to a higher GOR to the right has shown up in a number of counties. See an additional two cases below. While this is the fourth month in which Lea county has registered a GOR outside the semi-bounded GOR range, the trend has changed since the GOR has started to drop.
This dropping GOR trend has also shown up in Martin County. This implies that the concentration of dissolved NG in the oil phase is lower than previous months at the current temperature and pressure conditions and that going forward the GOR should continue to drop. A deeper explanation for this reversing GOR phenomena, if it continues, would be much appreciated.
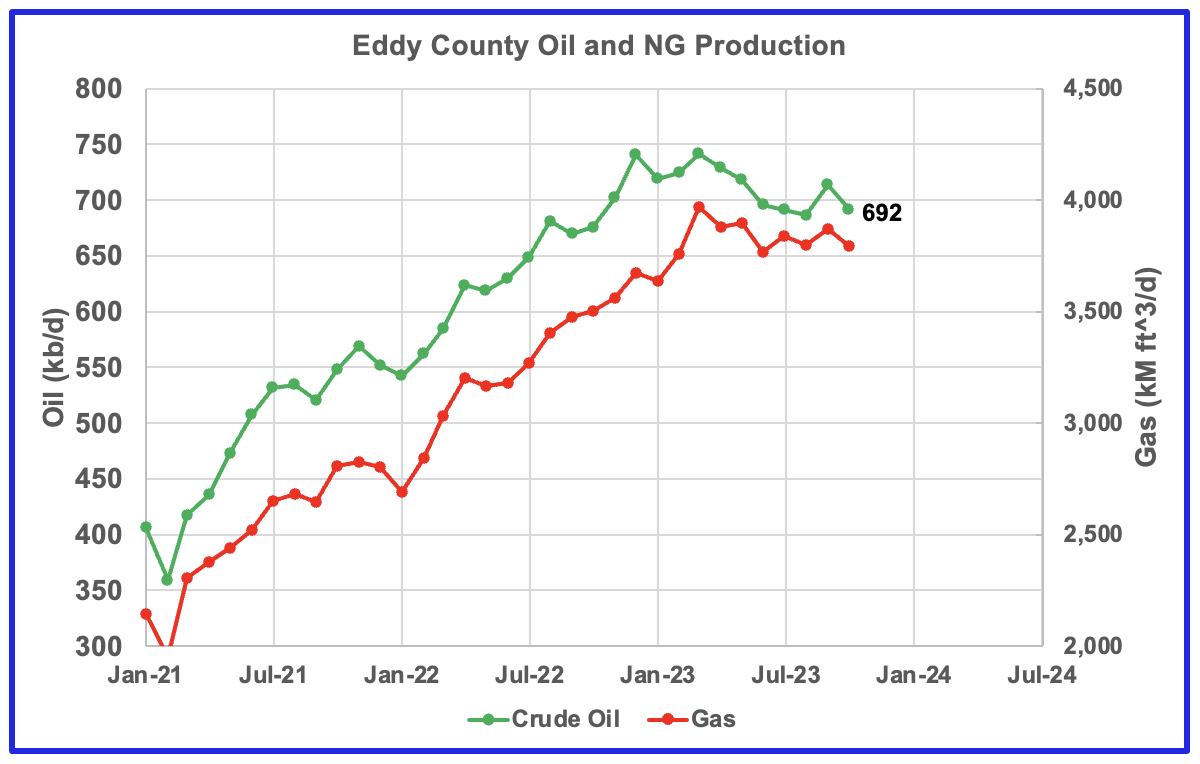
Eddy county oil production is showing early signs that it has peaked. October production was 692 kb/d.
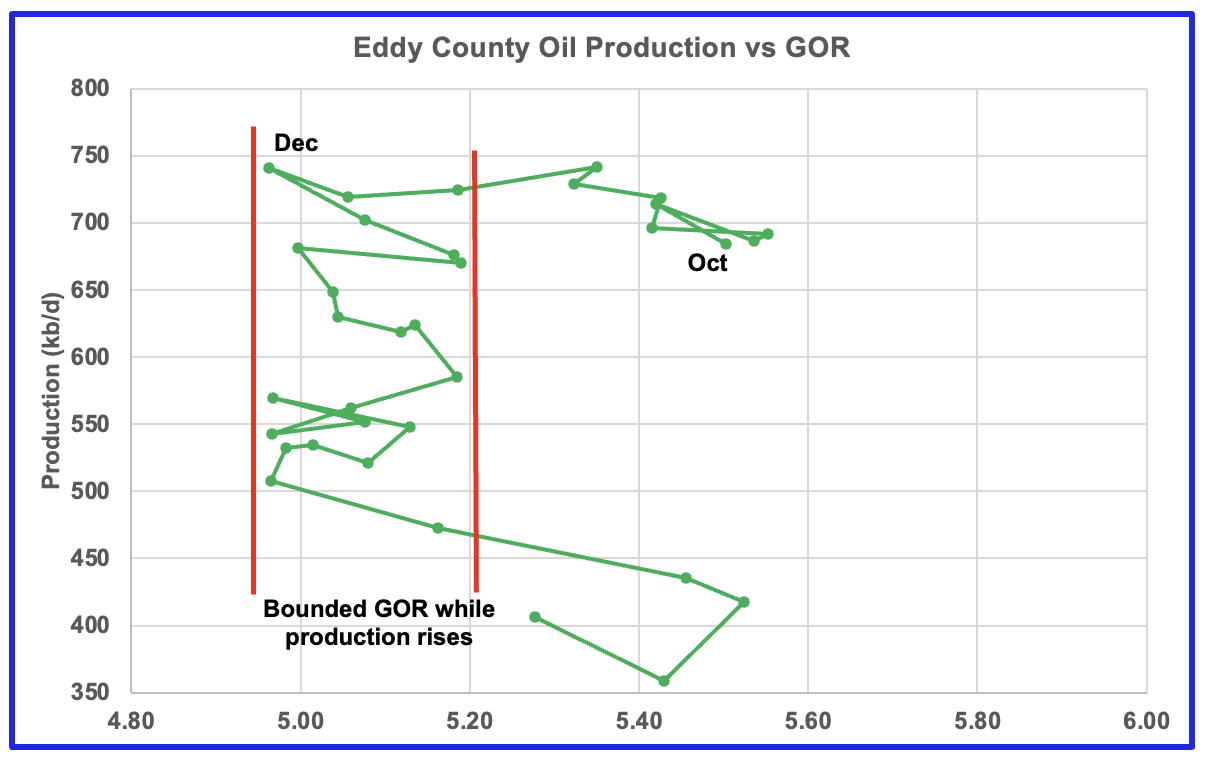
The Eddy county GOR pattern is similar to Lea county except that Eddy broke out from the semi bounded range earlier and for a longer period while oil production has been dropping.
Texas Permian
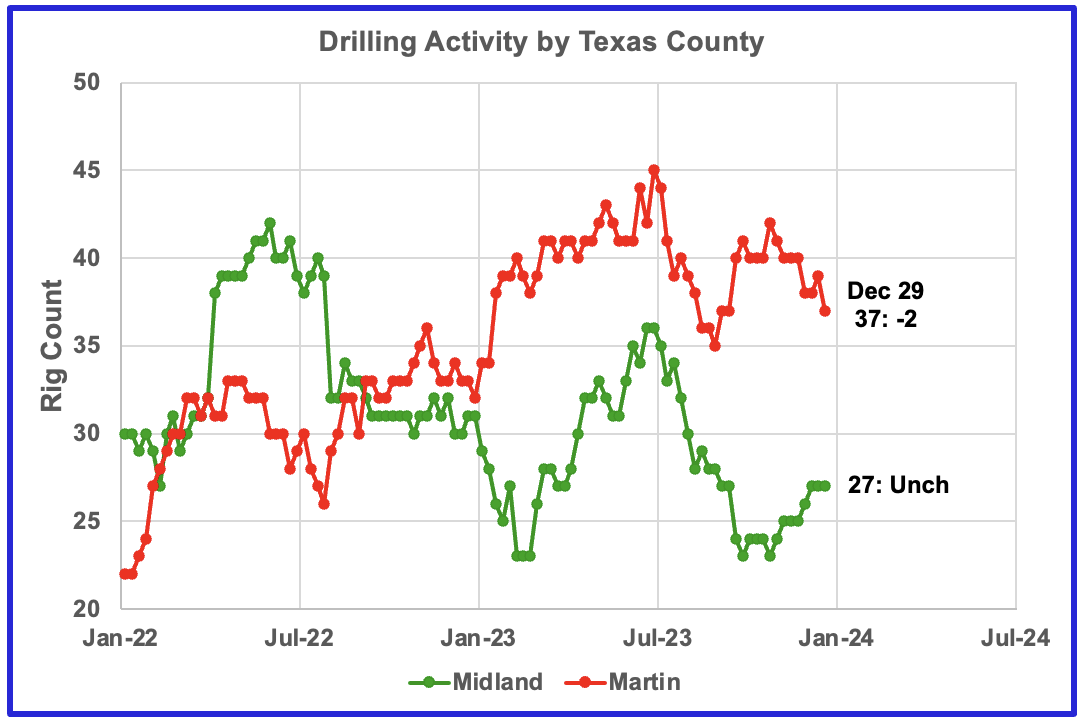
During December drilling activity increased in Midland county while it dropped in Martin county.
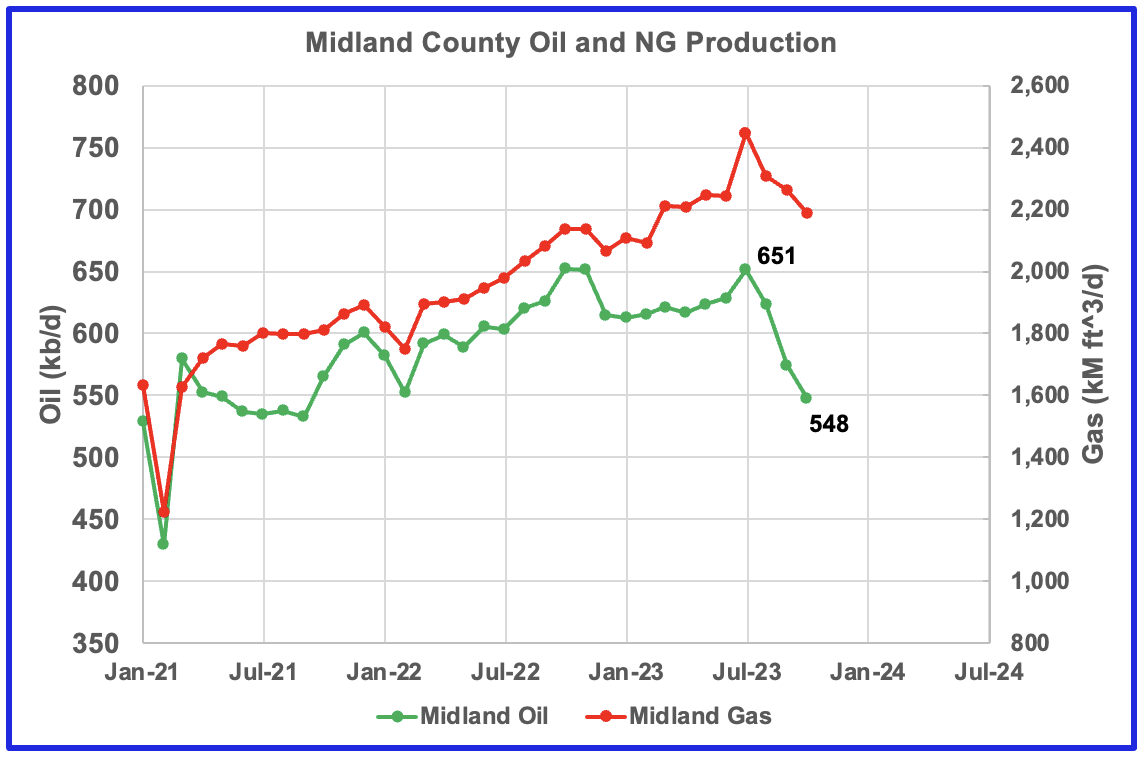
Both natural gas and oil production are dropping in Midland county. Cannot find any explanation for the July spike in oil and gas production. Oil production has dropped by 103 kb/d to 548 kb/d since July.
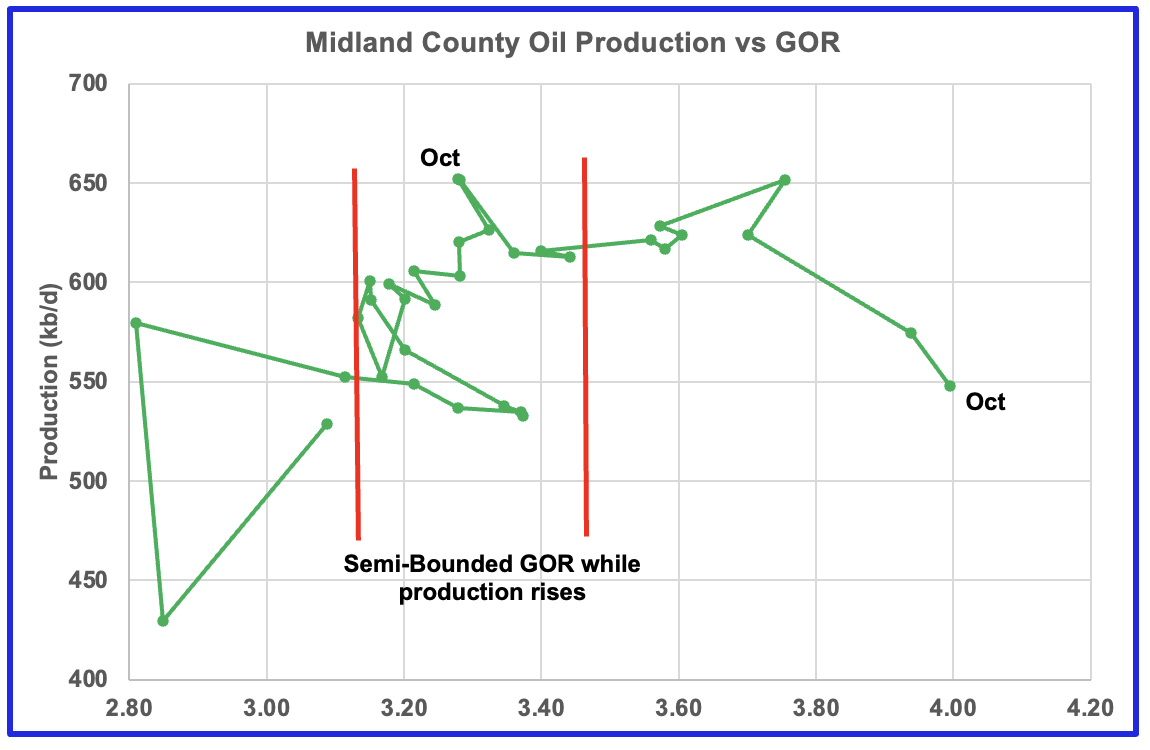
Oil production is dropping and the GOR is increasing. It appears that Midland has entered the bubble phase?
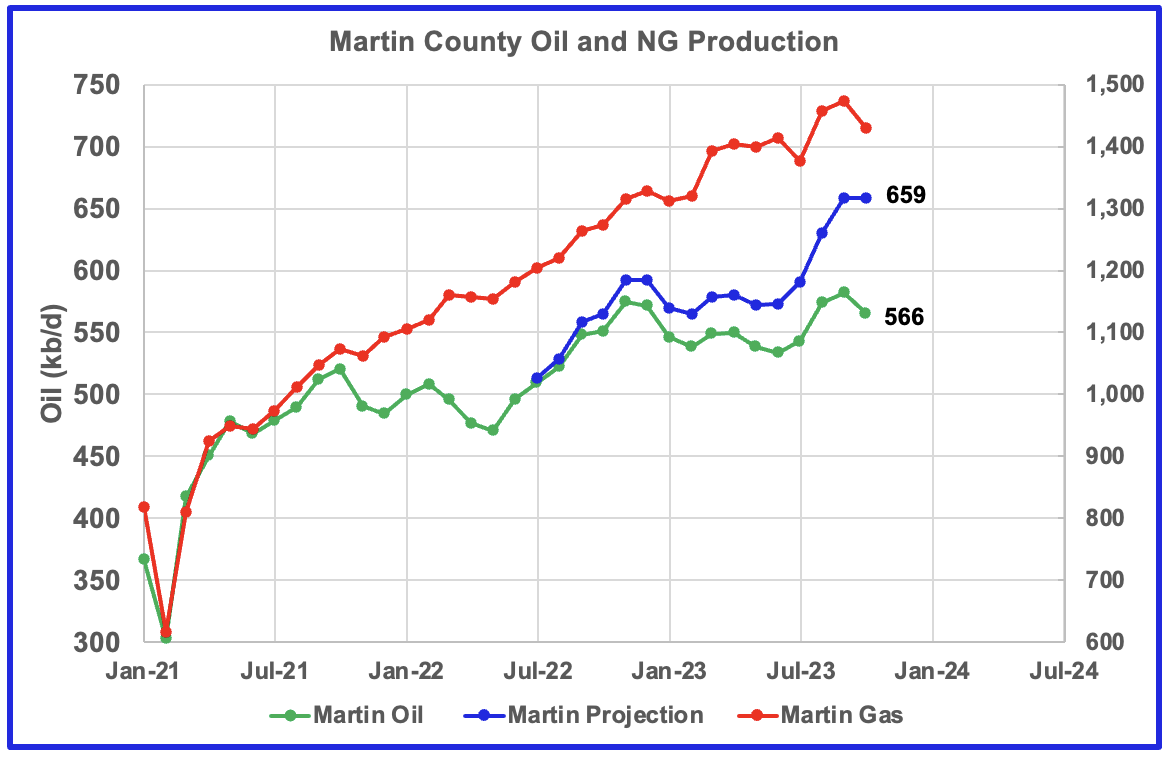
Both natural gas and oil production are increasing in Martin county.
The blue line is a production estimate which the Texas RRC will be reporting for Martin county one year from now as drillers report additional updated information. This projection is based on a methodology that used September and October production data and will be re-estimated next month.
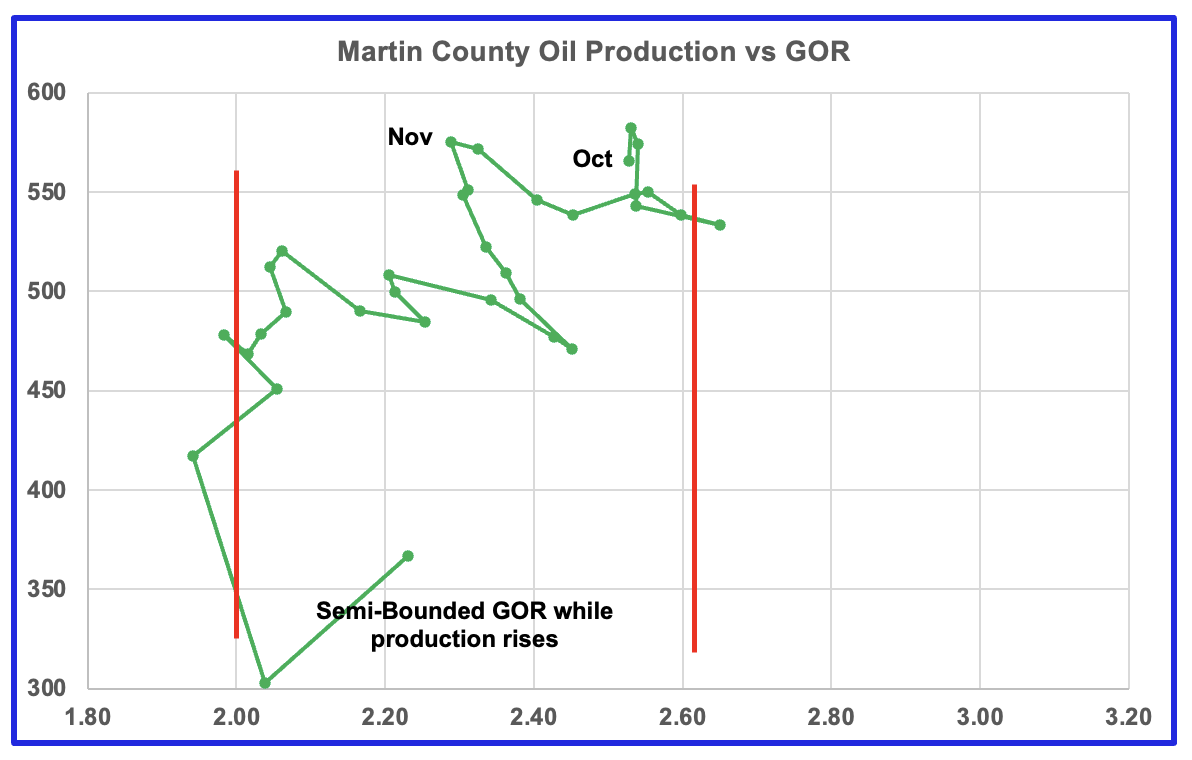
Martin county is displaying a new trend of increasing oil production while at the same time showing a retrograde GOR. Martin county has the lowest GOR of these four counties and at a GOR of 2.53, Martin may not be at the bubble point that results in a dropping oil production trend.
Three of the four oil production vs GOR charts above are exhibiting characteristics indicating that three of the largest oil producing counties in the Permian are in the bubble point phase and are close to or past their peak? Not clear as to what is happening in Martin County.
Eagle Ford Basin
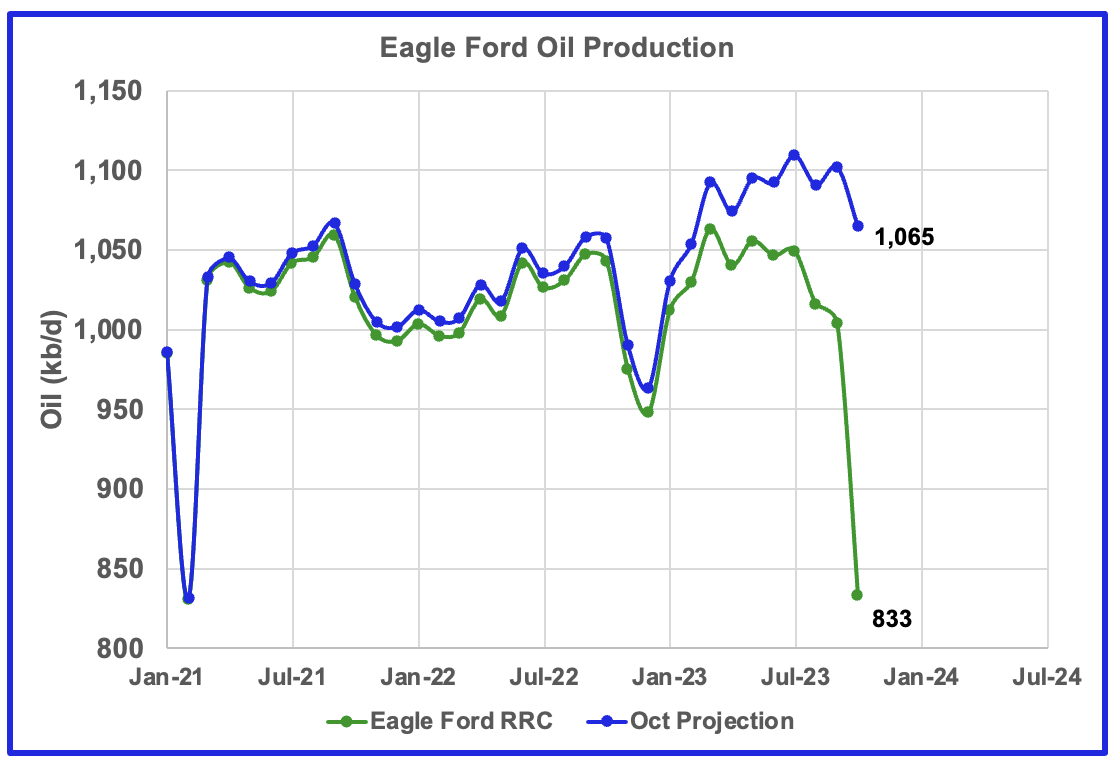
This chart is an estimate for oil production in the Eagle Ford basin using the RRC output from Districts 1 and 2, which are the two main districts comprising the Eagle Ford basin. The green graph shows the most recent production data from the Texas RRC. The blue graph is the expected oil production that the RRC will post about about a year from now.

Karnes county is the biggest oil producing county in the Eagle Ford basin and is ranked as the seventh largest oil producing county in Texas. Both oil and gas production are falling in Karnes county and both are down close to 30% from the peak.
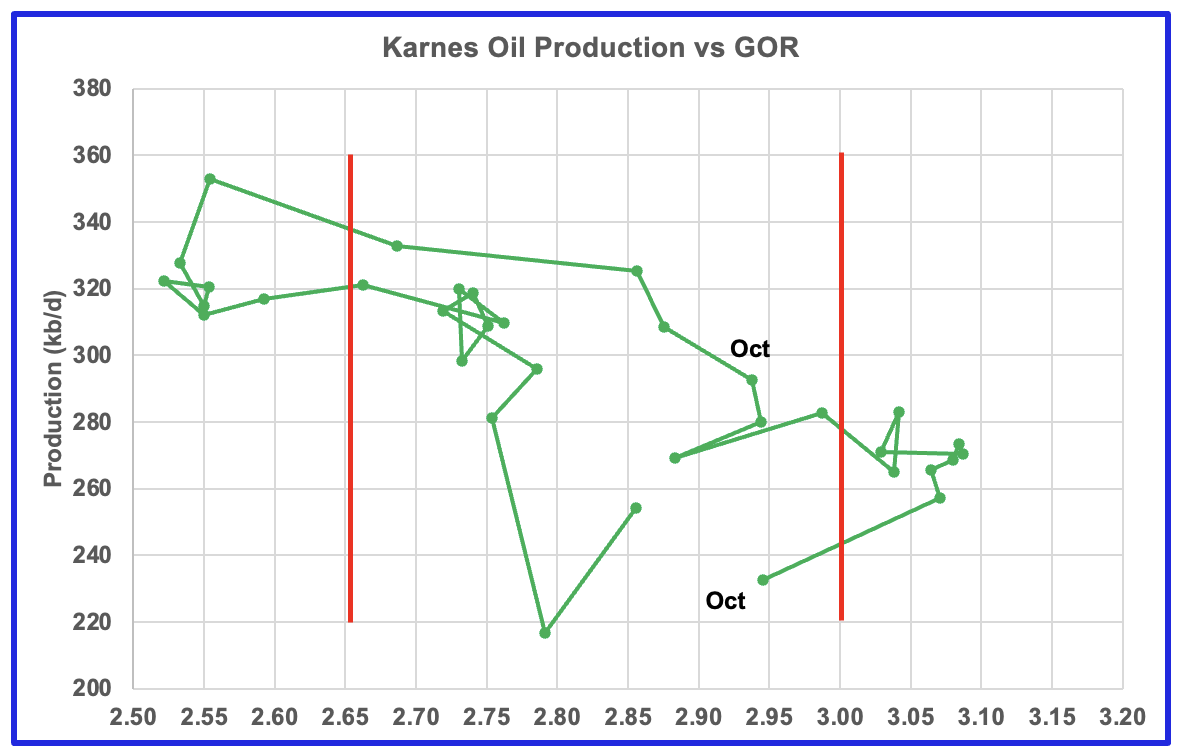
This is the GOR vs oil production for Karnes county but the GOR is still within its typical range while both production and GOR are dropping. This may indicate that Karnes county wells never entered the bubble point phase and weren’t very gassy to start with. Karnes county ranks fifteen in Texas natural gas production.
Drilling Productivity Report
The Drilling Productivity Report (DPR) uses recent data on the total number of drilling rigs in operation along with estimates of drilling productivity and estimated changes in production from existing oil wells to provide estimated changes in oil production for the principal tight oil regions. The December DPR report forecasts production to January 2024 and the following charts are updated to January 2024. The DUC charts and Drilled Wells charts are updated to November 2023.
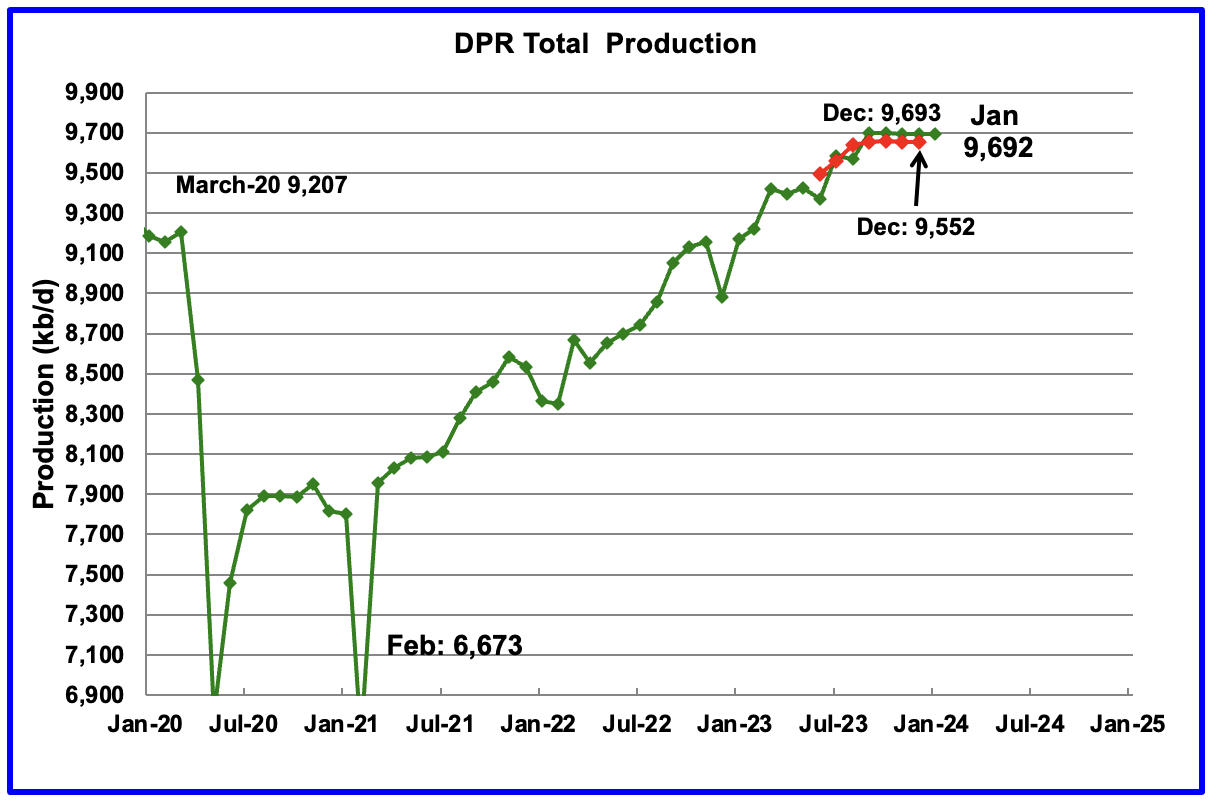
Above is the total oil production projected to January 2024 for the 7 DPR basins that the EIA tracks. Note that DPR production includes both LTO oil and oil from conventional wells.
The DPR is projecting that oil output for January 2024 will decrease by 1 kb/d to 9,692 kb/d.
While the green graph shows DPR production being essentially flat since September, it also had an upward revision to its production since the last report, red graph. For December, DPR production has been revised up by 41 kb/d, from 9,552 kb/d to 9,693 kb/d with the biggest increase occurring in the Bakken basin.
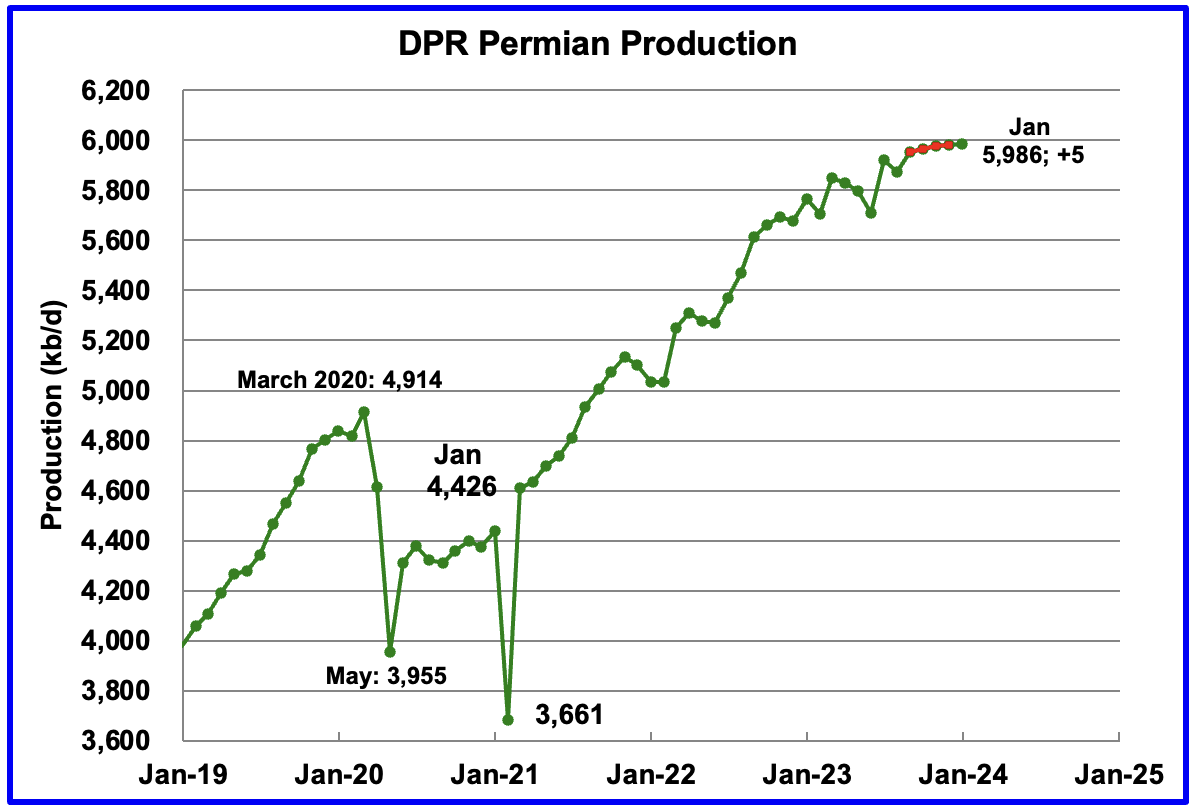
According to the EIA’s December DPR report, Permian output continued its slow rise in January. It is expected to increase by 5 kb/d to 5,986 kb/d. The last five months of production data clearly show a dropping trend in monthly production growth.
What is remarkable about the December projection is that the production from September to December is the same in both the November and December DPR reports, note the overlapped red and green markers.

During November, 438 wells were drilled and 449 were completed in the Permian. (Note that November is the latest month for DUC information). The completed wells added 410 kb/d to November’s output for an average of 913 b/d/well. The overall decline was 400 kb/d which resulted in a net increase to Permian output in November of 10 kb/d. Of the 449 completed wells in October 438 were required to offset the decline. Those extra 11 completed wells producing at 913 b/d resulted in the 10 kb/d increase in November.
At this time information on the number of drilled and completed wells is not available to account for the 5 kb/d Permian production increase in January.
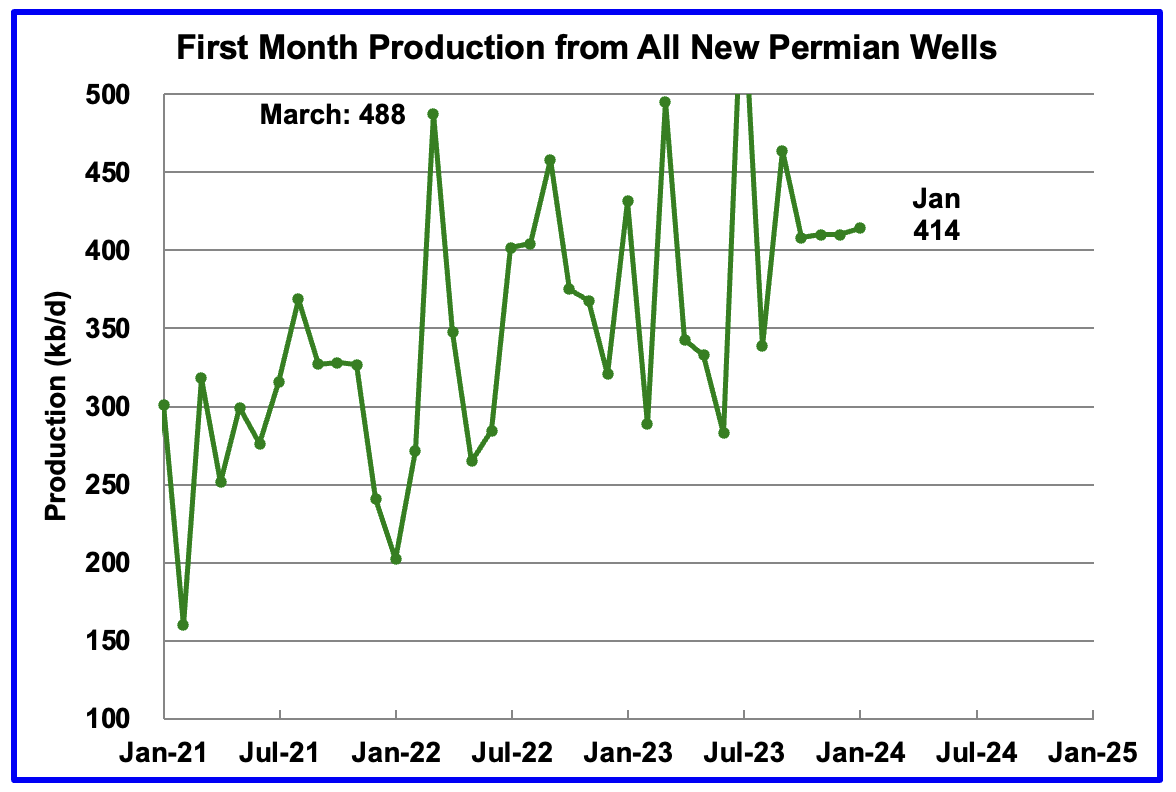
This chart shows the average first month total production from Permian wells tracked on a monthly basis. The total monthly production from the newest Permian wells in January is expected to be 414 kb/d and 4 kb/d higher than December.
Recall that this production of 414 kb/d is offset by a decline of 409 kb/d for a net overall output increase in the Permian basin of 5 kb/d, actually 4.65 kb/d, the smallest recent monthly increase. The monthly increase in November was 9.8 kb/d. This all hints at slowing production growth in the Permian.
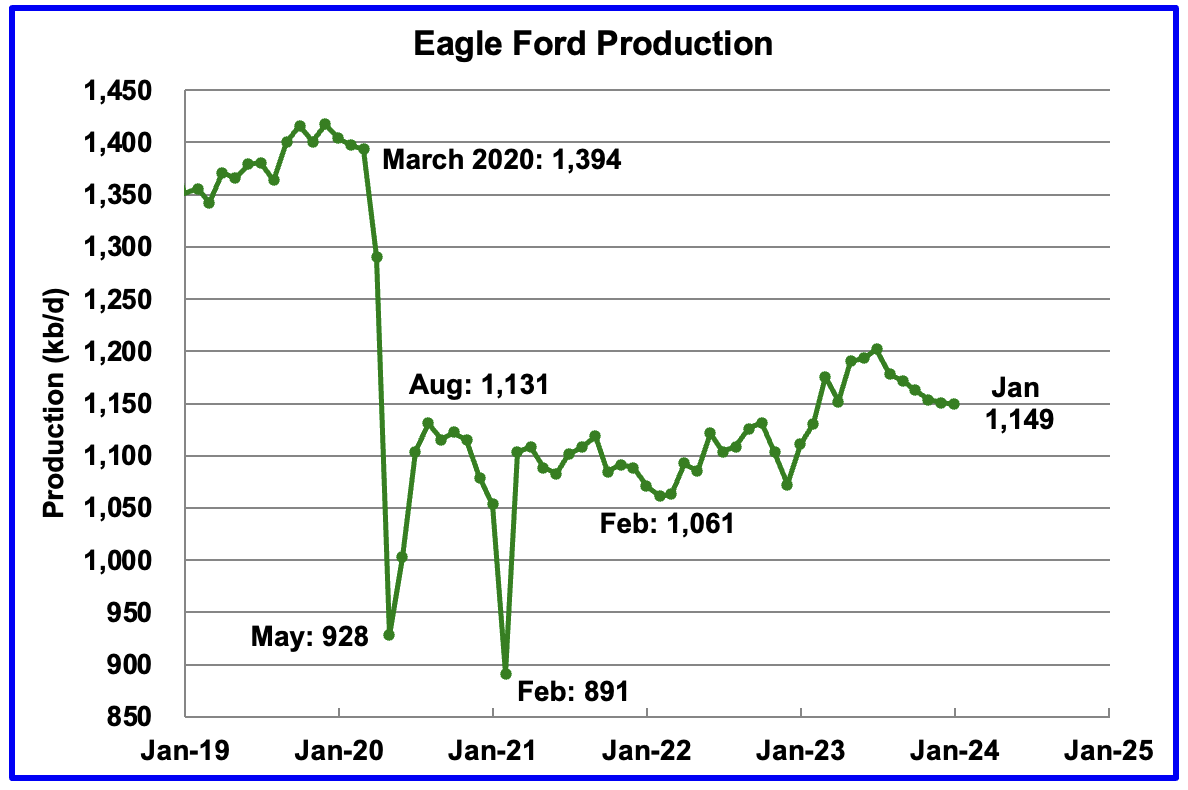
Output in the Eagle Ford basin has been in a downtrend since August. December’s forecast projects January output to decrease by 2 kb/d to 1,149 kb/d. The Eagle Ford’s output for November was not revised in the December report.
At the beginning of the year 2023, 68 rigs were operating in the Eagle Ford basin. The rig count began to drop in mid March to 60 and slowly dropped further to 47 in November. December has seen an increase of 3 to 50 rigs.
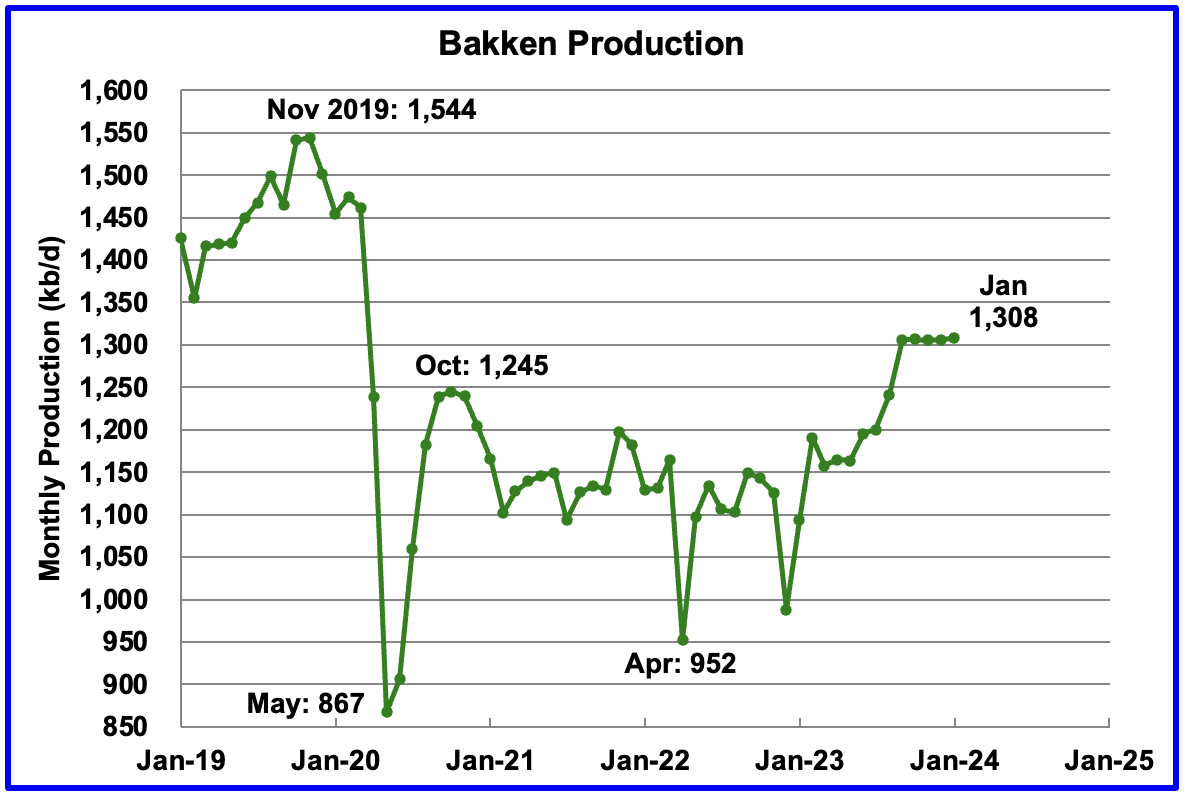
The DPR forecasts Bakken output in January will be 1,308 kb/d, 2 kb/d higher than December. September 2023 to January 2024 production is now projected to be 63 kb/d higher than the post pandemic peak of 1,245 kb/d in October 2020.
Note that the production from September to December has been revised up by 34 kb/d in the December report and accounts for most of the upward revision to DPR production.
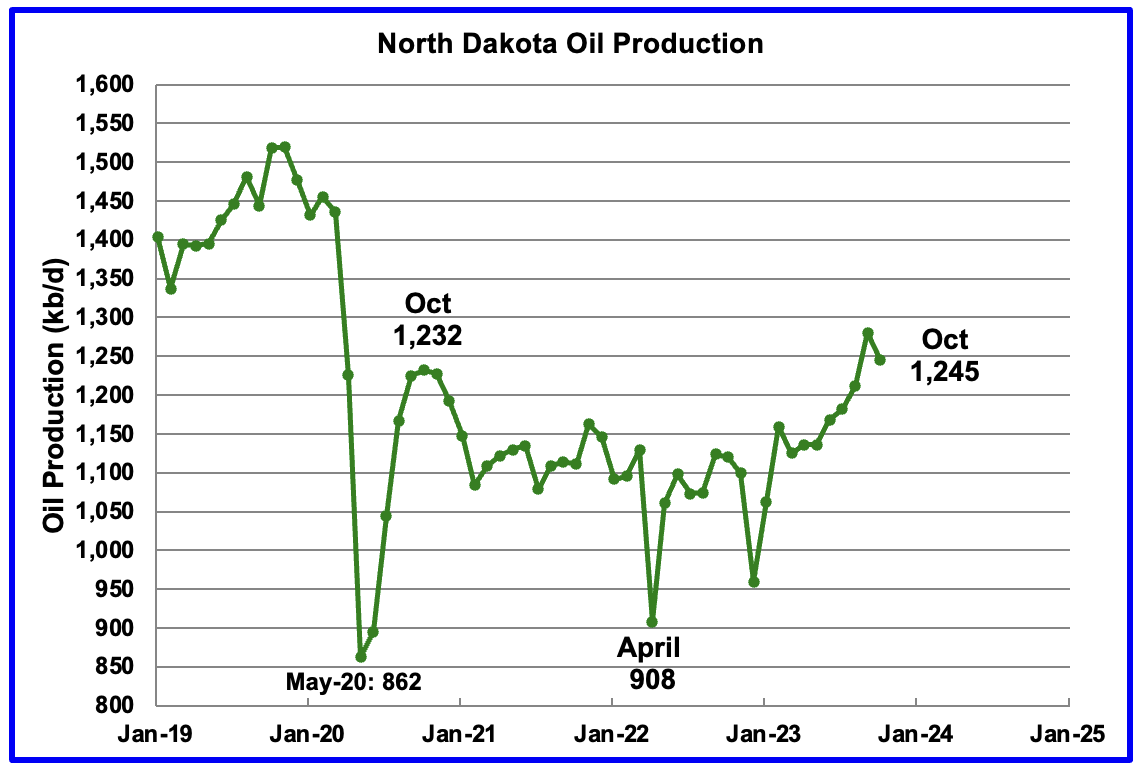
The North Dakota government reported that October production dropped by 35 kb/d to 1,245 kb/d. The October drop was associated with a severe weather storm in North Dakota.
Note that in the Bakken chart above, September production shows a similar spike in production. The DPR is missing the October decline associated with inclement weather.
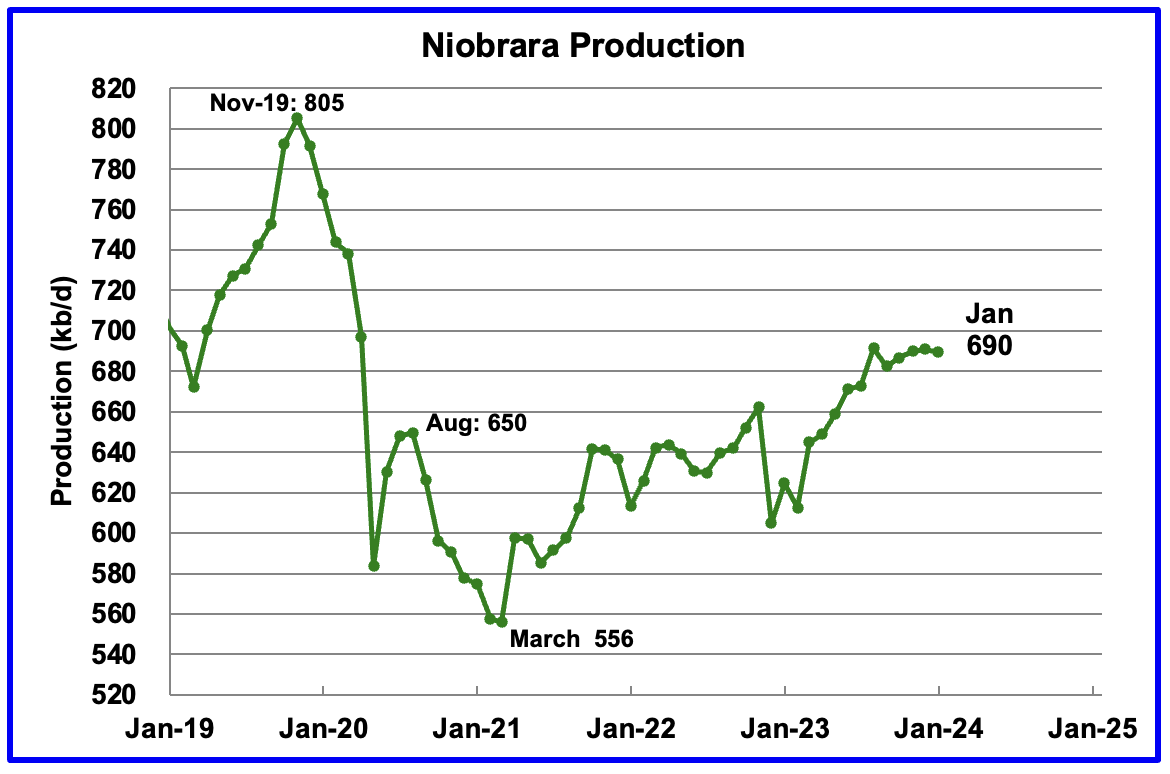
Output growth in the Niobrara continues to slow. January’s output decreased by 1 kb/d to 690 kb/d.
Production increased starting in January 2023 due to the addition of rigs into the basin but stabilized at 16 ± 1 rigs in March and April. However from August to December, the rig count has held steady at 14.
DUCs and Drilled Wells
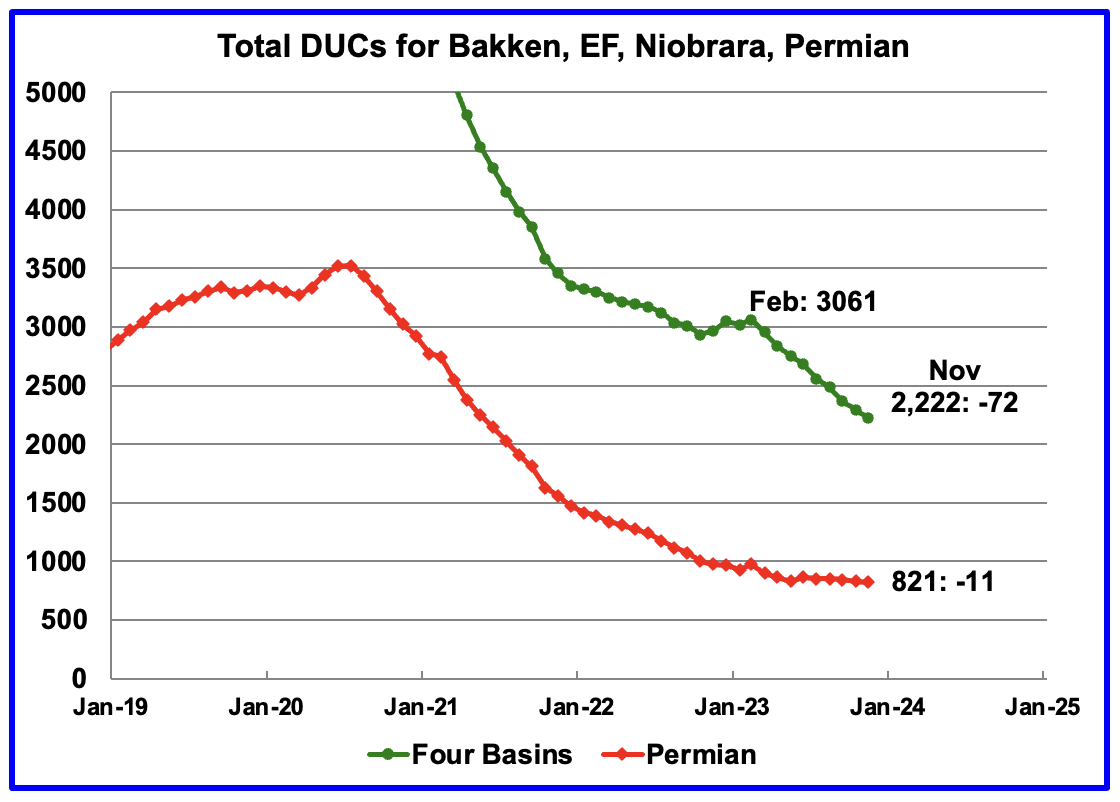
The number of DUCs available for completion in the Permian and the four major DPR oil basins has fallen every month since July 2020. November DUCs decreased by 72 to 2,222. The average DUC decline rate since March has been 93 DUCs/mth. Of the 72 DUCs decrease in November, 29 came from the Niobrara followed by 15 and 17 from the Bakken and Eagle Ford respectively.
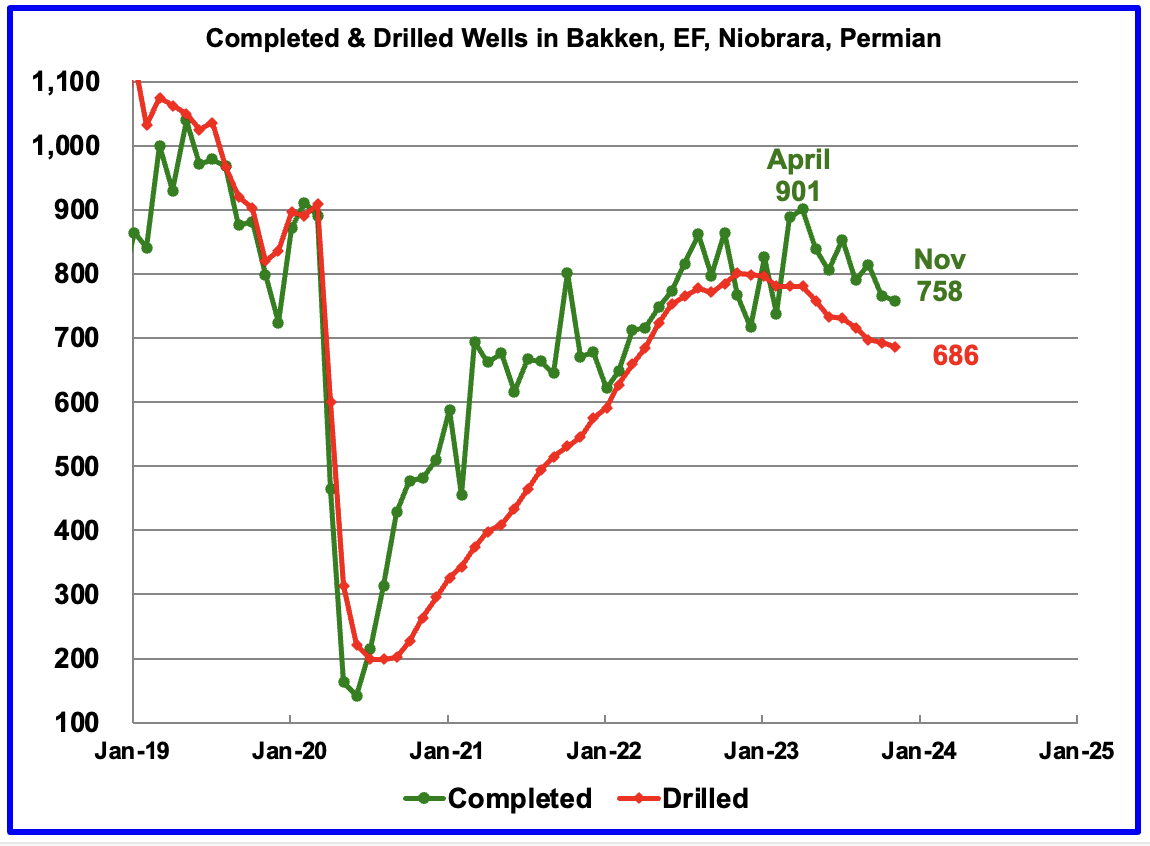
In these 4 basins, 758 wells were completed while 686 were drilled. Both drilled wells and completions are down from higher levels in early 2023.
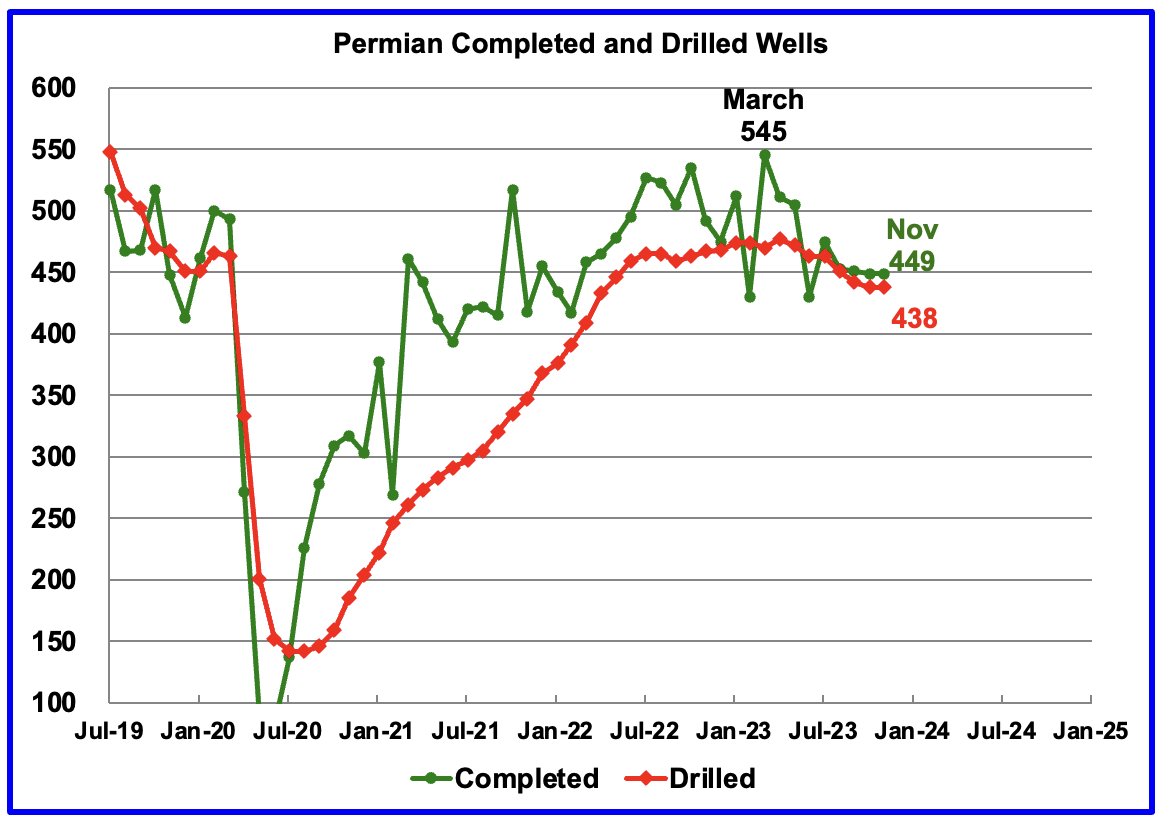
In the Permian, the monthly completion and drilling rates have been slowing since the March 2023 high of 545.
In November 2023, 449 wells were completed while 438 new wells were drilled. The gap between completed and drilled wells in the Permian is now very small compared to late 2022 and early 2023. Regardless, it is those extra completions that increase Permian production.
The Permian, as of November, had 821 DUCs remaining and the completion rate was 449 wells/mth. This means the current cycle time between drilling and completions is 1.83 months or 56 days.
218 responses to “US October Oil Production Held Steady”
Great article! Thank you, Ovi.
It is interesting that production for August and Sep was revised upward, yet none of the other Supply & Disposition factors (Imports, Exports, Refinery Input, Stock Change, C5 transfer to crude) changed. This resulted in more negative Adjustment Factors, which were negative to start with. As of now August Adjustment is at a whooping -620kbpd! That’s a bit strange.
Some people tend to think that production numbers are overstated, resulting in a need for a negative adjustment. However, it is not very credible that EIA revisions will lean further into that “error”, raising past production and subtracting from the Adjustment.
I’d have to go with Exports as the weak link, as it is the only parameter not collected by EIA directly (they take the numbers from Customs). Most likely the Exports are either understated for the past three months or they are not as diluted with C5 as the EIA thinks.
Kdimitrov
I think another big error, possibly biggest, is in the counting of the EIA’s crude oil stocks. Somebody has to report the volume of crude in all of those tanks. While many of those tanks may have automatic readers, some are still measured using a dip stick. Think of the errors possible in reading and transcribing those numbers and sending them off to the EIA.
Attached is a stock balance table that shows how the numbers are juggled. Bottom line is that the adjustment is required to cover all of the errors in the first three rows. The table is a comparison for the weeks ending December 22 and December 29. The adjustment factor has shifted by 1,228 kb/d over one week or 8,596 barrels for one week.
The numbers on the left are from the EIA’s weekly balance sheet.
Ovi,
These types of fluctuations in the high-frequency weekly data are understandable.
First, I know for a fact that timing of exports/imports entries does not match the stock survey date, so you can have tankers that are not yet reflected in Import/Export numbers but the oil is already in or out of storage, that’s a big source of variability from week to week. Second, weekly production numbers are just estimates. Third, as you say, there may be errors in stocks reporting, especially around end of the year.
What you don’t expect is is to have directionally biased adjustment, all these errors should eventually get reversed and canceled out. Especially, you don’t expect a directional Adjustment bias in the low-frequency monthly data. That PSM data is supposed to be more accurate and proofed, that’s why it is so delayed.
EIA had for a few years a directional bias with a positive Adjustment factor, and they addressed it over the past year or so. However, the last 4 months we seem to have a very substantial negative Adjustment bias for some reason.
https://www.eia.gov/dnav/pet/hist/LeafHandler.ashx?n=PET&s=MCRUA_NUS_2&f=M
Kdimitrov,
It does seem to be a statistical mess.
It’s just raw data not suitable for publishing. The time scale is too short to give good results, with tankers transporting several million barrels and lot’s of estimates.
Monthly data is much better in this case.
Eulenspiegel,
The monthly data also has adjustments which seem to be biased over the long term.
If you click on the link that KDimitrov posted, it is monthly data from PSM, not weekly data that never gets revised.
This is an old post from June 2023, but it was one of their most popular posts in 2023, excellent analysis imho.
https://blog.gorozen.com/blog/the-permian-basin
Worth a re-read if you have seen it already.
Thanks for all the information sharing Ovi.
I still don’t understand why you make this statement in bold however-
“The main takeaway from The Rest chart is that current production is 673 kb/d below the high of October 2019 and this appears to be a permanent loss that will never be recovered.”
I concur that the rate of production will likely never be matched, however the overall eventual production (URR) is unrelated to the rate of extraction since other factors like demand and pricing and international trade policies figure into the long term equation of production. A lower rate of extraction may simply extend production longer into the future.
A minor point, I submit.
Great job Ovi,
What would your Martin county GOR chart look like if you used your projected crude output with projected natural gas output (using similar methodology as your crude projection), if you have the natural gas data to do this?
Might be interesting to see if there is any difference from your current chart, as your projection is likely to be more accurate than the reported RRC data for the past 12 months or so.
Dennis
Attached is the chart you requested using projected NG and C + C production to see whether there was a change in the GOR. For October, the GOR dropped by 3%.
Thanks Ovi,
Did you do a natural gas projection? If so it would be interesting to see how that changed vs the state data as reported. I assume the red line is the projected GOR.
Hickory
I agree. “A lower rate of extraction may simply extend production longer into the future.”
However, the question this blog is addressing is “Peak Oll” in the World and US. This question is related production rate. Essentially what I am saying is that there is little hope that the Rest will contribute to a significant increase in US production rate in the future. For the US, Peak US is all about the Permian.
I see, yes that make sense. Thank you.
Another example of illegal oil production that is not happening
https://gulfsands.com/media-hub/illegal-oil-production-in-north-east-syria/
Too often corrupt politicians are years ahead of honest but incompetent ones
Just like illegal fishing which accounts for up too 15% of fish caught, it takes real determination to find the facts and plan to stop it.
Charles,
Yes they estimate 20 kb/d and perhaps as much as 80 kb/d for all of Syria. I would note that OPEC reports about 32 kb/d of output from Syria in 2022 with between 21 and 32 kb/d of output for all years from 2014 to 2022. The Statistical Review of World Energy reports 93 kb/d in 2022. So this stolen oil may already be accounted for in the data.
Dennis
The tanker Hawk has recently unloaded oil in China, where did that oil come from?
Charles,
I do not track individual tankers? I understand there is oil on the water that tries to avoid detection to avoid sanctions or because the oil or products were stolen. The point is the oil can be accounted for at the well head and at the refinery gate, how it gets from point A to point B is not of great interest to me. Feel free to try to track every tanker and pipeline and truck and rail car that carries oil. Report back with what you find.
“often corrupt politicians are years ahead of honest but incompetent ones”
Here’s where all the cases against Trump stand as he campaigns for a return to the White House.
What you need to know, CHARLES –
Former President Trump faces 91 felony counts in four criminal cases in Washington, New York, Florida, and Georgia.
Trump was charged with violating Georgia’s anti-racketeering law by scheming to illegally overturn his 2020 election loss. He’s also accused of election interference in a federal indictment.
In June, Trump was charged with hoarding classified documents and refusing government demands to give them back.
In March, Trump was indicted in New York on state charges stemming from hush money payments made during the 2016 presidential campaign.
The four-count indictment includes charges of conspiracy to defraud the United States government and conspiracy to obstruct an official proceeding: the congressional certification of Joe Biden’s victory. It describes how Trump repeatedly told supporters and others that he had won the election, despite knowing that was false, and how he tried to persuade state officials, then-Vice President Mike Pence and finally Congress to overturn the legitimate results.
After a weekslong campaign of lies about the election results, prosecutors allege that Trump sought to exploit the violence at the Capitol by pointing to it as a reason to further delay the counting of votes that sealed his defeat.
https://whyy.org/articles/trump-indicted-third-time-where-cases-stand/
Chart of Big 3 C plus C output from March 2021 to October 2023. Big 3=Texas, New Mexico, and North Dakota, the 3 highest producing States in the US. The average annual rate of increase has been about 663 kb/d over the period covered on the chart, about 2.6 years.
These 3 states cover 3 large tight oil producing areas, the Permian Basin, Bakken/Three Forks, and Eagle Ford, so it is fairly representative of tight oil output in the US in terms of rate of change in output.
Looking a this chart, tight oil shows no sign of plateau through October 2023.
If we add in Colorado to get the Big 4 Tight Oil Plays (Permian, Bakken/TF, Eagle Ford, and Niobrara) we get the following from March 2021 to October 2023. Not much sign of plateau here either.
Dennis
The only points that matter on the chart are the last two. It is the same situation with the first chart in the post. The big difference is the first chart has projections out to December 2024 which show a continuation of the slow down in monthly production growth.
I think we will know better in two or three months whether the trend shown in the DPR chart has got it right. What we won’t know is whether the slowing production is due to geology or managed growth by the oil majors.
Ovi,
The DPR and STEO are often revised higher to reflect higher output as it occurs. This has been occurring for the DPR for the past 6 to 8 months and the STEO for years. So I will go eith the longer term trend for now until the actual data starts to change. Two months of data is not a trend in my book, just a blip. The data never follows a straight line on a month to month basis. There are many cases where the two month trend would give us decreasing tight oil output over the March 2021 to October 2023 period, but I think we would agree the general trend has been increasing tight oil output over the past 2.6 years.
I think you have been expecting Permian output and tight oil in general to plateau soon for about the past 6 to 8 months. Eventually I think this will be right, so far the data isn’t showing it, at least to my eye. Maybe in a few months this will change.
Using the Drilling Productivity Report Dec 2023 it looks as if production from Permian, Eagle Ford and Bakken is flattening out
It seems that folks need to periodically be reminded that US tight oil is NOT extracted and reported in real time. October production, just now be reported by the TRRC in Texas (the ONLY data that matters!), actually “occured” six months ago, about the time the Permian rig count began to decline (6.23). “Lag time” between spudding and first reported production includes delays in frac’ing, delays in flow back, delays in stabilizing the well for reporting to the TRRC and then 60 days between being issued allowables and published production by the TRRC.
Rig counts are now down, fewer completions are occuring from new wells, DUC’s (the REAL cause for 2023 production surpises) are now pretty much “deducted,” https://www.oilystuff.com/forumstuff, and well productivity in key, core counties of the Permian is now tanking. The gas monster has got ’em.
Relying on big government entities like the Energy Inaccuracy Agency for data is, forgive me, lazy. Those entities all have political agendas and are run by grossly inefficient…government employees that work 9-3, four days a week.
Its not hard to sort all this out working from the top down, it just takes work. Statistical trendology is worthless in analyzing oil and gas; past performance NEVER, ultimately, is an indication of future results. Depletion never rests. Ovi’s gettin’ it; listen up.
Lea County, New Mexico is done; stick a fork in it. As Lea County went, so goes the Permian Basin HZ tight oil play.
Art Berman is right…its the beginning of the end for the Permian, and for US tight oil production.
Mike,
You’re a humble guy. I think Art’s been reading your work and thus changed his mind on the Permian.
Anon, you are kind to say that. Thank you. It only matters to me the truth gets told and that Americans, and people importing Permian tight oil, start to wise up. With regard to predicting tight oil performance in the future, the now is far more important than the past.
Mike,
The EIA estimates from the 914 report have been pretty good. Trends can indeed change.
The DPR is showing slowing tight oil output as is the STEO.
For scenario above I assume the following completion rates and also assume well productivity falls at about 4% per year.
US tight oil scenario using Permian scenario (URR=31 Gb) presented earlier. US tight oil URR=59 Gb, with 25 Gb already produced as of Sept 2023. The centered 12 month peak for the scenario below is 8621 kb/d in February 2024, the monthly peak occurs in Sept 2023 at 8627 kb/d. The scenario assumes WTI oil prices remain between $70 and $75 per barrel (annual average prices in 2023 US$) from Jan 2024 to December 2030 and start to fall to lower levels after 2030. A correction is needed for the US less Permian basin scenarios as they should have reduced completions after 2030 to reflect lower oil prices. This correction would reduce the URR by perhaps 5 Gb or so.
Perhaps this is what abundance looks like to some.
Modification to US tight less Permian results in Scenario below, URR reduced to 58 Gb (less of a difference than I expected). Modifications to scenarios for other basins (which I have not done for about a year) pushes the peak forward to June 2024 from the previous scenario (where peak was Sept 2023) and the peak is about 100 kb/d higher than the previous scenario due to adjustments to the non-Permian scenarios to better match output data.
The 914 survey is data reported by the largest producers in Texas and New Mexico representing about 90% of total C plus C output. This is what we have from the survey data for March 2021 to October 2023 for Texas and New Mexico.
Data at link below (spreadsheet from EIA)
https://www.eia.gov/petroleum/production/xls/comp-stat-oil.xlsx
Permian DUCs for wells spud starting in 2019, after Dec 2022 the data may not be accurate because it takes some time for the state agencies in Texas and New Mexico to process all the forms and data.
The EIA and Novi labs have very different numbers for wells drilled (aka spud) from July 2020 to December 2022. The difference for total wells drilled over the July 2020 to December 2022 is 2071 wells (Novi records 2071 more wells spud than the EIA).
If we added the 2071 wells to the DUCs, assuming the spuds by Novi and completions by EIA are bothe correct we get about 2892 DUCs for the Permian basin instead of the 821 DUCs estimated by the EIA in the DPR.
Mike,
Where did that Novi DUC chart come from? I cant find it except at your blog.
Well, that is precisely why you need to ignore the stupid EIA, IEA, DPR, LTO, IPAA, NCAA and PETA when trying to understand US tight oil and be a releavant energy analyst. You have to do your own work and use deductive reasoning. Honest to God, you cannot predict oil and gas production without knowing something about it, first hand.
Sometimes collecting data costs money. If you don’t have that money to spend on what your analyzing, then you often don’t have all the data and your analysis is incomplete.
I assume you are thinking you might find where the chart is from, in a different context than what I presented it, and alter its meaning to fit your agenda. Sorry, that’s all there is, the chart. It doesn’t need any further explanation, since you are a NOVI believer.
Recently Helms said the same thing in an interview, also on OSB, about Bakken DUC’s; they are gone.
Struggle with it all you wish; its reality.
Mike,
Yes, this is a hobby and I will not spend my money on subscriptions for Oil and gas data, they are expensive. I do use RRC and OCD data as well as the free Novi data along with EIA data.
Mike,
Can you define a DUC for me? I may not be understanding the definition correctly. Seems a little hard to believe that the DUC count could be zero either in the Bakken or Permian Basin, which seems to be what you are saying.
As I understand it every well that is completed must first be drilled, so essentially every completed well must have been a DUC before it was completed. How could DUCs be “all gone”?
It would seem to imply that drilling and completion work had ceased altogether.
There would have to be some inventory of DUCs in order for there to be completed wells.
Mike,
On Bakken DUCs see the following Director’s Cut
https://www.dmr.nd.gov/dmr/sites/www/files/documents/Director's%20Cut/12.21.23%20Directors%20Cut.pdf
October has 353 wells waiting on completion (I assume these would be DUCs), in October 96 wells were completed (preliminary estimate), so about a 3.5 month supply of DUCs.
If the Permian had a similar inventory of DUCs, completions were about 450, so a 3.5 month supply would be about 1575 DUCs almost twice as much as the EIA DUC estimate, but less than half the Novilabs estimate of about 3500 DUCS. You mentioned DUCs at half the EIA estimate, around 425 DUCs, this would be about a one month supply, seems there would be problems if the DUC inventory were in fact that low, not clear the logistics would work.
Mike,
The chart on your blog shows wells spud in 2020, I imagine there were wells spud in 2021, 2022, and 2023, so we would want to include those, when we do we find (at Novilabs) that in Jan 2023 there were about 2177 DUCs in the Permian Basin that were spud in 2020 or later, after Jan 2023 the numbers are likely not very accurate due to late reporting to state agencies. If the completion rate was 475 wells per month (roughly the 2023 average monthly Permian Basin completion rate through October 2023), this would be about a 4.6 month inventory of DUCs.
Mr. Coyne, I am aware of what the Novi chart is designed for. 2020 was the probable peak of viable DUC’s in all US tight oil basins; the chart shows, clearly, that within 30 months all those DUC’s were gone. That is the point of the chart. Not my chart, Novi’s chart. It was used in the context in which I presented it.
What on earth this subsequent littany of comments from you are on DUC’s, I have no idea what they even mean. Its very confusing. I asume you want there to be more DUC’s than there actually are because your models will then be more accurate? Are you arguing with Novi, the EIA, me, or just for the sake of arguing?
I suggest you spend more time trying to sort out what the difference is between wells in progress, actual DUC’s… and dead DUC’s. Your definition of DUC’s is way wrong.
_______
I ask myself all the time why people wish to portray there to be more affordable oil in the US than there actually is. The answer is always the same: money and/or ego and the need for relevance on social media.
Its a dumb thing to be arguing about.
If I’m wrong about the future of the Permian and the ignorance of oil exports, and we slow exports and leave some of it in the ground, for our kids, then what the hell? Sue me. We’ve got more oil to ease people’s financial pain and get us through an economic transistion to renewables.
If you, Dennis, are wrong about abundance, then you have effectively dismissed the need for conservation, created more confusion among people who know no better and, because of oil exports, we will run out sooner and all of us be harmed.
Like Berman says, if you have more money than you need at a given money in time, do you just give the rest of it away?
I can sleep way better warning people of the former, anyway I can, particularly using 60 years of experience IN the business; NOT the latter.
I don’t know how people can sleep blathering, constantly, about oil abundance, actually.
Hi Mike,
Thanks. Just trying to learn. Thanks for the tip. Perhaps when you refer to a DUC you mean deferred completions.
Here is one explanation of what a DUC is, yours may be different. It also explains WIP, deferred completions (DUCs not part of WIP) and dead DUCs.
https://www.forbes.com/sites/drillinginfo/2016/06/27/american-ducs-drilled-uncompleted-wells/?sh=4c924304729c
I don’t think my scenarios suggest abundance, but everyone is different. I agree producing less would be a good idea, my scenarios present what is likely rather than what I would like to see. I presented a Permian scenario upthread, is that what abundance looks like to you?
If we use 475 completions per month for Permian basin and assume WIP wells are those DUCs from past 6 months, we might have around 2700 to 2850 DUCs that are a part of WIP. The deferred completions (DUCs older than 6 months) would be roughly 707 to 857 for the Permian basin (depends on whether 2700 or 2850 is the correct number for WIP), if we use only DUCs from 2022 and 2023 and assume all other ducs are “dead DUCs”, based on Novi data.
Mike,
On further thought, I think I see what you mean about abundance, recently I have guessed that demand for oil might fall faster than supply leading to falling oil prices. This certainly does imply abundance. That low demand hypothesis may indeed be incorrect, it was presented as a possible explanation for low oil prices, the fact is that average real oil prices in 2023 were about half (56%) of the level of 2011 to 2013, the EIA expects oil prices to remain at roughly the 2023 level in 2024 and 2025 (and they are usually not right).
I have been expecting an increase in oil prices since 2016 and have been consistently wrong, but hey if I say prices will remain low, they are bound to rise.
If I am wrong about slowing growth in demand for oil, we will know it because oil prices will rise. Low oil prices either imply supply is too high or demand is too low. You seem to think supply growth is near its end, I agree. Now we need to reconcile that assumption with low oil prices, by deduction it seems slower demand growth for oil would be the likely explanation.
I also agree banning crude oil exports is a good idea and reducing the number of LNG export facilities that are built in the future would be a good idea for similar reasons imo.
914 Survey of large oil producers in Texas, New Mexico, North Dakota, and Colorado (top 4 oil producing states in the US responsible for most tight oil production.)
Mike,
Don’t RRC employees also work for the government of Texas? Government employees just the same as those that work for the EIA.
Mike,
We are all aware it takes time from the start of drilling a well until production starts, what we do not know is the average “lag time” for a horizontal tight oil well from start of drilling to start of production, can you give us an estimate? I have seen different estimates from 4 to 6 months, is that roughly right?
Matt,
As I imagine you are aware, the DPR is a model and the last 5 to 6 months are not based on real data, but a model tied to rig counts, sometimes it is pretty close, often it is not very good. That is why the numbers are revised each month.
This is the stacked graph.
When trying to attach a JPG file I got following message:
Oops! That page can’t be found.
It looks like nothing was found at this location. Maybe try one of the links below or a search?
Matt
You have to reduce the file to less than 60k before it will upload
Now that the serious decline rates are in the pipeline, what should we do?
Rig Report for week ending January 5. The Frac report has not been updated.
– US Hz oil rigs increased by 1 to 457. There has been little change to the rig count over the past five weeks.
– Permian rigs were up 3 to 298. Texas Permian added 2 to 208 while NM was up 1 to 90. In New Mexico there was a big change. Lea county dropped 4 to 44 while Eddy added 5 to 46.
– Eagle Ford dropped 1 to 44.
– NG Hz rigs were down 1 to 107 (not shown)
Ovi,
The primary Vision Frac Spread Count is down 4 WoW and 14 YoY to 236
Lea and Eddy county Rig count
Lea county dropped 4 to 44 while Eddy added 5 to 46. Note how the rig counts have crossed.
Has some new bench been discovered in Eddy county?
Do Ovi and Dennis really know anything about the oil industry?
A friend knew someone who worked in security in Iraq. He said theft of oil, forged figures, forged export documents were the norm if you could pay the right official.
The EIA only know what they are told and the people who tell them are corrupt.
This is just a snippet of what is happening in countries like Iraq, Iran, Venezuela, Russia.
https://apnews.com/article/iraq-oil-basra-us-invasion-corruption-disparities-b155140f9e9f9a2c962c4513cb7b1730
I know it happens in Iran, the regime is corrupt to the core.
Charles,
The EIA gets its data from many different secondary sources, as does OPEC and the IEA.
Dennis
What are these data sources?
Charles,
They are listed under notes and sources at link below
https://www.eia.gov/international/data/world/petroleum-and-other-liquids/monthly-petroleum-and-other-liquids-production
Charles. You don’t need to spend any time here. Its voluntary.
It would be good if you keep contributing your constructive observations, but this isn’t some kind of pissing tournament.
In my view Charles has asked some of the most germane questions on this board. Like where in the world is the IEA getting its data? Well, for years they obtained almost all of it from Platts. But the chief oil analyst at Platts once admitted that he clipped out the oil shipping news from the back of Lloyd’s List and put it into the equation. Then–I don’t know when exactly but about the time the IEA tilted toward abrupt green energy transition–OPEC became irked with the IEA and quit them, along with Platts. They shifted to Argus, which ironically relies somewhat on Lloyd’s List as well. Charles, whoever and wherever he is, may be a bit churlish, but with all the data that is promulgated in the faith of science, it certainly pays to know exactly the purveyors of the information you’re relying on, and what their ulterior motive might be. Stick with it, Charles, you’re doing fine. Like most things, the devil is in the details, and those are damn hard to come by.
Agree. It seems to me that Ovi and Dennis are trying hard to work with facts as best they can find them. Its hard to find facts about black market factors.
Gerry Maddoux,
Perhaps the data reported is wrong, someone would need to point me to the correct data, I would be happy to use it, but don’t have 50k to drop to get it, so will work with the free data that is available.
You guys can find another website that has that data available, I doubt it will be free.
How much is the subscription to Lloyd’s list? There is Argus, Rystad, IHS, and probably others. Information is never perfect, I imagine taking the average of IEA, EIA, and OPEC estimates gets us close enough to the truth. But I don’t look for conspiracies behind every piece of information I find, I will leave that to Charles.
Whoa! I have zero malice in making my comments. I merely stated that Charles is right to question the origin of the data that is purchased by the IEA. We are living in fairly unusual times, whereby sanctions are upon fossil fuels from several countries: Iran, Russia, Venezuela. Yet, within the last year, the U.S. administration sent an emissary to Venezuela with the express purpose of possibly buying their oil; an “Iran Deal” has been back on the table, then off; and everyone in the oil world knows about transshipment of Russian oil. The IEA has turned decidedly anti-fossil fuel and pro-green, and its offices are in London (the Green Energy Capitol), as are many of the offices of those from whom it buys its data. I have absolutely no quarrel with anyone on this site, but it does seem a bit unusual that a fellow can’t question if there might be a little bias being introduced, or if there might be a couple of million unaccountable barrels of oil between the supply and demand numbers. But you know what, Dennis, I’ll take your kind invitation and exit. You’re dead right: this is your site and you can handle it however you wish. I think you’ve done a nice job, along with Mr. Patterson and Ovi. I’m obviously trying to drive a square peg into a round hole, and since I use my true name and sometimes use it for honorable purposes, I don’t wish to sully it. Thanks for the opportunity to put down my thoughts, which have sometimes been right, sometimes wrong, but always parsed with consideration and a quest for truth.
Gerry,
There may be some bias in reported numbers, but note that I look at data from OPEC, EIA, and IEA, there might indeed be some bias, but not all of it in the same direction,
the numbers match up fairly well in terms of data, sometimes the forecasts are different, for example OPEC forecasts oil demand that is much higher than either the EIA or IEA, but output numbers are fairly close for OPEC, IEA and EIA.
Now we might assume as three major agencies are both estimating (for 2022 and earlier) and forecasting for 2023 similar output levels, that these might be fairly close to the truth (though of course one can claim otherwise). Demand forecasts for 2023 are significantly higher for OPEC vs EIA and IEA. Let’s assume that OPEC is correct and demand for oil is about 2 Mb/d higher than oil output. Does this track well with the oil price environment in 2023? Would we expect relatively low oil prices if the OPEC demand forecast was correct?
Maybe you see something that I do not.
The other website with data that is correct would be interesting to all of us, the invitation was for someone to find it, though my guess is that it would require a subscription and the cost might be high.
I love your comments, but I cannot create data, I do not have the resources to track every barrel of oil produced or refined, I leave that to others with more resources.
Without data we are left with anecdotes, which is of little interest to me.
Charles,
Corrupt officials exist everywhere, do you believe this is revelatory?
Dennis
What i find incredulous is that you think all the corruption, falsified production data, illegal shipments, simple theft is all accounted for by the EIA.
Research has estimated 5% of oil production vanishes by all sorts of clever illegal activity.
EIA make no mention of data from Windward, so how do they know how much oil is illegally exported from Iran, Venezuels, Russia?
Who is monitoring Russia production? what companies actually go to Russian fields and check?
Charles,
OPEC follows Russian output very closely as the are part of the DOC, this also applies to Nigeria, Iran, Iraq, Libya, and Venezuela. The refinery throughput and C plus C output numbers are very close from 1980 to 2022, compare EIA output data and Statistical Review of World Energy refinery throughput data.
If there is actual good research that identifies 5% more oil is being produced than was previously thought, the data would be out there for all to see and the statistics would be adjusted.
Your 5% number is vapor, not a believable number.
Can you point me to the peer reviewed research that gives the 5% estimate? Is it 5% every year, has it changed over time. I am interested in actual data rather than mentions in the press which are sometimes not well researched.
Output at wellhead and input to refineries are the numbers that matter.
How much extra Russian output do you think there is? You don’t think Western sanctions have had any effect on Russian output due to many Western firms pulling out of Russia? I think OPEC has a handle on this. Check their crude oil output estimates for Russia and note that the EIA numbers will be a bit higher because condensate is included.
Charles,
What research points to 5% missing oil? Can you point me to it. I have not seen it. I might believe it if I saw it. Most of the evidence you have presented is anecdotal, I am looking for numbers of barrels of crude for specific years. If we assume World output is about 81000 kb/d, 5% would be roughly 4000 kb/d of extra output that is not accounted for. I have asked this question before, who is producing this 4000 kb/d of unaccounted for oil output. Probably not a member of OPEC, because OPEC would be well aware of what its members are producing, I have suggested Russia in the past and you said obviously you didn’t mean Russia.
So where is this 4000 kb/d of extra oil being produced? If you are going to make the claim, tells us where we should look.
OPEC is part of it – just a few comments above there are reports of deep corruption in Iraq and Iran.
If you want to sell black oil from an oilfield, you won’t count it in your official report so the government has it easy to crackdown on you.
These countries are very corrupt – I only have reports from first had (a collogue on a company I worked) who told me about coal corruption in Uzbekistan. A relative from him made “deals” with coal there, he was very proud on him.
All I can tell you this coal was never counted anywhere – as was the money that flowed – and this one “deal” wasn’t that big but it was usual practice.
Eulenspiegel,
OPEC uses secondary sources to estimate output, the OPEC nations watch each other very carefully, particularly when there are quotas in place. Do you believe there has been a sudden change in the level of corruption? I imagine there has always been corruption and that everyone knows about it, including the companies that make the data estimates for the secondary sources.
Data is never perfect.
Denniss
This chart is in response to your question at:
https://peakoilbarrel.com/us-october-oil-production-held-steady/#comment-768227
The projections for both oil and NG show potential increases of 16% and 13% respectively as the data is updated over the following months.
Thanks Ovi.
Launching the New 2024 WTI Oil Price Challenge
Time to have some fun with real data we can see and will be accountable for next year. Let the Guesses begin.
You will need to make 2 Guesses
1) Closing price for WTI on December 31, 2024
2) Average price for WTI for 2024 as calculated from the EIA’s link:
https://www.eia.gov/dnav/pet/pet_pri_fut_s1_d.htm. This is item 13 on the weekly PSM.
To keep this fair here are my non-exclusive guesses.
1) $100/b
2) $85/b
1) $45
2) $65
I just want be clear and attach why. The banks are in trouble. Not just in the US. I think we will see all time lows in interest rates in China. Perhaps interest rates go to zero in China. As you can see I think oil prices will be higher the first half of the year.
Interest rates have to go lower or insolvency issues creep up due to underwater collateral.
There is a lot of oil consumption that revolves around Chinese real estate. If real estate prices continue lower in China it’s a problem for the banks and oil prices.
There will be no preemptive rate cuts to fix the collateral issues at the banks. Only when things are burning down will we see the rate cuts come.
OK I’ll go for it:
Closing = $100
Average = $100
Hopefully I’ll do better than last year!
My WAG is oil on 31/12/24 at around $120 and yearly average to be $95, based on tight oil production falling and Saudi unable to increase by the full 1Mbbls/d they cut.
Ovi,
I think closing price for WTI will be: $73
average price of WTI 2024: $95
My guess is a closing 12/31/2024 price for WTI of $115.00. An average for the year of $96.00.
Average 2024 closing price and Dec 31, 2024 closing price both at $75/b for WTI.
If you don’t mind me joining in this year:
-Average WTI 2024: $84.75
-EOY WTI 2024: $86.00
Gungagalonga
Everyone is welcome. Good luck in winning the grand prize.
We haven’t heard from:
Weekendpeak
KenGeo
Stephen Hren
Westexasfanclub
Hickory
Paul Pukite
Mike Shellman
LTO Survivor
Charles
Steve
Gerry
Plus +++++
$68 average
$65 closing
If I guess enough times eventually I’ll be right!
Or just dead lol
$79 Average
$89 Closing
bonus- Peak Global Combustion Day July 31, 2033
92$ closing
85$ average
Polished my crystal ball recently ;).
$73 average.
$76 closing.
Any attempt to forecast oil price is meaningless because in a situation of stagnation of production and of stagnation of economy, the oil price would vary for nothing.
Probably true but predicting has some entertainment value ( at least for me)….
rgds
WP
Jean
This is just an annual fun game.
Jean Francois,
I disagree, a stagnating economy might result in lower oil prices, if demand falls below supply at the prevailing price due to less economic activity. The average real Brent Oil Price in 2023 US$/b from Jan 2011 to Dec 2013 was $147/bo. I doubt we will ever see real Brent Oil Price that high in the future for a monthly average price. Chart below presents monthly average real Brent Oil Prices Jan 2010 to December 2023. From Jan 2015 to Dec 2023 the average real Brent monthly oil price in 2023$ was about $74.32/bo, roughly half the average level from Jan 2011 to Dec 2013.
78 Average
92 closing
rgds
WP
if i can join too 🙂
closing price : 113 $
average price : 97 $
https://aspofrance.files.wordpress.com/2023/12/ngforecastsevolution.pdf
J. LaHerrere forecasts pg 15,16
“Shale gas (or tight gas) production is important in the US since 2005 but will peak in 2024…
US shale gas HL ultimate is about 630 Tcf with a peak in 2024 or 2025 as Marcellus is
peaking and Permian and Haynesville in 2025.”
This will be at odds with many other peoples sense of the trajectory of US shale gas production.
My projection for continuous gas in US. URR=1480 TCF. This uses USGS mean TRR estimates and may be too optimistic.
A slightly more conservative scenario with URR=1200 TCF.
Why do these projections show such a rapid falloff of nat gas production from US shale?
I had assumed a long fat tail, understanding that this is a different beast than shale oil.
Hickory,
This is the nature of Hubbert models, I have not tried to use a similar methodology as I use for tight oil for shale gas. I have simply taken the TRR estimates by the USGS, then downsized the mean estimates by about 80% and then applied a Hubbert Curve, for the assumed URR, the peak would need to be lower in order to have a fatter tail as the URR is just the area under the curve. Laherrere’s analysis also may use a Hubbert curve, but the URR is only 630 TCF, about half of my “conservative” estimate, Laherrere’s peak is about 85 BCF/d (current US output is about 80 BCF/d).
Argus expects slower tight oil growth in 2024.
https://www.argusmedia.com/en//news/2525371-us-shale-oil-growth-faces-slowdown?backToResults=true
Frac Report
I checked the Farc site and there is no update for January 5. The last update was December 29. I wonder if they have decided to stop publishing their frac data.
Ovi,
Try this
https://www.aogr.com/web-exclusives/us-frac-spread-count/2020
or you might be referring to fracfocus
https://fracfocus.org/data-download
Dennis
Your first reference is for 2020 data.
I have used the second one in the past but it is usually 6 weeks delayed. The latest start frac day in the current report is Jan 2.
Ovi,
The different years are listed near the top of the page, just click on year.
https://www.aogr.com/web-exclusives/us-frac-spread-count/2024
It is for week ending Jan 5, down 4 to 246 and down 14 from one year ago.
The frac focus data seems months delayed for full counts.
Ovi,
Here:
https://www.aogr.com/web-exclusives/us-frac-spread-count/2024
Dennis/Kdimitrov
Thanks. The data wasn’t there when I last checked around 2:00 PM.
Tried at 4:00 and there it was,
Chart is posted below.
Frac Spread for Week ending January 5
The Frac site finally updated the count sometime this afternoon.
The count was down by 4 to 236, 2 more than the previous low of 234 on December 29, 2021.
Can someone involved with Fracs provide information on the typical time lag between the completion of the Frac and first day of oil flow/production.
My experience is that it’s usually a pretty quick transition from the final frac stage to breaking the seals/disc and flowing back. Maybe 1-3 days on average?
If I remember correctly, early on in the Eagle Ford… I think there was a very brief industry discussion to pause after completing a frac job. This was referred to as a Shake and Bake job. Meaning complete fracing the well, then pause for some determined time frame…. then flow back. I don’t think this went well or long in the science department…. and the norm seems now to be going immediately to flowback after fracing.
Gungagalanga,
How big a DUC inventory do you think exists in the Permian? I would think they would need at least a 3 month supply for the logistics, at roughly 475 completions per month (last 12 months average), this would equate to about 1425 DUCs, a 4 month inventory would be about 1800 DUCs. Does that sound in the ballpark from what you know?
Also how long does flowback last? I think by first flow, Ovi means the start of producing oil at normal WOR, so after flowback (which I would think is mostly water and proppant).
Ovi,
I found this on flowback.
https://kimray.com/training/flowback-quick-guide
Flowback typically lasts between 30 and 120 days. The fluid produced during this phase is a mixture of crude oil, natural gas, water, and sand.
Dennis
Great find. Clears up a lot. In the post above at the end it states: “The Permian, as of November, had 821 DUCs remaining and the completion rate was 449 wells/mth. This means the current cycle time between drilling and completions is 1.83 months or 56 days.”
Assuming that a completed well is added to the DUCs as soon as the well is completed, the cycle time I mention, 56 days, must be close to the average Flow Back time plus some time the well is sitting idle, waiting to start the Flow back.
A few days back I thought I saw a post by Mike Shellman that said that Novilabs was showing there were about 300 DUCs in the Permian and that he didn’t believe there were closer to 800 DUCs as reported by the DPR. That didn’t make sense to me since that meant a cycle time of closer to 20 days, which seemed short. I can’t seem to find the original post but there appears to be a number of answers at the link below. Maybe I got it wrong and he was discussing the Bakken. Not sure how to get to the original article on Mikes Forum Stuff. The original article included a chart.
https://www.oilystuff.com/forumstuff/forum-stuff/pretty-close-to-50-of-the-bakken-oil-production-increase-is-driven-by-completion-of-duc-wells
Ovi,
I think the EIA DUC count may not be correct, typically they would have about 6 months of DUCs that are work in process (WIP) inventory and then some amount of DUCs where completion has been deferred either due to low oil prices or some other reason (possibly running out of budget at year end) or stuff I don’t know about. As of July 2023 the deferred completion DUCs were on the order of 700 to 850 in the Permian based on an average completion rate of 450 to 475 and Novi data. This implies that the completion/flowback process takes roughly 6 months.
When Mike refers to DUCs he may be ignoring the WIP DUCs and only considering the deferred completions that were spud less than 2 years ago as being viable DUCs, it is a little unclear. He does not trust any of the EIA data it seems. I try not to ask too many questions because he gets upset and believes I am challenging his expertise rather than trying to learn.
He might answer questions from you though.
Dennis
What makes you think that the Permian or any other basin would have an inventory of 6 months. When completing 450 wells per month, that translates into a back log of 2700 DUCs.
I think the DPR count of 821 is reasonably correct. They have to go out to some of the bigger companies to request info on DUCs. Looking at the numbers supplied by the DPR, it looks like the DUC backlog is closer to 2 months
Ovi,
Look at every other basin and inventory, a drilling info article I linked in a comment respobding to Mr Shellman suggest wells in process consist of the wells drilled for the past 6 months, perhaps that information is wrong, but my guess is that the Permian DUC count by the EIA is wrong. Novi labs has a duc count of about 3500 wells, wells completed for the past year have averaged roughly 475 wells per month, 6 times 475 is about 2850 wells which seems much more in line with the Novi estimate for DUCs. The average for all tight oil and gas regions is about 4.7 months, and for all regions except the Permian the average is 7.4 months.
I think the DPR may be wrong, I trust the data from Novilabs more than the EIA estimates.
Question for the Nate H, Art Berman & Simon M enthusiasts:
IF the world replaced 100% cars with EVs tomorrow, but still needed diesel and jet fuel etc in current volumes to supply shipping, aviation, trains, trucking goods, heavy equipment, mining, plastics etc; how much gasoline would be created as a byproduct of the needed refining processes and in need of disposal?
Asking for a friend
Survivalist
I can’t give you an answer but can provide the following info as a clue.
For calculating refinery margins there was a calculation known as the 3-2-1 crack spread. This is based on old refinery technology that said a good rule of thumb to estimate the refinery margin was to assume that 3 barrels of crude produced 2 barrels of gasoline and 1 barrel of diesel.
So depending on the state of technology of the refinery, modern or old, and the quality of the oil, light/heavy, that ratio will vary across refineries. Could a modern refinery get to 2-1-1 crack spread?
I know that the syncrude sweet blend coming from Canada’s oil sands and shipped to the gulf coast is biased toward making diesel.
A refinery was specially built in Alberta to maximize the production of diesel from the oil sands. It produces 70 kb/d of product, of which 40 kb/d is diesel.
https://nwrsturgeonrefinery.com/project/maximizing-the-value/
Cheers Ovi. Thanks very much.
Peak Oil or Peak demand
Back when The Oil Drum was running, the issue of peak oil was very serious. A decline in global oil production of 0.5% per year or more would have very serious implications for the entire world. There would not be enough oil to provide for all our cars, trucks taking food and goods around the world and not enough fuel for all the ships and aircraft. Peak Oil would see large price rises and inflation and loss of jobs in sectors which are not vital, such as the holiday industry.
Dennis and many others now believe that we no longer face the problem of oil scarcity because demand will fall earlier and faster than supply. If this is the case, then peak oil is really of little interest. Why bother talking about a problem which is actually not a problem any more?
A decline in global oil production of 0.5% per year or more would have very serious implications for the entire world.
Naw, I think the estimate back then was much higher. I believe it was around 2% per year. If you do the math, I think you will find that the decline since November 2018 has been higher than 0.5% per year. And the demand decline has been greater than 0.5% per year. Covid could be responsible for that.
You are correct, peak oil will not be a problem if demand continues to fall as fast as supply. I have serious doubts that that will happen. The old giant and supergiant fields are all nearing the end of their lifetimes and new newer smaller fields have a much higher decline rate. Discoveries are not even keeping close to annual consumption. Consumption is 80 million barrels per day and consumption is around 5 million barrels per day. Not no, but hell no, demand will not fall that fast. Production will hit a Seneca Cliff soon, but demand will not.
Ron
Decline from 2018 has been reversing over the last 3 years, crude including NGPL which all go into the petrochemical industry has broken all records.
https://www.iea.org/reports/oil-market-report-december-2023
Massive increase in c and c in non opec has caused OPEC plus to cut production 2 or 3 times.
At the moment there is so much oil that prices are far lower than 2011to 2015.
Now OPEC has spare capacity which can feed back in at any time.
I remember on the Oildrum every time OPEC would cut production some know nothing would say OPEC had peaked.
C and c will exceed 2018 this year or 2025.
C and c will exceed 2018 this year or 2025.
Not a snowball’s Chance in hell that will happen.
Nov… 2018 84,589,000 barrels per day
Aug… 2023 80,700,000 barrels per day
Difference. -3,880,000 barrels per day
Ron
You can’t take one month. Accepted peak is as Matt Simmonds said it is sustainable production for at least a year, followed by irreversible decline.
Provide a 12 month moving average. Not only is the gap very close, the gap is closing down.
So we are not seeing an irreversible decline at the moment.
If demand increases as you think and supply cannot grow then we will start to see strong price increase at least to levels sen in 2014
This year will reveal much
it’s really a good resume of the problem of peak oil. It would have been really interesting to have data about oil production per size of fields. I remember the paper made by the UKERC 10 or 20 years ago in which you have a chart who show an exemple of what happen when old and giant oil fields decline and are no longer compensate by newer and smaller fields. Which is exactly what have happened in the UK and Norway (and in many mores countries). If you look at the world crude oil production (strictly crude so without NGL, condensates, refinery gains, biofuels…), you will clearly see that if you exclude Brazil, Iraq and North America unconventional oil the peak has happened almost 20 years ago, with a decline rate of 670 kb/d since.
French fries
The end of cheap oil happened as Colin Campbell said it would. The glut ended with Norway, Uk, Mexico going into decline followed by many other.
So far however there has always been a new source that has just managed to add additional production to world production. Brazil, Canada oil sands, tight oil.
I think we are coming to the end of discoveries that can add a little more oil, Namibia and Guyana being the latest.
The weight of old declining fields will tip the balance towards permanent decline probably once OPEC spare is used up.
I still think peak will be 2028 plus or minus a year either way. Decline rates will exceed demand decline forcing prices to balance the difference.
Charles, no one knows if a successful transition will occur and even if it does it will likely only be a partial one. Other limits to growth will likely kick in at some point. Civilization hangs in the balance, so there will be plenty of drama there regardless.
Charles,
My peak demand hypothesis is only a hypothesis, it will be interesting to see how it plays out. My guess is that there will be serious challenges as fossil fuel energy output reaches a peak. Maybe we can transition to other forms of energy along with using energy more efficiently and perhaps not, it remains an interesting problem to me and there are no simple solutions in my view and many believe there are none at all.
Dennis
Your comments and graph just a couple of weeks ago suggested you were reasonably sure demand will fall from this year, even predicting oil prices being under $100 from here on.
https://peakoilbarrel.com/eia-short-term-energy-outlook-and-tight-oil-update-december-2023/
You can’t keep changin your mind every few weeks, are you thinking of going into politics?
https://www.energypolicy.columbia.edu/publications/oil-intensity-curiously-steady-decline-oil-gdp/
The link above is quite clear every increase in GDP requires an increase in oil consumption.
The world becoming more efficient by 0.01barrel per $1,000 GDP. Currently it takes 0.39 barrels per $1,000 increase in GDP
The data which you have misunderstood states that this year it will require 1.068mb/d to generate a trillion dollars of GDP and next year it will require 1.041mb/d.
When global GDP hits $1 trillion more than it is now, I expect global oil consumption to be around 1 million barrels per day higher.
Global electric cars sales would need to hit 40 million per year to see demand flat and 60 million for demand to fall. As I said there will be millions more trucks globally and each truck uses the same amount of fuel as 30 cars.
Charles,
I presented a scenario based on a set of assumptions. If the assumptions are correct, then demand will fall and prices are likely to fall.
I am far from sure that the assumptions are correct. The future will always be unknown and every scenario created projecting what will happen in the future is certain (probabiity=100%) to be wrong.
I have probably stated as much thousands of times, but perhaps you missed it.
From your second link:
The time trend also reflects a gradual regime change from a supply- to a demand-constrained global oil market. In percentage terms, oil intensity first declines at rates lower than global GDP growth, allowing global oil demand to rise. Over time, given its linear functional form, the rate of intensity decline will accelerate to outpace the rate of global GDP growth, in which case global oil demand would peak and start to decline.
This is where I got my hypothesis.
Also note that there are two different metrics for World real GDP, one based on market exchange rates which does not take account of cost of living differences between nations (this metric was used in the paper you cited) and the other which uses purchasing power parity (PPP) exchange rates which does take account of cost of living differences between nations. The second measure is preferred by many international economists. I use the real World GDP based on the PPP measure to assess oil intensity and also use refinery throughput as a measure of crude plus condensate demand.
In 2022 about 0.2147 barrels of crude plus condensate were consumed for every $1000 of real GDP in 2017 international $ produced ($139.3 trillion in 2022 for 29.9 Gb of C plus C input to refineries). I assume the linear decrease in oil intensity from 2005 to 2022 continues in the future and that real GDP grows at about 2.5% per year, both of these assumptions are likely to be incorrect, this is a hypothesis. The demand scenario is based on this hypothesis and the supply scenario is my recent oil shock model. The demand is less than supply from 2024 to 2033 for this scenario and is the reason that I expect oil prices may be low, if the scenario is correct (probability=zero).
Dennis
I really don’t know how you think India will remain at 1.5 barrels per person when US consumption is at 20 barrels per person.
https://www.reuters.com/business/autos-transportation/sales-indian-suvs-soar-smaller-cars-skid-december-2024-01-01/
They are just getting started. If you knew the figures you would think twice about demand peaking this year. If Indian per capita consumption increases to a lowly 3 barrels per person, India’s consumption will hit 11mb/d.
We will know soon enough
Charles,
Yes we will see, I don’t expect that Indian consumption won’t increase, I expect relatively flat World demand for C plus C for a few years followed by decline, but only if oil intensity follows the linear trend of the past 15 years or so. Quite possible that it will not, as I often say there are an infinite number of possible future scenarios, choosing the correct scenario has odds of approximately zero. This is true for me and everyone else except the omniscient.
Charles,
In some nations such as China they are expanding the number of heavy duty trucks and buses that use natural gas. Also the efficiency of the World light duty fleet is increasing and there are a lot of two and three wheel ICEVs that have been replaced with EVs, these trends will continue reducing the demand for oil.
Charles, because supply could certainly fall faster than demand either before or after peak. And since oil is a key input the the economic engine it bears great concern.
Throw in the patchy distribution of production and you have the perpetual specter of geopolitical instability exacerbating regional supply shortage. The success and failure of nations can hinge on these issues.
Hickory
I agree. The poorest and most corrupt will fall first as some already have
Finding yourself in the ‘wrong’ trading bloc may prove disastrous. Echos of WWII, potentially.
Hickory
We now know what Russia is prepared to do to gain resources.
https://www.rferl.org/a/ukraine-destroyed-cities-russia-war/32454453.html
The Chinese goverment is even more brutal in scale
https://www.hudson.org/human-rights/the-ccp-wages-a-second-genocide-against-falun-gong
China, Iran and Russia are now very closely knit in terms of trade and ambition
Survivalist,
That is a very good question. The US is a an exception. It turns about 45% of the crude into gasoline whereas in mopst other regions it is closer to 25%. These are not absolute.Much depends on the refinery configuration. Contrary to popular belief very little gasoline is produced in the crude distillation stage. Most gasoline is produced from secondary processes – FCC, reforming, alkylation, isomerisation which produce FCC gasoline, reformate, alkylate and isomerate. There are a numbewr of tother minor components. FCC gasoline makes up the bulk of the gasoline pool, followed by reformate. Reformate and isomerate use the naphtha fraction as feed stock. The FCC which produces gasoline and feed for the alkylate uses Vacuum Gas Oil as the feedstock. A significant reduction in gasoline demand, not likely soon, would seriously affect refining margins. Naphtha would become long as would vacuum gas oil (VGO). FCC’s make a poor quality diesel stream and producing more diesel form an FCC is possible not not a good dea. A better use of the VGO stream would be to hydrocrack the VGO to middle distillate- jet and diesel, but that would require huge investment. The only sink for the naphtha is into petchems – steam cracking. Some naphtha will required to produce aromatic feedstocks – BTX for petchems but this is limited. There is no simple process for turning naphtha into jet and diesel. We are good at breaking chemical bonds but making them is a more challenging. I hope that this helps- it is the short, short version.
Attached is a refinery flowsheet with the embedded energy for the processes. You can see gasoline is energy intensive. I created this slide a few years ago. Now it will probably be picked up by the likes of McKinsey who will tray and sell it back to my company again. They did it on another topic. My slide was used in their presentation- wrongly I might add.
Carnot,
Is this a correct interpretation of your comment?
A gradual reduction in gasoline demand may not be a problem as refineries could gradually adjust to these demand changes with some level of investment.
Dennis,
The simple answer is yes, but there is never a simple answer. 3 years ago we did some modelling on EU refineries to try and understand what might happen. We confined ourselves to the EU because that is whee most of our manufacturing lays and the EU is probably ahead of the game. I did not consider China as no-one can understand Chinese economics and data is very patchy. Notwithstanding China is on a massive build out of refining capacity at the present time which will overtake the US.
I don’t buy into Peak Demand, never have and never will do and do not see it happening any time soon. Peak Supply will happen first. The fuel mix might change a little but only very slowly and demand for middle distillates will only grow globally. Were naphtha ever to go ultra long then it could be used in gas turbines for back up power generation. But I digress. Very roughly naphtha makes up about 20% of the barrel but it varies by crude type – light crude more- heavy crude less.
We made up a number of scenarios on the impact of EV’s on the EU fuel demand. There is very good data available from ACEA on the EU car sales, by fuel type, and the legacy fleet. The model allows us to plug in the annual data for new cars and deplete the legacy fleet. There is good data on miles driven, and new cars tend to be driven more. EV’s are not driven the same distance as ICE’s. Since 2020 there has been a steep decline in diesel cars, and sales of new cars has been dominated by gasoline, gasoline hybrids, and gasoline PHEV’s.. EV sales are growing but the uptake is mainly by fleet buyers. This year EV sales reached 16% but is a very subdued market and there is a growing belief that EV sales have peaked for a variety of reasons. ( charging, insurance, repairs, fire, running costs).
EV sales have been boosted by incentives which are no longer affordable. We are now in the real world and they are unaffordable to the general public.
The model predicted a modest GROWTH in gasoline demand up to 2030, and no decline before 2032. Diesel demand is forecasted to fall for light vehicles but not for heavy vehicles and off road applications. ( rail, mining agriculture). The model self updates each year and there is no sign of gasoline demand falling early.
For the EU this means the pressure is not so great for demand but the de-carbonization remains a significant issue. There are no easy retrofits to the existing equipment AND no appetite for investment due to activist investors and idiots like JSO, WEF, and Greepeace.
I hope the graph comes out as I have had to shrink it down and it has lost fidelity, but you should be able to follow it. In a couple fo months when all the data is updated the model will update. I cannot show you more as it is proprietary. Based on the last six months I think gasoline demand will extend little.
The EU also has some unrealistic requirement for jet fuel. There is simply no way that 50 % of the jet fuel will be made from renewables by 2050, even if demand falls off a cliff. All too often politicians have made rules that simply are nonsense. Cellulosic ethanol being one.
Thanks Carnot.
Can you try saving your chart as a gif, rather than png? The file size will be smaller and the chart may be more readable in the comments, if reposted. Thanks for the information. Perhaps demand won’t peak before 2030 in Europe or North America, but China is moving pretty fast on the transition to EVs and may set its sights on exporting EVs to India. If that occurs we may see gasoline demand fall at the World level. There may also be a transition of short haul heavy duty trucks to electric transport and long haul trucking could potentially move to rail which would reduce diesel demand (rail is far more efficient and can also be electrified). So land transport demand can probably be reduced.
Tesla works fine for me, some EVs are fairly inexpensive, especially some models made in China. As cheaper models roll out the EV transition may accelerate in my opinion.
Dennis,
I cannot find a way to save the file as aGif. It is not an option on my computer. I will look other options . JPEG is an option
I would bet on demand not peaking before 2030 or even 2035 unless peak production occurs. You can dream on China exporting EV’s but it will not have any impact because of the legacy fleet, which is substantial. I would bet that gasoline demand will continue to grow until Peak Oil supply arrives. If the EU cannot afford EV’s how will the ROW afford the unaffordable. Global gasoline demand is about 1.1+ billion tonnes per annum. I only see it growing even with 2 and 3 wheel E vehicles in Asia. The real gasoline demand exists in the US, EU, ME and parts of Asia. The US burns through 1+ million tonnes per day- 1/3 of the total global demand . So unless the US introduces so aggressive fuel consumption targets you can dream on about falling gasoline demand any time soon. Sad I know but I do not beleive in the sugar candy version.
Carnot,
We will see, prices of EVs will continue to fall, gasoline demand has been pretty flat since 2010 as has demand in the US, China is agressively going after the EV market and may dominate the World Market for EVs, demand in China for gasoline may be near peak. If India starts importing cheap Chinese EVs as the market in China becomes saturated, India may switch very quickly to an all EV market as their fleet is relatively small relative to their population.
We will revisit in a few years to see who was right, the future is not yet written. Growth in World gasoline demand has been about 0.8% per year on average from 2013 to 2022, peak was 2019, based on Statistical Review of World Energy 2023 data.
Dennis,
Fancy a wager? I guess not. 0.8% per annum growth still means growth, even with dramatic fuel consumption improvements. What makes you thing that EV’s will decline in pricing when input prices are rising? I just do not see it and the issues with EV resale values, charging infrastructiure, insurance, fire risk , running costs are all going to weigh heavy. Would I buy an EV – no way. Would I buy a hybrid- absolutely. The only scenarios that might slow fossil fuel growth are another Covid outbreak, population growth stagnation or economic collapse due to debt. Take your pick. We can limp along for a few more years by which time the US LTO shale story will be in decline. Then what? It is called Peak OIl. That does not mean an instant collapse but it will raise all input prices and the next round of quantitiative easing starts. What will happen in China?Chaos? Deja Vu.
Carnot,
I think demand for crude may be relatively flat, yes there has been very slow growth for the past 10 years, for the next 10 output may be flat and the 10 after that demand will fall. The growth in new plugin sales (hybrid plugins and BEVs) worldwide from 2012 to 2022 averaged about 42% per year. I expect the rate of growth will slow down in the future, but it is not clear how much.
In the US a Tesla Model 3 is pretty close to the price of the average light duty vehicle, running costs are lower, charging infrastructure can easily be built, and there are already Chinese EVs that are far cheaper than a Tesla which may take the World by storm in a few years time.
We will see,
Dennis
In europe EV prices are not falling much, the cost is going into inproved range.
The electric Kona is £40,000 new. £15,000 more than the ICE version.
The rate of devaluation is staggering. A 4 year Kona and Tesla 3 have lost £20,000. Very few people can afford to burn £5,000 per year. If sales stay mainly in the private fleet sector, sales will level off at 30% of sales.
I got better things to do with £20,000 and so have most other people
Charles,
The BYD Song sells for as little at $10,000 for its entry level model with a range of 190 miles, introduced in April 2023.
https://en.wikipedia.org/wiki/BYD_Seagull
Dennis
In europe EV prices are not falling much, the cost is going into inproved range.
Tesla 3 and Kona are £40,000 new. £15,000 more than the ICE version.
The rate of devaluation is staggering. A 4 year Kona and Tesla 3 have lost £20,000. Very few people can afford to burn £5,000 per year. If sales stay mainly in the private fleet sector, sales will level off at 30% of sales.
I got better things to do with £20,000 and so have most other people
Charles,
Yes EVs have depreciated as the price of new EVs has fallen. Many will choose to wait, others will choose to buy an EV, this is part of the reason for incentives. I didn’t know there was an ICE version of the Tesla Model 3, maybe only available in the UK?
A Kona is not nearly as nice a car as the M3 in my opinion.
In the US in Massachusetts a Model Y long range after Federal and state rebates costs $39630, total rebates are 11k (7.5k Federal and 3.5k state). This is about 10k less than the average new car price in the US.
Charles,
Not much that I can add save that depreciation is likely to accelerate as the full range of issue about EV’s becomes apparent. Who wants a to invest is a used battery? A chest of drawers falling off a cliff is a good analogy of an EV depreciation.
I paid £17.5 k for my Prius in 2009. Now it has a book value of £4k . £1k per year depreciation and it is ultra reliable.
Carnot,
Yes the Prius is a nice car, I owned a 2004, 2009 and 2015 plugin (now my daughter’s car). The Tesla is much nicer, but yes depreciation is a problem when the price of a new car falls from $60k to 50k and when Government incentives are added (not available when the car sold for 60k) the new car price is about 40k, so a 20k hit in US$ for a Model Y. Doubtful this will happen to someone buying a Model Y today at 40k though.
New cars tend to depreciate, that is just a fact, if on top of that the price of the new car falls as manufacturers improve their processes on a relatively new technology, the depreciation is steeper.
D.Coyne,
When you say things like “MoGas in US is flat and grows worldwide at 0.8% for past 10 years”, these are very crude aggregates that don’t tell the whole story, and certainly any secular trends are obfuscated by a once-in-century pandemic disruption in 2020-2022.
I personally like to dig deeper into complexities to get the full picture. As a rule, I like the 2010-2019 for the underlying trends, that period in-between the GFC and COVID disruptions.
US mogas, as you say is almost flat in that period: +0.1% pa. Is that a good number to extrapolate for future US demand? Nobody knows, really, but things are complicated. Let’s look at mobility first (chart below). Total miles driven were depressed 2010-2014 and then they started an uptrend. This is most certainly a hangover effect from the GFC. Household formation stagnated, home ownership stagnated, millennials stayed longer at home or moved into high-density urban rental units.
Since 2014-2015 these effects were dissipating, people were again starting families in the suburbs, the miles driven growth accelerated… until the pandemics hit. With COVID, apart from the mobility hit, there were also supply issues with car manufacturing in 2021-22. Car prices went way up and car sales stalled.
Now, what about fuel intensity in that 2010-2019 period? It was going down. (1) Obama era fuel efficiency standards had a massive impact. (2) The ethanol mandate was expanded. (3) Hybrids and EVs started to appear… Going forward, I expect only (3) to have some impact, and the effects of (1) and (2) are mostly behind us.
What’s in store next for US mogas, post-pandemics? Nobody knows, really, but if the 2015-19 underlying trend in miles continues, I think demand will actually INCREASE from 0.1% p.a. even with diminishing fuel intensities due to EV adoption.
I will cover ROW in a separate post, since I am being called for dinner 🙂
KDimitrov,
Yes crude estimates, what will future bring? I do not know, I can only guess. Trends often change. If we look at US gasoline consumption it has been pretty flat from 2010 to 2023. Miles travelled is a secondary measure, if we want to look at gasoline consumption, lets look at gasoline consumption.
If we use Jan 2010 to Feb 2020, the rate of increase is about 0.75% per year. I think more people working and shopping from home, aging population, more people using public transport, EVs, plugin hybrids and hybrids are all putting a dent in gasoline demand, younger people are much less into the car culture than when I was young, that may also have an effect on gasoline demand.
Carnot,
I just choose gif as the format when exporting the chart from the spreadsheet.
Carnot,
Thank you very much for your contribution! It is rare that I read something and physically nod at every sentence in agreement!
The only comment I have: in the event of mogas phase-out, if it were to occur, subbing hydrocracking capacity for FCC capacity is not going to be an insurmountable problem worldwide over a reasonable timeframe.
It’s a strange question, really, because traditionally mogas has been the premier product and refiners have invested in expensive kit to max its production.
KDIMITROV
Firstely thank you for your reply. I often get abuse.
In a normal world I would agree with your hydrocracker comment, but we are now in a strange world where a minority have extreme influenece in investments. 20 yeara ago EU refiners invested in max diesel to fuel the growing demand for diesel passenger cars. Some refiners updated refineries that minimised gasoline ( Repsol Cartagena). Many of the EU refiners are still gasoline biased and the EU is net long on gasoline (120 million tonnes capacity- 80 million tonnes demand) and net short of diesel (240 mllion tonnes demand- 200 million tonnes production) and that is on a good day. So the EU exports gasoline 1 tonne in 3 and imports 40 million tonnes of diesel per year( + jet). In the short term the supply and demand will come into balance. Gasoline growth and a small reduction in diesel driven by diesel car phaseout.
But the kicker is who would invest in a hydrocracker. At least $2billion in today’s numbers and you would need green or blue hydrogen. How are you going to get a payout? Especially if the market really is going to decline. Then you have to deal with the JSO., Greenpeace, WEF loonies who think we can switch overnight to unreliables. The reality is thus, no company in their right mind would invest in the EU whilst they (the EU) have a net zero agenda because the it will be a wasted investment. The excess refining capacity in the ME, India,and China will result in the EU becoming a net fuel importer as our refining capacity withers due to EU net zero rules. Sad but true. I have worked in this business for 45 years and we are slowly dying. Some will rejoice but believe me it will not end well when we have lost our expertise ( I am 67) and there is no-one left who knows the business. Young people do not want a career in the oil or petrochemical industry but they like our products – whilst they exist.
Watch the EU automotive companies squirm in the next few years. Germany will be forced to drop their crazy net zero plans but it will be too late.
Carnot, the investment point is a critical one and not understood. The number of hand waves of ‘we can just turn short chain molecules in to long chain’ to solve the diesel issue, or ‘charging infrastructure can easily be built’, or ‘we can overbuild renewables and turn excess into synthetic fuel’ etc.
(I hope you can see my hand waving at each of these statements)
Doing all of the above is physically possible on a small scale while civilization is growing, as in more goods, services and energy use, with plenty of easily accessible resources.
However at some point soon in the future, overall fossil fuels production will start falling noticeably year over year (especially oil). There are vast feedback loops that will take hold.
Because most people will want to keep the lifestyle they are accustomed to, they will spend more on today, and less for the future. Investment is one area which will decline first. There simply wont be the investment dollars to make the easy hand waves happen. Conjuring dollars out of thin air for investment by central banks also wont work on the downslope of energy, as it will just inflate the price of goods and services, always making the needed investment just a bit further out of reach.
Not sure if you have followed the Haru Oni project in Chile, but if ever anyone wanted a reality lesson, the numbers produced by that project are mind numbingly dumb. They have had their first ‘commercial’ (sic) batch of synthetic fuel sent to Europe, 24,600 litres for nearly a year of operation.
Even counting the first 5 months of operation as commissioning/ramp up, in the last 6 month’s it has had a process efficiency of 2.3% before counting any capital, operating, staff, transport or maintenance costs!! (just electrical energy input to energy output as synthetic fuel!!) It is unique and outstanding proof of how poor the planning for the future realistically is, because of all the hand waves of what people expect to happen.
Haru Oni is specially designed for all the equipment to match in size and output, based upon 70% capacity factor of the wind at Tierra Del Fuego, yet even assuming they can get efficiency 5 times higher, it would still take over 130,000Twh/yr of renewable energy to create the synthetic fuel needed to make the products fossil fuels currently provide (fertilizer, explosives, asphalt, plastics, etc).
Perhaps stating we would need 270,000,000 of these plants (at $US75M each, without the carbon capture bit) shows how dumb the idea of trying to keep civilization going in it’s present form, using just electricity really is, each plant with a limited life due to embrittlement of the metals by the hydrogen. There is not enough molybdenum to go close to building all this anyway…
Hideaway
As in all your pints I can only add to the picture. You are right on the nail and yes I did see your hand waving.
I looked up the Haru Oni project a while back. You can take a horse water but you cannot force it to drink.
Yes is can be done. Can it be done and make a profit- err Not in a thousand years of development.
You only have to look at the thermodynamics to see it will fail miserably. I do not know if you read Oilprice.com but they have some real experts. Brain Westonhaus is one. Endless schemes that are about to break on the world and save mankind only to disappear in a puff of smoke. Few people understand the Laws of Thermodynamics, which are actually well and truly proven which is more that you can say of many idea and concepts on this blog. Few take the time to sit back and really understand the physics and chemistry.
The Laws of Thermodynamics are not easy. At times I think i have grasped the second law and then I have my doubts. Meanwhile our politicians guided by the “Science experts”, whose income depends on ever more extreme measures being necessary to combat climate change, continue along the righteous path oblivious of the cliff top just ahead.
PV and Wind are energy sinks. You made some very valid points on Capex and maintenance. Wind is particularly bad and maintenance costs are sky high, Much , much more than 2% of Capex and a short life as well.
The real kicker is what happens when all we have got is intermittent power and captured carbon dioxide. Direct air capture must be one of the craziest idea I have ever heard, and yet there are so many experts who know how to do it. Really.
Most people have no idea about what kWh of power really is. We need to sit every politician and scientist on a bicycle connected to a generator and pedal non-stop for one hour at a brisk rate. After one hour they might have generated 0.15 kWh. That is what we are up against.
Carnot- “PV and Wind are energy sinks.”
Not when deployed where it is sunny or windy.
And you wonder why I don’t take your statements with any degree of seriousness.
The complete lifecycle energy input of a PV panel deployed in a sunny zone payback time is less than 2 years.
When deployed in the shade on the north side of a building in the UK where you live, it is an energy sink throughout its 40 year period of measurement.
Hickory
https://www.resilience.org/stories/2015-05-11/how-sustainable-is-pv-solar-power/
You proably know this site. It is a little old but the content is relevant. Stand alone Winfd and sloar might look good; solar much bettet han wiind. But in both cases what to you do when the sun does nort shine ans the wind does not blow? A back up is needed. Then you have all the additional connector and grid forming infrastructure to maintain the voltage and frequency. That means batteries, CCGT, Steam power plants, which must be run sub optimally. Add all the inputs and PV and Wind are no better than fossil fuels, and the cost of dispatchable power is off the scale. You cannot compare renewables with fossil or nuclear unless you incude all the extras to provide dispatchable power.
Now tell me how you propose to provide carbon neutral feedstocks to produce all the polymers and petrocemicals to power you carbon neutral economy for BAU. Let us start with something easy. What about simple ammonia. Somehow I suspect that might be a little beyond your sphere of knowledge, as no-one to date has managed even a cursory attempt.
I may not be an academic but I have 45 years years of working in the hydrocarbons business, which is rather more than most academics who tend to have very poor understanding of economics.
Hickory … “The complete lifecycle energy input of a PV panel deployed in a sunny zone payback time is less than 2 years.”
You continue to perpetuate this falsehood, that I proved a month or 2 ago was total nonsense. Just the process energy takes about 2 years to repay and it is only a fraction of the total energy.
Also having just solar panels producing electricity for industry is useless. Industry requires constant electricity, not intermittent. We do not have the processes that can work for intermittent electricity in most industries concerned with heavy fabrication of anything.
Just on the process energy, the 2 years payback is considering all the materials are lined up, the workers in place, the building already existing, some-one turns the switch on, the power allows the solar panel to be made, then the switch turned off, with the recorded differences the amount of energy used.
It is a childish way of measuring ‘energy inputs’, and allows zero energy for the buildings, the people, the trucks involved in transport, the roads and bridges built, the mining equipment on site at the mines, plus a million other things I’ve left out.
All of that suffers from entropy and needs to be replaced over time at an energy cost to build or manufacture it. Even the kids being educated to replace all the workers over time is an underlying energy cost, but never counted in such equations. The EROEI you read about for solar, wind and nuclear are done with ‘boundaries’, so the numbers look better and exclude all the hard to measure stuff. It is a community wide delusion and you are falling for it…
Just because something is propagated by paper after paper, professor after professor, doesn’t make it real.
Hideaway,
The studies of EROI always have boundries as any study without them would never be completed, the universe is vast, collecting all information from all of it would take an infinite amount of time.
As long as the studies of EROI use comparable boundries, the studies can be compared.
There are no studies with no boundries, maybe you can produce one.
Dennis, the boundaries used make a mockery of the results. A couple of weeks ago I showed with all the appropriate links that just the process energy used in the production of the raw aluminium, glass and silicon was greater than total energy claimed by some studies with ridiculously high EROEI numbers for solar.
There is a simple method that includes pretty much all the energy used throughout the chain from mining to final build, and full lifetime operation cost. That of course being the total capital, operating and maintenance costs, in dollars, of whatever type of energy production. Then of course that total cost needs to be turned into a proxy for energy to get an EROEI and not an energy return on money invested.
Using the average price of oil as this proxy is easily the best method, which is what I’ve done. It makes everything comparable in an unbiased way.
I’ve been using the 2022 IEA average price for a barrel of oil, dividing it by 1.7 for the 1.7Mwh of energy in that barrel, too use a $60/Mwh cost of average energy in 2022.
As the cost of energy was higher in 2022 than most of the previous decade, it will give an artificially high EROEI for every type of energy production, meaning that to get the ‘needed’ EROEI of around 6-15 to run modern civilization (various sources), the average of any replacement of existing system needs to be above 6. This is before considering the products we get from fossil fuels, which if made from electricity and carbon capture, would raise the required EROEI from solar, wind and nuclear a lot.
The problem is that those solar, wind or nuclear power plants that I can get the numbers for, give a very low EROEI, all less than 2. We can’t run a modern civilization on those energy sources, unless the plant lives get much longer, the O&M costs get much lower and the initial capital cost gets much lower.
Interestingly for nuclear, the O&M costs are the huge energy sink. In the USA the costs were $29.13/Mwh in 2021 (the latest year for this number from WNA), yet back in 2012, when the price of oil was higher, the O&M costs for nuclear in the USA was above $40/Mwh. Higher oil price in 2012 meant higher uranium prices back then.
The other aspect from my work is that I use the zero cost to humanity for solar, wind, oil, gas and coal, as I’m trying to work out the relative cost of the new system to what we built civilization with. We built power stations right next to the coal pits with the power companies having the ‘right’ to the coal, usually with a royalty attached to pay for the transmission lines to consumers.
Over the last 5-6 decades we have been mining and selling coal and more recently gas for power operations, all while debt has exploded in the developed world. IMHO it’s because the EROEI of the coal and gas has greatly deteriorated because of the extra energy cost of moving it around.
In all the work on LCOE, ‘they’ include a cost for purchasing coal or gas, to prove it’s an expensive form of energy production, while counting solar and wind as ‘free’. They ignore the reality of all the original coal power stations getting coal for effectively free, just the cost of mining.
For a modern coal power station, next to the coal pit here in Australia, I still only get an EROEI of ~5 with my method, using the 2022 average oil price, meaning to me we cannot run a modern civilization off coal anyway. Coking coal has a much higher EROEI
than thermal.
However no-one promoting an all electric future wants to mention replacing coking coal and all the products from oil and gas. The efficiency of turning electricity with carbon capture into synthetics, then making products from these, is appallingly inefficient, Haru Oni has a 2.3% PROCESS efficiency, overall efficiency is much lower, meaning not viable!!
It’s the oil and gas, oil in particular, that has the exceptional EROEI to run our civilization. I can still get an EROEI of 30+ for Saudi oil products.
All my work on the different EROEIs is explaining many things, like why we still had 60% of the population in rural areas involved in/with agriculture in developed nations despite 100 years of coal industrialization by 1900, but were able to get over 70% urban by the year 2000 with oil.
The only reason I can come up with, of why the capital, operating and maintenance costs of all energy producers are NOT being used widely for comparison, is that this method does not give the answer ‘wanted’. Instead all the studies set boundaries and massage the inputs to create an answer that appears acceptable so that the delusion of modern civilization being able to keep marching forward, continues.
BTW, even if ITER was wildly successful, fusion would always be an energy sink, not an energy producer. The energy cost of building ITER is massive at $35B and still rising. It can never replace that energy, and any commercial fusion plant that were to mimic ITER would be likewise energy expensive based on the needed materials used.
I’m not approaching the issue of EROEI from a perspective of fossil fuels are bad for climate, I’m approaching it from the point of view that fossil fuels are leaving us, one way or the other, so is ongoing civilization possible without them. The answer form everything observed so far is a resounding NO. A simple look at all the energy that goes into building a replacement for a simple coal power station, of solar, wind, extra transmission lines, batteries etc, is multiples of the materials, all fabricated using massive energy, tells me we can’t go to even to the 19th century lifestyle based on coal with them, let alone anything close to what we currently have.
Reverting to coal doesn’t get us modern civilization, as the EROEI was too low. The problems will pop up in agriculture as oil and gas decline, then somewhere else. Collapse of modern civilization is guaranteed when oil availability starts to decline at an accelerating rate. It’s what no-one wants to know about, so people choose self delusion by making up numbers to keep themselves and others happy in the interim.
Hideaway. Your EROEI fabrications are not accurate, or useful.
Reality can be seen at the level of utility deployments of new electricity generation capacity throughout the world, as they select what is the best 30 year option to add to their existing components.
Solar generation deployment by the utilities of the world in 2023 has come in much higher than prior estimates, with escalating momentum-
“Global annual renewable capacity additions increased by almost 50% to nearly 510 gigawatts (GW) in 2023, the fastest growth rate in the past two decades. This is the 22nd year in a row that renewable capacity additions set a new record. While the increases in renewable capacity in Europe, the United States and Brazil hit all-time highs, China’s acceleration was extraordinary. In 2023, China commissioned as much solar PV as the entire world did in 2022, while its wind additions also grew by 66% year-on-year. Globally, solar PV alone accounted for three-quarters of renewable capacity additions worldwide.”
The collective expertise of the global utility sector understands the reality perhaps a little better than you.
Hideaway,
A major flaw in using process energy as a metric is that it is not all the same in terms of energy waste. A lifecycle analysis properly accounts for these things, that is what Murphy et al use. If you want to use cost, use cost and profit, you seem to think using prices is best, but that will not necessarily reflect EROI as well as a lifecycle analysis focused on Energy. The EROI of oil, when we account for all the processes including extraction, transport, refining, and distribution is about 10:1, before we account for the losses in an engine which reduces the useful energy to about 3:1.
You cannot take the cheapest oil on the planet (Saudi Arabia at the wellhead) as your metric, you need to use the industry average today.
Also solar, wind and hydro, widely dispersed and highly interconnected requires very little backup power.
Dennis …”A major flaw in using process energy as a metric is that it is not all the same in terms of energy waste.”
Who cares what the waste heat is from the processes, and how is it relevant in the slightest??
The waste heat from the processes of making the aluminium from bauxite, the glass from silica sand, soda ash and the silicon wafers from the silica sand, is what happens in the process of manufacturing. The energy input is what counts, this is the energy that has to be supplied!!
This is still only part of the energy cost of making the panels. If energy is used of course it should be counted, just like every other energy input, otherwise you are just deluding yourself and anyone foolish enough to believe the numbers when great slabs of energy are left out.
The lifecycle analyses wants to only look at the diesel used in the machines at the mine, then the diesel in the trucks that transport the raw materials to the factory. Then the ‘energy’ used in the factory, then the diesel in the transport from factory to site of erection, then the fuels/energy used to put all the pieces together on site, then likewise for dismantling at end of life, with assumption of recycling everything.
This is a terrible way to look at energy inputs!!
There is no consideration, for the machinery at the mine, nor the workers, likewise for the trucks that do the transport, nor the drivers, nor the road and bridges driven over, nor the factories. They don’t come for free, they all have an energy cost to build and maintain, then because of entropy eventually be replaced. It is false accounting to leave all these costs out!!
Sure, we get nice numbers by leaving out most of the energy cost, which is why total capital, operating and maintenance costs are the best measure as the proxy for energy inputs. We can go back to 2005-9 for lifecycle analyses papers that showed EROEI of 15-20 for solar (Moore et al 2009). The more modern research is still based on the methodology from this earlier period. It’s all bunk because it leaves out most energy costs. going back to the period of 2005-9.
EROEI was never 15-20 back in 2005-9 as claimed by the lifecycle analysis of the time, which only shows marginal improvement today, because of thinner silicon wafers, increased panel efficiency etc. My method would show a tripling of EROEI (from the real level back then) to today because of the much cheaper capital cost and improved efficiencies. Life expectancy of panels is IMHO still questionable, as the lifecycle analyses want to use 30 years plus (and used this in 2005-9), while the average age of decommissioned panels according to IEA is around 17.7 years..
I use 25 years as that is the manufacturer guarantee period for most panels.
Hickory, Of course more solar is being deployed by utilities, it is mandated in most places and comes with subsidies, so why wouldn’t utilities everywhere deploy more??
The subsidised deployment tells us absolutely nothing about EROEI!!
https://finance.yahoo.com/news/tesla-lowers-range-estimates-u-154352348.html
Reuters says Tesla has concealed lower range capability than quoted for about 10 years. New regulations now require them to report range essentially the same way other EVs do, and the result, according to the text, is a 30% reduction in range capability.
>>
Seattle-based EV analytics firm Recurrent said it noticed last November that the dashboard range estimate in a Model 3 Long Range it was monitoring had been reduced to 333 miles from the previous estimate of 358 miles. That matches the current difference between the Tesla website’s estimate for that model and the estimate on the EPA site.
Recurrent Chief Executive Scott Case called the automaker’s revisions “a step in the right direction” for Tesla owners. Previous estimates, he said, have historically been “30% or more optimistic than the vehicles’ real-world range.”
>>
Not clear why this is not a 100% recall requiring them to add 30% more battery on all vehicles, perhaps stacked above.
Diesel and gas cars also have much less range in real driving than in advertise most times. With electric cars it’s even worse since they have their sweet spot in consumption when driving slow.
A model 3 uses round about 20 kwh/100 km when going on 120-130 km/h in not so good weather. That’s less than 400 km total range for the big battery, real when charging to max 80% on the trip and having a reserve of 10% (things can happen on a road trip) you have a range of 250 km before recharging.
I’d rather like to have a reserve of about 100 km from my experience with gas cars on longer trips – getting redirected from the Autobahn in the middle of the night into the center of nowhere because of an accident. Normal gas stations closed at night, good luck finding a credit card gas station or at least a slow charger for the Tesla.
Model Y long range changed from 330 miles of range to 310 miles of range, about a 6% reduction.
Dennis
Is this Permian DUC chart from NoviLabs saying that there were 2,177 DUCs in January 2023 and are now down to 367 in July. I think I may be misreading this chart.
Ovi,
Here is what I get (chart below). If we assume 450 wells drilled per month on average that would be 2700 wells in 6 months, lets call these wells in process (WIP) DUCs, the deferred completion DUCs would be about 857 (DUCs that are not WIP), some of these 857 DUCs might be dead DUCs, those are more difficult to assess, it may be most of them, perhaps around 700.
Dennis
The range that you are selecting is too big. Just select 2021, 2022 and 2023 or just 2022 and 2023 and a more detailed DUC count is presented.
In the picture below, I selected 2022 and 2023 in both First Production year and Period. There is quite a difference. Even starting in 2019, Novi shows 367 for July 2023.
Dennis and Ovi, you guys are getting it sorted out. Wells in progress have historically been thought of as RDMO (rig down move out) plus 6 months, awaiting frac’s. Wells that are between 6 months old and 24 or typically DUC’s, sometimes 30 months if they are Tier 1 level. Anything over 30 is a goner. You’d NEVER get the truth about dead DUC’s from an operator because they are puesdo valuable for a number of reasons, including not having to plug them and SEC PUD/Proximity Rules. I say the majority over 30 months are are totally irrelvant.
Because DUC’s have declined so signficantly now and fewer wells are being drilled because of falling rig counts, spreads are now sometimes pushing rigs off location to frac, anxious to get on with it. That won’t last as spreads decline. DUC’s have played a big role in 2023 growth, starting 2H22; thats gone now, pretty much.
Nobody is adding very many DUC’s anymore; costs are too high, where applicable interest rates are too high, cash flow is the only means of staying on the hamster wheel and they are going to complete ASAP. I don’t have a clue why Novi does what it does, its only answer is, “its how you want to classifiy DUC’s.” Most of Novi’s DUC’s belong in the TA or P&A category.
If rigs were more efficient and drilling lots more wells, faster, why are frac spreads low? Thats a lie and part of the reason why I believe Permian production is headed lower.
Thanks Mike,
I thought I must have had an inaccurate understanding of a DUC based on your comments, I was incorrectly including WIP wells in my DUC count, I think Novi labs may do the same thing.
In any case I agree, using the correct definition of a DUC, they are probably close to zero as you have been saying, thanks for teaching me another piece of the puzzle.
On frac spreads being low, there is typically a drop in frac spreads from Thanksgiving to the first week of January, we may see completions drop, so far we only have real data through October, if we rely only on RRC the complete data is from about 14 months ago, the EIA’s PSM data is pretty good usually within 1% of the final state data for Texas and New Mexico.
I agree there probably has not been any increase in the speed wells are being drilled, or if there has it is a small increase. It might be possible that the fracking process has become a bit more efficient over time so that fewer frack spreads can complete the same number of wells (wells per frack spread per month may have increased a bit), but that is simply a guess, I do not have data on that.
Thanks Mike
Clarifies DUC info. I am beginning to lean towards the DPR DUC count because it is giving a cycle time that is realistic, 55 days, considering that flowback time at best is around 30 days.
If you whack that by 2/3rds, thats likely real Permian DUC’s. Lying about DUC’s, to whomever, is not a punishable offense.
The simu frac stuff may be reducing working spreads some, but not much. They may slow down frac’ing where its cold, because of the cost to heat water, not in Texas.
My experience is that flowbacks on multi-unit (lease) pads can take up to 90 days to get all wells stabilized. Then another 30 days to file W/2’s and 60 more days to report first production and TRRC publication.
Lag time from spud to first reported production is still 6 months, min., IMO. That is why production is still increasing…from stuff that happened before rig counts started down in May.
Mike
I can accept 600 wells but it’s not that different from 800. The EIA uses Enverus as its data provider. I assume they have staff out there with the drillers collecting data trying to get it right.
In the article referenced in the link below they say flow back time can vary from 30 to 120 days. Does the time reflect the quality of the well, I.e high IP low flow back time?
https://peakoilbarrel.com/us-october-oil-production-held-steady/#comment-768381
https://www.oilystuff.com/forumstuff/forum-stuff/exxon-is-outta-duc-s-in-the-permian
Ovi
You can accept whatever you want but you continue to rely on big government data and that operators, like I was for 50 years, tell the truth to big government. That would be a mistake.
Investigative reporting involves “anecodotal evidence,” boots on the ground, beer joint heresay, common sense and being able to think past next week information. You and Dennis are not going to get anywhere without accepting that. Data is just that unless you know what it means. Its just numbers that other people are lying about.
The time to stablize a well during flowback and puke its proppant sand back all over the ground, then have to wash the well out, etc. etc., before it can be IP’d is just…the oil business. It vaires.
There is not anywhere near 600 viable DUC’s left in the Permian that can be completed at $70/1.50.
Have a nice day.
Mike,
Thanks for the information. Would you guess that wells in process (WIP) would be about 2400 to 2700 in the Permian (that would be 400 to 450 wells spud per month times 6 months)? I agree there are probably almost no deferred completions/DUCs that are viable in the Permian.
Also the piece from Flow was interesting, thanks again.
Mike Shellman
Thanks for your continuing and patient comments. I appreciate them.
I try to get raw data when I can but when it comes to DUCs, I am at a total loss. I put out the best and consistent info I can. Sometimes data can be wrong but the trend is right. Clearly the DPR DUC down trend is right and my understanding is that it comes from Enverus, hopefully a reliable data supplier to the EIA.
Here is why I chose to accept the 600 to 800 number. Once a well gets drilled it goes into a queue where more work has to be done on it before it comes on line. From what I had read, I thought the queue time was some where around 2 months to get that well online after being drilled. Now I am hearing from those with hands on experience that it could take up to 6 months to bring a well on line. So basically the length of that queue is roughly 450 wells per month times the time spent in the cue. So if it takes an average of 4 months to bring a well on line that means the cue is 1,800 wells long.
What I have learned today is that my understanding of DUCs needs to change. I thought a well in that queue was a DUC. Now I am learning that it is a Well in Process. So now I am more confused. How does one distinguish between a WIP and a DUC and what converts that WIP into a DUC that is put on the shelf to be used later.
So depending on the definition, I can see that there may only be 100 DUCs left. If that is the case, then we need to distinguish the difference between a DUC and a WIP. Unfortunately I have never seen any data on WIPs and that may be why there is confusion on the number of DUCs in the Permian.
Ovi and Mike,
Yes I was also confused on what should be called a DUC, there may be many definitions floating around, but the wells in process suggestion by Mr. Shellman was a great tip and has improved my understanding of the overall process. All of this is very basic for an oil pro, sometimes we just don’t know what we don’t know and I also appreciate Mike’s patience trying to improve our understanding.
I had previously thought that any well that was drilled became a DUC until it started producing, but the reality is that wells that were spud within the past 6 months are considered wells in process (WIP) and wells spud between 6 and 30 months ago are considered DUCs (sometimes also called deferred completions). Wells that were spud more than 30 months ago are often considered dead DUCs and may never be completed. Mr. Shellman or other oil pros can correct me as it is possible (likely) that I don’t have this exactly right.
Looking at Novi Data published Nov 8, 2023, I would estimate the DUCs that are 6 to 30 months old in the Permian basin as of July 2023 were about 92, assuming WIP=450 times 6=2700 wells. The May to July 2023 data might not be complete, if we use April Data I get a somewhat higher estimate of roughly 200 DUCs that are 6 to 30 months old, this matches pretty well with Mike’s estimate which is roughly 200 DUCs (if I understood him correctly).
On frac spreads dropping between end of November and early January, maybe budgets run out around this time so that things slow down at the end of the year? I guess it would depend on if the fiscal calendar for these companies runs from Jan 1 to Dec 31.
Ovi, when it comes to DUC’s, I too am at a loss. But only if I rely strictly on data. Data is messing people up with regards to predicting US oil production.
I hate to sound cynical, constantly, but everybody lies about everything today. No other industry I have ever known or read about in history relies more on common sense, than the oil & gas industry. Can’t see down there, you know; its dark, and hot, and unfriendly. In the really old days ALL we could do was rely on hearsay, world of mouth, on ‘scouts,” actually out there on the highway with binoculars, or scouts that would get field hands drunk in a beer joint to loosen lips. It worked OK and the US oil industry grew and made America great! Now, everybody has to understand how many pounds of sand goes into a stinkin’ perforated foot in a lateral.
Enverus, that is the EIA’s primary source of poop, was born a child of Alan Gilmer, DI’s founder. https://www.forbes.com/sites/davidblackmon/2017/08/17/gilmer-we-should-view-the-permian-basin-as-a-permanent-resource/?sh=2bb58a3f56ff.
The oil and gas industry is 150 plus years old. Only the last 10 years has there been so much information about it so readily available. A lot of the information is wrong, intentionally or otherwise. People wanting to understand cannot rely on my industry telling the truth…and man…I HATE THAT!!
Again, DUC’s have been important in understanding the spurt of growth in 2023. Everybody in the media, with an agenda, thinks that will continue. I don’t think so. If I could say anything to y’all so adamant about relying on data…you just gotta wait and the truth will become (self) evident.
The stuff we are trying to wring out the rock below us is several hundred million years old… you ain’t gonna understand much of it by relying on the Energy Inaccuracy Agency.
Mike Shellman, thanks for this and all your other work, it is a joy to read from a person that has boots on the ground experience.
My experience in totally different industries is exactly the same, half truths, mis truths all over the place. It tends to go along the lines of wishful thinking about a number of different parameters, if they all go well we’ll meet the xxx number, so they put the xxx number as the industry number for whatever.
It’s a world of information overload, there is so much information available that no-one has time to check and verify exactly how accurate any given piece of information is, because by next week there is more ‘newer’ information from ‘other’ sources.
Anyway, just letting you know there are many of us that don’t have O&G experience, but do pay a lot of attention to those that do..
Thanks Mike,
We do the best we can with the information available, thanks for helping us to make sense of it. Some of the EIA stuff is not very good (DPR and forecasts), but in my view the EIA PSM does a pretty good job. The chart below compares RRC data for Texas from Jan 2015 to Dec 2022 with the initial 914 estimate from the EIA in spreadsheet linked below
https://www.eia.gov/petroleum/production/xls/comp-stat-oil.xlsx
When we take the cumulative total from Jan 2015 to Dec 2022, the EIA estimate is 0.998948 of the RRC total for Texas C plus C over this 8 year period, not particularly inaccurate, assuming the RRC is exactly right.
The null must be selected to get an accurate count, there is probably some data that is incomplete and does not have specific dates attached to it or the data is just missing, those are called null points (no year data). Try selecting 2019. 2020, and 2021 only both with and without the null box checked and it may become clear. Or just have null box checked, On July 2023 there were 3190 DUCs with no information on the Date, on Jan 2021 the number was 768 DUCs, and on Jan 2019 it was 574 DUCs, to get an accurate count you have to click on the null box it may be that 574 of the DUCs are dead DUCs, or it might be 768 dead DUCs, let’s use 768 dead DUCs, based on the data I see with 3557 DUCs on July 2023, this would suggest about 3557-768=2789 “live” DUCs. Mr. Shellman does not consider WIP wells to be DUCs (I think), so if we assume about 470 completions per month and perhaps 6 months to be the WIP window 470*6=2820 and as Mike has said the DUCs would be all gone (as he defines a DUC, what others call deferred completions.) See
https://www.forbes.com/sites/drillinginfo/2016/06/27/american-ducs-drilled-uncompleted-wells/?sh=4c924304729c
https://www.msn.com/en-us/news/world/why-venezuela-deployed-troops-to-guyana-border/ar-AA1mdoOu
Venezuela deploys troops to Guyana’s border.
“Maduro’s threats focus on drilling rights granted by Guyana to big oil companies in the Atlantic Ocean, north of the Essequibo — a 61,600 square mile area both nations claim as their own.”
Maduro is giving the USA an excuse to invade.
Maduro is giving the USA an excuse to invade.
Don’t hold your breath.
Trump said he was going to invade Venezuela when he was in office.
Even someone who doesn’t understand oil can see that Venezuela has massive oil reserves ( even if difficult to extract ).
Based on proximity to the USA this is the #1 target if a certain mindset comes to power.
As stated, don’t hold your breath
I’m not holding my breath.
just seeing the obvious.
Monroe Doctrine.
D. Coyne,
Miles driven is not secondary, it is the primary driver for gasoline demand, along with mpg.
Gasoline = miles / mpg
What is secondary is your speculation on EV adoption, that doesnt affect gasoline demand directly, it just affects the US fleet’s mpg, along with many other factors, such as ethanol, CAFE standards, etc. People told you here that EV miles driven have been low, so effect on fleet mpg has been lower than anticipated.
US mogas is not going to go sharply negative by 2030, and in my view will probably grow at ~0.5% p.a. from now on, given that auto manufacturing bottlenecks have been resolved, most of mpg improvements of ICE vehicles are squeezed out, ethanol mandate has been fully implemented, etc…
Kdmitrov,
MPG can change, better to look at gasoline consumption directly in my view, as at page below
https://www.eia.gov/dnav/pet/hist/LeafHandler.ashx?n=PET&s=MGFUPUS2&f=M
Yes people have claimed EV miles are low, not my experience (I own only EVs at present, no difference in miles driven from previously), I would need to see data to be convinced. Generally newer vehicles are driven more miles and most EVs are relatively new cars.
What will happen in the future is not known. What has happened in the past at the World level is an average increase in sales of plugin vehicles of 42% per year from 2012 to 2022. Future growth rates will likely be lower and are unknown.
The primary metric is gasoline consumed, we have the data, we should use it.
Dennis
“Yes people have claimed EV miles are low, not my experience (I own only EVs at present, no difference in miles driven from previously), I would need to see data to be convinced. Generally newer vehicles are driven more miles and most EVs are relatively new cars”.
Well for someone who works in statistics you did not look very hard. Try these which is data for the good old US of A.
https://www.cell.com/joule/fulltext/S2542-4351(23)00404-X#secsectitle0015
https://carbuzz.com/news/the-average-ev-drives-thousands-of-miles-less-than-ice-cars
The second link is essentially the same daata as the first but discloses some additional graphic data. This data was produced by GWU. Funny how I found this within 2 minutes of searching, yet you maintain that there is not evidence of EV’s being driven less and moreover you expect a rapid decline in gasoline consumption, also not visible at the present time. With less than 20% of new vehicles being EV’s it will take a very long time before any significant fall in US consumption is seen. The fact is that the forecasts of EV uptake is below expectations as the full issues with driving an EV become apparent. What is emerging is that EV’s are being scrapped at a faster rate than CV’s. Minor accidents often make the cost of repairs unviable, resulting in surging insurance costs, for all vehicle types. It seems to me that you appear to select what you want to believe instead of keeping an open mind – I think it is called congitive bias, which affects a few people on this blog.
Likewise you have been in discussion with Mike Shellman and believe your statistical data is better than someone who has worked for decades in and around the Permain basin. The latest discourse with him revealed your somewhat limited knowledge of oil production matters. Finally you appear to accept that what you see from the EIA might not be in sync timewise. The EIA DPR has to be one of the worst reports they generate. I guess you now appreciate what a “dead DUC” is.
To bolster your data sources can I intoduce you to JODI. This is a rich source of information. You can look up the data for the past 20 years free of charge. It is a bit clunky but you can see that the US gasoline consumption has not declined. Be aware it is not perfect because some countries do not report.
https://www.jodidata.org/
Yes Carnot,
Unlike you I am not omniscient. There are a number of different sources on EV average use vs ICEV, my personal experience is that I drive the EV just as much as ICEVs I have owned, though this is anecdotal. My EVs have about 300 miles of range. Shorter range EVs that might not have a good charging network available may be driven less. The market is moving to longer range EVs, when one considers these longer range EVs in comparison to ICEVs the differential is nearly zero.
https://climate.mit.edu/posts/how-much-are-electric-vehicles-driven-depends-ev
Obviously someone who has been producing oil for 50 years knows more than me about producing oil, I imagine he knows more than you as well, though you might claim otherwise.
There is also this study
https://www.autoexpress.co.uk/tesla/352144/tesla-drivers-cover-higher-annual-mileages-owners-any-other-car
Dennis,
Your link was 4 years ago and based on the UK. Did you know that there is a huge tax break for company cars in the UK. Not representative of the the real situation especially when Ev’s made up 5.4% of new car sales in the EU. Even now EV’s in the EU are only 16% of new car sales, well behind estimates. The punters do not want them – too expensive and unreliable (too many unnecessary electronics)
At least quote some figures from you own continent rather than cherry pick an island. This is the sort of shite published by the BBC (biased broadcasting corporation) and The Ghastly Guardian.
Cognitive bias. You can do better than this.
Carnot,
Just another point of view, obviously if it does not confirm what you believe it should be dismissed, that suggests cognitive bias.
Try this
https://its.ucdavis.edu/blog-post/no-electric-vehicles-arent-driven-less-than-gas-cars/
OPEC spare capacity
According to OPEC they now have 3 mb/d of spare capacity, this capacity can come back relatively quickly as it is from existing fields whose production has been reduced.
If US, Brazil etc cannot meet the rising demand this year and prices rise sufficiently then OPEC could step in.
My guess is US production can still increase and decrease production in response to prices. At the moment the prices are too low for US to increase production very much.
https://www.spglobal.com/commodityinsights/en/market-insights/latest-news/shipping/113023-dark-tanker-oil-transfers-rise-further-with-suspected-sanctioned-trades
Once oil prices are over $100 we will see what US can do.
Russia has had 2 years to perfect the illegal trade in oil with Iran and Venezuela with the complicity of corrupt India and the Chinese dictatorship. This trade is probably at it maximum now. So I see oil prices starting to rise gradually.
Charles,
Thanks,
The article cites recent numbers of as much as 115 Mb for a recent quarter which would be about 1.27 Mb/d roughly 1.3% of World oil consumption (or 1% if you believe consumption is perhaps 103 Mb/d). This is quite a bit less than the 5% number often claimed. Note also that just because it is transported by a dark fleet to avoid sanctions does not mean that output was not reported correctly or that inputs to refineries is also not reported correctly in terms of total mass or volume.
The claimed spare capacity of OPEC has always been an illusion, there is some, perhaps 1.5 to 2 Mb/d, but we won’t really know until oil prices rise enough that OPEC quotas rise and we see what Saudi Arabia, Iraq, UAE, and Kuwait are capable of producing, all of the spare capacity that OPEC has is in those 4 nations, other members are producing at capacity.
Dennis
Do have have a short term memory problem?
The oil stolen in Nigeria, Sudan, Libya, Mexico, Russian interior oil transport illegally to Turkey from Iraq do not go by vessel this oil.
Also this article is what they could find in a limited part of the world’s Oceans.
The main trust of the article is showing the dramatic increase in the dark trade something you did not accept.
Anyway unlike you I will stick with my prediction and not change it along with my socks
Charles,
I adjust my thinking based on new information, you should try it. So you expect that other oil adds up to 2 to 4 Mb/d, on top of the oil that is already being reported by various agencies. I accept that the dark fleet exists, and that oil shipped by the dark fleet has likely increased since the sanctions on Russia.
What I do not accept is that oil output is 3 to 5 Mb/d higher than reported. I have asked before for your source for this claim, the fact that you provide no such source leaves me wondering if it is just made up or comes from an unreliable source. I am convinced by data, not by anecdotes.
Dennis
I have attached several studies of investigations with best assessment. Assessments of corruption in Nigeria, Libya, Mexico, Venezuela, Iraq which you knew nothing about.
Iran, Russia internal theft and on and on.
You can continue to believe that global GDP has magically increased by $10 trillion with global oil demand falling by 1 million barrels per day.
Also your changing view of demand peaking in 2035 to now 2024 is not evidence based, it’s just guessing.
You are swayed by little evidence on some issues but refuse overwhelming evidence on other things.
This year will tell
Charles,
You have never given your reference for 3 to 5 Mb/d extra oil being produced and consumed above what is estimated by OPEC, EIA, IEA, and Statistica Review of World Energy. I know there is corruption, so do the people at OPEC, EIA, and IEA. You seem to think nobody but you knows about corruption. There are many problems in the World, I focus on only a few.
My hypothesis is based on the evidence, my view was once similar to yours on a future peak in 2028, but sustained low oil prices since 2015 and the paper you linked on oil intensity led me to an alternative hypothesis. So far demand has not rebounded from the pandemic as fast as I expected and so far the peak annual demand for World crude plus condensate remains 2018 (refinery throughput from Statistical Review of World Energy).
If we see a sustained rise in oil prices due to high demand (rather than supply disruptions by wars or terrorist activity), my view will change.
You may not be aware, but every scenario of the future is a guess, based on what has occurred in the past. The past is not always an accurate predictor of the future, trends can change and often do in ways that cannot be predicted.
Don’t forget Biden doesn’t care who is selling oil, just so the price of gasoline is as low as possible to get his numbers as high as possible.
I am looking for a good datasource which separates all US liquid production into crude and CC- any pointers are appreciated.
Thanks
WP
Weekendpeak
Download the STEO, Short Term Energy Outlook. Click on all tables in the upper right hand corner to down load an Excel spreadsheet. Under TAB 3atab US all liquids is given in row 7. Under Tab 4atab US C plus C is given in row 7.
This is a source that is often referenced in the POB posts.
https://www.eia.gov/outlooks/steo/
WP,
I suggest that you go here.
https://www.eia.gov/dnav/pet/pet_crd_api_adc_mbblpd_m.htm
Any production above 50 API is effectively condensate though is can extend down to high 40’s API. The condensate is knocked out of the wet gas stream at the gas plant stage. It may be recovered or back blended into the crude stream. See the image which I lifted form one of my training modules.
Thanks to both Ovi and Carnot for the pointers – much appreciated.
rgds
WP
“Oil demand will continue to set records this year, with global demand growth expected at nearly 2 million barrels per day (bpd) compared to 2023, Wood Mackenzie said in a report on Thursday.”
This is a good piece from the bbc on the incentives to go electric for small businesses in the transport sector. Everyone who drives a lot as part of their business is champing at the bit to go electric to increase their profits. This with $75 oil lately.
“He would spend about 1,000 Kenyan shillings a day – just over $6 (£5) – on fuel when he used a petrol bike. Nairobi drivers earn on average about $10-15 a day, according to the country’s Boda-Boda Association.
Since going electric, Mr Lugalia says he spends no more than $1.42 a day – so his profits are now up and that makes him very happy.
“Because of the cost of petrol, I am able to save a lot more using my electric bike,” says Mr Lugalia with a smile.
https://www.bbc.com/news/world-africa-67781109
Fuel costs down about 75%. This makes sense since electric motors are about 4 times as efficient.
From Ars Technica ( https://arstechnica.com/cars/2023/11/280-million-e-bikes-are-slashing-oil-demand-far-more-than-electric-vehicles/ )
There were over 280 million electric mopeds, scooters, motorcycles, and three-wheelers on the road last year. Their sheer popularity is already cutting demand for oil by a million barrels of oil a day—about 1 percent of the world’s total oil demand, according to estimates by Bloomberg New Energy Finance.
We will see, I call Jeavons Paradox.
Almost everyone in the US cannot imagine having a vehicle with range of less than 200 miles before recharge/refill.
That attitude is one born out of a hundred years of energy and material wealth abundance.
For much of the rest of the world, and likely for Americans in the future,
the economic miracle of having a transportation machine that can be powered by electricity or petrol for 80 or 120 miles in a day prior to recharge/refill is not a hard thing to grasp. It is an economic revolution compared to the alternative of being a transportation ‘have not’, or being a victim of the peak oil supply disruptions.
Current examples of EV cargo delivery vans –
https://www.merchantsfleet.com/future-of-fleet/best-electric-cargo-vans-for-business/
On the smaller utility side, an amazing array of options are offered from this company as an example, with ranges up to 120 miles-
https://www.alke.com/configurations
I got some flak recently since I implied that I I would prefer an electric vehicle to the trustwurthy gasoline Volvo, but I stick to my point, electric is better!
(as long as it´s NOT from U238)
I think your site is awesome and believe that we need more discussions around the future of oil production in the US and around the world. I’m convinced that the Permian is about turn over and go into decline in 2024 but I appreciate your approach which is not so dogmatic about actual dates and rates of decline.
New posts are up
https://peakoilbarrel.com/short-term-energy-outlook-and-tight-oil-update-jan-2024/
and
https://peakoilbarrel.com/open-thread-non-petroleum-january-12-2024/
one interesting news from oilprice.com referring to EIA website here:
https://www.eia.gov/todayinenergy/detail.php?id=61283
the lower 48 actually are producing more 30-40degree API oil than before and in Texas 30-40degree API crude now surpassing 40-50degree API crude.
does this news bode well or bad for US shale oil?
Sheng, do you actually believe that?
Please don’t.
https://www.oilystuff.com/forumstuff/forum-stuff/horse-apples
I actually found it is really hard to believe too, like you tried to reason above, Mike
But, it does sounds quite convincing given that EIA had a page about this change, and did not leave it as something as “who cares” or just a statistic error — see the trend in the past year, something has to account for it.
I tried to explain it in a more ominous way for US shale oil below:
The over drilling caused phase separation that make the oil separating into heavier oil and wetter gas, especially in Midland where lots are at the boundary of 40 degrees, and before it was originally 42, now the heavier is 39-40.
Sheng, that I might buy, in fact it is the only explanation that makes sense, actually. Good!
In your example, much of the core in the Midland Basin is past bubble point, IMO; heavier oils (<45) might indeed have been cooked in the same benches but are the last to move. AL is now dredging that oil out of the rock. Also, higher WOR seems to change oil characteristics, from oygenation (?) and lower oil gravity. I am still not buying the 10 degree drop, but I like your idea.