EIA’s Electric Power Monthly – June 2019 Edition with data for April

A Guest Post by Islandboy
chart/

chart/

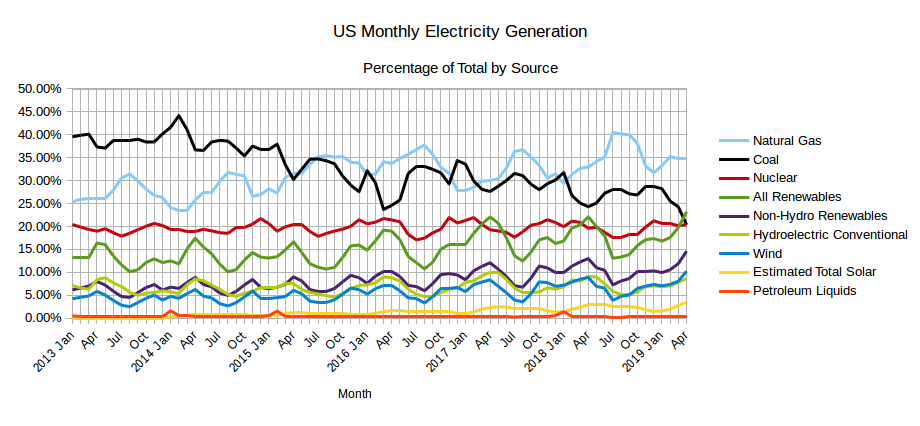
The EIA released the latest edition of their Electric Power Monthly on June 25th, with data for April 2019. The table above shows the percentage contribution of the main fuel sources to two decimal places for the last two months and the year 2019 to date. As was projected by the EIA in their Short-Term Energy Outlook in April (reported here), the contribution from All Renewables exceeded that from Coal for the first time ever. The EIA featured this news on their Today in Energy page on June 26th, the day after the data was published. Read More
US Tight Oil Estimate and Projection to Dec 2019

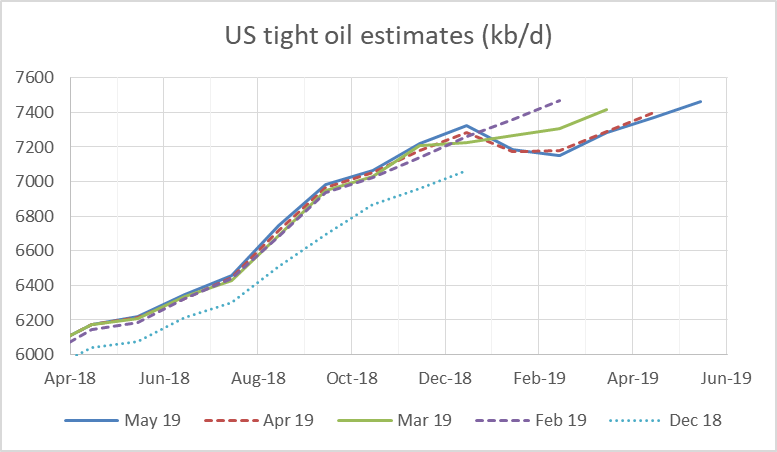
New tight oil estimates were recently released by the EIA. The chart below compares estimates from Dec 2018 to May 2019, where the Dec 2018 estimate is that estimate with the most recent month estimated being Dec 2018 and likewise the May 2019 estimate has May 2019 as the most recent month estimated. The May 2019 estimate is fairly close to the April 2019 estimate with a slight downward revision of the April 2019 estimate from 7399 kb/d to 7368 kb/d, March 2019 was also revised lower by 10 kb/d from 7292 kb/d to 7282 kb/d. For May 2019 the most recent estimate is 7462 kb/d and if past history repeats this estimate may be revised lower next month.

chart/

Read More

OPEC May Production Data

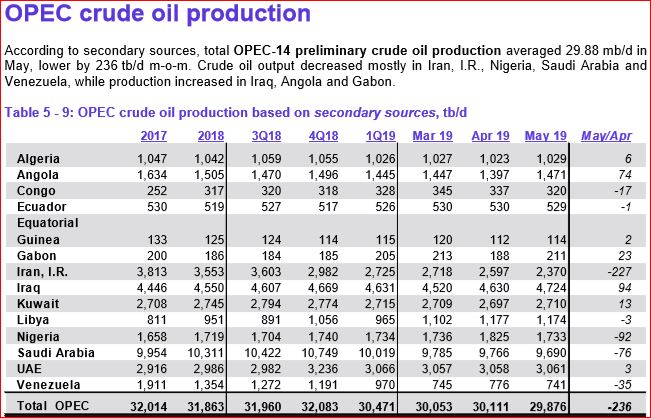
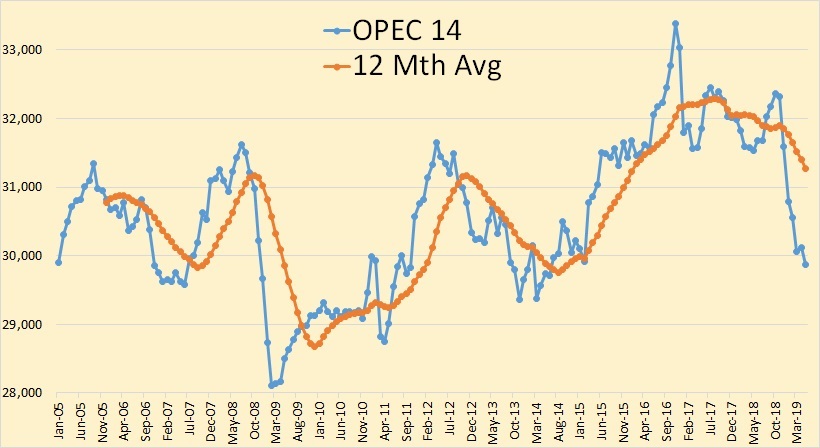
The below charts, unless otherwise noted, were taken from the OPEC Monthly Oil Market Report. The data is through May, 2019 and is in thousand barrels per day.

OPEC crude only production was down 236,000 barrels per day in May but that was after April production had been revised upward by 82,000 bpd.

Iranian April production was revised upward by 43,000 bpd and Saudi Arabia April production was revised upward by 24,000 bpd.

Read More