EIA’s Electric Power Monthly – August 2018 Edition with data for June

A Guest Post by Islandboy
chart/

chart/

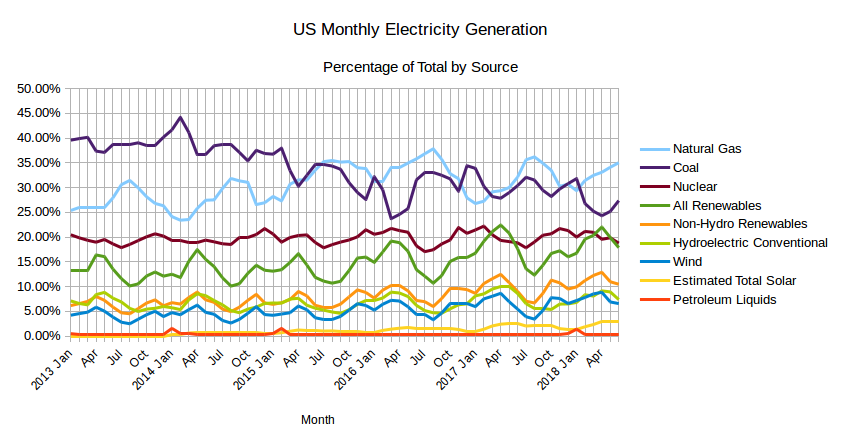
The EIA released the latest edition of their Electric Power Monthly on August 24th, with data for June 2018. The table above shows the percentage contribution of the main fuel sources to two decimal places for the last two months and the year to date. With the data for June now available some half year data can be produced. Below is a table showing the various changes in the amount of electricity generated for a few selected sources, All Renewables and Non-Hydro Renewables, between the first half of 2017 and the first half of 2018. Read More
Mexico Production and Reserves, 1H2018

A Guest Post by George Kaplan

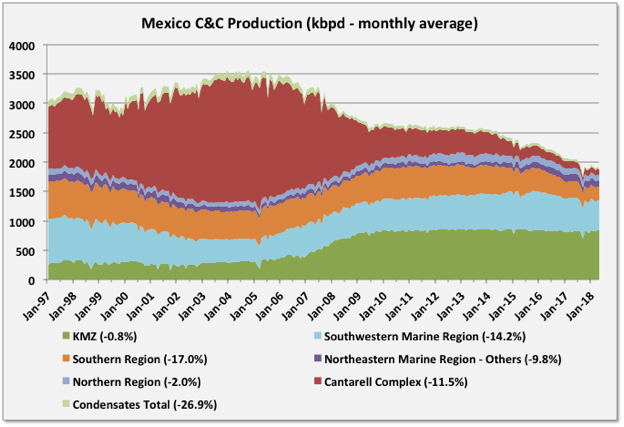
Mexico C&C Production

Mexico oil production is in decline though, at the moment, not as steep as it was expected to be (at least by me – IEA predictions are closer).

Data is through June and comes from Pemex and National Hydrocarbons Information Center (CNIH) (both sites are pretty good).

For June C&C was 1870 kbpd, down 25 kbpd from May and 170 kbpd y-o-y. Yearly decline rates for each region are shown in the chart below. Production peaked in 2004/2005 at just over 3500 kbpd, so overall decline is approaching 50%.

chart/

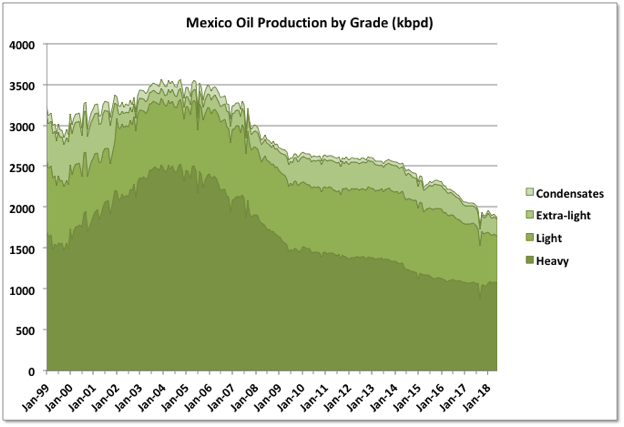
Most of the decline has been in light oil and condensate, with heavy oil holding fairly level.

chart/
Read More

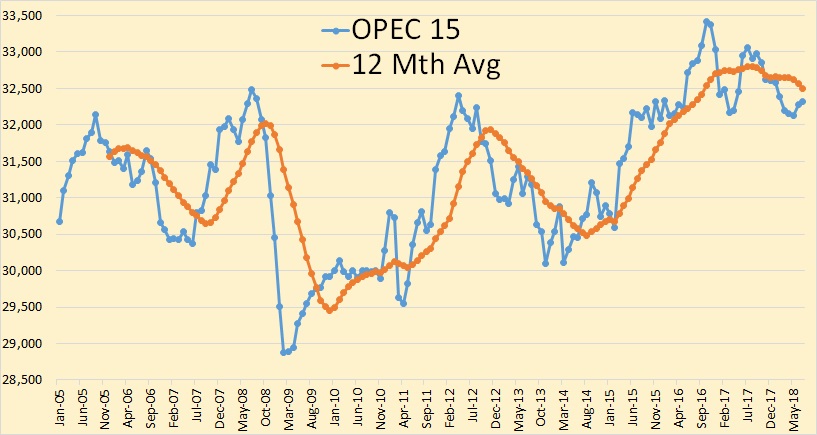
OPEC July Crude Production Data

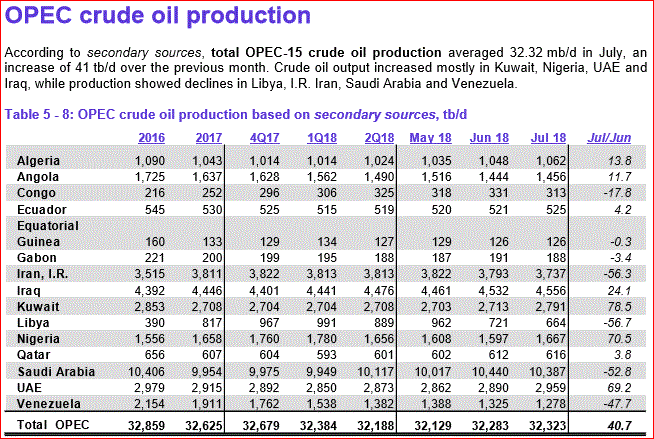
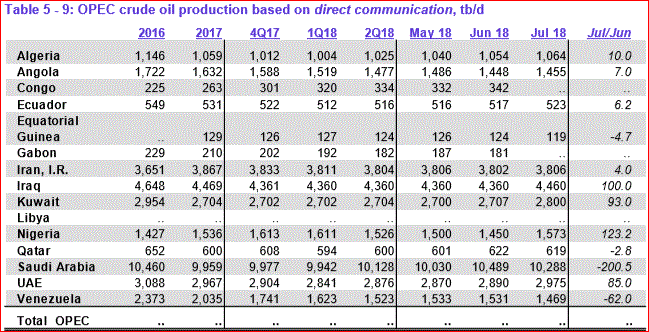
All OPEC data is from the latest OPEC Monthly Oil Market Report and is in thousand barrels per day. All data is through July 2018.

OPEC crude oil production was up 41,000 barrels per day in July but that was after June production was revised down by 43,000 bpd. So OPEC production is actually down 2,000 bpd from what was reported last month.

The big difference here is in what secondary sources says Saudi Arabia produced in July, down 52,800 bpd, and what Saudi says they produced, down 200,5000 bpd. What Venezuela says they produced has no basis in reality.

Read More