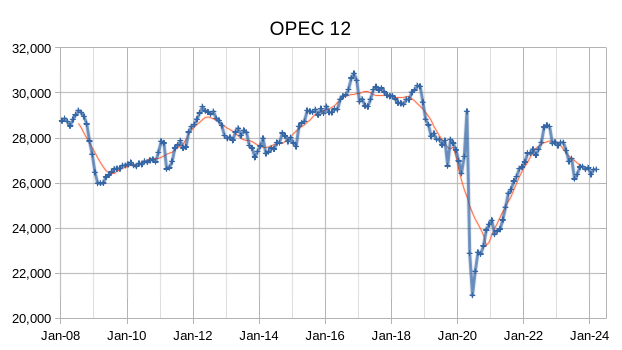
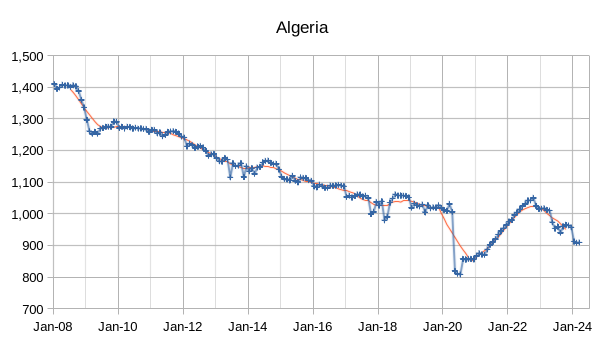
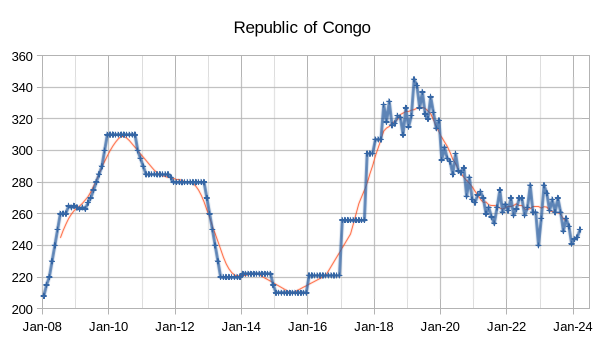
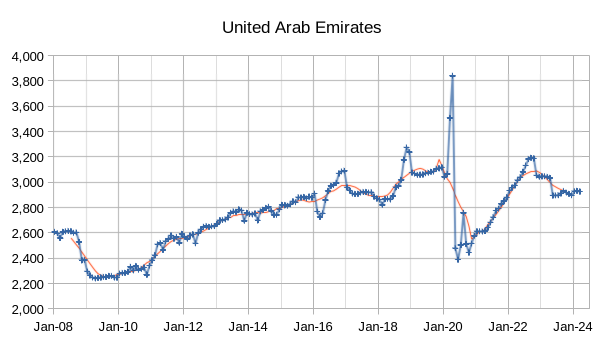
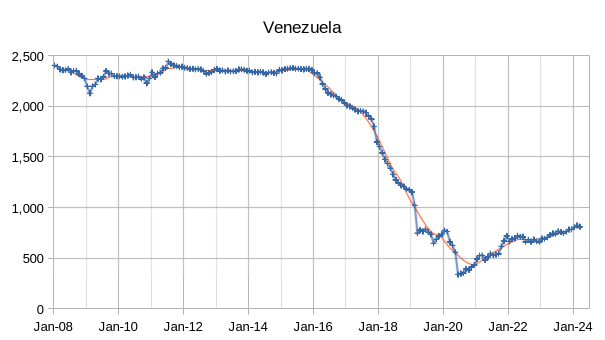
The OPEC Monthly Oil Market Report (MOMR) for April 2024 was published recently. The last month reported in most of the OPEC charts that follow is March 2024 and output reported for OPEC nations is crude oil output in thousands of barrels per day (kb/d). In the OPEC charts that follow the blue line with markers is monthly output and the thin red line is the centered twelve month average (CTMA) output.
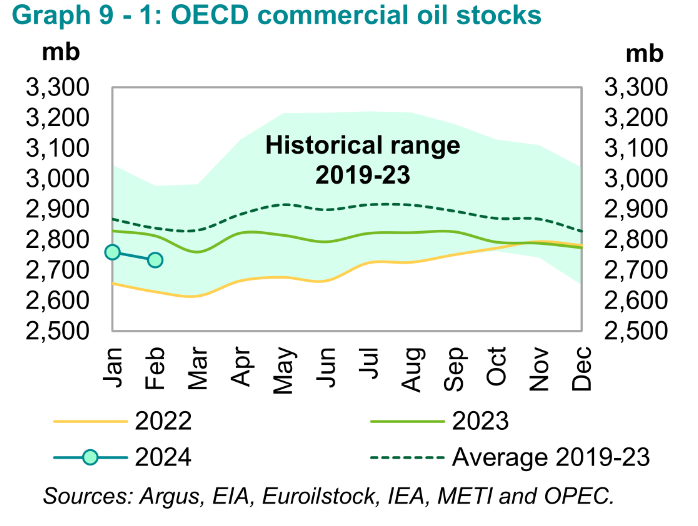
Preliminary February 2024 data shows total OECD commercial oil stocks down by 25.7 Mb, m-o-m. At 2,733 Mb, they were 80 Mb lower than the same time one year ago, 105 Mb lower than the latest
five-year average and 187Mb below the 2015–2019 average.
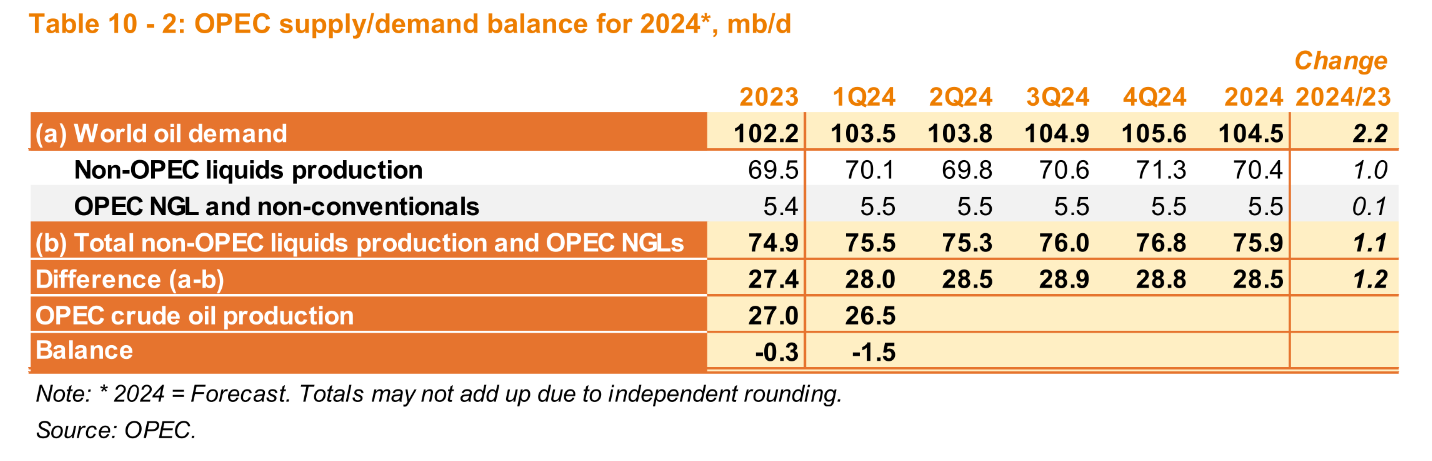
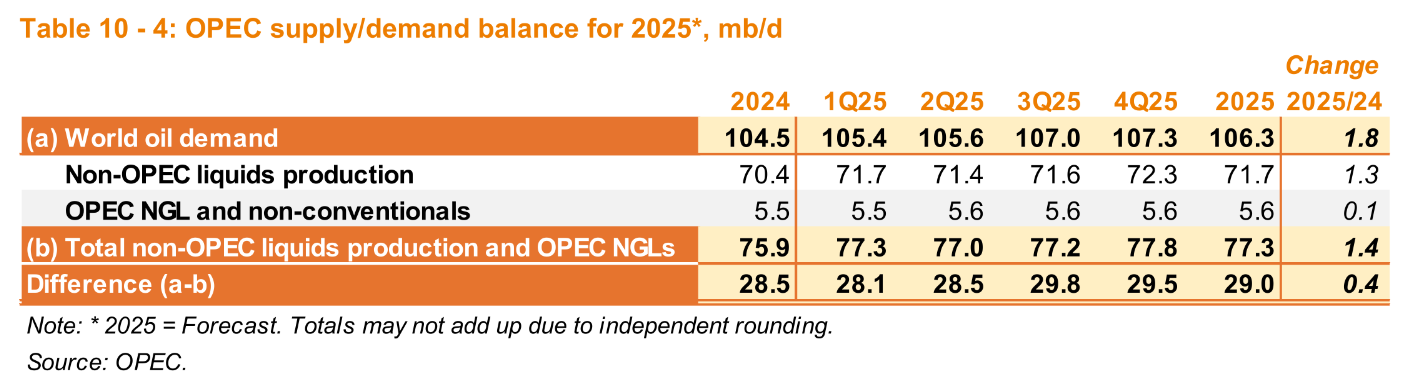
OPEC expects robust growth in World Demand for Liquid fuel in 2024 (2.25 Mb/d) and 2025 (1.85 Mb/d). The OPEC estimates for World Demand in 2023 (102.2 Mb/d), 2024 (104.5 Mb/d) and 2025 (106.3 Mb/d) are significantly different from the EIA STEO estimates in 2023 (101.96 Mb/d), 2024 (102.91 Mb/d) and 2025 (104.26 Mb/d). Also the IEA estimates based on the January 2024 Oil Market Report Estimate of 2023 World liquids demand of 101.72 Mb/d and the April 2024 Oil Market estimate of 1.2 Mb/d demand growth in 2024 and 1.1 Mb/d demand growth in 2025 suggest demand in 2024 (102.92 Mb/d) and 2025 (104.02 Mb/d) that are more in line with US EIA estimates.
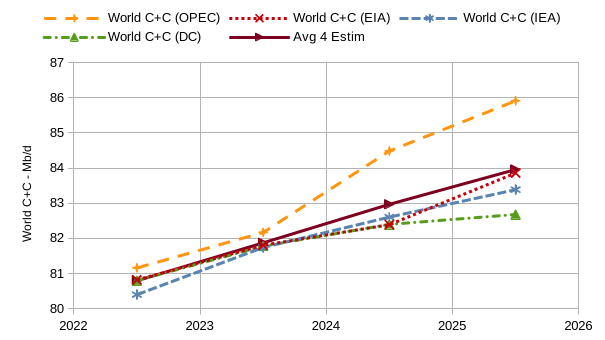
The chart below compares World C+C estimates using the EIA’s STEO, OPEC MOMR, IEA Oil Market Report, and my estimate (DC) using the Oil Shock Model, and average of the four estimates.
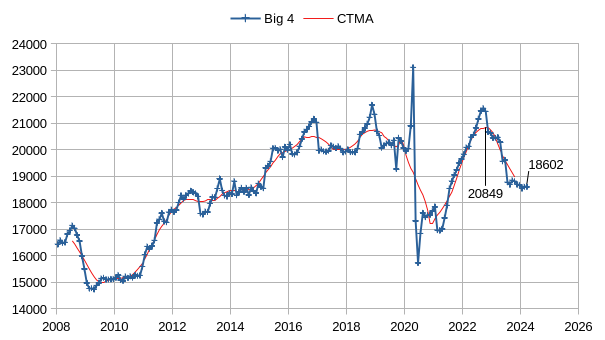
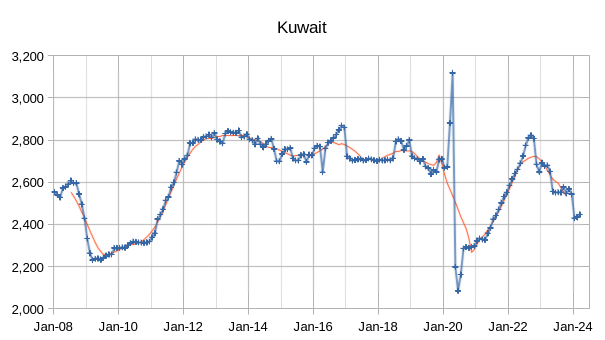
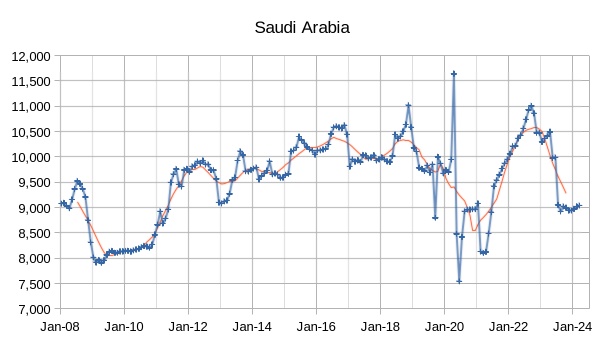
The chart above considers the Big 4 OPEC producers (Saudi Arabia, UAE, Iraq, and Kuwait) in order to estimate OPEC spare capacity. I assume the other 8 OPEC producers are already producing near capacity and the recent peak in the centered 12 month average at 20849 kb/d would be the estimate of total capacity for the big 4. In March the Big 4 produced 18602 kb/d, so spare capacity is about 2247 kb/d, if we add this to March output (26604 kb/d) we find maximum OPEC capacity of 28851 kb/d. If the 2025 estimate for the call on OPEC in the April 2024 MOMR is correct (29000 kb/d) then OPEC capacity will need to expand by 149 kb/d to meet the demand. My expectation is that World liquids demand will not be as high as OPEC estimates, the EIA and IEA estimates seem more reasonable.
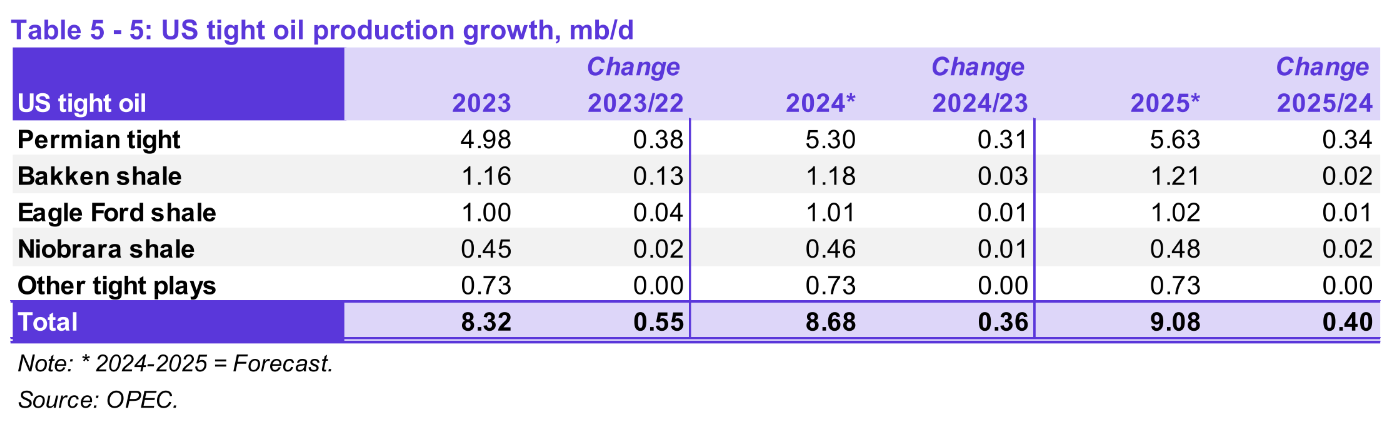
My estimates for future tight oil growth are about 100 kb/d lower in 2024 and 2025 than OPEC estimates.
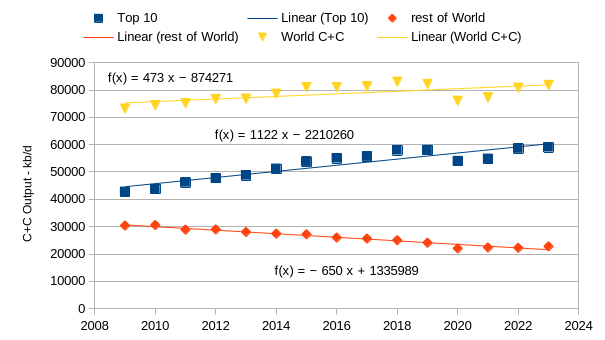
This last chart considers the top ten C+C producers in the World in 2023 and compares with all C+C producers and World less top 10 which I call “rest of World” on the chart. For the past 15 years (2009 to 2023) World C+C output has grown at an annual average rate of 473 kb/d (0.6%/year), the top 10 producers increased output at an average annual rate of 1122 kb/d (2.1%/year) and the rest of World saw an average annual decrease of 650 kb/d (-2.5%/year). My expectation is a plateau in World C+C output from 2016 to 2032 between 80 and 83 Mb/d with a peak in the 2026 to 2029 time frame.
71 responses to “OPEC Update, April 26, 2024”
Iraq at only 4.2 million barrels/day — what happened to the plans to increase the production to 12 million barrels/day?
personnally i doubt that iraq will never attain such a level of production. The plateau target of their main fields have been consistently revised downward. According to the link below, water injection is one of the main reason (along with transport system) for explaining why iraq haven’t reach a higher level of production.
https://www.qamarenergy.com/sites/default/files/Iraq%20Water%20Injection.pdf
TotalEnergies are the latest to be given the task of sorting out water injection, but overcoming the security, corruption and supply chain issues while still making money proved to be too much for ExxonMobil. If I looked at the recent shape of the production curves for Iraq (Kuwait and, maybe, KSA too) without knowing the actual numbers, or that they were subject to putative quotas, I’d say they looked like fields that use a lot of horizontal wells and that, after recovering from a lengthy shut-in, had now reached the limit of water injection and/or produced water handling capacities.
thank you for your reply sir, it’s maybe a silly question but how do look a field produced with hz wells ? By the way i’m currently trying to make a forecast of iraqi oil production but it’s such a headache to find reliable data.
Horizontal wells that I’ve had direct experience in operating tended to fall suddenly and faster than exponential but had a long thick tail, they also didn’t always like long shut-ins (i.e. they perform worse afterwards, if only for a few months).
Frenchfries,
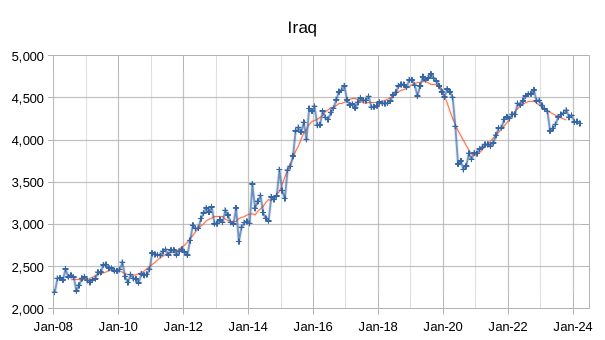
I agree Iraq is not likely to ever see 12 Mb/d output, I think they will struggle(20% probability) to reach their previous centered 12 month peak (4690 kb/d) which was reached in June of 2019, more recently in October 2022 the CTMA was 4463 kb/d in October 2022, I think the odds are better that they may be able to return to the 2022 peak (50% probability).
The stated goal was 6 mbd by 2020/2021. Actual output is in line with the real reserves status for Iraq, anyone´s guess what that can be. The wildcard for Iraq is, given the fact they completely shut down production three times. All producing fields at the time, could have some permanent reservoir damage, thus, less URR.
Not a good card at all, but who knows? If it is indeed the case, the actual info must be “Cosmic Secret” or something like that.
https://rumaila.iq/english/our-operation/water-injection/ Seven CPS (Clustered Pump Station) operating in Rumaila.
https://rumaila.iq/english/serving-iraq/oil-for-iraq/ Oil production. (1.35 mbd as of 2021)
“Under ROO’s operatorship the field has seen:
production increase 154% in the north of the field (from 382,000 to 969,000 bpd)
high production from mature reservoirs in the south of the field
production increase from the harder-to-access Mishrif reservoir increase from 150,000 bpd to 600,000 bpd
consistent production above 1.2 million bpd for 10 years – a first for the field.”
Dennis
Nice job. I think spare capacity is closer to 2,500 ± 100 kb/d using my eyeball estimate looking at the posted charts.
Max. Current Diff
Iraq 4,500 4,200 300
Kuwait 2,800 2,400 400
SA 9,000 10,600 1,600
UAE 3,100 2,900 200
Total 2,500
Keep in mind there are 300 kb/d of Kurdistan oil in Iraq not being pumped. Also OPEC production could be declining at conservatively close to 300 to 400 kb/d/yr. So the spare capacity diminishes every year without new capacity additions, such as SA cancelled.
Hi Ovi,
I define sustainable capacity as the output level that can be sustained for 12 months, one month spikes mean little as they can temporarily exceed capacity of GOSP and other infrastructure for a single month, but those levels are not sustainable. If I pick individual CTMA recent peaks for each of the Big 4 (in 2022Q4) the spare capacity estimate increases to 2259 kb/d (an increase of 12 kb/d), though I think the method that looks at all of the big 4 as a group is more representative. As far as Kurdistan output, this problem is a political problem (much like problems in Venezuela) that might not be solved even in the medium term, so I do not think it should be included as current capacity.
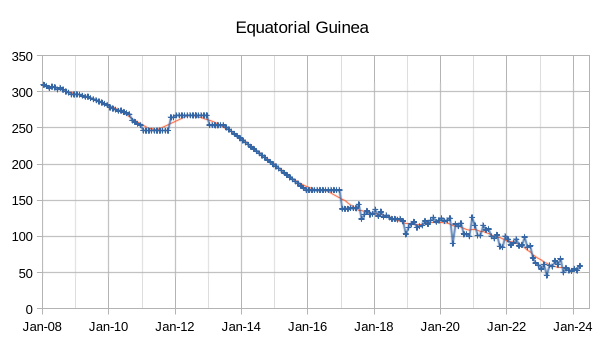
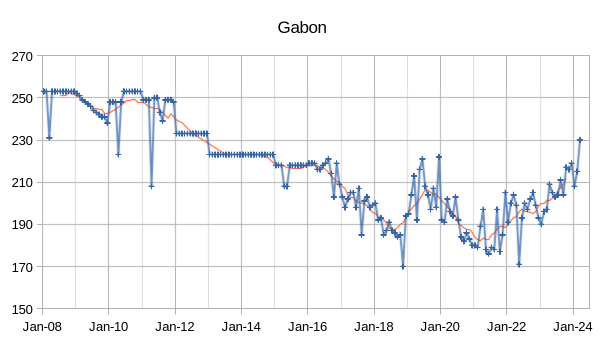
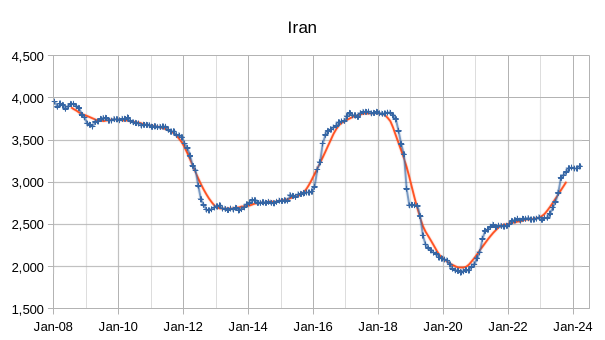
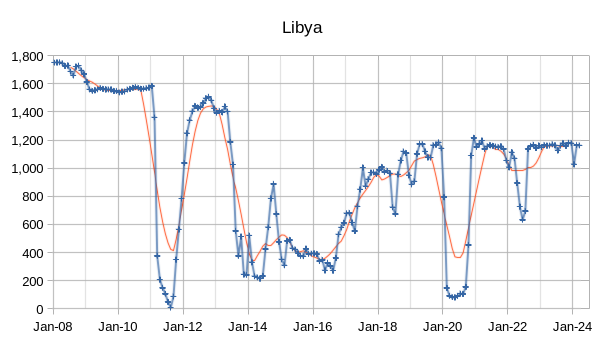
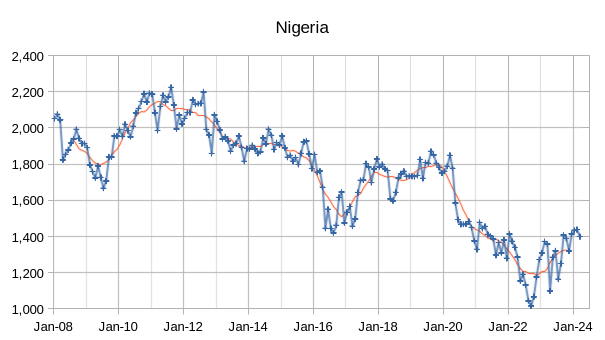
As far as declining capacity for the other 8 producers, as a group output has been increasing for the Other 8 as shown in chart below for the July 2021 to March 2024 period. An average annual increase using OLS for that period of 412 kb/d. Longer term (Jan 2008 to March 2024) the Other 8 has declined at about 350 kb/d as you suggest, recently we have seen increases from Iran, Venezuela, Nigeria, and Libya, not clear if we will see further increases, it will depend on bothe geology and political developments.
Longer term chart for Other 8 (Jan 2008 to March 2024).
Dennis
If you check those four charts you will see that the levels I choose were a minimum of 6 months, not single point peaks.
Ovi,
I think 12 months is a better metric for sustainable output, the numbers are not really that different in any case, but I would expect the shorter the window we use, the higher number we would get for spare capacity 1 month>3 months>6 months>12 months. I would have no way of knowing what window you used until it is stated.
Maybe your estimate is better, we may find out in a few years. Of course if the “other 8” decreases by about 350 kb/d each year, then in 2025 OPEC output capacity would fall to 26604 2500-700=28404 kb/d. If the EIA and IEA estimates for World demand prove correct, then OPEC will have enough capacity in 2025 to meet demand, if the OPEC estimate for World demand is correct for 2024 and 2025, then OPEC will be unable to meet demand.
Dennis
Attached are the four charts with arrows to show how/where I made my sustainable production level picks. A combination of length and number of times.
Ovi,
Yours is a very reasonable approach.
The main place we differ is Kuwait and Iraq, I would put their capacity at the 12 month average in 2022, which is about 100 kb/d lower in each case than your estimate, to me the recent peak in 2022 is likely to reflect better what is possible over the 2024 to 2025 period, it is possible that capacity will be expanded in the future in the Big 4, but there is also the other 8 which as you mention (and I agree) may see continued decline (returning to the pre pandemic trend of about 350 kb/d annual decline).
Dennis
I just looked at 2022 as production returning to past levels. It’s an indication that their drilling programs have offset some decline.
Ovi,
That might be correct.
I was assuming there might be some deterioration of capacity over time, in 2022 KSA and UAE were higher (on 12 month basis) or equal to past peaks and Kuwait and Iraq were a bit lower, this might be random, but I was assuming limits may be being reached and capacity might be declining, this is speculation on my part (the Iraq decrease may be the Kurdistan problem you mentioned earlier). My guess is that Kuwait may be seeing som decrease in capacity.
Hz Oil Rig Count for the week ending April 26
US Hz oil rigs decreased by 2 to 457.
– Permian rigs dropped by 1 to 302.
– Texas Permian rigs were unchanged at 203 while NM dropped by 1 to 99. In New Mexico, Lea County rigs dropped by 1 to 47 while Eddy was unchanged at 52.
– Eagle Ford was unchanged at 47.
– NG Hz rigs dropped 1 to 94. (Not shown).
Frac spread report for the week ending April 26
The frac spread decreased by 3 to 257 and is down 37 from one year ago when the frac count was 90. The weekly Frac spread count continues to bounce between 250 and 275.
https://www.msn.com/en-us/news/world/ukraine-hits-multiple-russian-refineries-overnight-despite-us-warnings/ar-AA1nzjg3
Put me in the group that didn’t see the Ukraine being able to strike so consistently inside Russia’s territory.
They are hitting 1200 KM deep in Russia near Siberian pipelines.
World War III Peak Oil – No storming the beach of Normandy and Blitzkrieg
…. Rather Swarms of relatively cheap drones striking sitting duck oil infrastructure.
I think oil prices are caught between two opposing forces. If Ukraine is able to take enough Russian oil and gas infrastructure offline. We will see a spike in price.
On the other hand don’t take your eyes off of what is going on over in Japan with their currency. It was briefly at 160.00 to the dollar earlier this evening.
If you scan through media you’ll hear stuff like interest rate differentials. That’s nonsense. This is a problem in the Eurodollar market. A dollar shortage.
I suspect a collateral shortage. A meltdown in the currency of the 3rd largest economy in the world would have some serious knock on effects.
None of which are inflationary to the global economy. Nor good for oil prices.
If they start selling US treasuries in order to get dollars that the market just isn’t providing. We will see a spike in yields globally and an accelerating devaluation of the yen.
HHH
How does it affect carry trade?
Most people believe that the carry trade is exchanging yen for dollars and then buying assets abroad. That’s not really what the carry trade is about.
Carry trade is about large Japanese banks using short term Japanese government bills as collateral to make dollar denominated loans that is the grease that makes economic activity happen. Particularly in China. Japanese banks loan dollars heavily into China.
But when geopolitical issues arise or supply shocks happed or Chinese real estate has issues. These banks become risk adverse and choose not to make loans.
In short it’s already been unwinding. Which is why both the yen and yuan are way down against the dollar. It becomes more expensive and takes more collateral to make dollar denominated loans.
It’s actually not even about the yen. Or Japanese central bank monetary policy. It’s about lack of dollar liquidity. A dollar shortage.
https://www.politico.eu/article/vladimir-putin-russia-diesel-prices-skyrocket-ukraine-war-drone-strikes-oil-refineries/
Putin’s fuel problem, how ukraine is sapping russia’s oil and diesel.
The strikes are “having an effect because they’re destroying oil infrastructure and other critical national infrastructure,” Ingram, the former British military intelligence officer, said.
The strategy, he predicted, would “be studied in officer training academies in decades to come.”
New Permian report at Novilabs
https://novilabs.com/blog/permian-update-through-jan-2024/
GOR for Permian from Novilabs post linked above.
I found the GOR discussion interesting. Unfortunate they don’t do it by formation, because there is one big mover and shaker in there and 2 other more ho-hums.
Reservegrowthrulz,
In chart below I consider only wells with first flow from 2018 to 2023 and look at the major formations (Wolfcamp, Bonespring and Spraberry) separately, there may be a difference between Wolfcamp wells in the Midland sub-basin and the Delaware sub-basin, but I lumped all Wolfcamp wells together here.
Without the surge of oil production in brazil, iraq and unconventional in north america, the global oil production would have been in decline long time ago.
The left axis is in Kb/d and the data reported included only crude oil without condensate and other liquids.
Thanks – What dataset did you use to produce that chart (if you indeed made it)?
thanks for your reply, i made it from data from OPEC, USEIA and various sources
Chart from Novi Permian post, projection assumes rig count remains at April 2024 level and well productivity is unchanged. Output rises to about 6500 kb/d in December 2029 in this scenario.
Click on chart for larger view or go to original Novi post.
A recent scenario I created for the Permian (with completion rate decreasing after December 2028) URR=42 Gb has Permian output at 5615 kb/d in Dec 2029 with peak of 5912 kb/d in August 2026. The scenario has an annual increase of about 100 kb/d for Permian output in 2024 and 2025. A major difference between my scenario and the scenario by Mr Peters is that I assume new well productivity starts to decrease starting in Jan 2023. With an assumption of no new well productivity decline and constant completion rate through Dec 2029, my scenario would have Permian output at about 6733 kb/d in Dec 2029. If we assume well completion rate decreases at 3 per month starting in Jan 2030 until reaching zero, the scenario has a URR of about 51 Gb. Total wells completed about 122 thousand for this scenario. Note that an assumption of no decrease in future new well productivity is completely unrealistic imho.
Dennis,
yes, NOVI only give one scenario which obviously not the fact.
Note the new well productivity are affected by many:
1. limited existing 2P undeveloped resources at the same “high-grading” quality as in 2020-2021
2. pressure depletion to some of the in-fill resources
the decline in IP and faster decline after 2022 is probably a combination of the two above
3. new benches, e.g. Barnett could help the positive way, but more speculative than the above two for now.
Sheng wu,
Yes the Permian scenario presented is very simple and assumes new well EUR remains at roughly current level (same as average 2022 well) and that the completion rate remains at about the average 2023 level from Jan 2024 to Dec 2029. Both assumptions are likely to be incorrect as will the assumptions made for any future scenario.
There are no future facts, just speculation.
Permian cumulative output for average 2020, 2022 and 2023 wells, the 2021 wells were slightly better (2021 wells not shown on this chart).
My recent Permian scenario with decreasing well productivity after December 2022. Vertical axis units are kb/d.
https://www.youtube.com/watch?v=7Gdvo8QPuMk
8 minutes
Peter Zeihan (geopolitical strategist) :
Can other countries replicate USA Shale?
This is Brazil production by basin. Campos has added some new FPSOs and redeveloped two old fields and has added production rather than just arresting the decline. However most new oil has come from the Mero and Bezios fields in the Santos basin. There is only one new FPSO this year so production may be flat or down slightly before picking up again with some additions in 2025 to 2026. After 2028 there is not much planned so without new discoveries that can be fast tracked decline could set in.
Significant reserves were added in the last few years, ANP only provides numbers for reserves not details of discoveries and revisions, however the price rise after 2020 Covid probably had a big effect, especially on possible and contingent categories.
Gas reserves.
C&C reserves by basin
Latest ANP data (to March) by platform, without continual addition and ramp up of new FPSOs the decline is quite steep.
Very impressive graphs I must say.
The headline news from Brazil indicate that they expect growth in exports going forward (at least for 2024), and a fair bit of it is coming from crude oil. Just a link to an arbitrary news article below.
https://valorinternational.globo.com/economy/news/2024/04/18/tension-in-the-middle-east-to-boost-sales-from-brazil-to-the-us.ghtml
I guess they will find a way to be on plateau phase for some years after peak, given they seemingly are not done with the growth phase of oil production (and increasingly gas as a byproduct) yet.
The rig count from Baker Hughes indicating 13 operating offshore rigs is a little bit up, but not that much comparing to the glory days 1-2 decades ago.
Rigs now are drilling wells that will produce over 20kbpd, twenty years ago most were for much lower producing onshore and shallow offshore wells.
I doubt they will add oil output this year, more likely a small drop, there is only Mero-2 completing ramp up and Mero-3 to come, unless the Equinor FPSO is accelerated, but next year there could be over 800 kbpd new capacity.
Very interesting sir, if i can ask, do you have data for the production of each field ? Apparently they have made a new discovery in the northern equatorial margin
Yes ANP provides the best well by well numbers of any agency but it’s sometimes a bit taxing for my computer to extract the data. Their site is pretty good now if you want to find individual items.
https://www.gov.br/anp/pt-br/assuntos/exploracao-e-producao-de-oleo-e-gas/dados-tecnicos/acervo-de-dados
Output of C+C for Brazil and Canada for past decade, each has seen about a 100 kb/d annual increase in output over the Jan 2014 to Dec 2023 period based on EIA estimates.
Dennis
Attached is a shorter time frame for Brazil. Not clear how much of the November to March drop is maintenance related.
This is a great read on oil discoveries last year
https://oilprice.com/Latest-Energy-News/World-News/Global-Oil-and-Gas-Discoveries-Fell-to-a-Record-Low-in-2023.html
Some highlights
– 3 billion barrels of oil discovered, less than half the year before, only about one tenth of annual consumption
– cost for discovered barrel of oil more than doubled from 2022, to $8.80 from $3.50
– most oil is in deep or ultra deep
Just the dregs left folks.
Stephen H.
It looks grim. If using mathematics we would have been approaching peak oil based on lacking oil discoveries about a decade ago. The lacking ingredient is expansion on previous discoveries and that is skewing the whole picture. The Dennis Coyne models are based on mathematical models for oil production as far as I am concerned and they are constantly being revised to the upside, meaning the more sinister scenarios remain unrealistic.
From peakers all the time the factor money and technology is under estimated.
Technology gets cheaper and better, and then there is the oil price that makes a ressource into a reserve.
At 30$ oil we would be in a big trouble now since a lot of countries would stop developing completely and only pumping the rest, what can be done cheap.
So peak oil is a non – event – the question is peak cheap oil, or peak not too expensive oil. And in the big picture, the shift between different energy sources.
With low discovery rates and high costs for deep water wells, and with the time cost of money and IRR requirements applied, companies may be a billion dollars in the hole before even reaching FID on new projects; it may only now be worth looking for reserves that are expected to be at least 400 mmboe in frontier basins. That they are still looking and even increasing exploration budgets says something about the merits, real or just perceived, of oil versus the alternatives.
”Great read on oil discoveries” : 10% of annual consumption. We are going to doomsday. In one year, only 10% of annual consumption discovered. Not even half, not even one thirf, 10%.
I believe legacy wells decrease 6% per year if not replaced.
It’ll be more than one year before doom.
But if the Permian starts dropping too, it seems like a nail biter if the lack of discoveries continues like this.
US February Oil Production rebounds by 578 kb/d
US February oil production recovered from the January production drop associated with the severe January weather in the Central US. The biggest recoveries occurred in Texas and North Dakota.
EIA – U.S. Crude Oil and Natural Gas Proved Reserves, Year-end 2022
https://www.eia.gov/naturalgas/crudeoilreserves/
EIA reports proven (1P) reserves based on replies to a questionnaire sent to E&P companies. Most, but not all, companies reply but presumably not the same companies reply every year, if for no other reason than acquisitions and mergers. EIA then makes some estimate for the non-reporting companies. However there is always some non zero sales and acquisition number, which I don’t think should happen if the estimates were accurate. Therefore there are some error bars around any kind of trends over time. The reports normally come out in December for the previous year but 2022 data has just been released.
The report used to separate out crude and condensate from wet gas, which is more information than is given in annual reports where only total liquids are given, but that appears to have ended this year. The report for 2022 reserves is four months late compared to usual.
“Bakken” is anything in North Dakota and Montana, i.e. not just LTO, but that is by far the majority. Remaining reserves are likely to keep on falling from here, followed by production decline; the discoveries (really drilling FIDs) have been slowly declining and revisions are around zero depending on price (indicating there are no probable or possible reserves).
Conventional fields typically show continual positive revisions, which gradually reduce in size over the life cycle, as probable reserves are upgraded to proven (see GoM below). For most years since 2017 the shale basins have shown negative revisions and adjustments for both oil and gas. There is some price effect but mostly I think this is companies downgrading initial recovery estimates as the results of the first wells reaching end of life are being seen. Some of this may be due to net trades not zeroing out but even allowing for the worst case there the revisions would still be negative implying the proven reserves shown may still be overstated for the total remaining recoverable (i.e. there is nothing in probable, possible or continent categories).
WTI price in 2022 averaged $95, up from $68 in 2021 and gas prices spiked explaining some positive revisions (last year oil was $78 so some revisions will have subsequently been reversed ).
GoM had a good 2022 with discoveries (announced FIDs) and revisions (price related and upgrades) adding reserves.R/P got above 6 years for the fist time in over a decade. However discoveries and announced projects have been relatively low through 2023 but the Sparta project should add some “discoveries”..
Until the 2019 numbers BOEM issued its own field by field estimates for, what it said were, 2P reserves in the GoM. The numbers actually turned out low even compared to the operator estimates for 1P and this process now appears to have stopped, which is probably as well; petroleum engineers who got 2P numbers so far off final URR wouldn’t go far in actual E&Ps; it’s excusable given the lack of access to data and computing limits that BOEM face but made the estimates pretty worthless. Part of the problem is that each lease block is reported against a single main field even if there are multiple reserve pools so that new field discoveries actually look like upward revisions to the main field.
“Niobrara” is really anything from Colorado. Like Bakken it has passed peak remaining reserves with discoveries dwindling and revisions mostly negative. R/P is below 10 now and has been steadily falling. The net acquisitions (yellow) being positive is a legacy of the sampling system.
“Permian” is the three RRC districts 7, 8A and 8C, and East New Mexico and has a lot of conventional crude and condensate production, but is mainly LTO. This aarea was still showing growth in remaining reserves and addition of discoveries are still high, although net revisions have turned negative. R/P has been falling but is above ten.
I’ve messed up the EF data so that might take a couple of days to look at but I expect it to follow Bakken and Niobrara as having peaked in remaining reserves.
“Eagleford” is the RRC districts 1 to 6 onshore, and mostly LTO. Discoveries are dwindling and revisions are mostly just a reflection of price changes. R/P is just under 10 but is falling.
The cumulative revisions for tight oil and gas have been significantly negative, indicating the initial estimates were too optimistic, but are now flattening out and respond mostly to price only, indicating that the proven reserves are all there is (i.e. no probable etc.).
Discoveries (really new drilling FIDs) for Bakken, EF and Niobrara are tending towards zero, with only the Permian having available acreage, but even there the turndown may now be showing.
With no discoveries or significant revisions all but the Permian have reached a limit for ultimate recoverable reserves.
Article alleging that former Pioneer CEO Sheffield may have colluded with OPEC plus.
https://finance.yahoo.com/news/american-oil-tycoon-accused-trying-154659690.html?guccounter=1&guce_referrer=aHR0cHM6Ly93d3cuZ29vZ2xlLmNvbS8&guce_referrer_sig=AQAAAH-V1nry7-vaNWaCmtZr_pOdIP22DGia1iJ4_P4HM4jUsrYNrW57yDcd16hFTxQRjngAaHmb7eQe1JfukZrw-SD3yBOd8um5GIuQN9YHUzqB9_iUMSB-uksqc40cySi8ZF1fh538amNI_xqBybeBJmZVG2XjmOR58KhfZBFMFhfd
I have the sense that most Americans just assume that major collusion happens routinely over the decades among the biggest players in the oil industry, domestic and otherwise. I don’t know to what that degree that notion is correct, but this news will likely be seen as business as usual for this industry by most people.
US Shale gas from link below, output pretty flat for past 18 months.
https://www.eia.gov/naturalgas/weekly/img/shale_gas_202403.xlsx
Tight oil data for March has not yet been posted by the EIA.
Interesting that we have Appalachian shale gas output falling since 2022, with increased output from the Permian basin making up much of this decrease leaving overall US shale gas output flat.
Dennis,
Where did you get the data for the Appalachian Shale Gas?? It doesn’t correspond with the EIA’s data or Shaleprofile (Novi).
steve
Steve,
Go to the official shale gas EIA estimate at
https://www.eia.gov/naturalgas/weekly/img/shale_gas_202403.xlsx
Then sum the Marcellus and Utica columns from the spreadsheet (columns B and D) then plot on a chart using dates from Jan 2018 to March 2024, the data is from the EIA. It might be different from the drilling productivity report which is model based and also includes conventional output along with shale gas output.
An update to US oil production has been posted.
https://peakoilbarrel.com/us-february-oil-production-rebounds/
A new open Thread Non-Petroleum has been posted.
https://peakoilbarrel.com/open-thread-non-petroleum-may-3-2023/