By Ovi
All of the Crude plus Condensate (C + C) production data for the US state charts comes from the EIAʼs Petroleum Supply monthly PSM which provides updated information up to Febuary 2023.
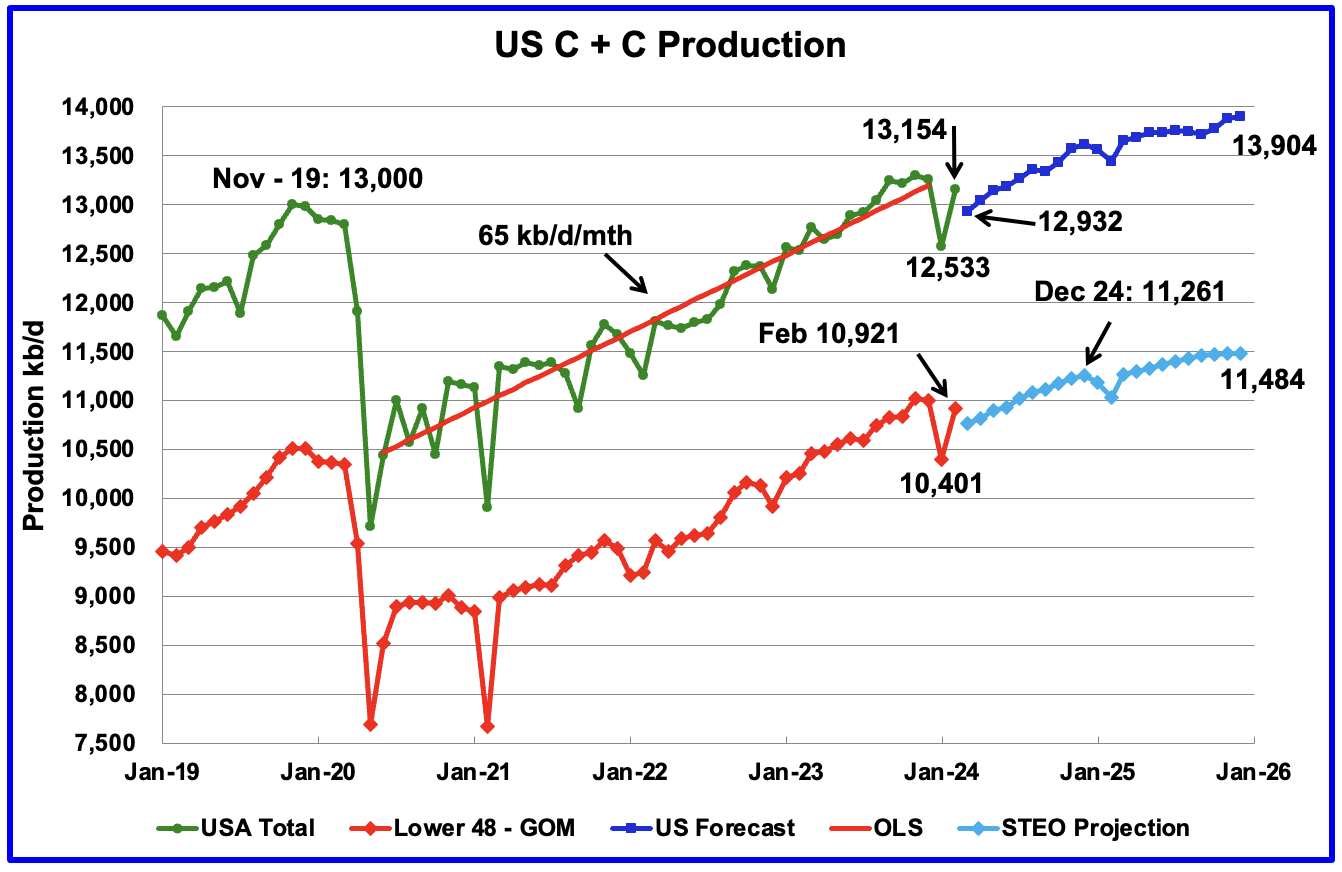
U.S. February oil production rebounded by 578 kb/d to 13,154 kb/d. The large increase was due to a rebound from the severe January winter storm that spread across most central states. The largest increases came from Texas, 172 kb/d and North Dakota 173 kb/d.
The dark blue graph, taken from the April 2023 STEO, is the forecast for U.S. oil production from March 2024 to December 2025. Output for December 2025 is expected to reach 13,904 kb/d and is an increase of 82 kb/d from the previous STEO report.
The red OLS line from June 2020 to December 2023 indicates a monthly production growth rate of 65 kb/d/mth or 780 kb/d/yr. From February 2024 to December 2025 production is expected to grow by 750 kb/d. This increase is very high growth and is not consistent with many articles predicting a near term peak in US oil production.
The light blue graph is the STEO’s projection for output to December 2025 for the Onshore L48. From February 2023 to December 2025, production is expected to increase by 563 kb/d to 11,484 kb/d which is 103 kb/d higher than reported in the previous STEO.
Is the slow rollover in production shown in the last four months of 2025 in the Onshore L48 pointing to peak US production occurring in late 2025?
January 2024 World Oil Production
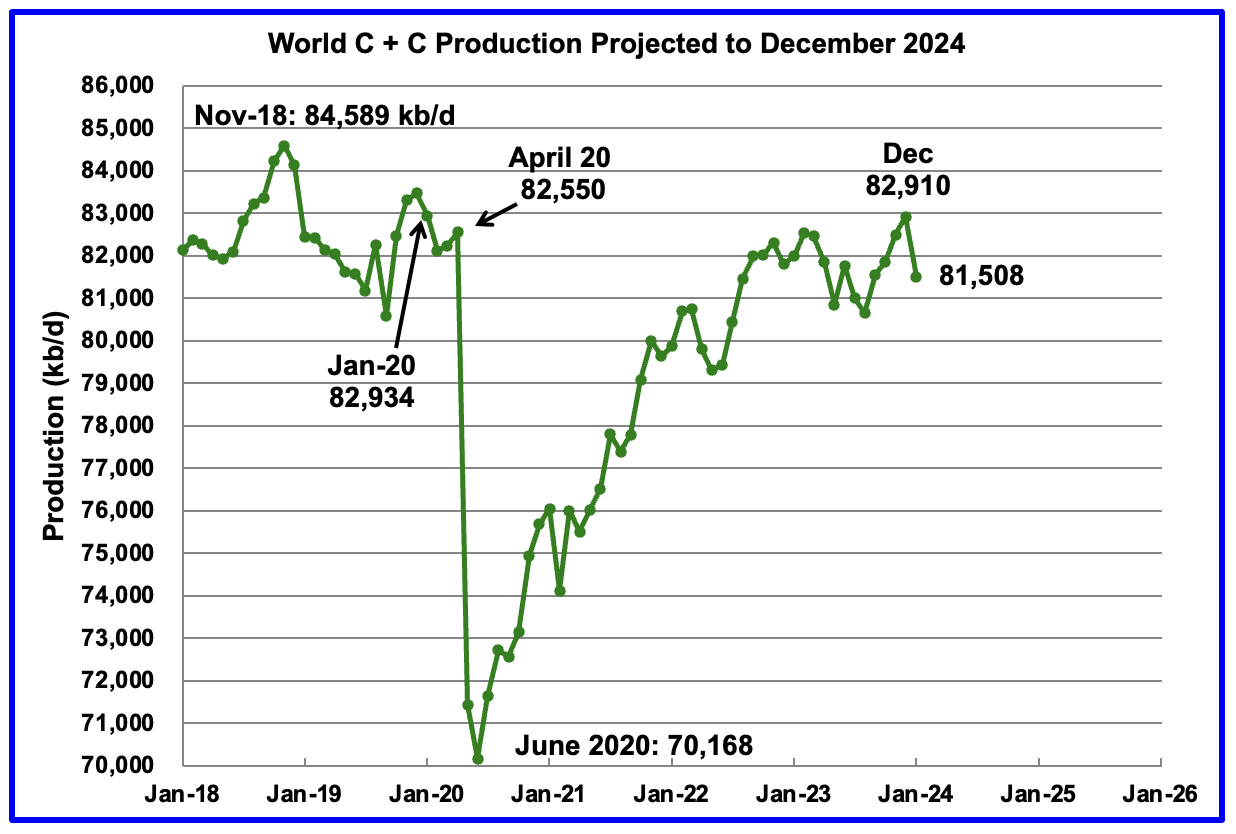
World oil production for January 2024 was released today. Production dropped by 1,402 kb/d, of which 762 kb/d came from the U.S. More on World oil production next week.
US Oil Production Ranked by State

Listed above are the 11 US states with the largest oil production along with the Gulf of Mexico. Ohio has been added to this table since its production approached 100 kb/d in January and exceeded Louisiana’s production. These 11 states accounted for 83.9% of all U.S. oil production out of a total production of 13,154 kb/d in February 2024.
On a YoY basis, US production increased by 622 kb/d. GOM production rose by 53 kb/d MoM while YOY it is down by 28 kb/d.
State Oil Production Charts
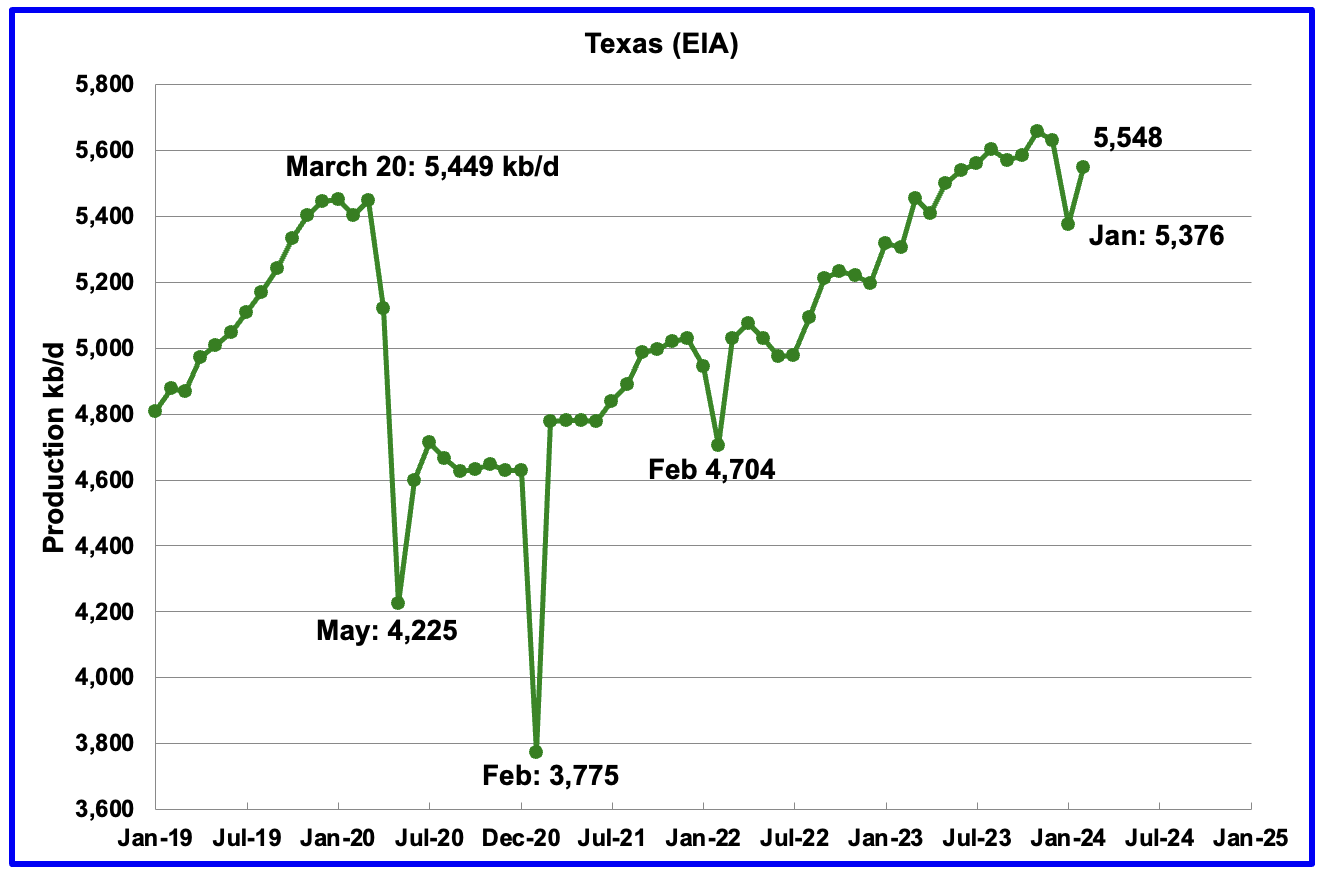
Texas production increased by 172 kb/d in February to 5,548 kb/d.
It is interesting to note that February’s daily production increase of 172 kb/d was smaller than January’s drop of 255 kb/d. Could this be related to the lack of drilling or completions during those 10 freezing days in January while the rapid decline in LTO producing wells continued and is difficult to make up?
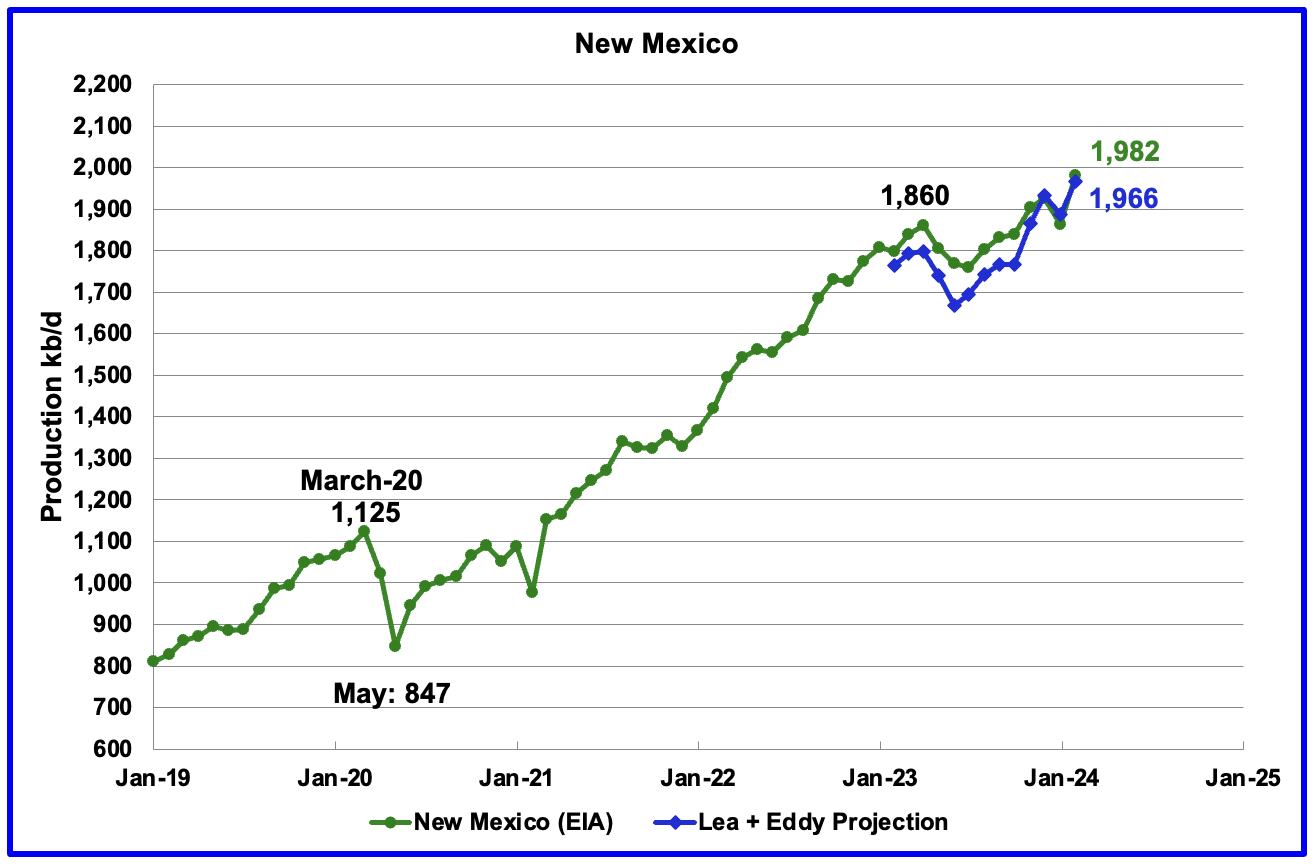
New Mexico’s February production rose by 120 kb/d to a record high 1,982 kb/d.
The blue graph is a production projection for Lea plus Eddy counties since these two counties account for the majority of New Mexico’s oil production. The projection used the difference between February and January preliminary production data provided by the New Mexico Oil Conservation Division. The projection provides a reasonable estimate for New Mexico’s production.
The combined projected output from Lea and Eddy counties in February increased by 79 kb/d to 1,966 kb/d vs the 120 kb/d reported by the EIA.
More oil production information from these two counties is reviewed in the special Permian section further down.
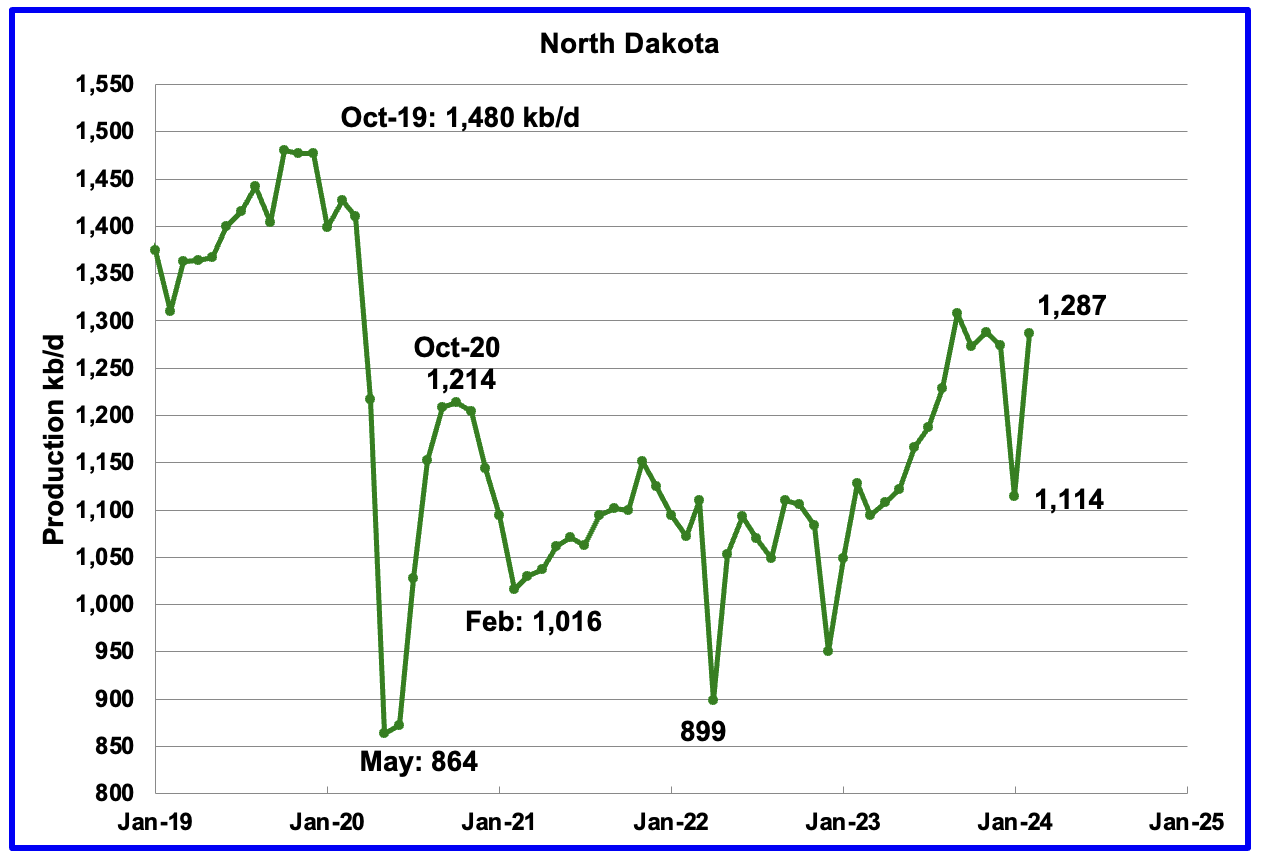
February’s output rose by 173 kb/d to 1,287 kb/d. YoY production increased by 159 kb/d.
According to this article, North Dakota’s February production was 1,250 kb/d. Seems the EIA found an extra 37 kb/d.
“According to the Department’s Director, Lynn Helms, the state produced 1.25 million barrels of oil a day in February — a 13% percent increase from January.
“Along with that, gas production jumped to 3.36 billion cubic feet a day… a 12 percent increase in natural gas production,” said Helms.
As for as rig count numbers, Helms reported that they were at 38 in February, but, jumped to 40 in March.”
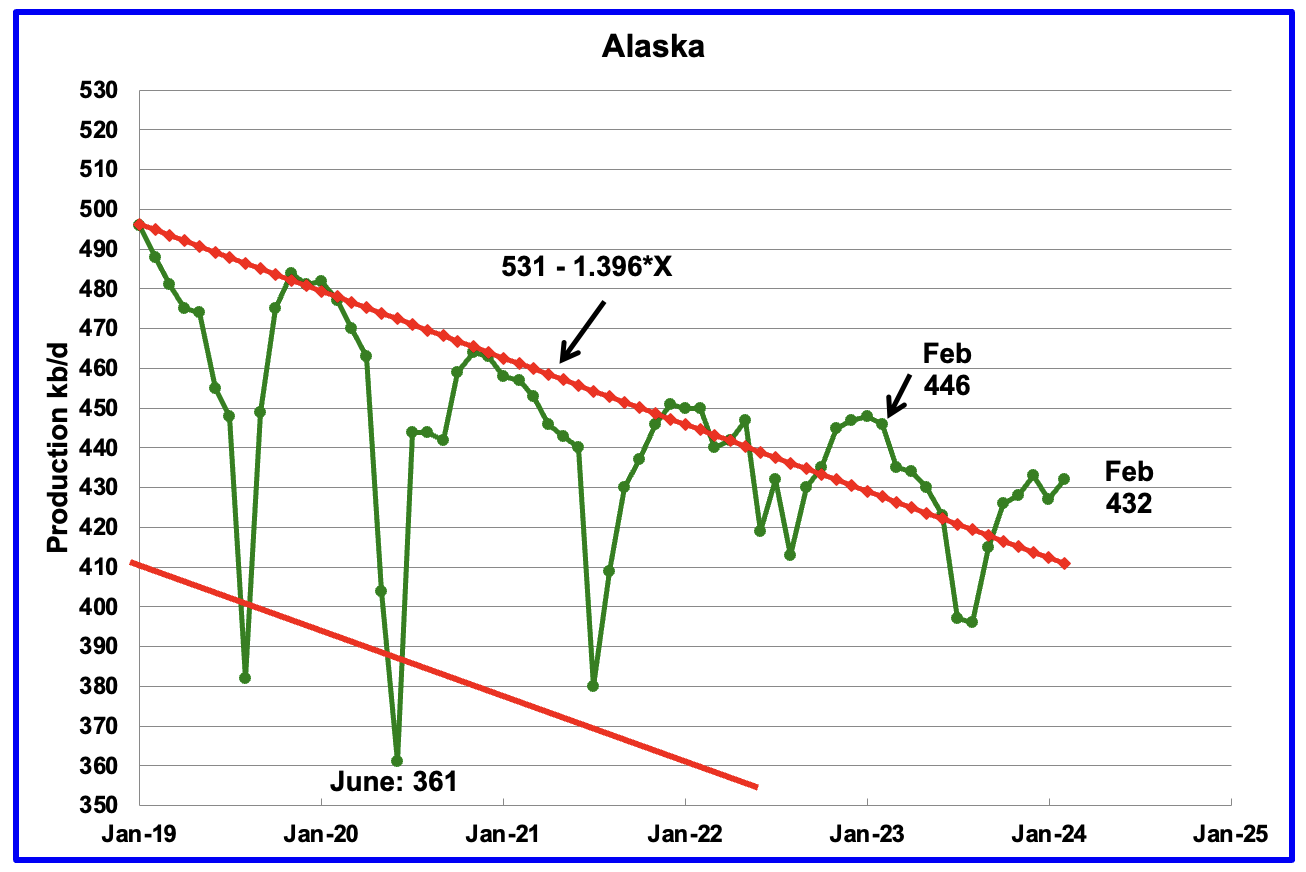
Alaskaʼs February output rose by 5 kb/d to 432 kb/d. Production YoY is down by 14 kb/d. The EIA’s weekly petroleum report continues to show Alaska’s April oil production is in the 430 ±5 kb/d range.
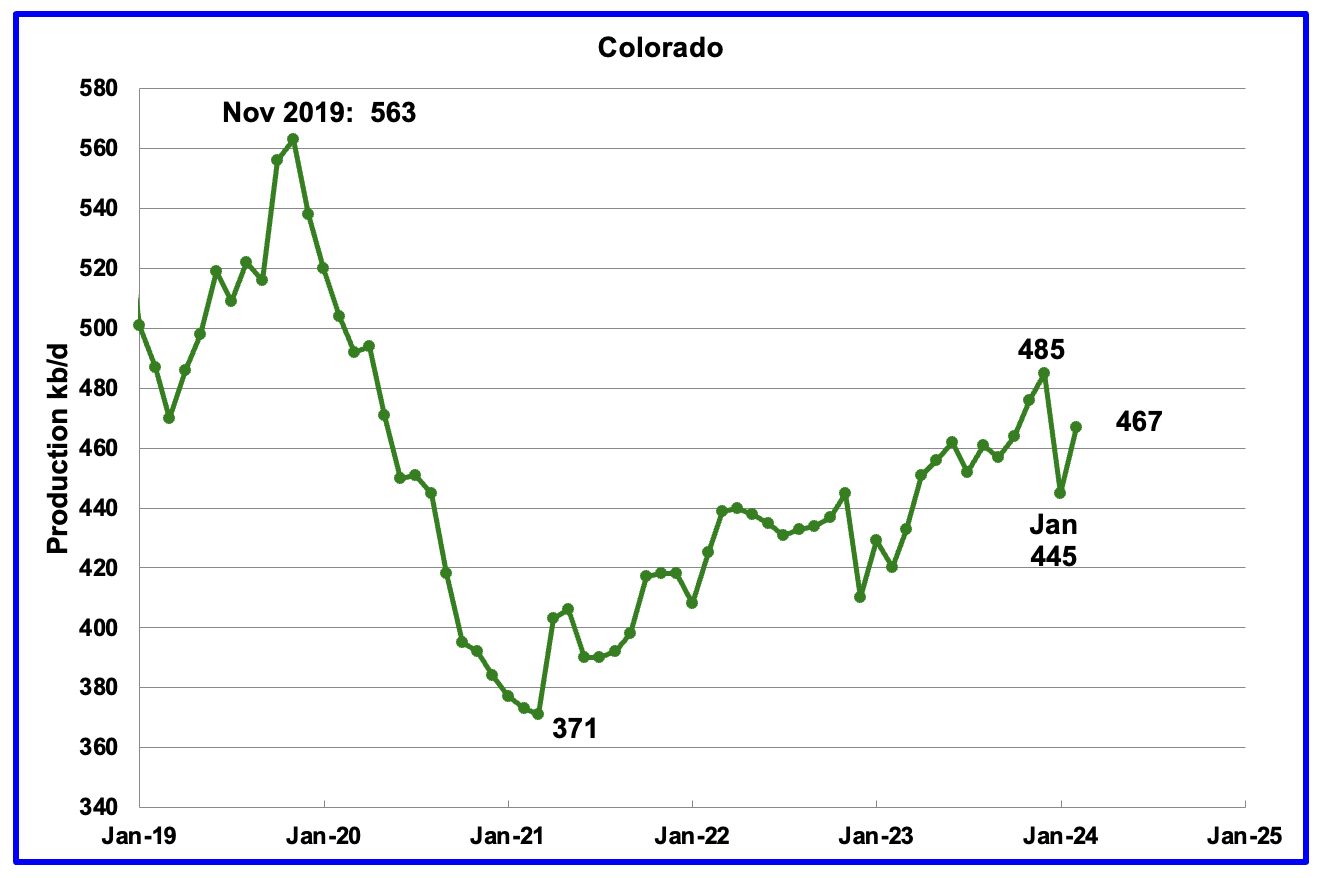
Coloradoʼs February production increased by 22 kb/d to 467 kb/d. Colorado has moved ahead of Alaska to become the 4th largest US oil producing state. Colorado began the year with 12 rigs but has now dropped to 9 in early May.
According to this article Colorado oil producers will have to pay an oil production fee as part of an agreement with environmental groups.
“Colorado’s oil producers are bracing for a new fee associated with their production as part of a compromise the industry reached with environmental groups that were pushing for more stringent regulations on drilling.
Colorado, the fourth largest oil producing state in the U.S., is a frequent battleground for the oil industry and environmentalists, who over the years have pushed for tougher regulations on fossil fuel production.
The deal reached this week will eliminate several proposed ballot measures targeting the fossil fuel industry ahead of this year’s election, including one that would have halted drilling in summer months.
As part of the compromise, producers will get hit with a fee that fluctuates with market prices on every barrel of oil produced in the state.
“We’re not huge fans of the fee dynamic / structure,” said analysts for investment firm Tudor, Pickering, Holt & Co in a note, adding it is estimated to generate some $140 million in revenue.”
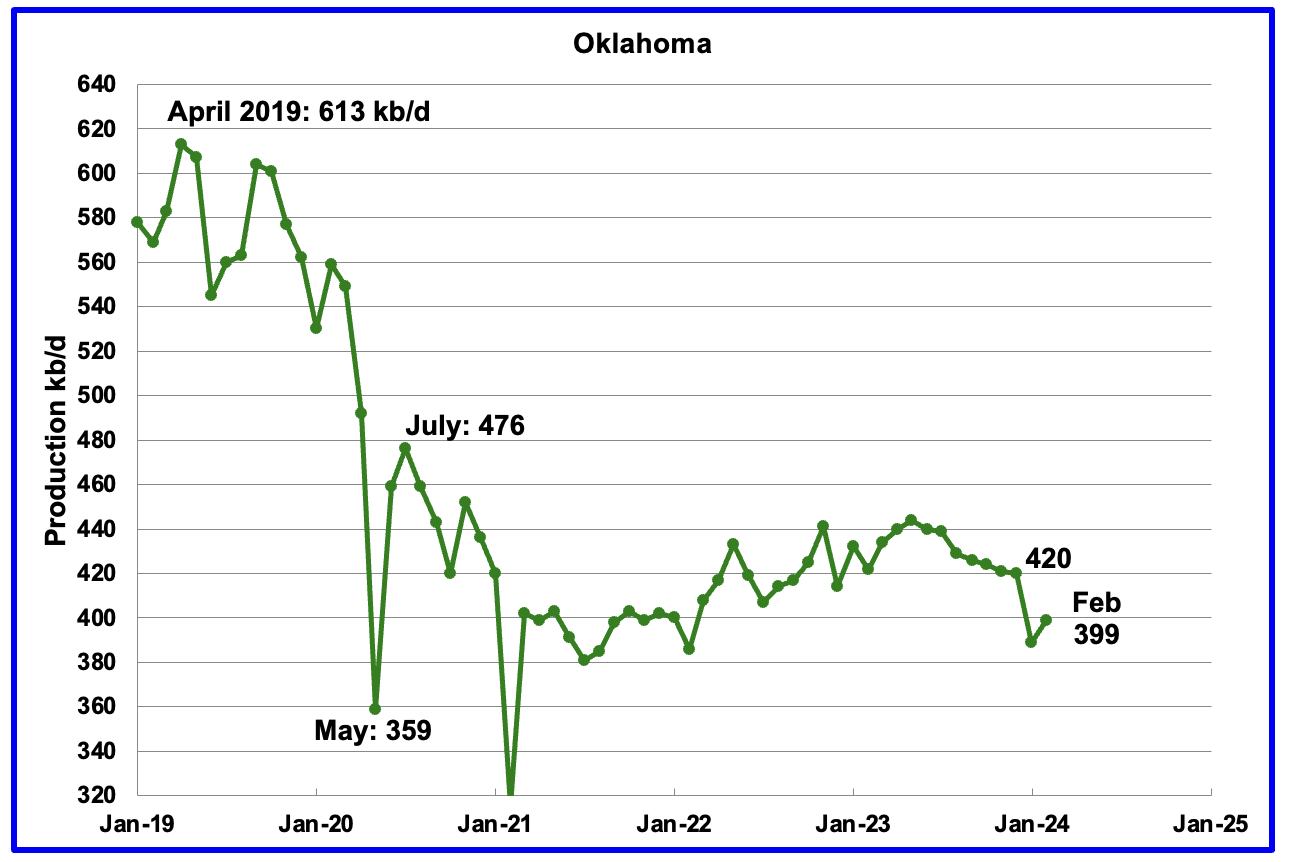
Oklahoma’s output in February rose by 10 kb/d to 399 kb/d. Production remains below the post pandemic July 2020 high of 476 kb/d. Output appears to have entered a slow declining phase. Note that January production dropped by 31 kb/d while February only rose 10 kb/d.
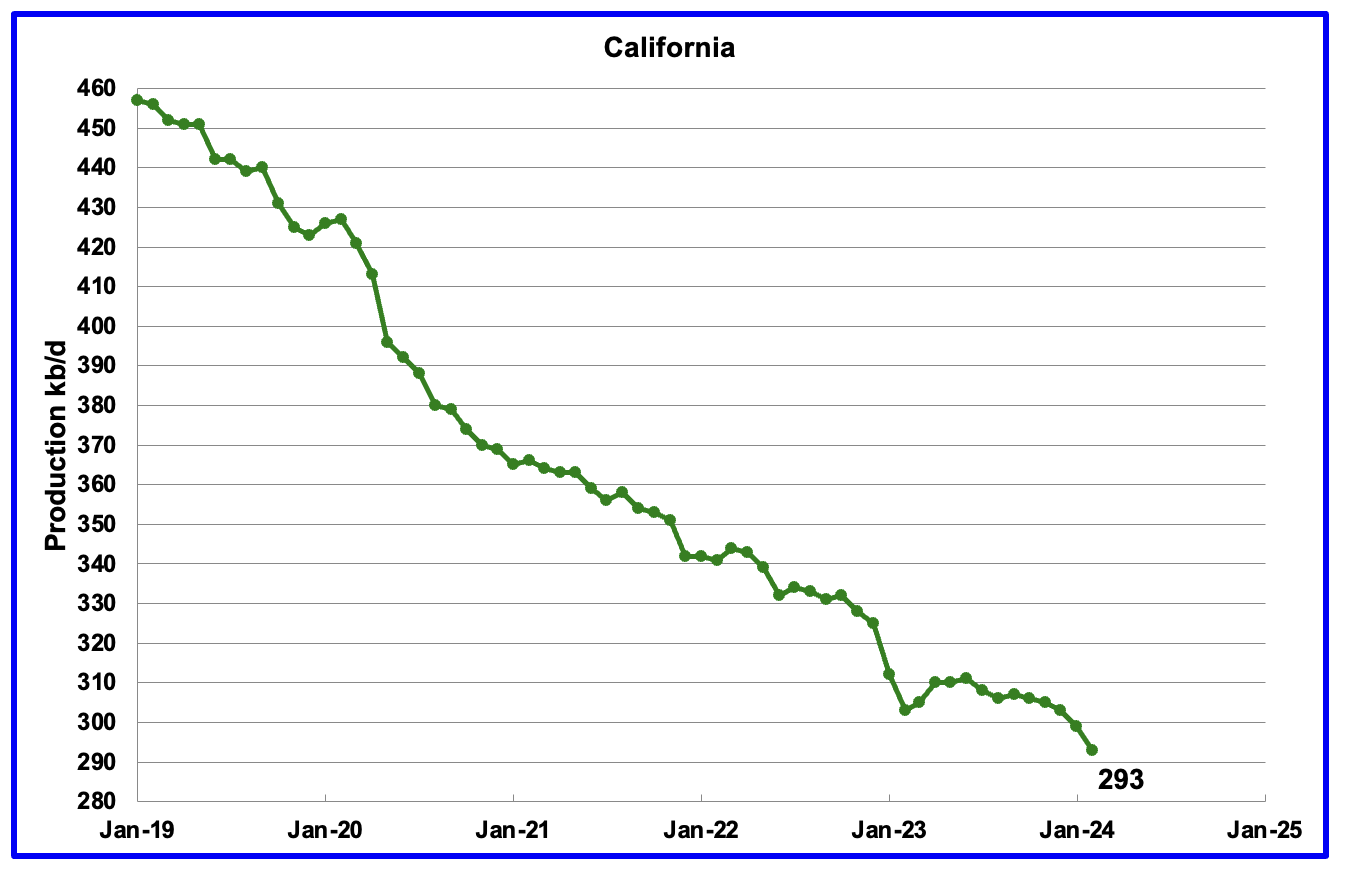
Californiaʼs February production continued its slow decline by dropping 6 kb/d to 293 kb/d. Production on average appears to be dropping at the rate of 2 kb/d/mth. From February 2021 to February 2024, production has dropped by 73 kb/d or close to 2 kb/d/mth.
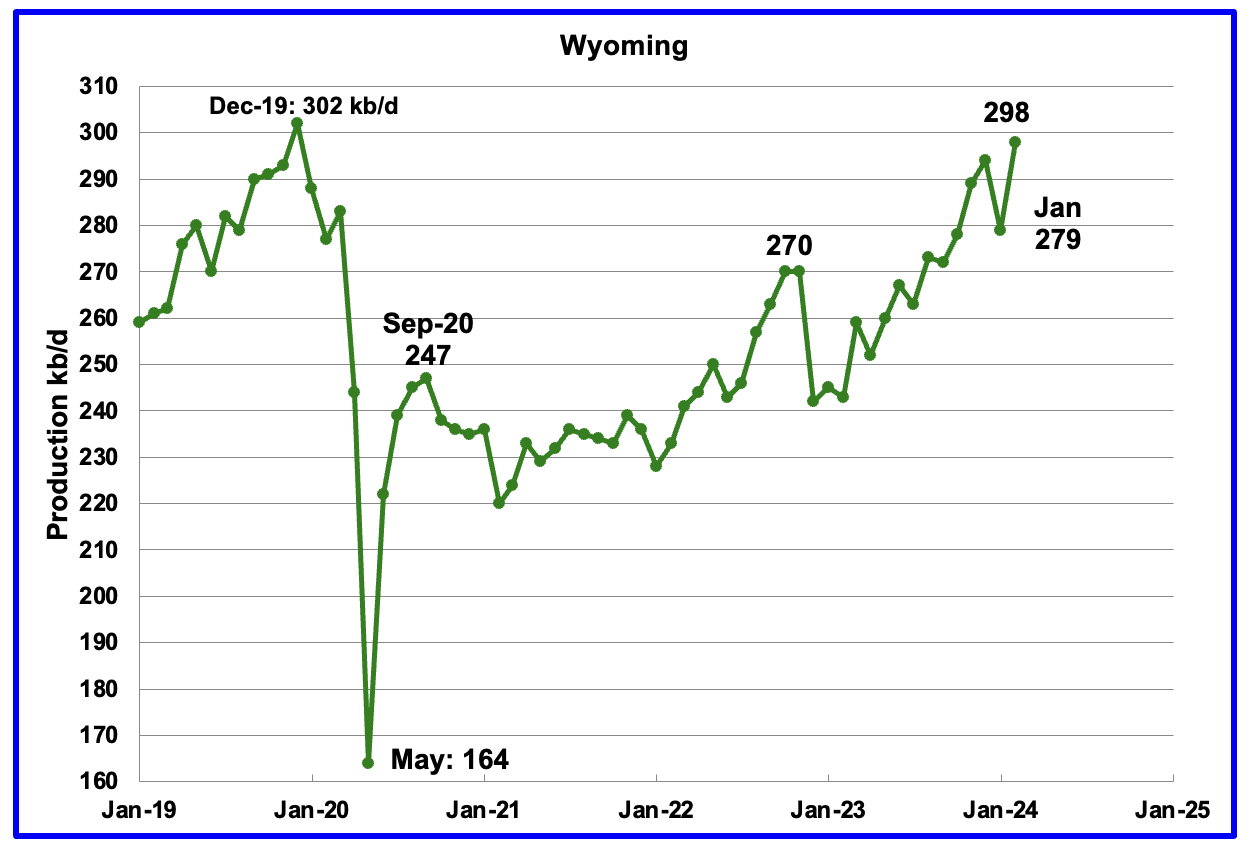
Wyoming’s oil production has been rebounding since March 2023. However the rebound was impacted by the January 2023 storm. February’s oil production recovered from January’s drop by 19 kb/d to a new post pandemic high of 298 kb/d.
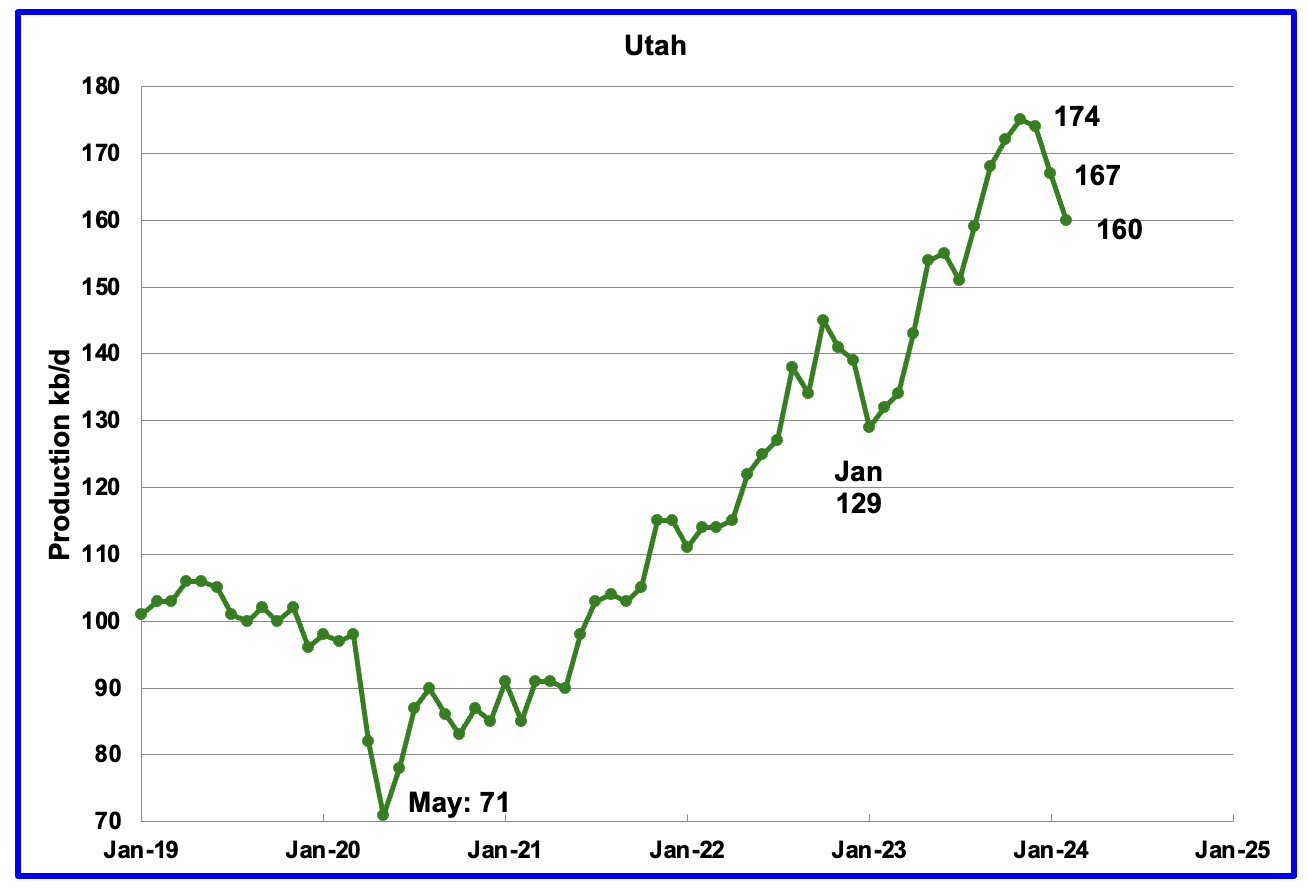
February’s production decreased by 7 kb/d to 160 kb/d. For the first 4 months of 2024, Utah has had 9 oil rigs in operation. It is not clear why production is dropping.
According to this article, one producer is using more proppant to increase production.
“Crescent Energy is doubling down on proppant in the Uinta Basin, making 50% bigger wells for 35% fewer bucks per boe of output, the company reported March 5.
“When we acquired this position [in 2022], the only horizontal development on the assets utilized a legacy, smaller completion design with roughly 1,500 pounds of proppant per foot,” David Rockecharlie, Crescent CEO, said in an earnings call.
New completions use 3,000 lbs per foot. “The early results from our updated design, which we implemented over the last nine months, are significantly better than the previous design.”
The increased production since February 2023 has come from the Uinta basin.
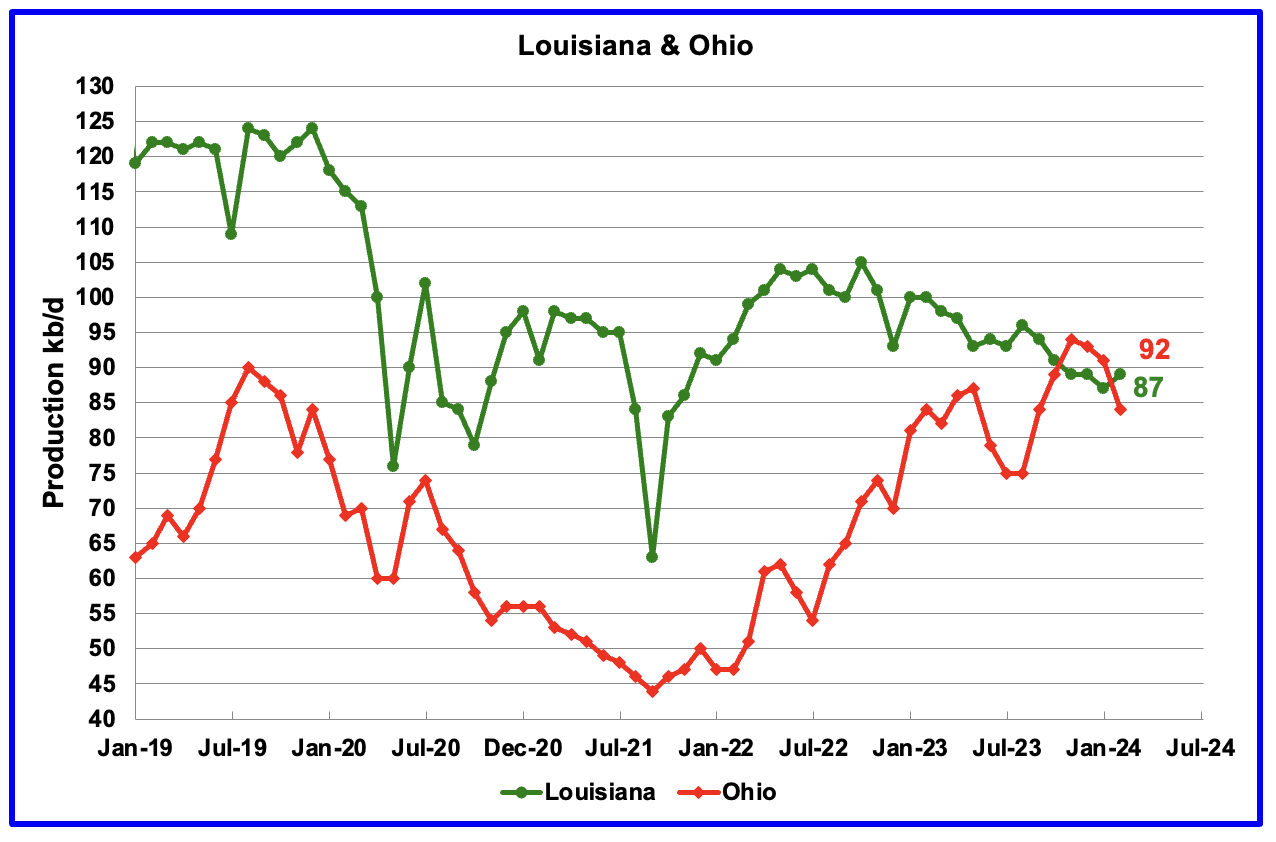
Ohio has been added to the Louisiana chart because Ohio’s production has been slowly increasing since October 2021 and passed Louisiana in November 2023.
Louisiana’s output entered a slow decline phase in October 2022. February’s production decreased by 2 kb/d to 87 kb/d. Ohio’s oil production dropped by 7 kb/d to 84 kb/d after reaching a post pandemic high of 94 kb/d in November. The most recent Baker Hughes rig report now shows two horizontal oil rigs operating in Ohio in April.
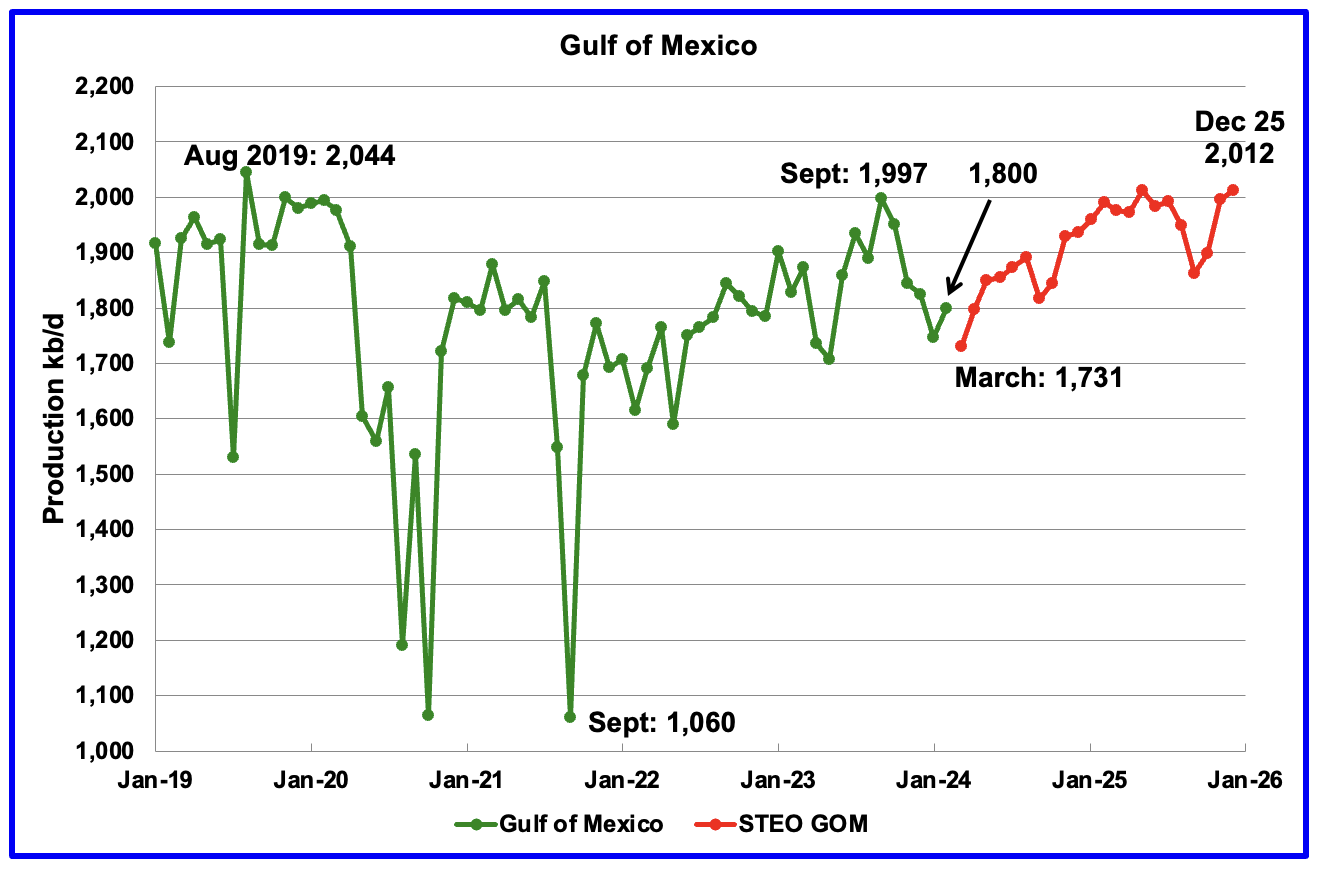
GOM production rose by 53 kb/d in February to 1,800 kb/d but is expected to drop in February by 69 kb/d to 1,731 kb/d.
The April 2024 STEO projection for the GOM output has been added to this chart. It projects production from March 2024 to December 2025 will increase by 281 kb/d to 2,012 kb/d, 27 kb/d lower than reported in the previous STEO.
A Different Perspective on US Oil Production
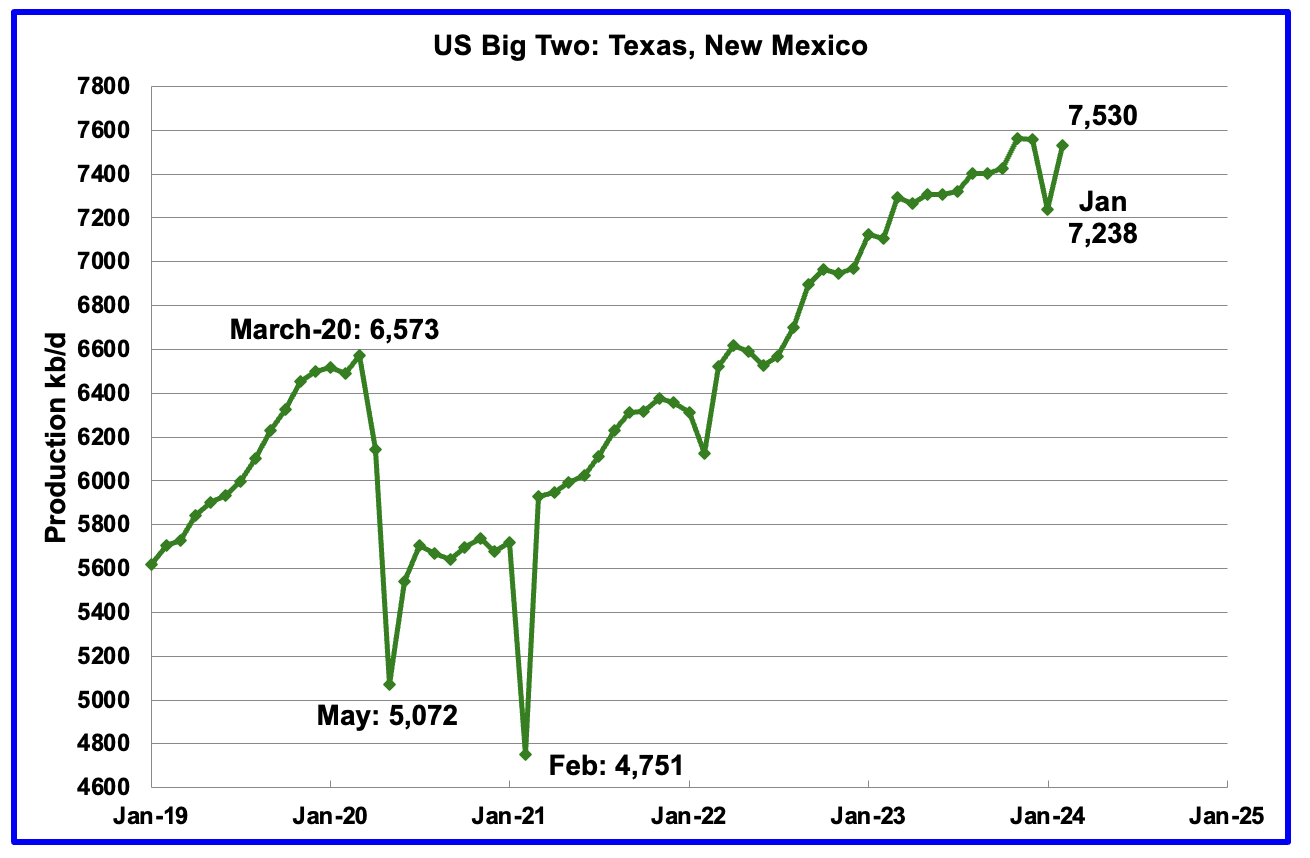
The Big Two states’ combined oil output for Texas and New Mexico.
February’s production in the Big Two states increased by a combined 292 kb/d to 7,530 kb/d with Texas adding 172 kb/d while New Mexico added 120 kb/d.
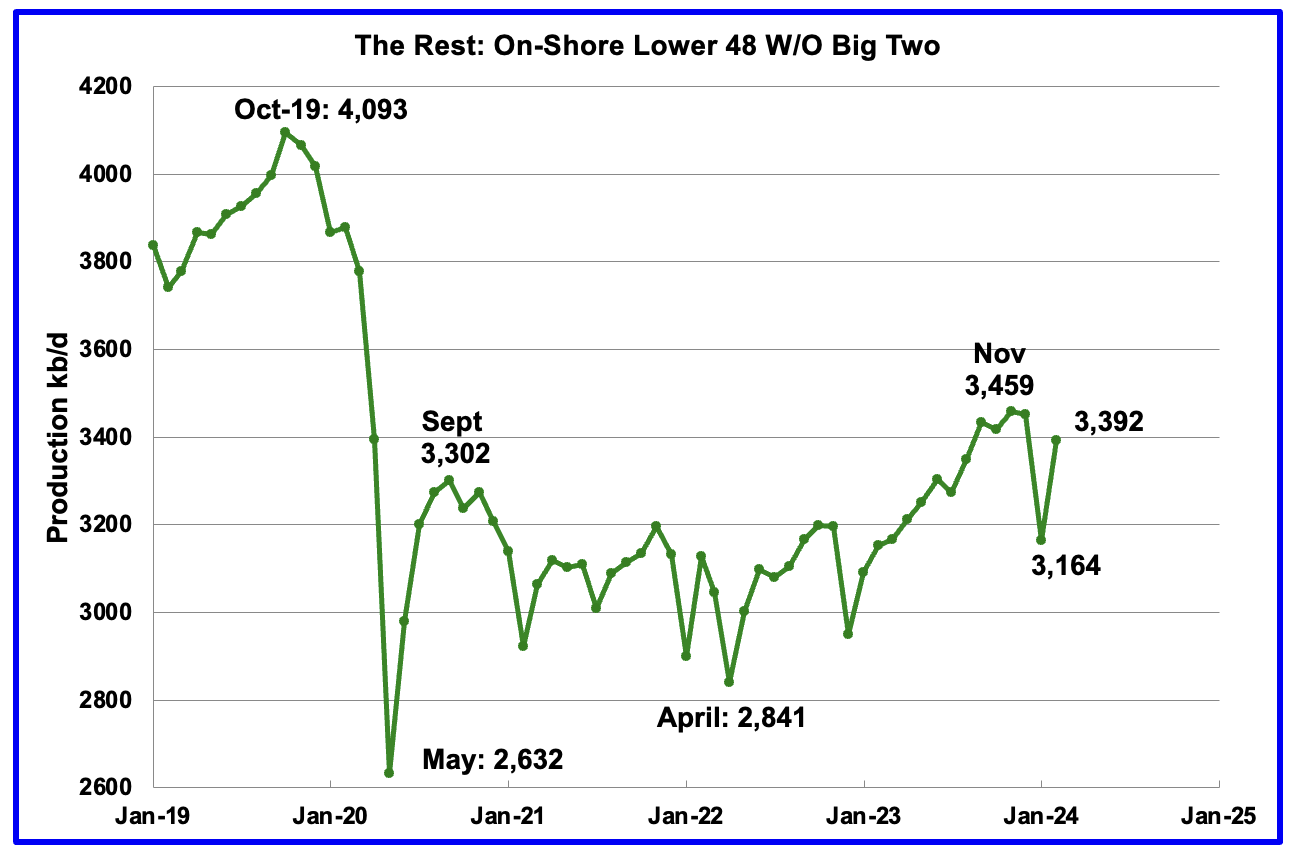
Oil production by The Rest
February’s oil production in The Rest increased by 228 kb/d to 3,392 kb/d.
The main takeaway from The Rest chart is that current production is below the high of October 2019 and is a significant loss that occurred during the Covid shut down and is slowly being recovered.
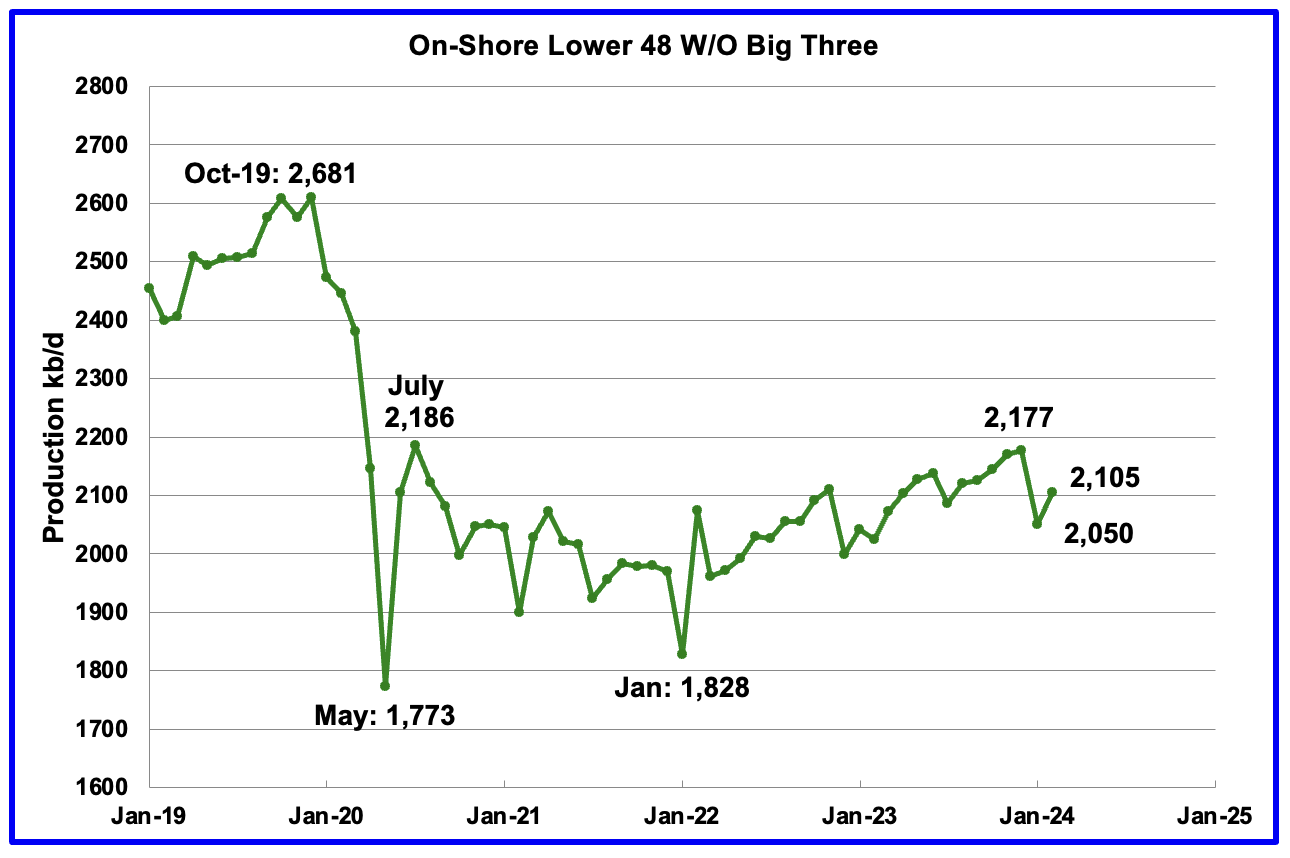
The On-Shore lower 48 W/O the big three, Texas, New Mexico and North Dakota, shows a slow rising production trend from the low of January 2022. February’s production increased by 55 kb/d to 2,105 kb/d.
Permian Basin Report by Main Counties and Districts
This special monthly Permian section was recently added to the US report because of a range of views on whether Permian production will continue to grow or will peak over the next year or two. The issue was brought into focus recently by the Goehring and Rozencwajg Report which indicated that a few of the biggest Permian oil producing counties were close to peaking or past peak. Also comments by posters on this site have similar beliefs from hands on experience.
This section will focus on the four largest oil producing counties in the Permian, Lea, Eddy, Midland and Martin. It will track the oil and natural gas production and the associated Gas Oil Ratio (GOR) on a monthly basis. The data is taken from the state’s government agencies for Texas and New Mexico. Typically the data for the latest two or three months is not complete and is revised upward as companies submit their updated information. Note the natural gas production shown in the charts that is used to calculate the GOR is the gas coming from both the gas and oil wells.
Of particular interest will be the charts which plot oil production vs GOR for a county to see if a particular characteristic develops that indicates the field is close to entering the bubble point phase. While the GOR metric is best suited for characterizing individual wells, counties with closely spaced horizontal wells may display a behaviour similar to individual wells due to pressure cross talking . For further information on the bubble point and GOR, there are a few good thoughts on the intricacies of the GOR in an earlier POB comment. Also check this EIA topic on GOR.
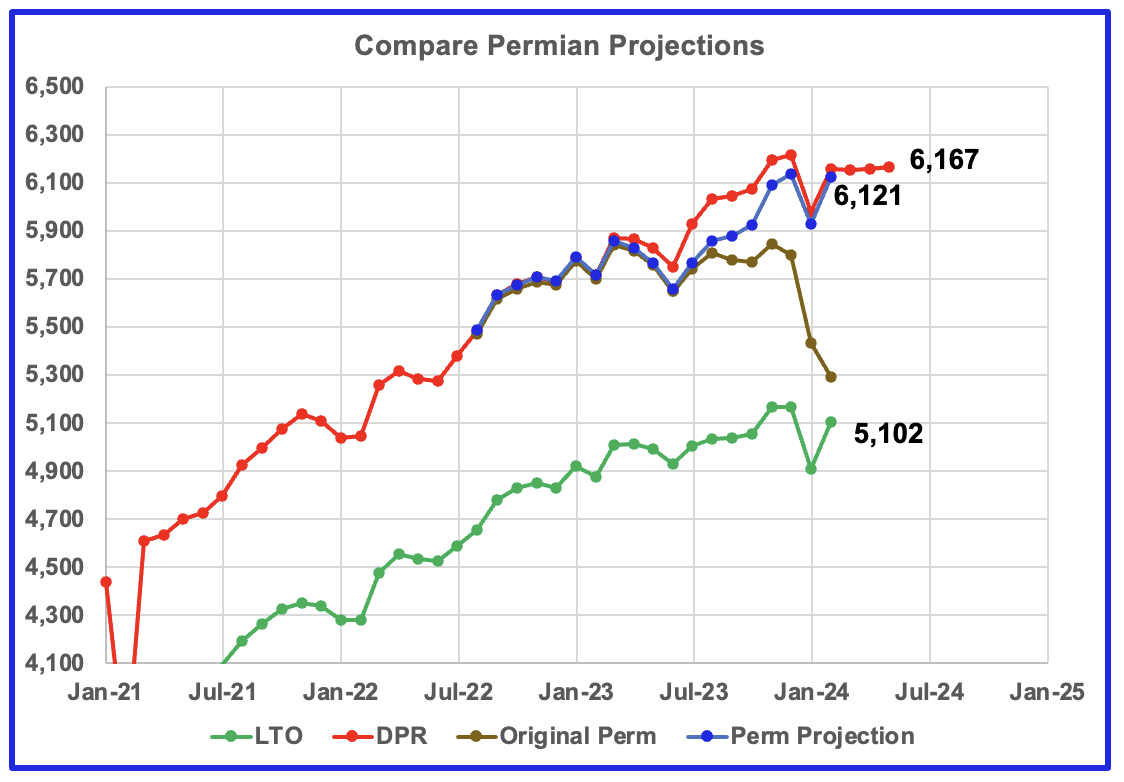
This chart shows four oil production graphs for the Permian basin updated to February and to May for the DPR. The gap between the DPR and LTO projections is there because the DPR projection includes both LTO oil along with oil from conventional wells in the basins that it covers.
The red and green graphs show oil production as published by the EIA’s DPR and the LTO offices. Comparing the two, it appears that both the LTO and DPR offices believe Permian LTO production is currently in a plateau/declining phase. The blue graph is a projection for Permian oil production. The brown chart is the sum of Permian production data as taken from the Texas RRC and the New Mexico Oil Conservation Division. The big January drop is due to severe weather in the central US.
The blue Permian projection graph only uses two months of preliminary production data, January and February, from the New Mexico OCD and the Texas RRC to make its February projection.
The initial attempt to project the Texas and Permian results using the same methodology as used to projectNew Mexico production has not been successful. A modification has been introduced for projecting Texas results and limited back testing was undertaken. It will take a few more months of Texas data to see if the modification gives reasonable results for Texas and the Permian.
One possible source of error affecting the Texas projections may be the large increase in February production reported by the Texas RRC. Typically the February/January drop is larger than the January/December drop. In this case, the opposite is true. Is this related to the big January drop or is it a real increase in February production? The modification in the methodology results in February’s production projection coming in lower than December.
New Mexico Permian
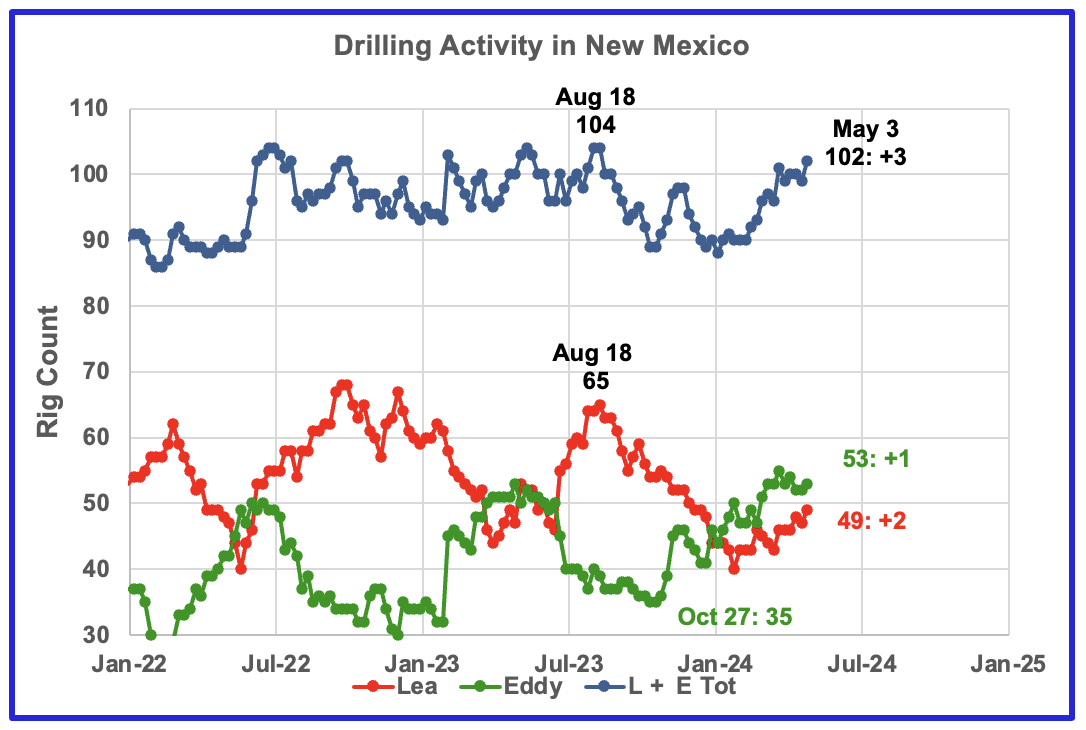
Since the middle of August 2023, the Lea county rig count has dropped from 65 rigs to 40 rigs in late January. By the first week of May the rig count had rebounded to 49. At the same time production has increased slightly to 1,150 kb/d over the period January 2023 to February 2024. See next chart.
From a low of 35 rigs in late October, 20 rigs moved into Eddy county at its peak, 55. Currently 53 are operating. Something is happening in Eddy county which will take at least six months to show up.
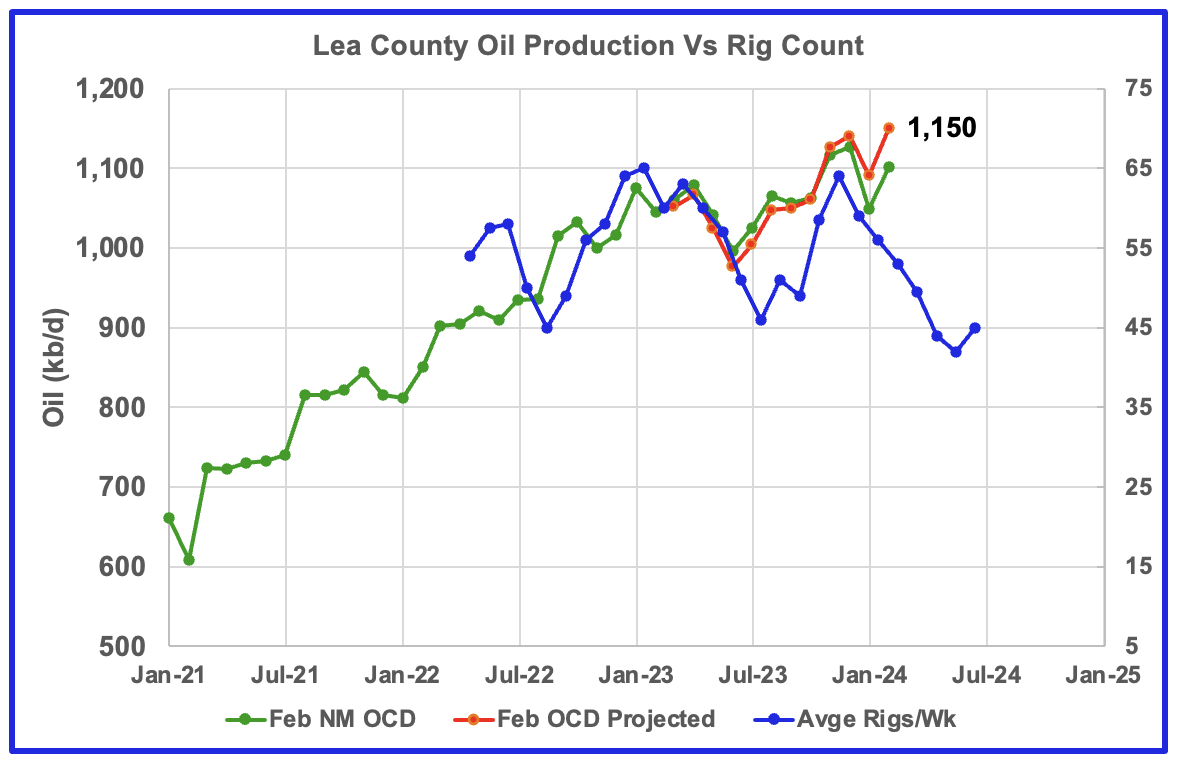
Preliminary February data indicates Lea County oil production increased by 52 kb/d to 1,101 kb/d. A projection for February’s final production estimates it will be close to 1,150 kb/d. NoviLabs in its latest update reported January Lea county production was 1,008 kb/d from 5,996 wells. Their estimate is lower than the 1,101 kb/d because NoviLabs only reports production from horizontal wells.
The blue graph shows the average number of weekly rigs operating during a given month as taken from the above weekly rig chart. The rig graph has been shifted forward by 3 1/2 months. So the 64 Rigs/wk operating in August 2023 have been moved forward to mid November 2023 to show the possible correlation and time delay between rig count and oil production. If the oil production were to follow the rig count going forward, oil production in Lea County should begin to drop in March or April.
The December/January rig drop may be foretelling that Lea county is close to peak production. Note there has been very little production increase since November 2023, 1,127 kb/d to 1,150 kb/d in February 2024.
Note that rig counts are being used to project production as opposed to completions because very few DUCs are being completed at this time.
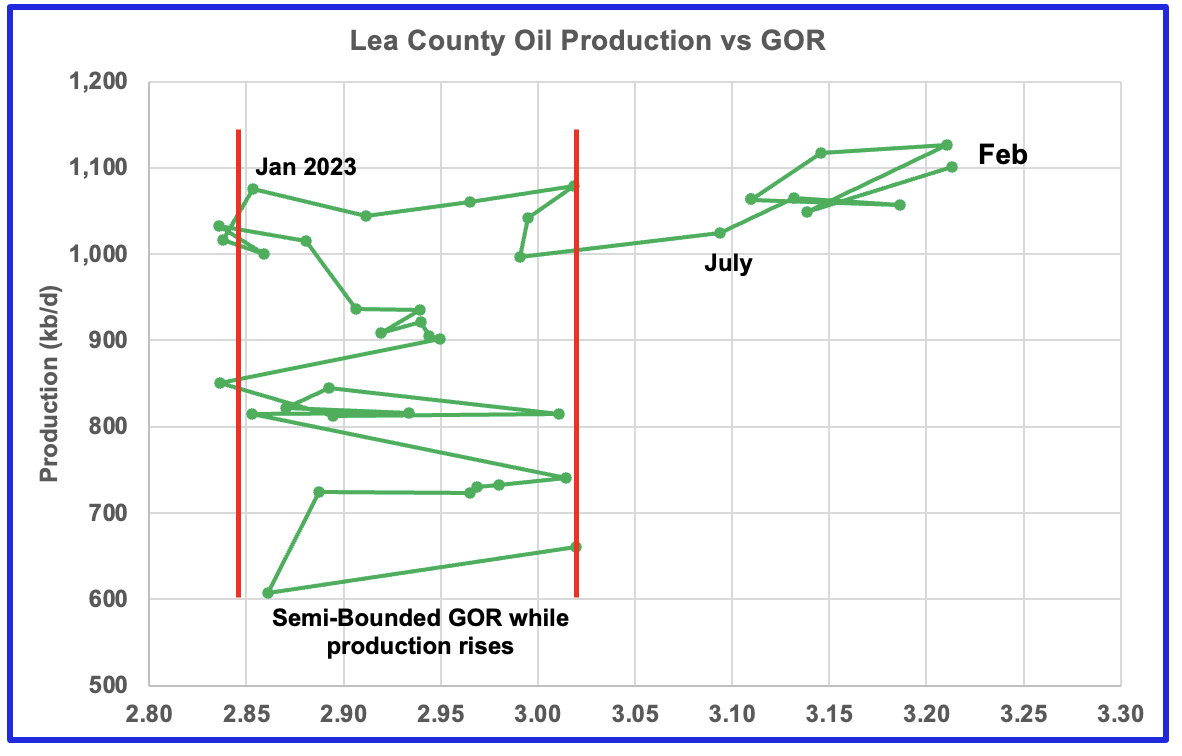
After much zigging and zagging, oil production in Lea county stabilized just above 1,000 kb/d. Once production reached its new high in January 2023, production essentially plateaued but the GOR started to increase rapidly to the right and entered the bubble point phase in July 2023.
From January 2023 to December 2023, the GOR increased rapidly from 2.85 to 3.22. In comparison, note that from January 2021 to June 2023, the GOR remained within the semi bounded range of 2.85 to 3.02.
Preliminary December 2023 oil production in Lea county hit a new high of 1,127 kb/d. However January production dropped to 1,049 kb/d due to cold weather and the GOR reversed direction. February saw both an increase in production to 1,101 kb/d and an increase in the GOR to 3.21, tied with December 2023.
This zigging and zagging GOR pattern within a semi-bounded GOR while oil production increases to some stable level and then moves out to a higher GOR to the right has shown up in a number of counties. See an additional two cases below. This is the eighth month in which Lea county has registered a GOR outside the semi-bounded GOR range.
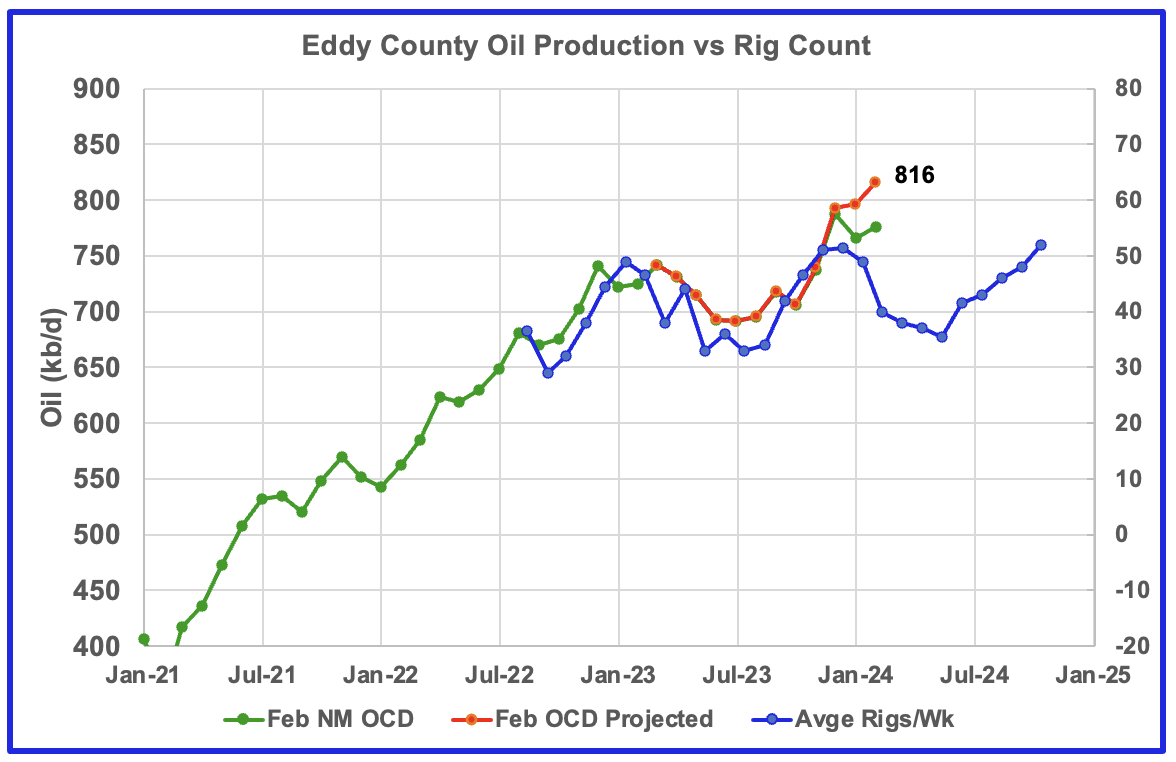
Eddy county oil production was showing signs it was in a plateau phase up to October 2023. However, production began to rise in November and hit a new projected high of 816 kb/d in February. The rising production must be associated with the large increase in the rig count starting in February 2023.
The blue graph shows the average number of weekly rigs operating during a given month as taken from the above weekly drilling chart. The rig graph has been shifted forward by 7 1/2 months to roughly coincide with the production graph. Note the difference in rig time shift between Lea county 3 1/2 months vs 71/2 months for Eddy.
If production were to follow the rig count trend going forward, Eddy production should begin to drop in March before rising again starting in June/July.
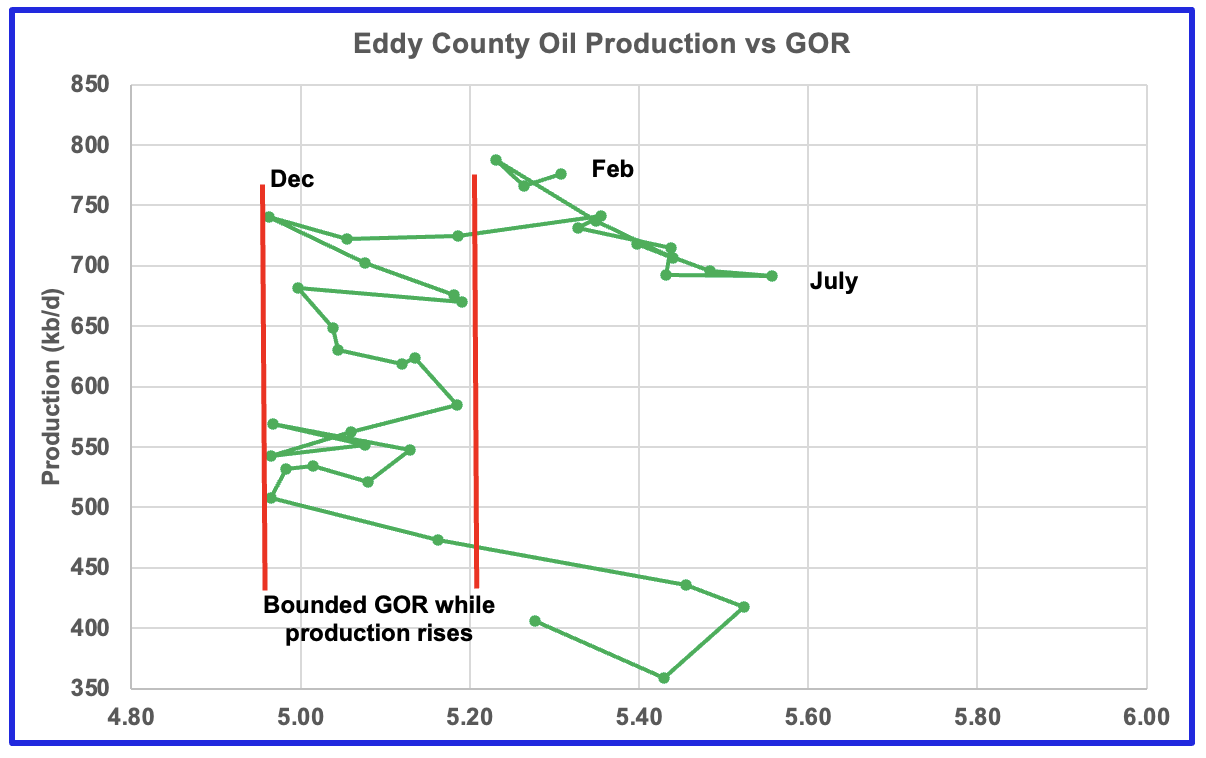
The Eddy county GOR pattern is similar to Lea county except that Eddy broke out from the semi bounded range earlier and for a longer time. For the last three months preliminary oil production has been bouncing between 750 kb/d and 800 kb/d.
August 2023 saw a reversal in the increasing GOR trend by decreasing which then was followed by the current oil production increase which reached a new high in December 2023, an atypical pattern. Could this indicate that drilling in Eddy county has punched into a new bench or are some old wells being refracted?
Texas Permian
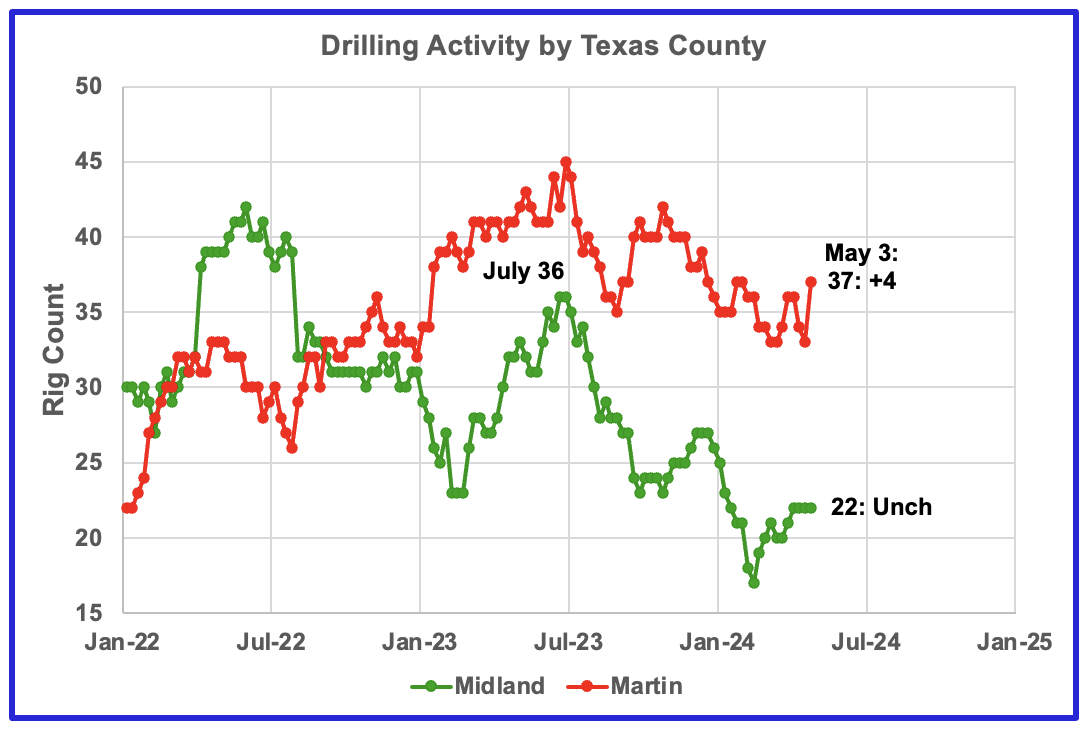
The rig count in Midland county started to reverse its downtrend and began to increase in late February 2024 but is still down 14 rigs from July 2023. Martin county rigs remain close to the lows of 2024, but rose by 4 in the week ending May 3 and are down 8 from the peak in July 2023.
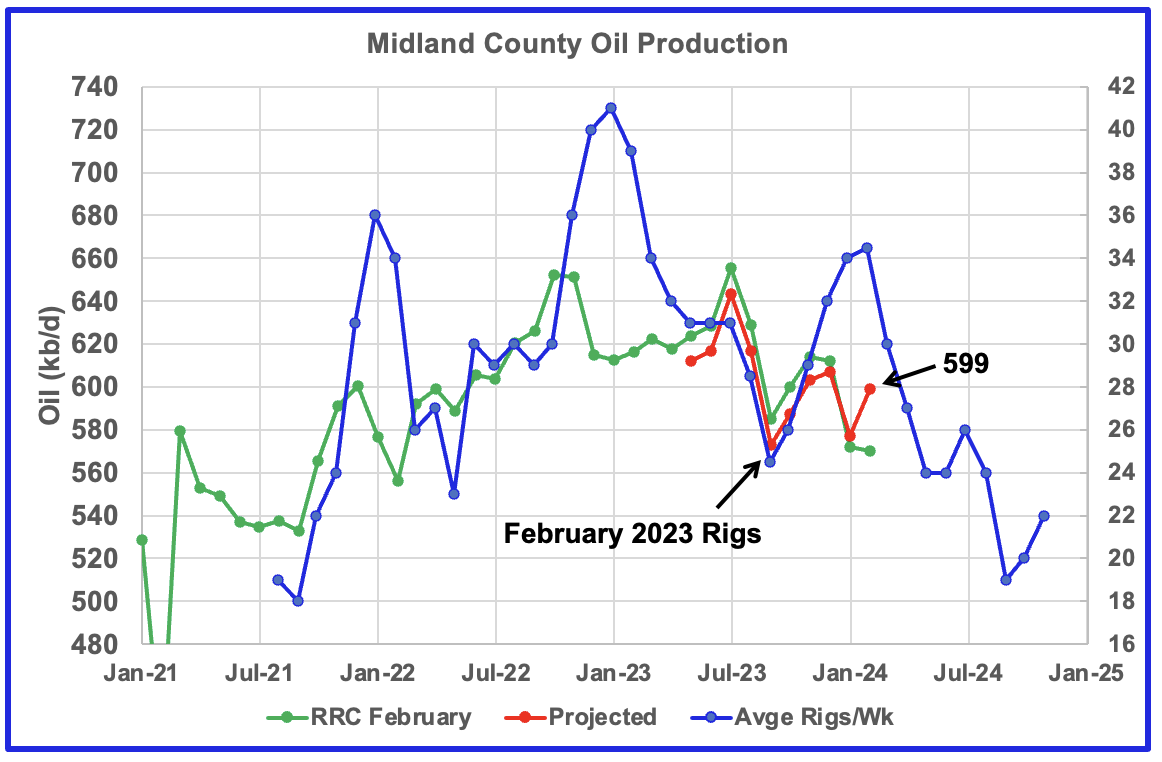
Midland County oil production began to rise again in October 2023, based on a projection. After the January drop February’s production rebounded to 599 kb/d, red graph. The green graph shows February’s preliminary production as reported by the Texas RRC. Note the small February drop. The rising production starting in October 2023 may be related to the rising drilling activity which started in March 2023. If correct, this implies Midland production peaked in July 2023.
The blue graph shows the average (approximate) number of weekly rigs operating during a given month as taken from the previous weekly drilling chart. The rig graph has been shifted forward by seven months. So the 34 Rigs/wk operating in August 2023 have been moved forward to January 2024 to show the possible correlation and time delay between rig count and oil production. If the seven month shift in the rig count is approximately correct in that oil production can be tied to the rig count, oil production in Midland county should resume its decline after March/April 2024.
In the NoviLabs January update on the Permian, Enno Peter’s chart indicates the Midland subbasin production will be flat from 2024 going forward while the Delaware will continue to grow and output will be twice as large as the Midland by 2030. Difficult to square those comments with talk of the Permian peaking shortly.
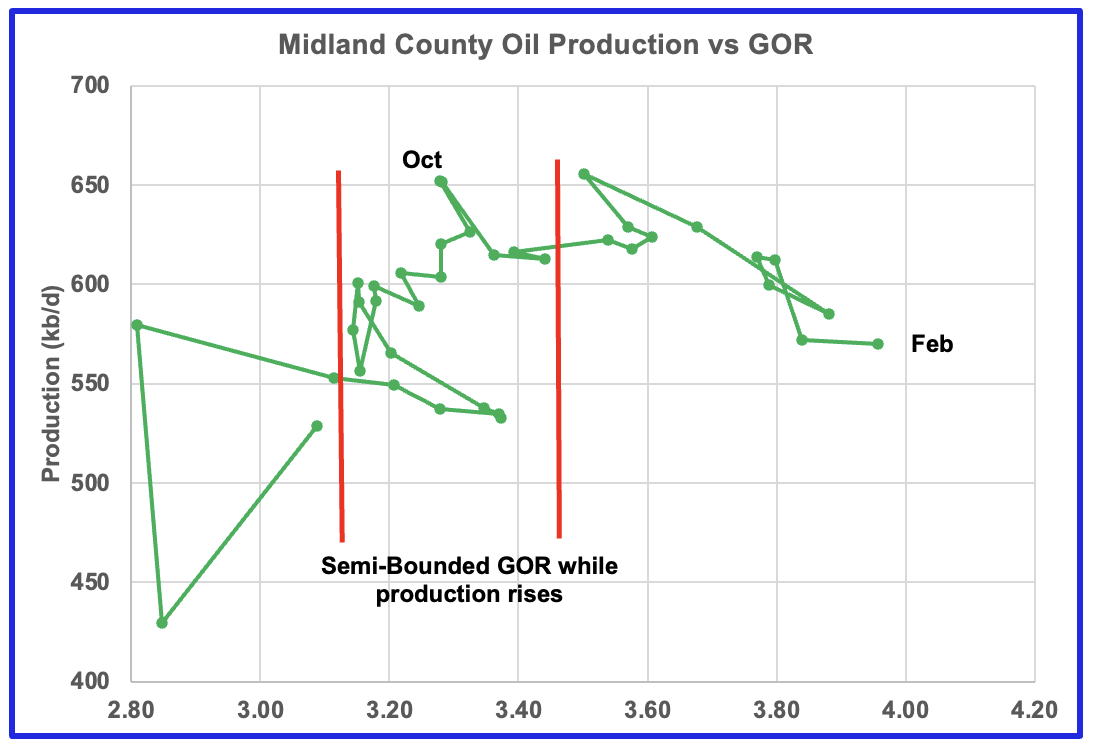
With Midland county deep into the bubble point phase, oil production continues to drop, based on the previous graph and should resume dropping in March/April. Note that oil production and GOR in this chart is based on the RRC February data.
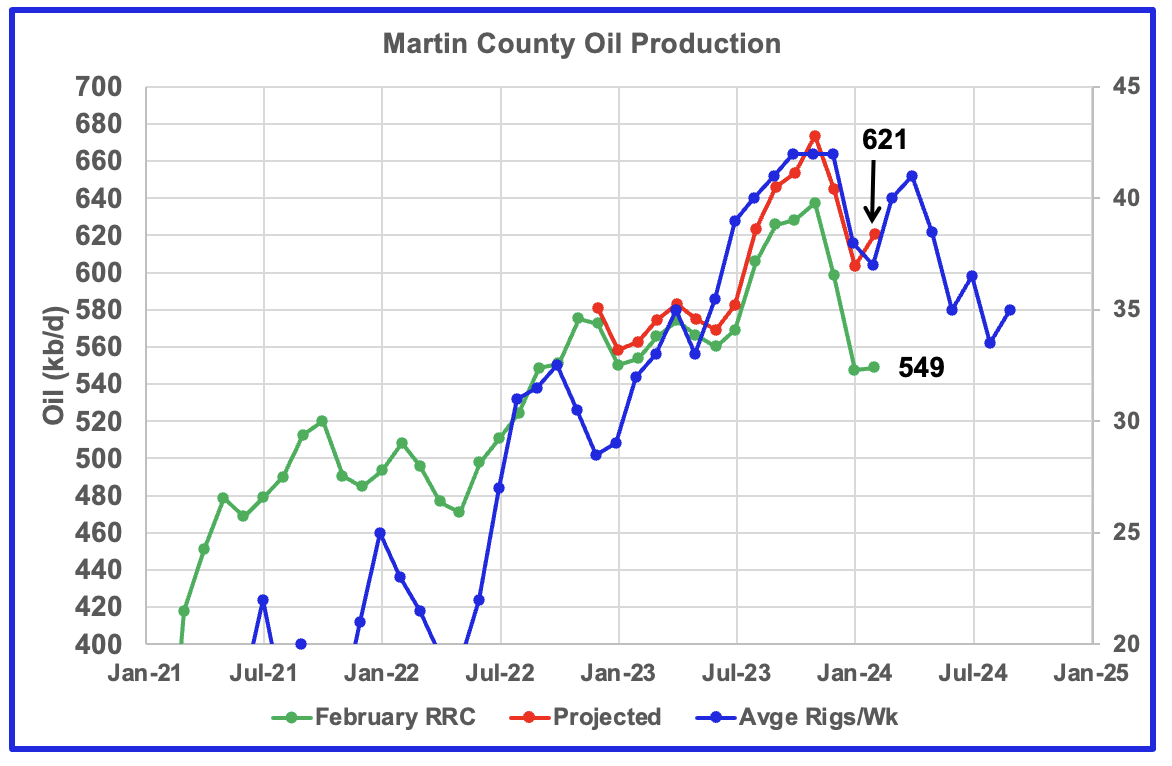
This chart shows the Texas RRC oil production for Martin County. It is showing initial signs of peaking in November 2023. The projection indicates February production was close to 621 kb/d and is lower than November 2023. The projection is also hinting at the beginning of a declining phase as it appears production is tracking the rig count graph since early 2023.
The red graph is a production forecast which the Texas RRC could be reporting for Martin county about one year from now as drillers report additional updated production information. This projection is based on a modified methodology that used January and February production data and will be re-estimated each month going forward.
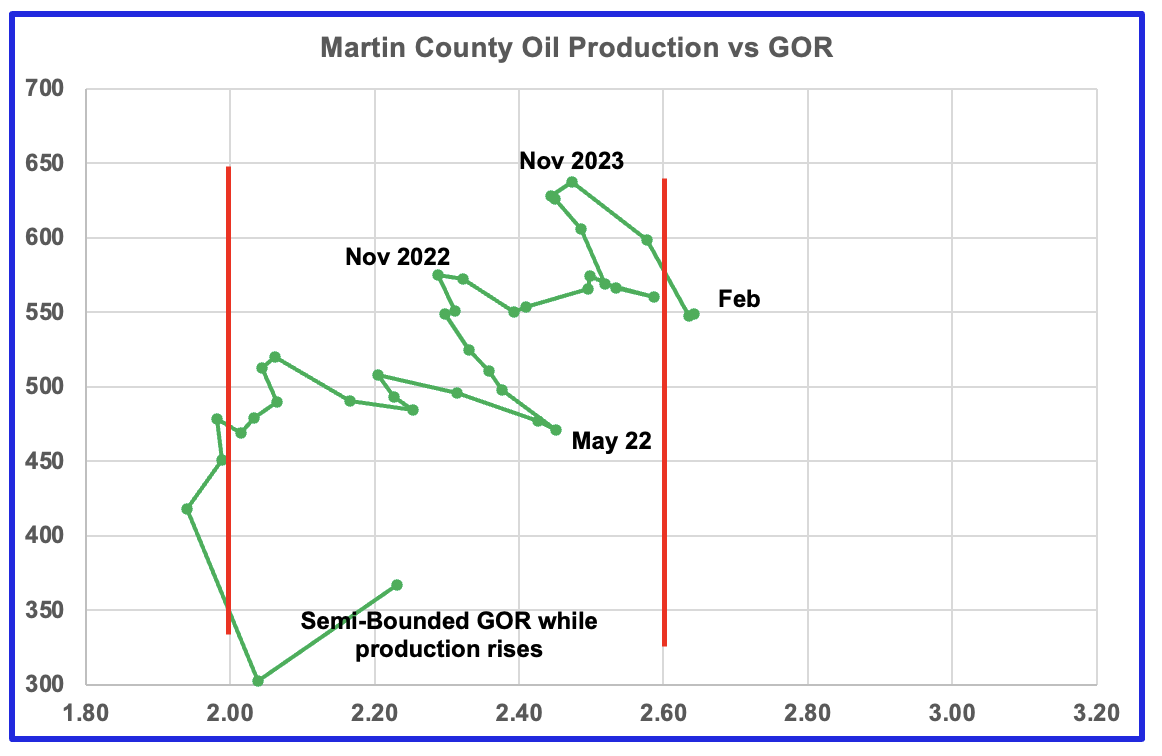
Martin county’s oil production and GOR up to December 2023 stayed within the semi bounded range and near peak oil production. However January and February saw the GOR move slightly out of the semi-bounded range for the first time. Martin county has the lowest GOR of the four counties at a GOR of 2.64. Martin may be on the verge of entering the bubble point phase that results in a dropping oil production trend.
Exactly where to put the right hand red GOR boundary for Martin county is not exactly obvious. It is possible that the right boundary should be closer to a GOR of 2.5. The GOR started to reverse direction in June 2022 as oil output rose to a new high in November 2023. In December 2023 the GOR began to increase and production began to drop. The GOR has been increasing since then and production has dropped. This makes it more likely that Martin county entered the bubble point phase in either December 2023 or January 2024. A few more months of data will clarify the situation.
Findings
Forecast oil production continues to rise for Lea and Eddy counties. However the rise is due to increased drilling activities from months back and production may be near a peak as drilling activity starts to decline.
Martin and Midland counties may have peaked and entered a declining phase.
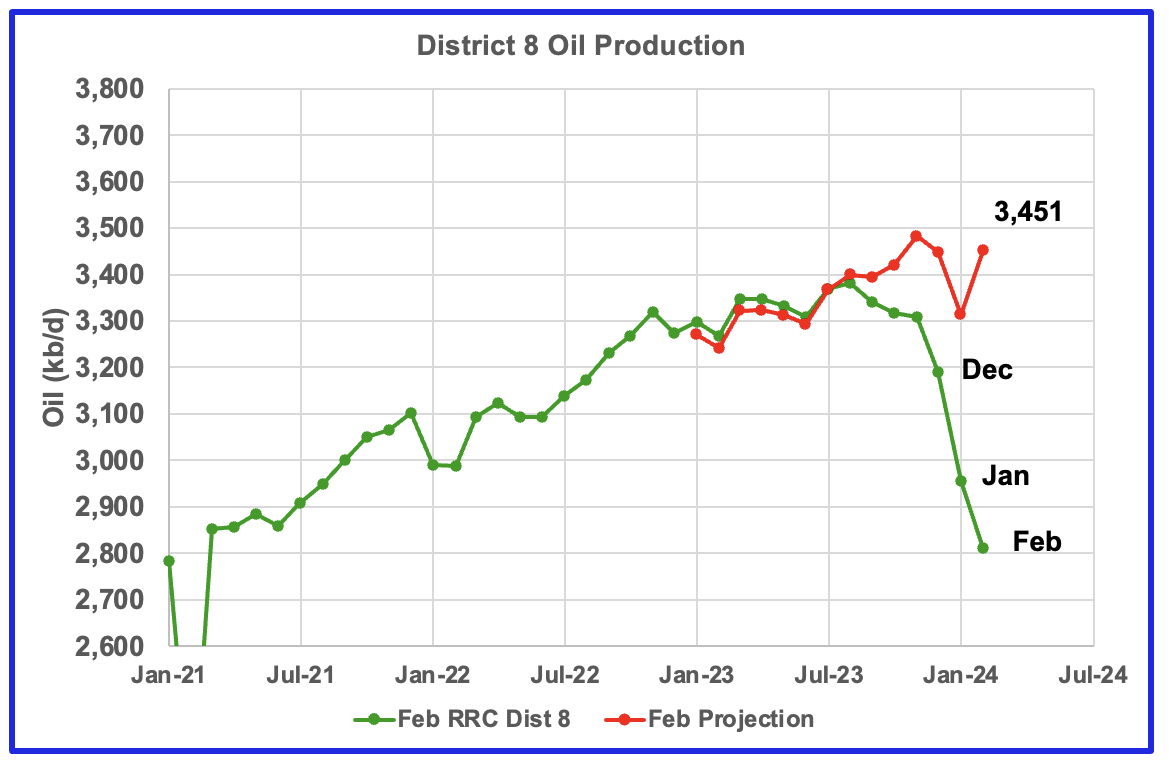
Texas District 8
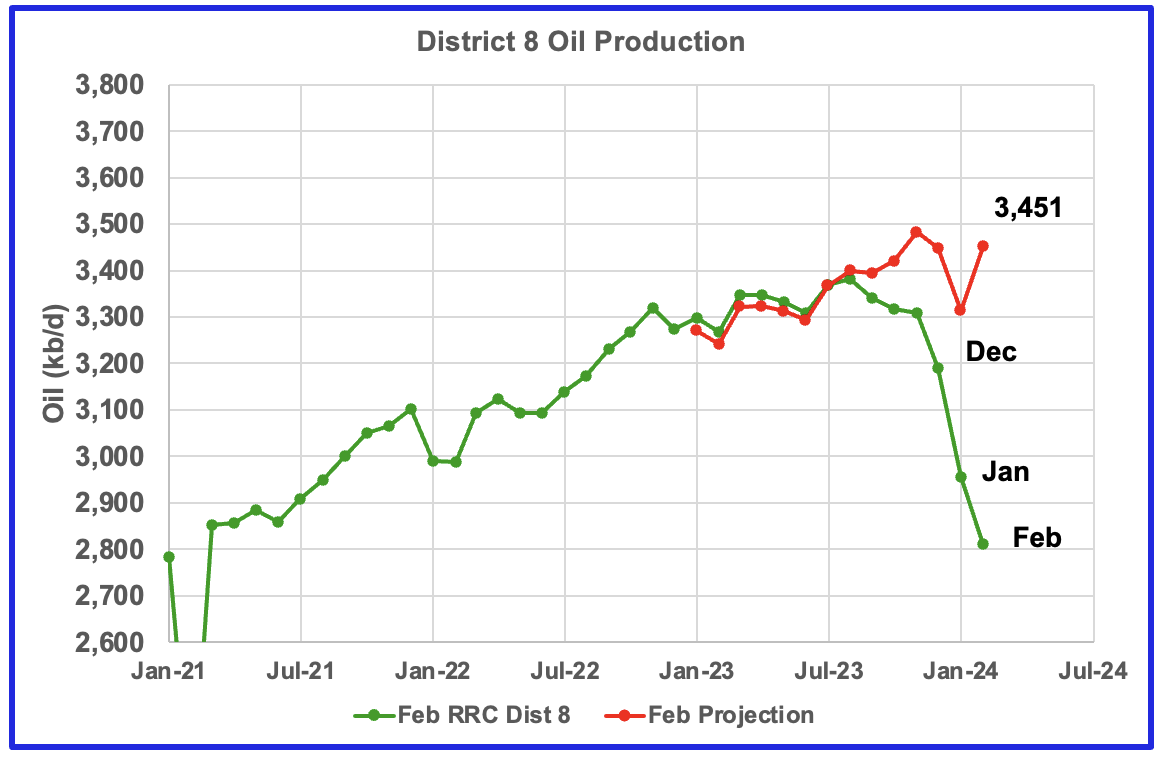
Texas District 8 contains both the Midland and Martin Counties. Combined these two counties produce close to 1,200 kb/d of oil. While these two counties are the two largest oil producers, there are many other counties with smaller production, Reeves #3 and Loving #4, that results in total production of close to 3,700 kb/d. Essentially the Midland and Martin counties produce 1/3 of the District 8 oil.
This chart shows a projection for District 8 oil production. The red graph, derived from January and February production data indicates that oil production in District 8 may be entering a plateau phase. The February increase is a rebound from the January weather induced production drop.
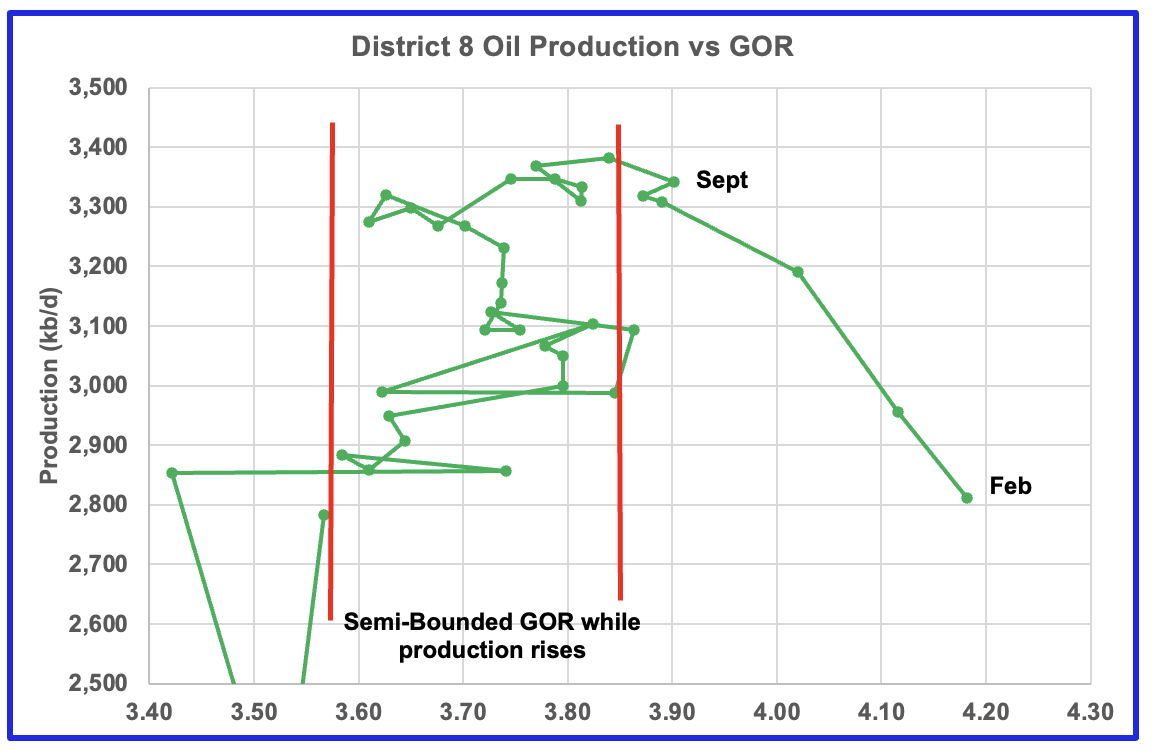
Plotting an oil production vs GOR graph for a district may be a bit of a stretch. Regardless here it is and it seems to indicate many counties may well be into the bubble point phase.
Drilling Productivity Report
The Drilling Productivity Report (DPR) uses recent data on the total number of drilling rigs in operation along with estimates of drilling productivity and estimated changes in production from existing oil wells to provide estimated changes in oil production for the principal tight oil regions. The April DPR report forecasts production to May 2024 and the following charts are updated to May 2024. The DUC charts and Drilled Wells charts are updated to March 2024.
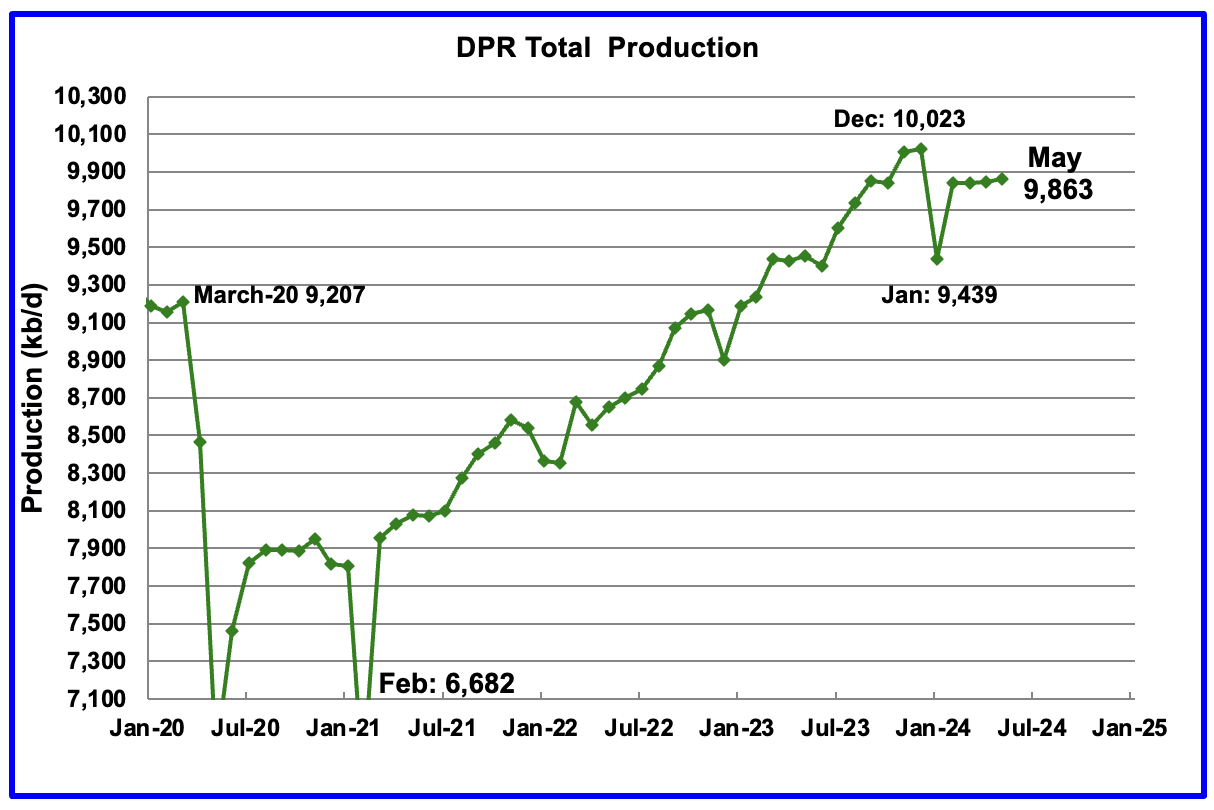
Above is the total oil production projected to May 2024 for the 7 DPR basins that the EIA tracks. Note DPR production includes both LTO oil and oil from conventional wells.
The DPR is projecting oil output for May 2024 will increase by 16 kb/d to 9,863 kb/d.
The April DPR report has also made an upward revision to its previous production forecast. For April, production was revised up by 79 kb/d to 9,847 kb/d. The large January drop is related to severe winter weather across the central US.
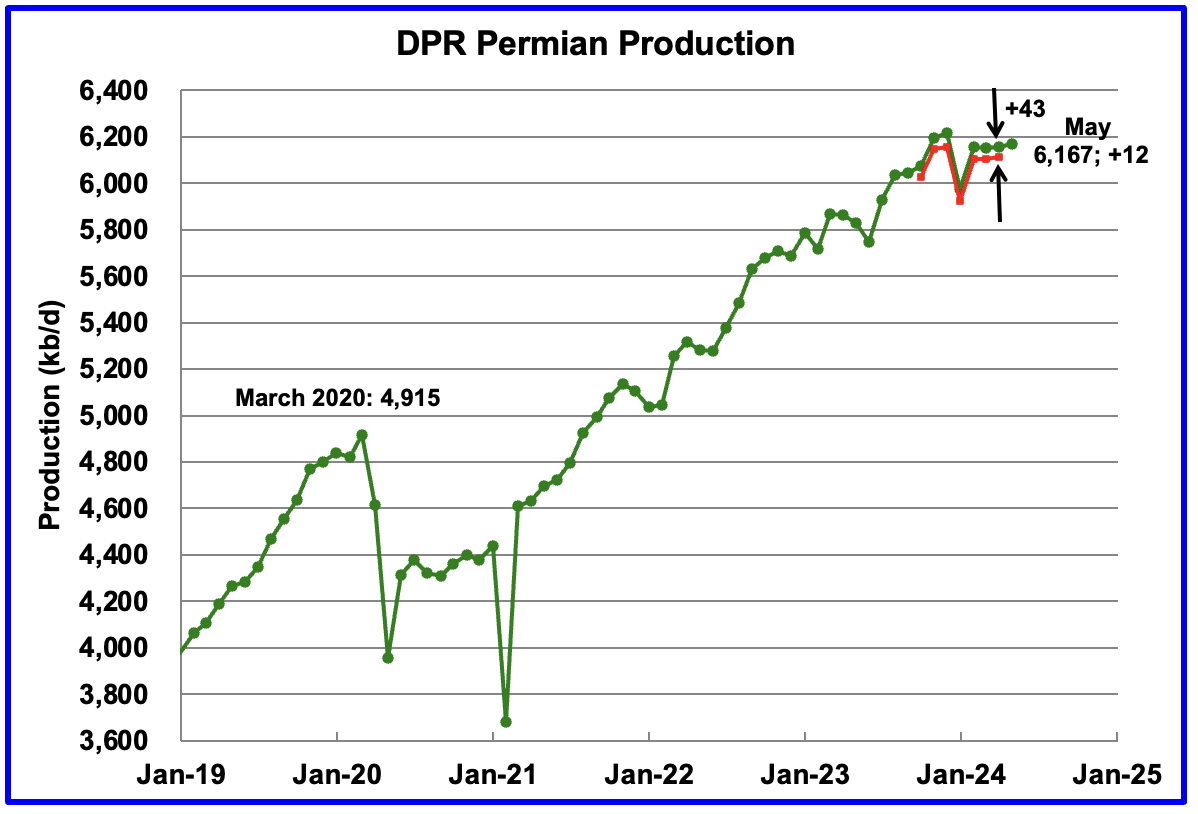
According to the EIA’s April DPR report, Permian output will continue its slow rise in May. It is expected to increase by 12 kb/d to 6,167 kb/d. The last four months of Permian production show a slowing trend in monthly production growth. The red markers show the DPR’s previous forecast.
While the May increase is small, the Permian’s output for April was revised up by 43 kb/d. All in all, May’s production is up 55 kb/d from April.
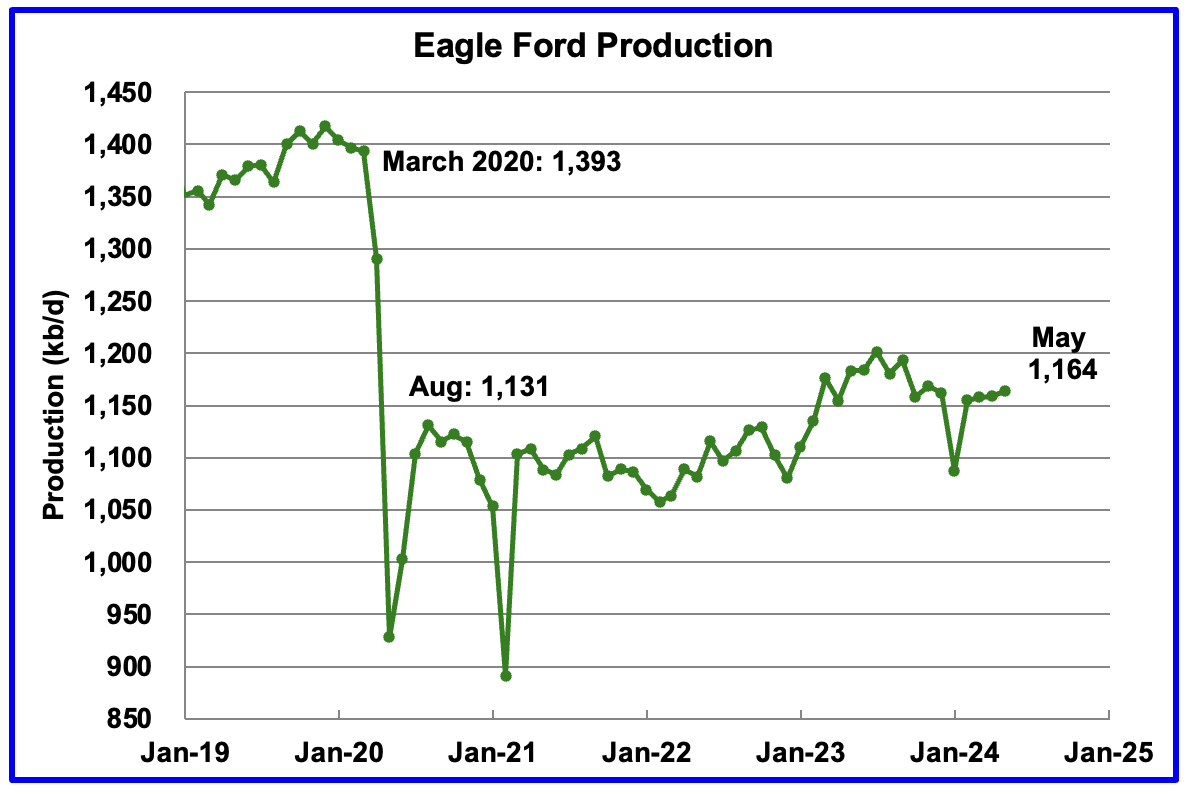
Output in the Eagle Ford basin has been on a plateau since November. The DPR’s April forecast projects May output will increase by 5 kb/d to 1,164 kb/d.
Since the beginning of 2024, the Eagle Ford rig count has been close to 47 ± 2 rigs. The current rig count is 47 which may account for its relatively flat output.
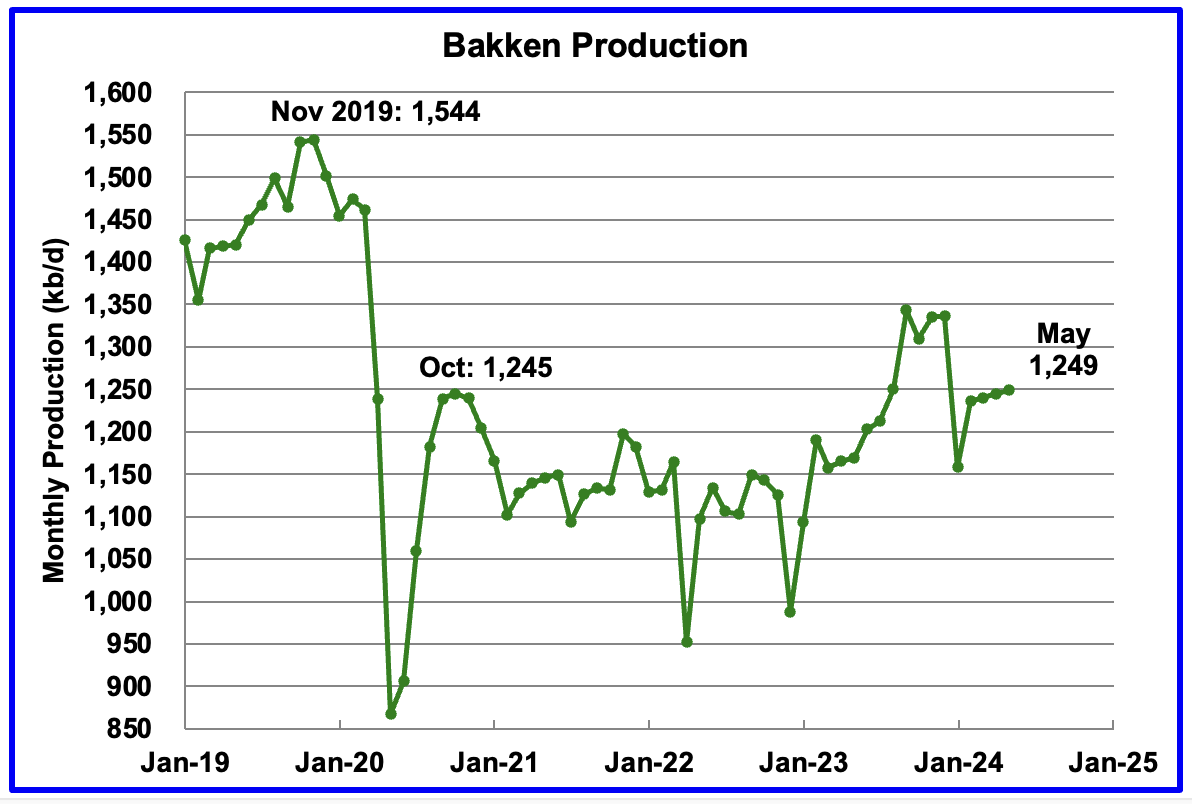
The DPR forecasts Bakken output in May will be 1,249 kb/d, 4 kb/d higher than April. May 2024 production has now exceeded the 1,245 kb/d produced in October 2020 by 4 kb/d.
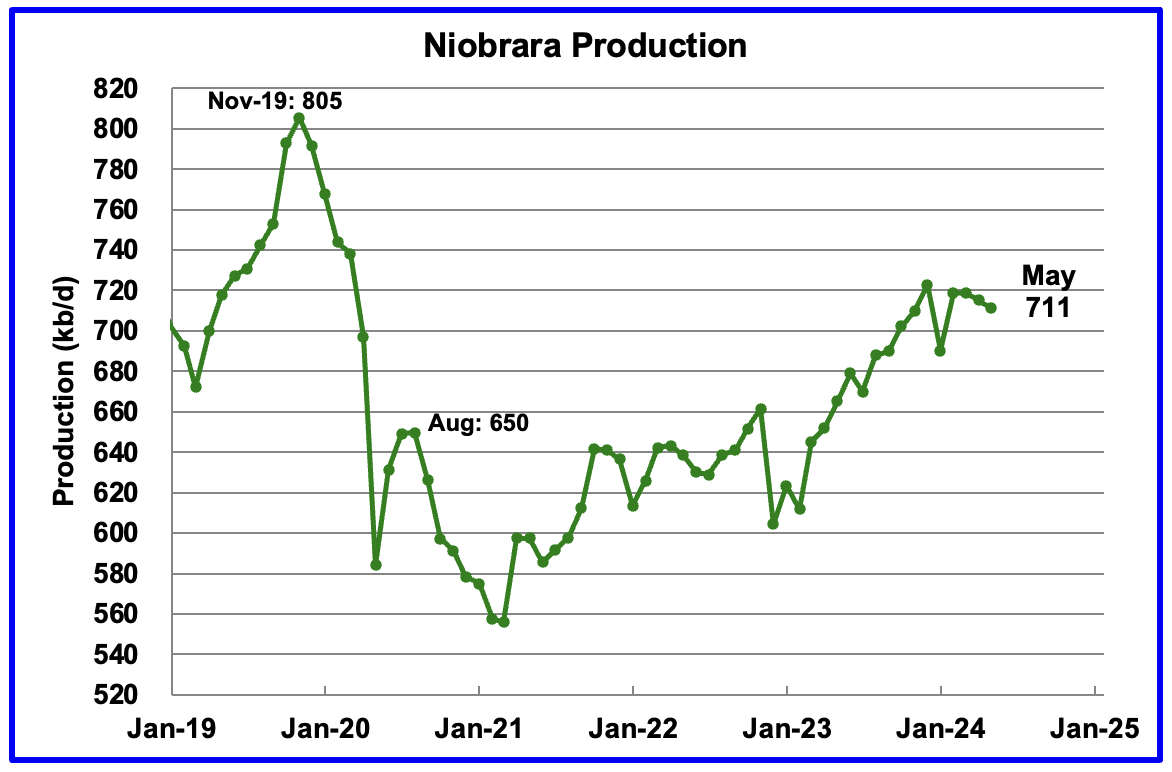
Output growth in the Niobrara continues to slow and may have turned into a slow declining phase. May’s output decreased by 4 kb/d to 711 kb/d.
DUCs and Drilled Wells
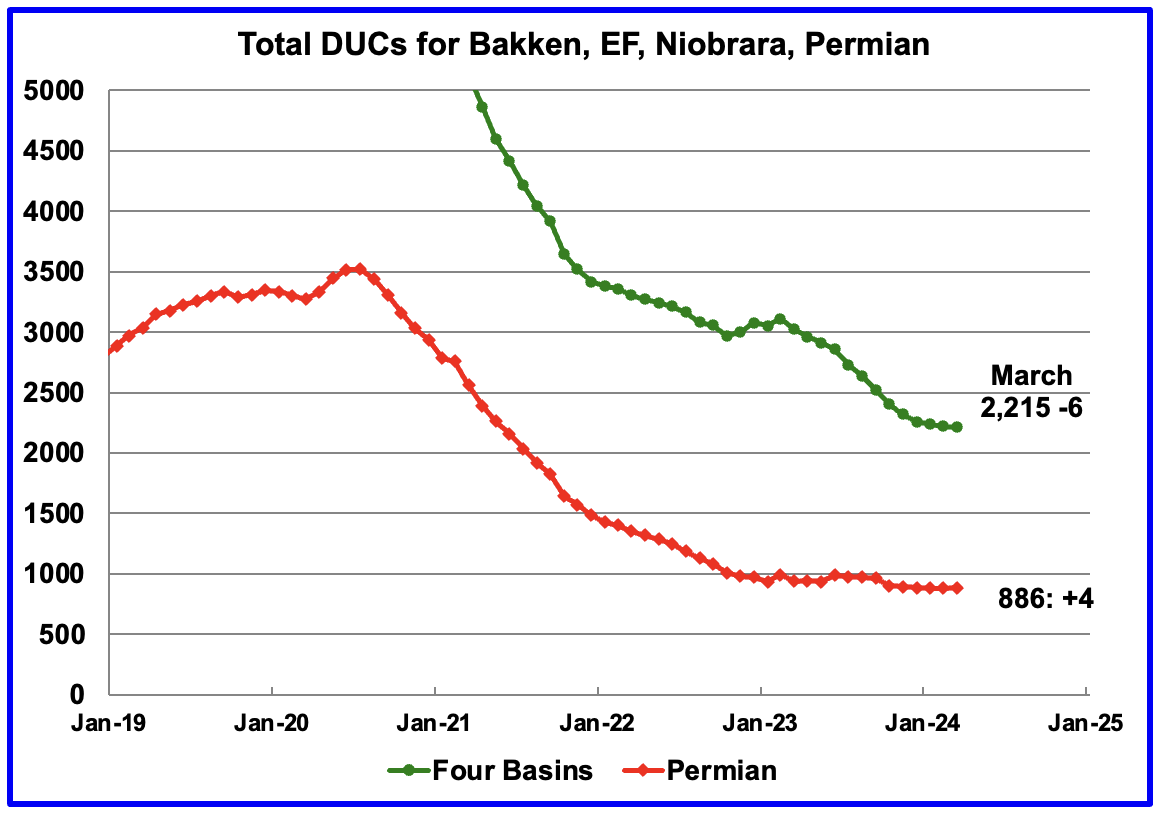
The number of DUCs available for completion in the Permian and the four major DPR oil basins has fallen every month since July 2020. March DUCs decreased by 6 to 2,215. In the Permian, the DUC count increased by 4, a rare event.
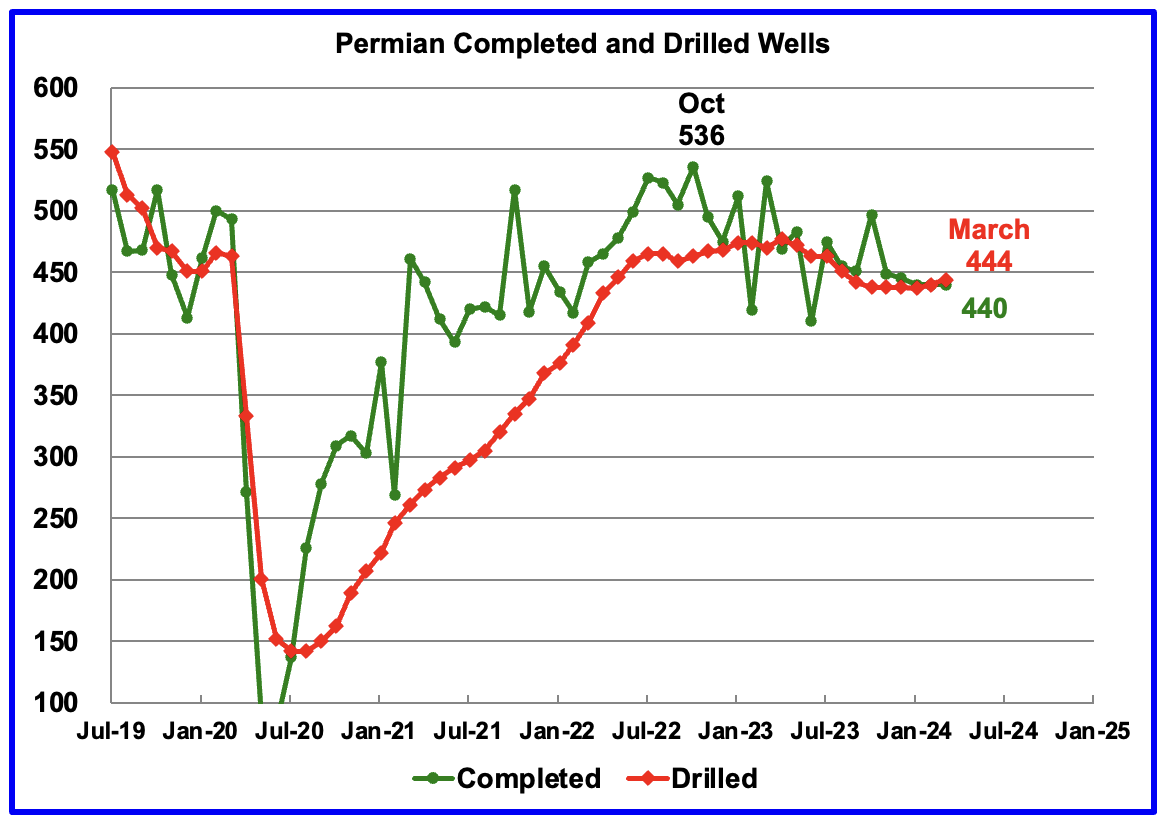
In the Permian, the monthly completion and drilling rates have been both stabilizing in the 440 to 445 range over the last six months.
In March 2024, 440 wells were completed while 445 new wells were drilled. This is the first month in almost a year where the number of wells drilled exceeded the completions.
Rig and Frac Spread Report.
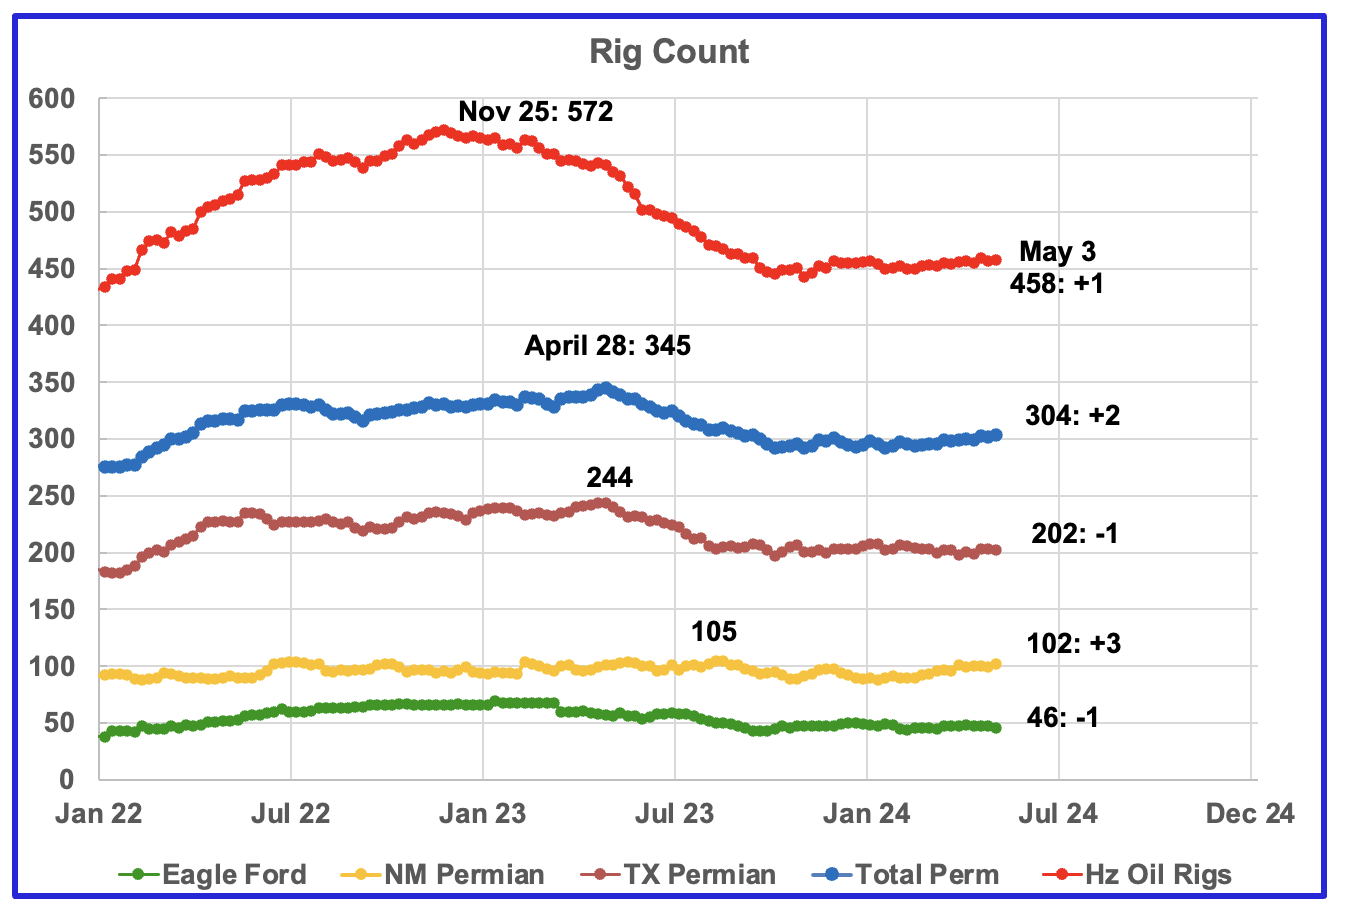
The Rig report for the week ending May 3.
- US Hz oil rigs increased by 1 to 458. The rig count has been slowly increasing since November 3, 2023 when it was 443 and is up 15 since then.
- Permian rigs added 2 to 304 and also have been slowly increasing since November 2023.
- Texas Permian was down 1 to 202 while NM was up 3 to 102. In New Mexico, Lea county added 2 to 49 while Eddy added 1 to 53. In Texas Martin was rose 4 to 37 and Midland was unchanged at 22
- Eagle Ford dropped 1 to 46
- NG Hz rigs were down 1 to 91. (Not shown)
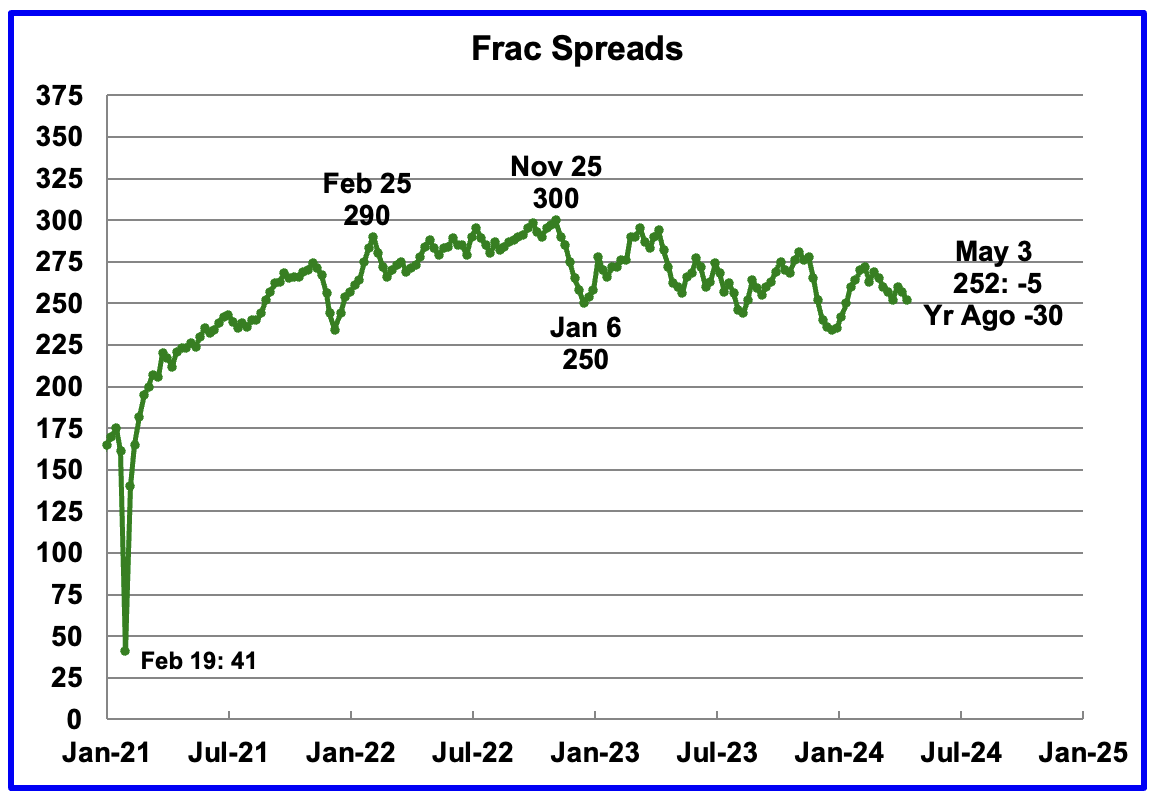
Frac Spread report for the week ending May 3.
The frac spread count was down 5 to 252 and is down 30 from one year ago. How high will the Frac count go in 2024? The chart continues to indicate the frac spread count will bounce between 250 and 275 going forward.
New Fracking Technology
According to this article “New technology helps US shale oil industry start to rebuild well productivity“
Simul-fracking is helping to reduce the cost of fracking but it requires many wells to be drilled up front and this requires a lot of funding the large companies can afford but smaller ones can’t.
“While overall output is at record levels, the amount of oil recovered per foot drilled in the Permian Basin of Texas, the main U.S. shale formation, fell 15% from 2020 to 2023, putting it on par with a decade ago, according to energy researcher Enverus.”
“Two decades of drilling wells relatively close together, resulting in hundreds of thousands of wells, have interfered with underground pressure and made getting oil out of the ground more difficult.”
“After doubling over a decade, the amount of oil extracted from each foot drilled in the Permian shale basin has been steadily declining since 2020, Enverus says. Reduced spacing between wells is to blame.”
“Companies now can complete (frack) wells faster and cheaper,” said Betty Jiang, an oil analyst with Barclays.
“A drawback to the new simultaneous fracking technology, also called simul-frac, is that companies need to have lots of wells drilled and ready to move to the fracking phase in unison before they can proceed. Pumps inject fluids into and get oil and gas out of two or three wells at the same time, instead of just one.”
“Simul-fracking can also lower well costs by between $200,000-$400,000, or 5%-10% apiece, said Thomas Jacob, senior vice president of supply chain at researcher Rystad Energy estimates.”
“But the biggest shale producers have committed to using oil revenue to finance shareholder returns rather than drilling expansion. Two of the biggest shale oil operators, Exxon and Chevron, have missed targets for Permian production in the past years.“
“Exxon said its own new fracking technology will allow it to extract an extra 700,000 barrels of oil equivalent per day (boepd) from Pioneer’s assets by 2027, tripling output there to 2 million boepd.”
46 responses to “US February Oil Production Rebounds”
Thanks Ovi – Interesting article about the near term Permian peak:
Alarming Trend (I’d say it echos a lot of the discussion here)
https://seekingalpha.com/article/4688683-an-alarming-trend-is-developing-in-us-shale-oil-production
Kangeo
One of the issues with gassier counties is knowing what to plot.
Attached is a chart for Reeves county which has a lot of Gas wells. The green graph is total gas divided by C plus C.
The orange graph is oil well gas divided by oil well crude. Both charts are indicating that Reeves county is heading towards the bubble point. Which one is more relevant. In NoviLabs, January update, Enno posts a GOR chart. Not sure what variables are in the ratio.
Ovi,
Pretty sure Enno uses C C (from all wells) for “oil” and total gas (associated with oil production and gas from gas wells) for “Gas” in his oil and gas ratio. More similar to your green plot.
Dennis
Using total gas is not the best way to do things if the objective is to determine if the oil wells are peaking. NM only gives oil and gas, no disaggregation into oil wells and gas wells.
Ovi,
I disagree, the oil and gas wells are together in the same counties you are analyzing and often what is classified as a gas well and what is classified as an oil well is determined by the GOR, essentially it is an artificial distinction, most wells produce both oil and gas. New Mexico does this correctly and to compare the Texas data to the New Mexico data on an apples to apples basis, one would be wise to follow the New Mexico model in my view. Use crude plus condensate for Oil and Gas from both oil and Gas wells for Gas output.
Perhaps Enno’s thinking is similar and he may want to keep the data comparisons consistent. Also for EIA data you will notice that there is no Oil from oil wells category, all the oil and condensate from all oil and gas wells is lumped together as C plus C.
The peak will be determined by the rate of completion and the economics. The falling level of Appalachian output and more pipeline capacity to LNG export terminal and perhaps completion of more LNG export capacity may lead to higher natural gas prices which may make Permian output more profitable. If profits are higher more wells will be completed each month and output may continue to rise.
My very conservative scenarios for the Permian basin assume that the completion rate remains at about the 2023 level, even with an assumed decrease in new well productivity of about 4% per year, output continues to rise until 2026 (but quite slowly increasing from 5719 kb/d in March 2024 to 5912 kb/d in Sept 2026, which is the peak for this scenario). I doubt that output is much lower than this scenario (this would be an F90 scenario). Chart in next comment below.
Permian scenario
Reeves County using Novilabs data Jan 2021 to December 2023
RRC Reeves Data up February
Similar
Ovi,
Yes fairly similar, though data after December 2023 is likely not very accurate. Even the data from March 2023 to December 2023 may not be accurate, but the most recent data is the furthest from being correct (as you clearly know, but some readers may not be aware). Also the Novilabs data focuses on horizontal tight oil wells, the RRC data includes all production (though most output currently in Reeves county is tight oil from horizontal wells, so this may not affect the data much),
Dennis
I hear you but NoviLabs is showing 435 kb/d for January while NM is showing 408. Somehow NoviLabs has more up to date info.
Ovi,
Not clear why that is, but Enno Peters is very good, there might be some data out there we are not aware of, also he may have access to Enverus data and perhaps some proprietary data from producers, my guess id that the Novi data is about as good as it gets, but the most recent few months are probably less than perfect.
For some reason I get a different result for NM for Novilabs in Jan 2024, 1762 kb/d for Permian basin NM.
https://public.tableau.com/shared/BK6MJ9CRN?:toolbar=n&:display_count=n&:origin=viz_share_link&:embed=y
Ovi and Dennis,
I don’t think proprietary production data in Texas is legally possible. All operators are legally obligated to report their accurate production data to the Texas RRC.
So, Novilabs is just using Texas RRC data, just like Enverus uses. They all do a massive data dump every month. The operators can’t legally give out different proprietary production data to folks at Novilabs, otherwise they would be in violation of many laws. If Novilabs wants to spin the public Texas RRC data through their proprietary AI algos, go for it, but the real raw data is best and available free from the Texas RRC. Or, recycled in a pretty good format on Enverus. But all the same data.
There are no proprietary production data sources for Texas, just the Texas RRC.
Dennis
What I put up was Reeves county. I mistakenly said that data was from New Mexico govt. My bad.
Gungagalonga,
Not sure there is anything illegal about sharing data, you are correct that operators give their data to the RRC, eventually, though the data often comes in 12 to 18 months after the fact. One place that the RRC falls down is it reports output only at the lease level and often there are many wells on a single lease. Novilabs supposedly get the individual well data from some of the operators and can check their algorithms for accuracy and likely can improve upon them useing such data. It is also possible the data can be processed in a more timely manner by Novilabs than by a government bureaucracy.
There is also data from the pending lease file which can be used to fill in data.
Ovi,
Enno may be using the pending lease file, but that file only defines things to the district level, so not clear why the RRC data is different from Novilabs. Enno may use past data on the percentage of output from various counties that make up a district to estimate county output from pending leases, or that is how I would do it, he may have a better method as he scrapes a lot of the data from the RRC and may be able to figure out which pending lease data belongs in which county, perhaps by looking up well numbers and permit data.
If we look at the percentage of district 8 output from Reeves in Jan 2024 it was 13.8%, if we assume the pending lease output in district 8 from Reeves county was also 13.8% we get 57 kb/d of pending lease output from Reeves county. If we add that to the 408 kb/d reported in the PDQ we get 465 kb/d which is higher than reported by Novilabs. So they use a more sophisticated approach or there may be 30 kb/d of conventional output (and tight output from vertical wells) that I have not accounted for.
Dennis, my point was that the operators would not sell or give out production data to a private entity that is different than what they report to the TX RRC. If the data is reported differently to the TX RRC vs. Novilabs, then it exposes the operator to all kinds of scrutiny, lease violations, lawsuits and fines, etc…. would be chaos and not worth the risk to the operator. This is the “illegal” part.
If Novilabs gets the same TX RRC data and then massages it somehow to make it project in a proprietary way, so be it. But Novilabs is also subject to the same lag times and revisions as reported to the TX RRC as there is only one stream of initial data… operator to TX RRC. Then it spreads out to all the data users to explore.
Novilabs may have select sampling operator partners to test projections with, which is fine and may help with their accuracy, but they start with the same data as everyone else.
Gungagalonga,
There is the pending lease file which has production reported for leases that have not yet been assigned a number by the RRC, only leases with a lease ID # are reported in the PDQ from the RRC. Note that it takes time for reports to filter through to the PDQ part of the website, if the same data was reported to Novilabs and the RRC by an operator, it is very likely that Novilabs would process the reported data far more quickly than the RRC and we would see it sooner, especially those that subscribe to the service.
If you download a statewide PDQ now and save it on your computer and then do the same in 6 months and compare, you will see the data filters through the RRC bureaucracy very slowly. Eventually the data is complete, but it takes about 18 months.
My point is simply that the availability of reported data on public websites will be different, in some places it will be reported more quickly than others. That is part of the reason that people are willing to pay for the data.
Dennis,
Assuming Novi received the raw data at the same time as the RRC, perhaps they could process a bit quicker than the Texas RRC, I agree. Novi probably presents the data better too. But what’s the point? Novi would still be subject to the same lag time for revisions and late data. Yes, you can assume an average typical revision/late reporting projection and get close. I used to attempt to model this at a previous position on the financial side of energy… we kept tract of the near months RRC revisions over time and logged in all iterations over time to get a pattern. Sometimes we were close on projections, other times the RRC surprised us and went rogue. Hardly useful for commodity trading!
Not sure where this discussion is going, which is likely my fault. My original point was simply that Novi is subject to the data as reported to The TX RRC as operators are obligated to report volumes in a timely and accurate manner to the RRC. I can’t see how Novi has proprietary data from every Texas lease, they likely don’t have the scale. Novi and Enverus wait in line to receive their raw data from the RRC, but may handle the data better. I subscribe to Enverus/DI, but have never used Novi since I have no use for it in my business, so you likely have more wisdom here.
Thanks
Gungagalonga,
The only important point is that the pending lease file will give additional insight, also the EIA estimates based on 914 survey data (data comes directly from producers with about 90% of total Texas output) and an estimate of the remaining 10% of output is surprisingly accurate. So in my view that is the best approach to estimating Texas output. To estimate Texas Permian output simply take the percentage of district 7C, 8, and 8A output to statewide output and multiply by EIA estimate, that will include some conventional output, the Novilabs data can then be used to sort out the percentage of conventional oil and vertical well tight oil output.
Basically the Novilabs estimate is the best I have access to, I do not have access to Enverus data.
As to how timely and accurate the data is reported to the RRC is not known by me, I only see what data the RRC provides and the PDQ data is not very good and the pending lease file is difficult to work with, though if I were proficient with SQL or other database applications it might be less of an issue.
Enno Peters is an expert software engineer, I am not.
Dennis.
I read the discussion regarding RRC data.
Crude oil purchasers sell their data to IHS Global, etc., who then sell the data to others (like our company).
Our oil sold during the month of April will be posted by IHS Global in June, so very timely.
It is sales data, which differs from production data, but should smooth out over time.
Doesn’t Enno Peters use a lot of algorithms in his work? I think he is constantly making adjustments, so his data ahead of RRC official data is very close.
He may incorporate the sales data in this? I’m just speculating.
I do know years ago I compared his data to IHS Global data we paid for and he was spot on. That was 2015-18. I suspect he’s gotten even better as time has went by.
Thanks Shallow sand. I don’t know the details of Enno Peters methodology, but he may incorporate sales data. I agree his estimates are quite good, when I look back at earlier estimates and compare with the most up to data I have available there is a small adjustment to the most recent 6 months of data reported in the older reports, but as I said earlier this is probably the best tight oil focused data available IMHO.
This is my response to your comment on oilystuff.com.
As an actual P-5 verified opertor in Texas for over 50 years, your comments about the Texas Railroad Commission, its production reporting (now corrected 90% in 90-120 days) is grossly inaccuarate, extremely bias and a disservice to people who read social media for real information. Novi is no longer run by its originator and is just another data-sell company trying to keep the party going. Its AI and ML learning dung heap is algo created and subject to great bias; neither it, nor the EIA, or DPR, or NCAA, or PETA, have any insights into oil and gas that the State of Texas does not completely resolve over time.
Only the State of Texas knows its oil and gas depositions; if you can’t wait for that to occur I suggest something like pickle ball.
https://www.oilystuff.com/forumstuff/forum-stuff/chevy-in-eddy/dl-ec02890d-39ae-4d22-b5e5-fab2b0d4e4c5?postId=663416f86378bd0010a0a26e
Mike,
the link you posted goes nowhere, 90% is not very good after 120 days. As I understand it Enno Peters still works at Novilabs and does excellent work. He wrote the Permian Blog post on April 26, 2024.
In that post he says:
The current level of drilling & completion activity should be enough to further expand the production capacity of the Permian Basin, all else being equal:
The very simple supply projection assumes current levels of completion rates and average new well productivity continue from March 2024 to December 2029, clearly neither assumption will be correct. Any scenario of future output is certain to use incorrect assumptions.
As far as the poor estimates of the EIA the chart below uses the Texas 914 estimate from
https://www.eia.gov/petroleum/production/xls/comp-stat-oil.xlsx
and compares with PDQ data from the RRC from Jan 2015 to December 2022. Note that the EIA actually underestimates RRC output especially in 2022, but mostly the estimates are pretty good, this is simply the fact of the matter. Note that this is not the EIA final estimate (which uses RRC data after about 22 months in the most recent compstat spreadsheet) it is the initial monthly 914 estimate based on the 914 survey and an estimate of the remaining 10% of output not covered by the 914 survey.
A simple way to compare the RRC and EIA data over this period is to take the sum of each. The EIA sum is about 99.89% of the RRC sum from Jan 2015 to December 2022.
Also it is quite difficult to extract the tight oil data from the RRC, Enno Peters does an excellent job of that in my view, also it is not easy to figure out the well profiles for multiwell leases as the output is reported by lease rather than by well. A sophisticated software engineer like Mr Peters is able to sort that out and present the data in a very usable fashion which is impressive.
Don’t some producers share their data with IHS as Shallow Sand stated? Isn’t there a pending lease file which a good software engineer could incorporate with the PDQ data to get a more up to date estimate?
Dennis.
To clarify, our crude oil purchasers sell data to IHS and others. We, as operator, don’t.
That’s our experience. Cannot speak for others.
Shallow sand,
Thank you for the correction, purchasers share the data, as you stated earlier this is not the same as producers, though when all the purchases are added up it should be fairly close to the oil produced (there could be some stock changes which would account for small differences).
Ovi,
Check out pending lease file, you can get a bit more up to date data for Texas statewide by adding this to PDQ data.
https://rrc.texas.gov/resource-center/research/data-sets-available-for-download/
See “Production Report for Pending Leases” under “Production data” at page linked above. You want to filter out the “is deleted” column data that has the “Y” flag so you don’t double count data that is already in the PDQ (leases that now have a Lease ID# assigned and are now no longer “pending” leases.) Enno Peters may use this data to get a better Texas estimate (though this is a guess on my part.)
As a Novilabs subscriber, let me weigh in on Novi’s proprietary data
Producers do keep track of individual well production but it is aggregated by lease when it is reported to the RRC. This is the operators’s proprietary infomation.
Novi has negotiated an arrangement with “some but not all” operators to obtain access to individual well production records.
These records/production data is used to improve Novilabs algorithms to directly report individual well production and to “smooth out” the production type curves and data for operators that do not share individual well production data.
These companies perceive their production data to be a competitive advantage.
I know from inquiries made to Novilabs that EOG and Mewbourne do not share production data with Novilabs.
I hope this helps the discussion
Made a comment on the non oil thread that was marked as spam. Just wanted to see if this comment would also be marked as spam.
Permian Basin estimates from Drilling Productivity Report (DPR, includes tight and conventional oil from Permian Basin Region), from Official EIA tight Oil estimate (Permian estimate includes only Spraberry, Wolfcamp, and Bonespring Formations), and the Permian tight oil estimate from Novilabs through December 2023 (includes only tight oil output from horizontal wells that started producing after 2000). In my view the Novilabs estimate is likely to be closest to actual Permian basin tight oil output. For December 2023 the Novilabs estimate for Permian horizontal well tight oil output is 5700 kb/d, output in December 2021 was 4581 kb/d. Data presented in Chart below is from March 2021 to December 2023.
The estimate below uses state data from TX RRC and NM OCD and the EIA 914 estimate for Texas and New Mexico to estimate Permian region output. This estimate is compared with the Novilabs Permian estimate where we find an average difference of 502 kb/d over the June 2020 to May 2023 period between the state data for the Permian region and the Novilabs Permian tight oil estimate. This 502 kb/d estimate represents conventional and vertical well tight oil output from the Permian region and also output from wells that started producing before 2001 in the Permian region (RRC Districts 7C, 8, and 8A). I assume the conventional and vertical tight oil output remains at the 502 kb/d level from March 2021 to December 2023 and subtract this amount from my Permian region estimate to arrive at the Permian tight oil estimate presented below. The red diamonds are my estimate and the blue line is the Novilabs Permian estimate presented for comparison. The data presented below starts in March 2021 and ends December 2023.
The price for natural gas in the Permian is around -$2.72. That’s a negative. The rising gas oil ratio is coming at a time of lower gas demand and pipeline maintenance. I can’t imagine this, along with a deteriorating price for WTI over the last few weeks, is doing much good for horizontal well economics. If we are going to have increasing quantities of natural gas over the next 5-10 years from these tight oil plays it’s hard to imagine the gas price situation will improve dramatically. I guess that’s the desire to export it. Of course all that liquefaction infrastructure will last a long time and these tight oil plays will likely be ghost towns within a decade leaving a lot of stranded assets.
https://oilprice.com/Latest-Energy-News/World-News/US-Power-and-NatGas-Prices-Plummet-to-Below-Zero.html
Stephen,
Large producers may have contracts with pipeline operators, EOG sold its natural gas at an average price of $2.10/MCF in the first quarter of 2024 according to the 10Q. NGL was sold at an average price of $24.32 per barrel and oil at $78.46/bo for 2024Q1.
See page 23 of link below
https://filecache.investorroom.com/mr5ir_eogresources2/332/2024 03.31 10-Q.pdf
Occidental Average Prices for 2024Q1
NG=$1.61/MCF
NGL=$21.17/b
Oil=$75.54/bo
Diamondback average prices for 2024Q1
NG=$0.99/MCF
NGL=$21.26
Oil=$75.06
see page 36 at link below
https://www.diamondbackenergy.com/static-files/657b3a69-373a-4a99-aaf2-73dc3f533bc8
Devon Energy average price (unhedged) 2024Q1
NG=$1.30/MCF
NGL=$20.81/b
Oil=$75.40/bo
See page 24 at link below
https://d18rn0p25nwr6d.cloudfront.net/CIK-0001090012/ea2ef245-d32b-41ca-81f8-8edcc3eca791.pdf
For XOM (merged with Pioneer) for 2024Q1 US upstream
NG=$2.22/MCF
Oil=$74.96
(they do not break out price for NGL)
see page 4 of link below
https://d1io3yog0oux5.cloudfront.net/_78625fd669a00aa37b1285d9b3404898/exxonmobil/db/2288/22249/supplement/1Q24 Supplement Website.pdf
Eventually more pipelines will be built to move the gas, there is a risk of stranded assets if the LNG facilities are overbuilt.
Interesting, good for them. But someone is losing money somewhere. The last thing you want is the pipeline operators to go bankrupt or the party will be over for sure.
Stephen,
The price for natural gas becomes negative when there is not enough pipeline capacity to move the natural gas so the operators are essentially paying someone to store the gas. Probably smaller producers are getting stuck with gas that has no place to go and they will cut back on starting new wells and perhaps shut in some production if that is what makes sense financially. It is a rough business during the shoulder season when there is less demand for energy.
Using the average of these prices in comment above and assuming the average 2024 well is a bit less productive than the average 2022 well (EUR=425 kbo over 177 months, with 166 kb NGL and 2002 MMCF of NG over that period of 15 years) The cumulative net revenue over 36 months is 10.95 million and reaches 12.1 million at 48 months and 13 million at 60 months. At a 10% annual discount rate the discounted net revenue reaches 13 million at 112 months. At 177 months cumulative net revenue is $15.8 million and cumulative discounted net revenue is $13.3 million.
At these prices this is not a very profitable venture.
Average realized prices for Permian producers are:
NG=$1.64/MCF
NGL=$21.89
Oil=$75.88
Like you suggest, the bigger players have probably negotiated better deals and are sitting on better acreage, and are coming out alright. But marginal producers have to be getting squeezed in this environment.
Stephen,
Yes that is why I do not expect the completion rate will rise and at these prices evn the scenario below may be optimistic because a fall in the completion rate might be a more reasonable scenario (the scenario below assumes the completion rate remains at about the 2023 average level until 2029 and then starts to fall.
The scenario below assumes the completion rate falls by 1 well per month starting in Jan 2024 and increases to 3 per month at the end of 2032. Peak is in mid 2025 at about 5800 kb/d for this scenario and URR=43 Gb with 113 thousand total wells completed (at the end of 2023 about 49 thousand tight oil wells have been completed in the Permian basin and in mid 2025 for this scenario it will be about 55.5 thousand wells completed).
For this scenario over Dec 2023 to June 2025 period the average annual rate of increase in output is about 67 kb/d.
Click on chart to zoom in.
Scenario (red dotted line) after December 2023 has Permian output growing more slowly. (At an average annual rate of about 80 kb/d over the next 2.5 years). Peak is about 5900 kb/d in mid 2026.
The rate of growth slows from 567 kb/d per year from March 2021 to December 2023 to 80 kb/d per year over the next 2.5 years which is about a 7 times lower annual rate of growth than the previous 2.75 years.
Gasoline demand in US falls to pandemic levels.
https://oilprice.com/Latest-Energy-News/World-News/US-Gasoline-Diesel-Demand-Hit-Seasonal-Low-Not-Seen-Since-COVID.html
At sub $80 WTI, there is no call for more oil or drilling at present. Oil markets seem balanced in $80-100 range. We are tipping into a peak demand scenario, probably from the rapid uptake of EVs in China. China is far ahead of US manufacturers in EVs, even Tesla, who has completely stalled out as a company. Read this amazing essay:
https://insideevs.com/features/719015/china-is-ahead-of-west/
Two other factors may be also be moderating gasoline demand, due to decline of consumer affordability-
Inflation is widespread. Higher costs for everything not called gasoline leaves less cash in peoples budget for optional travel.
Secondly, strong us dollar results in lower emerging market country purchasing power.
Real Gasoline prices in 2015 US$ for US.
For real median income see
https://fred.stlouisfed.org/series/MEPAINUSA672N
https://www.reuters.com/world/europe/ukraine-drone-hits-russian-oil-facility-record-1500-km-away-source-says-2024-05-09/
Ukraine hit Russian oil facility 1500km deep inside Russia.
The Rig report for the week ending May 10.
– US Hz oil rigs decreased by 4 to 454. This is the first big drop, 4, in many weeks.
– Texas Permian was down 2 to 200 while NM was unchanged at 102.
– In New Mexico, Lea and Eddy counties were unchanged at 49 and 53 respectively. In Texas Martin dropped 3 to 35 and Midland dropped 1 to 21
– Eagle Ford added 2 to 48
– NG Hz rigs were unchanged at 93. (Not shown)
Moving rigs from the Permian to the Eagle Ford. That’s interesting!
Frac Spread report for the week ending May 10.
The frac spread count increased by 6 to 258 and is down 14 from one year ago. The chart continues to indicate the frac spread count is range bound between 250 and 275 going forward.
A new update to World and Non-OPEC oil production has been posted.
https://peakoilbarrel.com/january-non-opec-and-world-oil-production-big-drop/
A new open thread Non-Petroleum has been posted.
https://peakoilbarrel.com/open-thread-non-petroleum-may-11-2023-2/