All September Non-OPEC Oil Production Increase from US

A Guest Post by Ovi

Below are a number of Crude plus Condensate (C + C) production charts, usually shortened to “oil”, for Non-OPEC countries. The charts are created from data provided by the EIA’s International Energy Statistics and are updated to September 2022. This is the latest and most detailed world oil production information available. Information from other sources such as OPEC, the STEO and country specific sites such as Russia, Brazil, Norway and China is used to provide a short term outlook for future output and direction for a few countries and the world. The US report has an expanded view beyond production by adding rig and frac charts.

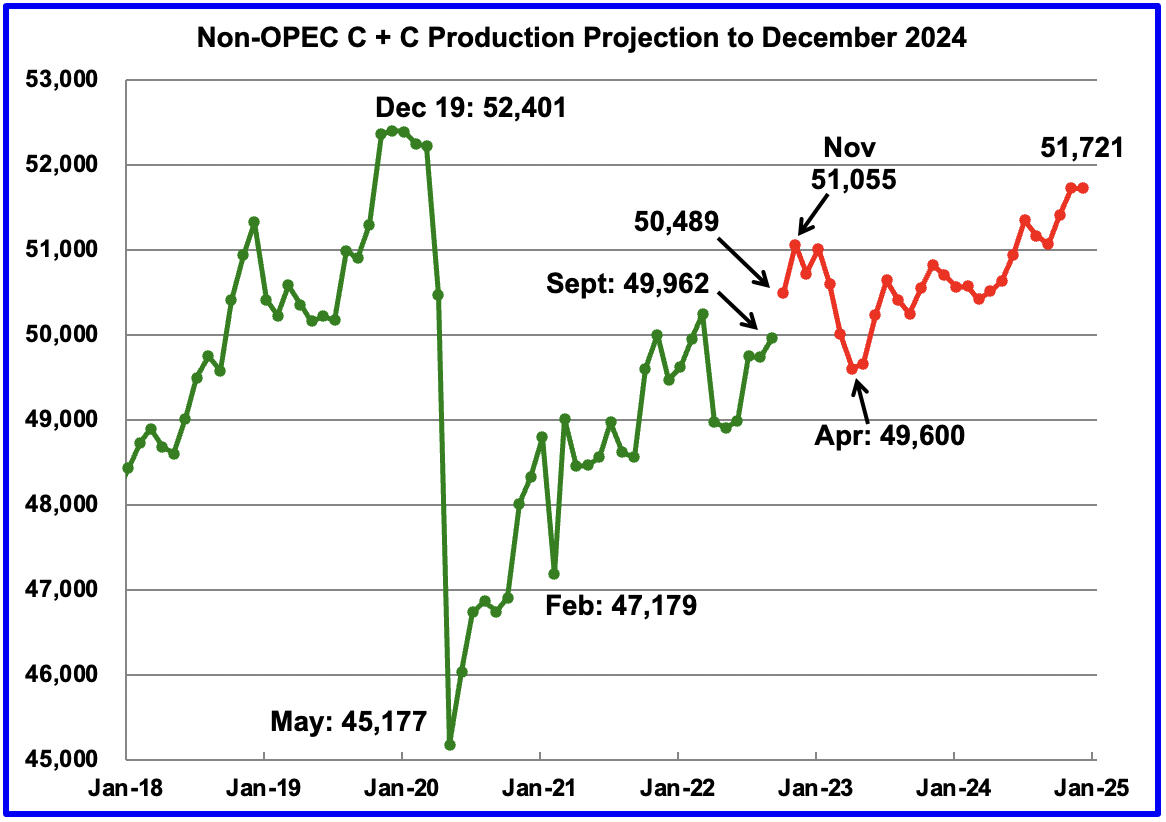
September Non-OPEC oil production increased by 229 kb/d to 49,962 kb/d. All of the increase came from the US, 289 kb/d. The largest offsetting decrease came from Norway 144 kb/d. Note that August output was revised down from 49,879 to 49,733 kb/d. This means that the September increase relative to the original August estimate is 83 kb/d.

October is expected to add 527 kb/d. This appears to be optimistic based on a few country charts below which project October production. Brazil +97 kb/d, Canada -600 kb/d, Kazakhstan +235 kb/d, Norway +100 kb/d and Russia +124 kb/d for a net of -44 kb/d. Maybe the EIA is not aware of the Canadian drop in October. The positive increments add 556 kb/d.

Read More

UK North Sea Summary Part II: Reserves, Recent Production and Future Projections

A Guest Post by George Kaplan

Reserves

The OGA issues UK oil and gas reserve values each year, but only in total, not for individual fields as is done in Norway, Mexico, GoM and Brazil (which reports by basin rather than field). The reserves are not backdated to discovery date so it’s not possible to generate anything like a true creaming curve, but they are split into categories of proved, probable and possible, and, since 2015, contingencies. Operators in the UK North Sea have up to five years to announce estimated resources in discoveries so there may be uncertainties for recent years, unlike in the Norwegian section where estimate must be declared as soon as they are known.

Read More

UK North Sea Summary Part I: Licensing, Drilling, Discoveries and Development

A Guest Post by George Kaplan

Discoveries and Development

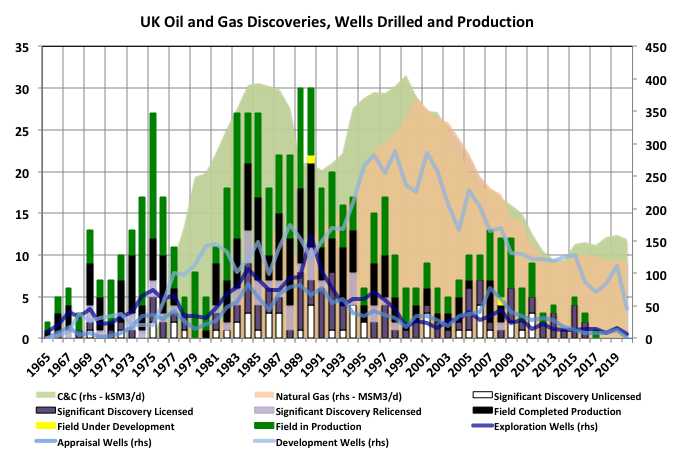
The global peak in oil and gas production for UK occurred in 1999 and 2000, probably delayed by four or five years by the Piper Alpha tragedy, and will not be approached, far less exceeded, again. There have been two other local peaks, each one preceded by about ten to twelve years by a local peak in the number of discoveries. The UK Oil and Gas Authority does not publish individual field resources, but it’s a fair bet that the large fields were discovered early on and most of the recent discoveries are small, near field tie-ins.

Read More

UK Offshore Production: Summary for First Quarter 2018

A Guest Post by George Kaplan

UK C&C

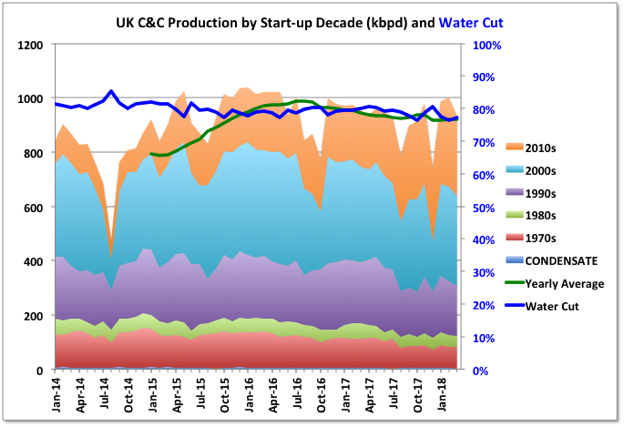
It was expected by many, me included but more importantly UKOGA and a couple of the bigger oil and gas consultancies, that UK offshore oil production would increase significantly from 2017 to exceed 1000 kbpd for the yearly average in 2018. So far this is proving a bit of a challenge. March production was 934 kbpd, down 7% m-o-m and 2% y-o-y (but up 0.8% for the first quarter compared with 2017). It’s possible that some fields have not reported but those showing zero for the month are not big producers. The biggest single field drop came from Clair but most fields saw declines, even the newer ones. Jodi data indicates there will be a rise shown for April to slightly above 1000 kbpd and then a fall back to around March numbers in May (note edit based on July Jodi data); there is usually a summer dip because of maintenance shutdowns (plus this year some strikes at Total platforms will impact).

chart/

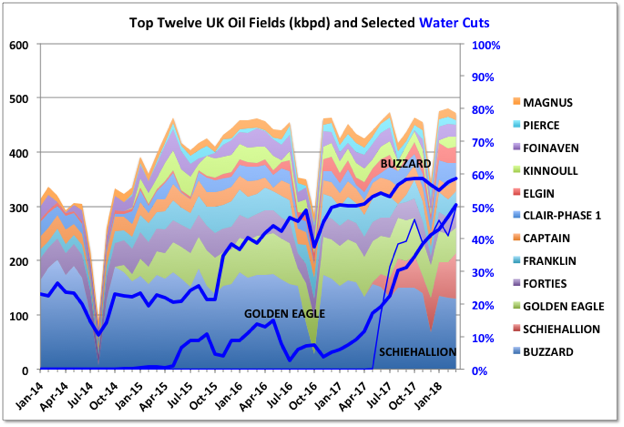
Two of the largest oil producers, Buzzard and the Golden Eagle Area Development, both operated by Nexen, have started accelerated decline following increasing water breakthrough (especially noticeable in GEAD over the past year). The newest large field is Scheihallion. This is a redevelopment with its neighbouring field, Loyal, through the Glen Lyon FPSO (also called the Quad 204 project), which was started last year. So far the combined decline in Buzzard and GEAD is almost matching growth in Scheihallion.

The Clair Ridge platforms, which will also exploit the remaining heavy oil in the Clair field, were installed last year but there have been multiple delays and production is not now expected until later this year. Once it is ramped up, which could take three or four years despite it having some predrilled wells, the project will be the largest producer at 100 to 120 mmbpd and has an eight year plateau, while Scheihallion/Loyal will plateau and decline quickly.

chart/
Read More

Norway Production, 2017 Summary and Projections

A Guest Post by George Kaplan

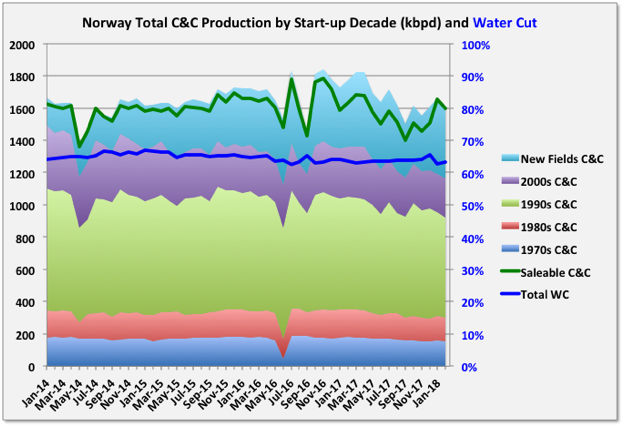
Average annual Norwegian wellhead C&C production dropped 1.5% in 2017, from 1709 kbpd (625 mmbbls total) to 1682 kbpd (614 mmbbls total). Wellhead gas (which includes fuel gas, flaring and gas injection) rose 2.6% from 2805 kboed to 2878 kboed. Exit rates were down 9% for oil andt 4% for gas, some of which was due to the Forties pipeline failure in December, but the decline appears to have continued in the first quarter of 2018.

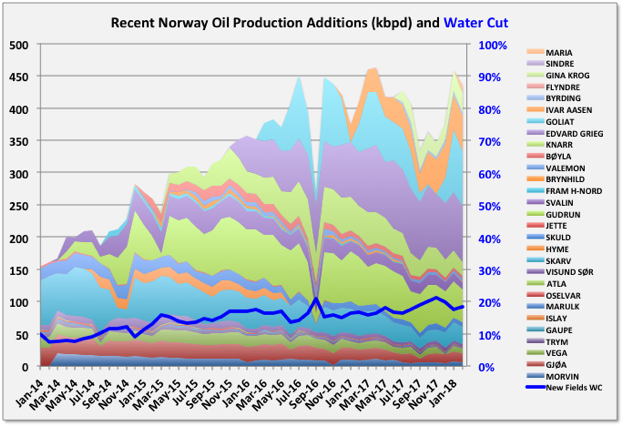
Three small projects, Flyndre, Sindre and Birding, and two larger ones Gina Krog and Maria, came online. Sindre appears already to be exhausted. Flyndre is shared with UK and is declining fast. Gina Krog, discovered in 1974, is a tie back via a wellhead platform to Sleipner with nominal nameplate capacity of 60 kboed (split about evenly between oil and gas), and Maria is an oil tie-back to the Kristin semi-sub, but with water injection supplied from Heidrun, with 40 kbpd nameplate and is still ramping up after first production in December.

Norway C&C

The data shown in the charts is through February, but the NPD figures for this year have not been as complete or unequivocal as usual, so should be considered accordingly. A number of fields have no reported wellhead figures for January or February, though they do have sales reported (to fill the gaps I have prorated from these numbers based on previous complete monthly data). Additionally it looks for some reason that the sales figures for 2017 have all been doubled and the numbers for NGL are being switched from reporting in Te/d to m3/d, so there’s a bit of uncertainty.
chart/

Troll

Troll, started in 1990, is by far the largest gas producer but also, currently, the largest oil producer, at around 150 kbpd, which has been kept steady for several years. The oil comes from a thin oil rim, produced from long, horizontal wells that are being continually drilled. The oil has to be produced before the gas cap can be blown down. R/P for the oil is about two and a half years, and the contract for Troll Phase 3, the gas reserves over the oil rim, was awarded this January with production expected in the second half of 2021. This would suggest the oil production will be kept high, and then start to drop quickly through 2020. Troll gas current reserves are almost half depleted and with an R/P of over twenty years, but the approved production rate has recently been increased to make up for declines in other fields, and this may continue.

The original development plan by Shell for Troll was to ignore the oil as they did not think it could be developed economically, mainly because it would have required hundreds of vertical wells; this was rejected by the Norwegian Petroleum Directorate. Short horizontal wells had previously been drilled in USSR (actually in the 1930s), Australia and Alaska but in the late 1980s extensive, and expensive, development for long reach, accurately placed horizontals, drilled from offshore floating rigs, was conducted by Norsk Hydro with NPD input. In the early 90s I remember Norwegian news outlets complaining that they perceived this as a waste of tax-payers money, but the effort has certainly paid off since. A similar large oil rim resource, Frigg, was not produced in an earlier gas development and was lost; by contrast Troll Oil will produce almost two billion barrels.

Statfjord

Statfjord, started in 1979, is still a large producer, at about 25 kbpd, many years after its original decommissioning date, although there are signs now of decline, which is likely to be terminal. It straddles the UK-Norway border and about 15% is owned by the UK through the local Statoil subsidiary. Interestingly at one time, by maritime law, the UK could have claimed all of the Norwegian Trench, which includes Statfjord and several other of the largest Norwegian fields, but instead agreed to a border based on the meridian line between the two countries. I think the UK oil and gas authority had been reporting UK Statfjord production as total rather than the UK share, maybe by wishful thinking, which has skewed some numbers and has only been corrected in the last few months.
chart/

The irregularity in Goliat production shows up in the curves for recent additions, but there is a clear trend for quite early and rapid decline, even among the larger developments.
Read More