A guest post by George Kaplan
EIA Liquids Reserve Estimates
This follows on from Part I, which looked at EIA reserves and revision estimates for US as a whole and the GoM, and concentrates on the on-shore tight oil and (below)gas producing regions.
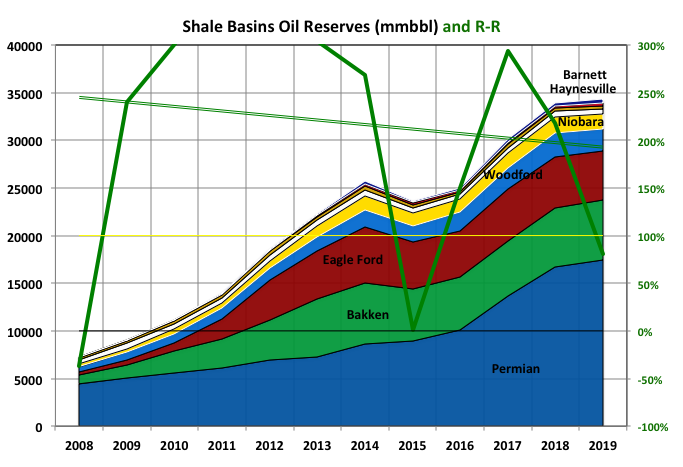
The EIA issues revision data by whole states or state districts rather than by basin, so some of the reserves and production, but a small proportion, will be from conventional reservoirs. It does give total reserves for each shale basin but not the changes, and I didn’t go to the trouble of pro-rating everything against that. Its data only goes through 2019; the 2020 update will be out in December or January.
The regions for each basins used are Permian – Texas Districts 7C, 8 and 8A and East New Mexico; Bakken – North Dakota and Montana; Eagle Ford – Texas Districts 1, 2, 3 and 4 Onshore; Niobara – Colorado; Marcelus – Pennsylvania and West Virginia; Utica – Ohio; Haynesville – Louisiana South Onshore and Texas District 6; Barnett – Texas Districts 5, 7B and 9; Woodford – Oklahoma ; Fayetteville – Arkansas.


