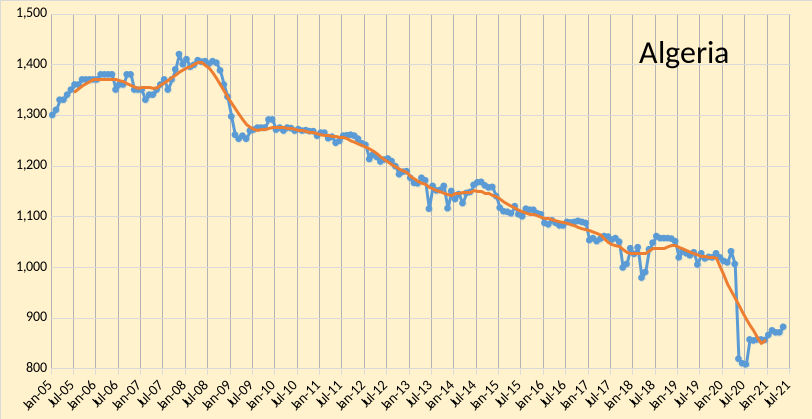
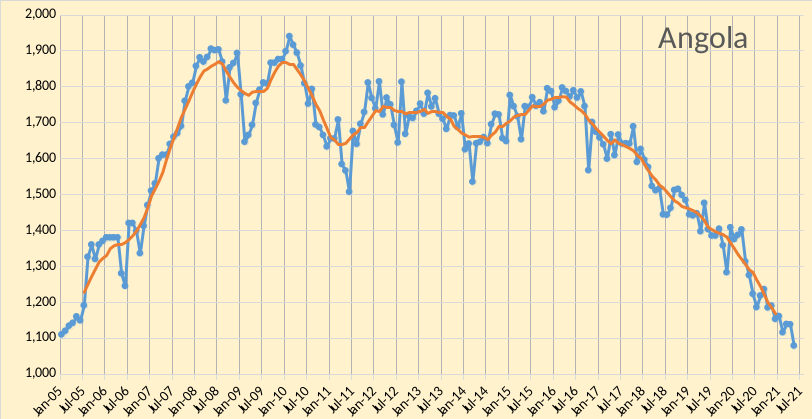
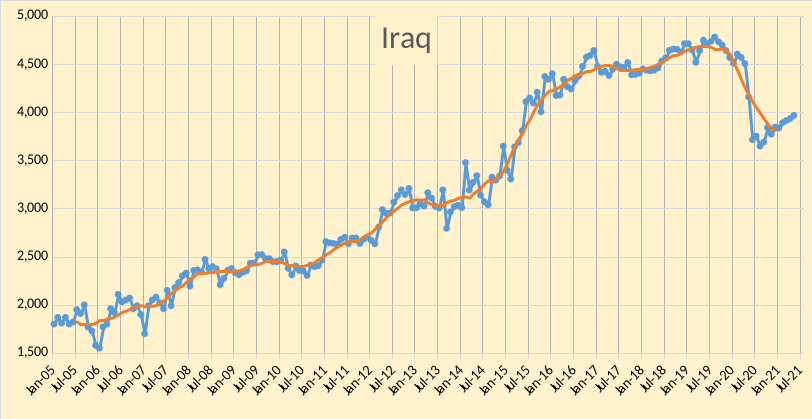
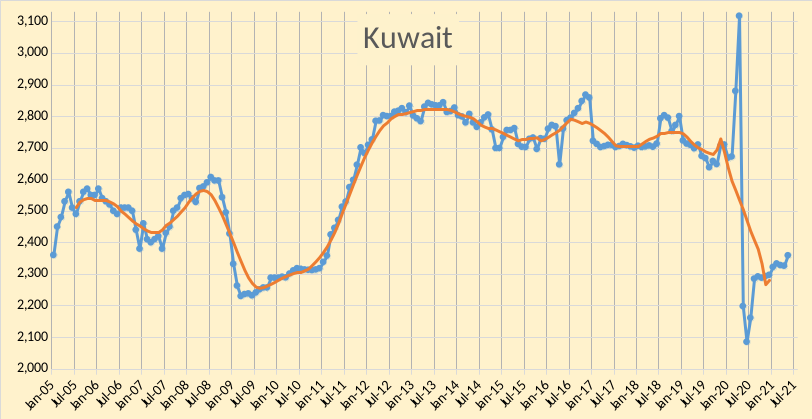
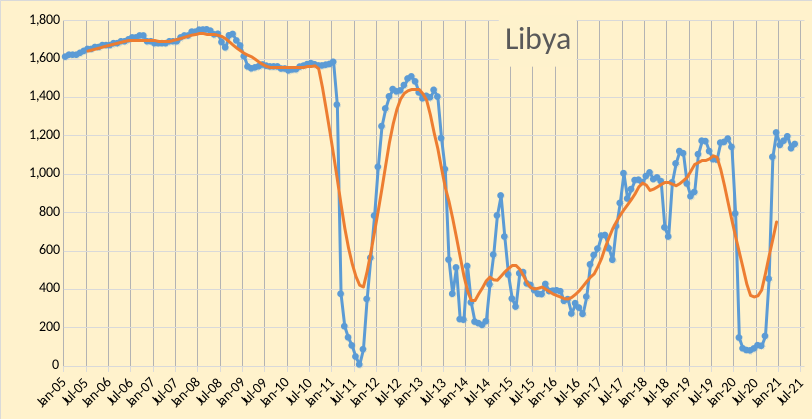
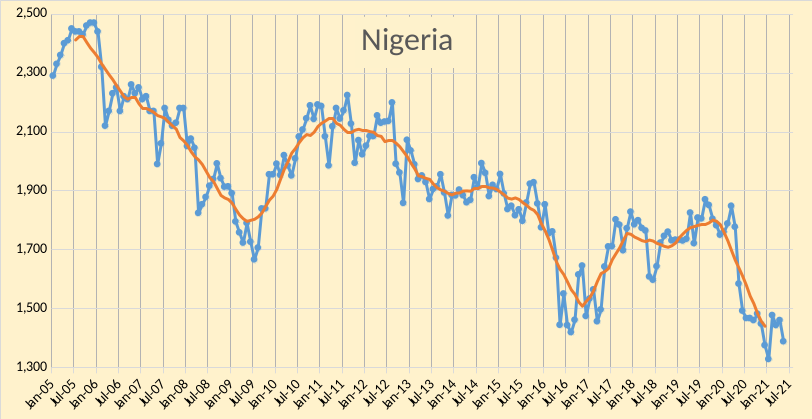
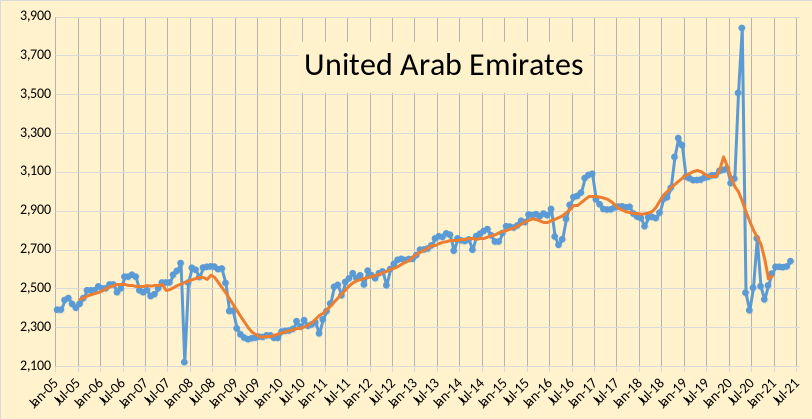
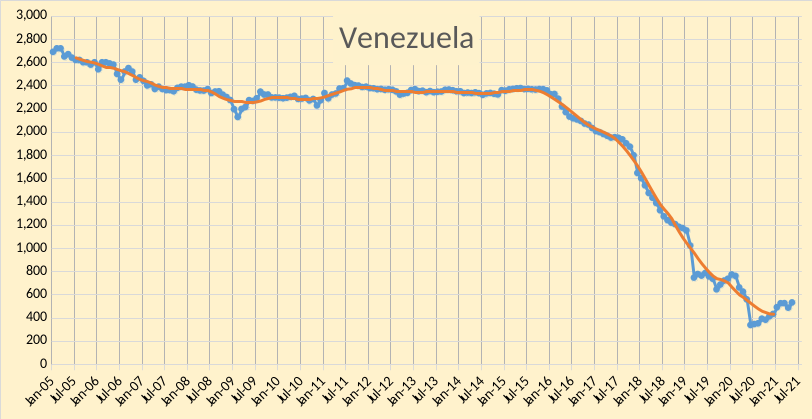
The OPEC Monthly Oil Market Report for June 2021 was published this past week. The last month reported in each of the charts that follow is May 2021 and output reported for OPEC nations is crude oil output in thousands of barrels per day (kb/d). In the charts that follow the blue line with markers is monthly average output and the red line without markers is the centered twelve month average (CTMA) output.
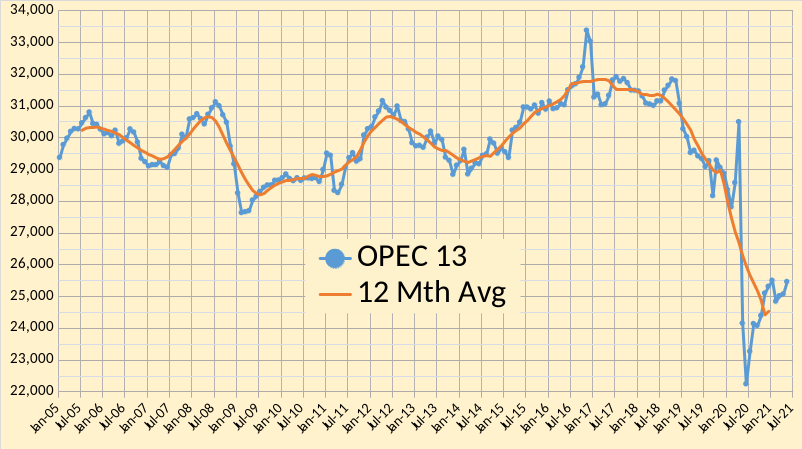
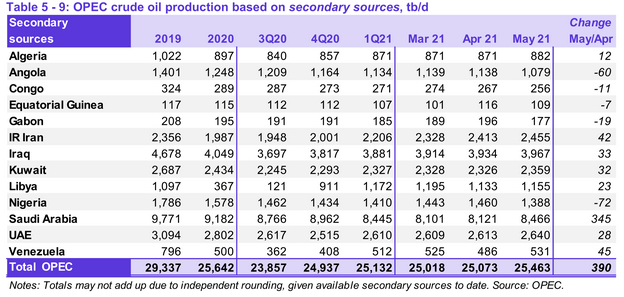
Only a small revision in OPEC output from last month’s April estimate (-10 kb/d), and a slightly bigger revision for March (-39 kb/d). OPEC output was up by 390 kb/d in April with most of the increase coming from Saudi Arabia (345 kb/d).
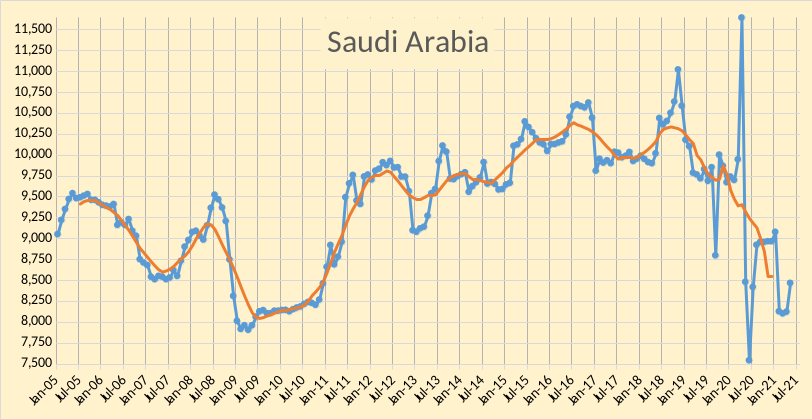
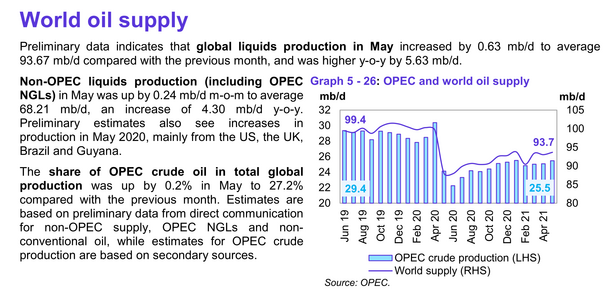
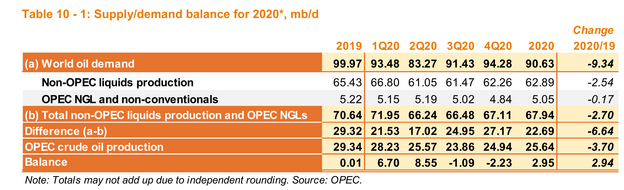
The OPEC world oil supply estimate of 93.67 Mb/d for May 2021 is about 6.4% higher than the World oil supply estimate for May 2020. Output remains about 6% below the level in April 2020 (99.5 Mb/d).
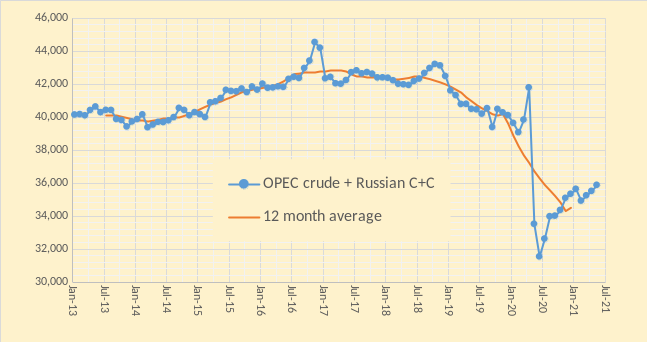
The chart above uses data from the Russian Energy Ministry and converts from metric tonnes to barrels at 7.3 barrels per tonne, the combination is OPEC crude plus Russian C+C output. Russian output decreased by 23 kb/d in May 2021 to 10410 kb/d, April output was revised up by 16 kb/d. OPEC13 crude + Russian C+C output increased by 367 kb/d in May 2021 to 35873 kb/d. The centered 12 month average OPEC crude plus Russian C+C output in Dec 2020 (most recent data point) was 34504 kb/d an increase of 197 kb/d from the Nov 2020 level.
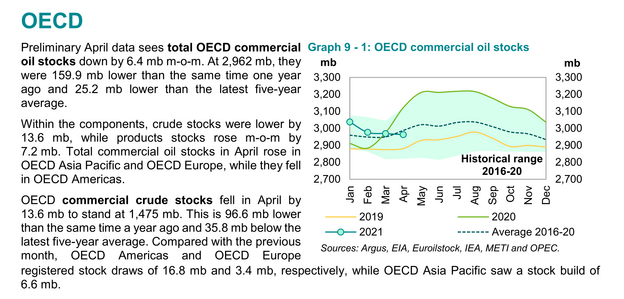
April OECD commercial oil stocks were 25,200 kbo below the 5 year average (see figure 18 above). OPEC crude output for the March to May period was was about 25,200 kb/d. OPEC estimates demand for OPEC crude in the second quarter of 2021 will average about 27,090 kb/d. If the OPEC demand estimate for OPEC crude is correct and OECD oil stocks roughly reflect the level of World oil stocks, then for the remaining months of the second quarter of 2021 (May and June) we would expect OECD oil stocks to continue to decrease. For OPEC to balance the World oil market at their expected levels for non-OPEC output and world Demand for the third quarter of 2021 would require an increase in OPEC output of about 3.4 Mb/d to and fourth quarter output would need to rise by another 600 to 700 kb/d to meet world demand for oil.
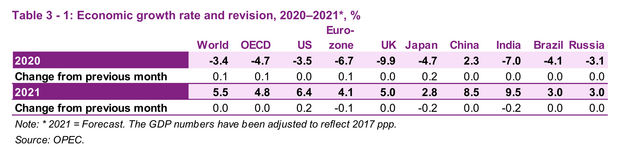
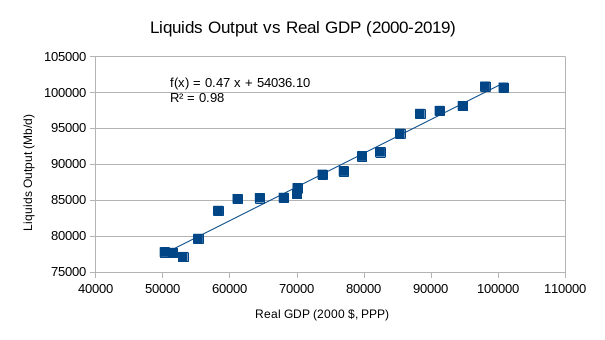
Consider figure 21 above which estimates World real GDP growth (using PPP) in 2021 at 5.5% (IMF estimates about 6% growth in 2021). Also consider figure 22 above which considers World liquid fuel output from 2000-2019 (EIA data) on y axis versus World real GDP (in 1982 international dollars based on PPP) on x axis. If real GDP grows at the rate estimated by OPEC in 2021 and oil demand follows the 2000-2019 trend, then a demand for oil of 102.4 Mb/d would be expected in 2021. For comparison the OPEC estimate for World oil demand in 2021 is 96.6 Mb/d. It is doubtful that the 102 Mb/d estimate is correct, but it is possible that OPEC may be underestimating demand in 2021. If so, we may see $90/bo for Brent (in 2021 US$) by the end of 2021.
183 responses to “OPEC Update, June 2021”
Dennis, you wrote: Russian output increased by 23 kb/d in May 2021 to 10410 kb/d,..
No, Russian output decreased by 23 kb/d in May.
43403 42877.1 44207.6
…….31 ………. 30 ………31 (days in the month)
Mar-21 Apr-21 May-21
10,263 10,476 10,453 (barrels x 7.33)
I use 7.33 barrels per ton while you use 7.3. And you forgot the “Read More” link.
Otherwise great post, Thanks
Thanks Ron. Corrected.
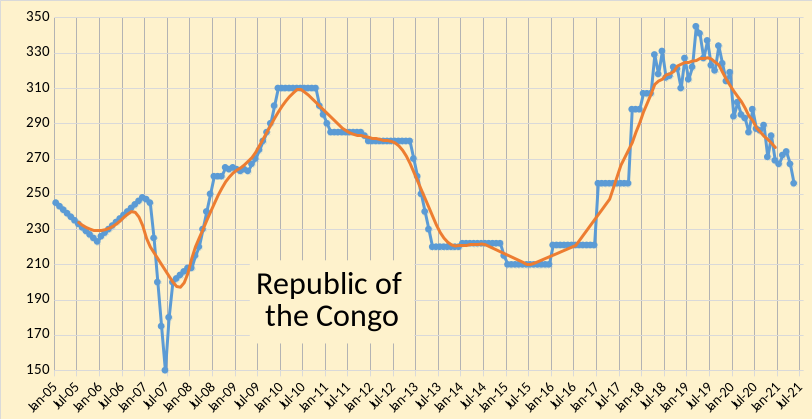
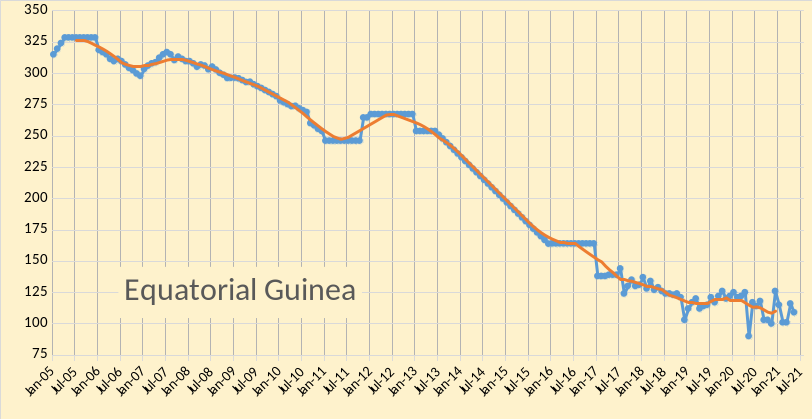
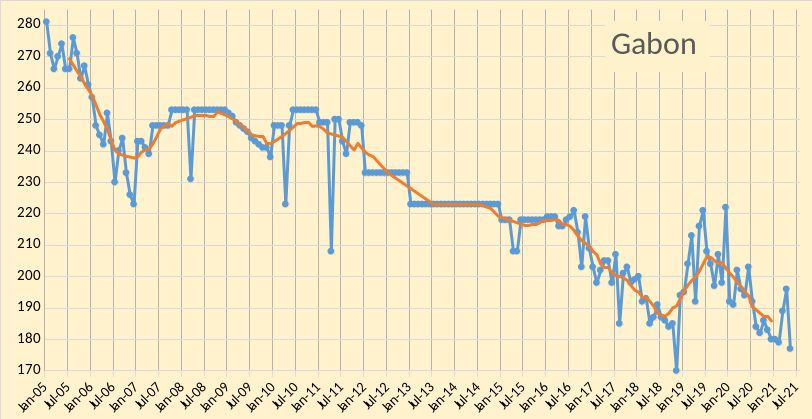
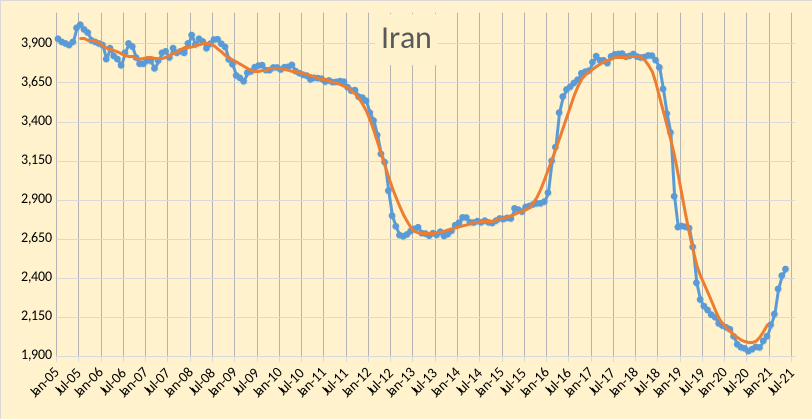
OPEC is basically 5 oil-producing nations, Iran, Iraq, Kuwait, Saudi Arabia, and the UAE. The “Other Eight” Algeria, Angola, Congo, Equatorial Guinea, Gabon, Libya, Nigeria, and Venezuela are all in decline. And that decline will continue.
I know, Venezuela’s decline is all political but that will likely last for another decade at least.
Below is a production chart of the Other Eight.
The “other 8” OPEC members in Ron’s chart above had average output fall by about 300 kbo/d each year on average from 2005 to 2020.
We can also consider the top 15 producers for World C+C from 2010 to 2019 (based on average output over those 10 years and choosing the top 15 producers from that sorted list. The 15 nations are:
Russia, Saudi Arabia, United States, China, Iran, Iraq, Canada, United Arab Emirates, Kuwait, Brazil, Mexico, Nigeria, Venezuela, Angola, and Kazakhstan.
As a group these nations produced 78% of total World output from 2010 to 2019 and 80% of World C plus C output in 2018.
When we consider a longer term from 2000 to 2019 and look at trends for the top 15 producers and the rest of the World (based on 2010-2019 average output ranking). For the top 15 output increased at 1059 kb/d on average each year over the 2000 to 2019 period or about 4.9% per year. Over the same period, rest of world (ROW) C plus C output decreased at 275 kb/d on average each year (1.6% per year). Chart below gives visual, click on chart to make it bigger.
For the chart above it appears that growth slowed in recent years (2014 to 2019)for the top 15 C plus C producers, but the decrease in the rest of the world’s(ROW) C plus C output has also slowed.
For top15 the 2014-2019 rate of increase slowed to 864 kb/d each year on average (1.3% rate of increase) and the ROW decrease was 71 kb/d annually on average over the 2014-2019 period (about 0.4%).
Chart below shows this, click on chart for larger view.
Notice that the top 15 peaked in 2018. That is even apparent in your charts Denis. OPEC peaked in 2016. Russia, which now admits they have peaked, peaked in 2018. The USA peaked in 2019, though you dispute this. But the point is, all this happened before covid started to slam production in May 2020.
Of course, most of the world was increasing production before the peak in 2018. If not then the peak would have been prior to 2018.
Ron,
Yes the peak at present is 2018. There is a good explanation for a decrease in output in 2019, there was an oil glut, OPEC cut output (as did Russia) and output decreased.
I agree that US output is unlikely to surpass the 2019 peak, but think US output can return to the 2018 average level and perhaps higher, it will depend in part on the price of oil. When it gets to $80/bo for Brent in 2021 $ or higher, we might see tight oil output take off especially in the Permian basin, other basins such as Bakken and Niobrara where the oil is expensive to transport to refineries may need $90/bo to see much increase in output, not sure about Eagle Ford, I think they will be lucky to maintain a plateau as the sweet spots may be fully drilled there and the field may continue to decline even with higher oil prices.
I doubt we will see a big increase in World output beyond the 2018 level, just a couple of million barrels per day to 85 Mb/d or so, supply is likely to be tight and prices will be high. In the past I have tended to underestimate future output, and this time is likely no different.
There have been lots of oil peaks in the past, prior to the 2018 peak, you were convinced in 2015 that we were at the peak. My guess is the final peak will be 2027/2028 with a 60% chance that the 2018 annual C plus C peak will be surpassed by the end of 2023 (we will have the data in April of 2024 to confirm).
Currently the highest centered 12 month average output is 83157 kb/d in November 2018, this number is likely to be surpassed by the end of 2023.
Dennis, you wrote: There is a good explanation for a decrease in output in 2019, there was an oil glut, OPEC cut output …
True, but OPEC produced flat out in the months of October and November of 2018, positioning themselves for 2019 quotas. And even these two months were 1.5 million barrels per day below their 2016 peak.
(as did Russia)
Nope. You better check that data again. Russia produced flat out the entire year of 2019 and did not cut output until May of 2020.
Okay, I got 2015 wrong. But that was just a wild-ass guess. It is different this time. I have analyzed things more carefully. You know Russia peaked in 2019, or you should if you believe what they said. They hope to keep production at around 11.2 million barrels per day thru 2024, but all the analysts are laughing that off. They say no way that can happen. And you seem to be coming around to the opinion that the US has peaked also. Well, congratulations. 😉 That’s two of the world’s three largest producers. That leaves Saudi Arabia, the third. Saudi is part of OPEC. OPEC obviously peaked in 2016.
Iran says they can produce 4 million bpd if sanctions are lifted. They just may be able to do that or at least come close. However, that is only 1.5 million barrels per day above what they are producing right now. That will not be nearly enough to make up for the decline in the rest of OPEC since 2016.
But I wonder where you think all this oil will come from that will push us past the 2018 peak.
Ron,
I have answered that before. Iran, Iraq, UAE, Kuwait, Brazil, Canada, and Norway will as a group produce more than in 2018 at the previous peak, Saudi Arabia, Russia, and US only need to match their combined output in 2018, though I believe they will be able to surpass that level. It is not a lot of extra output I am proposing, only 2000 kb/d by 2028, over a 5 year period from 2023, that is 400 kb/d each year.
Also note that the top 10 producers peaked in 2019 rather than 2018 and further that US output was under 11 Mb/d in 2018, the US surpassed that even in 2020 and output will increase further in the US after 2020, though I do not think the peak of 2019 will be surpassed, I do think output will remain above the 2018 level in the US until at least 2027. Chart below shows top 10 producers from 2010 to 2019 vs rest of world. The annual increase for World C plus C output over that period was about 997 kb/d, World output will quickly bounce back to 2018 output level over the 2021 to 2023 period if oil prices continue to rise (Brent at $73/b and WTI at $71/b as I write this).
Dennis,
What if you take out US shale from your chart and plot it separately? How does the top10, shale and the rest look in that case?
I believe that your top 10 production output chart looks good because of US shale. Once you remove that, it won’t look so good. And the US shale phenomenon is in the past. They have ‘drilled the heart out of the watermelon’ at least in all other basins apart from Permian. And Permian will struggle to make up the deficit of the other shale basins. In the Permian, average productivity has been declining for a couple of years now. Tier 1 is nearly all drilled out. Productivity will decline even more going forward. So, growth is shot in US shale.
So, where is the growth coming from?
Ancientarcher,
Yes much of the growth has been from tight oil, tight oil output will continue to grow, especially in Permian basin.
Also note that average output from tight oil in 2018 (year of peak) was about 6500 kb/d. For US tight oil even a very conservative scenario (which assumes oil prices at $65/bo in 2020$ or lower for the future) has tight oil output above 6500 kb/d. See chart below with a low price, high price and “average tight oil scenario.
Of the OPEC 5 , Iraq and Iran are highly vulnerable . In Iraq the problem is electricity generation . Come summer and rioting is an yearly event as electricity is routed to the oil industry from households . Second the oil in Kirkuk is controlled by the Kurds . They do not accede to control from Baghdad . Most of this oil is smuggled and sold “off books ” to Turkey . Baghdad controls the oil from Basra and other small fields . Iranian regime survives thanks to US sanctions . Sanctions are the glue that hold the people together otherwise the current regime would have been long uprooted . Electricity shortages here are also an issue . Needless to comment that WATER is a consistent problem for not only the OPEC 5 but the whole MENA region .
I am seeking an explanation for the idea that peak oil has been/will be/could be a low price event.
Under current conditions I don’t get how this is applicable.
I understand some theoretical reasons how this scenario could be real, including
1-prolonged global economic downtown, such as we have seen recently with the pandemic or could see if global population was in decline
2-economic activity continued at a slowly growing pace, but GDP suddenly became/becomes unhinged from oil consumption despite the historic relationship
2a- replacement transport mechanism available at lower cost, such as widely deployed electrical transportation
2b- conscious effort was made globally to suddenly live life without frivolous or wasteful consumption despite ability to afford liquid fuels.
My sense is that none of these possibilities are at play in a significant way currently (unless the pandemic economic damage/demand decline persists for another 5 years).
Note that the 2a and 2b scenarios are just theoretical examples of how gdp could be decoupled from liquids (I don’t think these are currently in play, and are just served up as examples).
If you are aware of other relevant possibilities that I have failed to see, I would appreciate any help with my understanding on it..
And secondly, if you see ‘peak oil with low price’ as true and/or likely- which of the factors I listed is the predominant reason? Thanks with help on understanding this.
Pardon if I missed some previous statements on this.
Hickory, it is just not that complicated. None of the reasons you listed seem very likely to me. But there is one thing you completely overlooked. When we hit or will hit, peak oil, no one will realize that we have hit peak oil. In fact years after we hit peak oil, there will be deniers that peak oil is in the past. The obvious example of that is right here on this blog.
But, quite obviously peak oil will be a time when everyone is producing flat out. When everyone is producing flat out, it is far more likely that there will be a glut, with low prices, than a shortage with high prices. Just think about it, that is obvious.
OPEC peaked in 2016 with a secondary peak in 2017. Every OPEC nation, including Iran, was producing flat out at the time. Non-OPEC peaked in 2019 and every Non-OPEC nation, including the USA and Russia, was producing flat out at the time. The monthly peak was November 2018. All those times were a period of low prices. No one had the slightest idea that this was the peak. Well, except a few of the smarter ones of course. 🙂
Only when production is falling, years after peak oil, will it be realized that the peak has passed. And prices will then increase. Because only then will supply fail to meet demand.
Hickory and Ron. Good observations.
Predictions of the future are impossible, but these observations make sense.
I will add that since 2008 GFC, a real wildcard is governmental monetary policy. It is clear to me governments will try about anything to keep the growth ship afloat.
This will have a huge impact on oil prices going forward. Volatility will increase IMO.
But, I could be wrong, lol. The mere fact that I am still allowing my financial health to be even partially dependent on the price of crude oil should cause anyone to question my views. Lol!!
I agree, monetary policy is playing a huge role since 2008, which will impact oil from the supply and demand side.
The amount of debt in the system will have a huge impact once interest rates need to be increased due to inflation which seems like it’s already here, but the fed is claiming its transitory. Volatility will increase.
I understand your point Ron, and am in agreement.
I should have been more clear in my question-
I was not referring to the moment (or year) of peak oil in my query.
What I am wondering is if anyone sees a reason why the time after peak, (when production is starting to fall enough to be commonly realized), could or will it be a low price time for oil? I am talking about this very decade.
Regarding monetary policy, the global central bank strategy to have increasing debt and money printing sustain short term economic growth , rather than sitting back and allowing contraction, certainly has its downsides and the central bankers are more aware of this than anyone. The downsides include the penalty of slower potential future growth, the inherent instability of going faster than your vehicle is optimized for, and the need to gradually devalue/debase the currency. The upside is that the economy doesn’t contract and then contract more. The choices may be tragic either way, and they have no right answer to what ails us (growing beyond our means). But in real dollar terms the mismanagement or lack of management of money supply could affect oil price primarily on the demand side. A broken financial system could cut demand extremely hard and fast. They will keep kicking the can down the road as long as possible. And if/when they fail to kick effectively, no one will want to be a witness, since all witnesses will be victims of the situation.
As I see it.
Hickory,
Much depends on the timing of the peak and decisions by OPEC as the peak approaches. There is a possibility that OPEC might carefully adjust output to keep prices just high enough to limit demand to balance supply and in an attempt to keep oil prices in check (under $85/bo for Brent in 2021 $) so that the transition to non-oil transport does not accelerate.
Should such a scenario occur (which I think unlikely), then we might arrive at a peak/plateau at 85 Mb/d with relatively stable or slowly rising oil prices. By 2030 we might see demand start to fall at a rate that is greater than the fall in crude oil output at $80 to $90/b and oil prices might start to fall, by 2035 demand may be dropping by a much faster rate than the fall in oil supply and prices would start to fall more rapidly. This last part of the scenario seems more likely but in the interrim oil price volatility seems much more likely. Many other possible scenarios exist, but if OPEC does not make the bonehead move they made in 2015 to defend market share, I think the idea that low oil prices at the peak are more likely than low prices at the peak simply is a matter of demand relative to suppy at the time peak oil is reached. As we come closer to a geological peak in supply as is likely in the next 5 to 8 years the more likely it is that demand will be outrunning supply and oil prices would be relatively high (likely $110/bo or more in 2027 in 2021 $ for Brent crude.)
Much depends on the timing of the peak and decisions by OPEC as the peak approaches.
Surely you jest. Right now OPEC is 75% Saudi Arabia and 25% Iran, Iraq, Kuwait, and the UAE. All these countries are in denial of any approaching decline. But they all probably realize their peak was in 2016. When prices start to spike they will all produce every possible barrel.
Ron,
Up until now they have been fairly disciplined, they may indeed produce every possible barrel to keep prices in check and may also develop resources more aggressively in an attempt to keep prices at reasonable levels. By 2027 or 2028 it will be obvious that World C plus C output can no longer increase and prices may need to spike to over $120/bo to match demand with supply. This is likely to accelerate the transition to electric transport for light vehicle land transport and possibly for short haul heavy transport as well, at some point long haul transport might move to rail and rail might be electrified if oil prices remain high (Brent of $120/bo or more in 2021$).
I believe I said the scenario was not likely (which for me means less than a 25% chance). The future is difficult to predict.
What I am wondering is if anyone sees a reason why the time after peak, (when production is starting to fall enough to be commonly realized), could or will it be a low price time for oil?
A low price time for oil? Not bloody likely. No, when the world realizes that the world is running out of oil, just as the economy is booming and oil likely to be in high demand, prices will spike.
Yes. I thought some had been suggesting the opposite
Are we currently in such a situation?
No, but we are pretty close. I expect to see far more “oil scarcity” articles appearing on the mainstream news very soon. They will creep in, one by one, and by late 2022 there will be an avalanche of such articles and news reports.
It takes a while for the world to wake up from it dream state and realize just what is happening. And everyone will be saying something to the effect of: “What, what the hell is happening?”
It will be the shock heard around the world. (Notice the play on words, shock not shot. 😉 )
In fact, the first obvious excuse will be: it takes time to (re)-develop production after COVID19. Then as in 2008, production will not follow the growth of demand while at the same time production countries will continue to push for production increase. Oil price will sky rocket and economy will drop,… while oil production is still increasing from new developments. Oil price will then drop … so low price at (local) peak.
Then, the question will be: what is the wild card after? More and more production countries are already past peak. Will there be another “Shale oil” somewhere?
My gut feeling is this time is different with big/giant oil fields at their very end years of production.
Curious to know whether we are past peak or close to it. Acceleration of efforts by so many countries to organize and speed up the energy transition (including SA) should not be only for the beauty and the sustainability of our planet.
Well, the logic goes like this – the peak is caused by affordability dynamics. At high prices, demand is destroyed by economic contraction. Growth is constrained by expensive energy, and is so inelastic that meaningful reductions in consumption will collapse economies.
Chris , some answers . There are no wild cards . Even shale was not a wild card . Fracking was a tech known before the shale ballgame started . Experts like Art Berman called it a Ponzi from day one . He called it a ” retirement party ” . Peak was (is ) 2018 . There will be no more peaks . Sorry to say but energy transition is too little to late . The wolf stands outside the door or even better the title of Dimitry Orlov’s latest book ” The Arctic Fox cometh ” . Be well .
Venezuela currently has fuel shortages and the lowest gas prices in the world. My guess is that this is due to government policy. Actually there are many scenarios that would result in low oil prices post peak. One possibility is wealth inequality. Suppose the median wage falls and only the super rich can afford fuel. Well suddenly demand falls because oil is too expensive for the median salary but cheap for top wage earners. Another scenario might be a world war which kills 80% of humanity. There will be less oil but more than enough for the survivors. Another scenario is that people realize that there will be less and less oil and organize their lives to consume less. Our family has been doing this for years. I own 4 bicycles in addition to a tandem and an electric bicycle for the family. We heat with our own wood (the ashes are used to make cleaning fluid for clothes and dishes). In another two years, we hope to be self sufficient with respect to water and a significant amount of food. I see a tremendous amount of fuel waste in the economy that will soon stop.
Another scenario is that some exporting nations realize they will need this oil as the world stares into a scarcity of oil. They might say: “Shit, why are we selling this stuff when we will desperately need it for ourselves in a few years?” And as they cut back, or stop exporting altogether, the problem gets a lot worse, and prices spike even higher.
L.O.L. The decision concerning the proportion of a domestic resource that should be preserved for domestic needs, and how much to export, is interesting. China’s REE deposits come to mind. Also, the impact of the immediate use of a resource versus a lower level of exploitation over time might come into play in some (perhaps unrealistic) scenarios as well. Not many examples of countries that have exhaustible natural resources saving some for future generations I’m aware of; probably would result in an unwelcome war or another ugly result!
BBC had lately two articles about electric cars (IIRC they will take over in less than a decade) and about the future of gasoline stations (they should transfer to car charging and to whatever the e-car owners need during the wait…) so in a way something is filtering to news already although it isn’t directly about peak oil…
There was a headline this morning about GM investing $35 billion in electric cars in the next two years. Ford is also investing big, consider their decision to sell an electric F-150 their cash cow. If anyone is studying the future of petroleum products it has to be those two.
Speaking with some local contractors there seems to be quite a bit of demand for electric pickup trucks. They think that the fact that they tend to drive not very much, and always end up back at the shop and the end of the day, combined with low fuel efficiency (high cost per mile) leading to quite a bit of savings.
Because electric trucks are significantly more expensive than ICE trucks and you save money for each mile driven, it makes sense for high use cases, not low use cases. If you don’t use it much, it will just sit there and depreciate at a much higher rate. Plus you will have to change the battery after 6-7 years. The deterioration of EV batteries has a time element to it that will add to the depreciation.
Ancientarcher, the price will not be very different between EV trucks and ICE trucks.
the price will not be very different between EV trucks and ICE trucks.
Dennis, what data are you basing the above statement on? I am speaking of 18 wheelers. I don’t think any of them are around yet.
I understand they will then be called 26 wheelers. You will need an extra 8 wheels to carry the battery. 😉
Ron,
Weekendpeak spoke of electric pickup trucks used by many local contractors, ancient archer was answering that. There are no electric pickup trucks being produced yet, but the projected price will be similar to ICE pickup trucks well equipped which usually are around 45 to 50k. Heavy duty trucks will be futher into the future maybe another 3 to 3 years, electric pickup trucks are expected to roll off assembly lines by late this year (Tesla) maybe early 2022. Ford is advertising F150 EV for Spring 2022.
Frito Lays in Modesto, CA expects delivery of 15 Tesla Semis by the end of 2021.
https://insideevs.com/news/496788/FritoLay-Expects-15-Tesla-Semi-This-Year/
Frito Lays in Modesto, CA expects delivery of 15 Tesla Semis by the end of 2021.
Great, potato chips! Yeah, we should be able to make a battery with enough power to haul potato chips. The next big test, bread trucks. Bread is heavier than potato chips but, with a lot of effort, we should be able to make that hurdle in a few years. 😉
Hi Ron,
Some of the other companies that have reserved the Tesla Semi are Pepsi, Walmart, Anheuser-Busch, UPS, FEDex, DHL, there are others in the article linked below
https://www.businessinsider.com/companies-that-ordered-tesla-semi-2017-12?op=1
It is a simple answer- lack of capital investment. With the Majors having an identity crisis and the shale industry consolidating rapidly. We have already seen the best of the shale in the rear view mirror and now less productive zones and child wells will not ever bring the production to levels seen in 2018,2019 and the Permian is a pin cushion with dwindling inventory. Growth will come through horizontal combination and not through the drill bit. Internationally I also believe the lack of investment in 2020 has set the industry back 7 years at least. You can look to Iran and Iraq but the Saudis just floated a 6 billion dollar bond to finance part of their dividend payment. They are on their last leg and fading. Charts are meaningless if investment doesn’t come back and fast.
LTO survivor,
As oil prices increase so will investment, what is your expectation for peak output in the Permian basin for tight oil? My best guess is below (ERR=58 Gb).
LTO Survivor,
Do you mean lack of capex in 2020 has set the whole oil industry back by 7 years or just US shale?
I believe 2020 capex was half of 2019 capex, so there is damage for sure, but that big? Why do you think it is that big of a damage?
Thanks
Hickory, “prolonged global economic downtown” (1) seems most likely to me, i.e. more countries going the same way Lebanon is currently going:
Lebanon: Mass queues and growing frustration over fuel shortages
“Lebanon has been afflicted with a crippling fuel shortage amidst ongoing economic turmoil in the country.
According to the report, Lebanon’s GDP fell from close to $55bn in 2018 to around $33bn in 2020, causing a surge in inflation which is expected to worsen this year.”
If there was plenty of cheap oil to produce available (no peak oil in 2018), Lebanon would probably be in a much better position right now. However, I don’t think anyone is talking about peak oil in Lebanon right now. The same thing could happen globally.
Kuwait rig count continues to fall despite higher oil prices. Rig count was 14 in May, down from 19 in April.
Last year, Kuwait scrapped an awarded oil project and intended to freeze more projects.
Moreover, Kuwait will probably burn record amount of crude oil this summer:
Kuwait faces crude-for-power demand as heat rises (June 7)
“Kuwait could be set for another summer of surging crude burn in its power plants, with electricity demand already hitting a record high as temperatures soar.
Peak power demand passed 15.07GW, a new record high, yesterday when the temperature rose above 50°C, according to the ministry of electricity and water (MEW).
Its peak load reached a then-record 14.96GW in July 2020, pushing it to burn around 184,000 b/d or nearly 10 times the amount used for power in 2019.”
The economy is also in big trouble:
Kuwait facing ‘immediate crisis’ as it seeks cash to plug deficit (3 Feb)
““It’s a very immediate crisis now, not a long-term one like it was before,” said Nawaf Alabduljader, a business management professor at Kuwait University.”
Dennis,
Kuwait, SA, and UAE datasets. What is going on between jan20-Apr20, that massive spike in production? Seems to be a glitch in the data.
Iron Mike
That is when SA asked OPEC to go to maximum production in response to Russia not agreeing to help OPEC reduce production at the beginning of the CV epidemic. The question is: Was that real production or some extra crude coming out of inventory?
Thanks Ovi, was that the only OPEC countries that “maximized production” after that event?
I remember now yes. That is when prices started to collapse.
Frequently S.A. and Kuwait increase production before an OPEC meeting so that they can “decrease” to previous production levels. In 2020 this was amplified because they were playing chicken with US LTO and Russia. This was a case in which, as Ron says, they were all producing flat out into a pandemic that destroyed demand. All the players took a big financial hit and we are watching the fallout with great interest.
Libya’s Oil Production Drops By 200,000 Bpd (Jun 09)
“Libya’s crude oil production has declined by more than 200,000 barrels per day (bpd) in recent days, or by almost 20 percent, on the back of pipeline leaks and maintenance at the biggest oilfield, Bloomberg reported on Wednesday, quoting sources familiar with the situation.”
The shale exit continues.
https://mobile.reuters.com/article/amp/idUSKCN2DP0K5?__twitter_impression=true
Exxon (XOM) Sees US Shale Oil Production Decline Per Well Bold mine.
Exxon Mobil Corporation XOM has been generating fewer barrels of oil from the prolific shale fields of the United States since 2019, per Reuters.
According to a latest report, the company’s oil wells, which are involved in some of the most promising shale fields, produced fewer barrels of oil per well despite an increase in overall expenditure and production.
In 2017, Exxon, which is one of the largest shale oil producers, acquired $6.6 billion of net acres in New Mexico, which doubled the company’s assets in the Permian basin that spans west Texas and New Mexico. Notably, the company intends to boost shale output in the New Mexico portion of the Permian basin to 700,000 barrels per day (bpd) by 2025.
Per data released by the Institute for Energy Economics and Financial Analysis (“IEEFA”), Exxon’s average liquid output for the first 12 months of a well dropped to 521 bpd in 2019 from an average of 635 bpd in 2018 in its Delaware basin assets of New Mexico.
That’s an 18% drop in production per well. And this was before the pandemic
Looks like they bought trash in Delaware then. Like a rigged gold mine in the 19th century, with nuggets inserted with a shotgun to fool investors.
At shaleprofile most basins are still at peak productivity – not getting better anymore, but not declining, too. At least not by much – 18% is huge. With this decline they can write off these acres soon.
Great work and good timing as seen by the comments so far . Hope the world starts to smell the coffee .Tks Dennis .
The IEA called for OPEC+ to stop investing in oil and gas and now tells OPEC+ to produce more oil and gas????
Oil Markets Baffled As The IEA Calls For More Production
In its latest Monthly Oil Report, the IEA called on OPEC+ to increase production in order to counter higher demand in 2022.
The agency claimed that, based on current global economic growth expectations, demand for crude oil and petroleum products will be reaching pre-COVID levels by 2022. The Paris-based energy watchdog, which has come under fire after its shocking Net-Zero by 2050 report called for no more investments in oil and gas, stated that “OPEC+ needs to open the taps to keep the world oil markets adequately supplied”. At the same time, the IEA has also reiterated that market realities are at odds with its proposed strategies to reach net zero-emission levels by 2050. Criticism will likely be harsh for the “former” leading oil and gas agency, as the agency has called upon the world to double down on renewables and commit to the Paris Agreement while admitting that the global economy continues to demand vast amounts of hydrocarbons.
The relevance of some of these reports will have to be reassessed, especially when looking at the high-profile “Golden Age of Gas” report and the “Net Zero by 2050” roadmap. When asked what needs to be done, the IEA indicated that the call on OPEC+ will be very strong, as the international oil and gas producers group will need to increase crude oil supply to the market by 1.4 million bpd in 2022. Which would mean a significant increase over its current July 2021-March 2022 targets.
They are clearly playing both sides of the fence since they probably receive funding from oil and gas as well as governments and “green” industries who have “committed” to net zero emissions.
IEA is the epitome of a confused mouthpiece.
The IEA has recently stated two positions, and contrary to many headline soundbites the statements are not in conflict with each other.
The first was the report on 2050 net carbon zero pathway that said if the global goal is net carbon zero then the major producing companies/countries must stop exploring and producing in new basins [if net carbon zero by 2050 is the goal]. That will be decided by others. Or should I say that decision will be largely avoided by others.
The second statement was relating to short term oil supply demand balance as Ron referenced.
Surely we are able to make the simple distinction.
Here is the net carbon zero report press release- https://www.iea.org/news/pathway-to-critical-and-formidable-goal-of-net-zero-emissions-by-2050-is-narrow-but-brings-huge-benefits
IEA going to one extreme to another is the headline news, yes. Too small investments (2017), demand falling of a cliff or too little oil again. The spin goes in all directions.
I think it is not very easy to keep oil prices low (from 2015 to now there have been several downside “chocks”). The middle east reduced drilling as soon as the democrats in US won the election. Major oil producers are ok with reducing production if prices are going higher. I do think it is very difficult to pursue a policy where reduced energy per capita is offered. So the way I see it, is that electric energy based on wind and solar has to balance reduced fossil energy. Electric transportation and heat pumps being the low hanging fruit. It can prolong energy scarcity problems in developed nations for many years, and therefore I think that is likely. The easy going higher energy/capita era, will be replaced with a more complacent energy stagnation/capita era for a while. And not without conflicts, since there are going to be winners and losers. Not just winners (broadly speaking) like the last 40-50 year period.
Could shallow sand or possibly Mike comment on this?
https://twitter.com/sand_frac/status/1404476730266447872?s=19
The EIA’s Drilling Productivity Report came out today. Everything looks pretty flat in the shale patch. Below is the total of all seven basins. The last three months of this chart, May, June, and July are just estimates. But they are likely pretty close, especially for May. And I think this is total production from these basins as it is slightly higher than the Light Tight Oil report that comes out later.
Except for the bad weather month of February, production has been virtually flat for a year now.
Total DUCs in shale basins are falling at the rate of about 250 per month. I don’t know how long this can continue. I have been told by some experts in the field that there are some DUCs that will never be completed because they would not produce enough oil to pay the completion cost. So we just cannot count the DUCs and divide by 250. The decline in DUCs will have to stop sooner or later.
What I don’t understand is why wells are drilled but not completed right away?
Frugal, I am not an oilman, and an oilman could obviously give a better answer than I. But I will give it a shot, and hopefully, I will be corrected for any mistakes I make.
Drillers are not frackers and frackers are not drillers. That is an entirely different operation requiring different crews, different equipment, and different CAPEX. But the driller leaves behind samples from the well, indicating just how productive the well should be. The best wells will obviously be fracked first. The less promising wells will be left for times when the price is high enough to justify the fracking cost.
But…. the total cost of the well is the drilling cost plus the fracking cost. And in a DUC, the drilling cost has already been spent. So when times get hard, and you can get a well, though it might not be the best well, you have already paid the drilling cost, so you can get it for only the fracking cost now. So you pay the fracking cost and recover what you can. And this would be the case especially if the new wells that are coming in are less promising than the poor wells already drilled.
But then, that’s just my opinion, for what it’s worth.
Yes this makes seance — the productivity of a well being somewhat unknown until you get your hands on the core samples. You have to drill to know what’s down there.
There has to be a certain delay just from a logistcs perspective, I think from some reports this is around three to six months but do not have first hand knowledge. This allows the drilling program and the completion program to be planned separately so that the do not interfere with each other. With most of the wells being drilled from pads around 8 to 10 would be drilled before the rig moves off and the completion crews move in. In that period things may change. On the commercial side prices may fall, companies go bust, liquidity dry up, transport or marketing deals change (e.g. so that gas capacity becomes limited), cracking crews become unavailable because of problems with the service company etc. The drill cores from pad may show some wells to be marginal or less attractive than originally expected or while the pad is being completed the rilling results on the next pad show it to be much more commercially beneficial to be completed immediately or a well may be found to be problematic and need special completion methods. Weather or unplanned maintenance delays may also play a part.
If one or more well is left incomplete on a pad, for any reason, it would become difficult and more costly to schedule the completion crews to return later (which may interrupt their planned programs and require loss of production from some of the other operating wells on the pad) and a decision to do so requires a new economic assessment, with the original return on investment expectations and sunk cost for the previous drilling now irrelevant. Once this new assessment is made there may be newer data available for expected recvory or initial flow etc. as well as a new price scenario to be factored in and a different appetite for risk in the E&P (none of the calculations are exact they are all based on on assessment of prababilities for best, median, worst scenarios)..
Ron, thanks for this.
Few are aware that the decline in the US LTO extraction in recent months has been slowed by
1) Drawdown of the DUC inventories (less CAPEX to bring in new wells).
2) Reducing the number of wells classified as inactive (does not take much $$$.)
All it takes is a look at the hard data, narratives, and wishful thinking never beats hard data:
Anyone doubting should look at the relationship between the number of fracking spreads and drilling rigs. For some time, the capacity from the fracking spreads has been running ahead of the requirements dictated by the number of (active) drilling rigs.
There will always be some cushion in the DUC numbers due to logistical reasons. We know little about the quality of the DUCs and how many of these are “dead “DUkCs.”
The above factors make it challenging to make reasonable forecasts on the future developments (like the next 9 – 12 months) in total US LTO extraction.
I know because I have been there for years, looking both at the Bakken and the Permian [tons of this information has not been made available in the public domain, but shared, discussed with insiders willing and able to pay] and all of this has been juxtaposed versus data from SEC filings for public companies.
Anyone who wants to know who “LTO Survivor” is, I could narrow it down to 3 names!
The near-term [6 – 9 months] trend in US LTO extraction will be downward as most companies now are CAPEX constrained (they recognize this.)
IMO, the best indicator for US LTO extractions’ future direction comes from studying the CAPEX budgets for public companies from their most recent SEC filings.
Looking at the trends, the first 12 months cumulative for younger LTO wells (Bakken may have “peaked” in 2018, referring to productivity or EUR) has been on an upward trajectory, but looking at the relative decline rates [from actual data] for these now supports the impression that longer laterals, more proppants loadings, and more fracking stages has helped pull extraction forward in time [which is good from a Net Present Value Perspective, NPV] and how this affects the EUR remains to be seen.
I am in the process of completing what in my world is referred to as a “post-project audit” for the Permian, which follows the template as my most recent post for the Bakken [looking at the Permian as one big project, and if anyone thought Bakken was bad…], but with data for the Permian.)
Initially, my Permian post was scheduled for publishing in late 2019, but I have been bogged down by many other commitments like the chairman of some boards.
I recently [as in for some years] have focused on oil price developments by looking at things like the credit impulse, the exchange rate of the USD [versus other currencies, and the most recent data {May-21} would surprise or shock most people], movements in the US 10 YT rates, fiscal and monetary policies, consumers affordability and many other parameters/metrics. This will give some clues about the oil companies’ willingness to invest in future oil capacities (NOTE I did not say growth in oil extraction!)
Much of this work has happened under the radar screens and little of it has been published.
All of these say now there will come a decline in the oil price [in USD] (it is easy to understand the reasons for the direction [of the oil price] but very hard to predict the timing.
I now expect the [present] oil price to come down later this year (2021). It is oversold!
As many more brilliant people than me put it, “if you get the USD right, you get a lot of other things right,” like the oil price as the oil is still [this could change!] priced in USD.”
Just my 2 cents in a hurry, and again Ron, thanks, and my money is on you [wrt timing the global peak, some of your opponents have not studied the hard data, and hard data still trumps everything else!]
Thanks Rune . Enlightening post . Await your research on the various subjects you are working on . Rgds .
I echo H in H
Rune
I have been tracking Frac spread crews with oil rigs and since September there have been 0.7 frac spreads added for each oil drill rig. This may not be a fair comparison because the Frac spreads may also contain NG wells. Regardless it seems that the addition of Frac spreads is lagging rigs. What is even more puzzling is that frac crews are fracking DUCs which I thought would have resulted in a higher ratio.
Ovi, the amount of time it takes to drill a well is not necessarily the same amount of time it takes to frack a well. I don’t know what the average time for each is, an oilman will have to tell you that, but there would likely never be a one-to-one ratio. So there would be no need for the number of crews to match.
Second point. You said: What is even more puzzling is that frac crews are fracking DUCs which I thought would have resulted in a higher ratio.
Ovi, a DUC is the only thing a fracking crew can frac.
Ron
Agreed. My point was fracking DUCs adds fracas and no rigs so that would make the ratio higher.
Ovi, see my post below. I put it down there to get more width for the chart. It’s all about capex.
Ovi,
Look at the other section of your chart where at 225 frac spreads there were almost 600 rigs, compared to about 360 rigs currently. The fact that there are nearly half as many rigs running for the same number of frac spreads suggests more DUCs are being completed. Basically we expect the ratio of frack spreads to rigs to decrease when a higher proportion of DUCs are being completed.
It will be interesting to see if rig and frack counts accelerate with higher oil prices.
Dennis
“Basically we expect the ratio of frack spreads to rigs to decrease when a higher proportion of DUCs are being completed.”
I see it the other way. If frac new crews need to be assembled to frac DUCS and no rigs are being added, the frac spread to rig ratio would be increasing..
Ovi,
Let’s take a couple of data points from
https://www.aogr.com/web-exclusives/us-rig-count/2020
and
https://www.aogr.com/web-exclusives/us-frac-spread-count/2021
March 13, 2020 frac spreads=298, oil drilling rigs=683, frac spread to oil rigs ratio=0.44
June 11, 2021 frac spreads=230, oil drilling rigs=365, frac spread to oil rig ratio=0.63.
Since the middle of 2020 DUC count has been decreasing. Basically fewer drilling rigs are needed when frac spreads are busy bringing the DUC inventory to a lower level.
Dennis,
Why is this happening now? Why did it not happen three years ago? I know, we had a pandemic, but why did this make companies to suddenly decrease their DUC inventory? That is, why are they drilling so many fewer wells than they are completing?
Ron,
Prices during 2020 (April to December) were very low, much lower than in 2018, that is a part of the explanation, also investor sentiment has changed and they are demanding a return on investment.
Ron,
In addition we had a very big drop in demand for oil that was very sudden, this left a lot of DUC inventory ready for fracking so drilling slowed down while DUCs were completed to bring down excess DUC inventory, at some point drilling levels will increase as DUC levels fall to levels companies are more comfortable with, we may be close to that level soon (within 3 to 6 months is my guess).
Ovi,
Yes you are correct, as a higher proportion of DUCS are completed (so that DUC inventory is decreasing) the ratio of frac spreads to oil rigs will increase as it has from March 2020 when the ratio was about 0.4 to June 2021 when the ratio has increased to 0.7 or so.
Ovi,
Let me share some numbers based on data from Shaleprofile (numbers could be subject to future revisions) that covers the big 4: Bakken, Eagle Ford, Niobrara, and Permian.
Until Apr-20, there was a general build of DUCs in these 4.
As from May-20, a significant drawdown in DUCs started (this as the oil price collapsed and completing DUCs would allow more wells to be brought to flow as the lower oil price constrained access to CAPEX.) For the Bakken and the Permian, cash flow from operations (CFO) was still negative. These operations (drawing down DUC inventory [each DUC is about $3-4M yielding nothing]) allowed to slow down the decline in LTO extraction.
For the period May-20 – Jan-21, 3 100 additional wells were brought to flow for the big 4.
About 47% of these came from the drawdown of the DUC inventory.
ON DEVELOPMENTS IN THE FINANCIAL WORLD
I do not think I have publicly used the term “financial crisis,” though I expect developments in the financial world to affect the oil market and the oil price. Not using the word “financial crisis” does not mean that there is no tail risk (low probability) of this happening.
Then again, what is the definition of a “financial crisis”?
The financial world is opaque, ref the Eurodollar system, which is out of the jurisdiction of the Federal Reserve.
Apart from that, some crucial indicators may give away trend directions 6 – 9 months into the future. One example is the credit impulse for China which recently turned negative, signaling an economic slowdown, and as China slows, many more follows.
The yield on the US 10 YT, which recently has come down. In other words, the bond market does not foresee much economic growth and the current US inflation (about 5% YoY) to last.
Mar-20 – Jun (4th)-21, the correlation between the US 10 YT and the oil price (Brent spot) was 0,84, which is substantial.
Jan-21 (1st)- Jun (4th)-21, the correlation between the US 10 YT and the oil price (Brent spot) was 0,86, which is substantial.
A rising US 10 YT signal more robust growth and higher inflation and vice versa, spilling into the oil market.
Relations change over time, but a test going back to 2017 found a strong correlation of 0,79 between the US 10 YT and the oil price from then to now.
It now appears the Fed policies are aimed at deleveraging US public debt by accepting higher inflation.
A negative real interest rate is one way to get there, and the more negative, the better,
which is a subtle form of default like negative bond yields
THE OIL PRICE
A lasting structural imbalance where demand runs ahead of supplies gives support for growth in the oil price.
The market now expects economic activity to pick up from the easing of Covid restrictions.
Now and from my perspectives, there are/will soon be several headwinds for continued growth in the oil price;
– Cutbacks in the US stimulus packages
– Likely an end to the mortgage forbearance
– Likely an end of the rent moratorium
– Slow/no real wage growth for employees
– Slow credit growth
– Consumer spending sentiment souring
– Lower yields
– The global credit impulse (ref China above)
– OPEC in the process of adding some 2 Mbo/d to supplies
– and many, many more
Recently I have not dived into the data to look at speculative momentums for oil.
Technical Analysis using tradingview or similar has some merit, reflecting some collective expectations or behavioral economics.
I still expect to see “poor” consumers start to reject a sustained higher oil price (around $70/Bo) by reducing demand.
Since 2019 about $70/Bo (Brent spot and nominal) appears to be a threshold where consumers with the least affordability start making cuts in their demand.
Could the oil price go above $100/Bo (in nominal terms)?
IMO yes, and that is related to developments in the exchange rate of the USD. Which again becomes derived from US fiscal and monetary policies.
Some analysts expect the USD to lose 30 – 40% of its purchasing power 2 to 5 years from now.
Anyone who understands the implications of such a “devaluation” to the USD would not like to go there, especially those living on a fixed income.
Lower US treasury yields equal tight monetary conditions. Interest rates aren’t low enough to pull economy forward anymore. Credit is where you need to look at to determine which way dollar is going and ultimately the direction of everything else. Corporate USA has 11.5 trillion dollar of credit extended to them. In order for this credit not to contract there has to be ever increasing loans and ever decreasing interest rates. The likely hood of a major dollar spike is greater than a collapse in value of the dollar IMO. It is just a matter of timing it.
Credit contracts when loans are paid off btw. Not just when loans are defaulted on.
Eurodollar market is likely twice as big as onshore dollar market and FED has zero control over it. Dollar shortage can show up outside USA in a hurry and totally screw up any theory on why oil prices or the price of anything else should go higher. And remember while banks outside USA can loan US dollars. They can’t print them to make people whole when a dollar shortage shows up.
The spike in usage of reverse REPO at the FED should be very alarming to everyone. Banks have plenty of bank reserves but not enough collateral. Collateral is pretty important when you have to borrow on a daily basis as banks do. Without enough collateral Eurodollar market doesn’t get enough dollars to function properly. You get a dollar shortage cause by FED’s QE taking too much collateral out of market.
The FED is between a rock and a hard place.
They have to control the yield curve, as you stated – companies can’t pay hight interrest rate anymore. In the current enviroment with starting inflation higher than 5% and increase in minimal wage on the table, nobody would lend money to a company under 7% for a few years -15-20% for junk ratings. At least in normal times.
And this would cause a bloodbath in the economy, and states, too. That’s why the collateral problem and the reverse repo problem is the smaller evil at the moment.
A comment posted on ” The Automatic Earth ” . Self explanatory .
“Dr D: ““Stocks fall on Powell threat to (maybe) raise rates a tiny bit TWO YEARS from now …”
I saw that yesterday and had to read the sentence a few times, think about what year we are currently in (2021), convince myself the year 2023 wasn’t a typo, then reread how little the rate would be raised … ??
Alice, my dear, we ain’t in wonderland anymore.
The stock market moves when Powell passes gas, doesn’t really mean much. 🙂
The real question is just how steep is Seneca’s cliff. Drilling these past 2 years have been way down everywhere.
That includes SA, Kuwait, and the rest of OPEC. Output in places like Angola, Algeria and Nigeria is not coming
back without a lot of investment. By who? Not the majors. Shell will not drill in Texas, much less Nigeria.
US tight oil appears flat for now, but the last few months have been estimates by the EIA. So far drilling has
been slow to recover even with substantially higher prices. Canada can grow some, but not a lot until there
are more pipes or prices high enough to pay for rail. Russia? The North Sea? Alaska? Kazakstan? None
of it looks to even get back to 2019, much less grow. Ron is right, 2018 was it. But how steep the
slide is now the question. Do we see $100 next year? $150?? Even so, and if drilling picks up, you can’t get a child
in less than 9 months even if you get a dozen girls pregnant. Except for shale, that 9 months is more like 5 years. look
at Guyana. Just an opinion.
Pilot,
Consider Rune’s post above where he expects oil prices will fall in the near future and your opinion that we will see a Seneca cliff in oil output.
The only way that both of these scenarios could be appropriate for World output is a severe Worldwide economic depression.
Is that your expectation? My guess is the odds are less than 1 in 25 that expectation would be correct over the next 10 years.
Perhaps when peak oil actually arrives and we see World output falling by 2% per year or more with high oil prices (over $100/bo in 2020$) due to lack of oil supply (circa 2030-2031) we might see a severe World Depression (Great Depression 2). Much depends on the speed of the transition to alternatives to liquid fossil fuel for transport, a slower transition makes the prospect of an economic depression far more likely.
Dennis- “and we see World output falling by 2% per year or more with high oil prices (over $100/bo in 2020$) due to lack of oil supply (circa 2030-2031)”
I put more chips on the high price scenario where that time frame (2030) is moved forward about 5 years due to sub-optimal human management of economy and politics (rather than geologic/technical constraints). Take your pick- resurgent nationalism in places like USA, war in the middle east, china asserting its muscle in its front yard (south china sea), Russia moving to assert re-control over its neighborhood, breakdown of civil society due to rising food prices or military coups, for example.
Of course, these kind of factors have huge uncertainty and don’t mix well with models.
When it comes to oil, some countries are much more vulnerable to price rise/supply disruption than others. For example, in this decade Russia, Canada and the USA are in a far different category than China, India, Japan, Korea, and most countries in Europe. The second group are examples where the pain could come fast and hard. It won’t be a quiet world if affordability or supply shifts unfavorably.
Hickory,
It is possible it will be 2035 or so, but my guess is that the transition to electric transport will be far enough along in 2035 that demand will fall below supply and we will see falling oil prices by that point in time. A slow transition to EVs due to supply contraints on batteries or other material shortages leading to high prices for EVs would be consistent with your scenario, 15 years is a long time so predicting that far forward is likely to lead to poor predictions (same can be said for 5 or 10 years, but bigger time spans will lead to much poorer accuracy).
In the past I have tended to underestimate the growth of oil output, projections have tended to be on the conservative side.
See
https://peakoilbarrel.com/2017/03/
for my expectation for tight oil in 2017 and note that most did not predict the pandemic of 2019-2021 in 2017, chart below is from that old post.
Pilot,
Fair point!
The big problem that I see is the lack of capex. There has been a lack of discoveries since 2005 and that will add on to it, but the big problem now is the inability/unwillingness of companies to spend capex on oil developments. This is partly because of the ECG and climate change narrative and partly because of weak balance sheets of o&g companies.
2020 O&G capex was a sharp drop over 2019 and 2021 is not much better, in fact it’s looking worse than last year. This will all come back to bite us all and not just the virtue signalling idiots pushing the climate change narrative.
I don’t agree with Rune that oil prices are going to decline. I don’t see demand declining for the next 5-7 years at the least and I don’t see supply keeping up. How can we have a low oil price in that scenario??
“The big problem that I see is the lack of capex. ”
With the prices levels for oil of the past 5 years (mostly between $45-75/barrel) , just what projects or type of projects are starved of capex currently?
Apparently most of the eager money has gone to LTO production, yet
“Despite rising production over the past decade, free cash flow per barrel of oil equivalent produced has been negative. Exhibit 1 plots production alongside free cash flow for a sample of 36 leading independents that we studied across unconventional basins.”, according to analysis by Mckinsey as of 2019.
https://www.mckinsey.com/industries/oil-and-gas/our-insights/paths-to-profitability-in-us-unconventionals
And if the LTO industry has not been rewarding capex, then what are the other projects that would?
It looks to me that prices will have to get higher and be sustained for quite a while to really get capex flowing strongly.
Ancient Archer,
I agree oil prices are likely to rise. If that is correct we are likely to see increased CAPEX in the oil industry which will tend to boost supply relative to a lower level of CAPEX. My expectation is that prices will rise to a level where supply increases and demand decreases to the point of market balance. The oil price where this occurs is anyone’s guess, my guess for 2023 is $90 to $100/bo for Brent in 2021 US$ in order to balance the market, but it might be anywhere from $80 to $120, very difficult to predict ad there are many potential wildcards.
Dennis,
The only issue here is lead time.
As Pilot said above, it takes 9 months to get a child. You can’t process this thing in parallel. Getting 9 women pregnant won’t get you a child in 1 month.
Same goes for capex. There is a lag of around 4-5 years (I think) before higher capex has an effect on oil production. If oil goes to $120 tomorrow and everyone and their aunts wants to invests in capex, it will still take a long time for the high capex level to make an impact. Higher production won’t tomorrow just because you invested an insanely amount of capex now. You have to wait. And in the meantime, depletion won’t be sleeping.
Then we come to the 2nd point – about the lack of discoveries in the last 15 years. So, it’s not that if you want to invest capex, you will be able to. There are very few new conventional discoveries in which to put the money to use.
And lastly, all this has come to pass because of a lack of capex since 2015. Most of the capex in O&G after 2014/15 has been in shale and has been pissed away. US shale production from wells drilled prior to 2020, declined by 2mmbpd in 2020. The capex that was invested in shale is not equal to the capex invested in deep water when looking at long term production.
So, you have a situation where the industry has been starved of capex for the last 7 years and they are still cutting capex. The oil price has been low for the last 7 years primarily due to (a) the long lead time nature of capex – capex cuts also took 5-6 years to affect production, and (b) fast flowing shale – but that growth is now history.
Your idea of high oil prices immediately impacting supply is bonkers. If you incorporate a 4yr wait from capex to production, how does it impact the demand and supply situation?
Ancient archer,
Not all capex takes 4 years to impact output, in some cases it is as little as 6 to 9 months, it depends on the project. Onshore infill drilling will have a pretty quick impact, also expansion of already developed oil sands projects might impact output pretty quickly once FID is made.
Arctic and deepwater offshore clearly take longer especially for a new project, but even in those places expansion of existing facilities will have shorter lead times than a new field development.
Can someone explain to me how oil prices will decline when supply will not keep up with demand in the future?
Johnny,
Rune may foresee a financial crisis in the near future, I don’t see it, but I have missed these in the past and future crises I am unlikely to predict, Rune studies financial markets more closely than me and probably knows more.
I don’t think it is possible to predict the timing of financial crises, if I could I might be a very wealthy man, alas I am not.
If the forecasts of major agencies (OPEC, IMF, World Bank, etc) are close to being correct, I expect real oil prices (in constant dollars at market exchange rates) will rise over the next 2 years, likely reaching $90/bo for Brent in 2021 US$ by the end of 2022 for economic growth rates forecast by the IMF in April 2021.
We are in for an uncomfortable number of years. Here I am in Texas and being told by ERCOT that we have to raise our thermostats, not wash clothes, power down electronics because (now at the beginning of summer) we can expect rolling blackouts. How can that be? It is always hot in Texas in the summer. The electric grid which requires a certain amount of green energy cannot handle the load. Now imagine about 5 million new EVs in Texas. This country is so woefully inadequate and unprepared for to the infrastructure needed to supply electricity needed in coming years and it will take a long time.
As I read this blog and I see the discussions, all I can share is what I have experienced. When we started drilling in 2014 we had over 1200 locations in the Permian Basin . Today in 2021 we have drilled over 130 wells and we have approximately 300 safe drilling locations remaining. In other words we have roughly 1/4 of the locations we had originally expected. So when I see the lack of CAPEX, the rate of consolidation, and the fewer number of quality drilling locations remaining, I look at the charts that predict significant production increases in the Permian through 2030 and I say no way! We will be lucky to be where we are today production wise in 2030 even if the the price was $500 per barrel. Locations are not infinite for $9 million dollar wells. With. $100 oil, I could expect spacing could narrow and we could add another 20% to the drilling inventory (max). Again it is simple. Follow the money. Companies are not putting out more drilling rigs and instead they are buying other companies because the producers know that inventory is dwindling and the best way to outsmart the neophyte analysts on Wall Street is to divert their attention to a new activity which is M & A. However if you look closely at all of the small public’s PUDs and Possible you would realize that we are closer to the end than the beginning.
The world has enjoyed cheap energy and this era is over until we discover new forms of cheap and abundant energy with or without a climate change concern.
Its Texas——
Good luck!
In the half century I’ve been an oil and gas operator, with a check book, I’ve learned two things I could always hang my hard hat on. One, never try and predict the price of oil, make financial decisions on reality, not hope, and…Two, never bother trying to explain well economics, or how the the oil and gas business works in reality, with people that have never owned working interest. It can’t be done. Most of the charts and wild ass predictions being made here are being done by people who have never seen a drilling rig.
The ultimate proof in your beliefs, your opinions, your analyses, is to put your money where your mouth is, then reap the rewards or suffer the consequences. Not many google minded analysts have the cajones to do that.
$70 WTI will not help the US shale oil space, nor will $80, even $90. You’ll get that soon enough, even those of you who don’t care whether the public or private shale oil industry pays back the nearly $300B of long term debt it has…that is still growing, by the way. The idea that the Permian is going to be able to pay back over $100B of debt between now and 2025, and still grow production levels, is ludicrous. YOY base decline rates in the Permian alone are 2 MM BOPD.
The rest of oil producing world has been set back on its heels the past decade. Low, volatile oil prices have disrupted the entire world oil order; capital to replace falling PDP reserves has been wacked and no noteworthy discoveries have been made worldwide other than Eastern South America. $70 oil will help the rest of the world much faster than US shale oil, but even that is going to take years.
So, hold on to your knickers, the price of oil is, near long term, going thru the roof. As the world suffers thru the economic ramifications of higher oil prices remember who the culprit is behind all this shit. Its US shale oil. US shale oil put 4.8MM BOPD of leveraged LTO on a balanced world oil market and in 2015 the price collapsed accordingly. Since then US shale oil has KEPT prices low and volatile, in spite of OPEC’s best efforts, and sucked capital necessary to arrest decline and replace PDP… from the entire rest of the world.
I said six years ago the US shale oil phenomena was going to prove harmful to the world’s oil future and here we go.
https://www.oilystuffblog.com/forum/forum-stuff/snakey
Mike, from your link:
I mean, think about it…why on earth would we want to be using cheap OPEC and Russian oil when the good ‘ol US of A can borrow money to drill unprofitable shale oil, flare its gas, deplete groundwater resources to frac it with…all so we can export the last of our natural resources to other countries, now?
Damn good question. Anyone got an answer?
Capital that needs a home, combined with good PR.
We built a water recycling facility. I truly can’t understand why the states don’t mandate a certain percentage of frac water be from a recycling source. It is a travesty and wasteful. Of course it raises the cost of Drilling amd Completions but not that much and should be required by all LTO E&P companies.
Good post Mike.
Thank you, LTO. Everything you say about the HZ tight oil space in the Permian, its declining well productivity, pressure depletion, remaining “drillable” locations, etc. is very much worth paying attention to and learning from, not arguing about.
Hi Mike,
I have run the numbers for the Permian basin based on shaleprofile output data for oil and natural gas for average 2019 wells, I assume productivity declines going forward and use the medium TRR estimate from USGS as a baseline, a wellhead price of $70/b and NG prices at $1.75/MCF at wellhead and NGL sold at 25% of wellhead crude price, well cost assumed to be $10 million, royalty and taxes at 28.5%, operating costs about $13/bo. Well payout is at about 30 months and the net present value of future net revenue over the life of a new well using a nominal annual discount rate of 30% is about $10 million. The Permian tight oil debt is paid back under most reasonable scenarios by 2025 or so.
Johnny —
In a free market economy, prices are set by marginal costs. That is the theory anyway. The idea is that competition drives prices towards marginal costs, and damn the torpedoes. If I can sell cheaper than the competition and still make a buck, who is there to care about tomorrow?
Oil prices tend to be driven by the futures market, which is based on changes in stored quantities, horoscopes, herd instincts and whatever scare story happens to be in the papers today. This is probably only possible because oil is very cheap in practical terms. By that I mean oil is too cheap to encourage conservation. So the price wanders around in the wide margin suppliers really need and consumers can really afford. The fact that there isn’t any handy replacement for storing energy in a moving vehicle helps.
But futures markets are basically a casino. There is no realistic, generally accepted take on future supply, as the whole bruhaha around Peak Oil shows.
So, as Ron points out, the mostly likely result is that oil will be sold cheap until it suddenly runs out. That has happened to fish stocks many times in the past. The only realistic ways out are governments slamming on the brakes before the economy hits the wall, or a better alternative appearing, which some are betting is batteries.
“probably only possible because oil is very cheap in practical terms. By that I mean oil is too cheap to encourage conservation”
That’s a very interesting way to look at it. Not many people do.
Indeed $3 is really really cheap for the amount of energy you get. Just try pushing a wheel barrel full of gravel up a hill for mile, or plow a rocky field behind a horse, to get a real good sense for how cheap gasoline or diesel is.
Very few things in the world give you such a big bang for the buck.
You can purchase roughly 4 gallons of gas for one hour work at minimum wage here in the states!
Never in history has such an incredible energy deal been available, and to so many people.
The success of the industry at bringing huge supply to the global market has the enabled incredible growth of humanity..overgrowth many would say.
And the billions of us all have gotten used to the idea of inexpensive fuel, and have learned that it is normal state of affairs to use the energy on a whim, for fun or entertainment, or with no regard to efficiency of use or the precious nature of the energy. As if it will always be cheap and there will always be enough.
This not the normal state of affairs in the history of humanity. We are in pretend mode with our way current way of life. We even consider flying in a plane as routine, rather than as an extraordinary (in the extreme) use of energy.
Unless you have unlimited budget for fuel in your personal and business life (and this applies to everyone and the country as a whole), better get used to living with a lot less fuel in the post-peak era.
I suppose this is all obvious, but it seems that the prevailing view of the culture is to somehow consider gasoline to be expensive. People are in for an education on that.
Hickory —
Oil is expensive compared to coal, which is why it plays a marginal role in electricity generation. But $3 a gallon is too cheap to conserve. In Europe it costs twice that, and consumption still isn’t close to optimal.
In America the rich buy new gas guzzlers and the poor buy used gas guzzlers, which skews the market towards waste. In Europe the poor have other options, like public transportation and mixed use zoning, which reduces consumption somewhat, especially in cities.
But if push come to shove I bet economies could cut fuel consumption by half without creating any real economic problems.
“But if push come to shove I bet economies could cut fuel consumption by half without creating any real economic problems.”
The USA could, but it would be extremely painful for the sectors that rely on discretionary/optional use of fuel. If the loss of oil happened quick it will be depression level economics, for a very long time/indefinitely. If it happens slowly the economy could adapt to a large degree.
Over the past few years, we have seen prices drop because of oversupply: it is difficult to increase usage quickly to take advantage of low prices, hence the price drop. My guess is that this inelasticity will not work in the other direction. There is so much wastage (perhaps overuse is a better term?) because of low prices that there will be little problem with cutting back: the pandemic proved it. I see the chance of a slow clawback of usage: maybe a foregone flight here, an electric bicycle purchased there. Essentially, a lack of clear market signals: the same process that convinced people that investing in LTO was a profitable idea. Over the past 10 years, there has been a $100 a barrel price fluctuation in WTI, masking useful price signals because of the multi-year time frame between finding oil and bringing it to market (I am in accord with Ancientarcher on this point).
I expect to see the same thing on the way down. For a period of time, LTO investors in the process of losing their money will continue to depress the market. An ongoing low-price market depends on geological, political and financial factors: a bobble in any of these leads to fluctuations in price (like we have seen in the past ten years). I expect this to continue. Something momentous (a war, a Seneca cliff in Saudi, a depression, an ecological tipping point) could lead to an ongoing higher price market.
So there you have it: a) current conditions favour low prices because of opaque market signals, and will probably continue for some time, and b) Something bad could happen, leading to higher prices.
Lloyd,
Short supply relative to demand will likely lead to rising oil prices. If OPEC plays it smart, oil prices could remain at $80 to 90 per barrel for many years (until 2030 or so). By that time we will have reached the ultimate peak in oil output as determined by the combination of demand and supply (which will be in part determined by a combination of geological and technological factors). After that it will depend on whether we have planned for the peak and have started to transition away from fossil fuel. Poor planning and a failure to see the coming peak will lead to a spike in oil prices followed by a potential economic depression. Better planning might lead to more balanced demand and supply of oil with moderate or even falling oil prices under the most optimistic scenario (low odds of this in my view before 2035, less than 1 in 10).
My guess for the final decline in oil market is a very bumpy price curve.
Nobody wants to do giant investing into a declining market – so big project will be rare. Squeezing out existing fields will be the way to go.
And when the demand decline is slower than the decline in the fields, prices will shoot up. Especially deep sea fields can decline very fast, or creamed giant fields.
With sky high prices a few projects will be started new, together with the steeper, price induced decline oil price will collapse again, investors will burn their hand for their 100 billion $ new oil field, investing in oil will be a no go, decline will be again faster than demand…
In my opinion we will see a rough sailing, especially because infrastructure can’t be changed that fast. Going from coal train infrastructure for everything to an oil car / truck structure took round about 50 years – and this time frame we will have again.
This is not correct. The drilling inventory is not there.
Again, most no premium consolidations occurring in the Permian are bigger fish swallowing littler fish because of the need for drillable A locations. The Permian HZ tight oil space cannot now make enough money at $70 for 100% RRR, dividends and deleveraging) with the best of their remaining inventory; they KNOW their plight having to drill B locations. FANG, for instance, says in the their IP’s they have 15K locations left to drill but that stuff is in pastures where goats would not dare to trend. That’s why its wanting to consolidate with folks who still have some good stuff to drill. Same with many others in the PB.
This is all a big problem, as LTO points out, who is actually IN the oil business, actually IN the Permian Basin and actually drilling those wells. But nobody wants to pay attention. Experience and instinctual know-how in the oil business is now perceived to be anecdotal, particularly if it runs counter to the sector’s narrative about abundance.
Data is the new oil, even if it is the wrong data. How can that big ‘ol part of Texas being running out of good shale wells to drill? Count the drillable locations all pure shale players tout; they’re not lying! Nobody lies on the internet. Take the TRR crap the USGS came up with 3-4 years ago.. we’re sitting on the Gulf of Wolfcamp; we’ll never run out. We’ll double current PB tight oil, recover 58G more BO and pay back all that debt, the charts say so !! The EF is in hospice care, the Bakken is Stage 4, but the Permian will live on forever.
Its wrong, of course, but when you have never worked out of a checkbook to drill these kind of wells, and tried to make a “business” survive by drilling stuff hat will only have a 35% ROI over 15 years, you have no “instincts” to trust in. All you’ve got to occupy yourself with is data. Even when its bad data.
Remember, shale oil is going to make a little money this year, for the first time, in part by not drilling enough wells to maintain reserve replacement. With 85% decline rates the first 32 months of production life, how do you think THAT is going to turn out?
Hi Mike,
I use USGS estimates as a starting point, because that’s what is easy to use. I take the net acres from the Spraberry, Midland and Delaware basin studies and the mean TRR estimates and then apply the economics using $70/bo at the well head as a maximum oil price from 2021 forward (actual oil prices up to the end of 2020 are used for the 2010 to 2020 part of the analysis. My 2019 average well profile has 377 barrels of crude plus condensate output over a 200 month well life. Wells are spaced at 1000 feet and are assumed to be about 10,000 foot laterals (roughly 250 acres per well). The USGS estimates have about 50.4 million net acres at of the end of 2017 (this is undiscovered TRR which ignores economics). At 250 acres per well this gives a TRR estimate of 199 thousand wells and UTRR of 70 Gb, average well would have EUR of 350 kbo for such a scenario. Clearly you and LTO survivor don’t think such an estimate for mean TRR is correct, so we could use the F95 USGS TRR estimate (44 Gb) which at least would be closer to what you believe (though probably still too high).
Below is a scenario I did back in 2019 for a low TRR scenario of 44 Gb, with an ERR of 39 Gb for the prices shown on the chart (Brent is shown WTI would be $5/bo lower) well cost assumed at 10 million in 2019 $, royalties and taxes 28.5% and OPEX about $13/bo over life of well, NG assumed to sell at $1.50 per thousand cubic foot and NGL at 25% of wellhead price for crude, discount rate assumed to be 10%, and interest rates 7.5%. Total horizontal tight oil wells completed for the scenario is 114 thousand (with about 33 thousand completed through April 2021).
No doubt you an LTO survivor would think this too optimistic, we will see. (I think this scenario is likely to be too pessimistic).
Alternative Low TRR (44 Gb), low oil price (Brent $56/b) scenario. Total wells drilled 67 thousand of 215 thousand potential wells (in a more optimistic mean USGS scenario with TRR=75 Gb) or 31% of potential with mean TRR and high price environment (oil at 200 per barrel). The economically recoverable oil in this very pessimistic scenario is 25 Gb. Note that about 7.2 Gb of tight oil has been produced from the Permian basin from Jan 2000 to April 2021 and 1.3 Gb was produced in the past 12 months, the midpoint of the 25 Gb would be 12.5 Gb, about 5.3 Gb more than produced to date and would be reached in 3 to 4 years at a continued rate of production equal to the current rate.
The scenario below peaks at 5200 kb/d in 2027 followed by steep decline.
Another thing to note is that LTO survivor said he initially expected 1200 drillable locations and has completed 130 wells with about 300 profitable locations left or 430 of 1200 which would be about 36% of initial estimate. My best guess scenario has about 184k wells completed vs 67k wells in the scenario shown below or 67/184=36%. So perhaps this scenario would fit better with LTO survivor’s experience. It is unclear if his 130 wells are representative of the 30000 wells completed in the Permian basin, it will be interesting to watch.
Mike,
The analysis may well be wrong because it is based on the USGS mean estimate for Permian TRR of 75 Gb, but I have also done estimates using the USGS F95 estimate of 44 Gb for Permian TRR. What is your thinking on that estimate? The ERR estimates that flow from these TRR estimates (39 Gb for $75/b Brent) is based on what I have learned from you on well economics. It takes account of the high decline rates of these oil wells and used a discounted cash flow analysis to arrive at the estimates. I could increase the nominal annual discount rate to about 23% which coincides with a 36 month well payout for the average 2019 Permian well and perhaps that would improve the analysis. The 10% discount rate I have used in the past was based on the number I see in SEC filings for oil companies. I use a pretty high interest rate assumption for oil company debt at 7.4% nominal annual interest rates, I would think most large oil companies could get about 6% on debt today.
Average 2019 Permian well profile that I use in my analysis shown below. EUR is about 370 kbo assuming well is shut in after falling below 10 bo/d.
Average new well EUR assumed to decrease starting in Jan 2020 in the analysis with the shape remaining the same and the curve shifting downward over time (probably inaccurate, but a simplifying assumption as future well profile is unknown).
Dennis, what is TRR? Is that Total Recoverable Reserves or Total Remaining Reserves? If the former, what are you using for total cumulative production?
Ron,
TRR is technically recoverable resources, which is the sum of cumulative production plus proved reserves, plus undiscovered technically recoverable resources (UTRR). At the end of 2018 the USGS mean estimate for UTRR was about 70 Gb for Permian basin (three studies on Wolfcamp/Midland, Wolfcamp/Delaware and Spraberry) and my estimate of cumulative production and cumualtive reserves at the end of 2018 is about 5 Gb for Permian basin tight oil.
Okay, I did the math. In the 2 years, 5 months since the end of 2018, the Permian has produced around 3.5 GB of oil. That brings the total cumulative production to about 8.5 GB. So if originally there was 70 GB of shale oil in the ground, then we have produced about 12% of the Technically Recoverable Resources. We still have 88% of Permian oil left to produce.
Well, okay, natural gas is a resource also, and that would change the equation somewhat. However, we would still have, by a very wide margin, most of the Permian oil still left in the ground.
The question is Dennis, do you believe that? Well, that has to be a rhetorical question. From the charts you have posted the last few days, it is quite obvious that you do believe that the Permian still has far more oil to produce than it has produced in the past. That is several times the amount of past production.
But Dennis, really? I think you are embarrassing yourself with such a nonsensical opinion. Of course, you are in good company. The USGS is embarrassing themselves also. They are obviously not talking to the oilmen in the field. But Dennis, I thought you would put more credence in their opinions.
Ron,
The 5 Gb includes both cumulative production plus proved reserves at the end of 2017. From Jan 2000 to Dec 2019 about 5.4 Gb of tight oil was produced in the Permian basin, no data prior to that on tight oil output.
Proved tight oil reserves at the end of 2019 in the permian were about 12 Gb, so proved reserves plus cumulative production at the end of 2019 was 17.4 Gb. Note that technically recoverable resources do not include economics, when we make a set of economic assumptions and combine this with the technically recoverable resources we get an estimate of economically recoverable resources (ERR), for the Permian this would be about 62 Gb for the USGS mean estimate and oil prices at about $75/bo.
Note that the USGS estimate for the Bakken from 2013 has been pretty spot on, cumulative production to the end of 2019 has been 3.3 Gb, proved reserves at the end of 2019 were 5.8 Gb for a total of 9.1 Gb. Using economics applied to the USGS mean TRR estimate of 11 Gb in 2013, I get an ERR estimate of 8.7 Gb, some of this difference may be proved reserves in Montana Bakken/Three Forks.
Perhaps the USGS has become worse at making these estimates from 2013 to 2018, I doubt this because they had much more information in 2018 than in 2013.
Mostly I have embarrassed myself by consistently making future estimates that have been too low while being told by others that the estimates were far too high when I have made them.
My guess is this is the case today as well, time will tell.
Dennis, thanks for the clarification. But what really bothers me about your predictions is that the few oil men we have on this blog, at least a couple of them are actual Permian producers, are telling you something totally different. You tell them, something to the effect, “Yeah, but my data comes from the USGS, and that trumps your opinion.” No, I know you don’t use those exact words, but that is exactly what you are implying.
I think you should give them more credence, a lot more credence.
Ron,
There are other people in the oil business that have opinions that are different from those that post here.
As I have suggested the Bakken estimate by the USGS has proven quite accurate once decent economic analysis is applied. Note that I learned much of this analysis from some of the people that disagree with my analysis.
I have never seen a convincing criticism of the USGS analyses, calling it crap is not particularly convincing.
The Bakken assessment was very good. Permian may also prove to be good.
Mike is surely correct that I don’t have any instinct for oil production. I will also note that Enno Peters at shaleprofile has Permian output increasing in his supply projection, even under the assumption that the completion rate does not increase in the future which is a dubious assumption imo.
Mike is there a good estimate of drillable locations in the Permian basin at a well head price of $70/b?
I don’t look at investor presentations to come up with my estimates, I use the USGS papers as my basis, can you explain how the USGS got the Bakken pretty much spot on (if proved reserves reported are correct), but have missed badly in the Permian basin.
I do not expect the Permian will produce forever, I expect a peak in 2030 to 2032 followed by decline, the steepness of the decline will depend on the price of oil which is alway a big guess in the future and in 2032 a very big guess (40 to 140 perhaps).
Hi Mike.
I for one understand and value the opinion of the guys on the front line. They invariably understand the nature of the task at hand far better than the Generals looking at maps.
I do hope you continue to post here as well as your own excellent blog.
I thought you might enjoy this for entertainment value and they are drilling soon!
https://www.zephyrplc.com/
Lights out,
I am also very happy that Mr Shellman and LTO survivor post here.
I learn much from the pros.
The point of explaining my estimates is so they can be improved. The USGS estimates are used as a starting point, as its the only comprehensive analysis I have access to.
Sometimes the intuition of professionals can vary widely. In many cases when I present my estimates on other blogs the oil professionals consider the estimates far too pessimistic. So those folks seem to have a different feel for wbat is happening.
Note that a low oil price low TRR scenario suggests 25 Gb for Permian ERR and proved reserves plus cumulative output is about 17 Gb.
As oil prices rise it seems likely that proved reserves will increase. I think it very likely the permian URR be more than 39 Gb, based on the USGS F95 TRR estimate of 44 Gb. For those unfamiliar an F95 estimate is one that has about a 95% probability of being too low. The mean estimate has roughly a 50% probability of being either too low or too high. The USGS mean estimate suggests about a 60 Gb URR for Permian basin.
‘Big oil is over’: courtroom dramas and boardroom coups signal end of crude
Shareholder revolts at Exxon and Chevron, and a courtroom upset for Shell, have dared campaigners to dream that we are approaching peak oil.
The oil industry is having a torrid year, and climate campaigners are delighted. For the first time, there is a palpable sense that the sands are shifting for a sector whose business model is incompatible with climate targets. Support for big oil appears to be dripping away.
The cancellation last week of the Canada-US Keystone XL pipeline was the latest in a series of turning points for the sector. The $8bn (£5.7bn) project was due to pump 830,000 barrels of crude oil a day from Alberta’s tar sands to Nebraska. However, the firm behind it, TC Energy Corp, canned the project last week after President Biden – acting in January – revoked the permit for it to cross the US border.
The controversial pipeline had been the subject of a 13-year David and Goliath battle between indigenous communities, whose land it would have gone through, and big oil. It was deemed critical for the future of Alberta’s oil industry. Now it is no more.
Russia to cut crude production in June despite OPEC plus output recovery, says statistics
Russia’s average daily oil and gas condensate production amounted to 1.419 mln tonnes in the period from June 1 to 14, 2021, down by 0.6% compared with May when the average daily crude oil output totaled 1.427 mln tonnes, according to the data released by the Central Dispatching Department of Fuel Energy Complex obtained by TASS.
If the Russian oil production statistics is recalculated in barrels at the coefficient used for Russia’s Urals oil (7.33), the country’s average daily output as of the middle of June amounted to 10.4 mln barrels…
Note that production from OPEC plus largest producer was 10.52 mb/d in early April, i.e. production is down by 120,000 barrels per day since the beginning of April despite (1) higher quotas and (2) higher oil prices.
The North Dakota & Bakken production data for April has just been released.
All North Dakota
Production was up 12,645 barrels per day to 1,121,551 bpd. That’s about half the increase they had in March. On an interesting note, daily production per well, for the last three months, has been 70 barrels per day. That’s the lowest it has been since the fracking boom began in 2011. The all-time high was 104 barrels per day per well back in September 2014. That is for the shale era. Data for conventional wells, in the early 1950s, was considerably higher.
Data for the Bakken only is a bit higher but with a similar pattern. Daily production for the Bakken reached 144 barrels per day for several months in 2012. But for the last three months, and once last year, daily production per well was 76 barrels per day. That was the lowest daily production per well since December 2007, well before the shale boom began.
The drop in Cap-Ex over the past 6/7 years has created another big problem, as has the current level of
inflation in the prices of oilfield supplies, especially steel. It will be very difficult to call back into service a
lot of the rigs that have been cold stacked. They have been stripped of parts to keep the operating fleet going
at a time when everyone in the industry has been pinching pennies. This is especially true for offshore rigs.
Maybe Denis can get back some onshore shale rigs on fairly short order, but the same is not true for most
rigs that have been idled overseas. Additionally, the cost of steel and other supplies has and is rising so fast
that whatever figures are being used to model an increase of drilling should be substantially raised. The same will
be increasingly true of frack spreads. How badly have idled spreads been stripped of parts and components,
and how worn out are they? Ordering and buying new offshore rigs, or frack spreads is a long term
proposition. Is that incorporated and any of these models that smoothly increase supply with price?
You have had very valuable posters show just how much the
proved reserves of major companies have fallen over the past
decade. Shell is the worst, with Reserves down to only about
8 years. What is not said is that studies have shown that
attainment ratios for proved reserves have fallen to only
about 75%. That means that only about 75% of the PDP–
proved developed reserves are actually going to be produced
before plug and abandon time.
Again I ask, just how steep is Seneca’s cliff?
Pilot,
Yes reserve replacement for oil majors and supermajors has not been good. There is a lot of potential output from NOCs, and from oil sands in Canada, and US tight oil. No idea how long it takes to get rigs back to work, but looking back at 2016 to 2018, it was pretty quick in that case.
The steepness of the cliff will depend on demand relative to supply. If demand falls steeply, then supply will follow. If the demand is there supply will either plateau or fall gradually (1 to 2% per year until 2040).
Dennis, why will supply only fall “1 to 2 percent a year” ? Cantarrell fell 30% per year when the peak
was hit, dragging Mexican production down by over 25% per year for several years. Angola has declined
by about 10% per year for the past 5 years. US production began to decline in 1971 at more than 2%
per year, up until shale became commercial. What is the factual basis of that 1 to 2% per year statement?
Are you assuming some stability in large numbers, and is that valid? How fast has the North Slope declined? The North Sea? Venezuela? What am I missing? Plateau, or decline 1 to 2%???? Just how
steep is Seneca’s cliff? pilot
Pilot
Micheal Höök has studied the decline rates of world’s giant fields. For fields larger than 1 Gb he found that the mean decline rate was 5.2% and the median was 4.3%. Only one had a decline rate of nearly 30% and most were under 10%.
https://royalsocietypublishing.org/doi/pdf/10.1098/rsta.2012.0448
Pilot,
World resources are likely 3200 Gb of C plus C, extraction rate for producing reserves has been over 5 percent for the past 70 years, a Seneca cliff scenario requires the extraction rate to fall to levels never seen in history, it just is not likely to happen. Yes individual fields have seen steep decline. For this to happen at the world level we would need to see this occur for all fields simultaneously, a highly unlikely scenario, perhaps a probability of 0.01%.
We could see a short term shock like Iran/Iraq war or Pandemic. A long term Seneca cliff is not likely.
Can you give me the factual basis for World output decline over 5 or more years at more than 2% per year. Afaik this has not occurred from 1870 to 2021.
Dennis, You have said before that your estimate for the ultimate comes from Jean Laherrere. Are you sure that your 3200 Gb is for C and C? How was this estimate obtained? When did he report it? As you know the estimate changes each year.
The value is likely 2900 Gb.
best, Seppo
Before the pandemic, on average, more wells were being drilled than completed, causing DUCs to increase. Since July 2020, more wells were completed than drilled, increasing DuCs. And the trend continues.
I think the reason for this trend is obvious. It cost less to “complete a well” than it does to “drill a well and complete a well”. It’s that simple. It’s all about capex, which they do not have enough of.
Ron
In response to your comment under my chart above, I think we are looking at two different questions. My ratio Frac/Rig is shedding light on the question of how many frac spreads are required to keep up with the number of operational oil rigs. According to the posted chart, it only takes 0.7. In addition this number is also sufficient to frac DUCs. The implication being less than 0.7 frac spreads are needed to keep up with the rigs alone.
The other implication is that fracking a well takes less time than to drill it.
Any additional info from field or hands on experts is appreciated.
Ovi,
In 2019 to 2020 the ratio of frac spreads to rigs was about 0.4, during a period when DUC inventory was growing. If there has been no change in either frac spread or drilling rig productivity for the past couple of years (a dubious assumption likely to be incorrect), then a steady state DUC inventory would have a frac spread to oil drilling rig ratio somewhere between 0.4 and 0.7 (perhaps in the 0.5 to 0.6 range).
Dennis
I generally agree. I think it is closer to 0.5 since the rigs I track are solely oil rigs. I assume that the frac spread numbers that are reported at (https://www.aogr.com) are for both oil and gas spreads.
Most of the comments here concern US shale so these papers by Ted Patzek, written over the past 10 years but recently indexed on his site, may be of interest:
https://patzek-lifeitself.blogspot.com/2021/05/papers-on-us-shale-plays-by-patzek-et-al.html
Thanks George great link. The man knows his stuff.
Paper by patzek linked below is very good.
https://www.mdpi.com/1996-1073/13/8/2052
I noticed a mistake in the paper where it is stated that USGS estimated TRR for Bakken/Three Forks is 7 Gb, this is incorrect.
The 2013 Bakken/ Three Forks assessment estimated 7 Gb for undiscovered TRR, one must add cumulative production plus proved reserves to get TRR when we do this we get about 13 Gb and 11 Gb for North Dakota section of Bakken/Three Forks alone.
At the end of 2019 proved reserves plus cumulative output was about 9 Gb for Bakken/Three Forks.
It looks like Shell is planning on selling all of its Permian holdings, could be a bellwether for the whole LTO business:
https://www.worldoil.com/news/2021/6/14/shell-said-to-consider-sale-of-largest-oil-field-in-the-us-valued-at-up-to-10-billion
A very interesting article came out a couple of days ago concerning Shell:
Royal Dutch Shell: You Cannot Fight Geology, The Dutch Court Ruling Doesn’t Change Their Future
One of the biggest pieces of news for Royal Dutch Shell recently has been the Dutch court ruling that forces them to make a larger 45% emissions reduction by 2030.
Despite this sounding very transformation, considering the geological and economic reality of their current situation, it actually does not significantly change their underlying future.
Their reserve life is only sitting at just above seven years and thus even if they wished to maintain their fossil fuel production, they already required significant investments before 2030.
SNIP
You Cannot Fight Geology
Upon reviewing their reserves, it may initially sound very impressive to hear that their oil and gas reserves currently stand at slightly over nine billion barrels of oil equivalent. Although in reality this actually sits rather low when compared to their annual production during 2020 of 1.239b barrels of oil equivalent. This effectively only leaves their reserve life at just above seven years, which is not particularly long and thus means that their fossil fuel production would already begin shrinking dramatically by the latter half of this decade. Admittedly they would likely continue replacing a portion of their oil and gas reserves in the future but their current production rate would still see them running very low by 2030 if approximately half were replaced per annum, as the graph included below displays.
There are two charts in this article. The second on titled: Oil Discoveries Lowest Since 1847 is alarming.
Hi Ron, any thoughts on why Shell would bag their operations in the Permian while they are also running low on reserves everywhere else? Seems like they would be holding on to every scrap of producing land they could. Unless one of two things: 1) they are making a serious attempt to transition to a low carbon energy company; and/or 2) their holdings in the Permian are worth squat…
Well, yes. One reason is (in bold) here:
Interest in Shell’s Permian assets seen as a bellwether for shale demand
NEW YORK/HOUSTON, June 15 (Reuters) – A cadre of oil companies, seeing continued profits in shale, are mulling Royal Dutch Shell’s (RDSa.L) holdings in the largest U.S. oil field as the European giant considers an exit from the Permian Basin, according to market experts.
The potential sale of Shell’s Permian holdings, located in Texas, would be a litmus test of whether rivals are willing to bet on shale’s profitability through the energy transition to reduce carbon emissions.
Shell would follow in the footsteps of other producers, including Equinor (EQNR.OL) and Occidental Petroleum (OXY.N) that have shed shale assets this year, looking to cut debt and reduce carbon output in the face of investor pressure.
Shell, like a lot of other companies, sees shale assets as a very low profit, or even a losing proposition. They can take the money from the sale, reduce their debt, and reduce carbon emissions of their company in one fell swoop. More from the article:
Against this backdrop, estimates for Shell’s acreage run from $7 billion to over $10 billion, the latter implying a valuation of almost $40,000 an acre.
That would be in line with the per-acre price Pioneer Natural Resources (PXD.N) paid for DoublePoint Energy in April, the most costly deal since a 2014-2016 rush by producers to grab positions in the Permian.
Most Permian deals this year have closed between $7,000 and $12,000 per acre, said Andrew Dittmar, senior mergers and acquisitions analyst at data provider Enverus.
If they can get $40,000 per acre they have found a greater fool to offload their acreage on.
Something about that doesn’t make sense. The need or desire to downsize is likely due to an inability to project making profit on the shale assets rather than any concern over a carbon footprint- I don’t believe they are in business to win any kind of beauty contest.
https://en.wikipedia.org/wiki/Brent_Spar
“Shell’s position as a major European enterprise has become untenable. The Spar had gained a symbolic significance out of all proportion to its environmental effect. In consequence, Shell companies were faced with increasingly intense public criticism, mostly in Continental northern Europe. Many politicians and ministers were openly hostile and several called for consumer boycotts. There was violence against Shell service stations, accompanied by threats to Shell staff.”
Things are a little different for European companies…I recall “Greenpeace sympathizers” fire-bombed a gas station back then; in light of what has transpired in the US recently who is to say it couldn’t happen again?
Shell is well aware of peak oil, and can’t solve the problem. So, what would you have them do?
“Shell would follow in the footsteps of other producers, including Equinor (EQNR.OL) and Occidental Petroleum (OXY.N) that have shed shale assets this year, looking to cut debt and reduce carbon output in the face of investor pressure.”
I don’t think it has anything to do with shale oil specifically. For Equinor it has to do with that it can draw on competence in Norway in the harsh offshore environment in the North Sea. Floating offshore wind power is where Equinor is world leading with technology and know how; now about to be utilised in the North Sea, Japan, US East coast and California. It is not more economical than ground based offshore wind mills, but has some advantages when it comes to lifecycle costs. For one, the wind mills can be placed in optimal wind condition areas not in the way of fishing resources. The big size of wind mills will not cause problems (the height and diameter of the blades are necessary to capture enough wind energy). And also the wind mills can be more easily moved to land and recycled, e.g. the steel. Wear and tear offshore is on the minus side.
Usually the blades are made of carbon fiber to make it lighter, but it can also be made of aluminum in the future with lower efficiency.
Shell is just now investing in North Sea South II in Norway for ground based offshore mill farms together with BP. To make the North Sea work with the enormous amount of wind power coming online and connection cables everywhere is very serious business and just a priority. Shale oil is too much of a distraction for Shell and Equinor, not even within their core competence area.
Shell was ordered by a Dutch court to cut by 45%. Of course, they will cut their “losers” first.
Ron
The chart is old and was published in 2016 by Wood Mackenzie and there is no data for 2016. It also leaves out the discovery of Ghawar in 1948, first bar/spike. I have not seen any updates since then. Not sure if Guyana had been discovered in 2016. The original is attached.
Here is Rystad’s discovery graph 2013-2019 including gas. 2019 was better than 2016-2018 in terms of BOE, but it was a bit gassy:
Is the energy transition just a fad??? Irina Slav at Oil Price.com says it is.
Energy Transition Fad Will Send Oil Sky High
Ironically, the wave of ESG investing in global energy markets may lead to much higher oil prices as a serious lack of capital expenditure on new fossil fuels dries up just as demand for crude continues to grow
Pressure from investors, tighter emissions regulation from governments, and public protests against their business have become more or less the new normal for oil companies. What the world—or at least the most affluent parts of it—seem to want from the oil industry is to stop being the oil industry.
Many investors are buying into this pressure. ESG investing is all the rage, and sustainable ETFs are popping up like mushrooms after a rain. But some investors are taking a different approach. They are betting on oil. Because what many in the pressure camp seem to underestimate is the fact that the supply of oil is not the only element of the oil equation.
“Imagine Shell decided to stop selling petrol and diesel today,” the supermajor’s CEO Ben van Beurden wrote in a LinkedIn post earlier this month. “This would certainly cut Shell’s carbon emissions. But it would not help the world one bit. Demand for fuel would not change. People would fill up their cars and delivery trucks at other service stations.”
Van Beurden was commenting on a Dutch court’s ruling that environmentalists hailed as a landmark decision, ordering Shell to reduce its emissions footprint by 45 percent from 2019 levels by 2030.
Cute headline.
‘Energy Transition Fad’
Wrong terminology.
Its a shift that has barely started.
The global economy isn’t going to just sit around while fossil fuel sources go into decline, despite how poorly large human organizations perform in the job of planning.
The effort is very weak to this point.
Poor grasp of the situation.
It will be grasped eventually, and then the effort will be strong.
Fad…no.
There is a possibility of Seneca cliff as major Western countries probably will not be able to adapt to dramatically shirking of oil supply.
That raises the question of the size of Earth population which is sustainable without “cheap oil” and several other interesting questions about the destiny of the current civilization and neoliberalism. Which is already in crisis since 2008 and the USA economy is in “secular stagnation” mode since the same date.
The USA standard of living is partially based on cheap oil and when cheap oil is gone the crisis of neoliberalism will probably became more acute. It is difficult to predict what forms it will take but Trump in the past and the current woke movement are two examples of mal-adaptation to the crisis of neoliberalism in the USA and loss of legitimacy of neoliberal elite (woke movement=, which is supported by Dems and several major companies, is the attempt to switch the attention from this issue — “look squirrel”)
I suspect this that current “irrational exuberance” about EV among the neoliberal elite and upper middle class (especially techno hamsters of Silicon Valley) will play a bad joke with the USA. Prols can’t care less about this fashion and will stick to tried and true combustion engine cars, especially with the current exorbitant prices on EV.
Do we need a rethink or reappraisal on how shale is doing?
After Blowing $300 Billion, U.S. Shale Is Finally Making Money
After years of booms and busts that produced astronomical losses along with a whole lot of oil, the fracking industry seems to have found a sweet spot. It’s poised to generate more than $30 billion of free cash this year, a record, according to Bloomberg Intelligence. While that’s just a blip compared with the $300 billion that Deloitte LLP estimates the sector burned over the previous decade, it marks at least a temporary revival for an industry that a year ago had been largely written off by investors.
https://www.bnnbloomberg.ca/after-blowing-300-billion-u-s-shale-is-finally-making-money-1.1618206
Ovi,
No… this BNN Bloomberg article reminds me of the “Massive Inflationary Manta” that the market was forecasting just a few months ago. However, as this inflationary wave will turn out to be “Transitory,” so will the notion that the shale industry is making money.
Making money for a quarter or two doesn’t change a Decade’s worth of BURNING $300 Billion in CASH.
GOD HATH A SENSE OF HUMOR…
steve
Steve
I am not in a position to challenge the article or you on the profitably of LTO wells when WTI is above $70. One thing for sure is that the oil stocks are doing well.
Attached is a chart of CNQ, Canada’s largest oil sands producer, over the past year. The step jump in late October is when WTI started its move from $40 to $70
For how long? To obtain this, they are restricting the investments necessary to renew the wells. Instead of this, they are fracking and extracting the DUC they didn’t exploit until today.
SAUDI DATA: April crude exports fall to lowest since June 2020: JODI
“Saudi Arabia’s exports of crude oil in April were at their lowest since June 2020 as it continued to hold down production well below its OPEC quota, figures from the Joint Organizations Data Initiative showed.”
Russia’s quarterly crude oil exports to drop 7.2% -schedule
“Russia’s July-September oil exports will drop by 7.2% from the second quarter of 2021”
No signs of any production increase from Russia.
Even higher oil prices will not extract oil from a turnip. Russia has peaked. They even admit it, in print. Russia’s energy ministry forecasts production to never surpass its previous peak.
The reason Russia has peaked is they have had massive infill drilling with horizontal wells, skimming the top of their old giant reservoirs. This keeps production high until…. until the water finally hits the top of the reservoir. Then production takes a nosedive. The same thing is happening to Saudi Arabia. They have been doing this, creaming the top of their reservoirs, since the early 2000s.
These are two of the world’s top three oil producers. The US has a different problem but with similar results. Yet we still have people who poo poo peak oil. Well, I guess you cannot blame them. Those who have predicted peak oil in the past have always been wrong. So why in hell should anyone listen to them this time?
Ron,
Just a different prediction of when the peak will be. I have also been wrong in the past, always too low every time. Perhaps now my estimate is too high, it is certainly possible we could have an undulating plateau from 2018 to 2030 at 83 Mb/d+/1, I just don’t believe that is the most likely scenario as demand comes roaring back as the pandemic recedes and oil prices approach $85/bo (in 2021 US$) in 2022. I don’t expect a glut, just gradually increasing output to satisfy World demand for oil at a higher oil price level.
Does Russia have unconventional oil left? To what extent has the lack of technology hampered Russia’s ability to extract oil? If Russia had the same technology as the most advanced companies in the West how much higher would their production be?
By unconventional I assume you mean shale oil. I have read that they do. But it is very remote and would be very expensive to extract. As far as I know, they have made no effort to develop any shale oil reserves.
I would think Russia has the same technology that the rest of the world possesses. Oil production is not a super secretive process. The technology is very easily available to everyone in the business. Their problem is not technology, it is geology.
Andre, concerning Russia’s Shale oil reserves:
In Russia, the main volume of shale oil (LTO*) resources is located in the Bazhenov, Domanik, and Khadum formations, of which the first is the most promising. The Bazhenov formation is a group of mature source rocks found over an area of about 1 million sq. km in Western Siberia.
Production cost from the Bazhenov reserve would be enermous. They may one day be developed, but not likely within the next decade.
See https://en.wikipedia.org/wiki/Bazhenov_Formation
My understanding is that developing this resource is challenging. Marc Blaizot has made an estimate on the amount of LTO worldwide. The amount is astonishing.
There is a second problem, it is the climate. The oil shale area in Russia extends from arctic areas to the Kazakhstan on the eastern side of Oural. And fracking techniques use a lot of aqueous solutions. While it is done without problems in Texas or New Mexico, it is going to be a little bit harder during Siberian winters. This is why the authors of the last Shift Project report are skeptical about the implementation of shale oil in Russia.
Jean François,
North Dakota is pretty darn cold in winter, not Siberia, but very cold.
They also have summer, fall, and spring there, I imagine this is true in Russia as well. 😉
I don’t know any of the specific issues with LTO but can give you examples of some of the problems with offshore developments. Russia had an agreement with Exxonmobil to provide technology and expertise to exploit some arctic fields that was killed by the sanctions. A major problem with deepwater drilling is that it requires high-pressure-high-temperature wellhead equipment (e.g. blow out preventors, flexible risers, xmas trees, subsea shut down valves. The hpht reservoir fluids are one difficulty but add to this that in Arctic conditions the equipment may also see extreme cold, and salt water conditions. There are only two or three foundries worldwide that can even produce the specialist steels that are needed to the required quality. Then you have to find a manufacturer to forge or cast the equipment you need – this means they have gone through a lengthy and costly design, manufacturing and testing program. All such equipment used to come from western firms, Asian countries may be catching up but 5 or 6 years ago none would have been trusted by major IOCs to do anything but commodity type items (i.e. medium pressures and temperatures, standard materials), and only then with extensive quality oversight. The first 20 ksi equipment (i.e. 20000psi design pressures are only just being deployed -e.g. at Anchor in GoM. There are few firms that can make high pressure flexible risers, which are incredibly complicated multilayered tubes, or the umbilcals that carry electrical and hydraulic control equipment (actually getting fewer because of mergers)
Elastomeric materials are another issue with hpht reservoirs and being able to handle varios chemicals and corrosive reservoir fluids. High pressure compressors, pumps and valves only come from a few manufacturers. Buying lower quality alternatives is not necessarily an option – it’s not that they don’t work as well or break down more often, they simply don’t work at all or quickly blow up and are goe for good. All this probably goes for drilling equipment too but that’s not my field though I know in Sakhalin ExxonMobil regularly broke well length records, drilling from onshore under the sea (using specialised enclosed drill derricks because of the cold).
Understanding reservoir chemistry and geology is difficult and requires ery powerful computers (2nd only to those used for climate models) and proven models, which are usually closely guarded by the E&Ps and specialist consultancies (not getting the model correct could be the difference between 5 and 35% recovery in a field. LNG plant and specialised equipment design is only available from 3 or 4 western companies. Other specialised technologies such as for some difficult oil-water mixtures are patented with one supplier. It takes many years to design, prove and refine these technologies.
Russian oil companies’ management is generally terrible, between incompetence, corruption, nepotism, apathy and don’t-rock-the-boat attitudes they will be at least 2 to 3 times longer and costlier than a western or asian IOC company and probably not be able to do complicated stuff at all. They have no interest or incentive to go through R&D programs or anything else without prospects of almost immediate returns. The good engineers quickly become cynical and many, if not most have a career goal to get to the west in some way (e.g. secondment or direct hire).
Ron
Eventually we will be right and have the proof.
It’s Too Late To Avoid A Major Oil Supply Crisis
There are a number of observable trends in oil supplies and by extension prices, presently. I am going to discuss one of them in this article. A lack of capital investment in finding new supplies of oil and gas. A favorite analogy of mine comes to mind, the ship is nearing the dock. In nautical parlance that means the time for course corrections is at an end. So we shall see if that is the case for oil. The massive “ship” that is world oil demand is on an unalterable collision with supplies that will have profound implications for consumers. This key metric reveals what the future is likely to hold for our energy security as the world continues to recover from the virus to those who will listen. The level of drilling and by extension capital investment is insufficient and has been for a number of years to sustain oil production at current levels. It’s no secret that even with the lower break-even costs for new projects thanks to cost-cutting by the industry the last few years, oil extraction is a capital-intensive business. The chart below from WoodMac, an energy consultancy, shows just how severe the decline in capex has been.
You will have to click the link to see that chart. I tried posting it but for some reason, I am unable to post even Gifs that contain colors. There is a lot more to this article than I have posted here.
Chart Ron refers to in comment above is below.
Dennis,
Where did you get this chart from – source?
Thanks
Also, it’d be would be good to know how much of this is US shale. I think the reduction of conventional capex has been even more severe than the chart would intimate. And that (low capex in conventional resources) is the major cause for concern going forward as far as supply is concerned.
The demand worries (reduction due to replacement of ICE cars/suvs by EVs) is overhyped and will take a long time to fructify. But the media and wall street analyst attention is on that point. Supply worries, which no one in media focuses on, are much more imminent and severe in my opinion.
Of course, we could have as much resource (or more) in Permian as you believe and the Saudis/Russians have a lot more oil in their tanks, so to say. But there are enough reasons to doubt their pronouncements regarding their supply capacity and the future production capacity in the Permian.
No one talks about the supply issue. Talking about the general public, everyone uses oil and expects to not use it in the future (because climate change!!), but no one knows how. Selling a few EVs is not going to cut it. But the media/wall street is extremely silent on this issue. Anyhoo, let’s see how this progresses. It will all happen very quickly from here on, I reckon..
The chart is from Ron’s link above. Here is a link to an article published in November 2019 talking about low investment (click on the right to read):
https://ogst.ifpenergiesnouvelles.fr/articles/ogst/abs/2019/01/ogst190315/ogst190315.html
From memory they give a breakdown of the percentage of total investment that went to LTO in this article. Again from memory, in 2019 slightly more than 25% of investment went to LTO.
Ancient archer,
Source at link below
https://oilprice.com/Energy/Energy-General/Its-Too-Late-To-Avoid-A-Major-Oil-Supply-Crisis.html
I agree supply may be an issue. If so oil prices rise and demand decreases and supply increases until market balance is reached. It might take $120/b oil hard to say.
You are correct that much is unknown, generally oil output has tended to be higher than I have predicted in the past.
In 2012 I expected the peak would be 80 Mbpd
https://oilpeakclimate.blogspot.com/2012/08/i-noticed-that-compared-to-model-by.html?m=1
That chart is from the article Ron shared, and it shows a big drop in the global expenditure for oil exploration from 2014 to 2016 (with oil falling from $106 to $29 in that time frame), and with relatively little change since then.
People may want to blame climate activists, but it was the rapid influx of LTO coming on the market that took the wind out of the exploration sails.
Going forward, companies just don’t see enough risk/reward benefit for exploration at the oil current price.
Especially with the big global auto makers now putting almost all of their new research and production capability funding (manufacturing lines) towards electrification of their brands.
Electrification so far means hybrid cars (RAV4 hybrid, etc ) not “pure” EV. And that might continue into the future.
https://www.mordorintelligence.com/industry-reports/hybrid-vehicle-market
Beware the tendency for tunnel vision which will allow you to see only what you would like, rather than what is actually occurring.
Here are the all electric vehicles for sale as of this Feb in the USA, [not including plugin hybrids]
https://www.caranddriver.com/shopping-advice/g32463239/new-ev-models-us/?utm_campaign=arb_dda_ga_cd_md_bm_hp_g28829951&utm_medium=cpc&utm_source=google
Many more options in Asia and Europe, which are bigger vehicle markets than the USA. In 2021 the USA is 18% of the light vehicle market, so don’t get the idea that what you see in your town represents what is going on in the world.
If you don’t think that this is having a major effect on the risk/benefit equation being considered by oil majors as they make long term plans for oil exploration going forward, I think you are just failing recognize a major industrial transition that is well underway. First inning is not even half way over.
I think this isn’t the only factor, but it is one.
Most “new” oil requires great amounts of CAPEX. So, if less oil will be needed in the future, the easy decision is to not spend the CAPEX. This is especially true when a “reasonable” estimate of future oil prices (past 2025) might be $25-250.
Recent past price volatility plus future demand uncertainty are good reasons to believe the world has peaked, or at least won’t produce much more per day than the present monthly peak in any month in the future (bumpy plateau).
I also like that few are talking about peak supply. That is a good indicator it has passed in my book.
Several east European state and xUSSR countries (Ukraine, Belarus, etc) are using more and more gas powered cars (retrofitted from petrol). This is the trend that I know and that is IMHO undeniable. So if you think that EV is the future in this space, it is you who have tunnel vision and is completely detached from reality 🙂
For poor countries lithium based EV (even Leaf) are out of reach for the majority of population and Tesla is the car exclusively for nouveau riche especially those in IT and other high tech (they value the ability of Tesla to differentiate them from the “crowd”, not so much its design). If you talk to ordinary citizen of such a country about EV he will laugh at you.
“Chevron temporarily shut in production June 18 from two offshore Gulf of Mexico oil and gas platforms and evacuated some staff, ahead of a weather system that was expected to strengthen into a tropical storm and make landfall in southeast Louisiana.”
If this is any indication this year is going to be another bad one for weather based production deferrals in the GoM. It is early in the season to be getting a storm formed directly in the Gulf waters. Usually it takes till late in summer for the Gulf to get warm enough and most storms would in the Atlantic from waves coming off of the Sahara and bear away North West as they approach the Caribbean, without US landfall.
Jack and Tahiti are major producers and close to several other large platforms operated by super-majors (the figures in the article are just the Chevron shares, actual totals are Jack/St Malo and Julia, which it processes at about 130-140 kbopd, Tahiti about 70).
https://www.spglobal.com/platts/en/market-insights/latest-news/natural-gas/061821-chevron-offshore-oil-and-gas-platforms-shut-in-ahead-of-gulf-of-mexico-storm
That was forecasted earlier. It is therefore not surprising. The GOM is abnormally hot (this was already noticeable in April), there is a more or less favorable windshear state due to the enso neutral phase in Atlantic and especially GOM and the main development region is neutralized by dry air and dust from the Sahara. For example, these updates of Deciphering weather. And it is said so since April. https://www.youtube.com/watch?v=QYB0TLLljT8 and https://www.youtube.com/watch?v=kjYRmxa7rhM ; https://www.youtube.com/watch?v=VKjYJnDNFQ0 as an example : all the models pointed out to an above average troical storm season. There is therefore no surprise about the storm activity in GOM so early in the season.
A new thread for February Non-OPEC production has been posted.
https://peakoilbarrel.com/february-non-opec-oil-production-sinks/
A new Non-Petroleum thread has been posted.
https://peakoilbarrel.com/open-thread-non-petroleum-june-19-2021/