By Ovi
The focus of this post is an overview of World oil production along with a more detailed review of the top 11 Non-OPEC oil producing countries. OPEC production is covered in a separate post.
Below are a number of Crude plus Condensate (C + C) production charts, usually shortened to “oil”, for the oil producing countries. The charts are created from data provided by the EIA’s International Energy Statistics and are updated to January 2026. This is the latest and most detailed/complete World oil production information available. Information from other sources such as OPEC, IEA, STEO and country specific sites such as Brazil, Norway, Mexico, Argentina and China is reported to provide an extra one or two month production preview beyond the EIA.
The EIA’s April/May STEO reports have made significant and major revisions to the projected World oil production due to the US/Iranian war. Also US projected production has been revised upward. See US chart at the end.
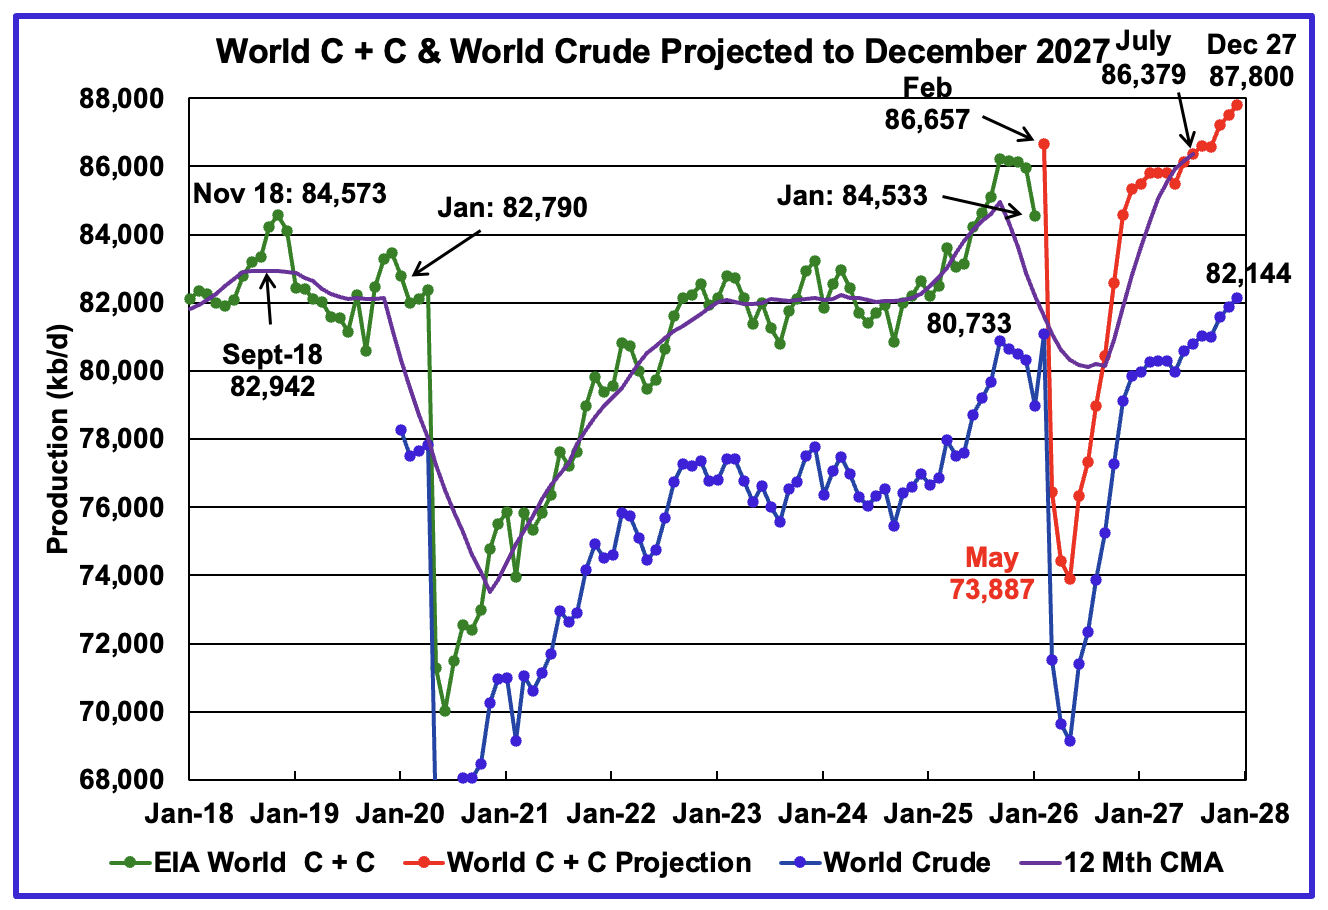
The World’s January oil production decreased by 1,411 kb/d to 84,533 kb/d.
This chart has been updated using the May 2026 STEO to project World C + C production out to December 2027. It uses the STEO report along with the International Energy Statistics to make the projection. Production in February 2026 is projected to increase by 2,124 kb/d to 86,657 kb/d. March/April production drops by more than 10,000 kb/d due to the Iran/US war. May production is forecast to be the bottom and is projected to be 73,887 kb/d.
The 12 month Centred Moving Average shown at July 2027 is 86,379 kb/d vs the September 2018 12 month CMA of 82,942 kb/d.
For December 2027, production is projected to be 87,800 kb/d, a new projected high and an upward revision of 547 kb/d from the previous report. The increase comes from a combination of Non-OPEC countries and the US.
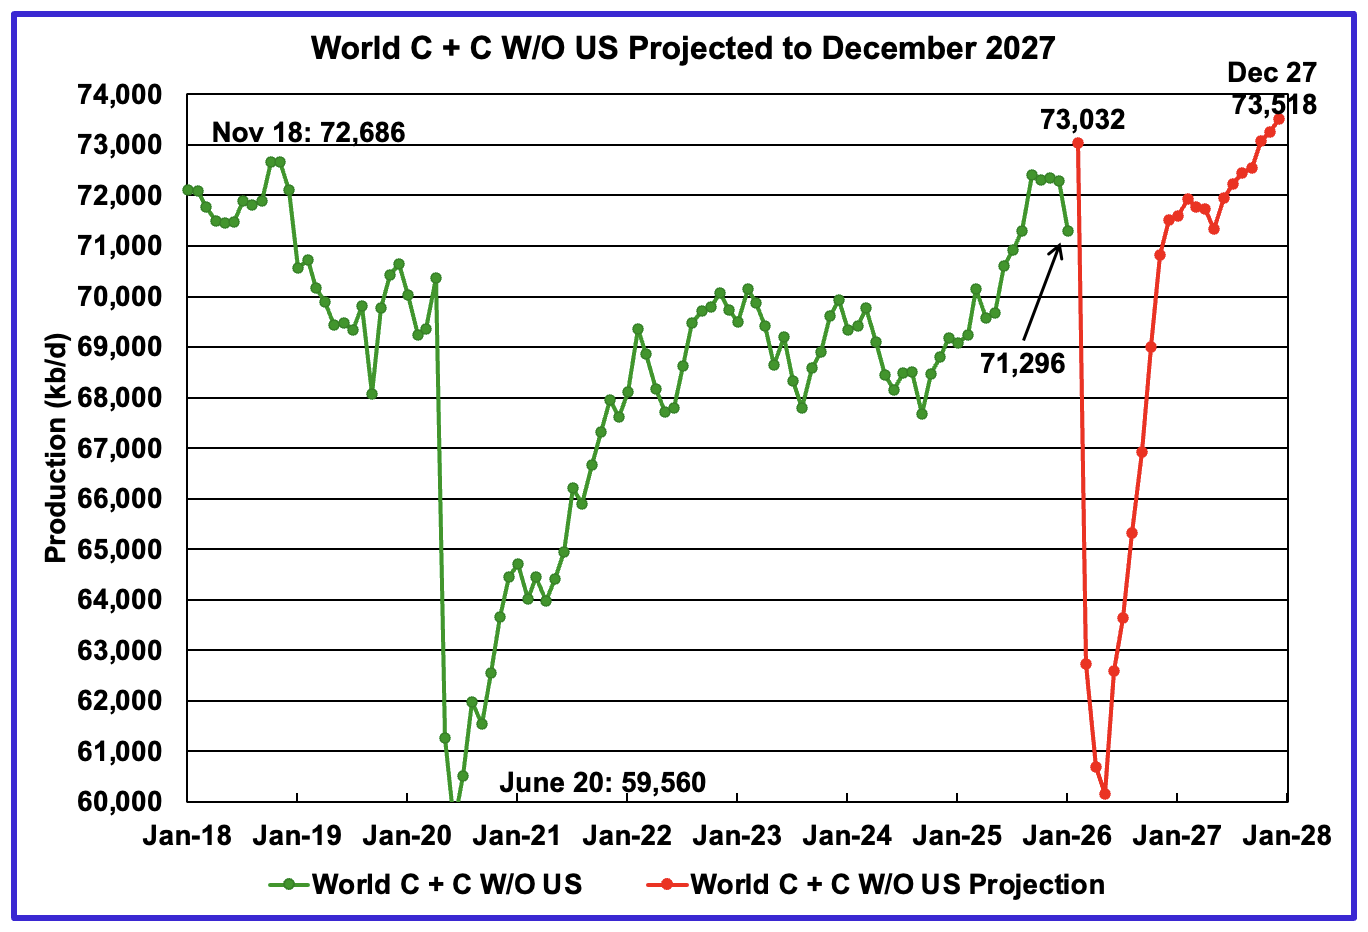
January’s World oil output W/O the US decreased by 991 kb/d to 71,296 kb/d. February’s production is expected to increase by 1,736 kb/d to 73,032 kb/d
The projection is forecasting that December 2027 World W/O US oil production will be 73,518 kb/d. This is only 486 kb/d higher than the expected February production of 73,032 kb/d. Very little growth is expected from the Non-US World oil producing countries.
A Different Perspective on World Oil Production
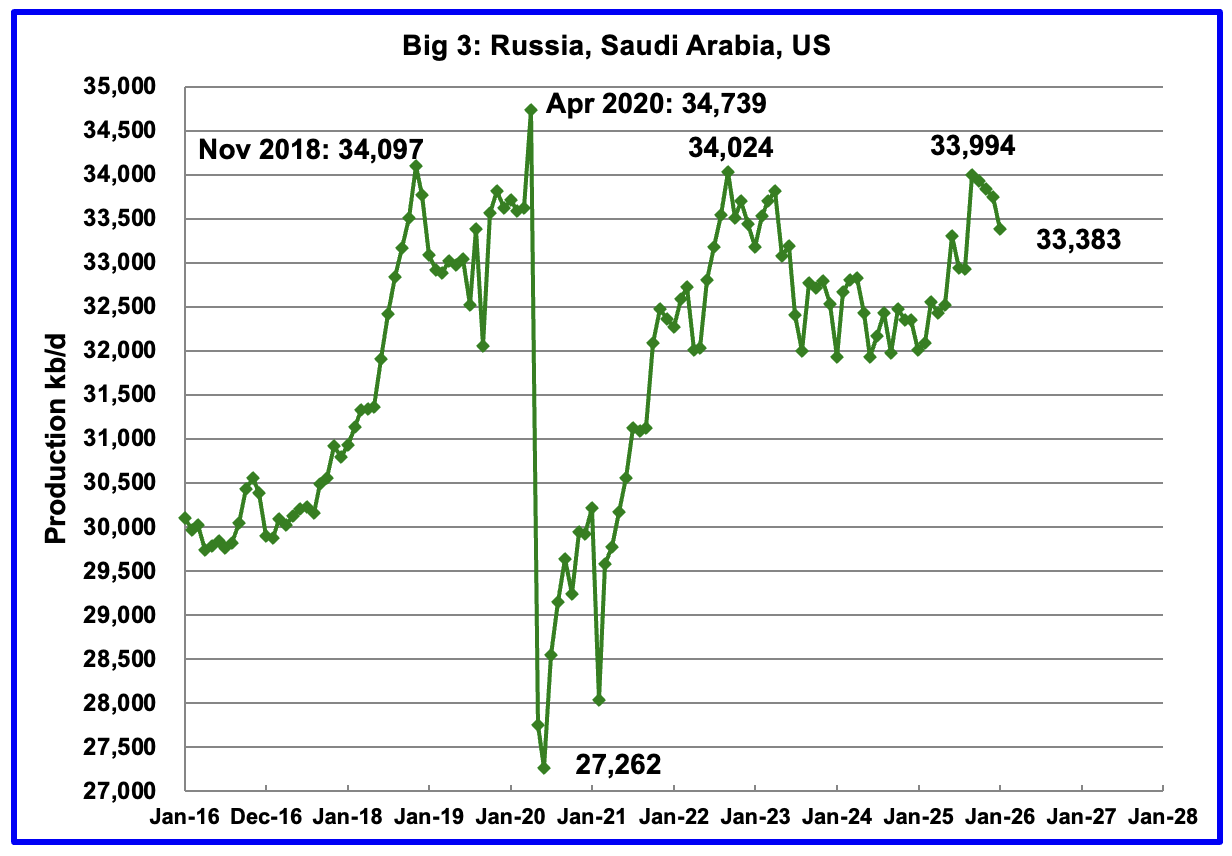
January’s Big 3 oil production decreased by 360 kb/d to 33,383 kb/d. US production, a contributor to the decrease, dropped by 410 kb/d in January due to a late winter storm.
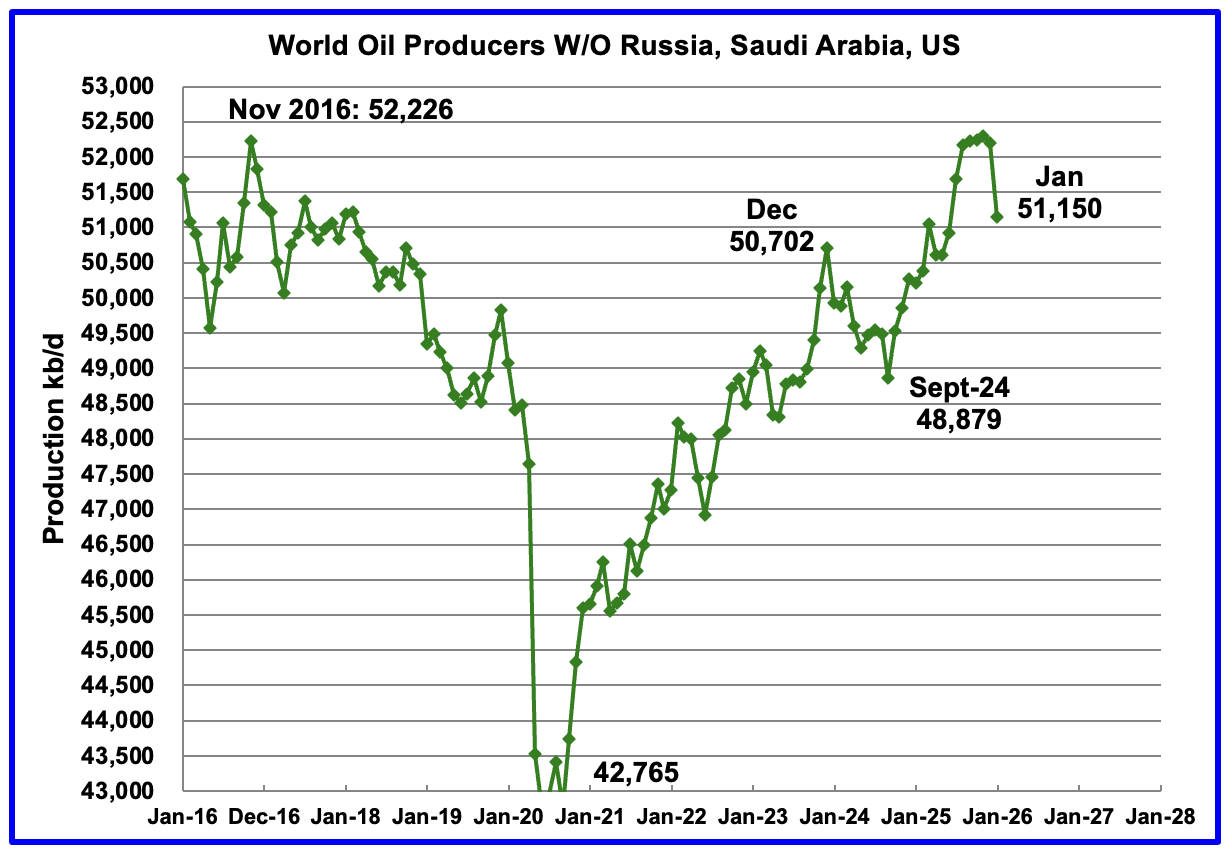
Production in the remaining countries has been slowly increasing since the September 2020 low of 42,765 kb/d but dropped sharply in January. January 2026 production dropped by 1,051 kb/d to 51,150 kb/d. There were big drops in the US and Kazakhstan.
Countries Expected to Grow Oil Production.
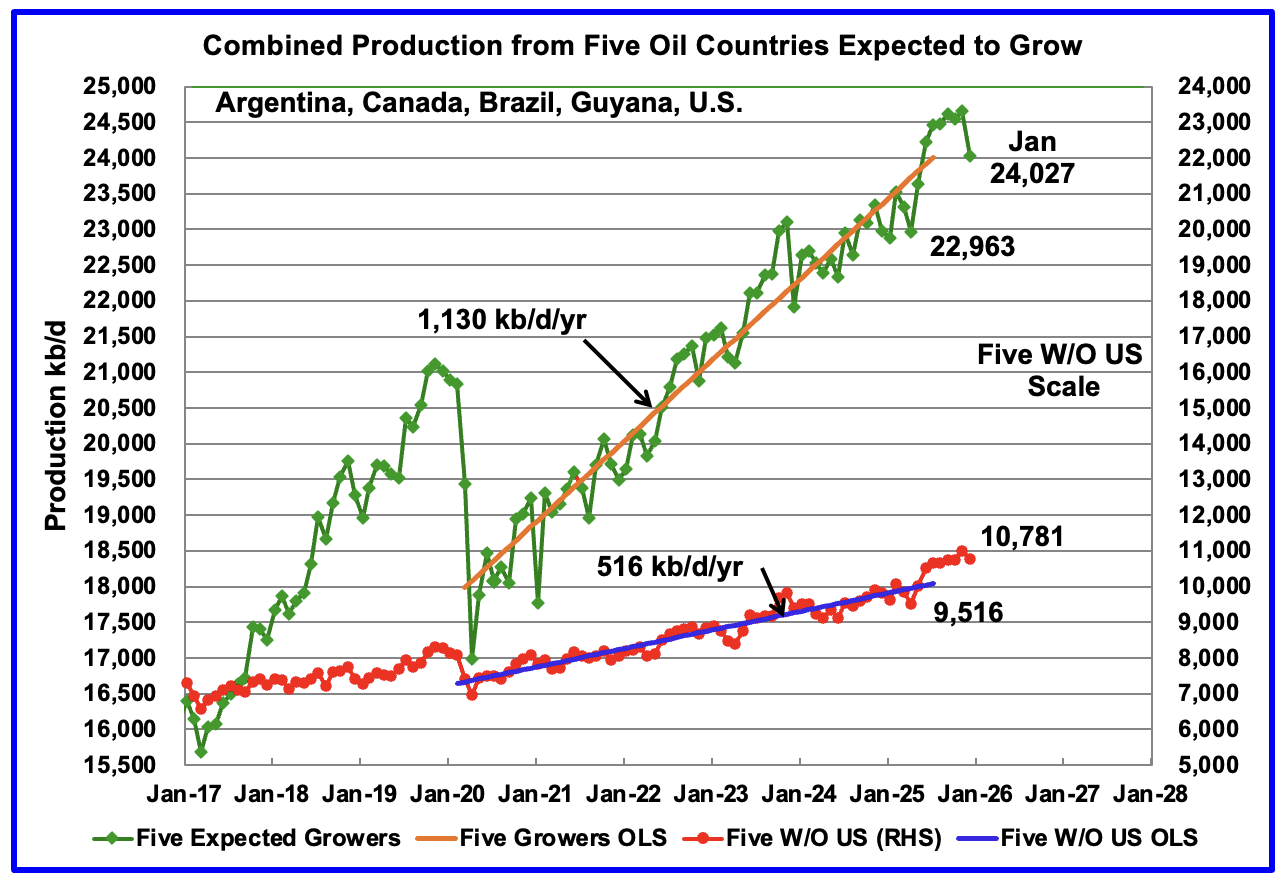
This chart shows the combined oil production from five Non-OPEC countries, Argentina, Brazil, Canada, Guyana and the U.S., whose oil production is expected to grow. These five countries are often cited by OPEC and the IEA for being capable of meeting the increasing World oil demand for next few years. For these five countries, production from April 2020 to July 2025 rose at an average rate of 1,130 kb/d/year as shown by the orange OLS line.
To show the impact of US growth over the past 5 years, U.S. production was removed from the five countries and that graph is shown in red. The production growth slope for the remaining four countries has been reduced by 614 kb/d/yr to 516 kb/d/yr.
January production has been added to the five growers chart and it dropped by 630 kb/d to 24,027 kb/d. January’s production decrease was primarily due to the large US drop. For the Five growers W/O U.S., January production dropped by 220 kb/d to 10,781 kb/d.
February’s production for the five countries is expected to reverse the January drop by increasing close to 600 kb/d.
Note: The OLS lines are updated to July 2025.
World Oil Countries Ranked by Production
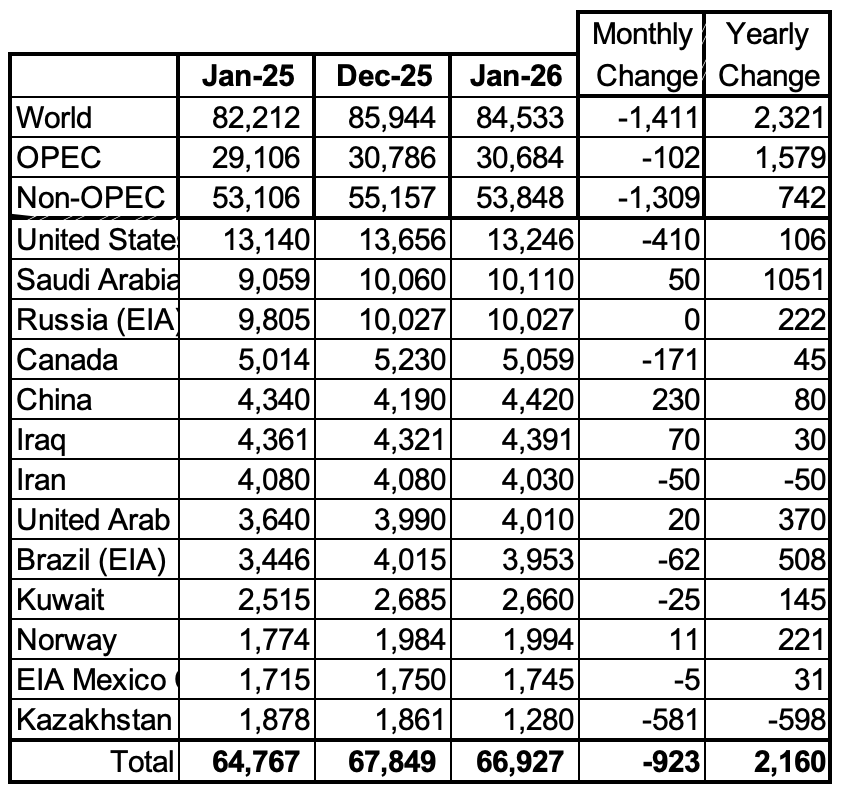
Above are listed the World’s 13th largest oil producing countries. In January 2026 these 13 countries produced 79.2% of the World’s oil. On a MoM basis, production decreased by 923 kb/d in these 13 countries while on a YOY basis production rose by 2,160 kb/d. Note the large YoY increases from Saudi Arabia, Brazil and the UAE.
Non-OPEC Oil Countries Ranked by Production
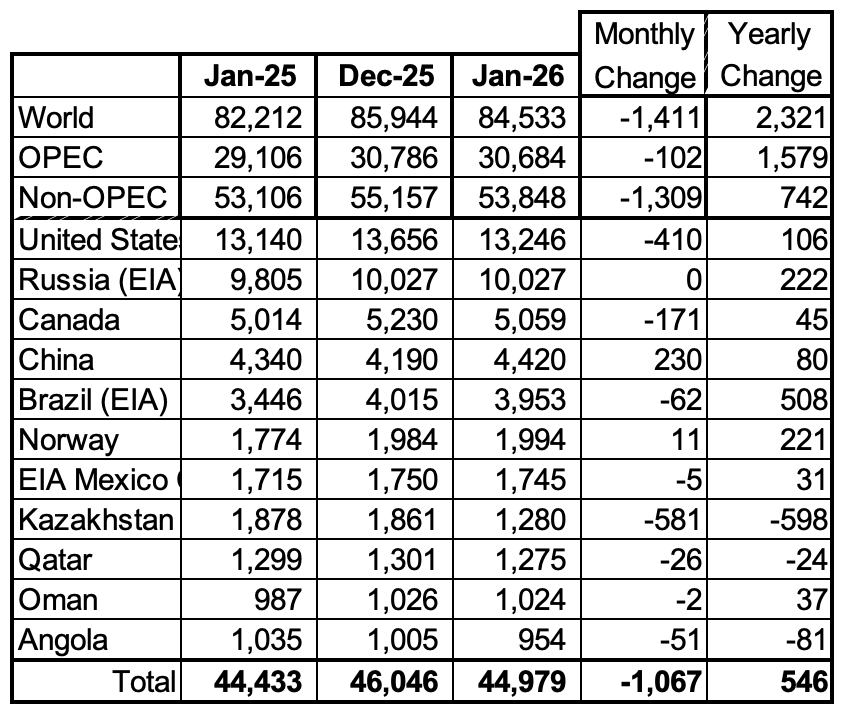
Listed above are the World’s 11 largest Non-OPEC producers. The original criteria for inclusion in the table was that all of the countries produced more than 1,000 kb/d.
January’s MoM production decreased by 1,067 kb/d to 44,979 kb/d for these eleven Non-OPEC countries while as a whole the Non-OPEC countries saw a yearly production increase of 742 kb/d to 53,948 kb/d. Major yearly gain came from Brazil but was offset by the drop in Kazakhstan.
In January 2026, these 11 countries produced 83.5% of all Non-OPEC oil.
Non-OPEC Country’s Oil Production Charts
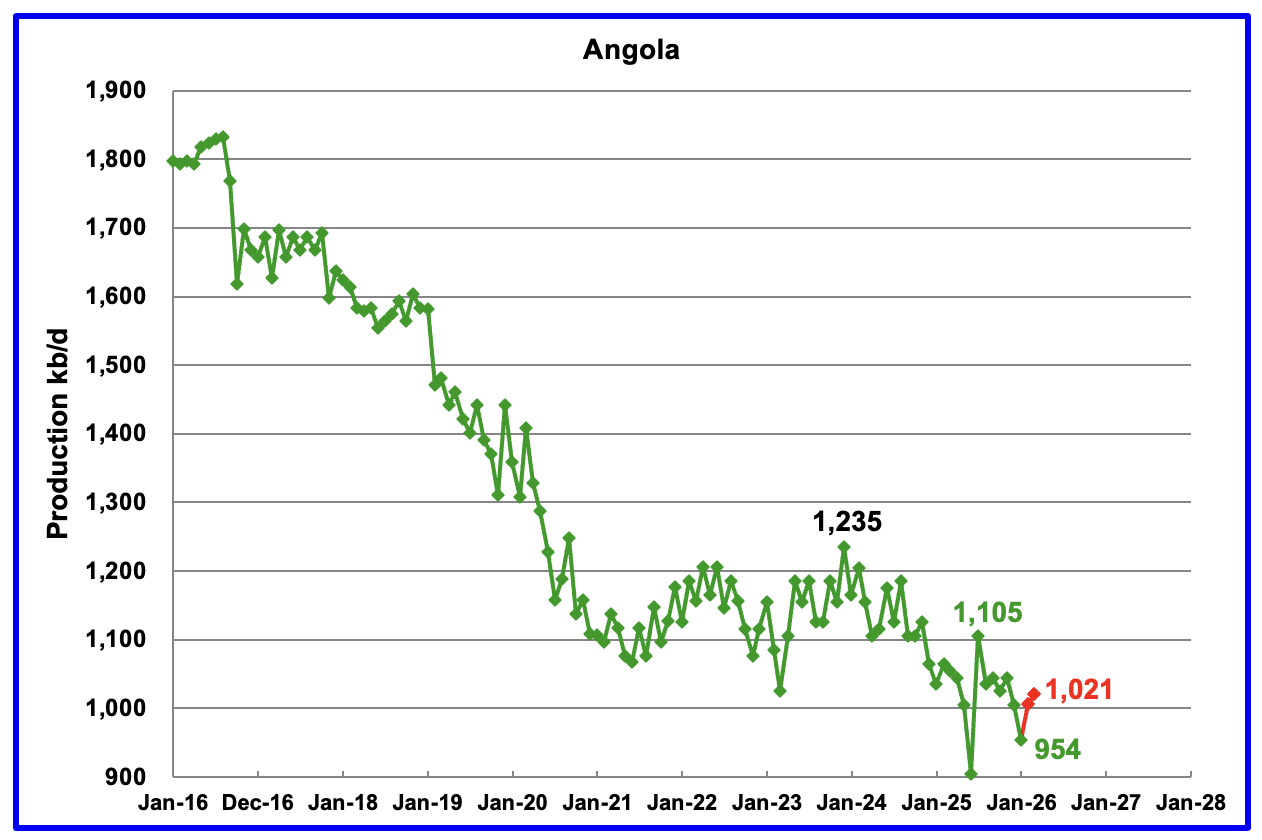
The EIA reported Angola’s January oil production dropped by 51 kb/d to 954 kb/d.
According to Angola’s National Agency for Petroleum, production in February and March rose to 1,021 kb/d, red markers.
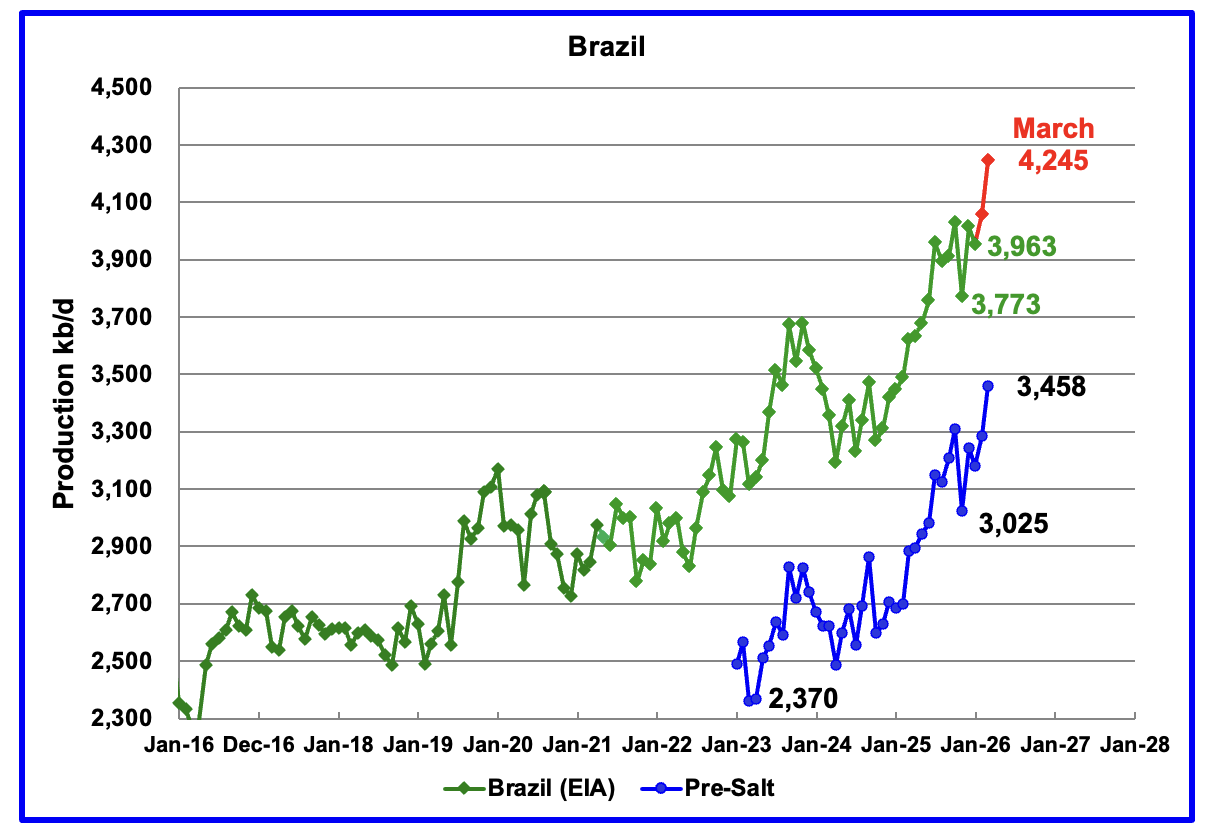
The EIA reported that Brazil’s January production dropped by 62 kb/d to 3,963 kb/d. According to this Article, the pre-salt reservoirs remained the backbone of national production, accounting for nearly 80 per cent of total oil and gas output.
Brazil’s National Petroleum Association (BNPA) reported that production rose both in February and March and rose to a new high in March to 4,245 kb/d.
Pre-Salt production was a major contributor to the February and March production rebound.
According to the May OPEC MOMR: “In 2026, Brazil’s liquids production, including biofuels, is forecast to rise by about 270 tb/d, y-o-y, to average 4.7 mb/d. Upstream liquids production is set to surge through production ramp-ups at the Buzios (Franco), Mero (Libra NW), Marlim, Bacalhau (x-Carcara) and Wahoo projects. Additional oil project start-ups are expected at the Buzios field, as well as from the Albacora Leste Cluster.
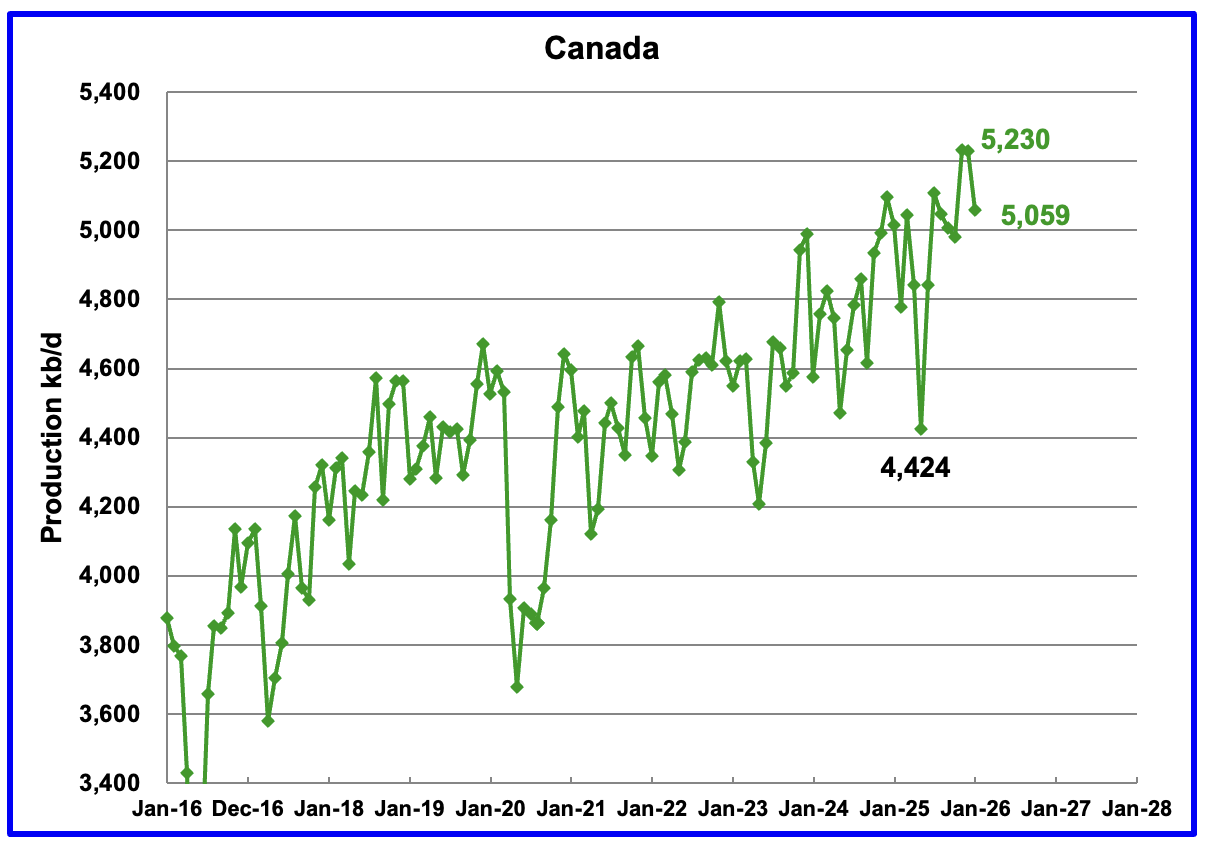
Canada’s oil production decreased by 171 kb/d in January to 5,059 kb/d.
Canada’s January production was down due to unexpected downtime at a few oil sands companies.
According to this Article, President Trump signed an executive order to build a smaller version of the Keystone XL pipeline.
“U.S. President Donald Trump on Thursday signed an order granting a cross-border permit to a project that would revive parts of the Keystone XL pipeline to transport Canadian oil from the U.S.-Canada border to Guernsey, Wyoming.
The pipeline, proposed by Canadian pipeline company South Bow (SOBO.TO) and its U.S. partner Bridger Pipeline, could increase Canada’s crude exports to the U.S.by more than 12% if it goes ahead. A presidential permit was required for the project to proceed.
The new proposal involves a different route through the U.S. than the previous Keystone XL project, which was canceled by former President Joe Biden in 2021 after years of Indigenous and environmental opposition.
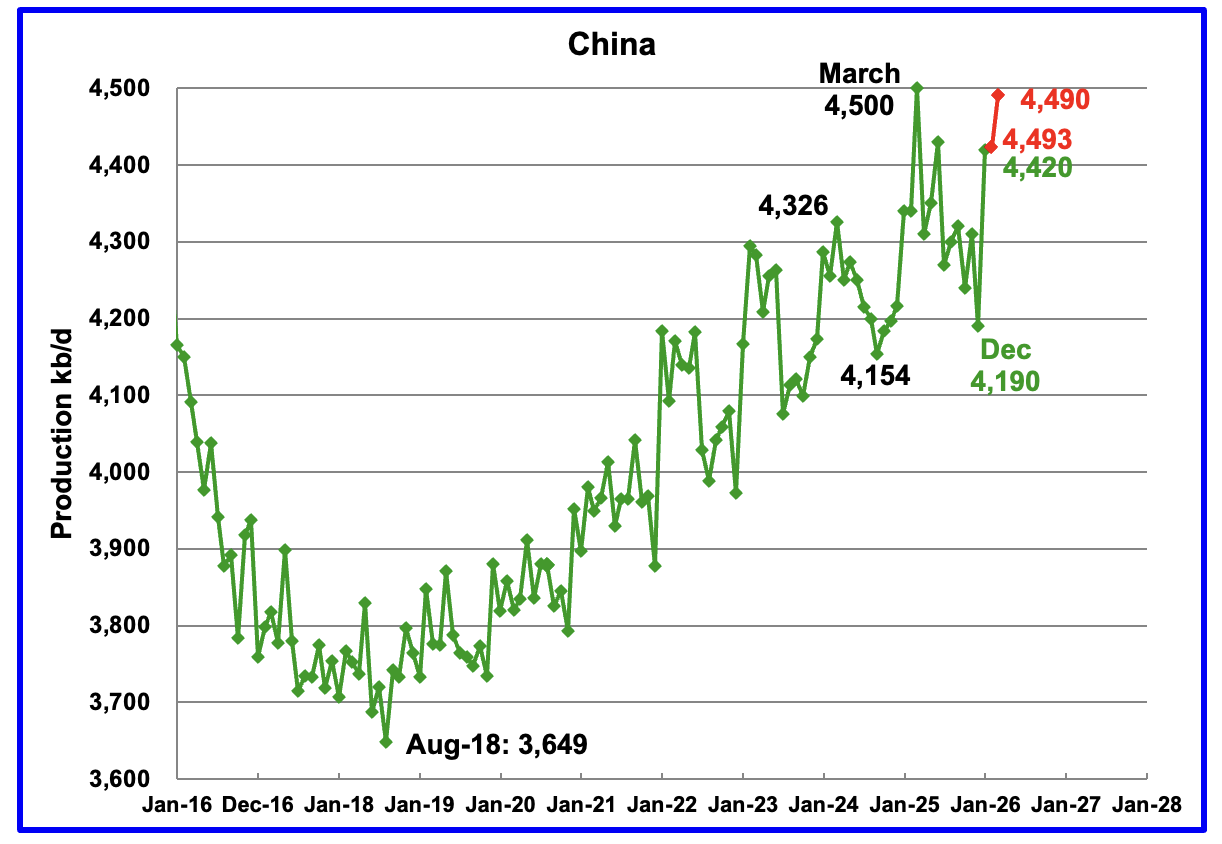
The EIA reported China’s January oil output rose by 230 kb/d to 4,420 kb/d. On a YoY basis, China’s January production rose by 80 kb/d. For March, China reported average production of 4,490 kb/d, red markers.
For the last two years, March has proven to be a record production month. Again this year March showed a large gain but it did not exceed the March 2025 peak of 4,500 kb/d. Does this hint at an upcoming peak in China oil production?
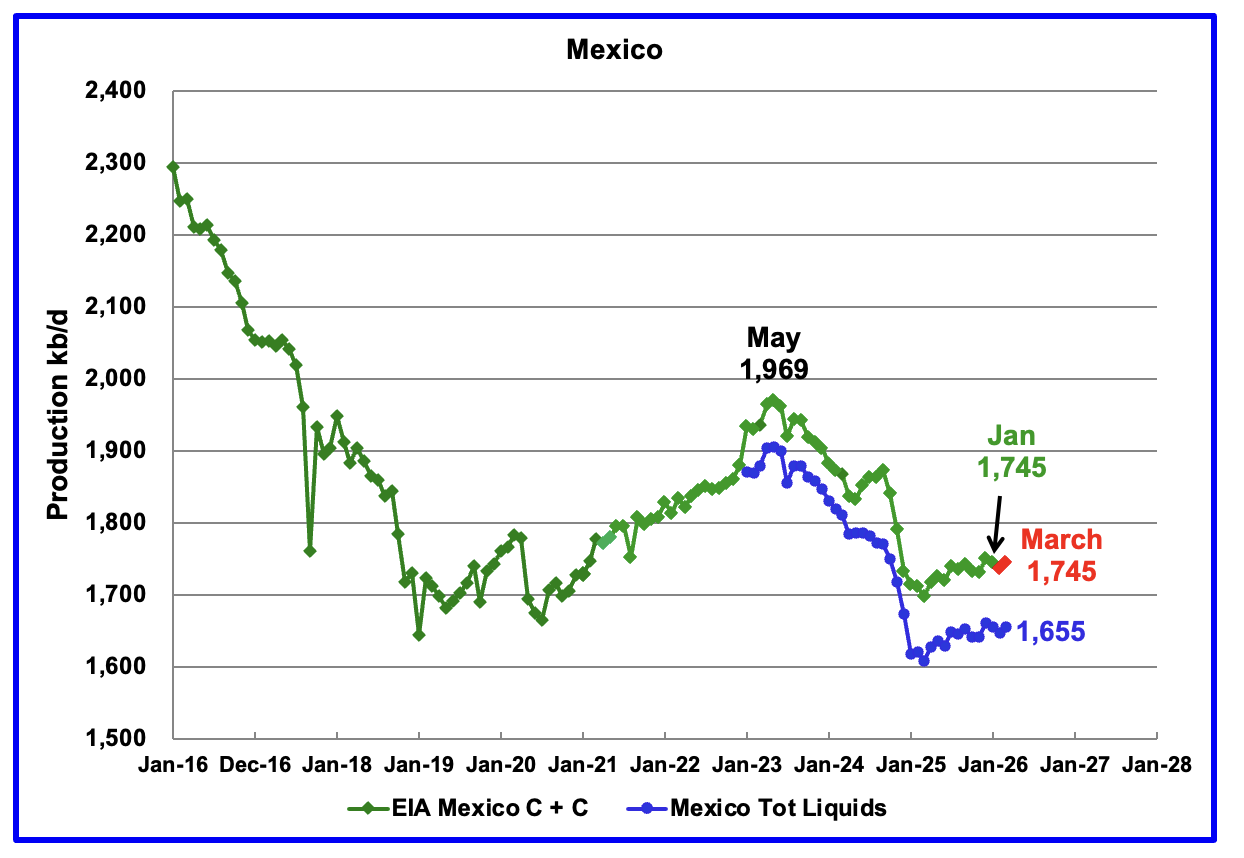
According to the EIA, Mexico’s January output dropped by 5 kb/d to 1,745 kb/d.
In June 2024, Pemex issued a new and modified oil production report for Heavy, Light and Extra Light oil. It is shown in blue in the chart and it appears that Mexico is not reporting condensate production when compared to the EIA report.
In earlier EIA reports, they would add close to 55 kb/d of condensate to the Pemex’s “Total Liquids” report. More recently the EIA has been adding 90 kb/d of condensate to Mexican production. For February and March production, 90 kb/d have been added to the Pemex report. March production is estimated to be close to 1,745 kb/d. Note that Mexico’s production, as reported by Pemex for the last eight months has stabilized around 1,650 kb/d.
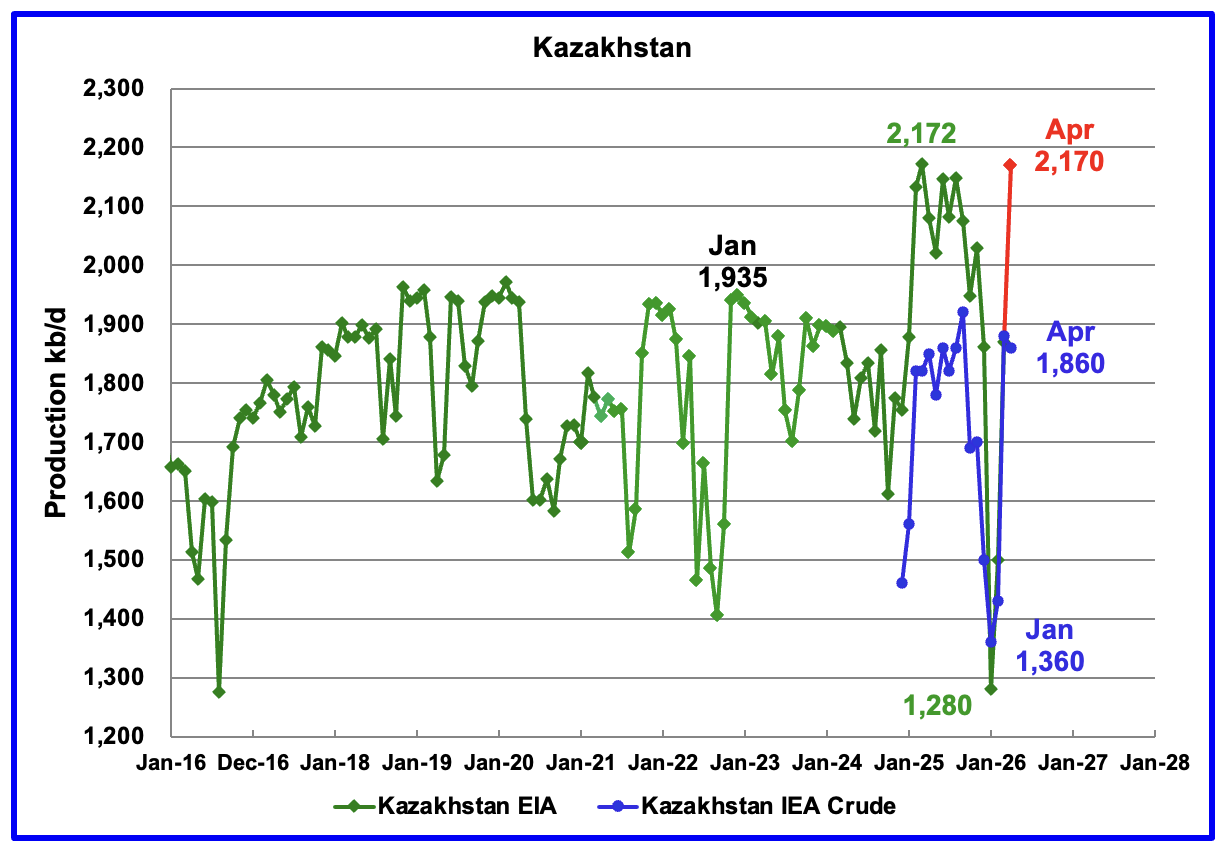
According to the EIA, Kazakhstan’s January oil output decreased by 581 kb/d to 1,280 kb/d. According to this Article, the large drop was due to a fire in the Tengiz oil field power generating plant.
“The Chevron-operated Tengiz oilfield in Kazakhstan has suspended oil production and exports a day after fires were reported at the field’s power generation and supply facility.
Oil production from Kazakhstan’s three largest fields, including Tengiz, was hampered in December and again this month due to operational issues affecting the country’s key export pipeline, operated by Caspian Pipeline Consortium.“
Since Argus no longer reports OPEC + crude production, production data for Kazakhstan will now be taken from the monthly IEA reports. March production rebounded by 450 kb/d to 1,880 kb/d even though this Report stated that Kazakhstan was supposed to reduce production in March. The May IEA OMR reported that crude production in April dropped by 20 kb/d to 1,860 kb.
The C + C production for April, red marker, was taken from this Report.
“Kazakhstan, which accounts for more than 2% of global oil output, boosted oil and gas condensate production by 16% in April from March as output ramped up at major fields, a source familiar with the data said on Monday.
Total production rose to 2.17 million barrels per day in April from 1.87 million bpd in March, the source said.
The increase was driven mainly by higher output at Tengiz, the country’s largest oilfield, where the source said production jumped 39% to 973,000 bpd.“
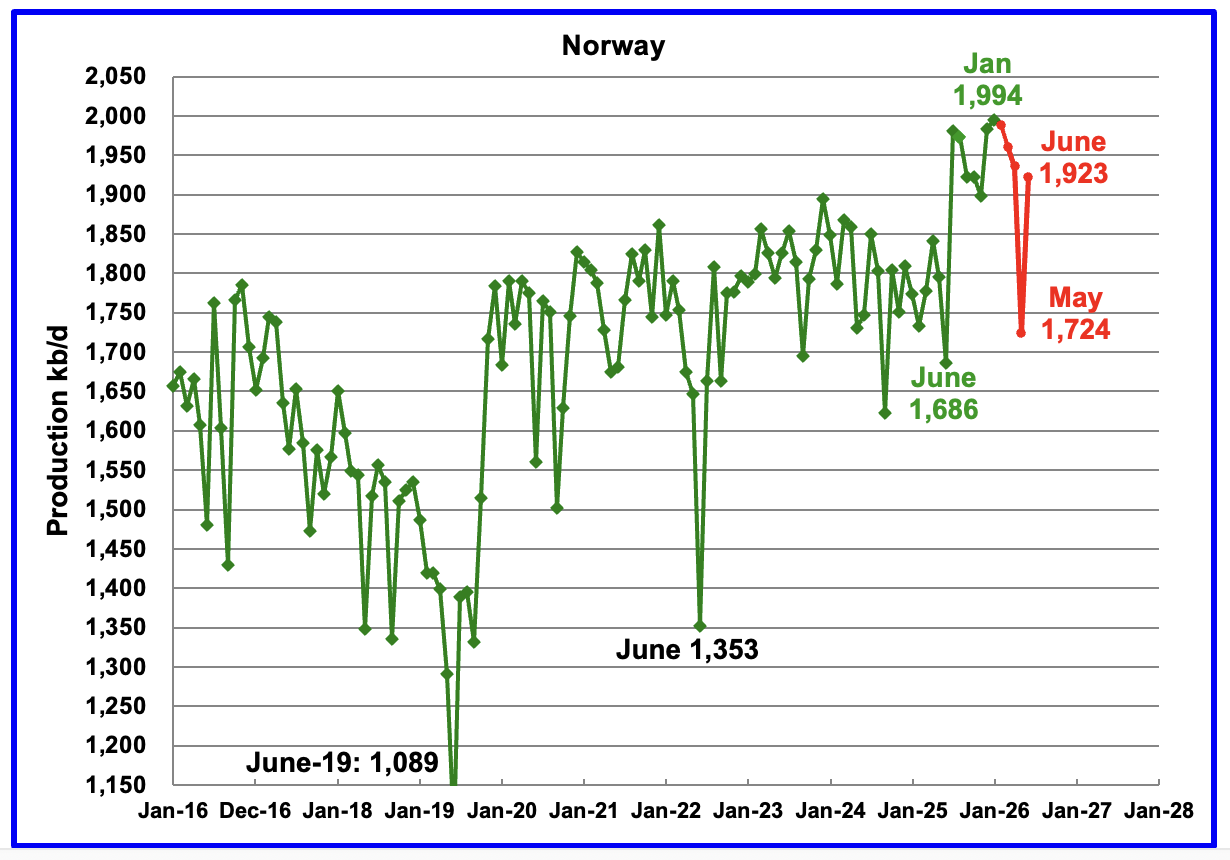
The EIA reported Norway’s January production rose by 11 kb/d to 1,994 kb/d.
Separately, the Norway Petroleum Directorship also projected that oil production from February to May will drop every month. For May it is projecting production of 1,724 kb/d. The red markers are the NPD’s production forecast.
According to OPEC’s May MOMR: “Norwegian liquids production is forecast to rise by about 10 tb/d to average 2.0 mb/d in 2026. This has been revised upward due to higher-than-expected output in recent months.
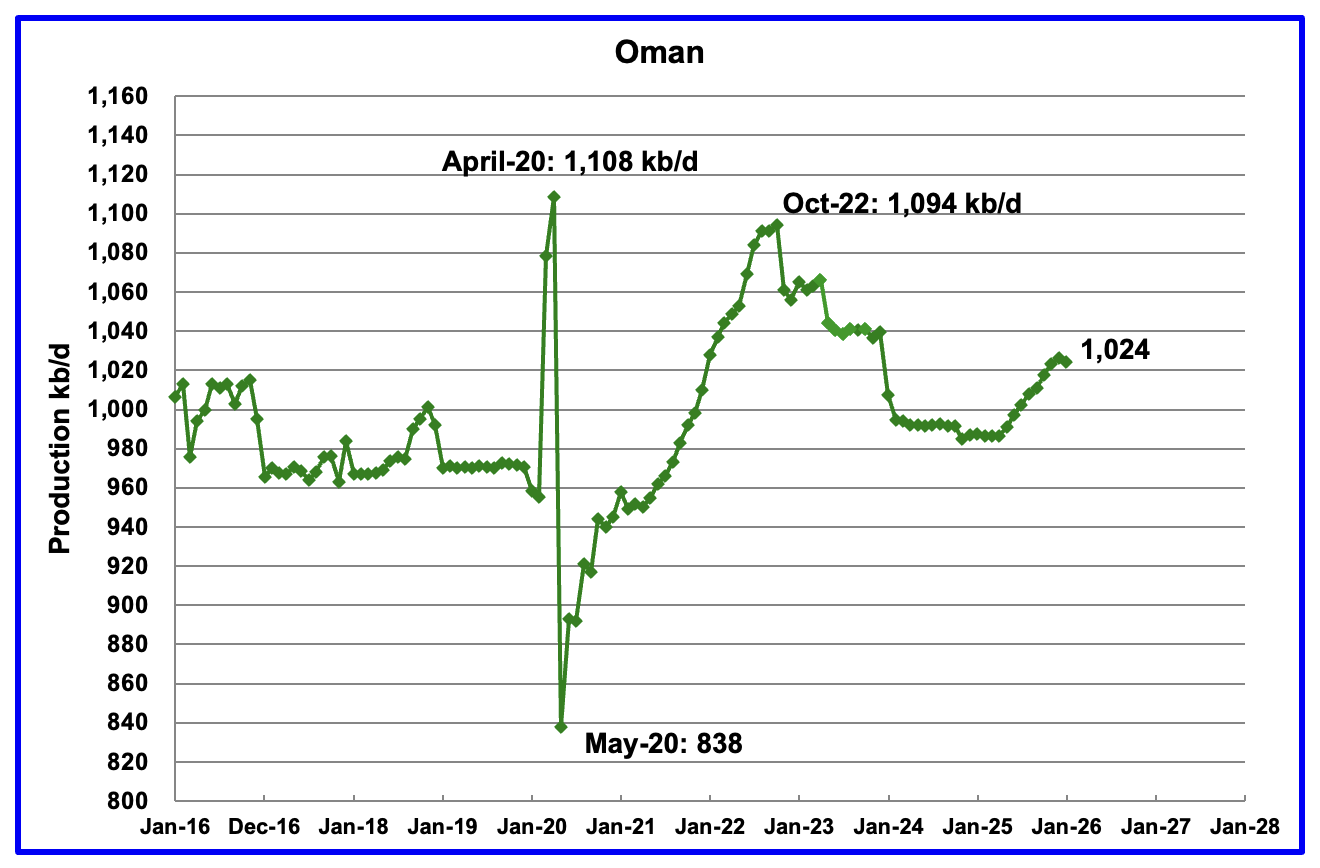
According to the EIA, January output dropped by 2 kb/d to 1,024 kb/d. Oman’s production appears to have started a budding growth phase. Previous production peaked in October 2022.
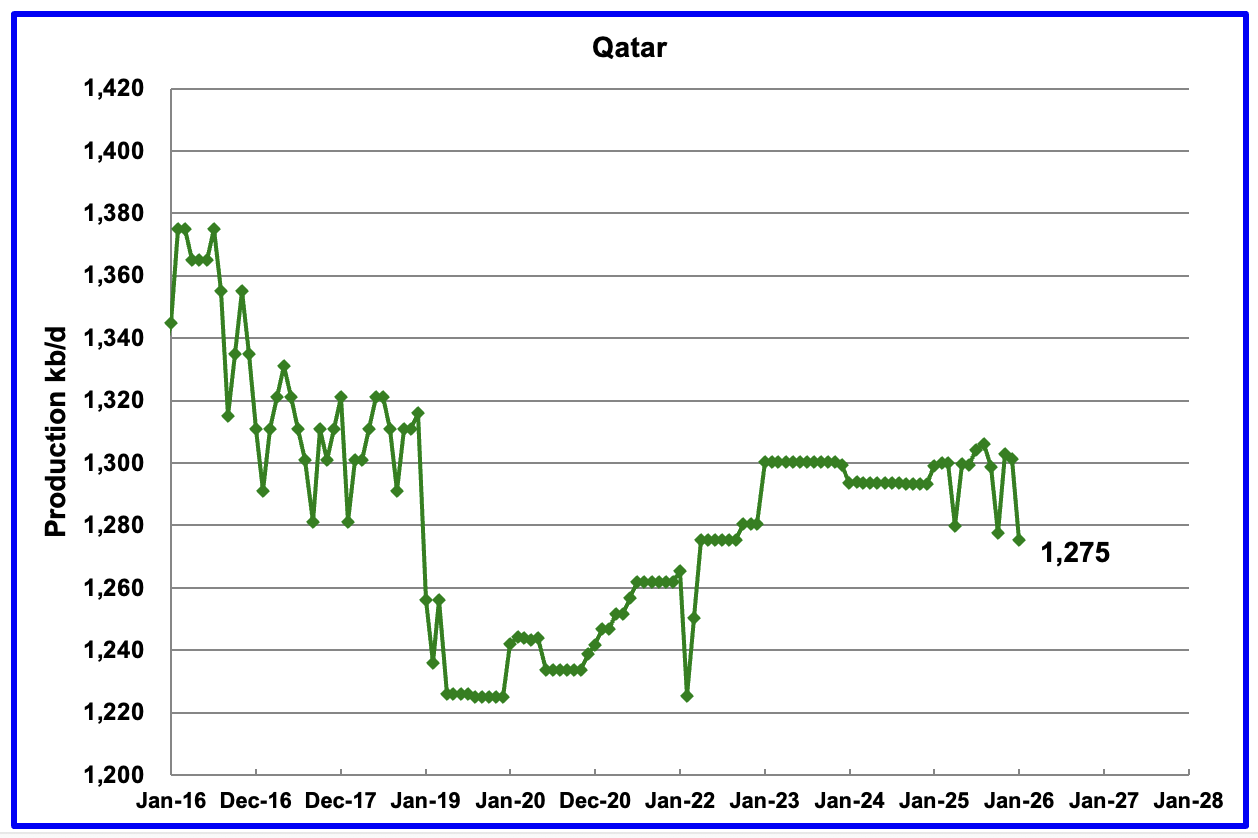
Qatar has restarted providing the EIA with monthly updated oil production.
Qatar’s January output dropped by 26 kb/d to 1,275 kb/d.
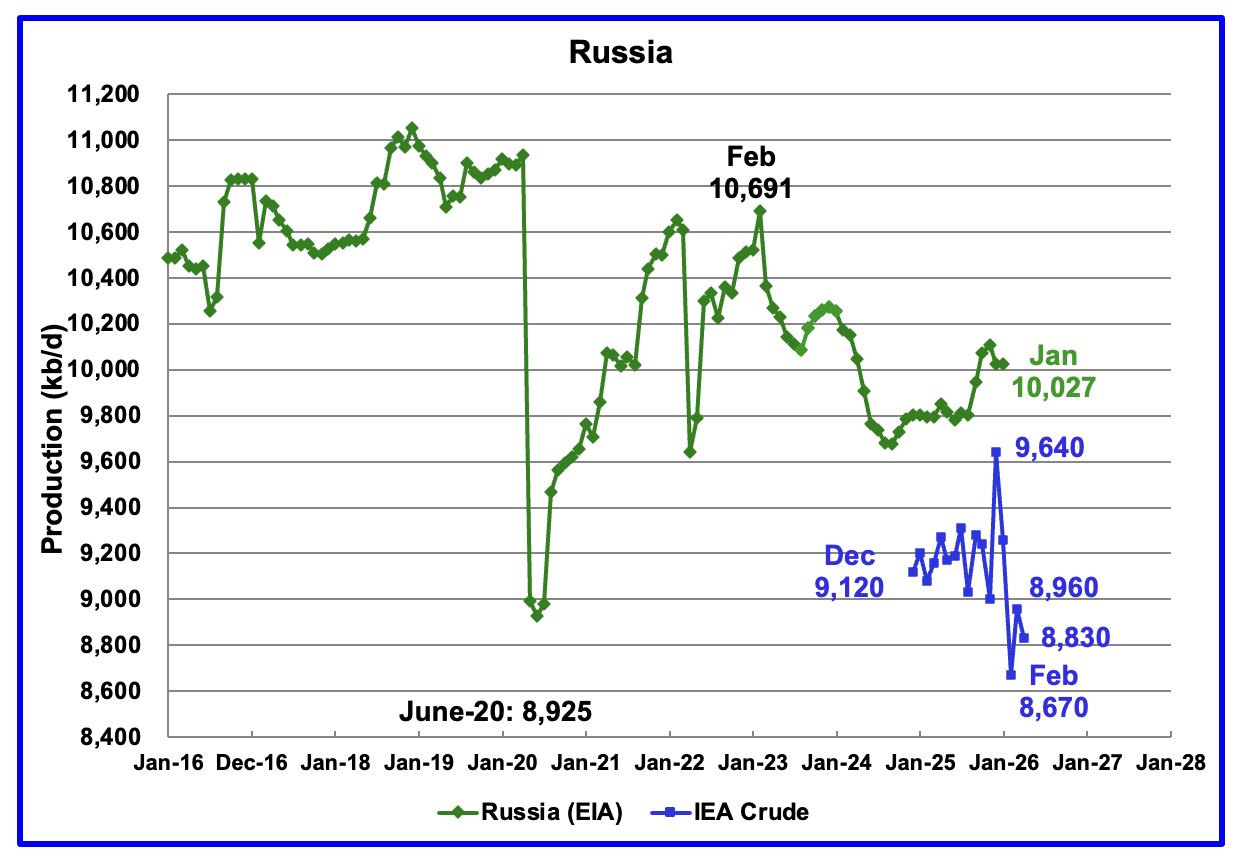
The EIA reported Russia’s January C + C production was unchanged at 10,027 kb/d and was up by 222 kb/d from January 2025.
The above chart also shows Russian production as reported by the IEA. It is difficult to assess the accuracy of the IEA report since over the last few months the IEA’s Russian production had been around 100 kb/d to 150 kb/d higher than Argus’ Media. The best that can be done at this time will be to compare the production trends between the EIA and the IEA. I think that Russian oil production continues to be a major state secret at this time because of the damage being caused by the heavy bombing to its related crude oil processing facilities.
According to the IEA’s February report, December’s crude production rose by 640 kb/d to 9,640 kb/d. The IEA’s March OMR reported that Russian crude production hit a new February low of 8,670 kb/d and rebounded to 8,960 kb/d in March. This is the first clear indication that Russian production is being affected by the Russia/Ukraine war. The May OMR report states that Russian April crude production was 8,830 kb/d, down by 130 kb/d.
The OPEC May MOMR is reporting Russian Crude production in March and April was 9,164 kb/d and 9,057 kb/d, respectively. For April, OPEC’s Russian crude production is 227 kb/d higher than the IEA’s report.
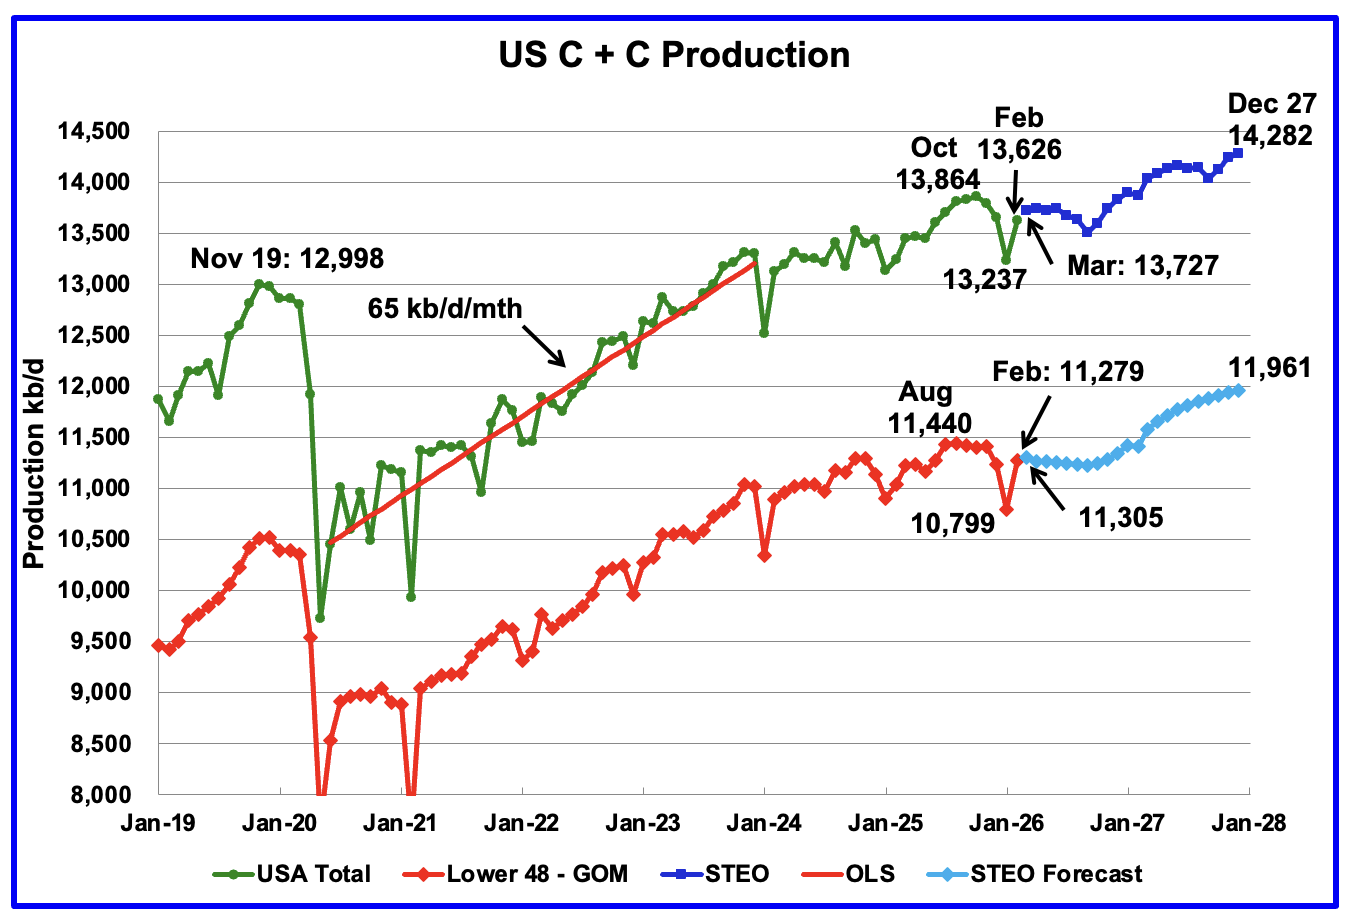
This US production chart showing output up to January 2026 is the same as the one published last week in the US update. However the projected portion of the two production graphs, light and dark blue, have been updated according to the May 2026 STEO.
For US projected production, December 2027 has increased from 14,157 kb/d in the March STEO to 14,282 kb/d in the May STEO, an increase of 125 kb/d. For Onshore L48 production, December 2027 production has risen from 11,892 kb/d in the March STEO to 11,961 kb/d in the May STEO. The rising production comes primarily from the Permian basin.
99 responses to “January World Oil Production Drops”
Horizontal Oil Rig count from Baker Hughes for week ending 5/15/2026
https://rigcount.bakerhughes.com/na-rig-count
Total US horizontal oil rigs up by 5 from last week, Permian Up by 4 rigs, Eagle Ford down by 2 and Bakken unchanged, rest of US (excluding Permian, Eagle Ford, and Bakken) up by 3 horizontal oil rigs from last week. TX Permian up by 3 and NM Permian up by 1 from last week.
YOY total US horizontal oil rigs are down by 57 rigs, Permian down by 45, Eagle Ford down by 6, Bakken down by 3, and other Basins (not including Permian, Eagle Ford or Bakken) down by 3 horizontal rigs YOY.
Natural gas horizontal rigs down by 2 WOW and are up by 18 rigs YOY (17% increase YOY).
rigs 2605
Frac spreads up by 5 this week to 184 and down by 9 spreads from a year ago. Frac spreads are up by 17 since Feb 27, 2026. Frac spreads are up by 19 in the past 4 weeks (about 10% higher).
https://www.aogr.com/web-exclusives/us-frac-spread-count/2026
Dennis
Thanks for filling in.
The Frac Spreads are certainly going up faster the Rig count. I wonder if they are completing dormant DUCs.
Ovi,
Perhaps, but if Permian DUC counts are correct, there is only a couple of months supply of DUCs so the increase in completions above drilling rate is limited. Also possible that some of the increase in frac spreads comes from the gas basins rather than oil. The frac spread info is rather limited compared to drilling rig info as you know.
Is it a valid assumption that production resumes as rapidly as projected with a hypothetical opening of the strait in June? Assuming no hostilities, no stray drones, peace, love and hummus for all won’t exports be constrained to rebuild damaged infrastructure?
Leeg
There are two issues with the projection.
The rate of rise looks optimistic, even assuming a June unblocking of the strait, which i don’t believe will happen.
Production gets back to the December 2025 level in January 2026. That could be a reasonable bet, assuming those damaged OPEC countries are repairing the damaged well. The big unknown continues to be Russia. Since Spring, when the Ukraine seems to have gained equal fighting capacity as Russia and is not as concerned with US delivery of weapons, it has intensified its attacks on Russian refineries and its export facilities. Difficult to know how much confidence to put in the OPEC, IEA and EIA production numbers, as noted in the comments under Russia,
Thx Ovi, I’m looking at the time it took production to resume after Covid and that’s without damage on the supply/inventory side so it seemed odd but maybe that disruption shouldn’t apply anyway.
Hi LeeG!
I’m intrigued — what is the basis of the “hypothetical opening of the strait in June”?
It’s been over 4 years since Russia began the “SMO” in Ukraine, and in spite of all of the speculation/predictions that Ukraine or Russia would “soon win” or “soon capitulate,” the conflict drags on with no outcome other than untold damage to lives and infrastructure.
I don’t understand why people think the Hormuz will magically return to normal in a few weeks or even months when, as far as I can tell, the major players (US, Israel, and Iran) have not expressed any serious interest in normalizing trade flows in the Hormuz.
I’m more interested in what will happen to global liquid energy supplies if the Hormuz stays closed for another 6 months, 12 months, or even 2 years.
What will happen?
NONE of the players have promised to return things to normal.
Let’s take a look at what will happen if they do not return to normal any time soon.
THC,
Opinion article linked below discusses Hormuz situation
https://oilprice.com/Energy/Energy-General/Beijings-Silence-Is-Fueling-the-Hormuz-Crisis.html
Regarding the China-US Summit there is this:
The irony of the summit is brutal, as it was meant to reassure markets that the world’s two largest powers could still cooperate during a crisis. After Trump’s plane left, it is now clear that both sides may now be too strategically divided to manage systemic maritime instability together. The ultimate fear now emerging is that Hormuz may never fully return to its pre-war status.
The author seems to share your pessimism, as do I.
The EIA’s STEO assumes Hormuz reopens in June, that seems to be a very optimistic assessment from my perspective.
THC, I have no idea what the assumptions are in the IEA projection but it obviously shows an immediate increase in June with full production coming back in half the time as it did with covid. It doesn’t make sense to me.
I figure as long as Donald is in power there will be no diplomatic progress and given that it doesn’t take much to block the strait military solutions are an expensive performance accomplishing little.
Where Oil Prices Are Headed in Q3 & Q4 2026 | Crude Oil Market Forecast
https://www.youtube.com/watch?v=Un2x8JIi3dk&t=218s
Oil prices, crude oil markets, the Strait of Hormuz, global oil supply disruption, and energy market volatility are reshaping the future of oil and gas. Trying to predict oil prices has become one of the most dangerous games in global markets. One headline can move crude oil $10 to $20 a barrel overnight, and the deeper issue is no longer just production
In this video, Troy W. Eckard breaks down why the Strait of Hormuz disruption, global conflict, declining reserves, and rising energy demand could create a completely different oil market heading into 2026. He explains why the industry may be entering a new pricing floor, what “demand destruction” actually means, and why replacing lost supply is far more difficult than most people realize.
If you follow oil prices, energy investing, inflation, or global markets, this conversation explains the real-world mechanics behind what is happening right now and why the next 6 to 12 months could reshape the energy sector.
Video chapters:
00:00 Why Predicting Oil Prices Is So Difficult
00:42 Strait of Hormuz and Global Supply Risks
01:36 Why Oil Prices Are Moving So Fast
02:28 How War Impacts Energy Markets
03:18 Is $75 Oil the New Price Floor?
04:22 The Global Oil Supply Problem
05:18 Why the World Needs More Drilling
06:07 Troy Eckard’s 2026 Oil Price Prediction
07:12 Could Oil Reach $125 Per Barrel?
07:48 Final Thoughts on Global Energy Markets
Finally! Someone in the oil business that is telling the ugly truth. I agree with you 💯, but the key is if we experience demand destruction. If Trump signs a peace agreement soon, oil will drop overnight and I will be buying that dip. If oil goes to $150, I will be selling everything.
To the gentleman making this video, assuming that you were correct in your assessment of what this white house will do, you are spot on in your analysis. The problem is you are assuming something which has an extremely realistic chance of not coming to pass. And that’s a problem. Not only for you, but for the whole world. Your assumption is based on the United States having a leader which is not corrupt & has not taken bribes & is not possibly being extorted by a foreign country to put it’s own agenda ahead of that of the United States, it’s citizenry & the rest of humanity for that fact. We all know for a fact that donald trump took an 800 million dollar luxury jet from Qatar less than a year ago & that his son in law, Jared has been given 2 billion dollars to manage from the sovereign government of Saudi Arabia. That nets him around 400 million I believe, just to whet the whistle. Then there’s AIPAC which has donated as a whole & through it’s individual members & supporters has poured billions into not only our president’s pocket, but also the pockets of most of our Republican congress & I’m sure many many democrats as well. IF we have a government which is more concerned about cow towing to the Israeli government & their agenda than our own citizens, then everything you just so eloquently analyzed don’t mean shit. Got it?
Gary,
I like the title of the video, but when I clicked the link it took me to “MAGIC JOHNSON WENT OFF & LeBron’s $50M Lakers Future Is in Question | Sedale Threatt Was UNHINGED”
Could you please confirm if this is the right link?
I think this is the correct link.
https://www.youtube.com/watch?v=owty5jCEsbg
Ovi,
Thank you, that link does indeed work.
I’ll give it a listen!
Right now I’m extremely interested in finding analysis of where oil inventories and prices will head if flows of oil tankers in and out of the Hormuz stay at current levels for the foreseeable future.
How low can product and crude inventories go before flow rates necessarily decline?
I don’t know much about this, but I assume you can’t actually use inventories down to zero, nor can you maintain the same flow rate as it approaches the limit of what can be removed from the tank/storage.
check out the latest Antero company presentation, see page 22
https://www.anteroresources.com/investors/presentations
the US is exporting 2.2Million Barrels of LPG, more than all other oil and gas exporting countries combined, and add ethane will double it to >4Million Barrels per day?
with 2Million BPD of C5,C6+ in NGL goes to dilute and move out 6MBOPD Venezuela heavy crude, US will be controlling over 12Million BOE liquid per day export, with another 3 MBOEPD of LNG.
While Permian is gassing out more and more LPG and ethane, the Southwest Marcellus is producing it for the core profit.
Sheng Wu,
US net exports of NGL was roughly 3 Mb/d in 2025, Venezuela has never produced more than about 4 Mb/d of C+C, extra heavy production has never been more than 2 Mb/d, perhaps some day Venezuela produces 6 Mb/d of extra heavy (API gravity<10 degrees), but not before 2035, and more likely not ever.
DC,
you are right, the US NGL export roughly 3Million Bbl/d include LPG(Propane mainly) at 2.3M and ethane around 0.5M. But, in the past month (April), China just bought record 580K bbls/d or close to 1million tons of ethane from US.
With the ever increase GOR and bubble point gas out in Permian, the NGL will be keeping a fast increase pace, and along with Wet gas in SouthWest marcellus, the the US NGL production will see a fast increase in the coming years while shale and tight oil production stalls.
About Venezuela extra heavy production, at the latest peak of 2007, about 2.5Million BOPD came from the Orinoco heavy oil belt (it is not 100% extra heavy, and quite some around 10deg API and could be produced at a much faster rate). With the US ever accessible NGL diluent, the production could be increase very fast, topping 3~5Million BOPD is not a fantasy in 2~5 years, with 3:1 diluent, the export will be close to 4~6 Million BOPD.
Sheng Wu,
What is your source for 2.5 Mb/d of extra heavy crude from Orinoco in 2007? Venezuala averaged 2.8 Mb/d of C+C output in 2007, doubtful that extra heavy oil output was 90% of total output. Venezuala’s exports of C+C were about 1.9 M in 2015. Not clear this level can be restored quickly. Your forecast sounds very optimistic. Your 3-5 year prediction might be correct in 8 to 10 years.
I wonder how long Saudi, UAE, Qatar, Bahrain, Kuwait, Iraq can handle the loss of income from exports, or handle the loss of imports (food, equipment and machine parts, for example).
The stability of these governments is diminished under conditions of economic duress, perhaps more so than in Iran.
What kind of outcome can they accept?
Don’t be surprised if civil unrest and insurgencies sprout in these countries over the next year or two if they cannot rapidly re-establish stable conditions favorable to frictionless trade.
Trump (and America in general) may sour to the task of providing military support to the region he has broken so badly.
It looks to me like the only thing that keep interest rates from going up over the next year is recession. Regardless, looks like we are on a path for a sharp leg down for US population purchasing power over the next years.
Hickory,
A few thoughts.
First, the US has a slight surplus in FF balance of trade, so rising prices don’t hurt the US *as a whole*. OTOH, the US isn’t monolithic: you have oil & gas producers, whose income is rising, and consumers whose disposable income is falling. IOW, Texas is doing great, but Maine and California are hurting. And even within Texas there are winners and losers.
2nd, the majority of oil & gas is consumed directly, not used as inputs to other things like manufacturing. Also, the impact of those inputs is substantially reduced by mitigations that commercial and industrial users implement when a single input rises in price: they’ll raise efficiency, use substitutes, reduce other costs, etc. That means that O&G inflation doesn’t raise Core CPI nearly as much as headline CPI, and the Fed pays attention to core CPI, not headline. That has changed since the 1970’s and the price shocks of that era – the Fed has learned to worry much less about oil price spikes.
3rd, people now have alternatives. You can run out and buy a hybrid or EV in a matter of days, either new or used. Solar takes longer, especially in the US, but in a lot of places you can buy and install it very quickly. IIRC Pakistan and Nigeria stand out here.
Turning over a fleet takes longer, of course, but substantial change can happen faster than one might expect. Remember, exponential change is hard to anticipate, and in this case the low part of the curve is mostly behind us.
4th, what happens when the full impact of the strait closure hits depends on government and market responses. Price signals are extremely effective at matching supply and demand, but well-intentioned but incompetent governments often interfere. They do stupid things like fuel tax holidays and price controls. In the end supply will match with consumption – we can take the easy way or the hard way. What is the hard way? Well, that includes governments running out of money to subsidize price controls on imports that must be paid for at higher prices. It includes sudden price increases after futile attempts to limit the pain of price increases, followed by rioting consumers. Far better to allow prices to rise and provide subsidies for the minority of consumers who are low income (most fuel is consumed by higher income people who don’t need protection).
A sensible use of market price signals is to tax oil & gas, and to tax ICE vehicles. Norway did this: they have always taxed ICEs heavily to reduce oil imports, and when EVs became available the vehicle tax was waived, which made perfect sense. Now Norway imports very few ICEs. It’s easy to imagine using FF related taxes to subsidize EV & PV.
The big question is how much production is permanently lost due to shut in wells and damaged formations?
“The Key Mistake – Assuming a Very Short War”
~~~~~
The Next Global Economic Shock From the Iran War Is About to Begin
Prof Robert Pape, May 18, 2026
https://substack.com/inbox/post/198137350
“(If) the assumption is that the war will last only a few weeks or a month or two, then all of the economic disruption – shipping delays, production stoppages, port congestion – due to the closure of Hormuz is both temporary and easily offset by existing inventories and onsite storage.”
“There is no scenario for Hormuz remains closed through the fall of 2026 or later. This means that the estimates – essentially all the estimates – have strongly assumed a very short war – always an unrealistic assumption”
“The pattern of economic blockades is historically consistent. The first phase produces price spikes without immediate shortages. This is essentially what the current market estimates assume: States draw on reserves and inventories, cushioning the initial shock. Markets adjust, and the system largely absorbs the disruption.
The second phase begins once those buffers become central. Prices rise further, airlines cut flights, and shortages begin appearing unevenly across vulnerable economies. But the shock remains partially contained because governments can still draw on inventories and emergency reserves.
The third phase is systemic. Once inventories run down to historic lows, production begins to contract as critical inputs fail to arrive. There are no rapid substitutes for 15% of world oil, gas, or petrochemical feedstocks on a timescale short of years to develop new supply.
In the third phase, price still rise but the shortages become chronic and governments, companies, and people react accordingly. They ration fuel, prioritize sectors, and determine which industries continue operating and which shut down. This redistributes economic pain unevenly and often reinforces political priorities.”
“By 90 days (end May), the shock globalizes. Strategic reserves—roughly 1.5 billion barrels globally—are drawn down toward operational limits, covering only a fraction of a sustained shortfall. Supply chains are disrupted across sectors simultaneously, and inflation accelerates as a function of constrained inputs rather than monetary conditions.”
“What to Watch Next”
“First, inventories. Watch U.S. East Coast diesel inventories, European LNG storage levels, and Asian jet fuel reserves. U.S. distillate inventories are already running roughly 11–18 percent below seasonal norms, while European gas storage remains near 30–35 percent full — far below the roughly 55 percent level Europe normally enters summer with. ”
“Second, industrial slowdown. Watch for refinery utilization cuts in India and South Korea, fertilizer shutdowns tied to LNG shortages, falling container freight volumes, and airline route reductions across Asia and Europe.”
“Third, political intervention. Export controls, diesel allocation programs, anti-price-gouging measures, emergency food subsidies, and fuel rationing indicate governments are entering the political phase of the crisis. Early warning signs include limits on diesel purchases, restrictions on fertilizer exports, government fuel-allocation orders, and emergency price caps spreading across multiple countries simultaneously.”
~~~~~
(Apologies for the long cut & paste, but I imagine this may interest participants of this group. Please let me know if I should limit frequency of posts like this).
That’s all very good, except for the following: “ There are no rapid substitutes for 15% of world oil, gas, or petrochemical feedstocks on a timescale short of years to develop new supply.”
That’s not really true. For example, water shipping can very quickly reduce fuel consumption by rather more than 15% by reducing speed. The same is true for trucking. Heck, light passenger vehicles can do the same. And telecommuting is far more fuel efficient for commuting.
There are many coal plants that are currently running well below rated capacity because coal is expensive, polluting, etc. Sad but true, that makes it a swing producer: it’s an easy substitute if natural gas suddenly becomes very expensive or scarce for generation.
The US could reduce overall fuel consumption by 25% in weeks with carpooling: just increase average people per vehicle from 1.2 to 2.4.
Car pooling – the horror.
Nick G,
Hey, thanks for taking time to respond.
“The US could reduce overall fuel consumption by 25% in weeks with carpooling”
Apparently Consumer Car Transport consumes 41% of Total US Liquid Fuel.
So in order to reduce total liquid fuel consumption by 25%, consumer transport liquid fuel consumption would need to drop by 61%.
In a few weeks sounds a bit optimistic, IMHO.
THC,
We can just assume a can opener as the old economist joke goes. I agree car pooling sounds a bit like the can opener.
It may be correct that demand for liquid fuels will fall as prices rise, there can be some switching to coal from natural gas and car-pooling could help reduce demand along with more use of public transport. The 25% reduction sounds optimistic, but maybe 10% is possible over a year or so as people switch to more fuel efficient vehicles and perhaps travel less.
Yeah, I was remembering light passenger vehicles at close to 50%. Per the EIA it was 44% in 2022:
Page 2 https://www.eia.gov/analysis/handbook/pdf/STEO%20Motor%20Gasoline%20Consumption%20Model.pdf
So, a 50% reduction would reduce overall liquid fuels by 22%.
There are two questions here: what is reasonably possible, and what is likely.
It is very important to know what is possible.
The US reduced passenger fuel consumption in WWII by 43% to free up oil for the military, and it was far less stressed than many other countries. We have many tools we didn’t have then, like smart phones in use by almost everyone, which allows far more complex yet convenient options, like Uber-type car sharing and carpooling – these require no infrastructure and only a little programming. We have telecommuting, which is very powerful and which has been deployed very recently for the pandemic. If we had a national commitment to dealing effectively with the economics of oil we could do an enormous amount, both in the short term and in the longer term.
On the other hand, the US has a president that is committed to pretending that this is a minor short term problem. It looks likely that we will stumble into the future.
Nick G,
During WW2 liquid fuel was rationed for consumers, one can assume anything is possible, what is more interesting is predictions of what is likely. Do you think it likely that in the US average passenger vehicle occupancy will increase from 1.2 to 2.4? If so what do you think the probability is? My guess is about 1% at most over the next 5 years.
Dennis,
I think in terms of having an influence on the ideas in circulation about public policy – the impact of current policies, and the policies that would be better. It’s interesting and useful to identify what’s happening now, and our best projections of what’s likely to happen, but I think it’s very important to identify optimal policies.
So…I agree that a significant increase in passenger vehicle occupancy is very unlikely with the current president. Any policy improvement is unlikely unless control of one or both houses of congress pass to the opposition party. Sadly, good public policy is facing a serious head wind with the current torrent of misinformation and, frankly, propaganda from traditionally right wing media, and more mainstream media which is being bought by right wing billionaires, such as CBS, CNN, the Wall Street Journal, The Washington Post (Bezos started well, but is going downhill rapidly), LA Times, etc.
Broadly speaking, mitigations of short term oil & gas supply will either be regulatory or market based. Productive regulatory solutions include mandates such as telecommuting; carpooling; narrowly and carefully crafted rationing; narrowly focused subsidies for low income folks and national security industries; and many other things I haven’t remembered at the moment. Market based solutions include fuel and carbon taxes, and other taxes and subsidies that reflect external costs which should be internalized.
Bad, counterproductive regulations include price controls, export controls, windfall taxes, broad tariffs, anti-price-gouging (aka badly administered price controls), gas tax holidays, etc.
Let me say this again:
what happens when the full impact of the strait closure hits depends on government and market responses. Price signals are extremely effective at matching supply and demand, but well-intentioned but incompetent governments often interfere. They do stupid things like fuel tax holidays and price controls. In the end supply will match with consumption – we can take the easy way or the hard way. What is the hard way? Well, that includes governments running out of money to subsidize price controls on imports that must be paid for at higher prices. It includes sudden price increases after futile attempts to limit the pain of price increases, followed by rioting consumers. Far better to allow prices to rise and provide subsidies for the minority of consumers who are low income – most fuel is consumed by higher income people who don’t need protection, and in fact could pay “gas hog” taxes to pay for narrow subsidies. In fact, it’s the higher income folks who need some rationing, because they’re less sensitive to price signals. That’s part of the reason that CAFE is important – car buyers tend to be higher income and less price sensitive than the 75% of drivers who are in used cars.
Nick G,
I think higher taxes on fuel makes sense and in general favor carbon taxes or a carbon dividend policy.
For carbon dividend policy see
https://peri.umass.edu/wp-content/uploads/2025/01/Boyce-Carbon-Dividends-as-Tax-Justice.pdf
or
https://www.wiley.com/en-us/The+Case+for+Carbon+Dividends-p-9781509526543
Dennis,
I strongly agree. Carbon taxes are simple and very effective. A good example is Europe, where passenger vehicles use only about 18% as much as in the USA, due to sensible tax policy.
Dividends are also a great idea: they eliminate a fiscal impact on the economy, make a tax that would be regressive be progressive instead, and help make carbon taxes politically acceptable.
Which is, of course, why the FF industry hates, hates, hates fuel taxes, utility taxes, carbon taxes, etc. A large part of Republican anti-tax policy comes from an understanding of the effectiveness of such taxes.
Sigh.
From Oct 2010 to Sept 2014, imported crude oil to the US had a real price in 2025$ of $137.77 over that 4 year period. If the Strait of Hormuz remains closed and World oil stocks continue to fall it seems oil prices will by $140/b at least and may rise to $200/b.
The situation in the Strait of Hormuz seems very far from being resolved.
Article below discusses reporting on the crisis
https://oilprice.com/Energy/Crude-Oil/Oil-Shortage-Scenario-Looms-Large.html
Hi there Ovi, all.
The mystery around Russia’s extraction rates deepens. Here is CREA’s brief for April:
https://energyandcleanair.org/april-2026-monthly-analysis-of-russian-fossil-fuel-exports-and-sanctions/
The Kremlin declared revenues of 374 M€/d for crude oil exports plus 173 M€/d for refined products exports. Assuming a generous revenue of 80 €/b, and omitting refinery gains, we get at 6.8 Mb/d exported in April. Adding internal consumption of 4 Mb/d an extraction rate of 10.8 Mb/d can be extrapolated.
Those numbers are obviously bogus. Especially considering that government revenue per barrel is possibly much lower. The Kremlin has been cooking their budget numbers since it started the war, but international institutions refuse to acknowledge so.
Just today, the Ukrainian government made public intelligence pointing to a single company having shut in 400 wells:
https://www.ukrinform.net/rubric-economy/4124650-russia-cutting-active-oil-wells-as-war-losses-mount-zelensky.html
While I don’t trust this last number either, it possibly paints a picture closer to reality.
Good morning all,
It’s nice to wake up to come here see active, civil discussion of the Hormuz, oil supply/demand, etc. from a peak oil perspective.
I wonder what a long-term chart of net energy provided by crude oil would look like. Does anyone know of such a chart or analysis?
Cheers!
Yes. The first two links below illustrate the conventional wisdom of declining EROI for FF. The third paints a somewhat different picture for oil, but still shows rapid declines in EROI for gas.
Peak oil and the low-carbon energy transition: A net-energy perspective
https://www.sciencedirect.com/science/article/abs/pii/S0306261921011673?via%3Dihub
Assessing Global Long-Term EROI of Gas: A Net-Energy Perspective on the Energy Transition
https://www.mdpi.com/1996-1073/14/16/5112
“Estimation of useful-stage energy returns on investment for fossil fuels and implications for renewable energy systems”
https://www.nature.com/articles/s41560-024-01518-6
Hi T HILL,
Thank you for those links!!!
Is EROI the generally preferred term rather than EROEI?
I was intrigued by the paper by Louis Delannoy et al., and I found the complete paper at ASPO France:
https://aspofrance.org/wp-content/uploads/2021/10/clean-version.pdf
Key quote:
“Removing the energy necessary for the liquids extraction and production (including direct plus indirect energy and material costs), we find that the net energy reaches a peak in 2024 of 415 PJ/d”
And
“this first result should not be interpreted as the announcement of a coming peak, but as an indication that by 2024, the production of oil liquids will require an amount of energy equal to 25% of its energy production.”
So they have net energy from liquids peaking at 2024, but visually their graph seems to show a peak in the late 2010’s. How does it look to you?
DC,
Thanks for the link:
https://oilprice.com/Energy/Crude-Oil/Oil-Shortage-Scenario-Looms-Large.html
And, holy moly, the Arab countries now have about 9.3 mbd offline.
“Saudi Arabia is losing over 3 million barrels daily, Iraq is producing 2.88 million barrels daily less, and Iran is at 1.69 million barrels daily lower output, while Kuwait has suffered a decline of 1.75 million barrels daily.”
Iran and Russia probably have some offline as well. Any estimates of how much they are down in mbd now vs 2025 avg?
Russia and Iran combined crude was down by about 550 kb/d in April 2026 from the average 2025 level, based on the May MOMR from OPEC.
Not sure who this fellow is, but FWIW more speculation on where we are heading:
https://x.com/AlaliQasem/status/2056446235385454918?s=20
We have reached the Point of No Return. 🚨
JPM, Goldman, Morgan Stanley all assume Hormuz opens by June.
Here’s why that’s wishful thinking:
⚠️ Production restart impossible before August — logistics alone
⚠️ Ballast tankers headed to US — won’t return to Gulf for weeks
⚠️ Every day without resolution = higher probability of NO resolution
The psychology:
🇺🇸 US leaving now = total strategic defeat
🇮🇷 Iran has already paid the cost = will outlast adversary
The math for May:
🔴 Production shut-in: -12M b/d
🟢 Demand loss: +2M b/d
🟢 SPR: +2.5M b/d
💥 Net flow loss: -7.5M b/d every single day
JPM said it themselves:
‘Tank bottom in global inventories if Hormuz doesn’t open by June’
They just won’t say what happens AFTER tank bottom.
I will: Demand destruction. Violent. Historic. 🛢️💥
Venezuela added 1M
THC,
For perspective, in 1981 World C+C production fell by 6.14% from the 1980 level. A similar % change in output in 2026 from the average 2025 level would bring average 2026 C+C output to 79.2 Mb/d from the 2025 level of 84.4 Mb/d a fall in output of 5.2 Mb/d. In 2020 World C+C output fell by 7.64% from the 2019 average level. If we assume a similar % change in 2026 to 2020 then World C+C falls to 78 Mb/d, a decrease of 6.4 Mb/d. Impossible to know what will occur in the future, but if the Strait of Hormuz remains closed there will be big problems down the road.
Sheng Wu,
Average Venezuelan crude output was 937 kb/d in 2025, in April 2026 monthly Venezuelan crude output was 1031 kb/d, an increase of 94 kb/d based on secondary source data from OPEC.
By 1 M do you mean 1 Mb/d of crude output? What is your source?
Total OPEC crude output is down by 9.7 Mb/d (this includes any increases in Venezuela) from Feb 2026 to April 2026 based on secondary sources.
DC,
https://www.oilandgasadvancement.com/news/venezuela-oil-exports-surge-to-seven-year-high-in-april-2026/
In April, Vz exported 1.23Million BOPD, 14% higher than March — highest since 2018.
The heavy oil in Orinoco has quite some shades,
some are above or close to 10deg API, and could produce with extremely high rate and minimal input, i.e. no need to heat up, and cost per barrel even lower than Saudi — it’s called foamy oil. They just need diluents to move/export.
Hi DC,
Thank you for sharing that — 1981 C+C decline of 6.14%.
**Comparing that to current situation**
2026 C+C = 84Mb/d
Offline/shut-in = 10 mbd
YoY monthly decline of roughly 12%!?
That sounds rather severe, and I imagine it will become more noticeable in many countries relatively soon.
~~~~~
So far, most of the shortages here in Japan are in plastics and material related to naphtha.
FWIW I asked AI to create a list of products currently in shortage in Japan due to the Hormuz closing (primarily naphtha related).
~~~~
**Agricultural and Crop Supplies**
*Rice and Bread Bags:
Standard heavy-duty polyethylene bags used by farmers to securely store, weigh, and transport rice harvests and grains are experiencing severe production backlogs.
*Crop and Silage Wrapping:
Heavy plastic films used for wrapping animal feed, hay bales, and silage are highly restricted.
*Soil and Greenhouse Films:
Farmers are facing strict bottlenecks for agricultural mulch film (used for ground soil coverage) and greenhouse roofing plastics.
**Food Packaging and Printing Inks**
*Monochrome Snack Bags:
Due to unstable ink and solvent supplies, Calbee is stripping color from 14 flagship product lines, switching to two-color black-and-white bags to cut ink usage in half.
*Unprinted Bundling Materials:
Pasta maker Nisshin Seifun Welna has eliminated printed red ink cooking directions, switching to plain, unprinted paper tape for bundling its spaghetti.
*Condiment and Food Containers:
The manufacturing of plastic squeeze tubes (like those used for mayonnaise or seasonings) and nattō (fermented soybean) containers has slowed down, causing Mizkan to temporarily suspend four product lines.
*Household and Municipal Supplies:
*Designated Trash Bags:
A severe shortage of the polyethylene bags mandated for volume-based waste disposal has sparked panic-buying.
*Cling Wrap and Lids:
Plastic cling wrap is seeing limited supply, while convenience chains like Lawson are swapping plastic coffee lids for paper alternatives.
**Medical and Healthcare Products**
*Nitrile Equipment:
Medical-grade disposable gloves face a critical shortage, forcing a 50-million-unit emergency release from national pandemic stockpiles.
*Clinical Plastics:
Essential hospital consumables like plastic syringes, petri dishes, and diagnostic testing trays are encountering steep production bottlenecks.
**Precision Machinery and Industrial Supply Chains**
*Synthetic Resin Parts: Custom cyclic intermediates and high-grade plastics used in internal automotive wiring, precision machinery housings, and electronics hardware are tightly rationed.
*Industrial Thinners and Solvents:
Paint thinners and chemical solvents used in automotive plating and industrial bodywork have seen supplies plunge up to 80%, forcing reduced assembly lines for truck manufacturers.
*Tires and Infrastructure Insulation:
Synthetic rubber shortages have triggered immediate domestic price hikes for commercial tires, while petroleum-based structural foaming and residential insulation materials face severe distribution backlogs.
**Housing Industry**
*Modular / Prefabricated Bath Units:
Major home equipment manufacturers—including TOTO, Cleanup, Lixil, and Panasonic Housing Solutions—have either completely suspended new orders or stopped providing delivery dates for their modular bathroom units.
*Foundation Insulation (Plastic Foam / Styrofoam):
Severe shortages of petroleum-based plastic foam insulation (such as DuPont Styro, which announced a 40% price hike) have stalled the very beginning of construction. Builders cannot pour concrete foundations without laying down this foundational insulation first, triggering a domino effect that delays carpenters, electricians, and plumbers.
*Pipes, Paints, and Industrial Solvents:
Shortages of raw petrochemical feedstocks have constrained the production of PVC piping used for water lines and drainage. Concurrently, a lack of petroleum-derived paint thinners, sealants, and rust-proofing coatings is forcing builders to leave walls unfinished.
**The Impact on Homeowners**
The lack of a single component or adhesive is halting entire home builds. Contractors (such as Maeda Housing and Kurasu) report that a quarter of their active projects are delayed, forcing them to push back completion and handover dates by two to three months.
According to S&P Global Commodities at Sea data, USGC crude oil imports from Venezuela increased to 9.2 million barrels in January, up from 6.4 million barrels in December 2025.
https://www.spglobal.com/energy/en/news-research/latest-news/refined-products/021926-increased-venezuelan-crude-imports-displace-mexican-hsfo-refinery-demand-in-usgc
In kb/d US imports from Venezuela increased to 297 kb/d in January, up from 206 kb/d in December. Based on EIA weekly data the 4 week average imports of crude from Venezuela had increased to 449 kb/d for week ending May 8, total 4 week average US crude imports for week ending May 8 were 5801 kb/d, so 7.74% of crude imports for the most recent 4 week average reported were from Venezuela.
US net imports of crude have dropped from 2418 kb/d for 4 week average for WE 2/27/2026 to 431 kb/d for 4 week average for WE May 8, 2026. US crude stocks have dropped by about 20 Mb from the end of Feb to w/e May 8. Inputs to refineries for WE May 8 were 16121 kb/d (4 week avg), US production of crude for w/e May 8 was 13614 kb/d (4 week avg). So to maintain product stocks we need net crude imports of 2500 kb/d, at net imports of 431 kb/d we have a deficit of 2100 kb/d and stocks would decrease at 65 Mb monthly. Total crude stocks were at about 837 Mb for W/E May 8, perhaps 50% of this can be utilized (there are minimum levels for pipeline fill and tank bottoms, etc) so call it 420 Mb of usable stocks or about 6.5 months of crude supply at May 8 levels of deficit. At World level this is probably much worse.
https://www.morningstar.com/news/dow-jones/2026052010469/us-crude-oil-imports-from-venezuela-at-highest-levels-since-2018-eia-data-show-opis
LATEST NEWS: US import oil from Vz approaching 1million BOPD.
Sheng wu,
Output has not changed much in Venezuela, the exports have been redirected to the US, this changes very little in terms of World Supply and oil prices as it is a World Market.
It will take at least 5 years and more likely 10 years before we see a significant increase in Venezuelan output as the oil industry infrastructure has been severely neglected for more than a decade. It will take time to rebuild.
DC,
Since 2025, Venezuela crude production has been on the recovery mode, assisted by Chinese oil companies and endowed by the natural crude advantages.
In late 2025, Vz production already topped 1million BOPD, and I would like to bet that by end of 2026, Vz will be producing 2.5million BOPD and exporting 2.5million BOPD (with 0.5million diluents import).
Sheng Wu,
We will see.
For EIA estimates see
https://www.eia.gov/international/data/world/petroleum-and-other-liquids/monthly-petroleum-and-other-liquids-production?pd=5&p=00000000000000000000000000000000002&u=0&f=M&v=line&a=-&i=none&vo=value&vb=173&t=C&g=none&l=249–243&s=94694400000&e=1767225600000&ev=true
and chart linked below, Jan 2026 C+C was 805 Mb/d, recent peak in November 2025 at 1005 kb/d an increase of 100 kb/d YOY. OPEC has Venezuela crude at 1031 kb/d for April 2026, about 94 kb/d above 2025 average crude output.
Perhaps the increase in the rest of 2026 will be 10 times higher than the recent past. I will believe it when I see the data.
venezuela cc
“The May edition of the IEA’s Oil Market Report is exceptionally provided free of charge in an abridged format.”
https://www.iea.org/reports/oil-market-report-may-2026
This shows that… “global observed oil inventories drew by 129 mb in March and by a further 117 mb in April”
Has anyone here done the math to confirm JP Morgans forecast that operational stress levels would be reached by early June and the operational floor by September?
T HILL,
Thank you for sharing the IEA report.
I am not all that familiar with global oil inventory statistics, but after poking around on the internet and using AI, it appears rather difficult to get clear global inventory data that is recent enough (ideally May 2026) to be meaningful in the current situation.
Perhaps it would be easier to look at local areas to see where inventories are particularly low or shortages are reported as anecdotal evidence of whether the draws are as severe as forecast by JP Morgan.
From the IEA report:
“end-April products stocks stored at the Amsterdam-Rotterdam-Antwerp
(ARA) trading hub plummeted to the lowest end-month levels since January 2015. ”
“Total oil product inventories in Fujairah plunged by 6.4 mb in April to a new record low”
It would be nice to see the full text of the JP Morgan report.
IEA 2026 Energy Crisis Policy Response Tracker
https://www.iea.org/data-and-statistics/data-tools/2026-energy-crisis-policy-response-tracker
Thanks for that link THC.
DC,
I am reading your post below back in 2012, at that time, Bakken was all rosy under your scope then?
https://oilpeakclimate.blogspot.com/2012/12/update-on-bakken-model-using-hyperbolic.html
After looking at Marcellus SouthWest could produce shale oil, I have more confidence that Bakken could produce true shale oil. That will double Bakken’s reserve.
Sheng Wu,
We will see. Currently cumulative production plus proved reserves for Bakken/ Three Forks is about 9.5 Gb, your expectation is that proved reseves will double to 8 Gb with cumulative plus proved reserves rising to 13.5 Gb, my guess is that that would be a very low probability scenario, less than F5.
Reality shows that Bakken/ Three Forks is likely to have a URR of 8 to 10 Gb. Scenario below has Bakken/Three Forks North Dakota tight oil with URR of 9 Gb, see link below for chart.
bakken 2512
Sheng Wu,
With all the announced power infrastructure buildout (largely related to AI), 15 to 25 GW of new CCGT power could be online within 5 years in the eastern US.
That comes out to 4/5 Bcfd additional App Basin production, which then would likely exceed the 40 Bcfd threshold. As you know, only the US and Russia produce more.
Question … when you mentioned SW Marcellus shale oil, are you referring to West Virgina? I am unaware of significant Pennsylvania oil production from the SW. Sure, the northwest crescent has been producing both oil and condensate from the Marcellus and Utica for over a decade.
Is this SW oil production something relatively new?
(Aside to Dennis … sure do miss not having those red tab ‘New’ things whenever a new comment was posted.
Made following multiple convos throughout posts WAY easier to both identify and follow. Jes sayin’).
Appalachia Rising!
Coffeeguyzz,
Sometimes and addon is not compatible with updated versions of WordPress. I do not write these apps, but what is available for free is limited. If you would like to pay for such an app, shoot me an email on what you are willing to spend and I will see what I can find.
Coffeeguyzz,
“Shale Oil” is the biggest misconception between mainstream media and mainstream geologists!
In petroleum geology expert community, there is a majority (>60~90%) believe that currently US shale oil are not coming from shale with high organic matrix (TOC, total organic carbons), or even higher majority (>80~95%) believe that shale oil are not coming from the TOC. That is validated by the fact that in Bakken, almost zero laterals landed in the high TOC Upper and Lower Bakken Shale, all the >10K laterals landed in the middle Bakken with TOC=0. But, there are tons of evidence that the Upper and Lower Bakken shale has oil — one could see it, smell it, and feel it, and it shows up in Gas CHromatograph, quite close to the produced oil. Some research even suggest that gas in Mid-Bakken could come from the high TOC Upper and Lower Bakken Shale. But, there are research suggest that the middle Bakken oil don’t come from the the Upper and Lower Bakken Shale, but could come from the Three Forks below Lower Bakken Shale, yes, it could steel oil from the ultra-tight Lower Bakken shale!!!
But, a majority (>80%) geology expert community agree that “shale gas” mainly come from TOC matrix.
The SouthWest Marcellus are mostly wet gas, and some condensate, i.e. in the West Virginia counties in between Ohio and PA. However, few ever tapped the Ohio part, where the Marcellus there is deemed as too shallow and non-productive due to the same reason as in Bakken, i.e. low maturity in the oil window while TOC is as high as Bakken Upper and Lower Shale. However, in the past 2 years, Antero and Gulfport successfully demonstrated that the OHIO part could be productive as well, and the fluids are falling into the volatile oil window. This demonstrates that “shale oil” could be produced from shale with high TOCs.
Sheng Wu,
The best performing wells and about 98% of all horizontal wells completed in the Williston Basin are completed in the Middle Bakken and Three Forks Formations, other formations have far lower average well productivity and are not likely to be profitable. Just the reality of the situation.
See following link from Novilabs with wells completed from 2017 to 2023 in North Dakota Williston Basin, 6591 wells total with 3687 in Middle Bakken and 2794 in Three Forks and 110 wells in Unknown formations. Cumulative output at 60 months was 335 kb for Middle Bakken, 306 kb for Three Forks, and 167 kb for unknown wells.
https://public.tableau.com/shared/YBF4WDGXY?:toolbar=n&:display_count=n&:origin=viz_share_link&:embed=y
Additional information about the SouthWest Marcellus,
Besides Antero and Gulfport, Expand and EQT also have drilled in OHIO part of SW Marcellus, and the latest NOVI report on Expand even listed this blocks as Tier1,
https://novilabs.com/blog/corporate-analysis-expand-energy-q1-2026/
and the NorthEast Marcellus is actually tier3,4 for Expand, and even those are also producing quite strongly, but just because the gas prices realized is too low, they are only Tier 3,4.
The industry operators have long been puzzled by the SouthWest Marcellus prolific production,
https://www.youtube.com/watch?v=WF59VA4QQGA
Now, I have an explanation for the 110% EUR,
https://www.linkedin.com/pulse/pyrites-fools-gold-marcellus-over-100-eur-sheng-wu-lxhqc
and this works in the Ohio oil window too, Bakken shale could as well have super productivity — just read it also has tons of “fool’s gold”.
‘Point of no return’: A research firm says the oil market is headed for a dire turning point by early June bold theirs.
The oil market could reach a grim turning point in the next few weeks, HFI Research says.
The firm sees “real panic” hitting crude markets as oil inventories run out.
Previously, it speculated that panic buying and hoarding could send crude prices past $150 a barrel.
Market watchers have puzzled over the reasons for oil’s resilience in recent weeks, but things could be about to change for the worse, one research firm is warning.
HFI Research, an investment research firm with a focus on energy markets, said it sees the oil market hitting a major turning point in the first week of June. If the Strait of Hormuz remains closed through that time, oil markets will likely descend into “real panic,” it said, suggesting that nations around the world could start panic-buying and hoarding oil as oil inventories hit rock bottom.
The scenario — which HFI said wasn’t its base-case — is contrary to where most forecasters think the crude market is headed. The firm pointed to more optimistic oil forecasts about how the market would soon normalize, but those predictions are likely fueled by “psychological biases” in the oil market, it said.
“It seems clear to me that if the Strait of Hormuz is still closed by the first week of June, we will see real panic,” the firm wrote in a Substack post on Monday of the coming turning point in markets.
“Sellside is still assuming some return to normality by June to avoid tank bottom, but the math is what it is.”
And yet, crude prices dropped today because the president said negotiations with Iran were “in their final stages”.
Traders seem convinced the the president will “chicken out” in time to prevent really serious shortages/price increases.
It seems like this move of suppressing oil prices and lifting stock prices by announcing that “we are close to a beautiful deal” will eventually stop working, but for now the market seems happy to cooperate.
I tried to imagine that I were a high level negotiator trying to stop a war and restore the trade flow through the world’s 1st (or 2nd?) most important energy choke point and ask myself whether I would leak to the press that “a deal is imminent.”
How would it benefit negotiations to leak progress to the press?
Why would I do such a thing?
I couldn’t come up for a reason for leaking comments like this to the press other than manipulation.
In this case, we have rumors of an OpenAI IPO filing by as early as Friday, so there is a possible motive to keep stock prices levitating, and gather up as much as the public’s money into Open AI as possible.
I agree.
My best guess is that this administration is aware that this war is an embarrassing failure, and doing everything it can to avoid admitting this. They’re improvising, saying whatever helps for the very short term, hoping that something will happen to create an excuse to credibly declare victory and get out.
Of course, it looks very much like they’re making vast fortunes from insider trading on these various announcements. Sometimes corruption is the simplest explanation.
Hilarious:
Earlier today, US time, we were told a US/Iran deal is close.
Just a few hours later, Trump’s policy chief threatened Iran:
“Iran can either agree to a piece of paper that is satisfactory to the US, or they can face a punishment from our military the likes of which has not been seen in modern history.”
From around 1:50 time stamp:
https://www.foxnews.com/video/6396222770112
“We will determine our selling price and if they do not want to buy, so be it. It’s okay if they do not want to buy it, we’ll leave it in the ground for our future generations,” Prabowo said in a speech on 20 May on the 2027 budget and economic plans.
https://www.opis.com/resources/energy-market-news-from-opis/indonesia-to-nationalise-coal-export-activity/
World largest exporter coal is having second thoughts about selling her endowment of coal to world market. Indonesia does not have large coal reserve. It began developing it quite late, but it appears that is now thinking whether it was a good idea to sell them at the rate it has been doing.
A very good thing for the environment – with luck that coal will stay in the ground forever. I think industry insiders often don’t understand the possibility that over time, with a variety of climate disasters, that FF in general and coal in particular will become stranded assets. For instance, Fukushima was a big blow to nuclear power- imagine a dozen Fukushimas in quick succession.
In the meantime higher export pricing will reduce coal consumption.
Indonesia and Venezuela and some resources rich countries all have impatient hearts.
China had rare earth and kept on exporting low level raw materials and the processed materials at low cost for decades before mastering the complete chain and then exercising the power.
Indonesia imposed some 3X more taxes and cut quota more than 50% for the nickel ore, and all refineries in Indonesia now stopped production and even starting import nickel ore from Philippine.
UAE is doubling its capacity to avoid the Strait of Hormuz by end of 2027, see
https://www.thedailyjagran.com/world/uae-announces-new-west-east-oil-pipeline-bypassing-strait-of-hormuz-by-2027-amid-energy-crisis-10312270
Also the following story suggests Saudi Arabia is exporting 7 Mb/d using East/West Pipeline to avoid Hormuz.
https://zeenews.india.com/world/what-hormuz-crisis-saudi-aramco-s-new-oil-route-moves-7-million-barrels-daily-here-s-how-3048741.html
and
https://www.morningstar.com/news/marketwatch/2026051977/crude-oil-is-going-the-long-way-around-the-world-as-countries-scramble-to-plug-hormuz-supply-hole
Note that in 2018 (most recent data point from EIA) Saudi Arabia was exporting 7341 kb/d of C+C. See chart linked below
saudi exports
I have found further info that about 5 Mbpd of crude is being exported by Saudi Arabia, with 2 of 7 Mbpd of crude transported in east west pipeline going to refineries.
The UAE gulf of Oman export terminal is well within the target zone of Iran weaponry.
It looks like wind and solar combined will be the #1 source of global electricity generation (not simply capacity) by around 2030.
Which means various things, including the idea that fossil fuels will last a little longer, and that some countries won’t go broke trying to compete for depleting or sequestered fuels quite so quickly.
https://electrek.co/2026/05/20/in-a-first-wind-solar-generated-more-power-than-gas-globally-april-2026/
Thank you for the link!
We could always speculate around how much renewable power can added to the grid before costs go up or there are some form of capacity limitations. 70-100% in blessed areas (including hydro power) or less than 30% in the worst favourable areas.
I would argue that the control systems being built now means that you could actually juggle more around physical limitations (like the grid). The likelihood of a more start/stop oriented grid actually functioning or, to be real, some parts of “the grid” based on renewables – is quite a big one given the large advances in computual advances we are seeing. There is a risk regarding the reliance on computers and spare parts overall, but that would be many decades away and dependent on global conflict level. Pretty small risk over a long time period. There are all kinds of options to build more innovative electricity supply, like relying more on solar panels/home battery/electric vehicle to grid in a home for example. Or with air to air heat pump/ground heat pump/insulation getting more out of electricity already supplied.
I assert that the US has lost the capacity/will/political capital to do what it takes to keep the SOH shut down.
The Gulf nations and all of the nations of the world who are dependent on oil, gas, refinied products, helium, fertilizer components, etc are all going to rebel against this failed US project.
Whether or not Iran keeps the highly enriched uranium I do not know, but I do suspect Iran ends up earning large payments for transit of the SOH for those it chooses to impose upon.
I would not be surprised that Trump, with his petulant and vengeful character, orders a ‘scorched earth’ attack on the Iran export facilities as he announces the end of these ‘special operations’. He would hate to been seen as a loser as he limps home. Better to make everyone look like a loser.
Hickory,
That would be a risky strategy as Iran would go all out to destroy energy facilities of GCC nations, Trump would look like even more of a loser if he does what you suggest.
We could see a very long stalemate of 4 to 6 months longer, before a diplomatic solution is reached. Maybe Iran will try to hold out until midterm election in November. We will see.
Soon the markets will start ignoring the bullshit and realize no cards are held by Trump.
True about that Trump action. I do think it is a possibility that should not be dismissed, given his erratic behavior.
US SPR withdrawals were about 10 million barrels for week ending May 15, 2026. Supposedly the minimum level for the SPR is 150 million barrels, so of the 374 milion barrels currently in the SPR, about 225 million barrels are available. If the 10 million barrel per week withdrawal from the SPR continues for 22.5 more weeks (about 5 months), we will reach the minimum level of 150 million barrels by October 2026.
Regarding Strait of Hormuz:
Markets still hope for a miracle reopening. ADNOC is warning that the miracle is not coming. – Cyril Widdershoven
https://oilprice.com/Energy/Crude-Oil/ADNOC-Warns-Gulf-Oil-Disruptions-Could-Last-Until-2027.html
Saudi Exports less than 5 Mb/d in March based on piece linked below
https://oilprice.com/Latest-Energy-News/World-News/JODI-Saudi-Arabia-Crude-Exports-Sink-To-Record-Lows.html
Perhaps demand falls due to high prices, see below where IEA predicts 30% of new passenger vehicles sold in 2026 will be electric.
https://oilprice.com/Latest-Energy-News/World-News/IEA-Oil-Shock-Sparks-Surge-in-EV-Sales.html
Rig Report for the Week Ending May 22
– This week’s rig count is providing the first indication that higher WTI prices are attracting increased drilling.
The dropping rig count that started in early April 2025 when 450 rigs were operating rose this week for the third week in a row. WTI closed slightly above $96/b today, unchanged from last Friday.
– US Hz oil rigs rose by 3 to 377, down 73 since April 2025 when it was 450. It was also up 15 rigs from the low of 362 first reached in the week ending August 1, 2025. The horizontal rig count is down 16% since April 2025.
– The New Mexico Permian rig count dropped by 4 to 79 rigs. Rigs were dropped in both Eddy and Lea counties. Eddy dropped by 2 to 33 while Lea dropped by 2 to 46.
– Texas added 7 rigs to 192. Midland was unchanged at 22 while Martin dropped 1 to 24 and Upton dropped 2. Within Texas, there was one large upward change. Ward county added 3 rigs this week. Ward started with 6 rigs in January.
– Eagle Ford was unchanged at 32.
– NG Hz rigs dropped by 1 to 106.
A Rig
Frac Spread Report for the Week Ending May 22
The frac spread count rose by 5 to 189. From one year ago, it is up by 3 spreads but is still down by 26 since March 21, 2025. The rig count has now increased for 5 weeks in a row. Both the Frac spreads and rig counts are
increasing.
A frac
A good article about the current state of the Iran war.
“ He seems to hope to slip away without Americans noticing the magnitude of this defeat.”
“ The outlines of President Trump’s endgame in the Iran war are now emerging. In a phone call with Israeli Prime Minister Benjamin Netanyahu yesterday, Trump reportedly explained that the United States was negotiating a “letter of intent” with Iran that would “formally end the war and launch a 30-day period of negotiations” on Iran’s nuclear program and the reopening of the Strait of Hormuz. The purpose and effect of such an agreement should be clear: The United States is walking away from the crisis. Trump may launch another limited strike to look tough and satisfy the demands of the war’s supporters, but it would be a performative gesture. Endgame in this case is a euphemism for “surrender.””
Basically, a disaster for the ME, the US and especially Israel.
https://www.theatlantic.com/international/2026/05/trump-surrender-iran-endgame/687252/
Hi Nick,
It’s amazing how far apart their announcements are.
**per Iran’s Fars News and Al Mayadeen**
🌏 Strait of Hormuz remains under Iranian management — route determination, timing, permits, and passage methods controlled exclusively by Tehran
🌏 Ship volumes return to pre-war levels, but Iran explicitly rejects any return to “free passage” status quo
🌏 US Navy withdraws from the Persian Gulf, Gulf of Oman, and Arabian Sea
🌏 Over $12 billion in frozen Iranian assets to be released
https://t.me/geopolitics_prime/69979
“Iran also confirms the nuclear file has not been discussed and that American officials themselves have told Iran in multiple messages that “Trump’s tweets are primarily for domestic American propaganda and media consumption” and “should be disregarded.” The “largely negotiated” deal claim therefore has no basis.”
https://x.com/HormuzLetter/status/2058301834658533417?s=20
**Per Trump**
“…….a Memorandum of Understanding pertaining to PEACE. An Agreement has been largely negotiated, subject to finalization between the United States of America, the Islamic Republic of Iran, and the various other Countries, as listed…..Final aspects and details of the Deal are currently being discussed, and will be announced shortly. In addition to many other elements of the Agreement, the Strait of Hormuz will be opened.”
https://x.com/selinawangtv/status/2058287897720099003?s=20
**Per Ali Hashem, Al-Jazeera’s correspondent in Iran**
Details of the final MoU draft include:
– End of regional war on all fronts, including Lebanon.
– Freeing several billions of dollars of Iran’s frozen assets.
– Lifting the U.S. naval blockade.
– Opening the Strait of Hormuz under ‘Iranian management’ (unclear if there will be tolls)
– Withdrawal of the majority of American forces from the Middle East.
After this, the two sides will have 30 days to find an agreement on the nuclear issue, but this timeframe can be extended if mutually agreed.
https://t.me/megatron_ron/15482
Quick heads up:
Dan Scavino, Deputy Chief of Staff at The White House and Director of the Presidential Personnel Office, just posted a video of B-2 stealth bombers:
https://x.com/DanScavino/status/2057992948508250433?s=20
Apparently, the Last time Scavino posted B-2 footage, the U.S. and Israel attacked Iran the next day.
https://t.me/DDGeopolitics/184735
~~~~~~~~
These guys have great timing.
Push down oil Thursday and Friday, load up with longs, and then bomb over the weekend.
We will have to see if they do indeed start bombing this weekend, but if they do, we can guess somebody is making huge money in oil futures/options on that.
https://mishtalk.com/economics/gop-senators-break-with-trump-over-1-8-billion-anti-weaponization-slush-fund/
Trump sued his own Department of Justice for 10 billion.
Settled the case.
Trump gets:
1) A 1.8 billion dollar slush fund that he can allocate to whoever he wants. He does not have to disclose who he gives the money too.
2) Can’t be audited by the IRS for past or future tax returns.
Lucky guy!!!
https://www.msn.com/en-us/crime/general/ivanka-trump-reportedly-the-subject-of-terrorist-assassination-plot/ar-AA23Td5A
Attempted assasination attempt on Ivanka Trump by IRGC
Hey Andre,
So much crazy stuff in the headlines.
I’m starting to tune it out to some degree — maybe that’s the idea — flood us with so much contradictory information that we give up and stop trying to figure out what’s really happening.
Argentina shale oil increase 38% YoY in April, and now the #1 export commodity for Argentina, $1.4Billion in April.
The fastest growing blocks have low GOR (<300scf/bbl) and API (~28deg)
https://www.rionegro.com.ar/energia/la-balanza-comercial-energetica-fue-record-en-abril-2026-por-vaca-muerta-neuquen-alcanzo-su-mejor-registro-historico-de-produccion-de-petroleo-4583146/
Sheng Wu,
The YOY gain is for a specific province of Argentina (Neuquén) rather than the nation as a whole. Vaca Muerta is primarily in this province, so this increase reflects increased output from shale oil. For Argentina’s C+C output was up by about 17% from Jan 2026 to Jan 2027 based on EIA data, link below
https://www.eia.gov/international/data/world/petroleum-and-other-liquids/monthly-petroleum-and-other-liquids-production?pd=5&p=00000000000000000000000000000000002&u=0&f=M&v=mapbubble&a=-&i=none&vo=value&t=C&g=none&l=249–6&s=94694400000&e=1767225600000
DC,
Yes, the YoY for Vaca Muerta (mostly in Neuquén) is up 36% to be exact, and for the country it is up ~20%, and oil and gas trade turned positive last year, and heading to major revenue this year.
Continental Resources just bought into the lowest GOR and API block in the neighboring Rio Negro, and similar to China’s Jiyang Sag.
https://www.linkedin.com/pulse/new-continental-block-vaca-muerta-vro06-sheng-wu-qn8uc
They’ve got a solid 10 year ramp up of production ahead.
Hickory,
“solid 10 year ramp up of production ahead” —
certainly, there is supposed to be another 100 miles extension East in the Rio Negro province of the vRo=0.6% based on the current burial depth — I remember. With this 3X larger black oil window blocks, I would like to guess that it is possible to reach 2 million BOPD in 10 years.
But, the burial history could be totally different, and with the knowledge of isotope Ro certainly provide a good reference for maturity.
Continental also tried to drill in the immature block of Bakken — further north in Divide county but not very promising.
I am trying to market my isotope maturity gauge and nano-porosity measurement to the operators in VM.
So, much of the overall VM zone remains to be drilled for characterization?
Anyone have a clear idea why the large price movement over last 3 months hasn’t resulted in any increase in U.S. oil production? 2017/2018 had a similar move which resulted in 10% production growth following price increase in Nov 2017, seems like there should have been some move, maybe the inventory simply isn’t there?
The straightforward explanation is that companies want a trustworthy forecast that prices will stay at a new and elevated level for a while – if it’s going to drop in just a few months it’s not worth investment that can take several months to implement and much more time to pay off.
The problem is that the current president does everything possible to make people believe that prices will fall very soon – every few days there’s a new message that peace is coming tomorrow! This is consistent with the prevailing TACO narrative, and is reflected in futures prices.
It seems very unlikely that Iran will agree to peace on terms that are truly agreeable to the US. My guess is that at some point everyone will pretend to agree – the president will declare victory and there will be an agreement to…negotiate later. The eventual terms will be much worse than the treaty the president tore up in his first term, but conservative media will go along with the victory narrative and the president will try to change the story – invading Cuba, and getting some kind of extension to the Abrahamic accords….something, anything.
And the TACO narrative will probably apply. Will the voters figure it out? Some will. Abraham Lincoln: : “you can fool some of the people all of the time, and all of the people some of the time, but you can’t fool all of the people all of the time.”
One big silver lining: solar, passenger EVs, truck EVs, batteries, heat pumps, induction cooking, etc can be installed relatively quickly and were cost competitive even before oil & gas prices rose, so their growth rates have jumped dramatically.
Kengeo,
About a 6 to 8 month lag between start of drilling and start of production for a new well, so maybe by September there might be some increase, also very little increase in number of operating rigs so far, perhaps due to better capital discipline by oil producers than in 2017.
Could also be interest rates which are creeping up. Makes investments more expensive. Always keep an eye on the bond market.
New post is up
https://peakoilbarrel.com/opec-monthly-oil-market-report-may-2026/