The EIA Short Term Energy Outlook (STEO) was published recently. A summary in chart form.
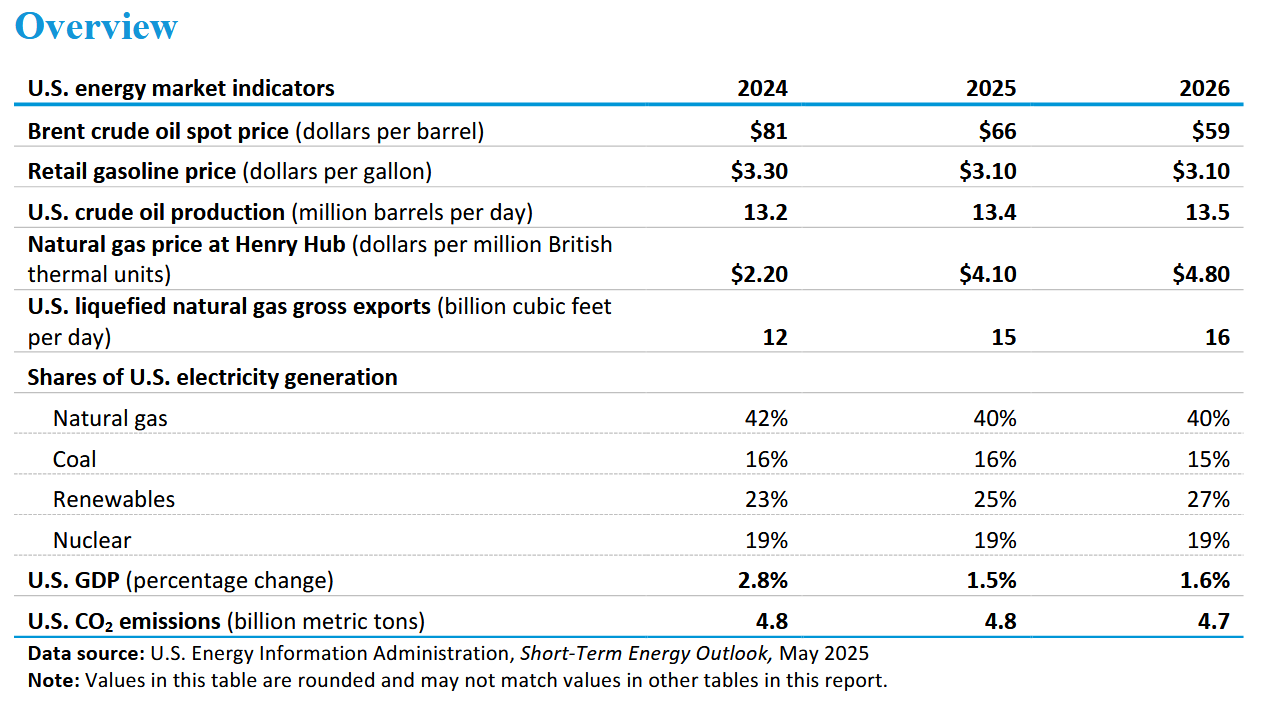
Comments not related to oil or natural gas in this thread please. Thanks.
Read MoreThe OPEC Monthly Oil Market Report (MOMR) for May 2025 was published recently. The last month reported in most of the OPEC charts that follow is April 2025 and output reported for OPEC nations is crude oil output in thousands of barrels per day (kb/d). In the OPEC charts below the blue line with markers is monthly output and the thin red line is the centered twelve month average (CTMA) output.


Comments not related to oil or natural gas production in this thread please, thanks.
Read MoreBy Ovi
The focus of this post is an overview of World oil production along with a more detailed review of the top 11 Non-OPEC oil producing countries. OPEC production is covered in a separate post.
Below are a number of Crude plus Condensate (C + C) production charts, usually shortened to “oil”, for the oil producing countries. The charts are created from data provided by the EIA’s International Energy Statistics and are updated to January 2025. This is the latest and most detailed/complete World oil production information available. Information from other sources such as OPEC, the STEO and country specific sites such as Brazil, Norway, Mexico, Argentina and China is used to provide a short term outlook.

World oil production decreased by 231 kb/d in January to 82,184 kb/d, green graph. The largest decrease came from the US, 305 kb/d. February’s World oil production is projected to increase by 400 kb/d to 82,584 kb/d.
Read More