Comments not related to oil or natural gas production in this thread please. Thank you.
Read MoreBad Weather Drops US January Oil Production
By Ovi
All of the Crude plus Condensate (C + C) production data for the US state charts comes from the EIAʼs Petroleum Supply monthly PSM which provides updated information up to January 2023.
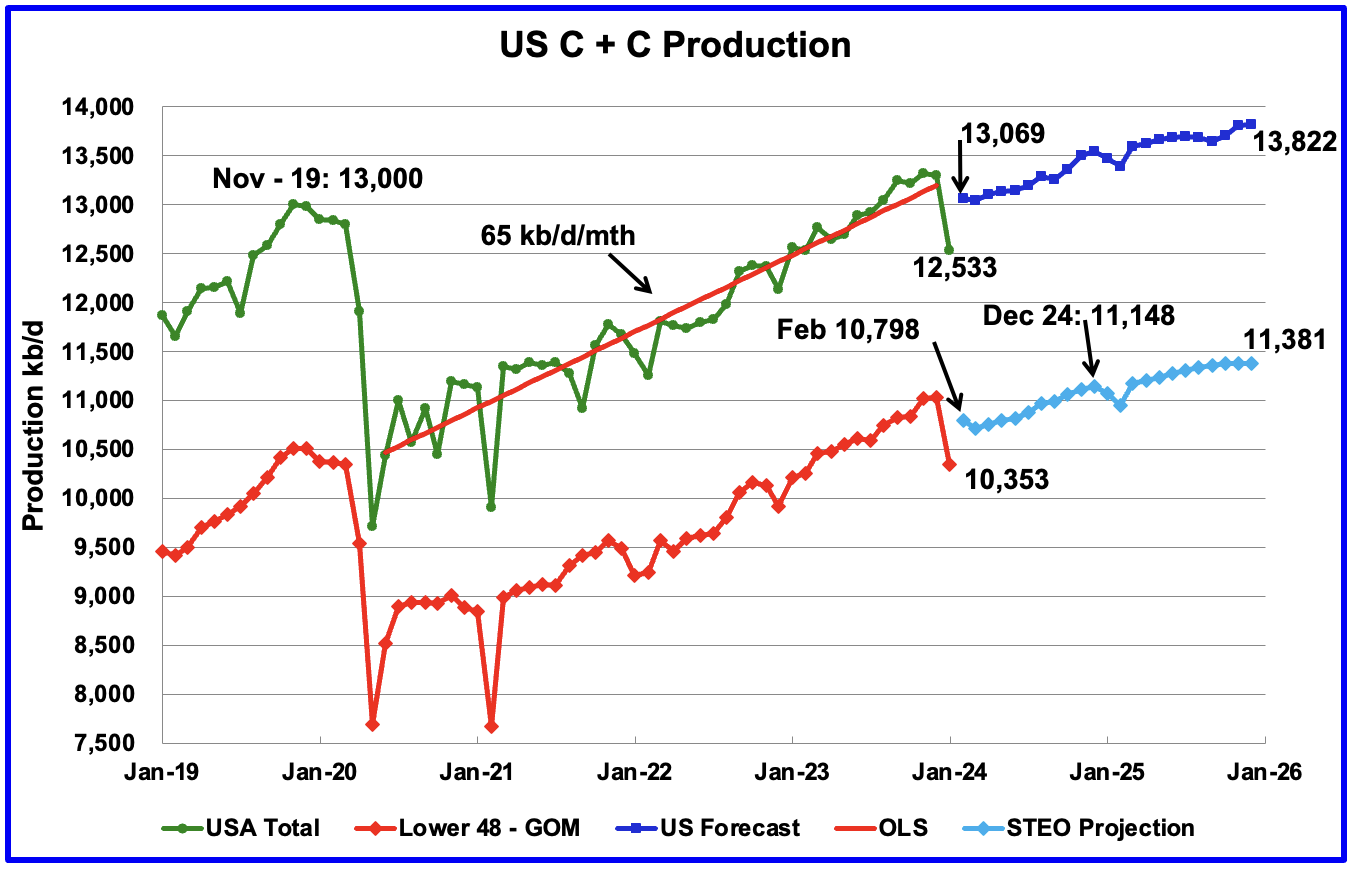
U.S. January oil production decreased by 762 kb/d to 12,533 kb/d. The large decrease was due to a severe US winter storm that was spread across most central states. The largest drop came from Texas, 288 kb/d.
Read MoreOpen Thread Non-Petroleum, April 1, 2024
Comments not related to oil or natural gas production in this thread please. Thank you.
Read MoreNovember World & Non-OPEC Oil Production
By Ovi
Below are a number of Crude plus Condensate (C + C) production charts, usually shortened to “oil”, for oil producing countries. The charts are created from data provided by the EIA’s International Energy Statistics and are updated to November 2023. This is the latest and most detailed/complete World Oil production information available. Information from other sources such as OPEC, the STEO and country specific sites such as Brazil, Norway and China is used to provide a short term outlook.
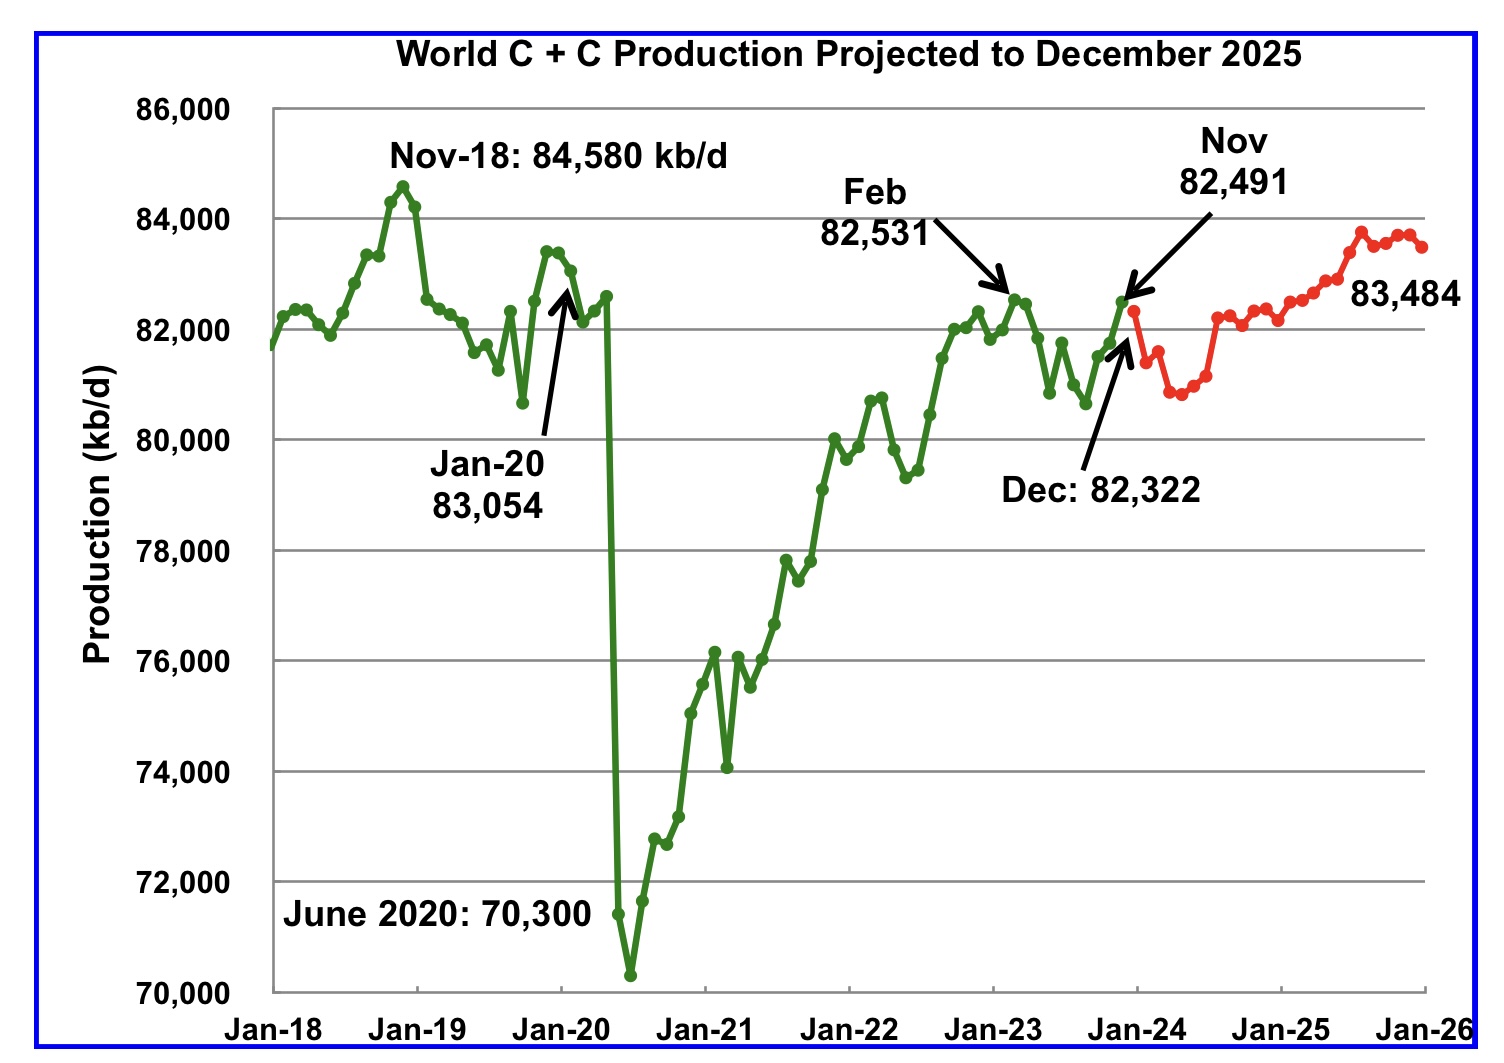
World oil production increased by 745 kb/d in November, green graph. The largest increase came from Canada, adding 360 kb/d. December World production is projected to drop by 169 kb/d to 82,232 kb/d.
Read MoreOpen Thread Non-Petroleum, March 25, 2024
Comments not related to oil or natural gas production in this thread please, thanks.
Read More