By Ovi
All of the Crude plus Condensate (C + C) production data for the US state charts comes from the EIAʼs Petroleum Supply monthly PSM which provides updated information up to January 2023.
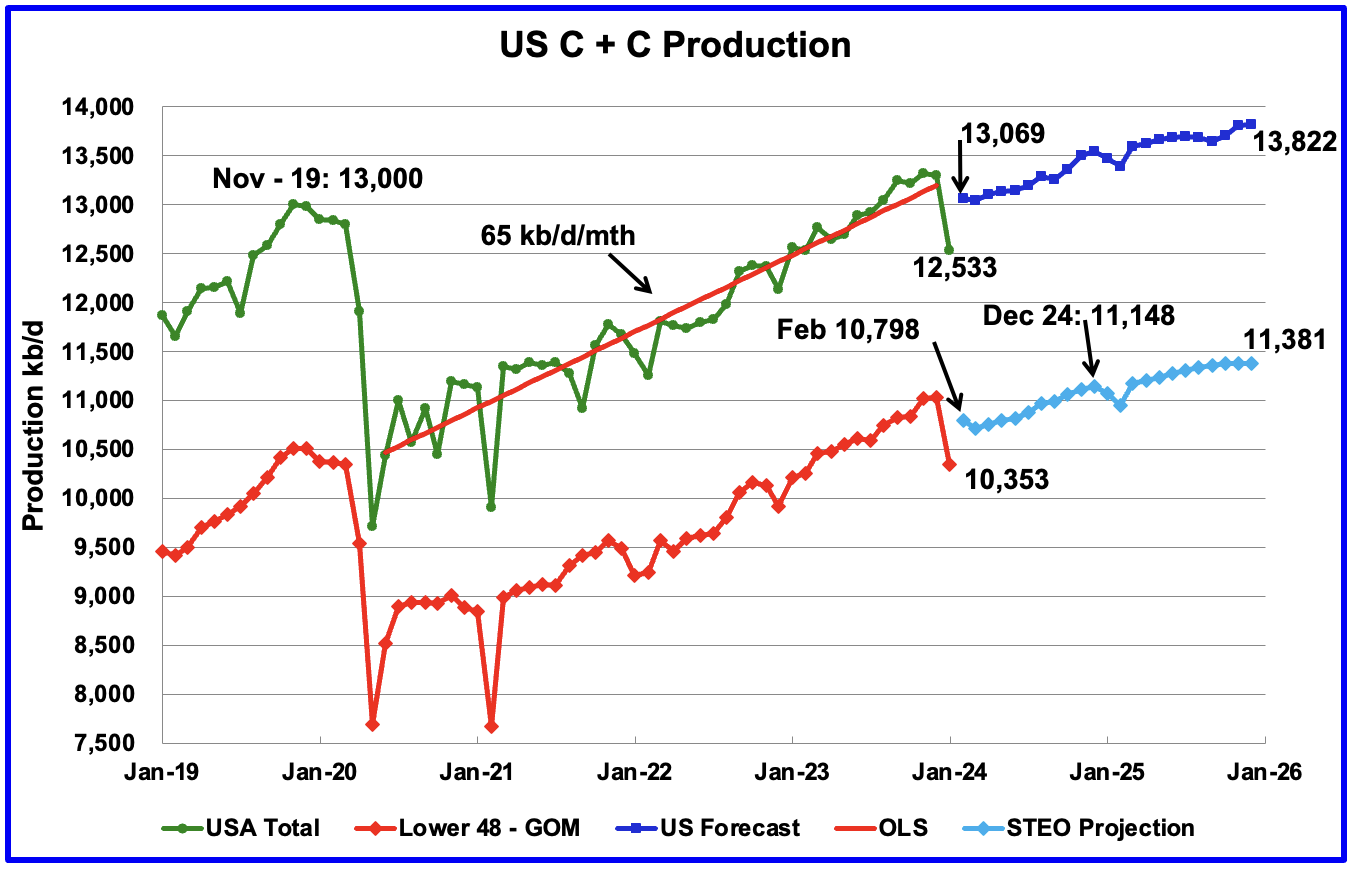
U.S. January oil production decreased by 762 kb/d to 12,533 kb/d. The large decrease was due to a severe US winter storm that was spread across most central states. The largest drop came from Texas, 288 kb/d.
The dark blue graph, taken from the March 2023 STEO, is the forecast for U.S. oil production from February 2024 to December 2025. Output for December 2025 is expected to reach 13,822 kb/d and is an increase of 124 kb/d from the previous STEO report.
The red OLS line from June 2020 to December 2023 indicates a monthly production growth rate of 65 kb/d/mth or 780 kb/d/yr. Using a two point average, the growth rate from February 2024 to December 2024 is 32.7 kb/d/mth, 1/2 of the growth rate for the previous period. Regardless this is still a very high growth rate and is not consistent with many articles predicting a near term peak in US oil production.
The light blue graph is the STEO’s projection for output to December 2025 for the Onshore L48. From February 2023 to December 2025, production is expected to increase by 583 kb/d to 11,381 kb/d which is 102 kb/d higher than reported in the previous STEO.
Is the slow rollover in production shown in the last four months in 2025 in the Onshore L48 pointing to peak US production occurring in late 2025?
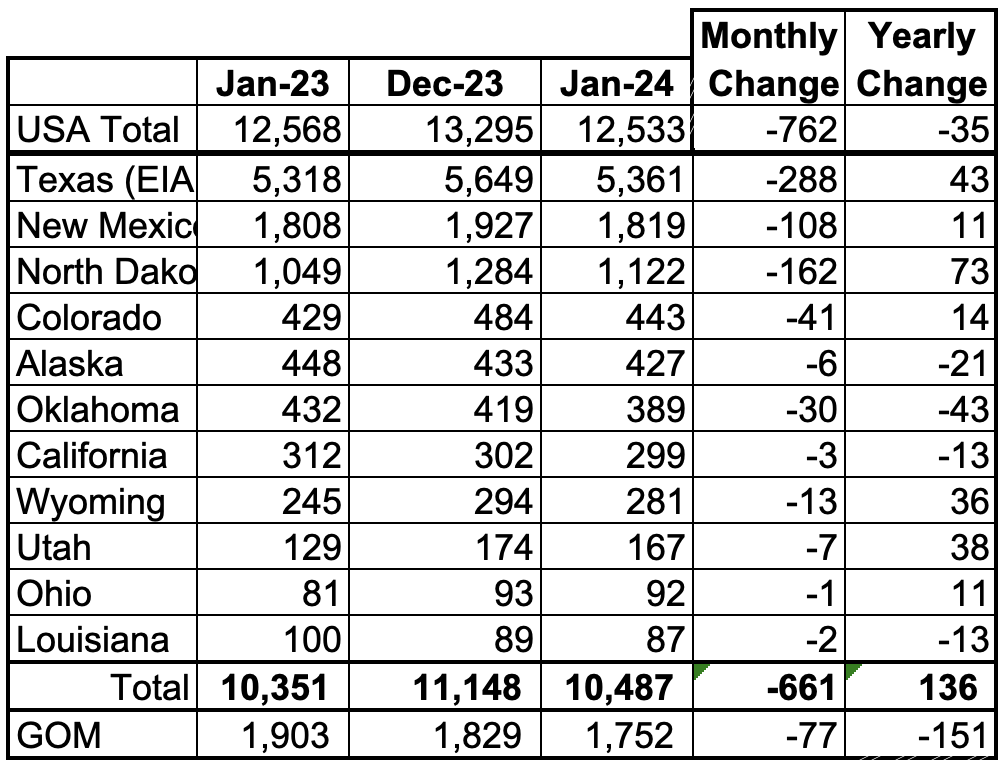
Listed above are the 11 US states with the largest oil production along with the Gulf of Mexico. Ohio has been added to this table since it exceeded Louisiana’s production. These 11 states accounted for 83.7% of all U.S. oil production out of a total production of 12,533 kb/d in January 2024.
On a YoY basis, US production decreased by 35 kb/d. GOM production dropped by 77 kb/d MoM while YOY it is down by 151 kb/d.
Note that on a MoM basis, production in all of the above states dropped.
State Oil Production Charts
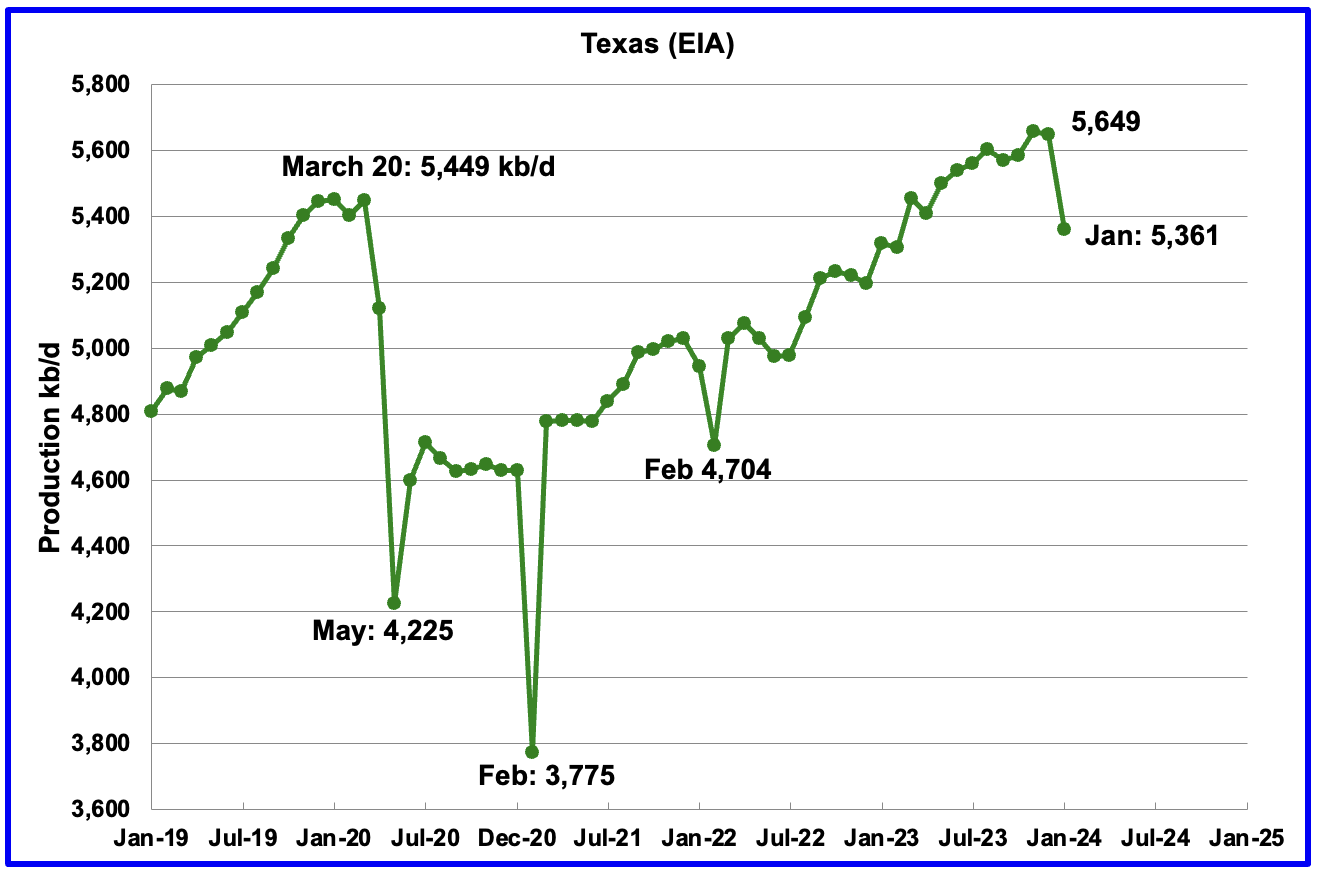
Texas production decreased by 288 kb/d in January to 5,361 kb/d.
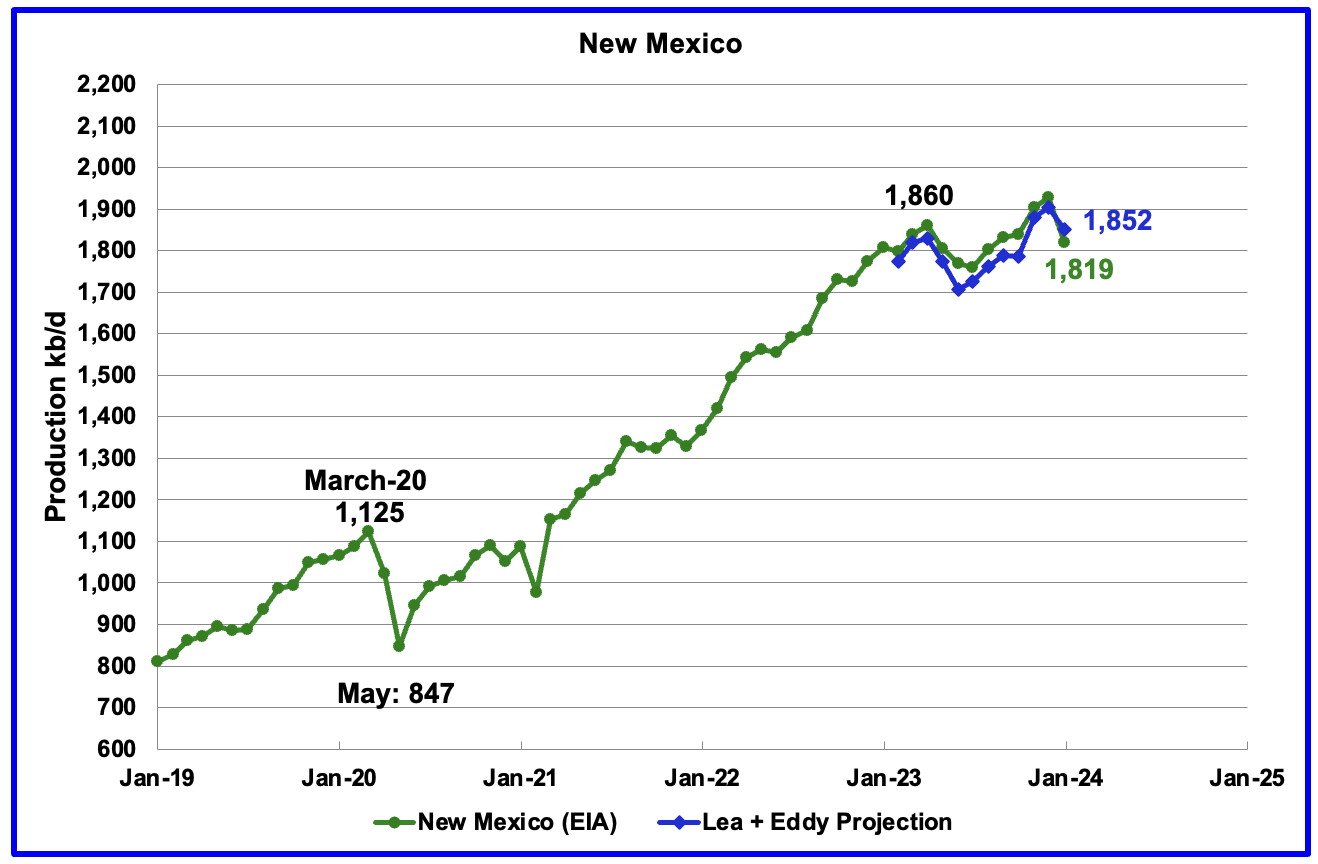
New Mexico’s January production dropped by 108 kb/d to 1,819 kb/d.
The blue graph is a production projection for Lea plus Eddy counties. The projection used the difference between January and December production data provided by the New Mexico Oil Conservation Division.
The combined output from Lea and Eddy counties in January decreased by 55 kb/d to 1,852 kb/d. It is interesting to note the Lea + Eddy production trend is similar to the EIA’s.
More oil production information from these two counties is reviewed in the special Permian section further down.
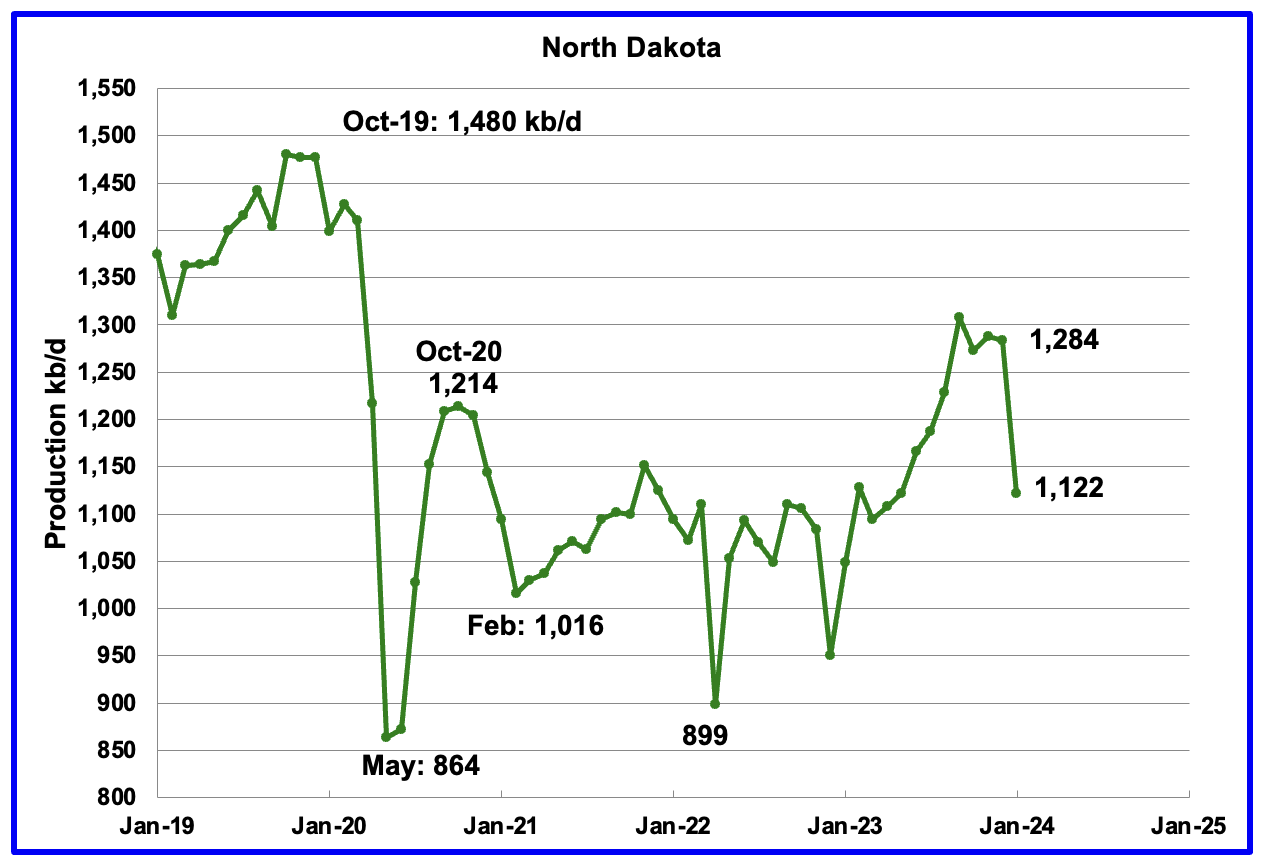
December’s output decreased by 162 kb/d to 1,122 kb/d. YoY production increased by 73 kb/d.
According to this article: “Severe cold in northwest North Dakota caused large drops in oil and gas production in January, the state’s top oil regulator said Thursday.
“Winter really can bite here,” State Mineral Resources Director Lynn Helms said, but he added that production is already picking back up to speed.
The state produced an average of 1.1 million barrels of oil per day in January, down 13.5% from 1.27 million barrels in December. Natural gas production fell by 15% to around 3 billion cubic feet per day, making for an output of 93 billion cubic feet over the course of the month.
The state’s drilling rig count as of Thursday was 38, which is flat compared to recent months. Helms said the rig count is expected to climb by one or two in the coming year.”
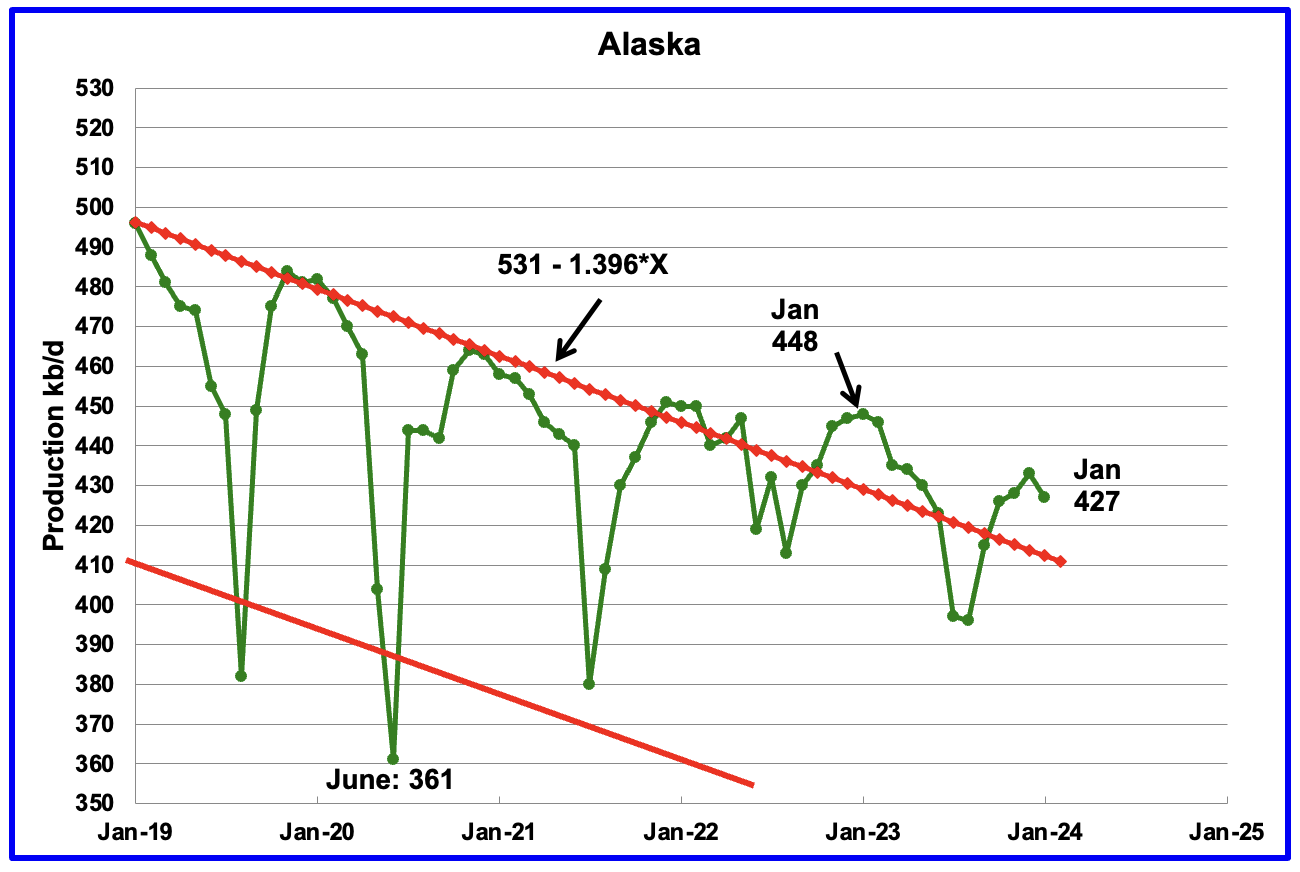
Alaskaʼs January output decreased by 6 kb/d to 427 kb/d. Production YoY is down by 21 kb/d. The EIA’s weekly petroleum report continues to show Alaska’s March production is in the 430 ±5 kb/d range.
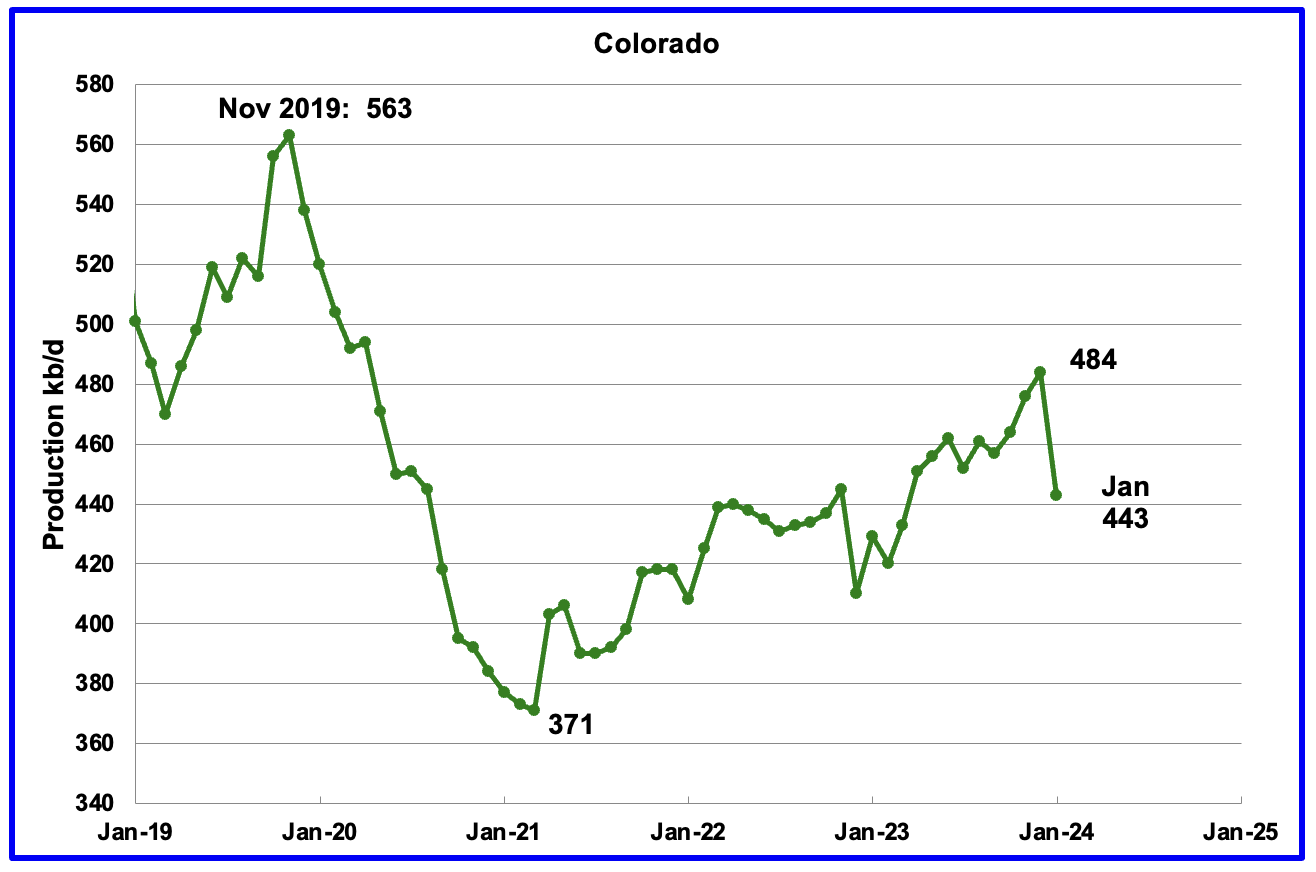
Coloradoʼs January production decreased by 41 kb/d to 443 kb/d. Colorado has moved ahead of Alaska to become the 4th largest US oil producing state.
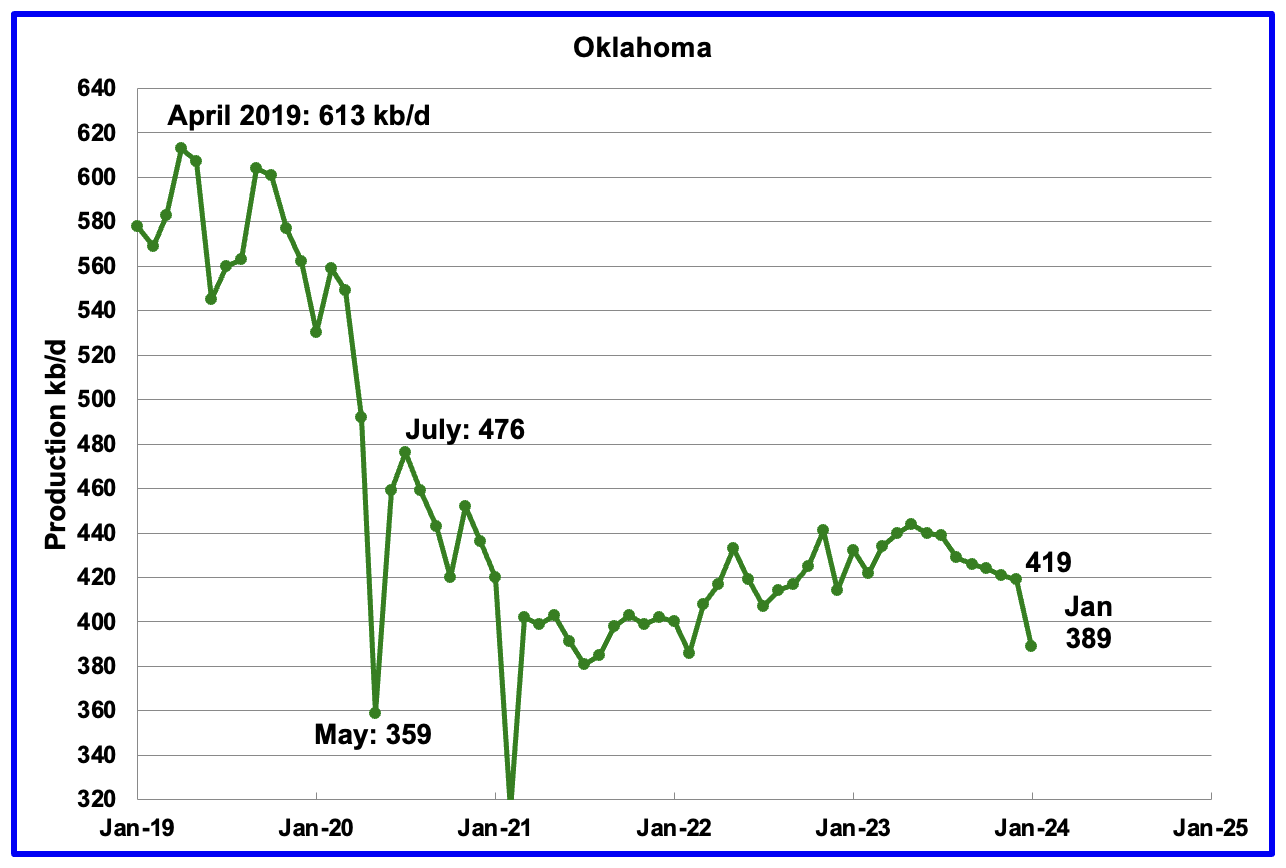
Oklahoma’s output in January decreased by 30 kb/d to 389 kb/d. Production remains below the post pandemic July 2020 high of 476 kb/d. Output may have entered a slow declining phase.
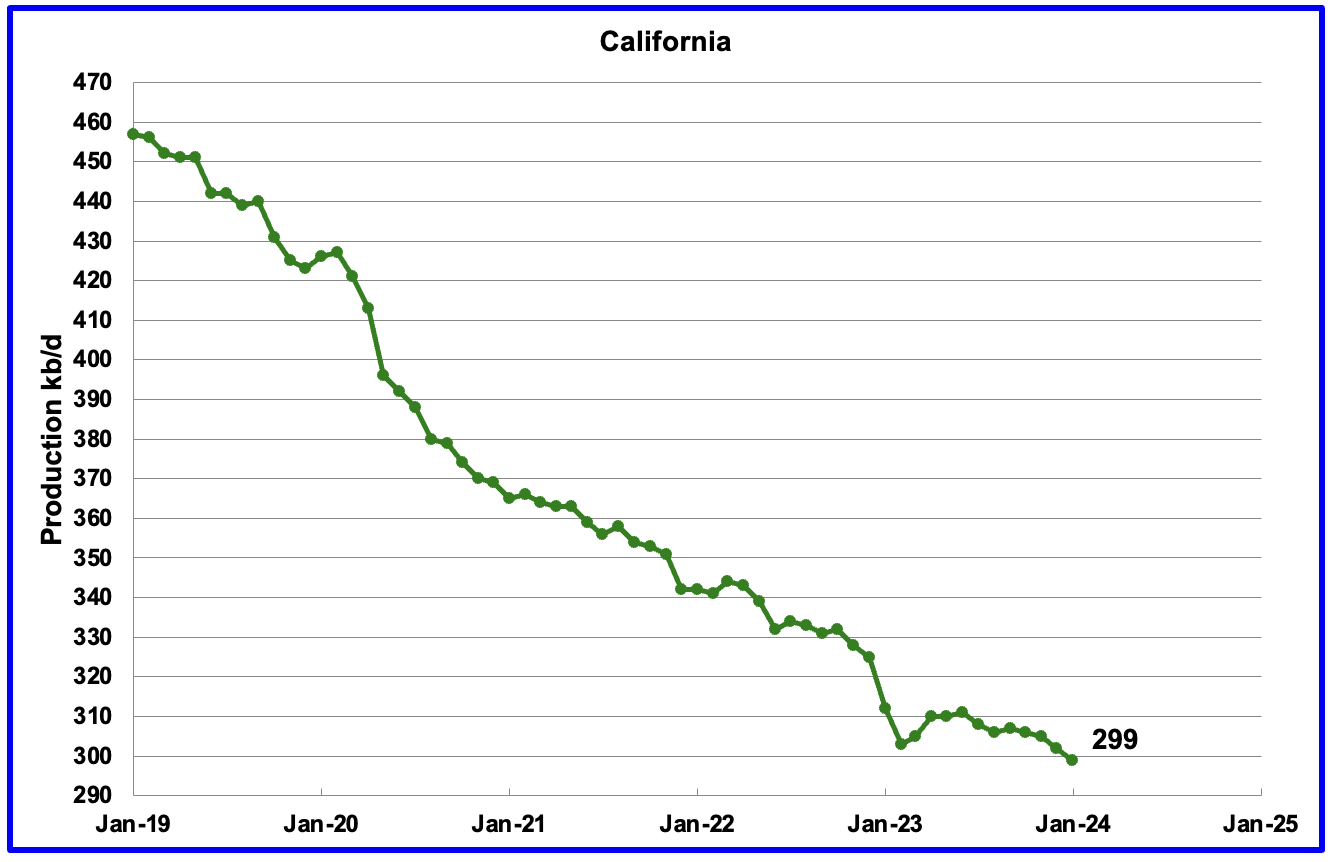
Californiaʼs January production continued its slow decline by dropping 3 kb/d to 299 kb/d.
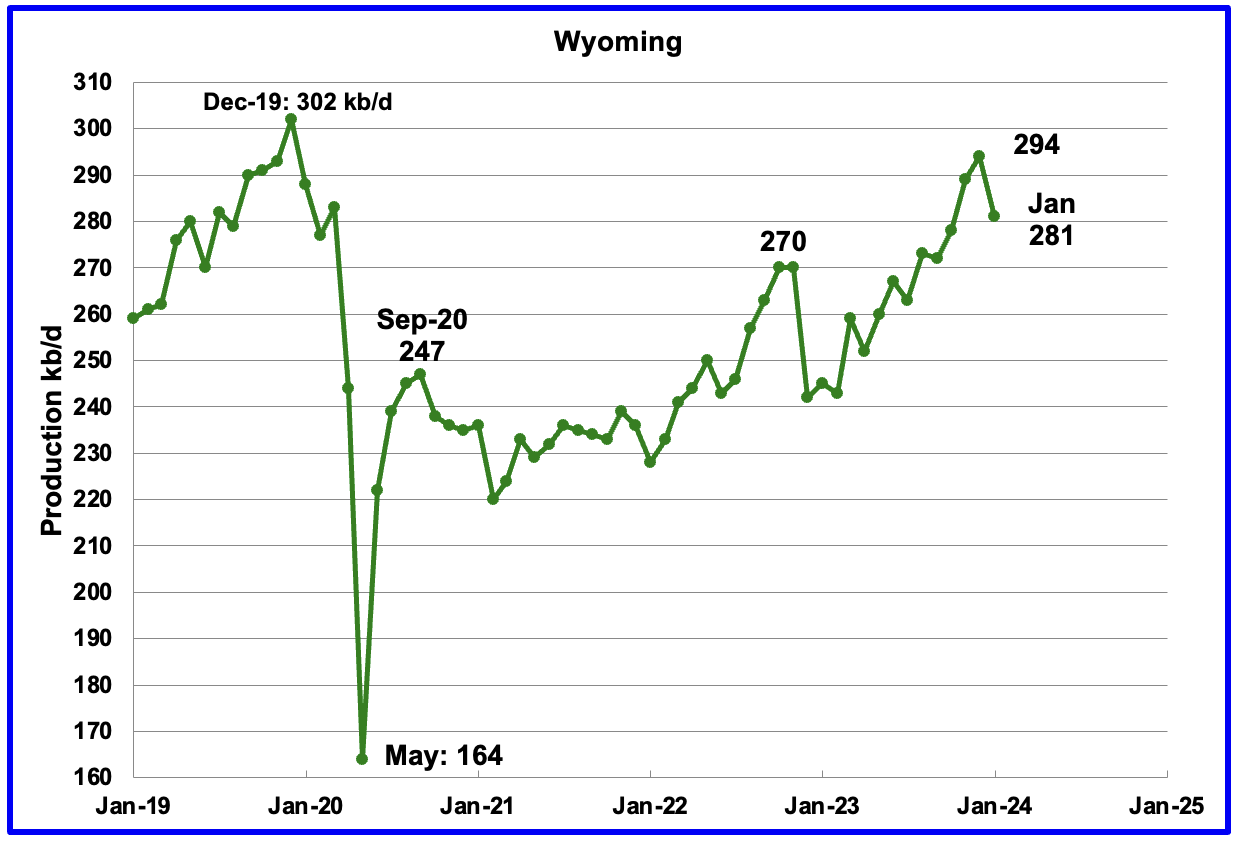
Wyoming’s oil production has been rebounding since March 2023. However the rebound was impacted by the January storm. January’s oil production dropped 13 kb/d to 281 kb/d, after hitting a post pandemic record high in December.
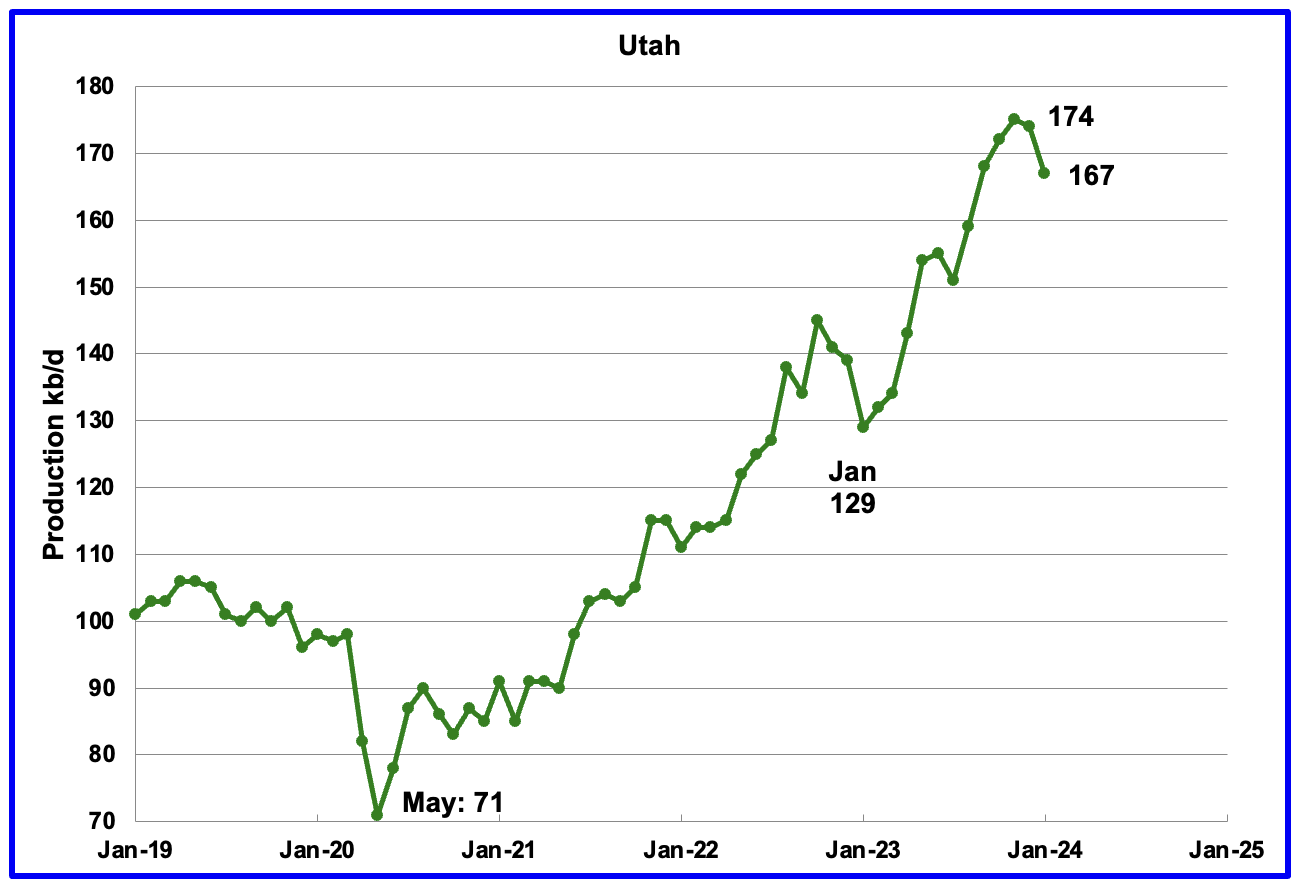
January’s production decreased by 7 kb/d to 167 kb/d. For the first 3 months of 2024, Utah had 9 rigs operating, up from 7 in early 2023 which may account for the increased production. YoY production has increased by 38 kb/d.
The increased production since February 2023 has come from the Uinta basin.
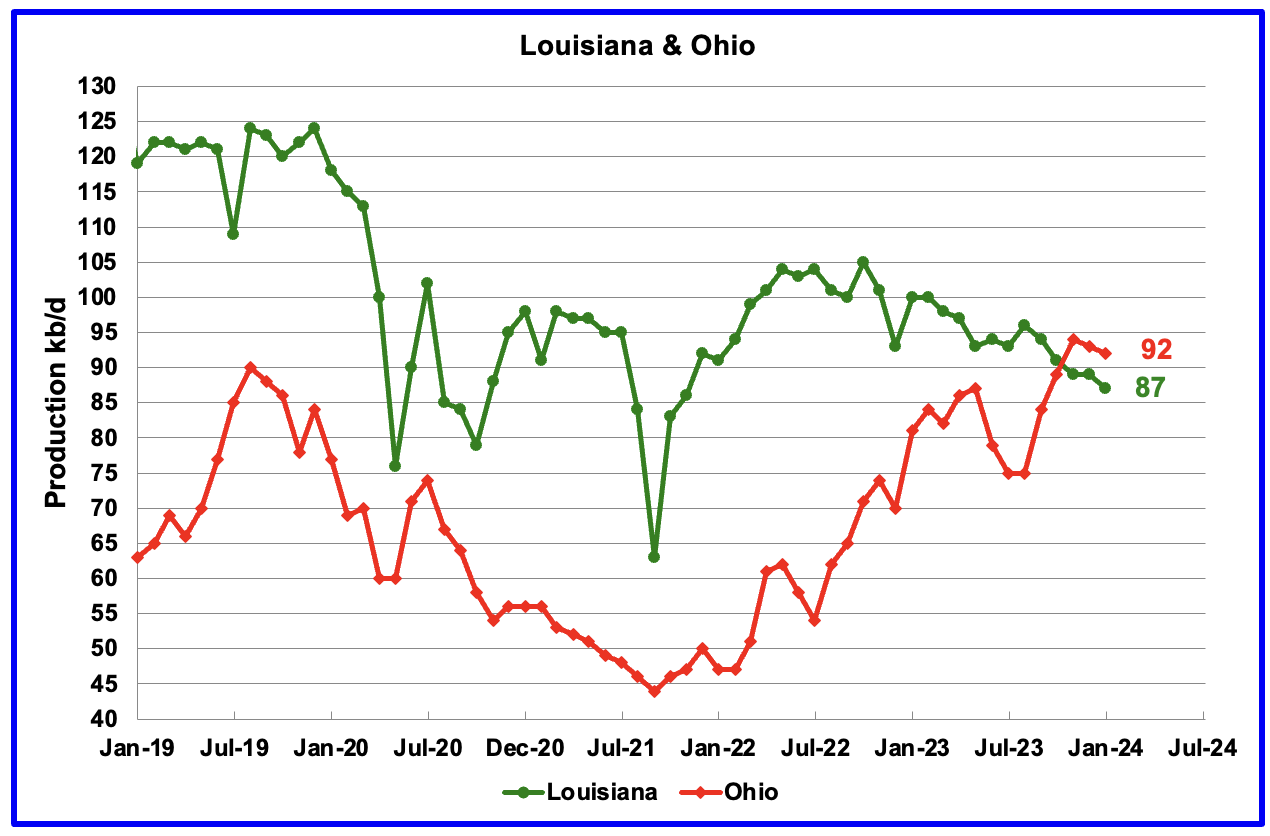
Ohio has been added to the Louisiana chart because Ohio’s production has been slowly increasing since October 2021 and passed Louisiana in November 2023.
Louisiana’s output entered a slow decline phase in October 2022. January’s production decreased by 2 kb/d to 87 kb/d. Ohio’s oil production dropped by 1 kb/d to 92 kb/d after reaching a post pandemic high of 94 kb/d in November. Interestingly, the weekly rig count report does not show any rigs operating in Ohio.
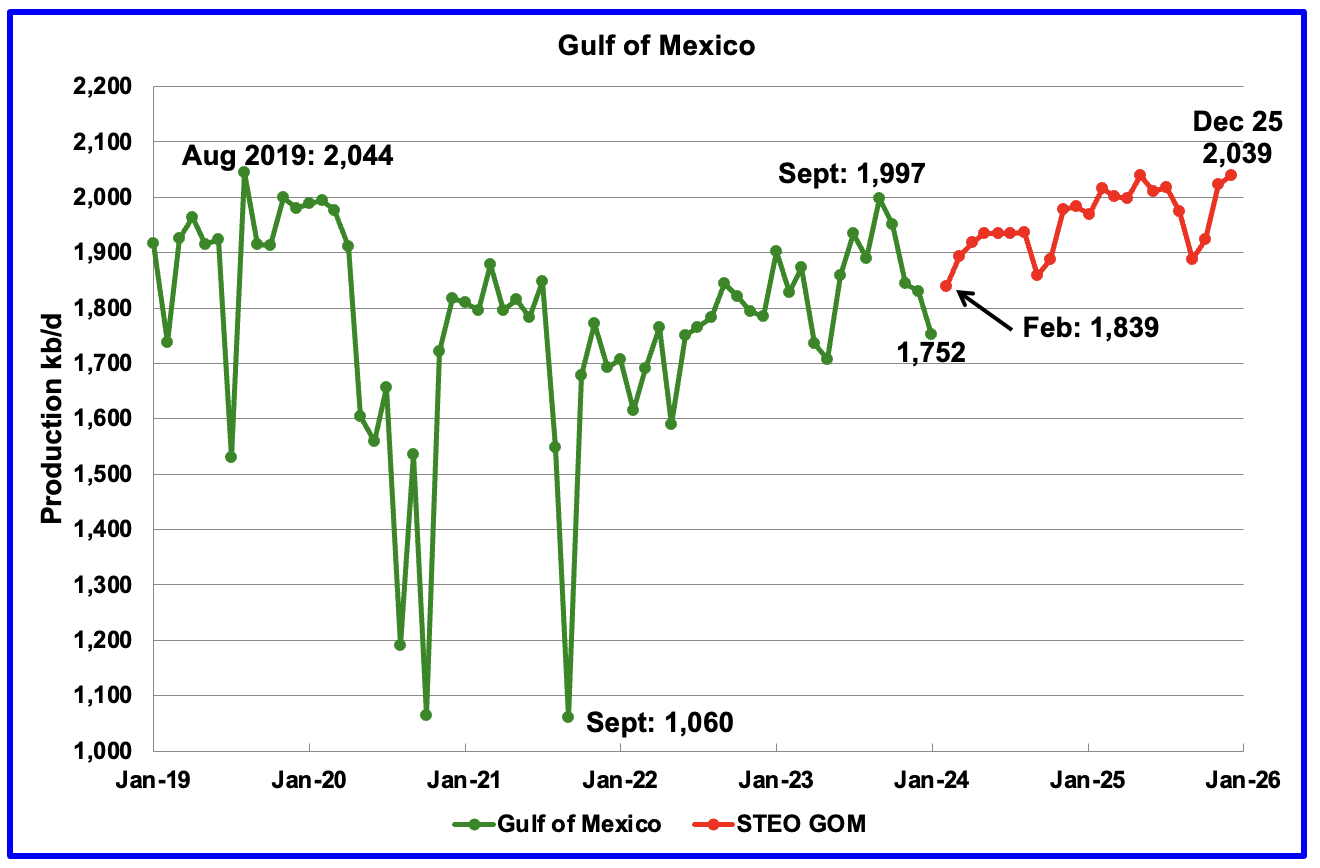
GOM production decreased by 77 kb/d in January to 1,752 kb/d but is expected to rebound in February by 78 kb/d to 1,839 kb/d.
The March 2024 STEO projection for the GOM output has been added to this chart. It projects production from February 2024 to December 2025 will increase by 200 kb/d to 2,039 kb/d, 19 kb/d higher than reported in the previous STEO.
A Different Perspective on US Oil Production
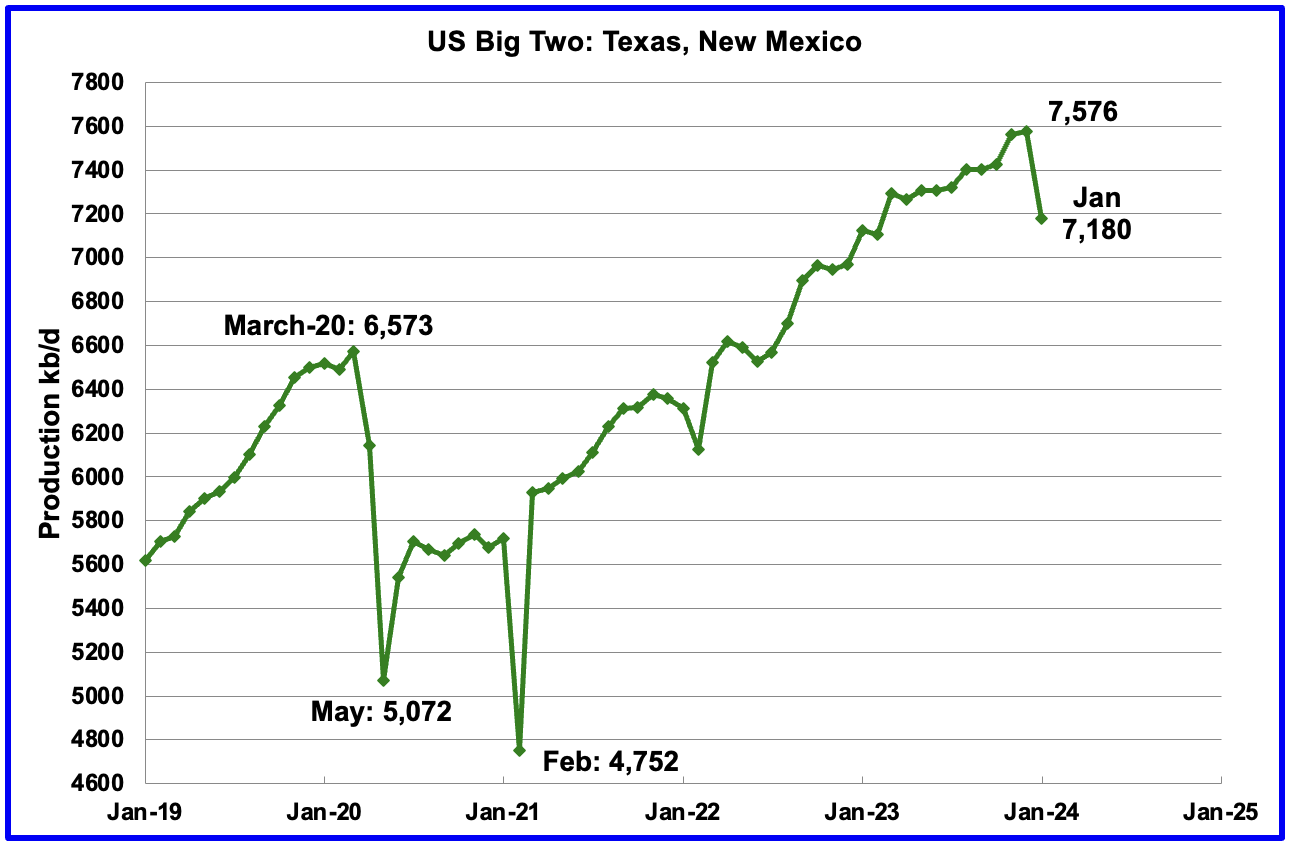
The Big Two states’ combined oil output for Texas and New Mexico.
January’s production in the Big Two states decreased by a combined 396 kb/d to 7,180 kb/d with Texas dropping 288 kb/d while New Mexico dropped 108 kb/d.
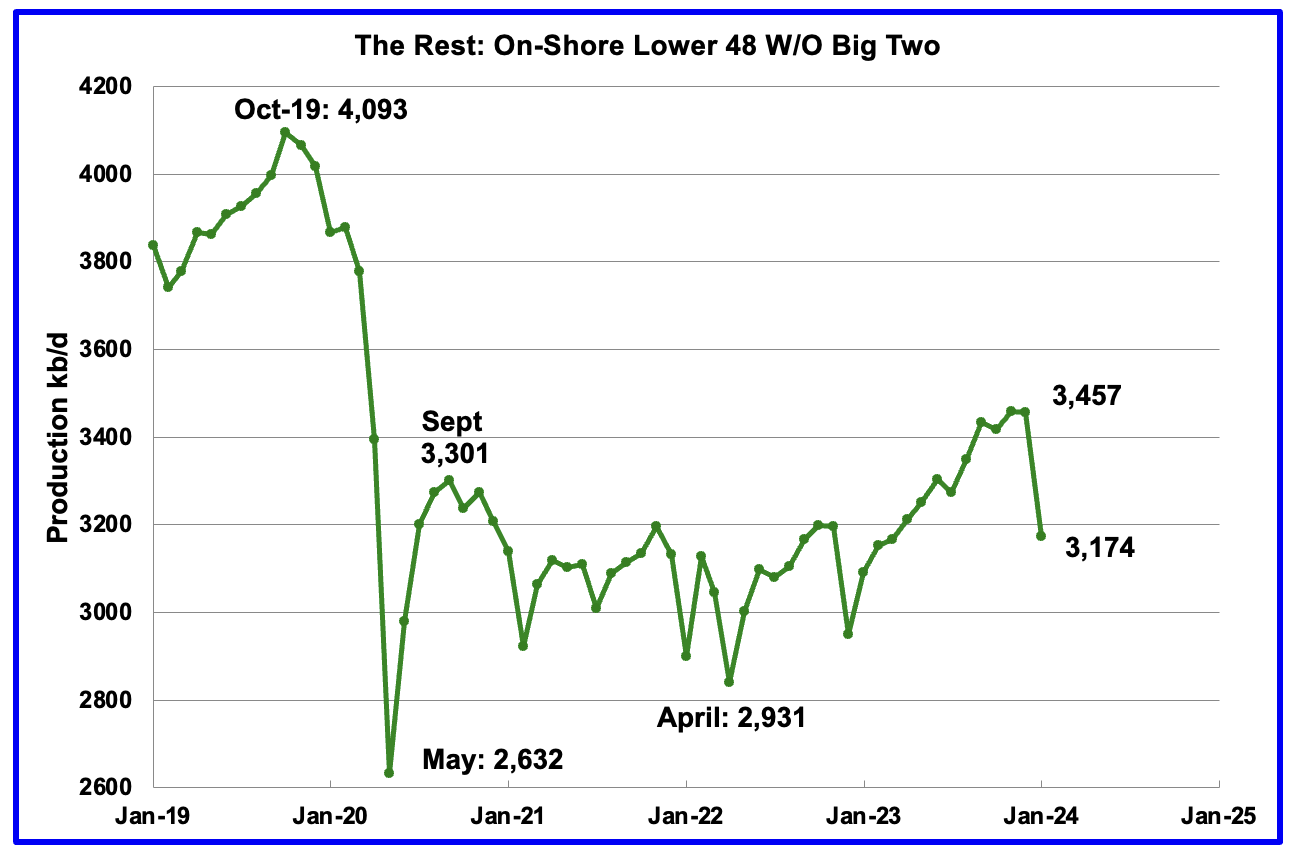
Oil production by The Rest
January’s production in The Rest decreased by 283 kb/d to 3,174 kb/d.
The main takeaway from The Rest chart is that current production is below the high of October 2019 and is a significant loss that occurred during Covid shut down and is slowly being recovered.
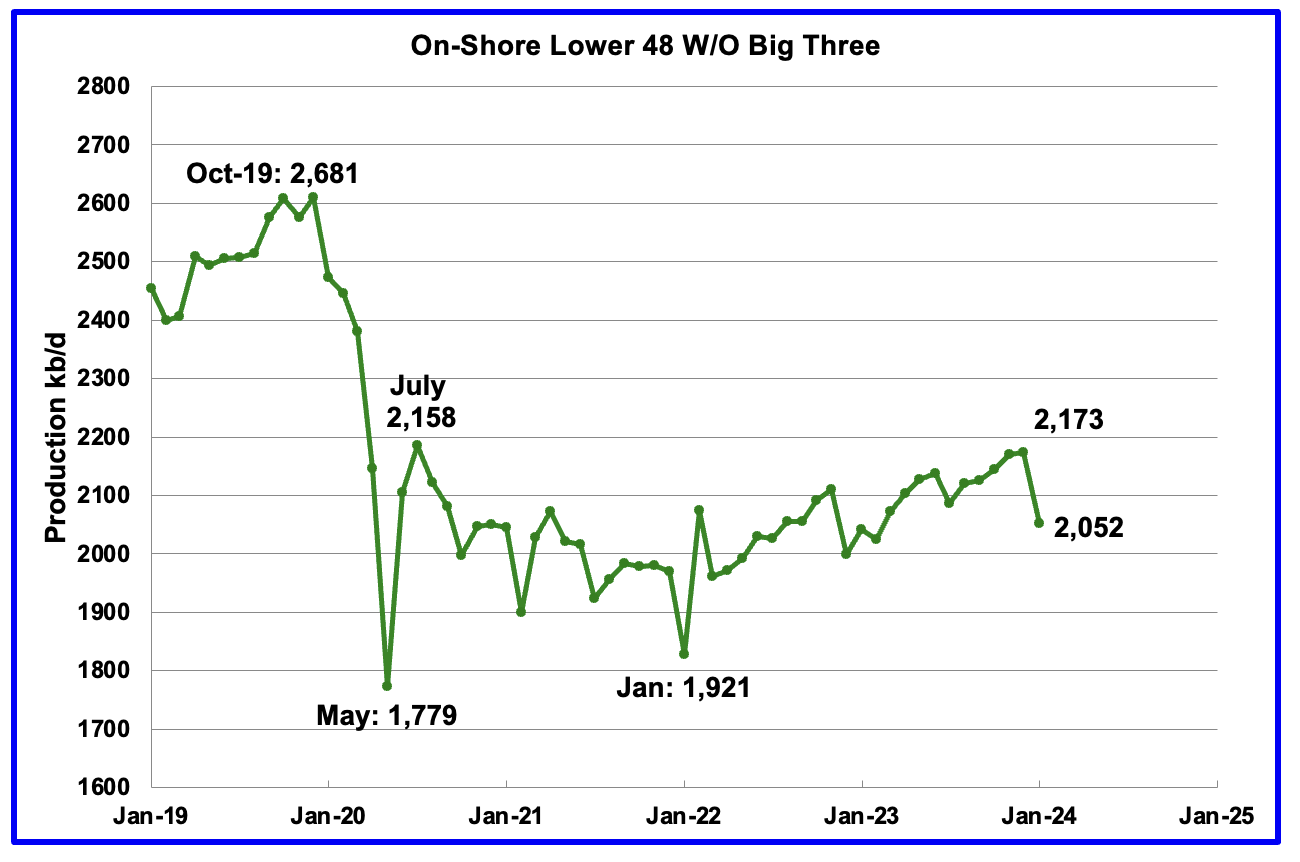
The On-Shore lower 48 W/O the big three, Texas, New Mexico and North Dakota, shows a slow rising production trend from the low of January 2022. January’s production decreased by 121 kb/d to 2,052 kb/d.
Permian Basin Report by Main Counties and Districts
This special monthly Permian section was recently added to the US report because of a range of views on whether Permian production will continue to grow or will peak over the next year or two. The issue was brought into focus recently by the Goehring and Rozencwajg Report which indicated that a few of the biggest Permian oil producing counties were close to peaking or past peak. Also comments by posters on this site have similar beliefs from hands on experience.
This section will focus on the four largest oil producing counties in the Permian, Lea, Eddy, Midland and Martin. It will track the oil and natural gas production and the associated Gas Oil Ratio (GOR) on a monthly basis. The data is taken from the state’s government agencies for Texas and New Mexico. Typically the data for the latest two or three months is not complete and is revised upward as companies submit their updated information. Note the natural gas production shown in the charts that is used to calculate the GOR is the gas coming from both the gas and oil wells.
Of particular interest will be the charts which plot oil production vs GOR for a county to see if a particular characteristic develops that indicates the field is close to entering the bubble point phase. While the GOR metric is best suited for characterizing individual wells, counties with closely spaced horizontal wells may display a behaviour similar to individual wells due to pressure cross talking . For further information on the bubble point and GOR, there are a few good thoughts on the intricacies of the GOR in an earlier POB comment. Also check this EIA topic on GOR.
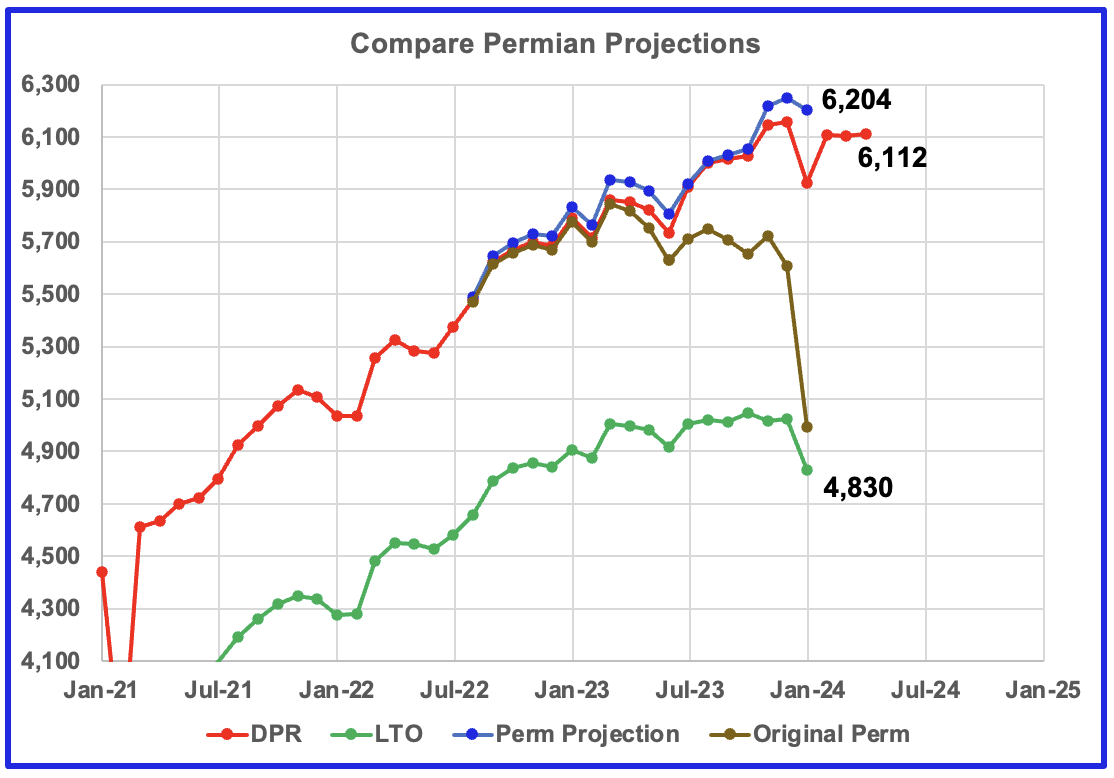
This chart shows four oil production graphs for the Permian basin updated to January and to April for the DPR. The gap between the DPR and LTO projections is there because the DPR projection includes both LTO oil along with oil from conventional wells in the basins that it covers.
The red and green graphs show oil production as published by the EIA’s DPR and the LTO offices. Comparing the two, it appears that both the LTO and DPR offices believe Permian LTO production is currently in a plateau/declining phase. The blue graph is a projection for Permian oil production. The brown chart is the sum of Permian production data as taken from the Texas RRC and the New Mexico Oil Conservation Division. The big January drop is due to severe weather in the central US.
The blue Permian projection graph only uses two months of production data, December and January, from the New Mexico OCD and the Texas RRC to make its January projection. The blue graph follows the DPR closely up to December 2023 but does not show the same large January drop.
New Mexico Permian
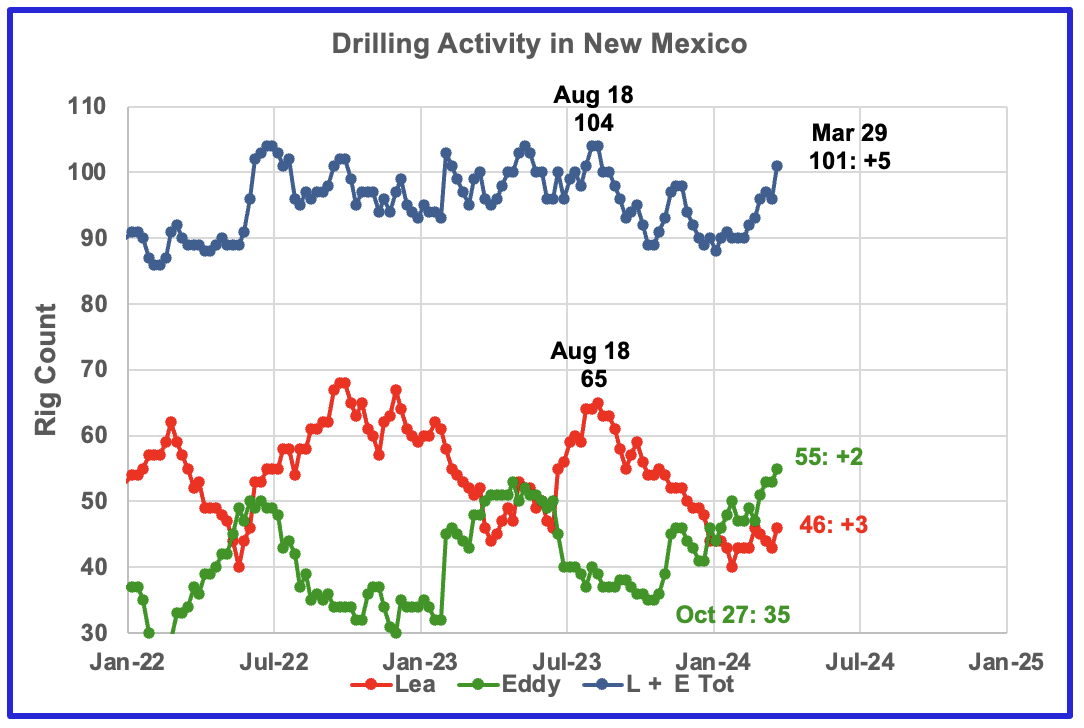
Since the middle of August, the Lea county rig count has dropped from 65 rigs to 46 rigs in March 2024. At the same time production has held steady at close to 1,100 kb/d over the period January 2023 to January 2024. See next chart.
From a low of 35 rigs in late October, 20 rigs have been moved into Eddy county. Something is happening in Eddy county which will take at least six months to show up.
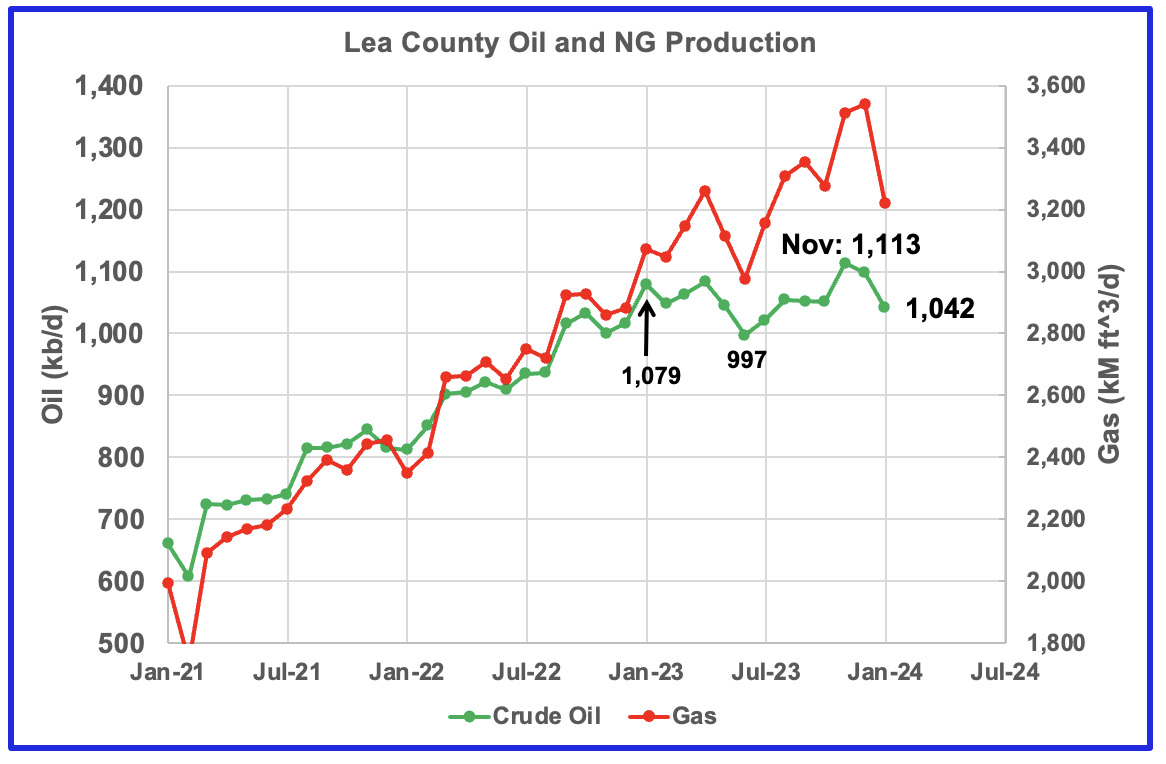
Preliminary January data indicates Lea County oil production decreased by 56 kb/d to 1,042 kb/d. The recent rig count drop of close to 20 rigs since August 18, 2023 could be beginning to show up in a production drop.
Assuming the average spud to production time is 6 to 12 months, the November production increase of 62 kb/d to 1,113 kb/d must be associated with a number of June 2023 drilled wells coming online in November 2023. The December/January drop may be foretelling that Lea county is close to peak production and may be reflecting the dropping rig count that started in August 2023. Note there has been very little production increase since January 2023, 1,079 kb/d to 1,113 kb/d in November.
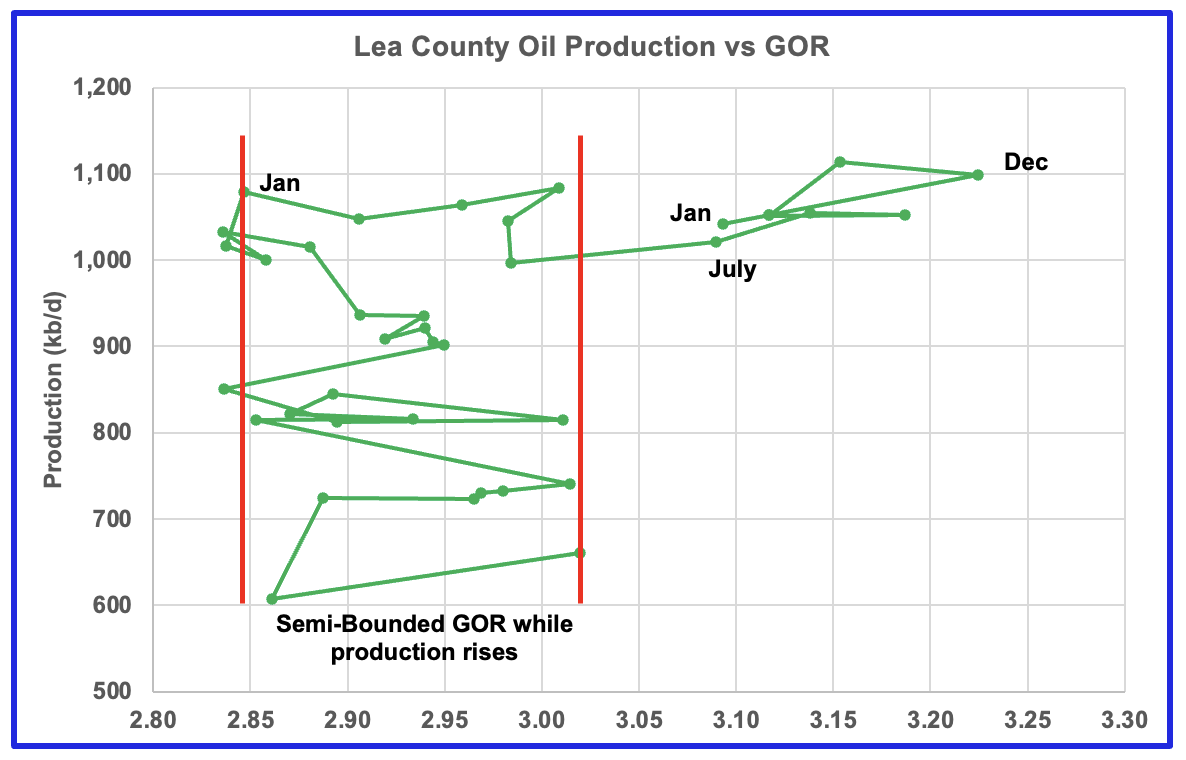
After much zigging and zagging, oil production in Lea county stabilized above 1,000 kb/d. Once production reached its new high in January 2023, production essentially plateaued but the GOR started to increase and entered the bubble point phase in July 2023.
From January 2023 to December 2023, the GOR increased rapidly from 2.85 to 3.22. In comparison, note that from January 2021 to June 2023, the GOR remained within the semi bounded range of 2.85 to 3.02.
November oil production in Lea county hit a new high of 1,113 kb/d. However, December and January production dropped to 1,042 kb/d and the GOR reversed direction. Not clear why the GOR dropped in January. Could be related to cold weather issues and which wells were affected.
The November production increase must be related to the significant increase in drilling that started in mid June 2023. The December and January drop may be hinting at further production declines in the coming months as the drop in drilling activity after August 2023 starts to kick in.
This zigging and zagging GOR pattern within a semi-bounded GOR while oil production increases to some stable level and then moves out to a higher GOR to the right has shown up in a number of counties. See an additional two cases below. This is the seventh month in which Lea county has registered a GOR outside the semi-bounded GOR range.
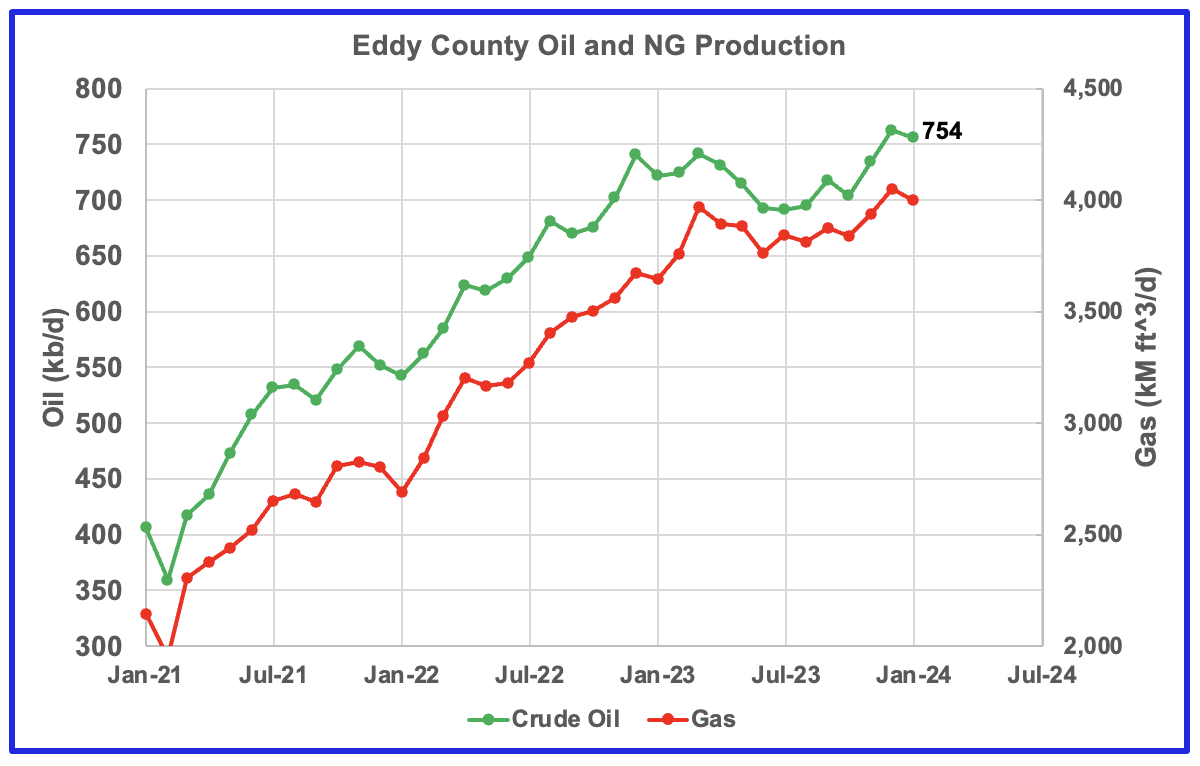
Eddy county oil production had been showing signs that it was in a plateau phase up to October 2023. However, December production hit a new high 763 kb/d while January dropped 9 kb/d to 754 kb/d. The rising production must be associated with the large increase in the rig count starting in February 2023.
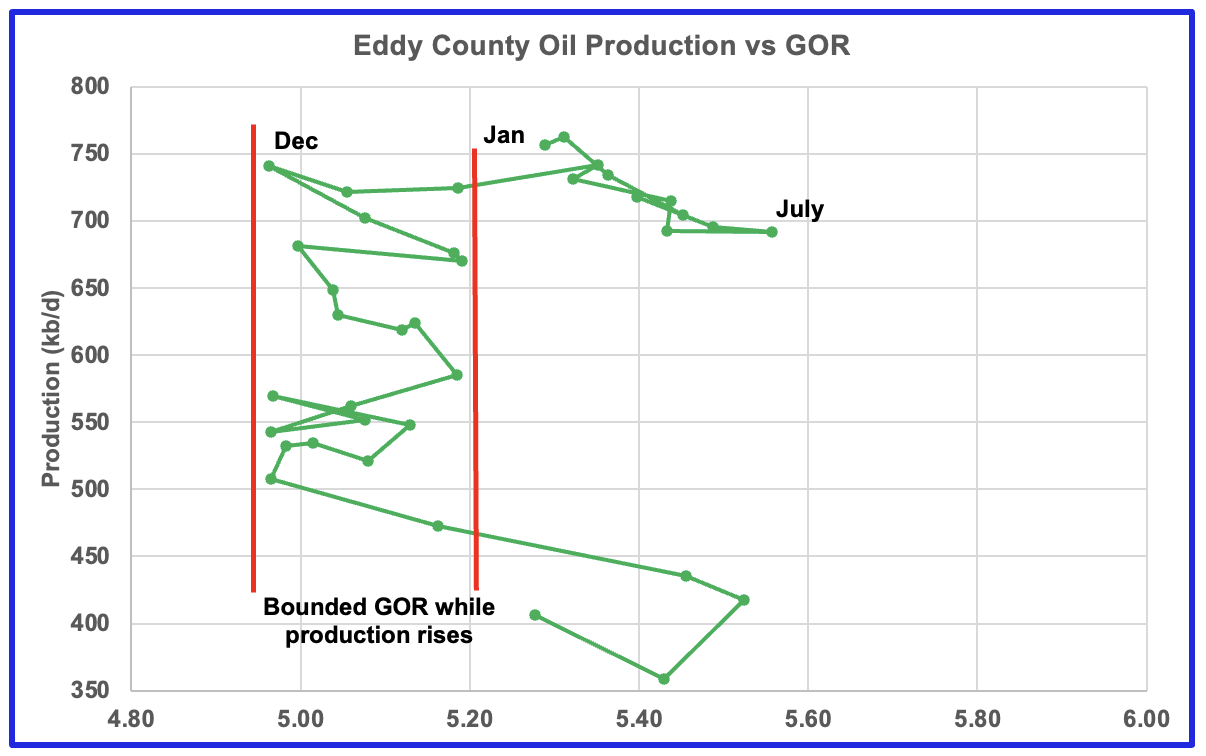
The Eddy county GOR pattern is similar to Lea county except that Eddy broke out from the semi bounded range earlier and for a longer period while oil production has been bouncing around the 700 kb/d to 750 kb/d level. However August saw a reversal in the GOR trend by decreasing which then was followed by a November oil production increase which reached a new high in December, an atypical pattern. Could this indicate that drilling in Eddy county has punched into a new bench or are some old wells being refracted?
Texas Permian
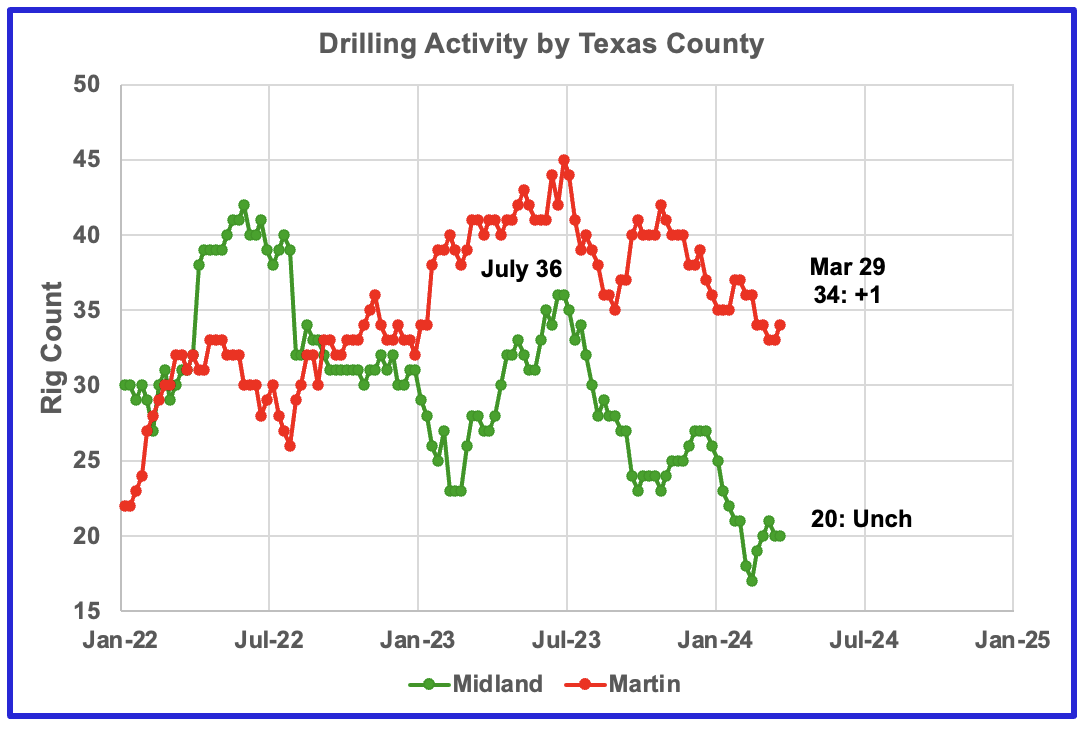
The rig count in Midland county started to reverse its downtrend and began to increase in late February 2024. Martin county rigs remain close to the lows of 2024, 33, and are down 11 from the peak in July 2023.
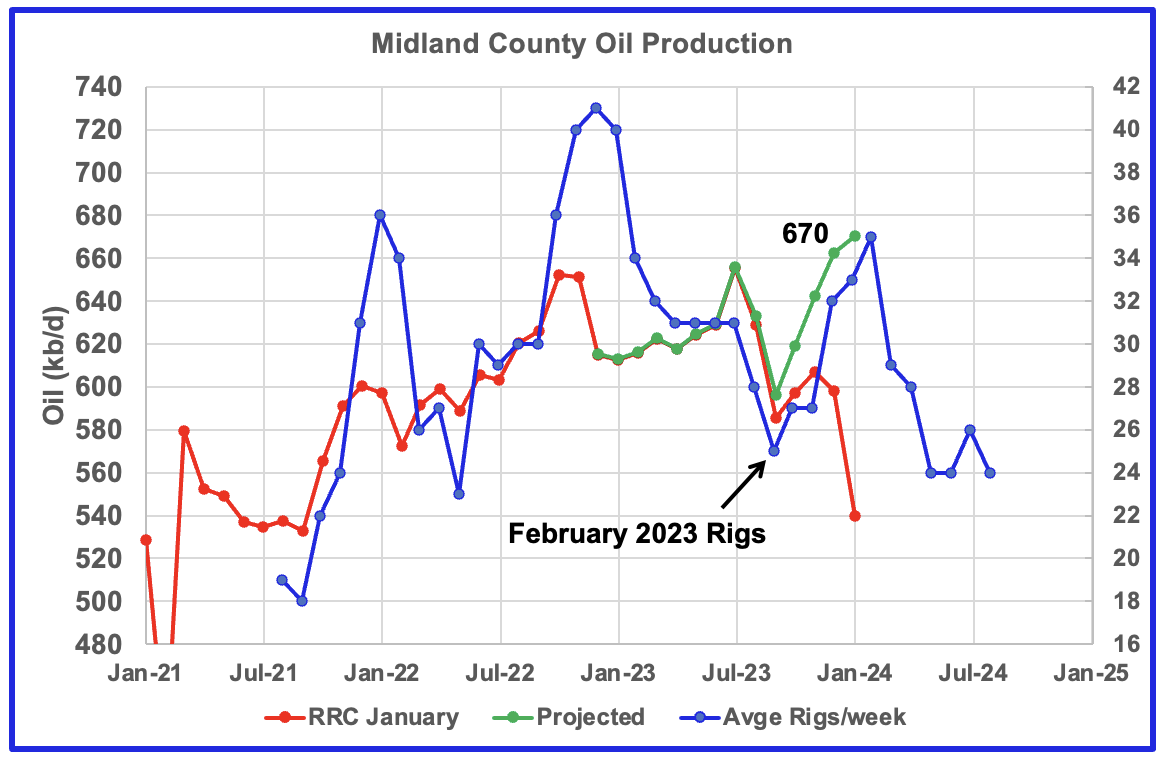
Midland County oil production began to rise again in October 2023, based on a projection, and reached a new high in December 2024 of 662 kb/d, green graph. January production was 670 kb/d. The red graph shows the January 2024 production data reported by the Texas RRC. The rising production starting in October 2023 may be related to the rising drilling activity which started in March 2023. If correct, this implies a peak in Midland production around February/March 2024.
The blue graph shows the average (approximate) number of weekly rigs operating during a given month as taken from the previous weekly drilling chart. The rig graph has been shifted forward by seven months. So the 25 Rigs/Wk operating in February 2023 have been moved forward to September 2023 to show the correlation and time delay between rig count and oil production. If the seven month shift in the rig count is approximately correct in that oil production can be tied to the rig count, oil production in Midland county should peak in February or March.
While completions should be used to correlate with oil production, that information is not readily available. According to the DPR, the average number of completions from January 2023 to February 2024 was 462 while drilled wells was 456, a 1% difference. Consequently rig count is a reasonable proxy for completions in this case over this time period.
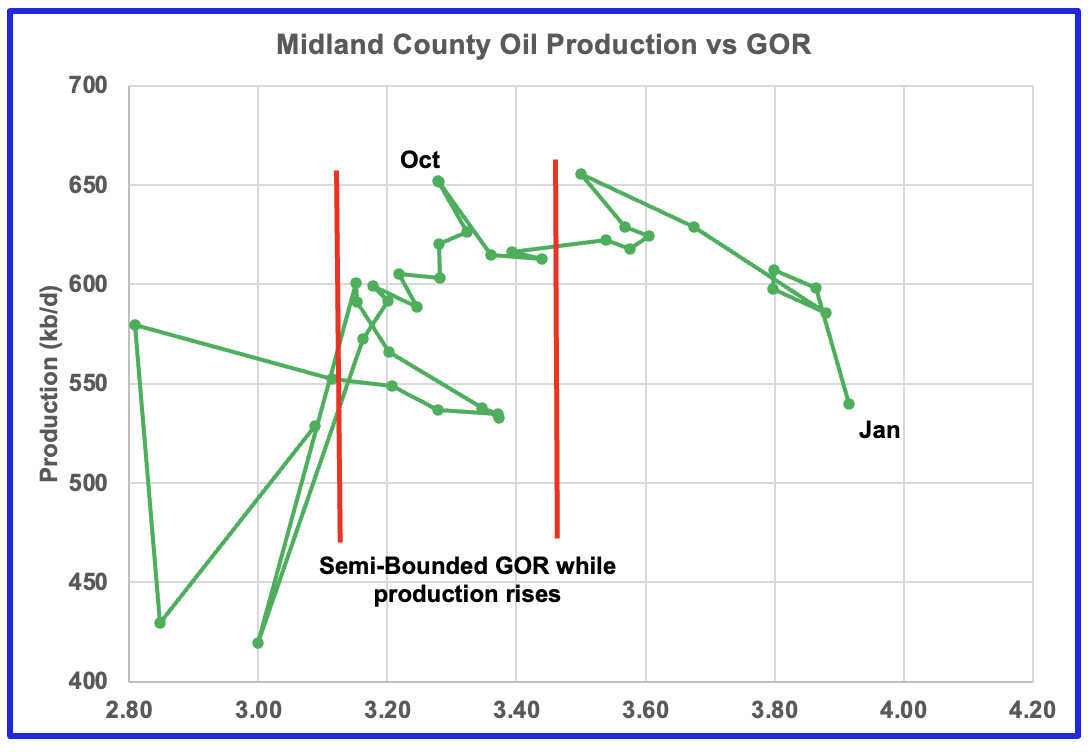
While it appears Midland county is deep into the bubble point phase, oil production continues to rise, based on the previous graph. Note that oil production in this chart is based on the RRC January data.
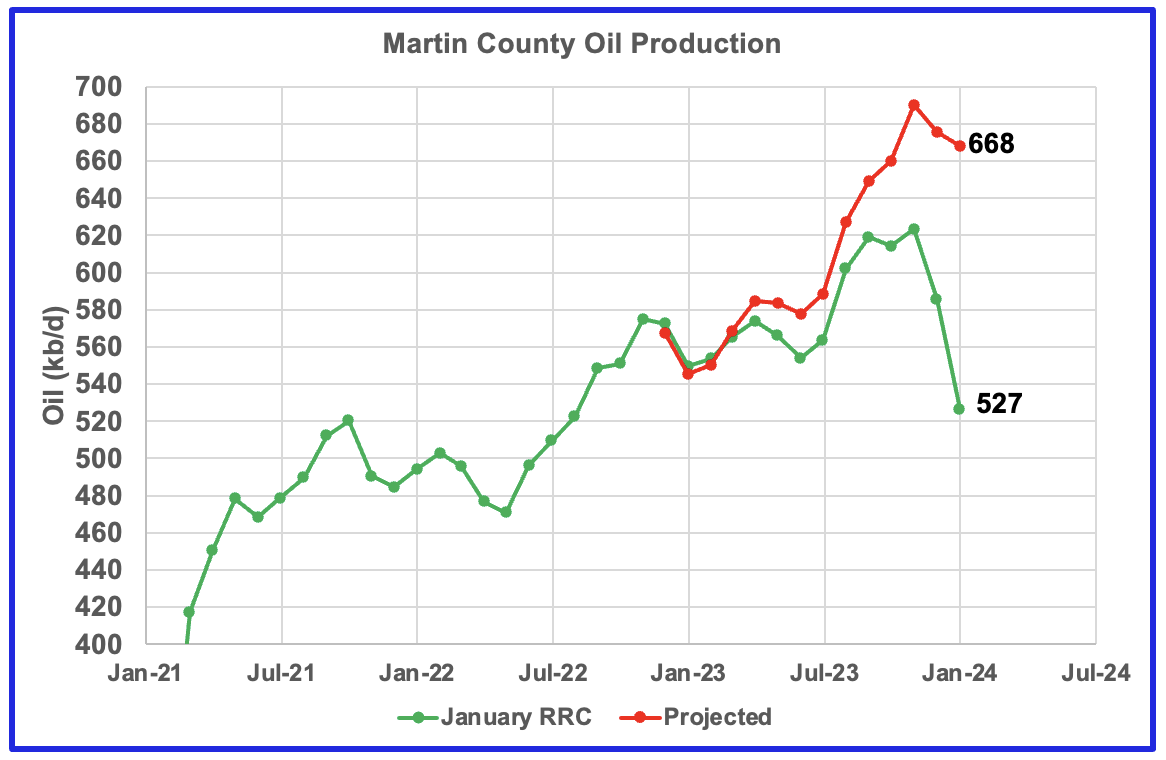
This chart shows the Texas RRC oil production for Martin County. It is showing initial signs of plateauing. The projection is also hinting at the beginning of a plateau phase.
The red graph is a production forecast which the Texas RRC could be reporting for Martin county about one year from now as drillers report additional updated production information. This projection is based on a methodology that used December and January production data and will be re-estimated each month going forward.
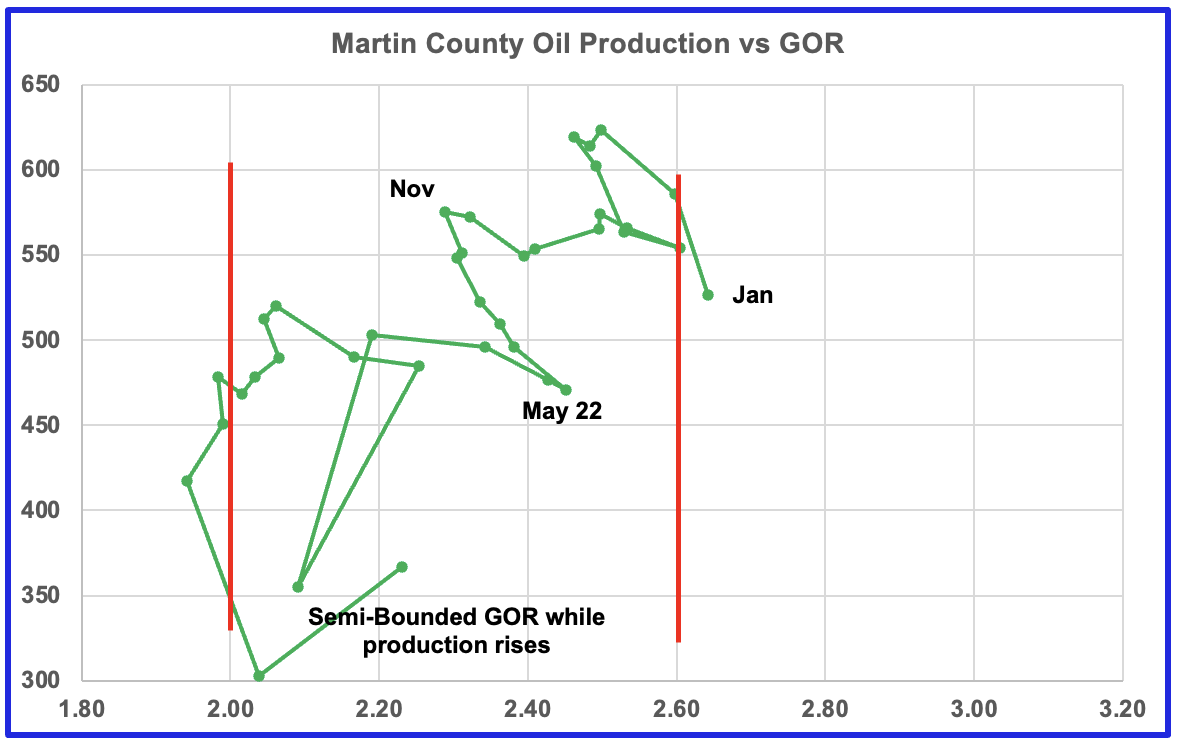
Martin county’s oil production and GOR up to December stayed within the semi bounded range and near peak oil production. However January saw the GOR move slightly out of the semi-bounded range for the first time along with a drop in production. Martin county has the lowest GOR of the four counties at a GOR of 2.64. Martin may be on the verge of entering the bubble point phase that results in a dropping oil production trend.
Exactly where to put the right hand red GOR boundary for Martin county is not exactly obvious. It is possible that the right boundary should be closer to a GOR of 2.5. The GOR started to reverse direction in June 2022 as oil output rose to a new high. In December 2022 the GOR began to increase and production began to drop. The GOR has been increasing since then and production has dropped. This makes it more likely that Martin county entered the bubble point phase in December 2023. A few more months of data will clarify the situation
Findings for the Four Counties
- Lea: It is in the plateau phase and possibly close to peak oil production. GOR has reversed direction, possible due to bad weather.
- Eddy: Oil production is slowly increasing possible due to increasing rig count. The GOR is in the bubble point phase and has reversed direction by decreasing.
- Midland: Oil production is increasing while at the same time the GOR continues to increase.
- Martin: Oil production could be entering the plateau and bubble point phase. The GOR has continued to increase since November 2022 while production has remained in the 525 kb/d to 600 kb/d range and coincidentally moved further into the bubble point phase in January.
Texas District 8
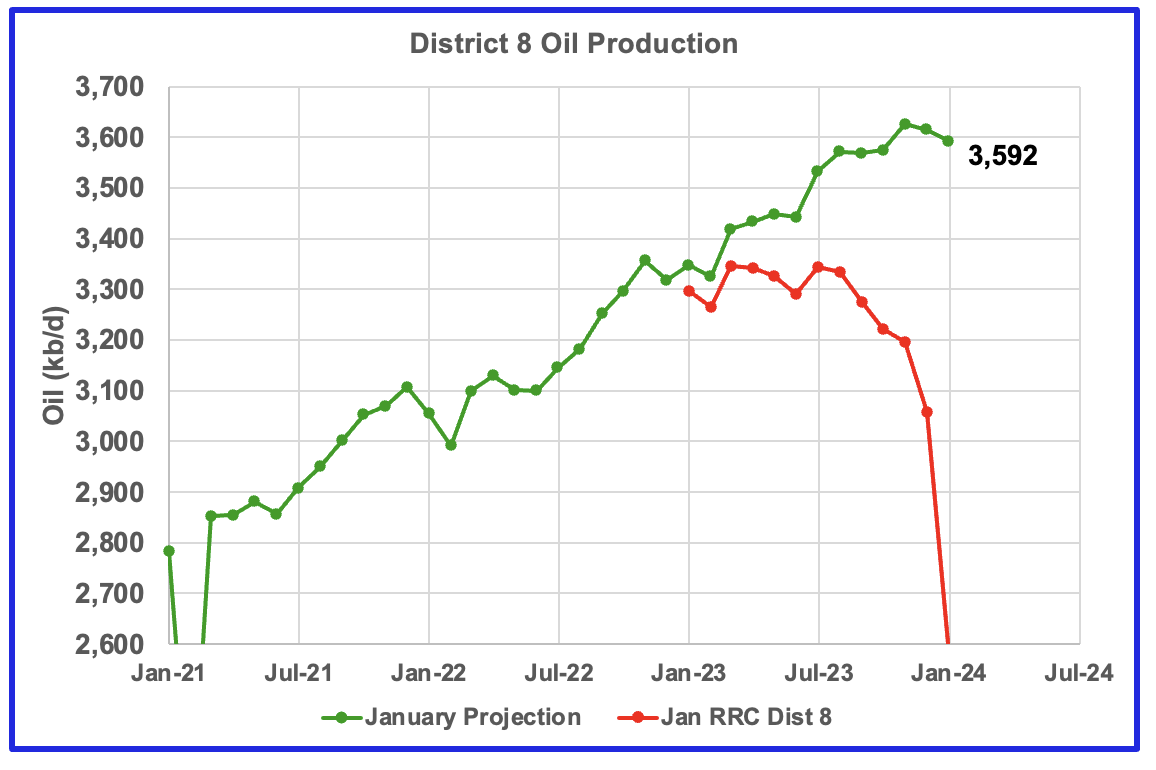
Texas District 8 contains both the Midland and Martin counties. Combined these two counties produce close to 1,200 kb/d of oil. While these two counties are the two largest oil producers, there are many others with smaller production that results in total production of close to 3,600 kb/d. Essentially the Midland and Martin counties produce 1/3 of the District 8 oil.
This chart shows a projection for District 8 oil production. The green graph, derived from December and January production data indicates that oil production in District 8 could be near its peak, even though Midland county production will continue to rise for another few months.
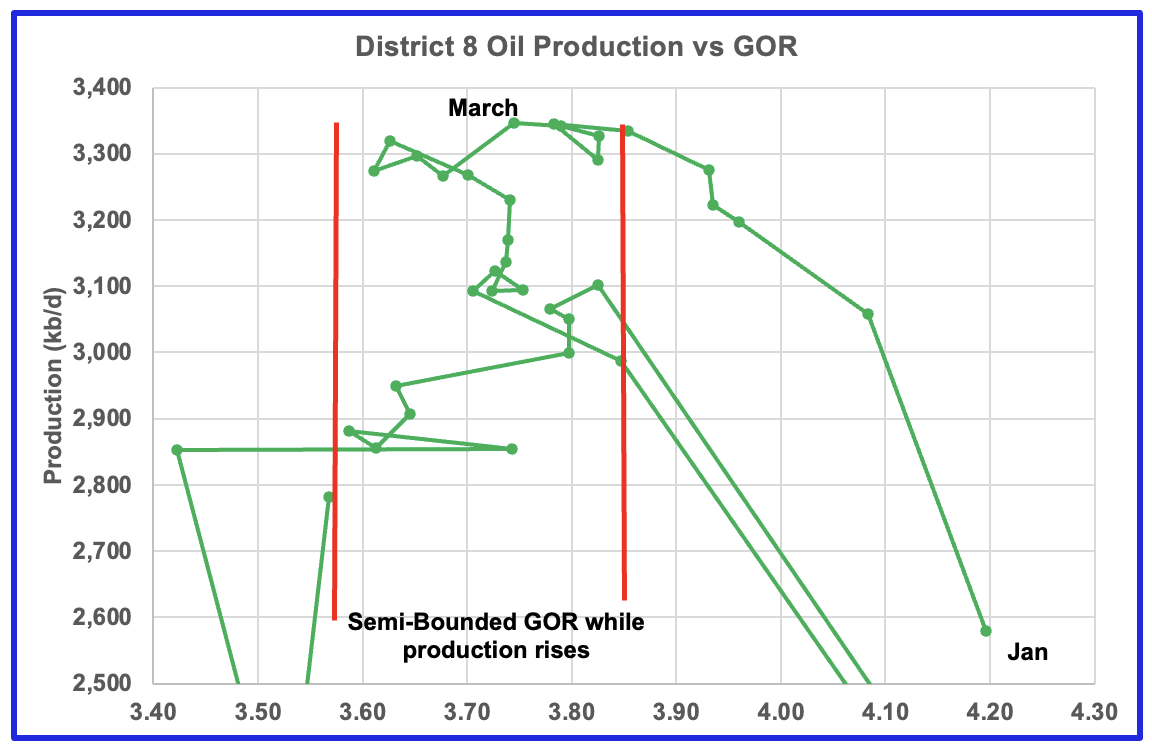
Plotting an oil production vs GOR graph for a district may be a bit of a stretch. Regardless here it is and it seems to indicate many counties may well be into the bubble point phase.
Drilling Productivity Report
The Drilling Productivity Report (DPR) uses recent data on the total number of drilling rigs in operation along with estimates of drilling productivity and estimated changes in production from existing oil wells to provide estimated changes in oil production for the principal tight oil regions. The March DPR report forecasts production to April 2024 and the following charts are updated to April 2024. The DUC charts and Drilled Wells charts are updated to February 2024.
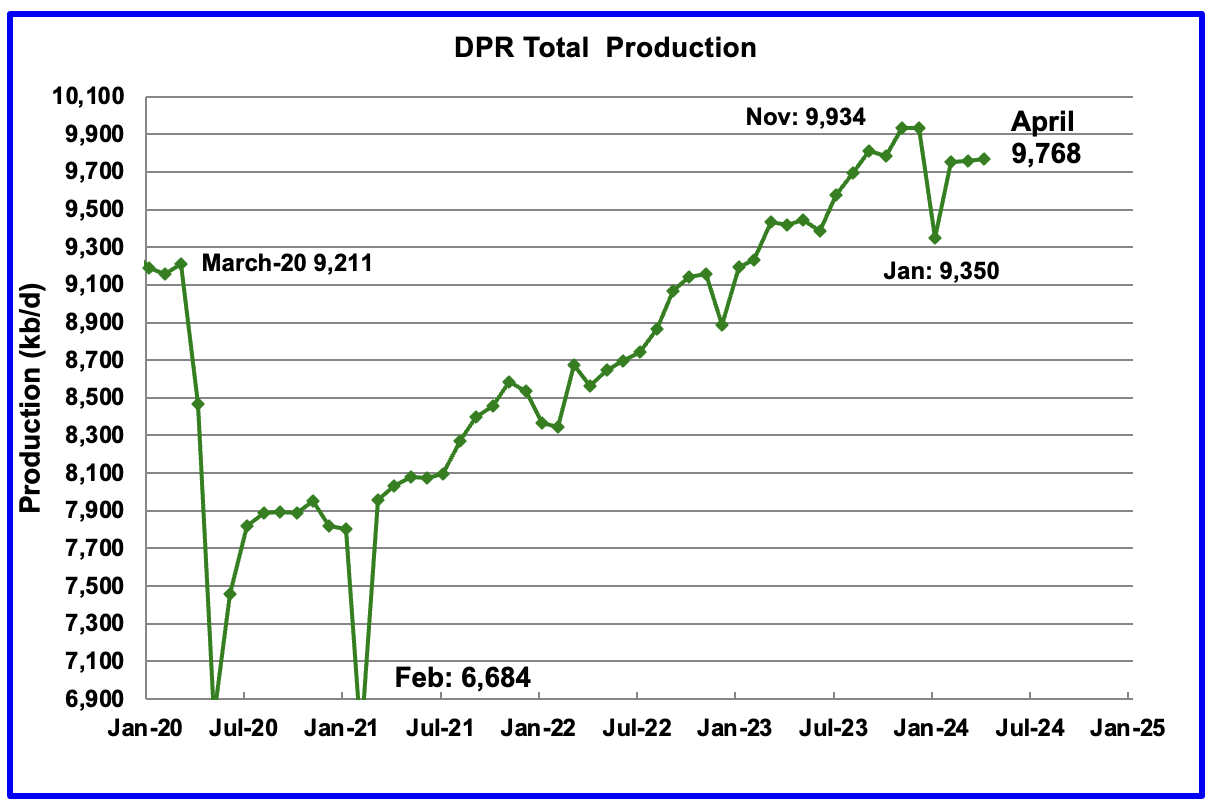
Above is the total oil production projected to April 2024 for the 7 DPR basins that the EIA tracks. Note that DPR production includes both LTO oil and oil from conventional wells.
The DPR is projecting that oil output for April 2024 will increase by 9 kb/d to 9,768 kb/d.
The March DPR report has also made an upward revision to its previous production forecast. For March, production was revised up by 43 kb/d to 9,759 kb/d. The large January drop is related to severe winter weather across the central US.
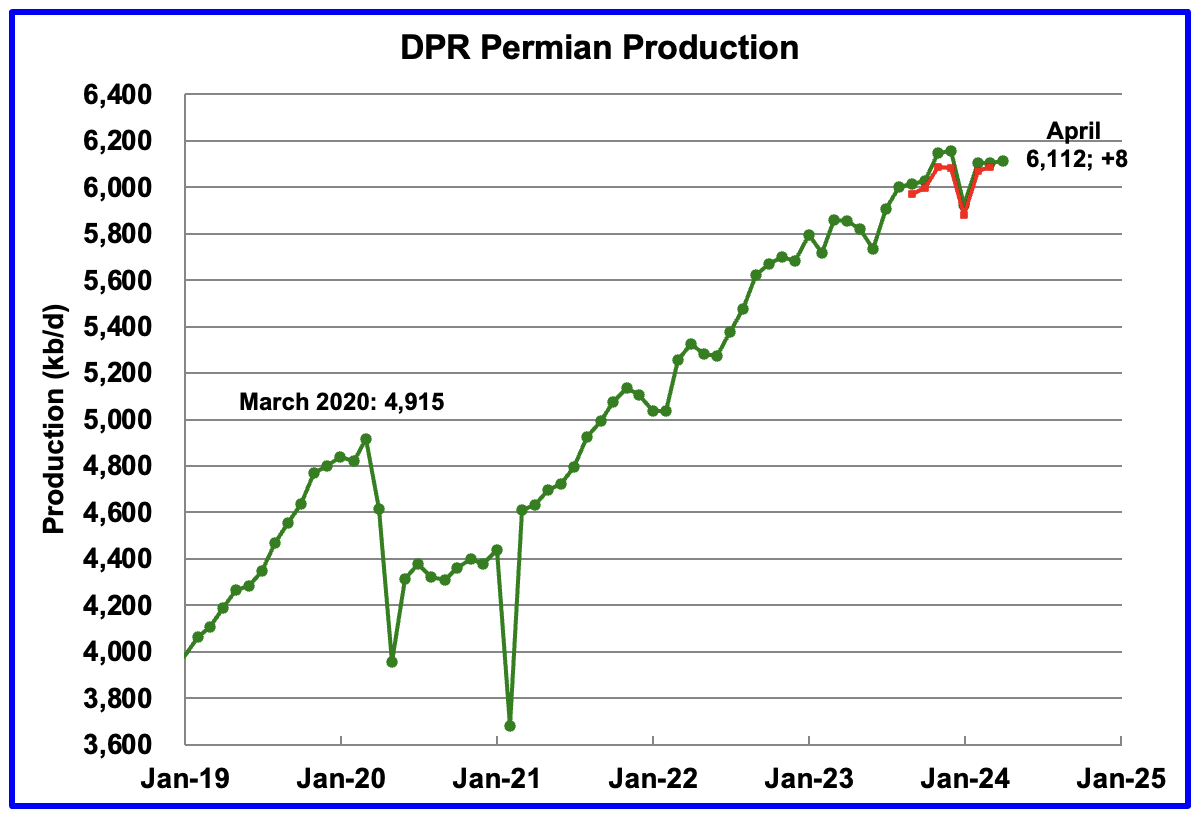
According to the EIA’s April DPR report, Permian output will continue its slow rise in April. It is expected to increase by 8 kb/d to 6,112 kb/d. The last three months of Permian production show a slowing trend in monthly production growth. The red markers show the DPR’s previous forecast.
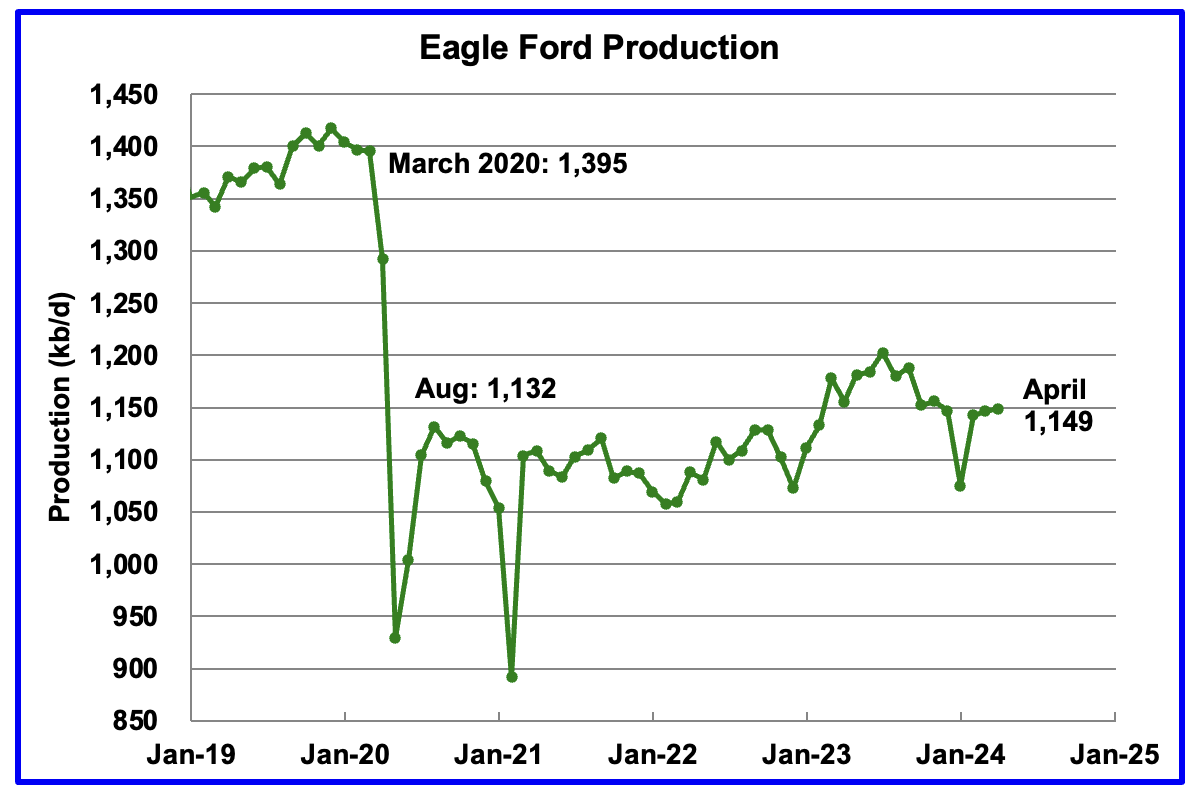
Output in the Eagle Ford basin has been on a plateau since November. The DPR’s March forecast projects March output will increase by 2 kb/d to 1,149 kb/d.
At the beginning of the year 2023, 68 rigs were operating in the Eagle Ford basin. The rig count began to drop in mid March 2023 to 60 and slowly dropped further to 47 in November 2023. Since the beginning of 2024, the Eagle Ford rig count has been close to 47 ± 2 rigs. The current rig count is 47.
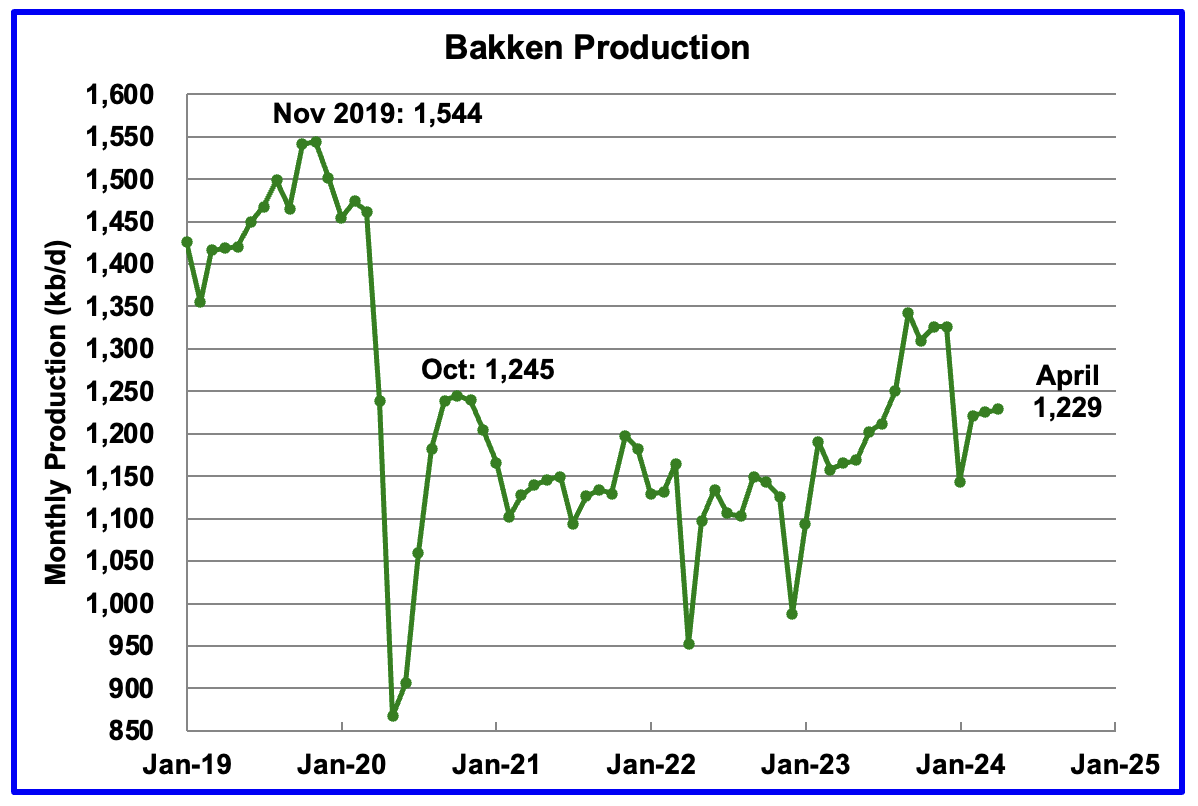
The DPR forecasts Bakken output in April will be 1,229 kb/d, 4 kb/d higher than March. April 2024 production is now projected to be 16 kb/d lower than the 1,245 kb/d produced in October 2020.
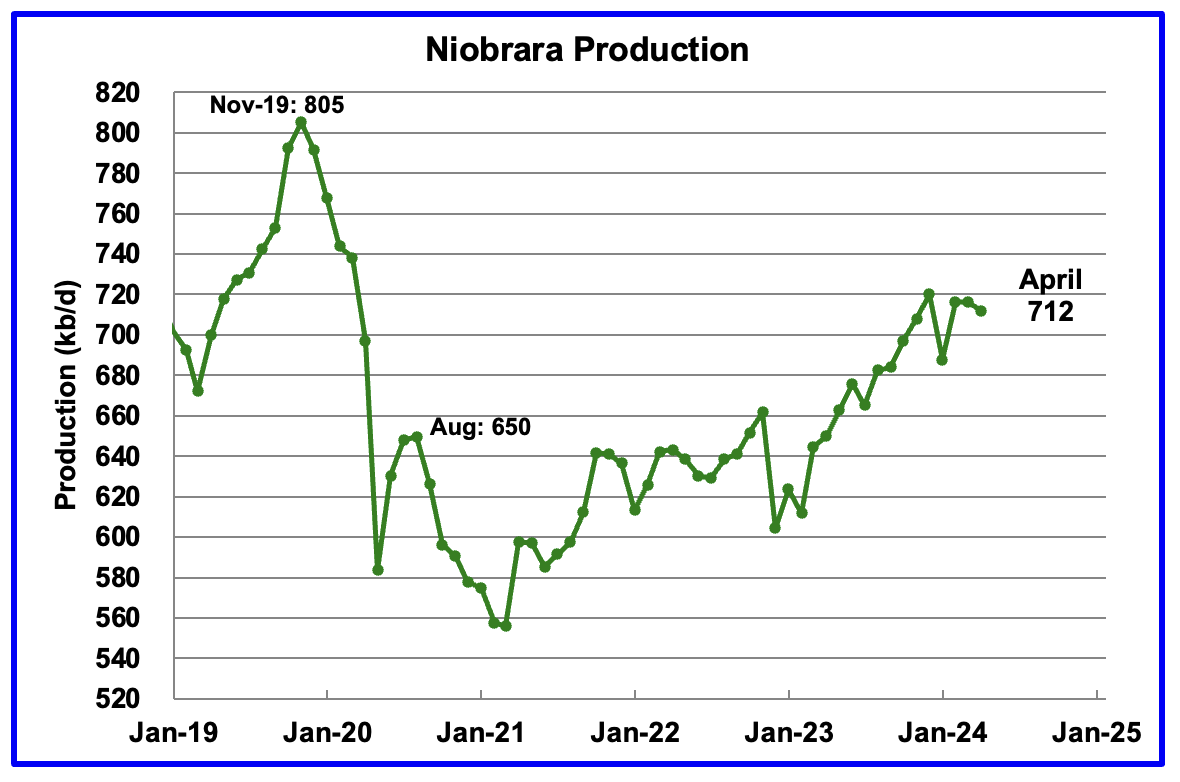
Output growth in the Niobrara continues to slow and may be on a plateau. March’s output decreased by 4 kb/d to 712 kb/d.
DUCs and Drilled Wells
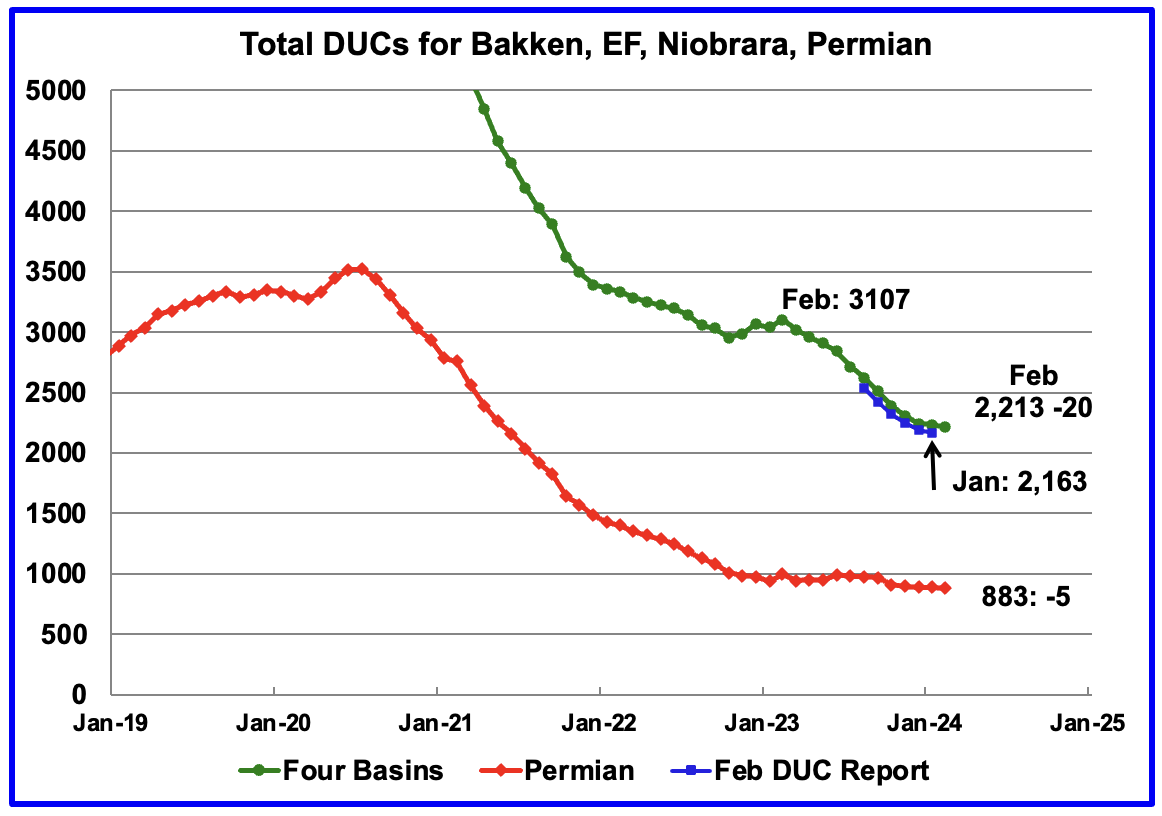
The number of DUCs available for completion in the Permian and the four major DPR oil basins has fallen every month since July 2020. February DUCs decreased by 20 to 2,213.
It is not clear what is the DPR’s definition for DUCs? The February report stated that there were 2,163 DUCs in January. The current March report has added 70 DUCs to January to 2,233 while the rig count has been steady or dropping. Puzzling.
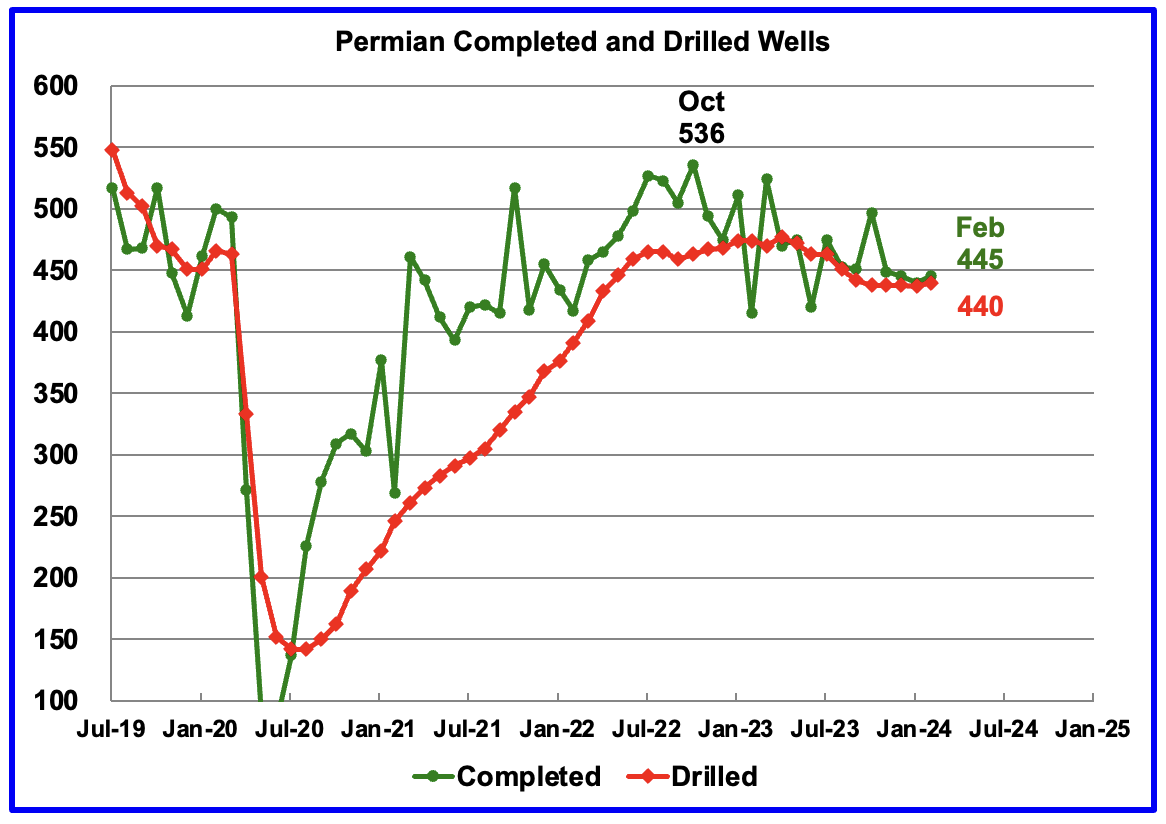
In the Permian, the monthly completion and drilling rates have been slowing since the October 2022 high of 536 rigs.
In February 2024, 445 wells were completed while 440 new wells were drilled. The gap between completed and drilled wells in the Permian is now very small compared to late 2022 and early 2023. Regardless, it is those extra completions that increase Permian production.
Rig and Frac Spread Report
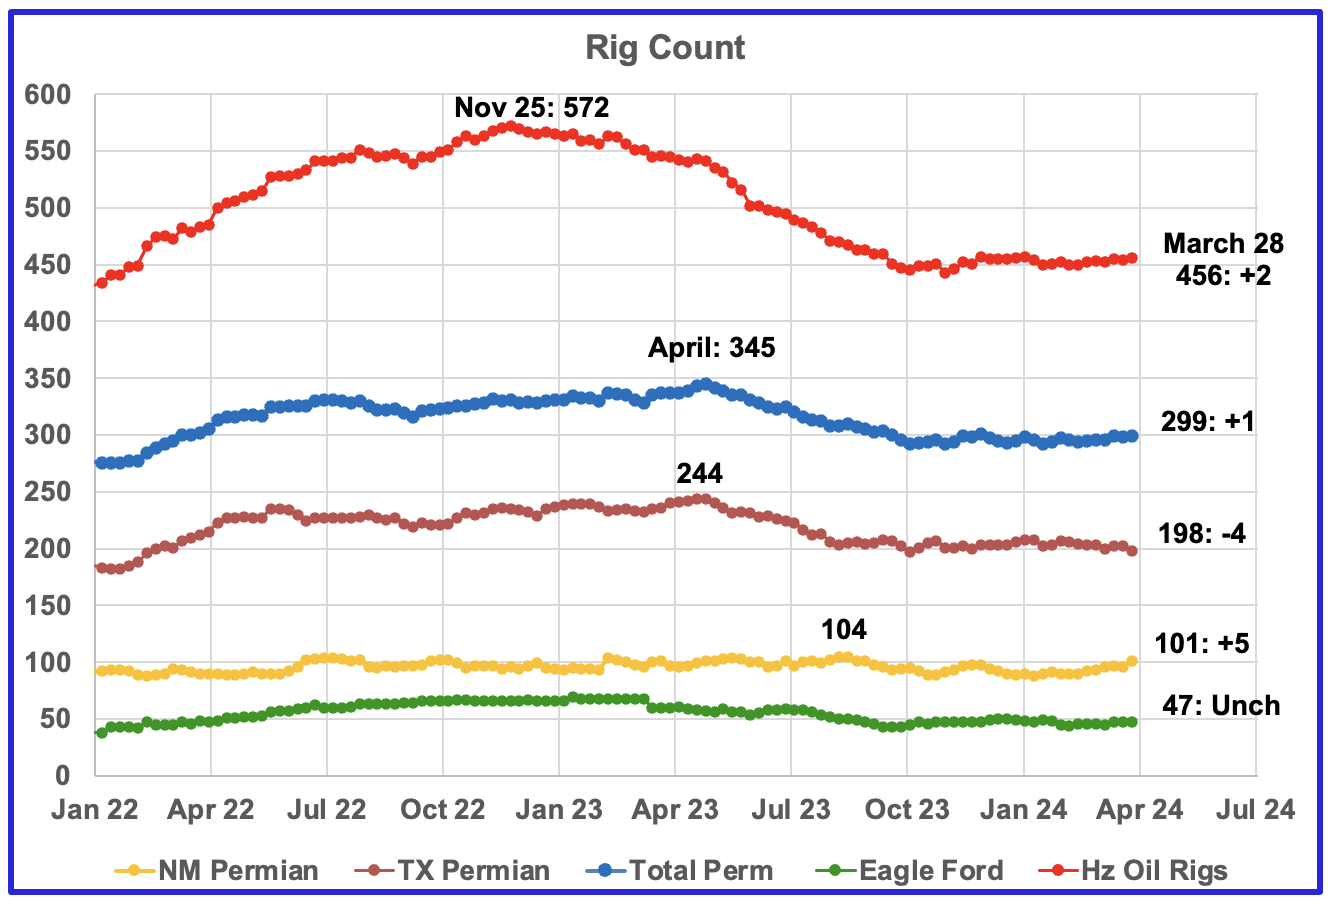
This Rig report is for the week ending March 29.
- US Hz oil rigs increased by 2 to 456. The rig count continues to hover close to 450 since the beginning of October
- Permian rigs added 1 to 299 and also have been flat around 295 since October 2023.
- Texas Permian was down 4 to 196 while NM was up 5 to 101. In New Mexico, Lea county added 3 to 46 while Eddy added 2 to 55. Something is happening in Eddy county.
- Eagle Ford was unchanged at 47
- NG Hz rigs were unchanged at 101. (Not shown)
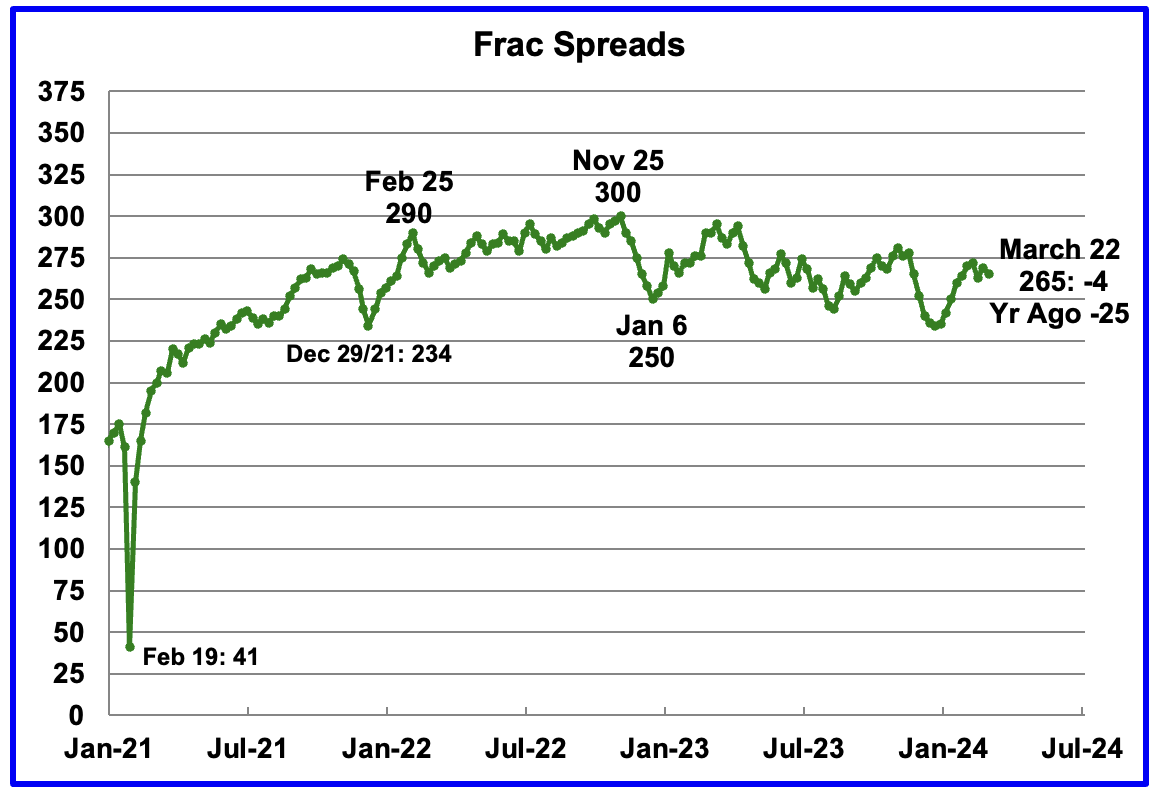
This Frac report is for the week ending March 22. No report was published for the week ending March 29.
The frac spread count was down 4 to 265 and is down 25 from one year ago. How high will the Frac count go in 2024? The chart is starting to show signs the frac spread count will bounce between 250 and 275 going forward.
162 responses to “Bad Weather Drops US January Oil Production”
Thanks, Ovi, great article as usual.
One comment about the LTO office of EIA. It shows flat Permian production since mid-2023. The reason is that they only track the three main formations: Wolfcamp, Sparberry and Bonespring.
NOVI Labs recently posted that all of the growth, Midland mainly, comes from numerous minor benches.
Kdimitrov
Did not know that the Midland’s increase is associated with numerous minor benches. It will be interesting to see if Midland peaks in February and March.
I don’t see them recovering above the recent peak, so probably a good time to call peak US shale.
Lightsout,
Higher natural gas prices, if that occurs, along with higher oil prices could lead to higher completion rates in the future. I expect growth in Permian output will be slower than the past, but whether growth is positive or negative will depend on future completion rates. My best guess is slightly higher US tight oil output, maybe about 500 kb/d more than recent peak by 2027 or 2028.
Dennis
Then we disagree, but my opinion is that a higher price can not offset the combination of factors now limiting growth.
Lightsout,
We will see, the main limitation is slower rates of new well completion, we will know more by August 2024. The main problem currently is lack of profits at the current price deck, if that changes (prices increase) the completion rate is very likely to increase IMHO.
That’s it, Lightsout called it, end of discussion!
Mark your calendar, April 2nd, 2024 – we can now say with 99.999% certainty that peak oil for the world and USA was in 2018/2019…the only person left to say otherwise is Dennis…he’s fairly rational though so will have to throw the towel in sooner than later…
There’s only a couple hundred billion barrels left to refine of the good stuff, so refiners are understandably shuttering their doors…
Here’s a look at refining capacity for top 3 and assumes a 3% annual decline:
3% average annual decline seems reasonable/optimistic and results in 1P totally exhausted by ~2032 or so…
Kengeo,
Very little is certain, I would put the odds at 3 in 10 that 2018 will remain the final peak in World C plus C CTMA output. My expectation remains that there is roughly a 70% probability the centered 12 month average (CTMA) peak will be surpassed, with a 50/50 chance it will be either before or after Dec 2027 and a 90% probability the CTMA peak for World C plus C output will fall between June 2025 and June 2030.
World Refining capacity data from link below, this is the number that matters, refined products can be imported and exported.
https://asb.opec.org/data/ASB_Data.php
More World refining data from OPEC annual Statistical Bulletin (ASB)
https://asb.opec.org/data/ASB_Data.php
Ovi,
The “oil” output in Ohio may be mostly condensate from natural gas wells. Looking at Baker Hughes pivot table for Ohio I find 12 horizontal rigs operating in Ohio for week ending 3/28/2024 and all of them are gas rigs.
Data from
https://rigcount.bakerhughes.com/na-rig-count/
[…] Original Post […]
Ovi,
Excellent work and presentation as usual. These charts are very revealing to me and confirms what I have been seeing for the past 2 years. Continued Consolidation among companies (specifically Permian focused) will lead to fewer wells being drilled as well as more consolidation.
We saw diminished returns and results with development wells even in the “core of the core” in the Delaware Basin starting in 2021. Industry standard reservoir engineering analysis has had a very difficult time analyzing the connectivity between wells due to the newest technology in fracking and the complex fracture network created by these advancements. As a result, you will see the GOR continue to rise and oil production based on the current rig count and frack spreads should lead to smaller growth and possibly even some declines in the smaller companies.
We were surprised by the oil growth last year, however; if you look at the frac spread vs. drilling rig count, you will see that the industry dramatically reduced the DUC count by completing many more wells than actually drilled last year. We are now very close to the point where the DUC count should remain relatively constant and increased growth coming from DUCs will not be as impactful as they were in 2023.
Unless we see new technology via re-frac or some sort of secondary recovery, I anticipate there will be a very hard slog in trying to increase production. Fighting these high decline rates coupled with lower reservoir pressure will make production growth challenging for 2024 and beyond.
We may be wrong about this conclusion, but we believe the end of unbridled production growth in the LTO is near.
LTO Survivor
You mention “Industry standard reservoir engineering analysis has had a very difficult time analyzing the connectivity between wells”. Even if that connectivity between wells is small, as long as some oil flows along that connectivity, the pressure in the connected regions will continue to equalize. Since the situation is dynamic I can understand why it is difficult to assess connectivity.
If Midland were to peak in the next few months we could see the Permian move into a plateau phase. However right now Eddy is a bit of a mystery.
Attached is a chart of the ratio of frac spreads to rig count. Over the past seven weeks it has settled into a narrow range of 0.58 to 0.60. It will interesting to track this ratio going forward and it may be another indicator of industry consolidation.
Ovi,
Note that frac speads are used for both oil and gas. Are you using the gas plus oil horizontal rig count? It seems you may be using just horizontal oil rigs in the chart above. Interesting idea though, see chart below for frac spread count to horizontal rig count (both oil and gas rigs).
Dennis
Correct. I used Just Hz oil rigs.
Thanks for the clarification.
Frac spreads to horizontal rigs (oil and gas)
Chart with 3 month shift forward of horizontal rig count below.
Thinking is completion might occur about 7 months after spud, but frac process (including moving rig out and moving frac spread to job site) might take 4 months with drilling process (including moving rig in) perhaps taking 3 months on average.
These are guesses on my part, as the process is far more complex than I can fully appreciate. Would love to hear from those who know more.
Pressures may equalise once the wells stop flowing, but before then any cross flow would be negligible compared to overall well production. Interference is important in that it reduces (possibly significantly) the URR of the child wells but it won’t change the early performance or composition of the wells production.
this is a true statement George but it does affect the URR of the child wells significantly.
Bad weather or Mike told you so! He said things will be seen after 6 months, they are pretty much showing their ugly head!
Svaya
Definitely bad weather, February will rebound by over 500 kb/d,
> Definitely bad weather
Ovi,
How bad was the weather? These things are measured. If I remember correctly, this year was only one day with really low temperatures, compared with a week in 2021 with much lower temeperatures.
Can you please compare with 2021 temperatures, and also show how much the production was down in 2021, for this causation to be relevant! At the moment there is nothing that says to me definitely.
Svaya,
see
https://www.ncei.noaa.gov/access/monitoring/us-maps/maps?maps=regional-tavg-rank–1–202101,regional-tavg-rank–1–202401
So now we are doing a whole month temperature averages!
Makes me think of that joke:
If you have 2 loafs of bread and I have none. Statistically we have each one a loaf of bread.
Even using this tool the month was February 2021
I was just quoting from memory and you can see serious differences when taking this month into acount:
https://www.ncei.noaa.gov/access/monitoring/us-maps/maps?maps=regional-tavg-rank–1–202102,regional-tavg-rank–1–202401
Also the ranking throws me off, because the difference between ranks is non-linear
But whole month averages is not a good way to approach this IMHO even without the ranking
Svaya,
You can look at each day for every state and get back to us.
Why wouldn’t we look at the monthly average temperature, we are looking at average output for the month, seems logical to look at average temperature. We could also look at minimum temperature for the month, which would give us a single moment in time for the entire month, would that be more representative in your view? There are about 37200 hourly data points for a single month in all 50 states, how would you proceed?
Let us know what you find.
@Dennis
1) I cannot use the data since the products are Ranks of Averages. So the difference between Rank 6 and Rank 28 is non-linear and not determined.
2) Even so, IMHO, the burden of proof is not on me since I am not the one that said “definitely the weather”.
Anyways my money is on “Mike told you so” and I justify that as just my hunch so there’s no burden on prooving that.
Yes in Feb 2021 output fell in Texas by 18.5%, in Jan 2024 output fell in Texas by about 5.1%, less than a third of the % drop in Feb 2021.
The “weather” is not quite as easily measured as you first assumed, there is a lot of data, but finding statewide averages or regional averages (or whatever you think would tell you the weather was cold, snowy or whatever) is not an easy task.
In any case I agree with Ovi it was likely the weather, or it could be a budget thing where all of the budget for the year was used up by Dec 15 and they went on holiday for a few weeks waiting for more CAPEX money to be available on Jan 1, the lull at the end of December could then affect January output. Often we do see a drop in output in Jan, in North Dakota it is often due to blizzards, winter blizzards could also affect Colorado, Wyoming and Utah, but probably not Texas so much.
@Dennis
Why use percents and not absolute measures in kb/d?
Of course the percents are higher in February 2021, since total production was lower post covid.
The way I would do it would not be strictly on temperature averages, but to agregate which producers closed operations due to the weather. That would be real data but would probably expensive, both time and money. But that would settle it as definitely weather.
Svaya,
The percentage drop gives a better sense of the scale, if a state is producing 200 kb/d and output drops by 100 kb/d , that is a large change in output for that state, if the state is producing 5000 kb/d, a 100 kb/d drop is statistical noise. That is how I look at things.
I can’t find temperature averages for states, but knock yourself out.
Also see the directors cut video in the first minute and 10 seconds he talks about cold weather in January reducing production in North Dakota. This probably was not the case in Texas, but might have been a factor in the Rockies and could have affected Colorado, Wyoming, Utah and perhaps Illinois, and Ohio.
https://www.dmr.nd.gov/dmr/oilgas/directorscut
@Dennis
JPM says production still down
https://twitter.com/SheDrills/status/1777293247829667866
Is it the weather still?
So next months update will be titled: Great weather lifts US oilproduction. 😉
And if it’s still down, bad jeebies from previous month bad weather drops February Oil Production!
JPM says production still down
https://twitter.com/SheDrills/status/1777293247829667866
Title:
Total Eclipse Drops US April Production
Frac report is for the week ending March 29
The Frax report for March 29 was just posted.
The frac spread count was down 5 to 260 and is down 35 from one year ago. The chart continues to show the frac spread count bouncing in the range between 250 and 275.
Related to the frac/rig discussion above and in line with LTOs post, would be interesting to see all three of rigs/fracs/DUCs in one chart, I would guess there is a correlation.
And I guess WTI (& Brent, NG/LNG etc.) prices are influencing too, so a multi variable analyzis as good as in any exam.
(but reducing lesser factors was one approach, as long as you don´t oversimplify, if I remember correctly)
https://www.reuters.com/world/europe/several-people-injured-drone-attack-industrial-sites-russias-tatarstan-agencies-2024-04-02/
Ukraine hits oil refinery deep in Rusia.
https://www.youtube.com/watch?v=IYG654K1D3M
5 minutes. Peter Zeihan (geopolitical analyst) beleives the attacks are very significant.
They are demonstrating the ability to disrupt oil from Siberia.
Ukraine has found a soft spot and they are going to hit it over and over again.
“This is a disaster for the Russians the Ukraine will be doing this at scale, because the Russian can’t stop it”
Dennis told me all was fine and OPEC could make up for any loss Russian oil production.
Potential here is Russian oil exports going to zero. Not only that but potentially no Russian oil exports for a decade or more.
So a hard pike in prices followed by a crash as debts go unpaid on a large scale globally.
3H, is the Russian crash going to happen before or after your prediction of $25 oil of more than a year and a half ago, I’m still waiting for $25 oil ?
Price action indicates something big is near. Oil up, stocks breaking trend support heading down. Even the Japanese yen crosses are indicating trend change. And it would take something big and sustained for that carry trade to unwind.
Markets are on edge here.
HHH,
Perhaps you are right this time – or not. You have made more or less the same statement (markets signals imminent crash) for quite some time. Have you reflected upon why you have been wrong so far and how to improve your predictions? Perhaps you are reading the data wrong?
Jeff,
HHH will continue to say there is a crash coming soon. Eventually he will be right and will say see, just like I said. Nobody knows when a crash will occur, but they do happen from time to time, roughly every 60 to 80 years though sometimes a pandemic will intervene, those can also not be predicted in advance. We might not see $25/bo oil until 2050, but I expect we might get there, sooner (2035) would be better than later from an environmental perspective.
The current situation is the FED won’t be able to cut rates due to rising oil prices and hot jobs data.
So what does that mean going forward. Besides no rate cuts. It means a repricing of commercial real estate. Which means huge losses on bank balance sheets. It also means loans that need to be rolled over have to be rolled over at much higher interest rates.
Sure the FED can dangle the possibility of rate cuts out there. But when gas prices go back to $4 and job data continues to be hot there will be no rate cuts.
The inverted yield curves aren’t wrong. They have been calling for not a soft landing or no landing. They are calling for a crisis for going on 18 months now. People have become way too complacent thinking just because it hasn’t happened yet means it’s not going to.
There is no such thing as central bank liquidity btw. Bank reserves created by central banks never leave the central bank balance sheet. The bonds and MBS’s they buy from commercial banks are paid for with bank reserves that never leave the FEDS balance sheet.
Liquidity comes from commercial banks. Peg oil at say $125 or $150. How much liquidity do you think the commercial banks are going to provide in such an environment?
Rates can go to zero in such an environment and commercial banks would still be very hesitant to lend. Equals no liquidity.
$150 oil pops the current everything bubble. Debt deflation follows. $25 oil.
Yup thats possible.
Probability 4.9%
The more important thing is the time stamp.
Without a particular time prediction, this kind of pronouncement is worth very little from a business planning, personal risk management or financial planning standpoint.
HHH,
Sorry but I do not see any reflection on _why_ your previous prediction was wrong and the learnings that you made. I´m not saying you are wrong now, some things do look bad but it is important to learn from previous mistakes to progress.
In your comment you state that FED will not lower the rate going forward. I will remember this statement and if they do cut (which I think they will) we might be able to discuss this again.
Jeff, the yield curves haven’t even un-inverted yet. I can’t be wrong until it actually plays out.
And once the yield curve does finally steepen out of its inversion it’s just the beginning of the recession that everyone seems to believe was somehow cancelled. Not the end or bottom of recession.
Yield curves have been calling it for 18 months. Even if it takes 36 months to play out doesn’t mean they are wrong.
All it means is your impatience.
If we somehow steepen out without a crisis then I will be wrong in my assessment.
I guess anything is possible. But it’s like a 5% chance at best that I’m wrong.
I’m expecting the yield curve to steepen out when the FED finally does start cutting rates. Because they are forced to cut not because they chose to cut. Because the jobs and inflation data finally tank because bank lending goes down with the repricing of CRE collateral.
In the meantime I’m watching oil scream higher on geopolitical issues in the ME and Russia refinery capacity being taken off line.
15% or about 1mbpd of Russian refining capacity has been taken off line. So far.
Russia is importing gasoline from Belarus.
Yes it’s just my opinion. But $150 oil burns the barn down.
Eurodollar banks would pullback dramatically on dollar liquidity outside the US. Causing a disorderly unwinding of dollar denominated debt and spiking dollar.
HHH,
OPEC can certainly make up the 1.2 Mb/d cut by Russia. No Russian oil exports is about as likely as $25/b oil prices before 2035. And for a decade or more, now we are getting to near zero probabilities. Maybe odds of 1 in a million or less.
I will place a $1 bet with those odds Dennis…
You will have to find another counterparty, but where would you put the odds that Russia has zero oil exports for a decade? Even with no refineries (also very unlikely), they could still export crude oil. The no oil exports from Russia for a decade scenario is just as silly as the $25/bo nonsense, which we might get to in 2035, but before 2030 it is another one in a million type of scenario (for an extended period of one month or longer).
Even in 2035 25$ oil would exist for only a very short time – as in the COVID-shock of the first months.
All offshore would shut down, and all expensive production, no maintenance drilling. Only pumping old giant fields when this price would be standard. I don’t think that much more than 30 mbpd could be produced in such an environment.
And it’s only 11 years till then – the current build cars will still drive then in majority, as not everyone has the money to buy an brand new electric one. Electric grid in Africa or India will still not be able to handle the loading of x million electric cars and trucks.
Aviation will still rely on Kerosene, with the here and there hydrogen prototypes flying. Chemical industry will still intake mainly oil, with experimental bio indigents.
You in the USA will first get 4 years Trump (very probable in my opinion, I don’t say this is good), stopping state financed conversion. So the single biggest oil guzzler will still use a lot of this stuff.
It will be an effort to have oil consumption in 2035 lower than today – and with the decline of many big fields until then (Shale in B and C quality benches then) this will be necessary to prevent a permanent 100$+ oil.
Eulenspiegel,
Perhaps you are correct, $25/b is in 2023$ and may be too low, but my guess is that demand will fall below supply and much of the expensive oil (tight oil, new oil sands projects, Arctic oil and ultra deepwater) will no longer be developed. OPEC may fall apart and Middle east nations and Russia may start to compete for market share and might flood the market with oil in a more nearly perfectly competitive oil market, oil prices will fall to whatever the cost of the marginal (highest cost) barrel that can satisfy World demand. Note that only a portion of the current light duty fleet are newer cars, lets say the average car gets scrapped after 15 years, in 11 years only cars from the most recent 4 years would be still operating, that is about 300 million vehicles, with perhaps another 400 million ICEVs sold over the next 11 years (assuming we get to nearly 100% plugin vehicles sold in light duty market by 2035). If we assume fleet efficiency for these 700 million vehicles increases over time (more hybrid vehicles) to an average of 40 miles per US gallon and each vehicle drives 10 thousand miles per year on average then demand would be about 11400 kb/d for light duty ICEVs in 2035. In 2022 gasoline demand for the World was 26 million barrels per day so this would be a reduction of about 14.6 million barrels per day in land transport fuel demand. In addition there may be some reduction in use of land transport fuel by heavy duty trucks and buses as well as 2 and 3 wheel vehicles which are not included in this estimate as these will also see some transition to electric transport. The actual price may not ever reach $25/bo, but it might reach $30/bo in 2023 US$ some time around 2035. I have assumed self driving cars never get approved on a wide scale, if that is incorrect we could see EV miles travelled accelerate as close to 100% of light duty vehicle miles travelled will be by robotaxi in a 5 year time frame after widespread approval of self driving cars.
@Dennis
Even now oil price is at the marginal producer (perhaps the last weeks over it) – LTO doesn’t really make money below 75 and only lives on wallstreet tricks then.
It will be at 100 in 11 years. So is extreme deep water oil once the best ressources are tapped. Consumption has to fall A LOT to get cheap – don’t forget there is still growth from Africa and Asia.
Electric car sales are falling in Germany again – the first enthusiasm is over, and all green oriented people with much money already have one. Hybrids are often only tax evasion models (many are not loaded) here – and on gas they guzzle more than my pure gas car.
Once 50% of cars are electric, imagine the loading stations needed at interstates for holyday travel (or truck loading…). New landlines have to be build, nothing to see here still. 100 MW or more for a big station at a much traveled interstate. Ouch. Nothing even planned at the moment.
Yes, change is coming but slow. Also the infrastructure is even in rich Europe not there yet – at the same time we are told to change heating houses to heat pumps, and improvements of the electric grids are tiny at the moment.
Building a new train cargo system is already dead while planning – the army of green environmentalists and conservative house owners united have loaded their cannons with lawyers already. So it will be trucks. With a loading need of 1 MW per piece. I don’t see this ready and working in the next 10 years.
Edit: Did a bit data mining. One Autobahn here has on average 16000 trucks per day, round about 11 a minute. They must load every 400 km when electric – a station is every 50 km, so capacity to load round about 90 trucks an hour on average (and that includes truck free sundays) is needed. To avoid chaos the double should be there I think. Just to see what needs to be done.
People don’t quite get that transition from oil doesn’t mean reduced oil demand, it only means oil will be a smaller wedge of the energy supply. We transitioned from coal a century ago and coal demand still hit all-time high in 2023 (worldwide). Think about that!
Demand for oil will be there for many decades, Dennis, the question is, will there be affordable supply to meet it.
Eulenspiegel and Kdimitrov,
We will see. Plugin sales growth from 2014 to 2023 grew at an average rate of over 41% per year. The share of BEVs was over 70% in 2023 and the share of plugin sales for all light duty vehicles sold in 2023 was 15.8%. Prices for BEVs will come down over time as the industry ramps up, building charging infrastructure is not that difficult. Demand is likely to fall starting in 2030 in the mean time demand will grow more slowly than in the past. If we look at past 4 years the linear rate of increase has been 3.6 million per year, if that linear rate of increase continues we would reach 54 million plugin vehicles sales in 2034 (cumulative sales 2014-2034 of 439 million). My guess is we will do better than a linear rate of increase as prices fall and charging infrastructure becomes more widespread.
Data from
https://ev-volumes.com/news/ev/global-ev-sales-for-2023/
*transition….this is interesting that anyone here would imply that moving from a high energy density fuel to essentially zero energy density fuel is not only possible but could result in a ‘transition’….
Here’s what lower oil consumption works out to:
Kiribati – Population of 133,515 people / 400 bbls oil per day.
1,000 people in Kiribati split 3 bbls per day…GDP is $1,700 per capita, meaning in a year $1.7 Million is generated via consumption of 1,100 bbls of oil…$1,550 GDP per barrel.
50 people in US split 3 bbls per day…GDP is $83k per capita, meaning in a year $4.15 Million is generated via consumption of 1,100 bbls of oil…$41,500 GDP per barrel.
Since Kiribati only consumes 400 bbls of oil per day (0.004 mbd) they have a significantly lower GDP…about 27 times lower than the US…beacuse oil consumption is 20 times lower than US per capita…
Sri Lanka is similar to Kiribati, 660 people share 3 bbls and GDP is ~$3k…$1,800 GDP per bbl…India is nearly the same at $2,000 GDP per bbl, 216 people in Brazil split 3 bbls per day…GDP is $9,000 per capita, meaning in a year $1.9 Million is generated via consumption of 1,100 bbls of oil…$1,700 GDP per barrel.
We are an oil based society, plain and simple…
So what is a barrel of oil worth to the average person?
At least $1,500…or more than $40k in the US…
You may also note that GDP per capita in US has not changed (adjusting for inflation) since 2007 timeframe…it’s been a long plateau…
It wouldn’t be surprising, would it? Look at 2022…
Peakoil in the Data – 2006: Debt climbs and US GDP per capita growth drops…
Chart of US real GDP per capita at link below
https://fred.stlouisfed.org/series/A939RX0Q048SBEA
In 2007 it was 55560, in 2023 it was 66754. From 1985 to 2023 the average rate of growth in US real GDP per capita was about 1.54% per year, see chart below.
The “debt problem” is when credit to the non financial sector decreases, this is called a financial crisis, be careful what you wish for, debt levels at present are not a problem.
Kengeo,
Consider the World. Here we have oil consumption per capita in Gigajoules and Real GDP per capita in 2015 $. GDP growth is not related to oil consumption growth on a per capita basis.
Data from
https://www.energyinst.org/statistical-review
and
https://data.worldbank.org/indicator/NY.GDP.PCAP.KD?page=
For 1982 to 2019 data the relationship is very weak between oil consumption per capita and real GDP per capita for the World, R squared about 0.14. Strangely it shows that decreasing oil consumption leads to higher real GDP which is counterintuitive.
Dennis,
it shows that decreasing oil consumption leads to higher real GDP
I’d say that it shows that higher GDP leads to lower oil consumption…
I think average gas prices will be back above $4 before the election in November. Could be $5 depending on what goes on in Russia and the possibility of thing escalating in ME with Israel and Iran.
https://www.msn.com/en-us/news/other/ukraine-says-it-destroyed-russian-warplanes-in-one-of-its-biggest-drone-attacks-of-the-war/ar-BB1l8FFB
Andre (above):
“Ukraine has found a soft spot and they are going to hit it over and over again “;
Every nefarious actor on the planet is watching this and realising countries can’t defend against swarms of drones.
Ovi – Great work, thanks, I don’t buy the Covid issues explanation for lower production (think recovery occurred in 21/22), but if I did think there was ongoing Covid impact, I’d wonder why it appears Covid had almost no impact on NM? Maybe it is a difference of price sensitivity NM vs TX?
Kangeo
I think that a Petroleum expert could better explain the difference in the impact of shutting wells in LTO oil fields vs conventional oil fields.
As for the difference between TX and NM, there is none
Tx NM
Post Covid 4,225 847 kb/d
Pre Covid 5,449 1,125 kb/d
Ratio 0.775 0.753
Data taken from the charts above.
Check the state charts and these are the states that took the big hits, ND, OK, Wyoming, Louisiana. The last three states have mostly conventional oil. ND has some conventional oil. Maybe some expert can provide some information on the consequences of shutting a conventional oil well vs and LTO well. Could be related to the API of the oil or just the high decline rates of LTO wells.
Attached is production data starting January 2020 showing what happened in ND with oil production for two different APIs. The LTO wells appear to have been harder hit, maybe because new wells weren’t being drilled and the high decline rate showed its ugly face. The heavier oil just kept on at a steady pace. The data source is given below.
Other comments appreciated.
https://www.eia.gov/dnav/pet/pet_crd_api_adc_mbblpd_m.htm
World Oil (C + C) Production Rose 400 kb/d in December
Thanks Ovi,
The World Monthly data has a problem from 1973 to 1992, the EIA really is doing a poor job of late. The annual data seems to be consistent with older estimates from 1973 to 1992.
Below I show the annual data from the EIA. The OLS linear trend from 1973 to 2023 has a slope of 686 kb/d per year for average annual rate of increase in World C plus C output. My expectation is this rate will be much slower over the next 5 years, perhaps about half the historic rate.
Hey Dennis,
I noticed that very error (from 1980-01 to 1992) on the monthly data in early February on my own dashboard and i mentioned it to the EIA on Feb 13th using the contact form, they replied they were working on it back then. I asked for an update last week but i have not got a reply. Have you been in touch with them yourself about this?
I tried to contact them but got no response. Eventually they may get it right. Probably has something to do with FSU nations prior to 1993.
If we assume the future rate of increase after 2023 is half the historic annual rate (343 kb/d), then the 2018 peak gets surpassed in 2027, at that point I expect World C plus C output might plateau (plus/minus 100 kb/d of peak) for a few years and then output will decline after 2030. The rate of decline will depend in part on the level of demand and the price of oil, natural gas and NGL along with the cost of oil extraction.
Dennis – Do you have this same data/graph but with tight oil removed?
Kengeo,
No, data can be found at the EIA.
The centered 12 month average (CTMA) for World C plus C output is below, this data is suspect from 1973 to 1992. CTMA peak is 83003 kb/d in Aug/Sept 2018, most recent 12 month average is 81810 kb/d, about 1193 kb/d below the CTMA peak in 2018. Though the data being messed up makes me less confident in EIA data in general.
Dennis
Attached is a comparison with BP. The charts are not that dissimilar except for the difference in the oils that they are reporting.
BP includes crude oil, shale oil, oil sands, condensates (lease condensate or gas condensates that require further refining) and NGLs (natural gas liquids – ethane, LPG and naphtha separated from the production of natural gas).
Ovi,
The annual data looks ok, it is the monthly data from 1973 to 1992 that does not match with the annual EIA data.
After C&C production has gone up 2mmbpd in the last 5 months are we seriously expecting the Nov 2018 high to hold? That is just another 1.6mmbpd higher??
Just the OPEC cuts being reversed – and some of which some of which will in 2H24 – will bring C+C production very close to the highs. Just Saudi has actual spare capacity of 1.5mmbpd with sustained capacity of 10.5mmbpd and currently producing at 9mmbpd.
Yes, there will be cuts from Russia but Iraq has spare capacity, so has UAE. The restart of the Kurdistan pipeline will mean another 400kbpd to supply.
I don’t see how we don’t set another all time high in oil production by the end of the year.
Ancientarcher,
We might see a new peak by 2026 or 2027, but I doubt it will be in 2024 or 2025. It depends on OPEC decisions and demand which are hard to predict.
Russia will cut its crude oil production in the second quarter of 2024:
Looks like cuts of 1.2 mb/d by June…
https://www.enerdata.net/publications/daily-energy-news/russia-will-cut-its-crude-oil-production-second-quarter-2024.html
My read is 971 kb/d of Russian production cuts in June 2024.
Crude price continues to increase by 5% every 2 weeks, by May we will see the new floor of $100 per barrel set, by the end of the year $200/b is possible.
Crude Prices Could Hit $95 This Summer: ‘Oil Is Fighting The Fed, Again’
12:06 pm ET April 3, 2024 (Benzinga) Print
In an environment marked by a combination of tight supply, escalating demand, and ongoing geopolitical tensions, oil prices are projected to surge, potentially reaching a peak of approximately $95 per barrel this summer.
This perspective comes from Francisco Blanch, a leading commodity and derivatives strategist at Bank of America, who has recently revised his outlook on the oil market in light of these evolving dynamics.
“Oil is fighting the Fed, again,” Blanch stated in a note published Wednesday. The analyst highlights that escalating fuel prices are influencing headline Consumer Price Index (CPI) trends, thereby potentially limiting the scope for central banks to implement rate cuts.
According to Blanch, the oil outlook is currently dominated by four forces:
Persistently low inventories: Across the board, the oil complex is experiencing significantly low inventory levels, a situation that is contributing to upward pressure on prices.
OPEC+ production decisions: The output cuts enforced by OPEC+ countries are serving to tighten supply in the global market.
Geopolitical flashpoints: Escalating tensions in key regions, notably involving Iran, Russia, and Venezuela, not only threaten supply chains but also, paradoxically, stimulate oil demand through longer trade routes and reduced refining capacities due to infrastructure attacks.
Economic growth: Robust growth figures are painting a picture of stronger-than-anticipated demand, particularly for the upcoming summer driving season.
In response to these developments, Blanch has adjusted his forecasts for Brent and West Texas Intermediate (WTI) crude oil, projecting average prices for 2024 at $86 and $81 per barrel, respectively, with a peak expected at around $95 per barrel during the summer months.
Kengeo,
Some say $25/bo others say $200/bo, $90/bo would be my current guess. OPEC will increase output when Brent hits $95/bo and prices will fall back to $80 to $90 per barrel.
Note that if Brent increases to over $100/bo (in 2023 US$) and natural gas stays at $2/MCF or more and NGL sells at $30/b, then Permian wells in 2024 would pay out in about 27 months assuming $13 million CAPEX per well. If CAPEX is 14 million the payout is reached in 32 months. This assumes average 2024 Permian well has crude EUR of 418 kbo, NGL EUR is 167 kb, and natural gas EUR is 2014 MMCF.
In short Permian wells would be profitable at this price level and completion rate might rise in the Permian basin.
I get a 3.4% increase in Brent spot price every 4 weeks based on weekly data since the start of the year, so only about a third of Kengeo’s estimate for the rate of increase in oil prices. If that rate continues we get to more than $100/bo nominal price for Brent in about 20 weeks.
Doesn’t seem right…
6/05 – 87.45 x 1.14 = $99.7 in ~8 weeks…not 20…
Today – 87.45 ( 14%)
2/08 – 76.84
Kengeo,
Data at link Below
https://www.eia.gov/dnav/pet/hist/LeafHandler.ashx?n=PET&s=RBRTE&f=W
Chart is based on 13 weeks of weekly Brent spot price data. It takes 20 weeks to reach more than $100/bo and 2 years to reach $200/b, if the rise in the past 13 weeks continues for another 104 weeks. Typo in chart Prece should be Price.
Here’s 2022 v 2024
Notice that the rise in 2022 did not continue to $200/b, you do remember what happened in March 2022?
Based on the recent price history of the past 52 weeks, I expect Brent will likely remain in the $70 to $100/b band.
Kengeo,
Using daily data (Jan 2 to April 2) I get about a 4.5% rate of increase every 4 weeks using futures data and for daily spot price data the trend is 4.75%/4 weeks, at this rate Brent would reach $100/b in 16 weeks, just under 4 months. To reach $200 per barrel at that rate (4.75% every 4 weeks) would take 76 weeks or roughly 18 months. It seems unlikely this rate of increase could be sustained for that long a period.
Check 2007-2008 timeframe, it would be most comparable to that should it happen…
Kengeo,
The difference is that the World was producing at capacity in July 2008 when prices peaked. Not so at present, OPEC has been cutting output since 2021 to support oil prices, they have at least 1500 kb/d of output that they could add to World output if they choose to do so. Perhaps they won’t, but there may be a few extra barrels above quota produced as prices approach $95/bo or more.
The chart above is incorrect as I mistakenly used total US horizontal oil rigs instead of just Permian basin horizontal oil rigs. Ignore it. Sorry.
Earlier I posted a chart with rigs and Permian output that was in error, due to incorrect rig count used. A corrected chart below with correct Permian Horizontal rig count. The relationship between rig count shifted forward by 7 months (following Ovi’s idea from his Midland county chart) and Permian output from March 2021 to October 2023 is used to project Permian tight oil output forward to October 2024 using horizontal oil rig count through March 2024 and shifting rig counts forward by 7 months. The model/projection is shown for all months March 2021 to October 2024.
Thanks Dennis, this is a really interesting idea, looking forward to seeing how this model plays out
Stephen,
Probably completions are more important so looking at completions per rig would make more sense and for the past 12 months it has been roughly 1.5 completions per rig on average. The result using my other model is a bit different and probably more accurate if this 1.5 ratio of competions per rig holds true in the future.
Models compared in chart below.
should also consider the different decline rates of legacy wells and productivity changes of new TIL wells.
NOVI posted a picture of US shale oil production, and more than 50% come from wells TIL in last 18 months, showing the huge decline of base legacy wells, as well as the importance of new TIL wells.
In the case of Permian, this link below shows it is ~ 60% coming from new TIL wells in last 18 month.
https://novilabs.com/blog/permian-update-through-july-2023/
Sheng Wu, what is a TIL well?
My model includes new wells and old wells. For Permian tight oil here is model vs Novi data from Jan 2014 to Sept 2023.
TIL is another name for a first flow well, a well that has just started producing.
The model uses a different well profile for 2010-2012 wells (these were fairly similar) and then a 2013, 2014, … , 2019, 2020, and 2021 well profile, I assume based on the data I have that 2022 will be similar to 2020 and after 2022 I assume about 3.65% annual decrease in new well EUR when about 490 wells per month are drilled, the rate of decrease is assumed to increase or decrease at higher or lower completion rates. So changing new well productivity is included in the model. The future rate of decrease is based on the average rate of decrease in normalized (for lateral length) well productivity from 2016 to 2021. This will be adjusted as I get new information.
“Bad Weather?”
I woke up to several inches of snow this morning.
Shorts two days ago.
Wavy Jet stream?
https://www.youtube.com/watch?v=nWUtLoWChFY
3 minutes
Will Venezeula invade Guyana? – No, Venezeula can’t produce offshore oil.
some salt water disposal wells are stopped from January, 2024 in Delaware Basin due to earthquakes.
will this slow down production too?
GoM G&C production through December 2023. I think it unlikely that another peak will be reached, either as an annual or monthly average, but the decline might be fairly gentle for a couple of years at least. Deep water (less than 5000 feet) and shallow (less than 1000) are in decline and ultra-deep production has been making up the difference recently. The largest field, Mars-Ursa, is still maintaining high production but at some point it must go into steeper decline as it is now 27 years since original start up (though the Olympus platform is younger but still ten years from start-up, which is a typical plateau design period). Other large fields like Thunder Horse, Caesar/Tonga/Tahiti and Great White are all over ten years old and have had extensive brownfield additions to keep production close to plateau, but options for more in-fill additions must be getting short now. I have only seen two fairly small plans, for additions at Mad Dog II and Atlantis.
Until 2019 the BOEM issued in-house estimates of field by field reserves. These were supposed to be proven plus probable (i.e. usually representing the expected ultimate recovery), but as about a third of the operating fields have produced more than the estimate of remaining oil since then the numbers were evidently underestimated. The BOEM seems to have stopped this process now.
Most of the production and about 80% of all drilling is in the Mississippi Canyon and Green Canyon areas, and it’s been like that for at least ten years, however several of the new projects due this year and next are in the smaller areas.
I believe the chart above excludes only the shallow water output, so deep and ultra deep output from previous GOM C plus C chart.
The three most recent new build start-ups in the GoM have performed very well (at least after start-up – Argos had a 15 month delay in schedule because of faulty equipment) with Vito and Kings Quay having fast ramp ups and exceeding nameplate for some months.
Some of the tie backs have not done so well. Power Nap was at one time estimated at 100 mmboe reserves but is going to struggle to pass 10 to 12; Shenzi North had expected production of around 17 kbpd but both wells have significantly underperformed and are fading away rapidly in only four months (presumably the operator is looking at remediation); and Taggart ramped up well but water cut has risen quickly and that well too is fading away.
Shenandoah is going to be online in a few months – delayed from end of this year to beginning of next. That is going to add another 80k and do well in the plateauing phase
.
What’s interesting too is that the oil sources that are left have natural decline rates near or even above 10%…like current interest rates…maybe there’s a correlation between the average natural oil decline rate and interest rates? that’d be interesting to sus out…
Thank you Mr. Kaplan, great information! When you say a couple of years do you mean steeper decline starting in 2027 or 2028?
Permian DUC estimate from Novi Labs, click on well status then select DUCs only and adjust period to 2016 to 2023 to get chart shown below.
https://novilabs.com/blog/permian-update-through-july-2023/
In December 2022 the estimate is 3696 DUCs in Permian basin (this includes Work in Progress wells), vs the EIA DPR estimate of 976 DUCs in December 2022, a difference of 2720 DUCs or the Novi estimate is a factor of 3.8 higher than the DPR estimate. In my opinion, it is likely that the Novi Labs data is more accurate as Enno Peters is a data expert, the EIA, not so much.
Interesting comment on Seeking Alpha on the current US POB post.
For example, I own leasehold and mineral interests in an EOG operated project (“Rattlesnake”) in Lea County (26S-33E). Last summer, there were 9 producing “1.3-mile” laterals – 8 in the Wolfcamp A and 1 in the Wolfcamp D. In the fall, they drilled and fracked 7 additional Bone spring “Monster” wells (i.e,4,000- 5,000 boed/+ peak rates) in the W2 of the project area. I’m very happy!
If someone is a Seeking Alpha member, could you contact the author and invite him to post comments/info on POB.
https://seekingalpha.com/article/4681720-bad-weather-drops-us-january-oil-production#comments
Ovi I tried to post a reply, but the comment is being moderated, not sure if it will get thru as I don’t post at seeking alpha.
It would be interesting to know how the original 8 Wolfcamp A wells compare with the newer Bonespring wells. Generally the lower Wolfcamp (C and D) and Avalon formations are not as productive as 2nd and Third Bonespring and Wolfcamp A. The best wells in the Delaware seem to be the Wolfcamp XY which is a layer between the Wolfcamp A and 3rd Bonespring. Maybe these “monster” wells were in the Wolfcamp XY.
I did a quick check on Lea County using Novi Labs and the average well has IP around 2000 boe/d, so these “monster wells” were indeed two times higher than average, though I am not sure what the average lateral length of the average well in the Novi database is. I looked wells starting in 2021 and 2022.
You left out the part where this person claims Lea and Eddy counties are only about 20% developed and nowhere near peak.
I don’t agree with that, but it is a different perspective than we often hear here.
My 2nd comment got thru, but the one with a link to your comment got removed. Not sure he will find us.
Dennis
I tried to look deeper into Mr Nelson but could not link him to any company. However I was able to find a comments list by him and he clearly sees our posts. The attached picture is a comment on your OPEC post. Whether he visits POB directly is not clear.
The link in my comments still works for me. Not sure why it is broken on your computer. In the link below he is forecasting US production to surpass 14,000 kb/d.
https://seekingalpha.com/author/brian-c-nelson/comments
Ovi,
Trying to get people to visit POB doesn’t work at seeking alpha, when it was clear to them that was what I was attempting they removed my comments. Best we can do is respond with a thank you, but they might remove that as well.
EnergyNet has an EOG operated 23 well ORRI for auction. One of the individual wells produced about 100,000 bbl in its first month but was down to 10,000 bbls in just over a year and shut in now. Those high initial ip’s are mostly mirages even with a good operator.
DCLonghorn,
Thanks. From Novi labs Nov 2023 Permian update link below
https://novilabs.com/blog/permian-update-through-july-2023/
These are EOG wells in Lea County with first flow in 2021, 57 wells total in 2nd and 3rd Bonespring, peak monthly output on average was 1677 bo/d in month 2, month 13 (12 months after peak) output was 339 bo/d. For NG peak was 2673 MCF/d and month 13 was 795 MCF/d. In terms of boe peak was 2123 boe and 12 months later it was 472 boe. Chart below is oil only. The horizontal scale for cumulative output is the same as the daily output from top chart (got cut off in screen shot).
A decrease by a factor of 10 in 12 months is unusual based on the data I have seen, wells like those must be offset by other wells that decline by much less as the average seems to be about 4 times less output after 12 months compared to the peak, beyond 12 months the rate of decrease is much slower than the decline in the first year.
Very interesting, thanks Dennis.
I wonder if these are small pockets of high porosity: either naturally occurring or created by the frac.
Kdimitrov,
You’re welcome. I think your guess about small pockets of high porosity may be correct, but as you know I am no expert.
The chart at link below shows 25 individual wells for Wolfcamp XY formation for EOG 2021 first flow wells in Lea county, one well has a peak rate of about 4000 bopd. The average of the 25 wells peak rate is 2138 bopd for month 2. The well with the lowest peak rate in month 2 has about 638 bopd of output in month 2. So a big range of 600 to 4000 bopd for peak production. Typically the distribution is roughly lognormal.
https://public.tableau.com/shared/PSS23JTSS?:toolbar=n&:display_count=n&:origin=viz_share_link&:embed=y
looks like bubble point death really limited the EUR,
a paper from BEG of Texas claiming the normalized EUR in Bakken has not improved since 2007, and I was totally shocked!
https://www.sciencedirect.com/science/article/abs/pii/S0920410521010536
It’s really the physics of PVT.
This Rig report is for the week ending April 5
Baker Hughes has changed their data base and at this point making it more difficult to extract weekly data. Need to study the new format.
– US Hz oil rigs increased by 1 to 457. The rig count continues to hover close to 450 since the beginning of October but appears to be trending into a slow uptrend.
– Permian rigs added 1 to 300 and also have been flat around 295 since October 2023 but also showing signs of a slow uptrend.
– Texas Permian was up 3 to 201 while NM dropped 2 to 99. Eagle Ford added 1 to 48.
– NG Hz rigs were unchanged at 101. (Not shown)
This Frac report is for the week ending April 5
The frac spread count was down 3 to 257 and is down 30 from one year ago.
How high will the Frac count go in 2024? The chart is starting to show signs of a slowing frac spread count heading toward 250.
So oil is set up for a (small) decline this year – the oil production number in this report is constant and still 200 kpd under the December numbers. Drilling and fracking is even to slightly declining, and well quality will go down and not up.
Oil analysts still calculate with a growth this year, but we’re into April and no up still – and these numbers aren’t hinting at a production boom late year.
Russian numbers will go down, too, with all the Ukrainian drone target shooting practice underway. The middle east is still opaque – a big mess there is possible every day.
A lot of good reasons to phase out oil on the long run, but there are no short solutions.
“A lot of good reasons to phase out oil on the long run”
No choice on that…it will happen regardless of of any attempts to avoid it.
Making strong efforts in the short run (starting in 1970) is good practice…
this transition doesn’t happen fast.
This very late and slow transition path that we are now embarked on is great news for those hoping to profiteer on the shortage of energy supply….which explains much so much of the attitudes we see expressed on the topic.
The latest from Mr Shellman on the Permian
https://www.oilystuff.com/single-post/the-hamster-wheel
gas is a lot better,
here is NOVI 2022 US shale gas production, showing ~45% production come from new TIL wells in the last 18 months,
https://novilabs.com/wp-content/uploads/2022/11/image2.jpeg
and if you look only at Appalachians PA, just ~35% total production come from new TIL wells in the last 18 months
for Haynesville, it is almost 60% total production come from new TIL wells in the last 18 months
For those not in the business, TIL well=first flow/ new well.
Mike says something about some believing that tight oil is going to 12 Mb/d, I have made such estimates in the past (I think it was 11 Mb/d actually), but my current thinking is a peak of about 8.9 Mb/d in 2027, could be a bit higher with sustained oil prices over $120/bo in 2023$, but I doubt we see more than 10 Mb/d unless we see future prices at over $150/bo in 2023$ sustained for several years (like the 2010 to 2014 period), even in that case I doubt we hit 11 Mb/d.
yes, unless another Permian or another Bakken plus EF are discovered.
Sheng wu,
Good point, there are other tight oil basins, I have guessed that those (other than Permian, Eagle Ford, ND Bakken/Three Forks, and DJ/Niobrara Basins) will be about 6 Gb in total for my most recent best guess. Probability roughly 100% that this guess will be incorrect. I have been wrong in the past and history is likely to repeat. Most of this oil will be probably be from Anadarko, Powder River, and Uinta Basins, but I have not seen recent USGS estimates for these basins, there will also be some condensate from Marcellus and Utica Basins.
Here is a scenario I did on Jan 6, 2020 (just before pandemic become apparent). The highest scenario I could find was about 11 Mb/d at peak from August 2019 (it was a high scenario intended as an F5 scenario (95% probability in my estimation that output would be less than the scenario), the best guess scenario was about 10 Mb/d at peak and the F95 scenario had a peak around 9 Mb/d.
Dennis – An alternate and more believable story is that tight oil URR is only 58 Gb (not 77).
The 6 year plateau is caused by your overestimation of 19 Gb, based on most recent Rystad estimates, US reserves are:
1P – 36 Gb as of 1/1/2024
2P – 50 Gb as of 1/1/2024
1P and 2P oil reserves would need to be considerably larger to accommodate for near term tight oil production of 20 Gb over the next ~6 years. Based on current production levels and no changes in 1P/2P reserves, we would have the following remaining 1P/2P levels by end of 2030:
1P – 3 Gb as of 1/1/2031
2P – 17 Gb as of 1/1/2031
So for your outcome to be remotely possible, you are looking for ~15% 1P growth annually for the next 5 years…
Please report back when you find the 1P reserve growth….
Kengeo,
TRR resources estimated by the USGS are roughly 110 Gb for mean estimate, my scenario is pretty conservative. Take a look at EIA reports for tight oil proved reserves link below
https://www.eia.gov/naturalgas/crudeoilreserves/
end of 2021 proved= 24 Gb and 2P = 33.4 Gb
end of 2011 proved= 3.6 Gb and 2P= 5 Gb
Let’s say we assumed in 2011 that there would be no growth in tight oil reserves (as you do now for end of 2021). Cumulative production of tight oil was about 2 Gb at the end of 2011, proved reserves were 3.6 Gb, ergo we should have no more than 5.6 Gb of tight oil production at the end of 2021 because reserves do not grow, right?
The 2P to 1P ratio seems to be 50/36=1.39 according to Rystad. So 2P tight oil reserves would be 24 times 1.39 which is 33.4 Gb at the end of 2021, so tight oil URR would be about 54 Gb(33.4 plus 20.7 Gb cumulative output) at the end of 2021 and at the end of 2011 would have been 3.6*1.39+2=7 Gb, so by this calculation the URR increased from 7 Gb to 54 Gb over 10 years, about a 5.4 Gb per year increase in URR. My 78 Gb estimate is 24 Gb higher than 54 Gb so 5 years after 2021 (year end 2026 we might have 5.4*5=27 Gb higher URR than at the end of 2021, that would be 81 Gb.
As always you forget about contingent resources, which have been discovered but just not yet declared as reserves.
For US between 1970 – 2005, the average decline rate was ~2% until the tight oil additions of ~2010. Now a significant portion of tight oil has been produced, leaving somewhere around 20-25 Gb conventional reserves remaining and ~25 Gb of tight oil remaining. This results in roughly 50 Gb remaining and nearly 250 Gb US cumulative production. Based on your evaluation above, 2P should be growing, but it is not:
Rystad 2P:
2022 – 78 Gb
2023 – 55 Gb
*2024 – 50 Gb
Below implies that 2023 global crude discoveries were only 2.5 Gb:
“Exploration results in the conventional space were dismal in 2023. Total non-shale oil and gas discoveries clocked in at 5.7 billion barrels of oil equivalent (boe) last year, with liquids accounting for around 55% of discovered volumes. This signaled the lowest level of conventional discoveries on record in terms of both absolute volumes and reserves replacement, which stood at only 12%. By contrast, the reserves replacement ratio exceeded 100% as recent as 2010 and nearly surpassed 150% in 2006 in the heady days before shale and the Great Financial Crisis.”
Kengeo,
Tight oil is not conventional oil, so the quote on conventional discoveries is beside the point.
A mistake in my previous comment, URR increased by about 47 Gb over 10 years (2011 to 2021) , not 54 Gb as I originally wrote.
At the end of 2021 2P tight oil reserves were about 33 Gb to 40 Gb (the 2P/1P ratio might be as high as 1.7), then we add the cumulative production up to Dec 2021(21 Gb) and we get 54 to 61 Gb of cumulative output plus 2P reserves. So the 77 Gb estimate requires very little reserve growth (between 16 and 23 Gb) over the 2021 to 2041 period, between 0.8 and 1.25 Gb per year on average vs a 4.7 Gb per year average from 2011 to 2021.
From year end 2011 to year end 2021 2P reserves increased for US tight oil from about 5 to 33.4 Gb while in addition 18.7 Gb of tight oil was produced over that 10 year period.
So we have 18.7 Gb cumulative output plus the increase in 2P reserves of 28.4 Gb for a total increase of 47.1 Gb over 10 years. Now we could assume as you do that now we will see no future increase in 2P reserves, but most would view such an assumption as absurd. I am basically assuming that the URR will increase by about 25 Gb from year end 2021 to year end 2041, roughly 1.25 Gb per year on average over 20 years (a rate about 3.8 times slower than from 2011 to 2021.) As in the past this scenario is quite conservative, possibly too conservative especially if oil prices are as high as you expect ($200/bo nominal Brent price by the end of 2024).
Dennis – Thanks, appreciate the effort to reconcile, if in fact there is as much 1P/2P US reserves as you think as well as growth, then I’d say $200 bbl by end of the year is less likely…if on the other hand shale declines at a rate of 10% as modeling indicates, then a very large price movement is assured…
The biggest issue I have is with a 5-6 year long plateau…it doesn’t seem plausible…oil production generally has 2 modes, growth and decline…
Now, if you had US production growing to 14-15 mb/d and then decline, that would seem more realistic.
What’s interesting is that the rig count is now below a long term average of ~600, based on this alone we should expect a drop of at least several % each year until more rigs are added.
Take the Alaskan North Slope as an example (not perfect since shale has much higher natural decline rates), after it’s peak in 1988 at 2 mb/d, peak decline rate was 6% (more recently 3%). The ANS peak was short lived only 1-2 years before 3% decline set in and peaked at 6% five years later. You may also enjoy that ANS production can be approximated very well by a 5th order polynomial (y = 3E-05×5 – 0.0082×4 + 0.6375×3 – 20.014×2 + 198.85x + 1258.6).
For shale, we might expect initial decline of only 4-5% the first couple years and then peak decline 3-4 years later near or even above 10%. This would still result in 36 Gb of tight oil produced by 2050. That would yield a URR of 65 Gb, which I believe is slightly under the amount you expect.
ANS:
Kengeo,
It is very possible that my scenario will be incorrect, it assumes a slight increase in completions in the Permian basin after October 2024 then a constant completion rate for a couple of years followed by a decreasing completion rate. It is impossible to predict the future odds are zero that any scenario that I create would be the correct shape, but I am confident that the area under the output curve will be between 70 and 85 Gb (roughly a 75% confidence interval).
The decline in tight oil will depend on the completion rate, decline is faster when completion rate decreases more quickly.
For the IOCs and large independents, including the three Canadian oil sands producers, share buy backs were slightly down last year but still high.
Dividends showed the normal steady rise.
Long term debt was down slightly.
Costs for oil and gas developments, including acquisitions, were up (the ratio of buy back to costs fell significantly from last year’s high but is still well above other recent years – in the bonkers years of 2012/15, when there was a backlog of profitable projects being developed, it was around 5% compared to 75% last year).
George
Looks like Mexico have another issue this morning.
https://twitter.com/rawsalerts/status/1776787276602708045?t=u5G3lxbVMh1MABD7Guqm4g&s=19
I think Akal (most of Cantarell) now only produces abouy 39 kbpd, but there was a report that this could take off 200 kbpd, so the platform may process oil from other fields are be a key part of oil or gas pipeline systems.
Saudi Aramco Suspends Two Oil Contractors
Aramco has served notices of temporary suspension to two oilfield service contractors, Zawya has reported, citing the companies.
According to one of them, Borr Drilling Limited, the suspension will begin this month and last for a year, the report said. Borr Drilling operates the Arabia I rig in Saudi Arabia and said it would look to move the rig elsewhere for the duration of the suspension.
The other company, Valaris, has also received a suspension for one rig, out of a fleet of 19 that its Saudi subsidiary operates in the kingdom. The contract for the rig was ending at the end of this year, the report noted.
Aramco earlier this year said it had scrapped plans to expand production capacity to 13 million barrels daily. The company said in January that the state had ordered it to stop work on the capacity expansion and keep the maximum sustainable capacity at 12 million bpd.
In February, Aramco’s chief financial officer said that Due to the natural decline in operating fields, as many as 6 million barrels per day of global oil production is being lost every year and needs to be replaced—which was not happening.
Attached is an updated chart for Texas. It uses the Texas RRC data for December and January to project the Texas January output to compare it to the production the EIA reports. The EIA reported Texas production decreased by 288 kb/d in January to 5,361 kb/d. The projection has January production at 5,671 kb/d, 310 kb/d higher than the EIA’s estimate.
It will be interesting to see the EIA’s January revision when they report February production.
Texas oil, gas drilling permits slide by 33pc in March
Calgary, 8 April (Argus) — Texas drilling permits for oil and natural gas fell in March by 33pc from a year earlier on declines across all major producing regions.
There were 669 permits issued in March for drilling oil, drilling gas, or drilling for both oil and gas across the state, according to the Texas Railroad Commission (RRC), down from 999 in the same month last year. Permits ticked higher from the 659 recorded in February.
The year-on-year drop was led by the Midland region, or District 8, where permits fell in March to 328, down by 133 permits from a year earlier, and lower by five compared to February.
Also down from a year earlier were permits issued in the San Angelo region, or District 7C, to the immediate southeast of Midland. The regulator issued 60 permits there in March, lower by 39 from March 2023 but up from 42 permits in February.
https://www.argusmedia.com/pages/NewsBody.aspx?frame=yes&id=2555513&menu=yes
Data can be found at link below from RRC for Texas drilling permits.
https://www.rrc.texas.gov/resource-center/data-visualization/oil-gas-data-visualization/drilling-permits/
Note that March of 2023 was a particularly high month for drilling permits approved at 865 permits, the average permits approved per month in 2023 was 643 with a low of 543 and a high in March at 865. In March 2024 there were 674 permits approved and the average permits approved in the last 12 months has been 638 permits per month.
Not sure where Argus is getting its data for March 2023, but it is different from what the RRC website says (865 permits not 999 permits for March 2023).
Dennis
I was able to check District 8 and I got 499 permits vs the 328 that Argus is reporting. However there are so many boxes to check that I am not sure that the 499 are new permits.
When I use your source, it gives me 47 permits for Midland. When I use the source below, it gives me 65 permits for horizontal permits. Not sure which boxes to check.
http://webapps.rrc.texas.gov/DP/initializePublicQueryAction.do
Hi Ovi,
Your link is better because we can focus on Horizontal wells.
For all of Texas I get 795 horizontal well permits approved in March 2023 and 622 horizonatal well permits in March 2024 using the link you provided. I have status= “approved”, and wellbore profile= “Horizontal” and well type= “Oil or gas well”. For district 8 (Permian core in Texas) I get 460 horizontal oil and gas wells approved in March 2023 and 390 drilling permits for horizontal oila nd gas wells approved in March 2024.
Alister Hamilton –
Depletion and Thermodynamic modeling;
https://www.reddit.com/r/peakoil/s/fg71PwA2Vx
YouTube: https://youtu.be/r79rxfOFJJY?si=Z3n9AXE10oTQSNn_
This seems to rely on the Hills Group study/Louis Arnoux work doesn’t it?
Thank you for this hint. I did not know that Alister is still active. I will try to recontact him.
https://www.reuters.com/business/energy/russia-seeks-gasoline-kazakhstan-case-shortages-sources-say-2024-04-08/
Russia asks Kazakhstan to create a gasoline reserves for Russia in case of shortages.
https://oilprice.com/Energy/Energy-General/Low-Natural-Gas-Prices-Curb-US-Oil-Production-Gains.html
“Since March, the spot natural gas prices at the Waha hub in West Texas, in the Permian, have turned negative several times, sinking to as low as -$1.16 per MMBtu on March 18, per EIA data.”
NOW,WAHA PRICE IS NEGATIVE $2.1
GOR MUST TOP THE ROOF NOW IN PERMIAN
Mexico Set to Slash Oil Exports by Over 300,000 Bpd in May
The volume to be cut represents a third of the total that Mexico sells abroad, Reuters noted in a report, which also said 330,000 bpd is the minimum that will get redirected from overseas market to local refineries.
The reduction in exports was necessary because Pemex’s output has been on a steady decline due to natural depletion and not enough new discoveries. In February, the daily average fell to the lowest in 45 years, Reuters said in its report.
Good article featuring Mike.
https://pboilandgasmagazine.com/too-much-too-fast/
An updated December World Oil Production report has been posted.
https://peakoilbarrel.com/december-world-oil-production-at-post-pandemic-high/
A new Open Thread Non-Petroleum has been posted.
https://peakoilbarrel.com/open-thread-non-petroleum-april-9-2024/
Rig Count for the week ending April 12
US Hz oil rigs dropped by 2 to 455. The rig count continues to hover close to 450 since the beginning of October.
– Permian rigs decreased by 1 to 299 and also have been flat around 298 since October 2023.
– Texas Permian was down 2 to 199 while NM was up 1 to 100. In New Mexico, Lea county was flat at 46 while Eddy added 1 to 54. Eddy county rigs have stabilized at the 55 level over the last few weeks,
– Eagle Ford dropped 1 to 47.
– NG Hz rigs dropped 1 to 98. (Not shown).
Frac report is for the week ending April 12.
The frac spread count was down 5 to 252 and is down 31 from one year ago. The frac chart is starting to show a slow declining trend in the frac spread count and could drop below 250 in the next couple of weeks.