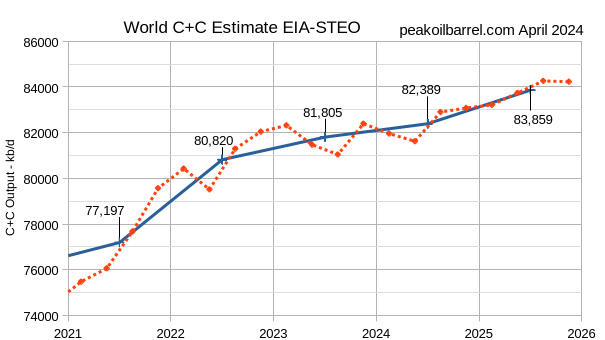
The EIA STEO was published recently the estimate below is based on data from that report and statistics from the EIA International Energy Statistics. The EIA expects the 2018 peak for annual average World C+C output will be surpassed in 2025.
A number of charts have been pulled from the STEO report and are presented below.
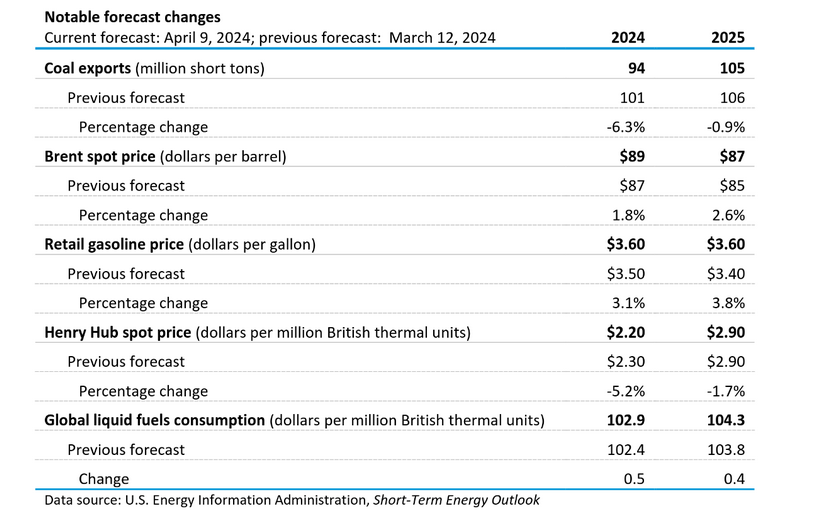
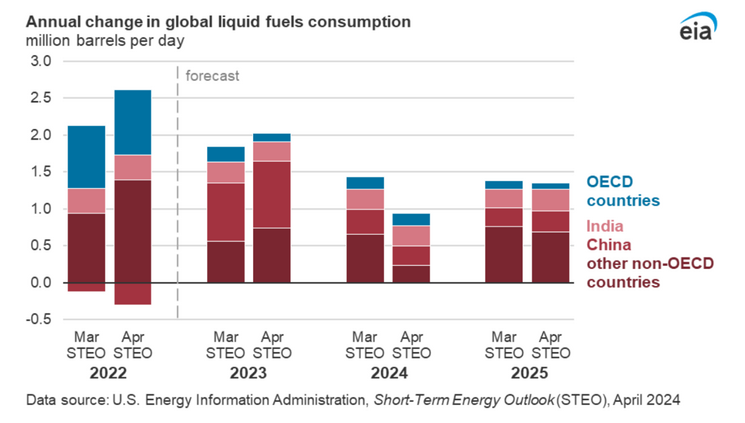
This month the EIA revised the 2022 global liquid fuels consumption data available in the International Energy Statistics, increasing the assessment of global oil consumption that year by nearly 0.8 million barrels per day (b/d) compared to last month’s STEO. The historic data serves as a baseline for the short-term forecasts, affecting the view of energy markets this year and next. This month’s revision to historic data, as well as current market dynamics, led to an increase of the forecasts for global oil consumption in 2024 and 2025 between 0.4 million b/d and 0.5 million b/d in both years.
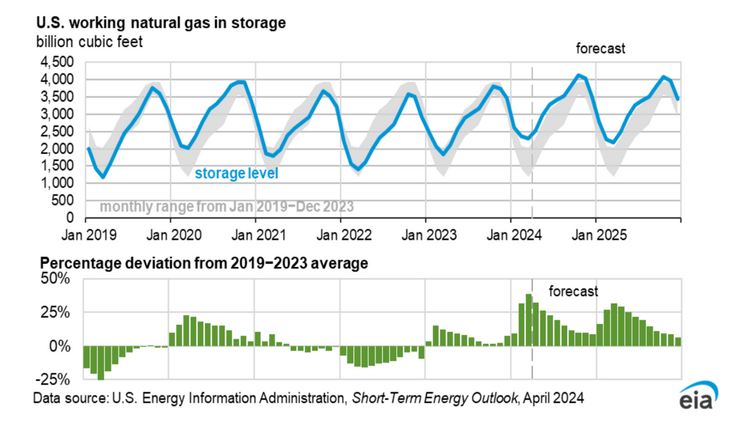
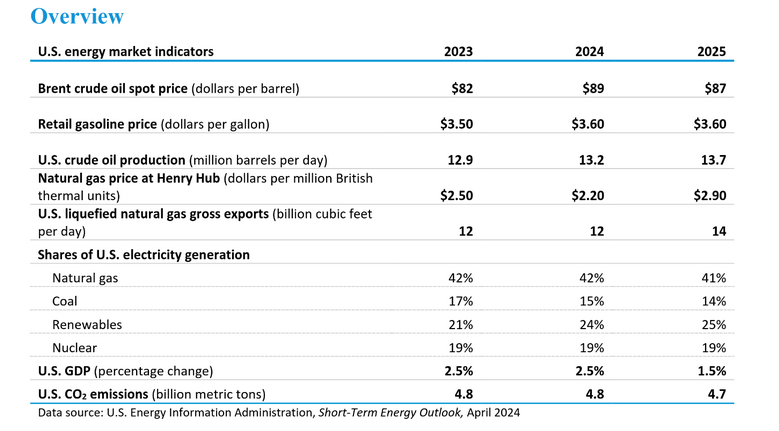
Working natural gas in storage is forecast to be significantly above the 5 year average in 2024 and 2025 which may lead to relatively low natural gas prices in the US.
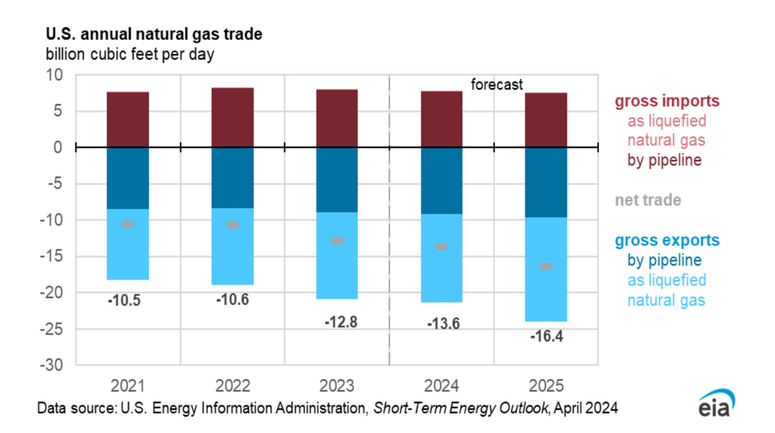
Note the large increase in net exports of natural gas from 2021 to 2025 roughly a 60% increase over 4 years with most of this increase from liquified natural gas (LNG) exports.
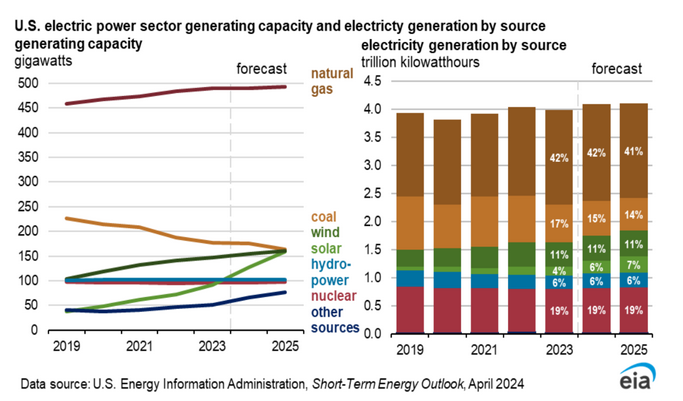
The electricity generation chart on the right is more important in my view. Note that the increase in solar power output from 4 to 7% allows a reduction in coal power use from 17% to 14% over the 2023 to 2025 period.
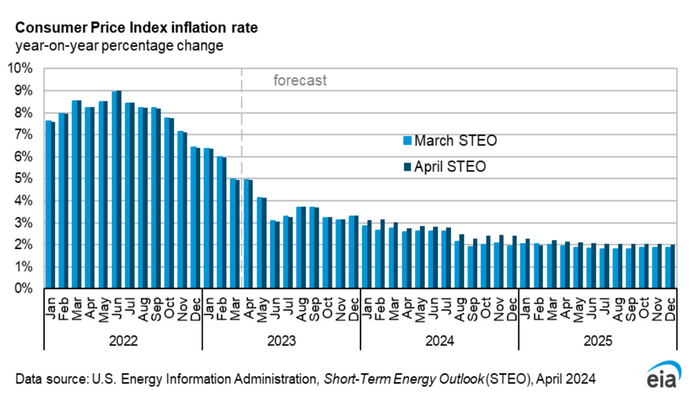
The EIA expects Inflation to reach the 2% target in late 2024.
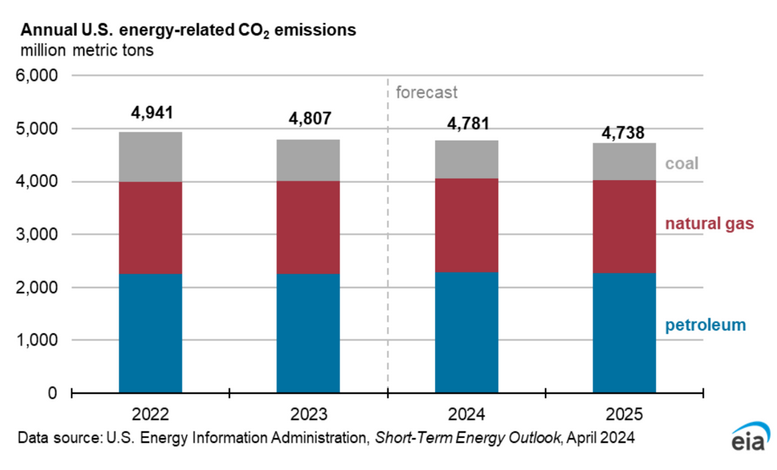
Most of the carbon emissions from the US are petroleum and natural gas emissions (over 80%).
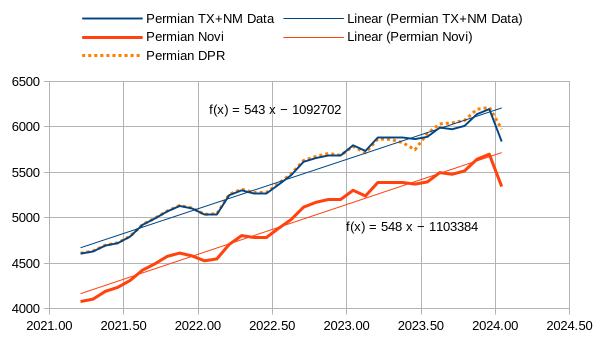
The state oil output estimate for Texas and New Mexico in the Permian region matches the Drilling Productivity Report (DPR) closely through March 2023, note that ths includes both tight and conventional oil. The Permian Novilabs estimate uses Novilabs Permian tight oil output through December 2022, the difference between state data and Novilabs data from Jan to December 2022 averaged 496 kb/d, the estimate from Jan 2023 to Jan 2024 assumes conventional output is 496 kb/d (unchanged from previous 12 months). The trends for Permian regional output and Permian tight oil output are very similar from March 2021 to Jan 2024 at about 545 kb/d per year.
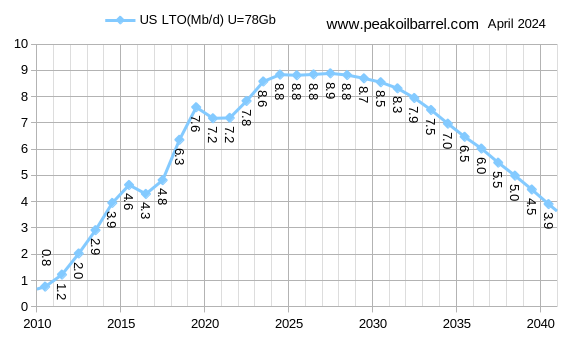
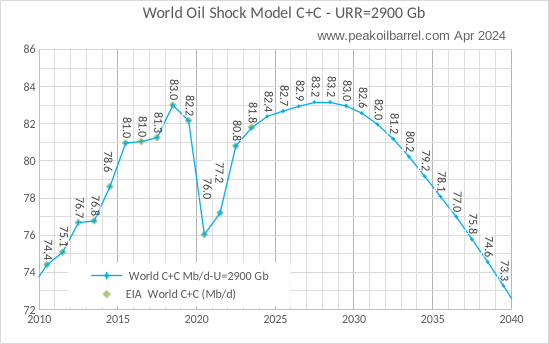
My most recent estimates for US tight oil (LTO) and World C+C output, the EIA STEO has World C+C at about 83.9 Mb/d in 2025, my model has output peaking in 2027 and 2028 at about 700 kb/d less (83.2 Mb/d). Output falls to about the 2010 level of output by 2038 in this scenario with World C+C output falling by about 10 Mb/d from 2029 to 2039.
81 responses to “Short Term Energy Outlook, April 2024”
Thanks Dennis – so regardless of peak in ~2016 or ~2026, between now and 2040 you see annual decline of only 0.65 mb/d, is that correct? I think you are a high functioning eternal optimist!
Kengeo,
The last point on the chart is 2039, In 2023 output was 81.8 Mb/d and in 2039 the scenario has output at 73.3, so a decrease of 8.5 Mb/d over 16 years, if we assumed a straight line decline (which I think will be incorrect) that would be 0.53 Mb/d per year. Alternatively my expectation is that output will be about the 2023 level in 2032 (82 Mb/d) and will fall by about 8.7 Mb/d over 8 years which is 1.09 Mb/d per year over that 2032 to 2039 period.
I am not as optimistic as the EIA which in their International Energy Outlook 2023 has World C plus C at 84.8 Mb/d in 2039.
https://www.eia.gov/outlooks/aeo/data/browser/#/?id=24-IEO2023®ion=0-0&cases=Reference&start=2020&end=2050&f=A&linechart=Reference-d230822.30-24-IEO2023&ctype=linechart&sourcekey=0
Well, Dennis, I would never compare you to the EIA…that would be too harsh!
Kengeo,
Here is a projection by McKinsey
https://www.mckinsey.com/industries/oil-and-gas/our-insights/global-energy-perspective-2023-oil-outlook
If we assume Crude plus condensate remains about 80% of total liquids (it may in fact be less than this by 2039), then the “current trajectory” scenario is fairly close to my scenario though 2039, this scenario is roughly 90 Mb/d for total liquids in 2039, my scenario for C plus C is about 73.3 which is about 81% so my scenario might be a bit high as the long term trend points to about 79% C plus C to total liquids ration in 2039 which suggests about 71.1 Mb/d C plus C in 2039 for the Mckinsey current trajectory scenario.
Thanks Dennis – Where would you project 2024 and 2025 to fall on this figure? Seems there’s been some large drops in production/capacity that will not come back and are not likely to be replaced. Other than the 1.5 degree trajectory, I don’t see those other scenarios as being very realistic. The shale oil miracle could unwind very quickly between now and 2028. What’s interesting is that for all scenarios they see a fairly steady downtrend, regardless of scenario, the average centered peak is in the past, wouldn’t you agree?
Kengeo,
These are demand scenarios and the current trajectory scenario seems reasonable to me and is fairly close to the scenario I presented in the post, the output in 2024/2025 is in the 82.2 to 82.7 Mb/d range with peak in 2027/2028 at 83.2 Mb/d for World C plus C output.
Global Oil Production Dropped by 1.2 Million Bpd in February
The world’s crude oil production fell by 1.2 million barrels per day (bpd) in February compared to the same month last year as steep output declines in Saudi Arabia and Iraq were partially offset by a large annual production gain in the United States, the latest data by the Joint Organizations Data Initiative (JODI) showed on Wednesday.
Compared to January 2024, global crude oil production jumped by 473,000 bpd in February as U.S. oil production rebounded following shut-ins due to bad weather in January, according to the JODI data shared by the Riyadh-based International Energy Forum (IEF).
Year-over-year, crude oil production in Saudi Arabia plunged by as much as 1.4 million bpd, the data showed.
The Kingdom has been implementing an extra voluntary cut of 1 million bpd since July 2023 to help the OPEC+ group’s efforts to “stabilize the oil market.”
Saudi Arabia’s crude production rose by 55,000 bpd month-on-month in February—to a seven-month high of 9.01 million bpd, according to the JODI data.
The Saudis have pledged to keep their crude production at “about 9 million bpd” until the end of June 2024. So far, the Kingdom has been keeping its pledge and hasn’t produced above its self-imposed quota under the OPEC+ deal.
Meanwhile, Saudi Arabia’s crude oil exports rose by 20,000 bpd from January to 6.32 million bpd in February. This was a three-month high in Saudi exports, the data showed.
Another large annual production decline was registered in Iraq, where crude oil output fell by 347,000 bpd, per the JODI data which compiles self-reported figures from the individual countries.
Ron,
Jodi data is not very good. The April OPEC MOMR has 2024Q1 World liquids output about 700 kb/d higher than 2023Q4. That is the best data I can find on oil supply beyond December C plus C data from the EIA, note that OPEC has a lower estimate of World total liquids for 2023Q4 than the EIA (nearly 1600 kb/d lower), so there are data differences between OPEC and the EIA, not clear which is correct.
Dennis, I am well aware that the JODI is not very good. They rely entirely on “self reporting” for their data. However, their data is C+C. I don’t pay any attention to total liquids anymore. So we will just have to wait a few months to get the real data, but I think the trend will be turning down.
Ron,
Perhaps. Eventually it will.
Great job Dennis!
Thank you Andre.
Really good article, but do you really believe:
” Note that the increase in solar power output from 4 to 7% allows a reduction in coal power use from 17% to 14% over the 2023 to 2025 period.”
Considering, that we still don’t have the technical means to store electricity at such quantities, I doubt that we can do a 1-1 assumption
Daniel
Daniel,
7% is a very small amount of total electricity output, and this is the EIA’s projection, their are nations whose total solar power consumption is higher than this, Spain for example had 11.5% of electricity generation from solar in 2022. If you look at the chart in the post this is what the EIA expects and historically their forecasts for solar power growth have been very conservative.
Net oil forecast question. Has anyone seen historical and forecast data that applies EROI assumptions to the total production? With Canada heavy crude pushing 5mb, deep water from Norway/US and others a significant portion, and tight oil a very significant portion I wonder how much is actually available to society. I have been scratching around, reading various studies but have not found data and forecast presented in this way. I suspect that on that basis we have actually passed peak in the sense that is truly meaningful to civilization, and that it will also influence the net decline rates due to Canada’s position in the mix. Any leads anyone has for this info would be appreciated. Thank you.
Tom,
JT posted the paper below back in February, you might have already seen it (it is now over 2 years old) not sure if there is any newer research.
https://www.sciencedirect.com/science/article/abs/pii/S0306261921011673
This paper seems to roughly agree that 2018 was the net energy peak, but seems to suggest we may come close to the 2018 level in roughly 2028 on a net energy basis for total liquids production. It also looks like net energy from all liquids declines at about 3.5% per year from 2030 to 2040 (from chart I read 65 Mboe/d in 2030 and about 50 Mboe/d in 2040, and assume exponential decline over those 10 years).
Great summary Dennis…thanks for the work!
Tom, always appreciate your comments.
As oil depletes I assume that oil price will go up as long as it can be afforded, and the higher price will stimulate some prolonged/more production.
At some point along the depletion path if the price becomes unaffordable, for whatever reason, then more of the low EROEI oil will be left in the ground.
Likely this will pan out with an extreme overlay constraint of geographic/geopolitical variability. Whats available for purchase in one country will differ from what is available for purchase in another country, in a much more extreme divergence than what is the situation today.
Also note that the excellent chart reposted by Dennis portrays a peak plateau of net liquids energy currently, but consider that the population is rising and therefore net liquids energy per capita has been falling for roughly the last decade.
Thanks Hickory. I agree Tom’s insight is invaluable.
Thank you Dennis,
I have not seen this study and it is quite informative. Paired with natural gas production I think we will kick the can down the road for another 15 years, while a larger wind and solar base can likely be put in place. Climate will be a wild card. As industrial production begins to hit limits I see inflationary pressures and unemployment rising. Immigration, homelessness are early signs of economic/population/environmental stress. We have a shot at pulling off a softer landing (not one that is sustainable!!) , but I don’t think we have the political and social will to do so, at least not with current policies. I suspect we will likely use all the production represented in the graph, So 2 degrees will be in the rearview mirror. Interesting times…… as we muddle through.
Hickory,
Yes I was going to per capita net energy next in my thinking too. I have always wondered if the evolution of democracy was partially a function of an expanding economic pie (expanding net energy) and how a shrinking pie would affect it. I think there are large swaths of rural America that have seen the results of shrinking per capita energy, I see it in Maine where I live. A lot of people feel they have been left behind, but I also believe that the reasons for this are very unclear to them. They have become gullible to the deceit that runs rampant in our media today. This has not been a useful trend to help solve the very real problems we face, so seems to be the nature of humans, we are not well evolved for complexity!
We’re near Sebago Lake here. The last hay field in our “downtown” area is succumbing to “developement,” Tractor Supply, so the rumor goes.
Another honorary Mainer–Daniel Dennett–died yesterday.
A bitter irony that a new farm supply store would be built on the last hayfield.
Holy shit. That’s two of the Four Horsemen of the New Atheism gone now. Sucks.
Daniel Dennett–died yesterday.
A interesting thinker, who I encountered several times.
It can’t be that long for me.
He was four years younger than me. Damn! It can’t be long for me either. A note of interest, I am writing a book and just added this to it today:
“In the Forward of Russell Targ’s book, “The Reality of ESP,” Stephan A. Schwartz writes:
Along with Ed May, I once debated with Daniel Dennett, a prominent critic of ESP research, at an event produced by ABC News for station sews staffs and station managers. We debated for about thirty minutes with Dennett making dismissive and disparaging remarks to anything Ed or I said, but always generalities. Finally, I said to him: “Let’s pick an experiment we both know, and you tell me what is wrong with it, and I will respond.” Without a moment’s hesitation he shot back in the most deliberated condescending act I have ever witnessed, saying, “You don’t think I actually read this stuff, do you?” There was a moment’s silence, then as chuckles, and finally, as guffaws. It suddenly dawned of Dennett what he had said. He blushed and sat down and left as soon as he could.”
I suppose that you are correct in seeing a link between the viability of democracy and prosperity (stable or rising energy/capita).
In a scenario of contraction one of the first victims may be democracy, and with it the luxury of a civil society with generous individual rights and protections.
I think many people delude themselves when they think that an authoritarian governance might be in their favor. Russian roulette on that.
Tom
I think the more important question is cash returned over cash invested, CROCI. While EROEI could go negative, the only thing that matters to a producer is CROCI. A good example is the oil sands. SAGD uses a lot of NG to generate steam.
Let’s assume it takes one BOE of NG (6000 ft^3) to produce one barrel of syncrude. At $2.50 per 1000 ft^3, that’ s $15 input cost. Syncrude is $85/b. There is $70 to cover a lot of other expenses.
For mining operations, the cokers took on average 1000 ft^3 of NG to produce one barrel syncrude. Diesel was also used by the trucks.that hauled the mined oil sands,
Both CNQ and SU NYSE are major Canadian producers of syncrude and WCS and are rolling in free cash flow, paying down debt and increasing their dividends.
Thank you OVI.
That is quite interesting. I am studying the balance sheets of CNQ and SU. The relative scarcity/cost of FF types and the demand for energy dense liquid fuels and how it skews allocation and resource flows. So the upshot here is that a dollar is a poor proxy for a given number of BTu’s. Natural gas at around $8/ billion BTU and diesel around $23/biliion BTU according to one study.
Suncor (SU) looks very nice with P/E under 10, 4.3% Div., Low debt/equity, be nice to pick up at $32.50. Trading natural gas for sand tar is horrible for the planet, but it seems like these guys can do it more profitably than I would have imagined. We are so fucked! Eye opening.
Same concept applies to regular oil producers that use coal generated electricity to power their operations.
Tom,
Eventually demand for oil may fall so that the oil price falls below a profitable level for oil sands, also natural gas may peak in 5 years or so in which case the price would rise also hurting oil sands profits.
In short I don’t think oil sands will be profitable long term, by 2035 we are likely to see output declining.
Rig Count for the week ending April 19
US Hz oil rigs increased by 4 to 459. The rig count is showing signs of slowly increasing. The last time the count was at 459 was September 15, 2023.
– Permian rigs rose by 4 to 303 and are also showing signs of slowly increasing.
– Texas Permian rose by 4 to 203 while NM was unchanged at 100. In New Mexico, Lea County added 2 to 48 while Eddy dropped 2 to 52.
– Eagle Ford was unchanged at 47.
– NG Hz rigs dropped 3 to 95. (Not shown).
Frac report for the week ending April 19.
The frac spread count rose by 8 to 260 and is down 30 from one year ago. The Weekly Frac spread count continues to bounce between 250 and 275.
Attached is a presentation by Baytex energy on their EF operation.
There are nuggets in here that the EF experts might pick out.
What caught my eye was a pressure profile map they presented. On the left the picture shows 4000 psi in the blue area while on the right red area the pressure is 11,500 psi. Quite a difference over roughly 30 miles. On the left is crude while on the right they show condensate. In the presentation there is a GOR map to the right of the attached picture.
The other thing they mention is that they are looking at refracs. I assume these are older wells using newer techniques, i.e. more propant and sand.
https://www.baytexenergy.com/content/uploads/2024/04/24-04-Baytex-Eagle-Ford-Presentation.pdf
Mike knows this company and has commented on the refracs on his website. Checkout what he has to say about refracs.
https://www.oilystuff.com/forumstuff/forum-stuff/swapping-dollars
OVI,
EF is the real first shale oil basin among the current majors, i.e. Bakken,Permian among other smaller basins like DJ, Woodford/Anadarko and Uinta.
But looking at the Baytex report, it seems that they are intentionally missing out the high shale (rock) and higher TOC part, i.e. the upper part of lower EF, which is also quite thick (~80ft) in the high pressure part of Baytex.
The other observation is the direction of the laterals are all pointing to the highest gradient or fastest changing GOR. This could cause the lateral to see quite different GORs along the gradient, and when producing the PVT phase separation will kick in and cause different part of the lateral to behave differently. This gradient in the volatile/condensate(3~20MCF/bbl)/wet(>20MCF/bbl) gas part is almost 10X faster than the average gradient (0.5MCF/bbl) over 30miles along the pressure plot above. Around the refrac well, the gradient could be as high as 2~5MCF/bbl /mile. This is the GOR part (5~25MCF/bbl) where PVT separation is most severe, and the production in the well-bore will easily see pressure drop below the PVT phase separation pressure and causing interference among different production GOR stages of the lateral.
Similar thing happened for Repsol just south east of the core of EF and locate right next to Baytex in DeWitt, which see the GOR shoot up real fast after production, while the oil recovery dropped to 1/2~1/3 of the neighboring core.
Sheng Wu
Thanks for that very informative information. From what you are saying, it seems to indicate that the acreage they have is closer to Tier 2 quality wells. Probably not a good investment. Raises the question, “Why did they buy it?”. Another classic case of who was smarter, the buyer or seller?
Ovi,
Lower EF will ultimately pay off I think. Circa 2027-28 gas will be >$5 I think. Marcellus/Haynesville will be peaking at a time when massive new LNG infra will be all built-out.
Peak Oil in 2019? Exploring Multiple Lines of Evidence and AI Insights
First off, a big thank you to everyone, especially Dennis, Ovi, and Ron, for entertaining my persistent inquiries. I’m particularly grateful for the insightful discussions and the diligent contributions made by many of you here. Based on these conversations, and with the help of AI analysis, I’ve developed a hypothesis: peak oil occurred in 2019, and we should anticipate an approximate 6% annual decline rate in oil production over the next 5-10 years, if not longer.
To explore this hypothesis, I employed AI as a tool for questioning, discussion, and analysis. Here are 20 key points, derived from discussions with ChatGPT 4.0, supporting the notion that 2019 marked the peak year of global oil production:
1. 2019 Production Levels: There were exceptionally high production levels in 2019, prior to the pandemic-induced decline.
2. COVID-19 Impact: The pandemic drastically reduced demand and production in 2020, resulting in a significant drop from the highs of 2019.
3. Slow Recovery Post-Pandemic: Global production has been recovering but hasn’t consistently surpassed the levels seen in 2019.
4. Technological Advancements: The maturation of extraction technologies may limit significant future increases in production efficiency.
5. Economic Viability: The economics of extracting harder-to-reach oil have been compromised by lower oil prices since 2014 and again after 2020.
6. Shift Towards Renewables: There is accelerating investment in renewable energy sources, reducing dependency on oil.
7. Government Policies: Stronger global environmental policies are advocating for a reduction in fossil fuel usage.
8. Energy Transition Dynamics: The global energy market is increasingly shifting towards non-oil energy sources due to climate change mitigation efforts.
9. Electric Vehicle (EV) Adoption: The rapid growth of the EV market is significantly cutting into oil demand, especially for transportation.
10. Societal Shifts: There is a growing consumer preference for sustainability and energy efficiency.
11. Overstated Reserves: Concerns exist that some countries may have overstated their oil reserves, suggesting potentially less available oil than reported.
12. Geopolitical Tensions: Persistent geopolitical issues in key oil-producing regions can disrupt supply and impact long-term production capabilities.
13. Investment Shifts: The divestment from fossil fuels by major funds and governments is reducing capital available for oil exploration and production.
14. Technological Limits: Existing fields may be reaching technological limits, making it challenging to offset natural decline rates.
15. Lack of Major New Discoveries: There has been a decline in the rate of significant new oil discoveries, indicating that future production may not keep up with demand.
16. Market Dynamics: Volatility in oil markets, driven by uncertainties over long-term demand, affects investment in new production.
17. Regulatory Pressures: There are increasing regulatory pressures to curb carbon emissions, affecting oil production logistics and locations.
18. Supply Chain Constraints: Economic and political factors are causing challenges in the global supply chain, potentially impeding production efforts.
19. Carbon Neutral Goals: The ambitious carbon-neutral goals set by numerous countries and companies could significantly diminish long-term oil demand.
20. Global Economic Shifts: As global economies evolve, there may be a shift away from oil-driven energy policies towards more diverse energy portfolios.
Additionally, I had AIs debate these points, resulting in a fascinating discussion. The outcome, a hypothetical 60% likelihood favoring the Pro-Peak Oil AI versus a 40% for the Anti-Peak Oil AI, suggests that changing any number of factors could influence the debate’s direction.
PS – Dennis, I win…j/k debate continues…
Added Plateau to the discussion:
Let’s imagine three AIs representing each scenario—2019 Peak Oil Scenario, the Bumpy Road, and Continued Production Growth—debating their respective positions:
AI for 2019 Peak Oil Scenario (AI-Peak): AI-Peak argues that global oil production peaked in 2019 and is now on a downward trajectory or plateau. It presents evidence such as recent production data showing a lack of sustained growth since 2019, depletion of existing reserves, and slowing investment in new exploration projects. AI-Peak emphasizes the importance of considering factors such as geopolitical tensions, technological limits, and shifts towards renewable energy sources in shaping the trajectory of oil production.
AI for the Bumpy Road (AI-Bumpy): AI-Bumpy contends that global oil production is experiencing a plateau followed by a period of declining production, with fluctuations along the way. It highlights factors such as technological advancements enabling continued production from existing fields, market dynamics influencing investment decisions, and geopolitical events affecting supply chains. AI-Bumpy argues that while production may not be growing as rapidly as in the past, it is not yet in a sustained decline and may experience ups and downs before declining further.
AI for Continued Production Growth (AI-Growth): AI-Growth asserts that global oil production continues to grow steadily, driven by ongoing investment, technological advancements, and sustained demand. It presents evidence such as recent production data showing continued increases in output, new discoveries and reserve additions, and robust investment in exploration and development projects. AI-Growth argues that while challenges exist, such as environmental concerns and energy transition efforts, the fundamentals of oil production remain strong, supporting continued growth.
Great summary Kengeo, thanks for putting this together!
No problem, had to share the fascinating world of AI, it’s a (un)natural evolution of the internet from ~25 years ago…exciting times
Kengeo,
We both agree that oil output will peak, we simply disagree on the timing. My scenario is essentially a bumpy plateau from 2015 to 2032 with World C plus C output between 80.8 and 83.2 Mb/d (with the exception of the pandemic affected years of 2020 and 2021). Also AI just sifts what it finds on the internet, it is not particularly reliable information as the AI has no way to assess what information it finds on the internet is credible.
Dennis, it’s great to question how AI technologies work. Engaging with it directly can help you build a better understanding of its capabilities. Think of it like Tesla’s Autopilot: while the system enhances driving, it requires the driver’s responsible use to ensure safety. Similarly, using AI effectively depends on how you interact with it and apply its outputs.
AI (especially advanced models like ChatGPT 4.0), isn’t simply browsing the internet to gather information. Instead, it’s trained on extensive datasets ranging from books, scientific articles, and reputable websites that have been carefully curated by experts. This training involves understanding patterns, relationships, and factual content.
While AI has mechanisms to assess and prioritize information based on the reliability of sources and the requested context, it is not perfect and can certainly make errors (that’s where the humans can help/enhance AI). The reliability of AI significantly hinges on the quality and diversity of its training data. As powerful as AI can be in accessing and synthesizing information, it’s crucial for users to apply critical thinking and validate AI-provided information with credible sources. This combination of AI assistance and human judgment can significantly enhance the reliability and usefulness of the information obtained.
If you haven’t already, suggest you spend some time with ChatGPT 3.5 or 4.0, it’s amazing how it can synthesize/process data in real time making graphs and figures on the fly. As an example, the following text was entered and the following graph was quickly output: “Could you make a quick figure showing historical global oil production, using a different color line, could you project future decline rate of 6% annually?”:
Kengeo,
That is not all that impressive as it is quite easy to produce such a chart, assuming a decline begins in 2024 does not jibe with what the EIA, OPEC or the IEA project along with almost all major oil companies and many energy consultants such as McKinsey, Rystad, etc.
I have only interacted with ChatGPT3.5, it just gives generalities. I have not been willing to fork out money for these tools.
I have seen research suggesting a 6% decline, but note this is under a scenario where new development ceases, does that seem a realistic scenario over the next 10 years or so? We might see such a scenario around 2045 or so, in the mean time at the World level 2 to 3% decline after 2035 makes sense, with perhaps 1 to 2% decline from 2034 to 2045.
It is possible ChatGPT4.0 is better, I haven’t tried that.
Generative AI is a stochastic parrot. It’s literally less than useless since you can’t vouch for the output.
Absolute garbage product as the last Hail Mary for the tech industry and so stocks.
Well put sir.
AI can’t really do any worse than us humans, right? I’m not sure I buy your take on it though
A “stochastic parrot”: AI doesn’t copy without understanding, like a parrot. It translates languages, suggests what video to watch next, or even predicts the text you are trying to type. It’s not just about understanding; it’s about being useful in practical ways. Plus, scientists are advancing AI making it smarter and more aware of context.
AI being “less than useless” because you can’t trust its answers: true that it isn’t perfect and can make mistakes, but that doesn’t make it useless. In many cases, outputs are meant to be checked by humans, especially when helping doctors read X-rays. Improving AI is critical so it gets better and safer over time.
Calling AI “absolute garbage” and a desperate move by tech companies: investing in AI isn’t a last resort; it’s future technology that could change everything for the better. AI isn’t just about making money; it’s about creating tools that can solve big problems, like fighting climate change or making new medical breakthroughs. A lot of smart people believe there is huge potential to make our world better.
So it’s a lookup algo and spellcheck. Colour me unimpressed.
The LLMs that are so revered in the industry are simply token based autocompletes. That’s all it is.
Look at AI art and music and you’ll also see that, again, it is merely an illusion by putting things it has devoured online into a blender and regurgitating pap with no understanding.
Anyone who has used GPT4, Gemini, Copilot etc. Will see easily enough. It’s not novel and it’s not useful outside of doing things that Siri was doing (badly) in 2011.
And actually it can do worse than humans. A LOT worse. Have a look at the papers regarding hallucination factors in LLMs when it comes to anything but the most brain dead answer you can get by just googling a thing.
Ask Air Canada or the NYC local government how well their AI chat bots worked.
We heard all this in the ‘50s with top down programming engines. It failed. We had it again in the ‘80s with expert systems. It failed.
We’re getting it again to juice tech stocks after the misery of crypto and the metaverse failed. And like 3D cinema, it will once again fail and disappear. I say this as a long time sci-fi fan who also had a paid OpenAI account when ChatGPT dropped. It’s grift, all of it.
Kengeo, thanks for the hypothesis.
However, my opinion….. what AI can’t do with any great reliability is predict future spontaneous human creativity to improve and expand production. AI is really only reliable at imaging current trends based on the past but is very poor at predicting future trend change due to innovation. A 6% annual decline would send the world into instant panic mode and that’s not likely to happen in reality as humans will innovate and adapt to avoid pain.
New report out with demand projections
‘Global EV Outlook 2024- Moving towards increased affordability’
IEA projects (under one scenario) –
“The rapid uptake of EVs of all types – cars, vans, trucks, buses and two/three-wheelers – avoids 6 million barrels per day (mb/d) of oil demand in the Stated Policies Scenario in 2030, and over 10 mb/d in 2035.”
A few comments
-I don’t consider that ‘rapid’, rather it is the slow path/weak effort scenario
-if oil depletes rapidly like some here think, or there is geopolitical disruptions of supply to certain areas, or the price of refined products get too high,
then the pace of EV buildout will be quicker, of course
https://www.iea.org/reports/global-ev-outlook-2024
EVs are a bust. The people that went all in on them are those that are either not car people (e.g. Tesla owners), already have a backup ICE or two, or live in areas with good and maintained charging facilities.
So, not most people. Everyone I know with an EV has had the “great car, but…” conversation with me, from the MG SUV owning cousin to the VW ID.3 and BMW I4 owning engineers I work with.
Anyone expecting EVs to save oil consumption for something else is on another planet.
Lol same bullshit different year. “EV sales are only 1%, EV sales are only 5%, EV sales are only 10%…”
Now it’s EV sales are only 20% it will never happen
https://electrek.co/2024/04/22/global-ev-sales-are-robust-more-than-1-in-5-cars-sold-in-2024-will-be-electric/
What don’t you understand about the appeal of a vehicle that is 4-5 times as efficient, much quieter, much faster, and much less maintenance than existing ICE cars? I wonder if you’ve ever even been in an EV. You’re like these same ignorant dumbasses who pull up next me to me in their huge loud trucks and are flabbergasted when I leave them in the dust.
Can’t make the idiots happy:
It’s
“See how expensive EVs are, no one can ever afford them”
or
“EVs are failing, too cheap company’s aren’t making any $”
Pure EV sale is falling, not increasing, at the moment in Germany here. The tax credits are over, and all enthusiasts already have one. Now it’s the hard way to convince people that just want a car – and here the price is simply still too high, and the infrastructure too bad.
Most people rent here and don’t have an own car port where you just can plug them on when you come home. So these people rely on public infrastructure – and that’s not there yet. There are superchargers at the Autobahn – but you shouldn’t supercharge a car every time – only when you have leased it, then it doesn’t matter when you ride down the battery fast.
Same with hybrids – they rely even more about having a slow loader everywhere you park it. Otherwise it’s only a tax evasion model for company cars (you pay half the tax for them).
Owning them is a problem, too – you have the IPhone effect. Technical cycles are running faster, so used cars are more technical outdated then their combustion cousins. So you get lower used car prices. New battery tech is proclaimed every now and then, it’s a sign of “wait a bit”, too.
So it’s a long way to go. And it won’t be fast without help from government – infrastructure is needed most.
In 2022 World BEV sales were 7.68 million and in 2023 World BEV sales were 9.98 million.
Data from
https://ev-volumes.com/news/ev/global-ev-sales-for-2023/
For Germany I found this:
Although battery-electric vehicle sales in Germany increased in 2023, the market share increased only moderately to 18.4%.
from https://www.best-selling-cars.com/germany/2023-full-year-germany-best-selling-electric-cars-by-brand-and-model/
Dennis – I’m not sure about where you are, but in California, it’s been a bit sobering to see electricity prices going up by a lot. In 2019 a Kwh at a supercharger was around $0.26, by 2019 it was $0.35, 2022 jumped to almost $0.60, and now it’s stabilized around $0.52…at this rate (doubling every 3-4 years), it will be $1.0 kwh by 2027. I don’t think there’s a large supply of people willing to drive a model 3 around that barely gets 20 mpge…they could drive something much cheaper and save money per mile too. There’s not an endless supply of people that can charge from home with cheap rates…making it even worse, non-Tesla chargers are even more expensive (EVgo, chargepoint), so if anything Tesla is better positioned to weather the EV storm than others. Add to this congestion at superchargers and cold weather issues turns many away from EVs.
Kengeo,
I am not in California, most charging I do is during the night when rates are lower, I imagine there is a time of use rate in California. Yes with TOU rates in California a customer saves 9 cents per kWh over regular rate 24 cents per kWh.
This is equivalent to 6 cents per mile for a model 3. Compared to an ICEV which gets 35 MPG at about $5.40 per gallon (avg CA price) which would be about 15 cents per mile, so about 250% more than the Tesla M3.
I live in a state which gets quite cold in winter, not really a big issue. If someone cannot set up home charging then an EV does not make sense, but in many places in the US people can set up charging, for those renting it is more of a problem.
There are about 130 million households in the US and about 65% live in owner occupied homes, so that’s about 84.5 million potential households that could set up home charging, so yes the number is limited.
I drive a hybrid, bro. One that costs half the price of the equivalent EV, has minimal maintenance and is far cheaper to insure and get repairs if need be. It also gets well over 500 miles to a tank (42 litre) at >70 MPG.
There is literally nothing an EV benefits me on, and it seems that sentiment is becoming more well known by people and the industry.
Oh gee, reading stories like this sure makes me feel like I’m missing out. https://www.canarymedia.com/articles/ev-charging/whats-behind-the-epidemic-of-unreliable-ev-chargers
https://www.the-sun.com/motors/9820218/electric-vehicle-downsides-battery-ontario-canada/
https://www.autoevolution.com/news/hyundai-dealership-scams-ioniq-5-owner-and-their-insurance-company-for-battery-replacement-226272.html
https://www.renewableenergymagazine.com/electric_hybrid_vehicles/uk-s-ev-infrastructure-12-years-behind-20230911
Ride a bicycle around China Kleiber. Your perspective might mature on this topic a bit.
Someone said China?
https://www.reuters.com/business/autos-transportation/hybrid-vehicle-sales-surge-china-posing-fresh-threat-foreign-automakers-2023-11-21/
Art Berman had a article here,
https://www.artberman.com/blog/evs-will-have-no-effect-on-oil-demand/
claiming Norway’s oil consumption is not going down even as the EV adoption close to 100%
The projections seem reasonable from a geological perspective, but from a wider perspective there seems to be a giant problem brewing. And that is our growth based financial system. With the economy being a physical system that needs energy to operate, and more energy to grow, even stagnation in available net energy becomes a crisis. You can load up on debt to try and hide the stagnation but only for so long.
I think there is a very good chance that we will have that next 2008 ( 1929) financial shock this fall.
These big financial shocks happen in the fall (most stressful time of year for banks).
We will have added trillion of dollars more debt by the fall to the US gov’s already huge debt.
The election puts a whole lot of investments in doubt.
Japan and the UK are extremely fragile and contagion of the financial risk is likely.
We are past peak net energy from fossil fuels.
And the enemies of the Biden regime know this and can trigger the crisis, if it doesn’t happen on its own.
Tesla earnings today in an hour or so should be a fun bloodbath. There’s a company that is overvalued garbage.
Also, all other EV manufacturers are eating it too, unsurprisingly. Even BYD, and they’re clearly too good for superior Westerners to have given the hostility the likes of US and EU gov’t and business has to them.
Did I miss the bloodbath?
“Tesla shares jump 12% after Musk says company aims to start production of affordable new EV by early 2025”
https://i.postimg.cc/dVFKkY6S/IMG-5686.jpg
For some reason the hot linking won’t work on here. That Tesla didn’t drop to historical levels shows how insane the market is. The latest stories about the Cybertruck and odometer controversy should make this a no go, especially as Tesla has absolutely nothing to offer over their competitors now beside the charging infrastructure.
Signal vs noise.
Lot of noise in these posts looking at share prices, short term trends, looking at one sector in isolation of the whole. Step back, relax a little, try to see a bigger picture. Forget all the noise. It’s totally non productive, confusing and a waste of your time. Focus on the long term trends and look at LtG model output and get your head firmly calibrated on the big picture. The share price of Tesla stock this week is irrelevant. This board has some fine minds. capable of some real analysis, please let’s stay focused on the big picture!!!!!
1. We are past peak in Net Oil production. Approaching peak for other FF.
2.We are on the bumpy oil plateau, facing terminal decline within a decade or sooner.
3. The alignment of Russia, China, Iran, Iraq does not bode well for the west.
4. We might be going through a phase shift in the Climate that may accelerate temperature increases. Data within a year may confirm this.
5. Europe is seeing the beginnings of a phase shift in industrial production decline.
6. Affordability, masked as inflation, is gaining traction as a trend, due to critical resource cost constraints.
7. two hot wars, and several conflicts continue.
8. US politics are swirling around the bowl, going on ten years.
I’m sure I missed a few, but you get the idea.
Indeed.
Hear, hear.
The EIA reported inventory and weekly production this morning. Weekly production has been flat at 13,100 kb/d for 7 weeks in a row, the first week being March 8.
Attached is an updated chart for Texas production using Texas RRC data for January and February to estimate what the EIA will report for February at the end of the month. The chart is projecting a new production high of 5,782 kb/d. It also indicates that the EIA’s initial January production was too low by 158 kb/d.
The increase is due to a large increase in February production or is it? Typically the February/January drop is larger than the January/December drop. In this case, the opposite is true. Is this related to the big January drop or is it a real increase in February production or faster reporting by the RRC?
More problems for Pemex
https://www.riotimesonline.com/mexicos-oil-output-dips-amid-field-challenges/
Oilprice.com has a story that in Norway EV sales were 82% of all new vehicle sales in 2023 and will be 90% in 2024, yet oil demand hasn’t dropped.
How is this possible? Or is this story incorrect?
Shallow sand,
People may be holding onto their old cars and also heavy duty trucking may be using more than earlier and has offset any reductions from EVs.
Chart below based on EIA data from link below, seems gasoline consumption has decreased by about 41% since 2005. 2005=36.6 kb/d and 2023=15.0 kb/d.
https://www.eia.gov/international/data/world/petroleum-and-other-liquids/annual-refined-petroleum-products-consumption?pd=5&p=0000001001vg0000000000000000000000000000000000g&u=0&f=A&v=mapbubble&a=-&i=none&vo=value&&t=C&g=none&l=249–165&s=94694400000&e=1672531200000
Dennis.
Yes, I read articles stating gasoline demand has decreased significantly.
It does look like oil demand peaked in Norway, but oil demand hasn’t dropped significantly yet. Maybe it will once more older ICE vehicles are retired.
Shallow sand,
Keep in mind that “oil demand” often includes LPG which in my mind is not oil, I think of this as more similar to natural gas than to fuels that are liquids at standard temperature and pressure. Obviously sales of EVs will have the greatest affect on gasoline demand with maybe a slight affect on diesel demand (where an EV replaces a diesel vehicle), but more of the diesel is used in heavy duty vehicles (GVW above 5000 pounds) than by light duty vehicles. Let’s say that some day the World cuts gasoline consumption by 60% of 2022 consumption (in my previous comment I said Norway cut gasoline use by 40%, it was actually by 60% from 2005 to 2023) in 18 years, in 2022 World consumption of gasoline was 25988 kb/d, 60% would be 15592 kb/d reduced World liquids consumption and total transport liquids consumption is roughly 60000 kb/d for the World so this is more than a 25% reduction in the total and there may be greater penetration of heavy duty BEVs in the future reducing transport fuel use further.
Dennis
To properly answer SS’ question, on must ask the more basic question, “When did the EV market start”.
Since Tesla is the lead supplier look at when they started introducing their EVs. Model X 2015. Model 3 2017. Model Y 2020. Taking into account the time lag in building the RV fleet, a more realistic view of the impact of EVs on gasoline consumption would br to compare 2020 to 2023.
Eyeballing your chart, 2023 vs 2020, 15/17 = 0.88. So the EVs have reduced fuel consumption by 12% in Norway. Why such low percent saving?
Attached is an article which shows Norways car population. For 2020, this is my eyeball estimate.
Hybrid 275 k
EV 350 k
Gasoline 925
Diesel 1,025 k
Total 2,575.
Percent EV/Hybrid 25%
Other factors such as fuel economy standards and cost account for most of the drop from 2005 to 2020.
https://www.reuters.com/business/autos-transportation/evs-could-overtake-petrol-cars-norway-by-end-2024-2024-04-02/
Ovi,
Thanks.
I agree your analysis is better. A big part of the drop in gasoline use from 2005 to 2016 was a switch to more diesel vehicles which replaced older gasoline (motor gas) vehicles. Fuel efficiency improvements and more HEVs also likely played a role. Up to 2013 BEVs were an insignificant part of the story and even up to 2020 had little impact. The impact becomes larger as the older ICEV fleet is retired and most new care sold are BEVs and/or PHEVs.
More data and analysis (which is far better than my back of napkin analysis) at
https://cleantechnica.com/2023/11/13/end-of-the-oil-age-preview-norways-fleet-transition-to-ev/
Chart from cleantechnica piece, click on chart for larger chart
Eventually a lot of good analysis of the situation.
There was a push towards diesel cars around 2010 with the introduction of very efficient motors based on automated electrical injection, that at the time was seen as increasing fuel economy as well as performance. Nowadays we have the 2025 deadline for quiting sales of combustion engines in Norway, a huge psychological impact. Consumers expect to having to switch to electric cars soon and vendors as well. Looking at the projections, there is no doubt that gasoline consumption will hit a rock bottom level next decade. Diesel consumption is however much more robust, due to how important it is for economic activity overall (not only thinking about light transportation). When talking about only light transportaion I would argue that people in rural communties could use a hybrid car with gasoline, a very small gasoline car or access to commuting transportation. And that overall for society that would be better than diesel being used for light transportation. The ones living in rural communites (a lot of my relatives) would instead argue they want a cheap diesel car if possible.
What we are seeing is that it will be a glut of gasoline going forward that can be utilised for a lot of uses for engines up to 450 hp, to probably free up more diesel for the heavy lifters of economic activity. Vehicle manufactures should adapt, and I see many already are adapting to this picture.
Price matters.
The new EXXON numbers are out – earnings are not so good, they blame natural gas prices.
Seems they are drilling themselves into oblivion in Permian and flooding the gas market with their gassy wells.
Hahahhahahahahahaha!
New posts are up
https://peakoilbarrel.com/opec-update-april-26-2024/
and
https://peakoilbarrel.com/open-thread-non-petroleum-april-26-2024/