By Ovi
The focus of this post is World oil production along with a more detailed look at the top 11 Non-OPEC oil producing countries.
Below are a number of Crude plus Condensate (C + C) production charts, usually shortened to “oil”, for oil producing countries. The charts are created from data provided by the EIA’s International Energy Statistics and are updated to December 2023. This is the latest and most detailed/complete World Oil production information available. Information from other sources such as OPEC, the STEO and country specific sites such as Brazil, Norway and China is used to provide a short term outlook.
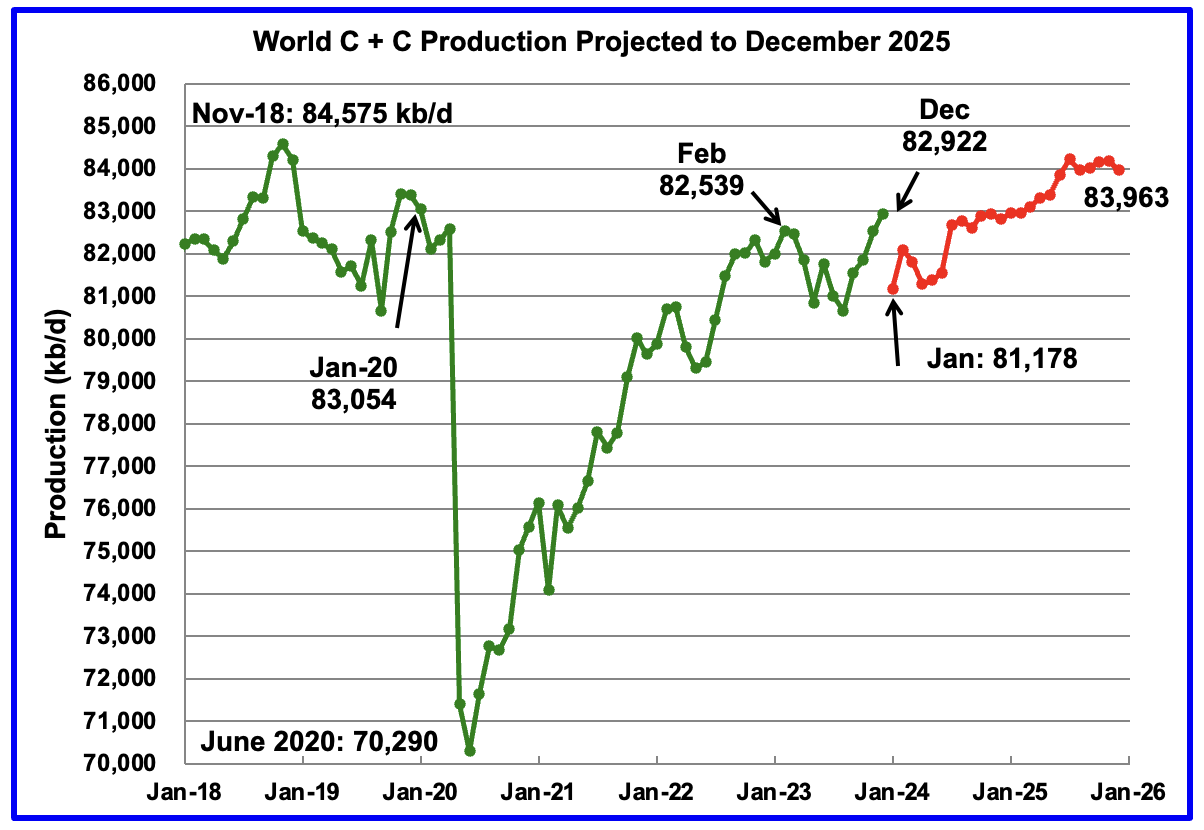
World oil production increased by 400 kb/d in December, green graph, to a post pandemic high. The largest increase came from Guyana, 175 kb/d. January World oil production is projected to drop by 1,744 kb/d to 81,178 kb/d. The large production drop is due to the STEO’s January estimated drop of 2,160 kb/d for all liquids. Of the 2,160, US accounts for 1,500 kb/d while Canada drops 130 kb/d and Brazil drops 280 kb/d.
This chart also projects World C + C production out to December 2025. It uses the April 2024 STEO report along with the International Energy Statistics to make the projection. (Red markers).
The red graph forecasts that World crude production in December 2025 will be 83,963 kb/d and is 612 kb/d lower than the November 2018 peak. The December forecast is 479 kb/d higher than reported in the previous world update.
From December January 2024 to December 2025, production is estimated to increase by 2,785 kb/d.
December 2025 production is within striking distance of the November 2018 peak. Keep in mind that today OPEC + has close to 3,000 kb/d of production cuts in reserve. Most of it could be used up by the expected production increase of 2,785 kb/d by December 2025.
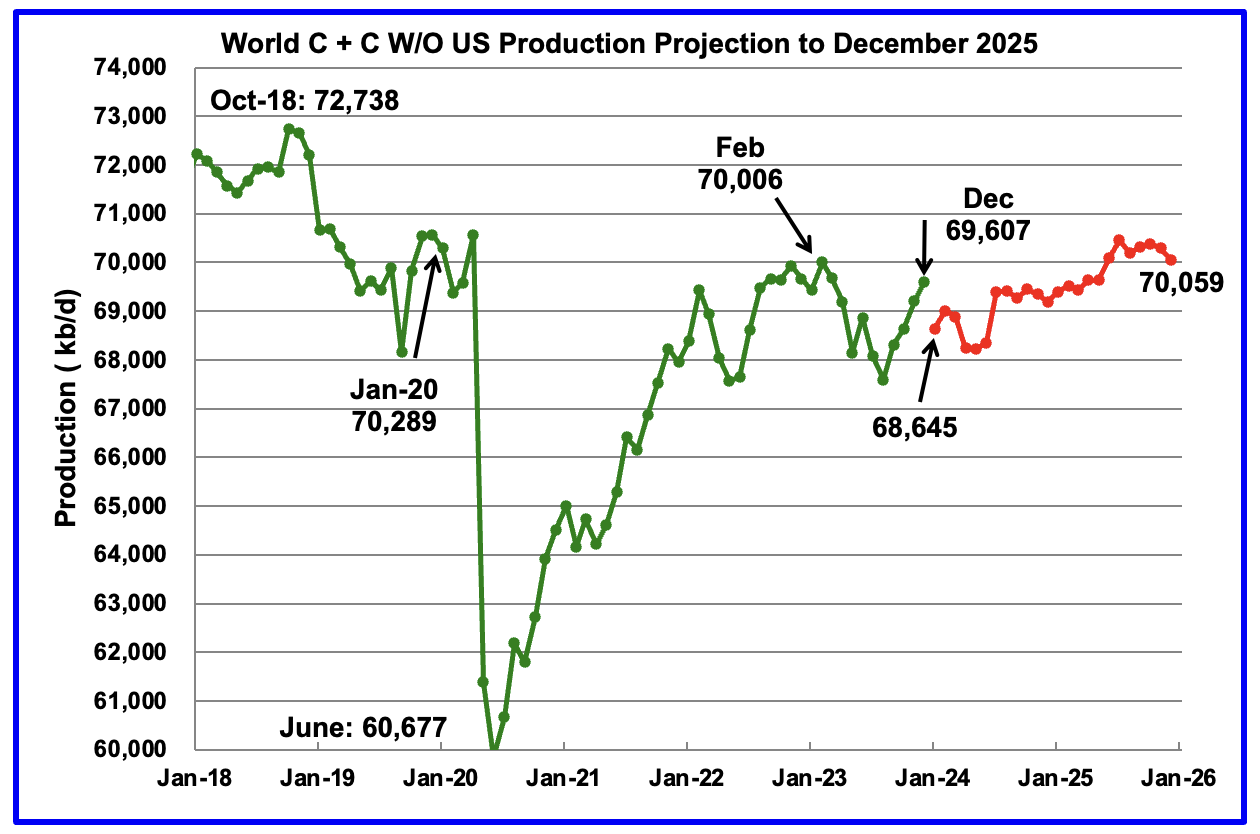
World without US December oil output increased by 405 kb/d to 69,607 kb/d. January production is expected drop by 962 kb/d to 68,645 kb/d.
Note that December 2025 output of 70,059 kb/d is essentially unchanged from February 2023. Is this an early indicator that World without US oil production is heading into a plateau phase? Note that the current December 2025 estimate is 395 kb/d higher than reported last month.
World oil production W/O the U.S. from January 2024 to December 2025 is forecast to increase by a total of 1,414 kb/d.
A Different Perspective on World Oil Production
Instead of dividing the World oil producing countries into OPEC countries and Non-OPEC countries, this section divides the countries into two groups on the basis of their production capacity. The division will be The Big Three, US, Saudi Arabia and Russia, and The Rest, i.e. the World oil producers W/O the Big 3. The top producer in the Rest, currently Canada, produces close to half of the lowest producer in the Big Three.
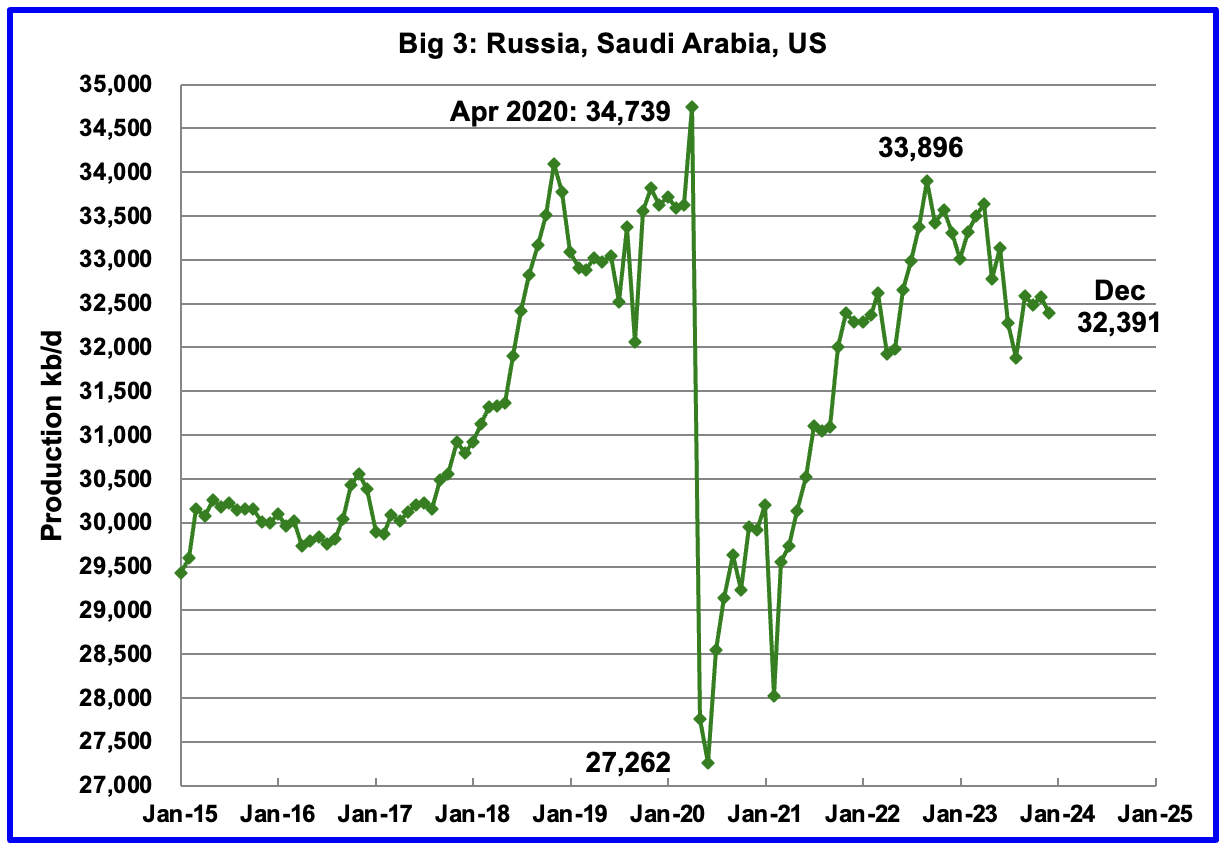
Peak production in the Big 3 occurred in April 2020 at a rate of 34,739 kb/d. The peak was associated with a large production increase from Saudi Arabia. Post covid, production peaked at 33,896 kb/d in September 2022. The production drop since then is primarily due to cutbacks in Russia and Saudi Arabia.
December production from the Big 3 decreased by 179 kb/d to 32,391 kb/d.
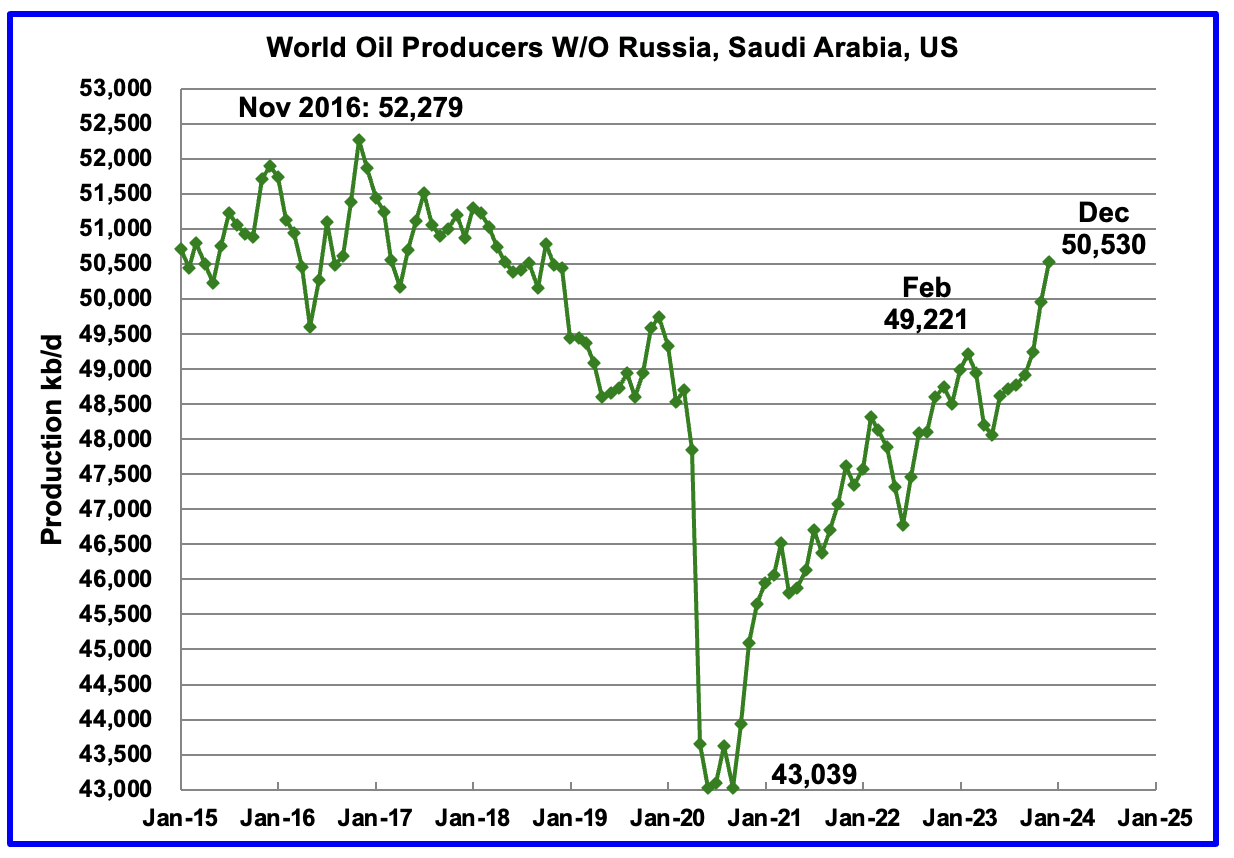
Production in the Rest has been slowly increasing since the low of September 2020 at 43,039 kb/d. In February 2023 production rose to a post covid high 49,221 kb/d. Output in December was 50,530 kb/d, an increase of 579 kb/d over November and exceeded the February 2023 high by 1,309 kb/d. Since September, the Rest has added 1,615 kb/d. Two countries were the biggest contributors to the large rise, Canada 311 kb/d and Iran 323 kb/d.
December 2023 is 1,749 kb/d below the November 2016 high.

Above are listed the World’s 12th largest oil producing countries. In December 2023, these 12 countries produced 76.4% of the World’s oil. On a MoM basis, these 12 countries increased production by 14 kb/d while on a YOY basis, production rose by 468 kb/d. On a YoY basis, note how the size of the Saudi Arabia’s production drop overshadows the US increase. Also note the large MoM Saudi Arabia drop of 250 kb/d, which put it 50 kb/d below its output target of 9,000 kb/d.
Projection for Non-OPEC Oil Production
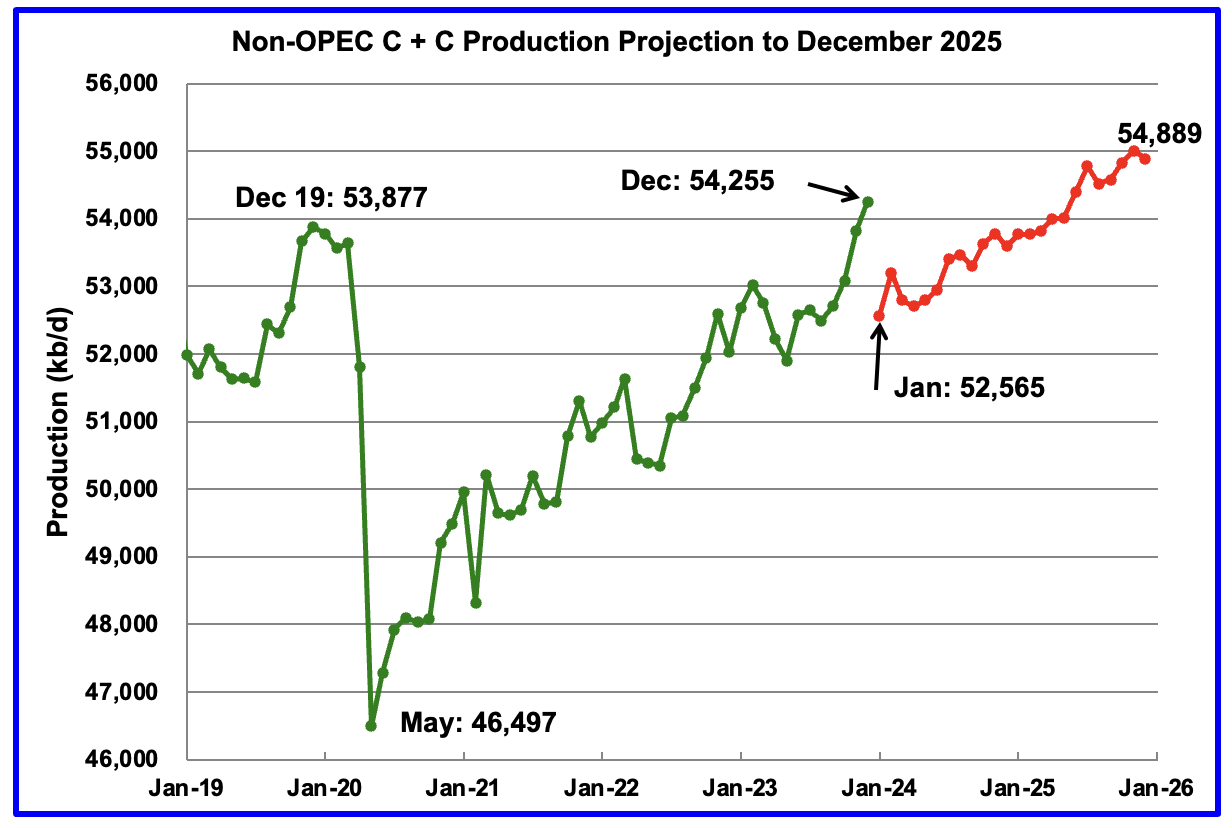
December Non-OPEC oil production rose by 434 kb/d to 54,255 kb/d. The largest increase came from Guyana, 175 kb/d. Note that Non-OPEC production now includes Angola.
Using data from the April 2023 STEO, a projection for Non-OPEC oil output was made for the period January 2023 to December 2025. (Red graph). Output is expected to reach 54,889 kb/d in December 2025, which is 1,012 kb/d higher than the December 2019 peak of 53,877 kb/d.
From January 2024 to December 2025, oil production in Non-OPEC countries is expected to increase by 2,324 kb/d. According to the STEO, the major contributors to the increase are expected to be the US, Brazil and Guyana.
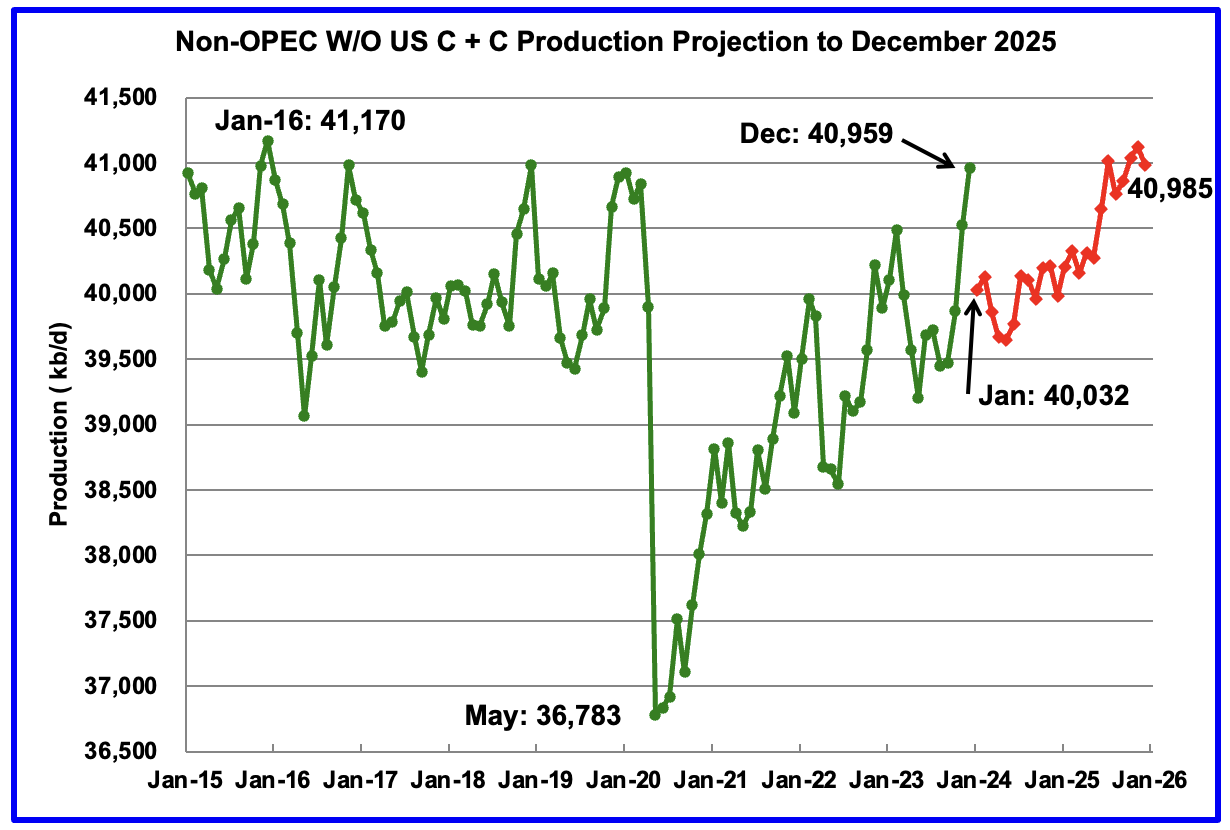
December Non-OPEC W/O US production increased by 438 kb/d to 40,959 kb/d. January production is projected to drop by 927 kb/d from December.
From December 2023 to December 2025, production in Non-OPEC countries W/O the US is expected to rise by 26 kb/d, essentially unchanged.
Over a longer time frame, Non-OPEC W/O US production has bumped up against a 41,000 kb/d barrier. In January 2016, production peaked at 41,170 kb/d. December 2025 estimated production is 185 kb/d lower than January 2016.
Non-OPEC Oil Countries Ranked by Production
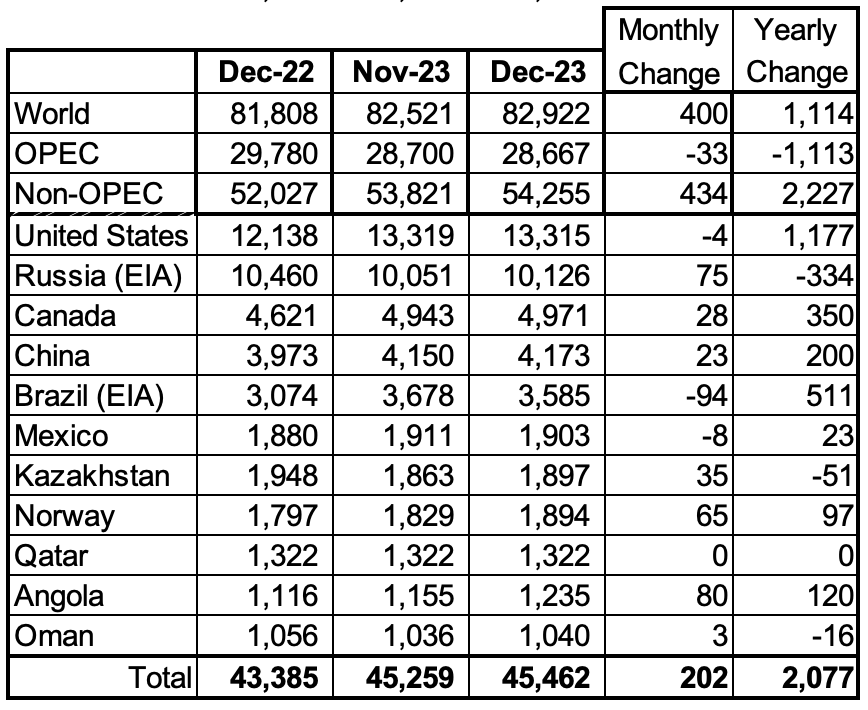
Listed above are the World’s 11 largest Non-OPEC producers. The criteria for inclusion in the table is that all of the countries produce more than 1,000 kb/d. Note that Angola has been added to this table.
December’s production increase for these eleven Non-OPEC countries was 202 kb/d while as a whole the Non-OPEC countries saw a production increase of 434 kb/d.
In December 2023, these 11 countries produced 83.8% of all Non-OPEC oil production.
OPEC’s C + C production decreased by 33 kb/d MoM while YoY it decreased by 1,113 kb/d. World MoM production increased by 400 kb/d while YoY output increased by 1,114 kb/d.
Non-OPEC Oil Production Charts by Country
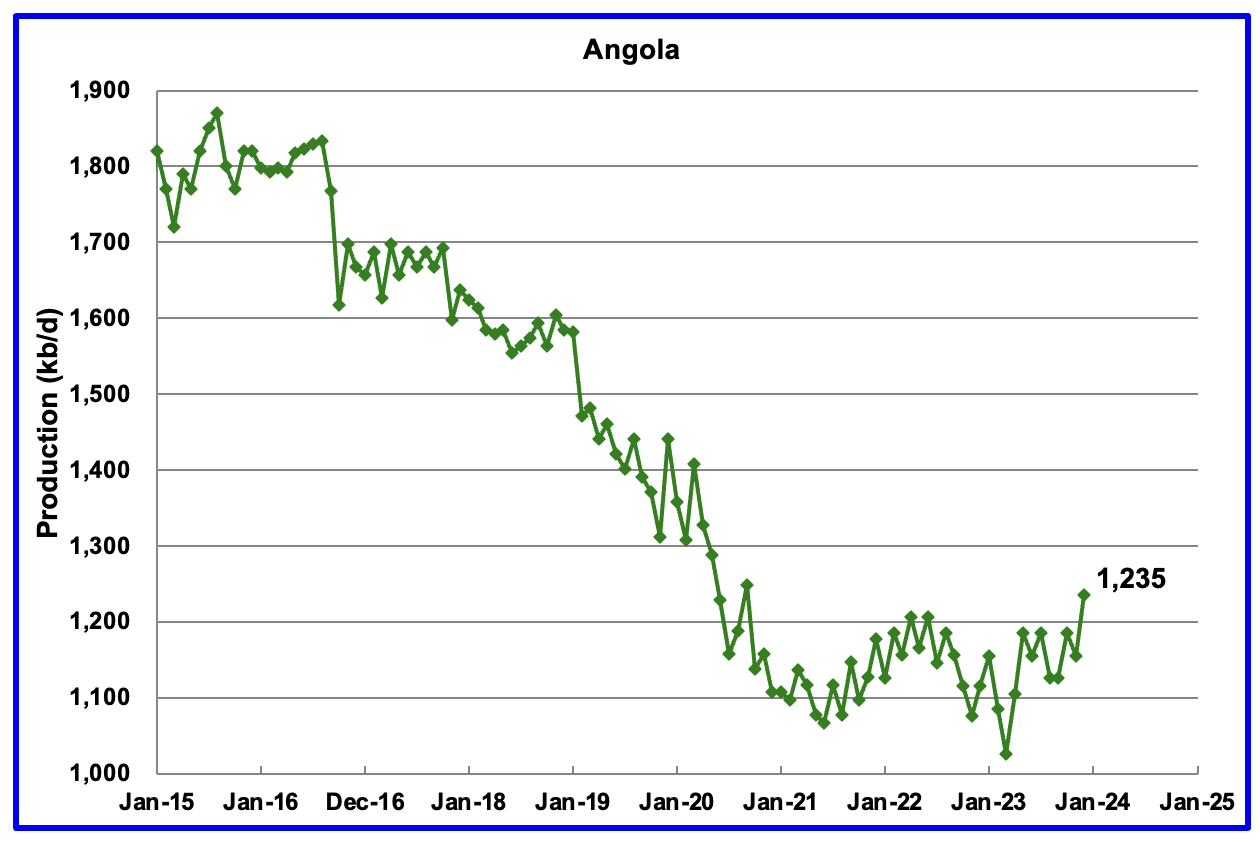
Angola has been added to the Non-OPEC producing countries since they have resigned from OPEC.
Angola’s December production increased by 80 kb/d to 1,235 kb/d. Angola’s production since mid 2021 appears to have settled into a plateau phase but is showing signs of increasing production as it courts more outside investors.
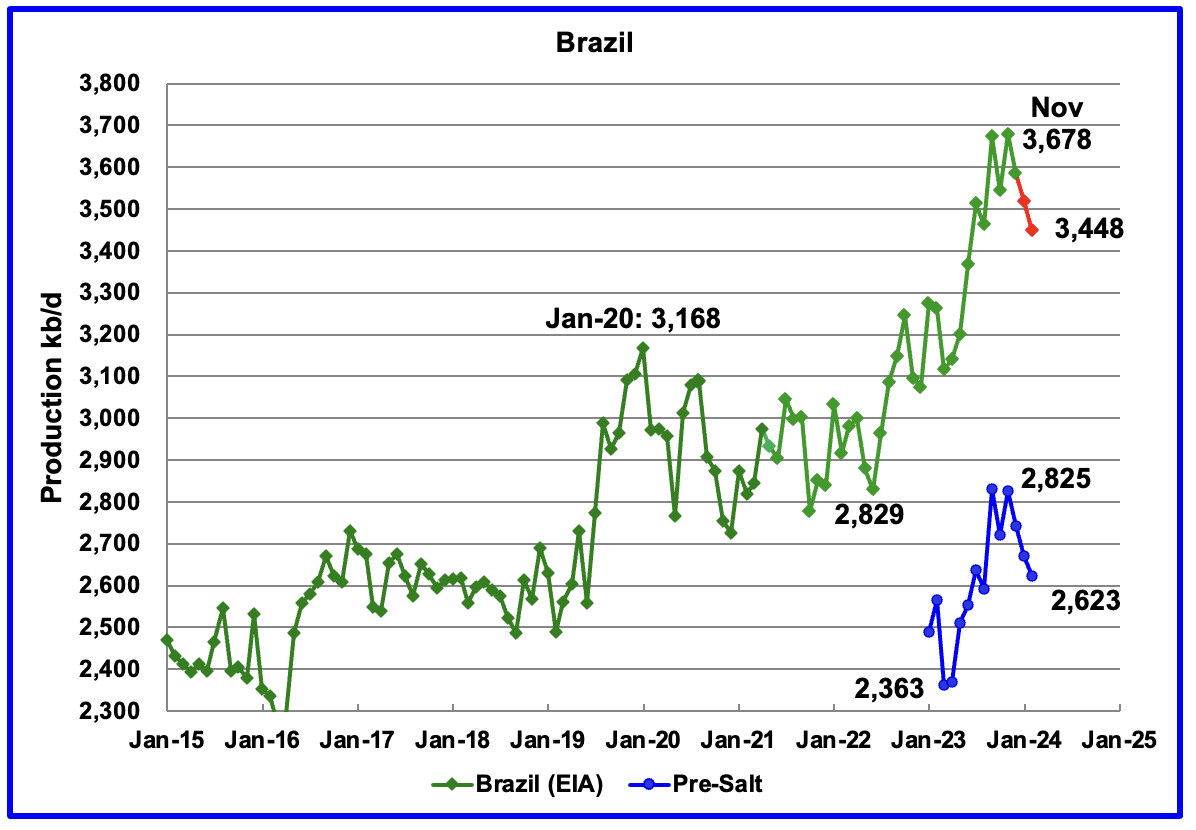
The EIA reported that Brazil’s December production decreased by 94 kb/d to 3,585 kb/d.
Brazil’s National Petroleum Association (BNPA) reported that output dropped in both January and February, red markers. February production dropped by 71 kb/d to 3,448 kb/d.
From March 2023 to November 2023, production increased by 563 kb/d. A similar rise in production is not expected in 2024. For 2024 the MOMR is expecting a smaller increase, closer to 120 kb/d while the EIA is forecasting flat output.
The March MOMR notes that : “Crude oil output is expected to increase through production ramp-ups in the Buzios (Franco), Mero (Libra NW), Tupi (Lula) and Itapu (Florim) fields. Oil project start-ups are expected at the Buzios, Atlanta, Pampo-Enchova Cluster and Vida sites. However, increasing costs in the offshore market and inflation might continue to delay projects and could temper growth in the short term.
Production from Brazil’s off-shore “pre-salt” region has been added to this chart. February’s pre-salt oil production decreased by 47 kb/d to 2,623 kb/d.
Note from November to February, pre-salt production dropped by 202 kb/d while during the same period Brazil’s over all production dropped by 230 kb/d.
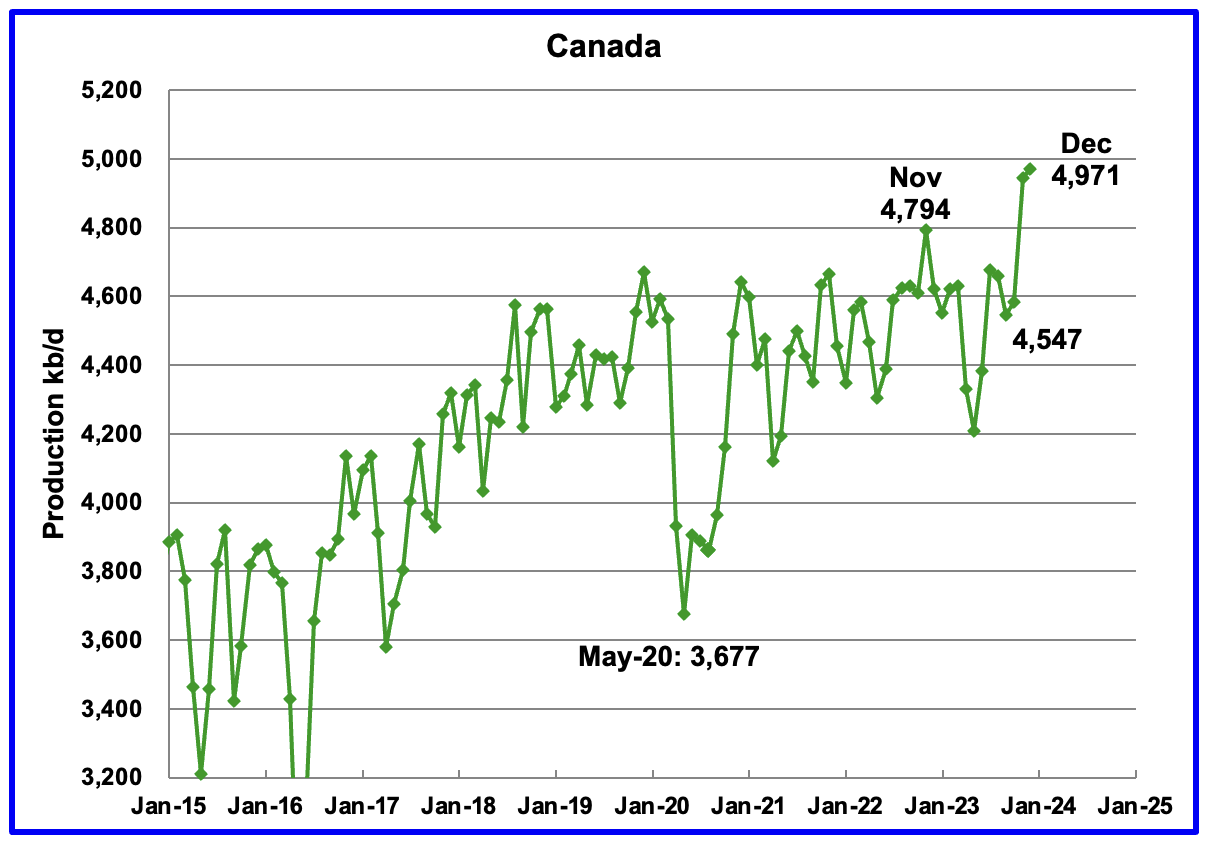
According to the EIA, Canada’s production increased by 28 kb/d in December to a record 4,971 kb/d.
In March 2024 the TMX pipeline suffered another delay when the pipeline could not be pulled through a tunnel. However TMX’s latest announcement indicates all of their problems have been addressed.
On April 3 2024, according to a TMX announcement the Trans Mountain pipeline expansion is to enter commercial service on May 1.
“The Crown corporation behind the massive project provided the start date in an update posted to its website Wednesday.“
“The commencement date for commercial operation of the expanded system will be May 1, 2024,” Trans Mountain Corp. said in the update.”
“Trans Mountain anticipates providing service for all contracted (oil) volumes in the month of May.”
The company also confirmed in its statement that it has resolved the construction-related difficulties that had slowed the project’s progress in recent months. Trans Mountain Corp had encountered an “obstruction” when trying to pull the pipe into the horizontal hole that had been drilled for it in an area of the Fraser Valley between Hope and Chilliwack, B.C.”
The startup of TMX is expected to reduce the WCS/WTI discount from the $18/b to $25/b range to $12/b to $15/b.
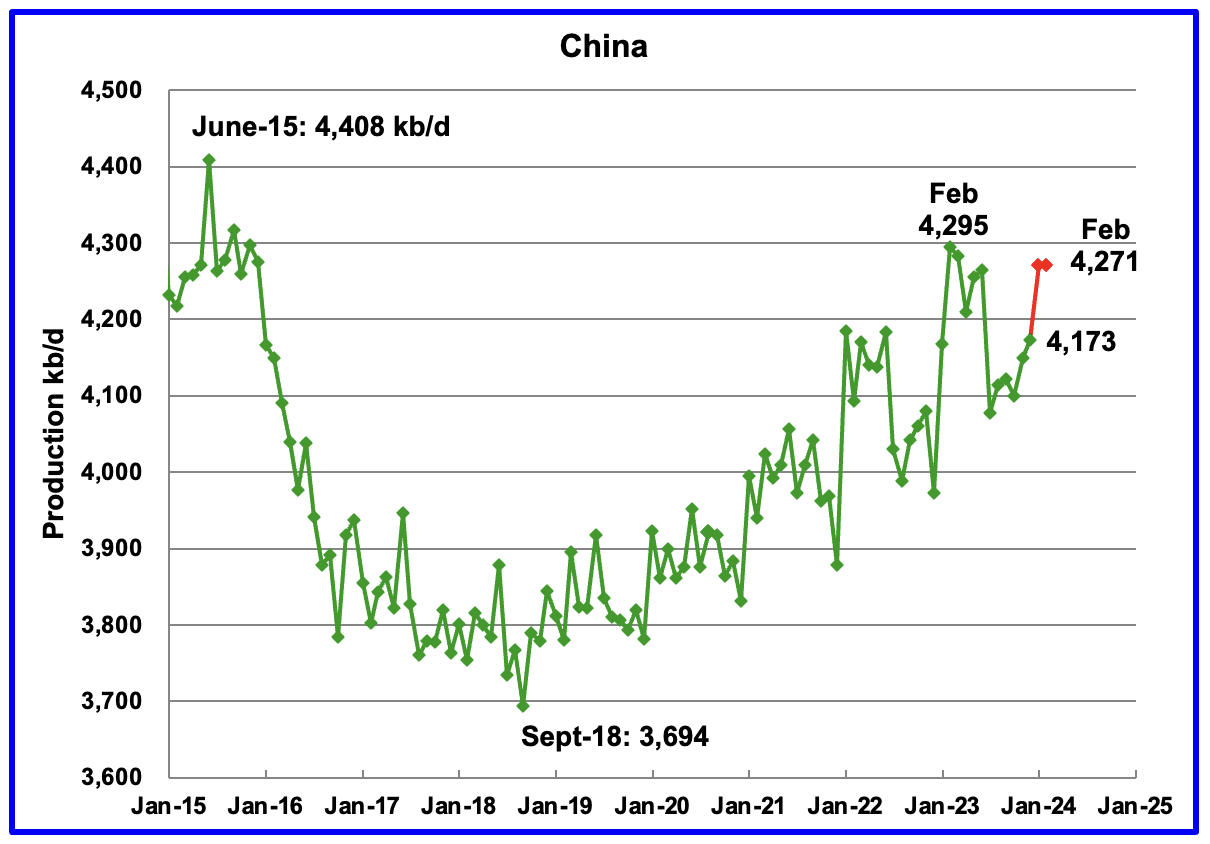
The EIA reported China’s oil output in December increased by 23 kb/d to 4,173 kb/d.
The China National Bureau of Statistics reported an average output for the January/February time period because they did not report January’s production. In late March 2024, the China bureau announced the average production for January and February (red markers) was 4,271 kb/d. This is slightly lower than February 2023 high of 4,295 kb/d.
Every January for the last four years, China’s production has seen a massive increase. In 2022 production jumped by 322 kb/d from December 2021 to February 2022. However according to the March MOMR: For 2024, Chinese liquids production is expected to rise by about 10 tb/d. The EIA generally agrees since it is also projecting no growth for 2024.
While China’s production growth has risen steadily since 2018, it may be approaching its post pandemic high as inferred by the March MOMR, the EIA reports and the latest update from the China National Bureau of Statistics.
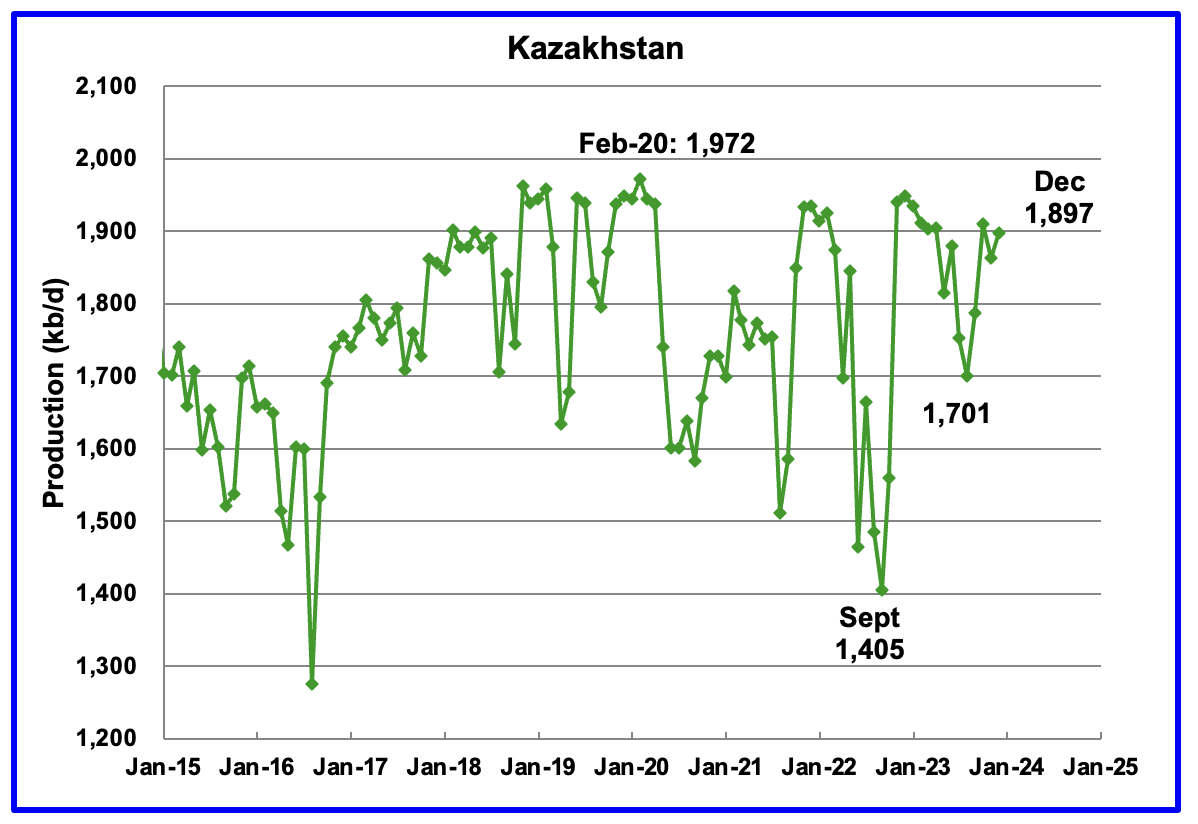
According to the EIA, Kazakhstan’s output increased by 35 kb/d in December to 1,897 kb/d.
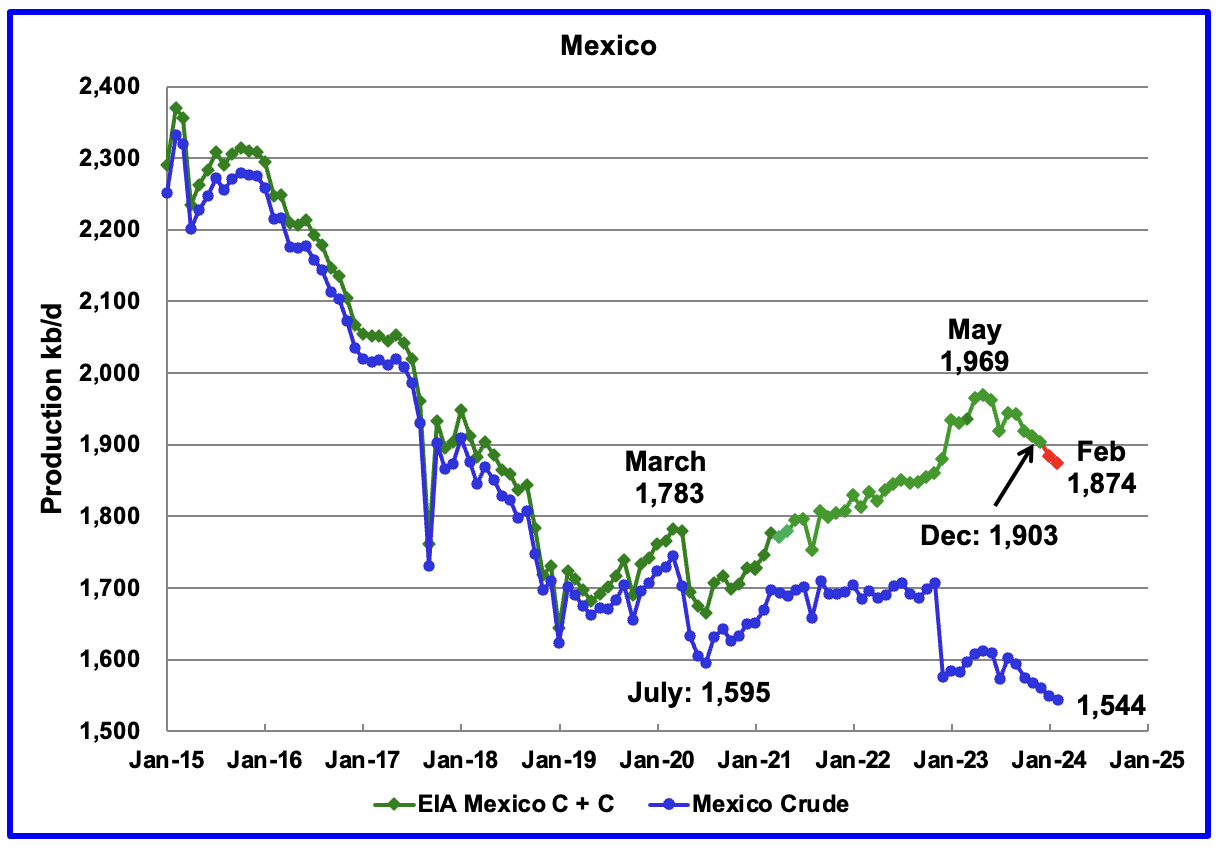
According to the EIA, Mexico’s output decreased by 8 kb/d in December to 1,903 kb/d.
According to Pemex, Mexico’s oil production dropped in January and February to 1,874 kb/d. Mexican crude production as reported by Pemex has been added to this chart. According to this article, “Crude output at Mexico’s Pemex slumps to more than four decade low”
Pemex reported crude production in February was at a new low of 1,544 kb/d. The 330 kb/d gap is a combination of 275 kb/d of condensate and a 55 kb/d EIA condensate correction. Mexico has recently revised its definition of condensate. This has resulted in the EIA adding an extra 55 kb/d, on average, to the Pemex report. The red markers include an additional 55 kb/d.
According to the March 2024 MOMR: “Mexico’s liquids production is forecast to drop by 60 tb/d to average 2.0 mb/d in 2025. Production ramp-ups in projects like Mezcalapa, Amoca-Yaxche, Okom, Tucoo-Xaxamani and Amoca-Mizton-Tecoalli are expected to be more than offset by declines in several fields such as Quesqui and Tupilco Profundo. Meanwhile, output in the Ku-Maloob-Zaap asset is expected to remain stable.
The reason for the large drop in December 2022 is unclear and is not reported in the news. According to the IEA, Mexican crude production in November 2022 and December 2022, was 1,610 kb/d and 1,620 kb/d respectively. For February 2024, S & P Platts is reporting crude production of 1,650 kb/d vs the 1,544 kb/d reported by Pemex.
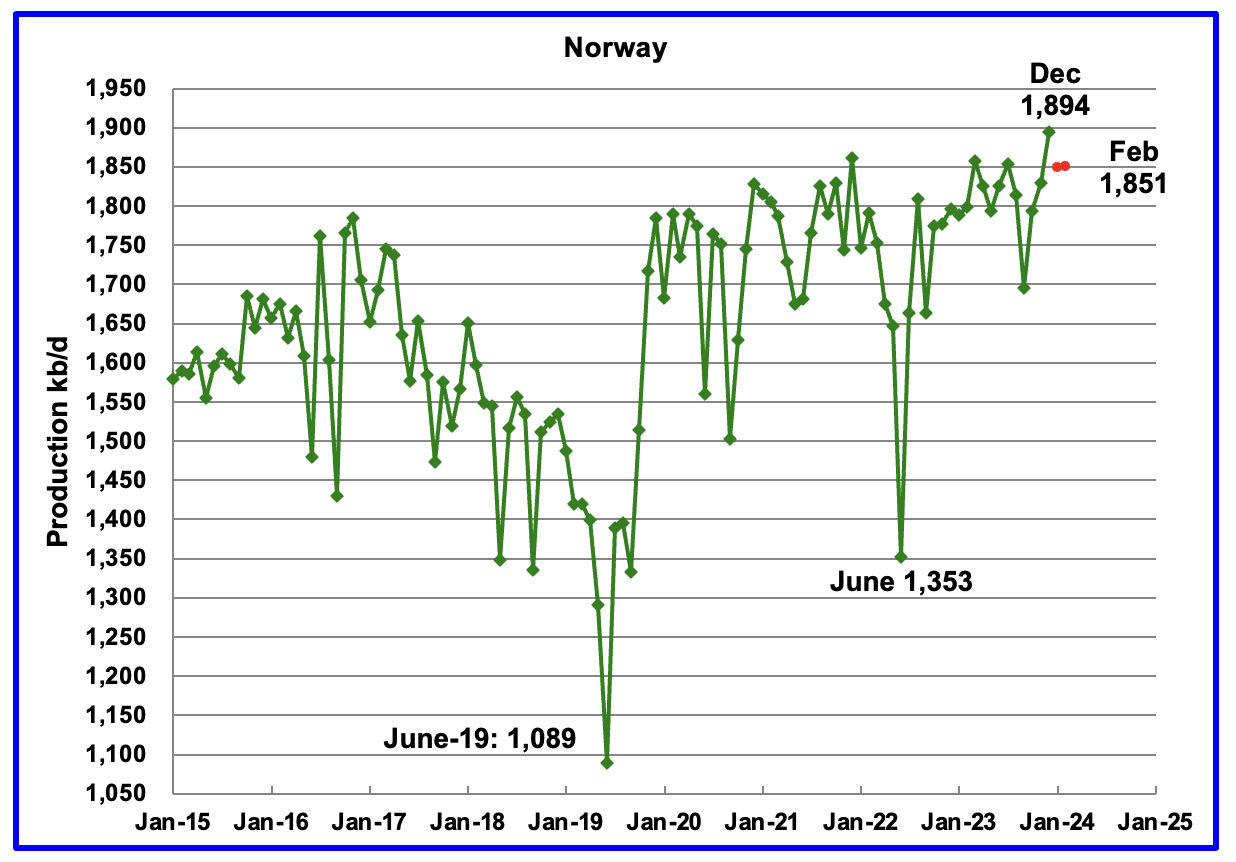
The EIA reported Norway’s December production increased by 65 kb/d to 1,894 kb/d, a new post pandemic record high.
Separately, the Norway Petroleum Directorate (NPD) reported that February’s production added 2 kb/d to 1,851 kb/d, red markers. January dropped by 45 kb/d to 1,849 kb/d.
According to the NPD : “Oil production in February was 3.0 percent more than the Norwegian Offshore Directorate’s forecast and 2.4% more than the forecast so far this year.”
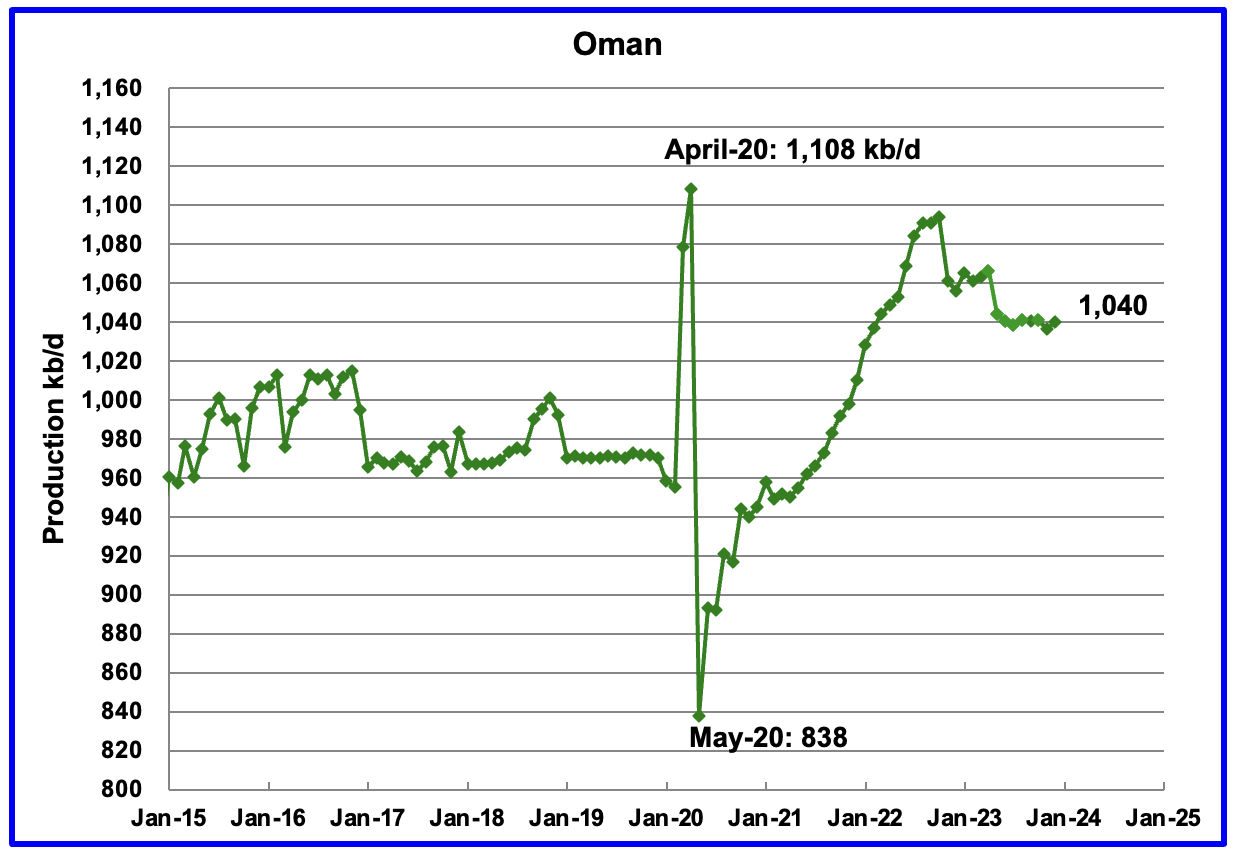
Oman’s production has risen very consistently since the low of May 2020. However production began to drop in November 2022. According to the EIA, December 2024 output was 1,040 kb/d.
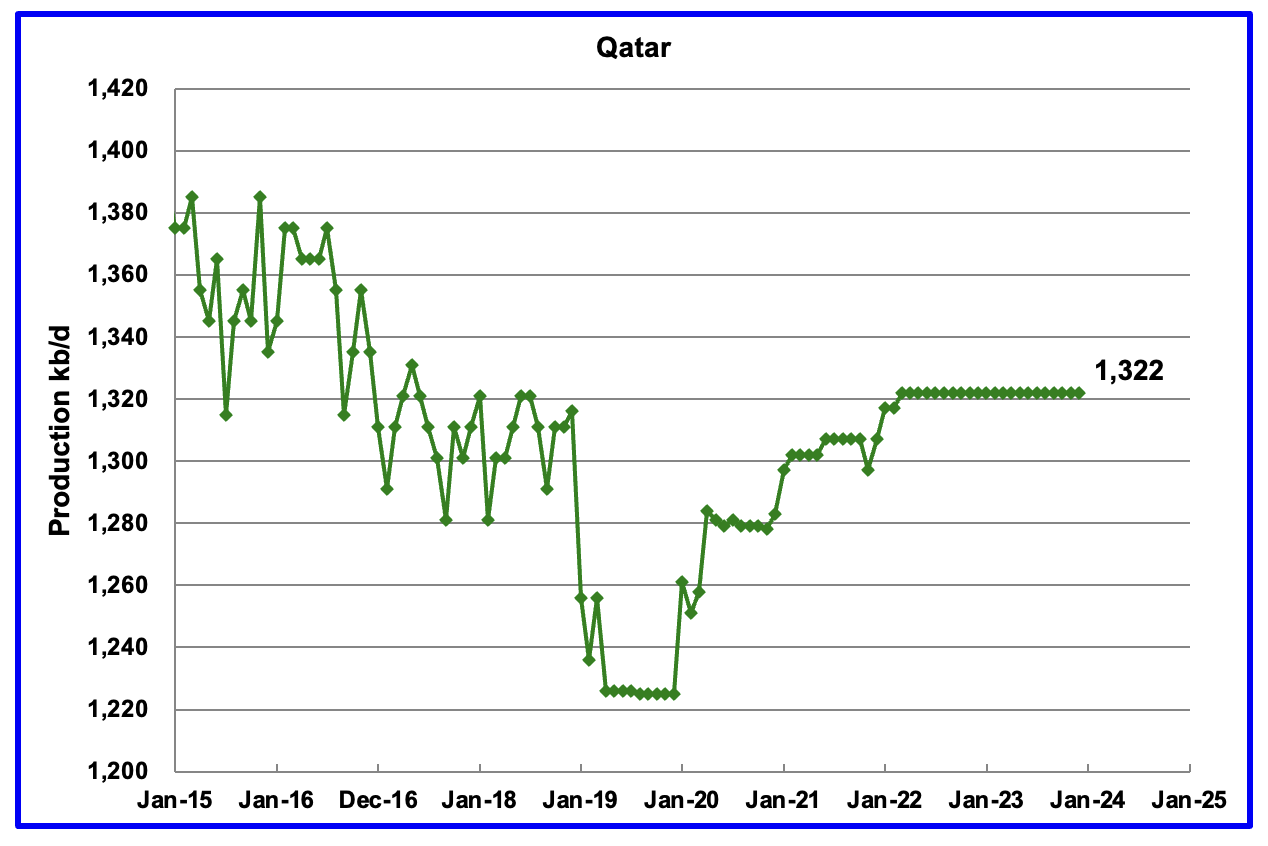
Qatar’s December output was unchanged at 1,322 kb/d, possibly due to lack of updated information.
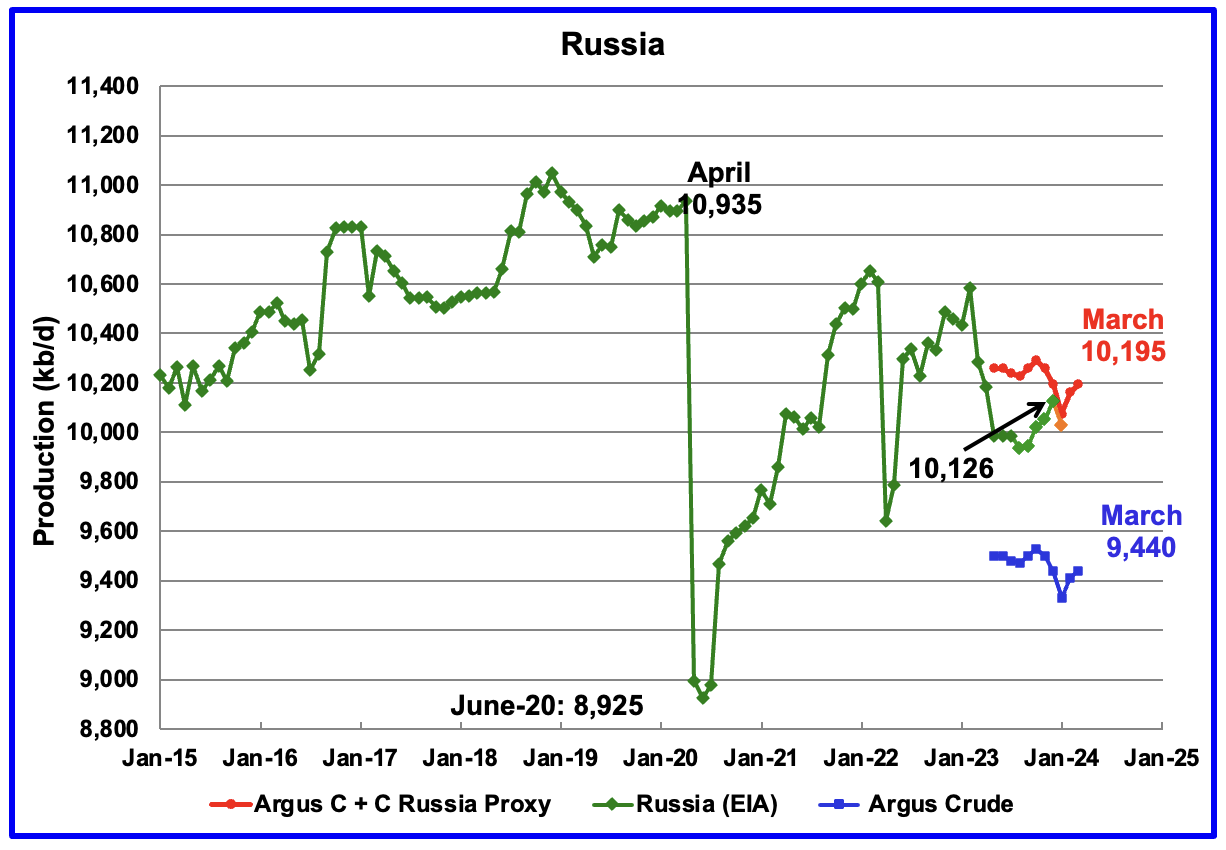
The EIA reported Russia’s December C + C production rose by 75 kb/d to 10,126 kb/d. Using data from the April STEO report, Russian output is expected to be slightly lower at 10,123 kb/d in January 2024.
Using data from Argus Media reports, Russian crude production is shown from May 2023 to March 2024. For March 2024, Argus reported Russian crude production was 9,440 kb/d, an increase of 30 kb/d, blue markers. Adding 8% to Argus’ March crude production provides a C + C production estimate of 10,195 kb/d, which is a proxy for the Pre-War Russian Ministry estimate, red markers. S & P Platts reports that Russian March crude production was 9,420 kb/d, down 10 kb/d from February, same as the Argus estimate of 9,420 for March.
If the EIA’s Russian production projection is correct, this indicates that there is no sign that Western sanctions are affecting their oil production at this time. The Argus and EIA trends are now going in the same direction but with Argus data delayed by 4 months. Argus’ source may be catching up as it sources may be providing delayed production data.
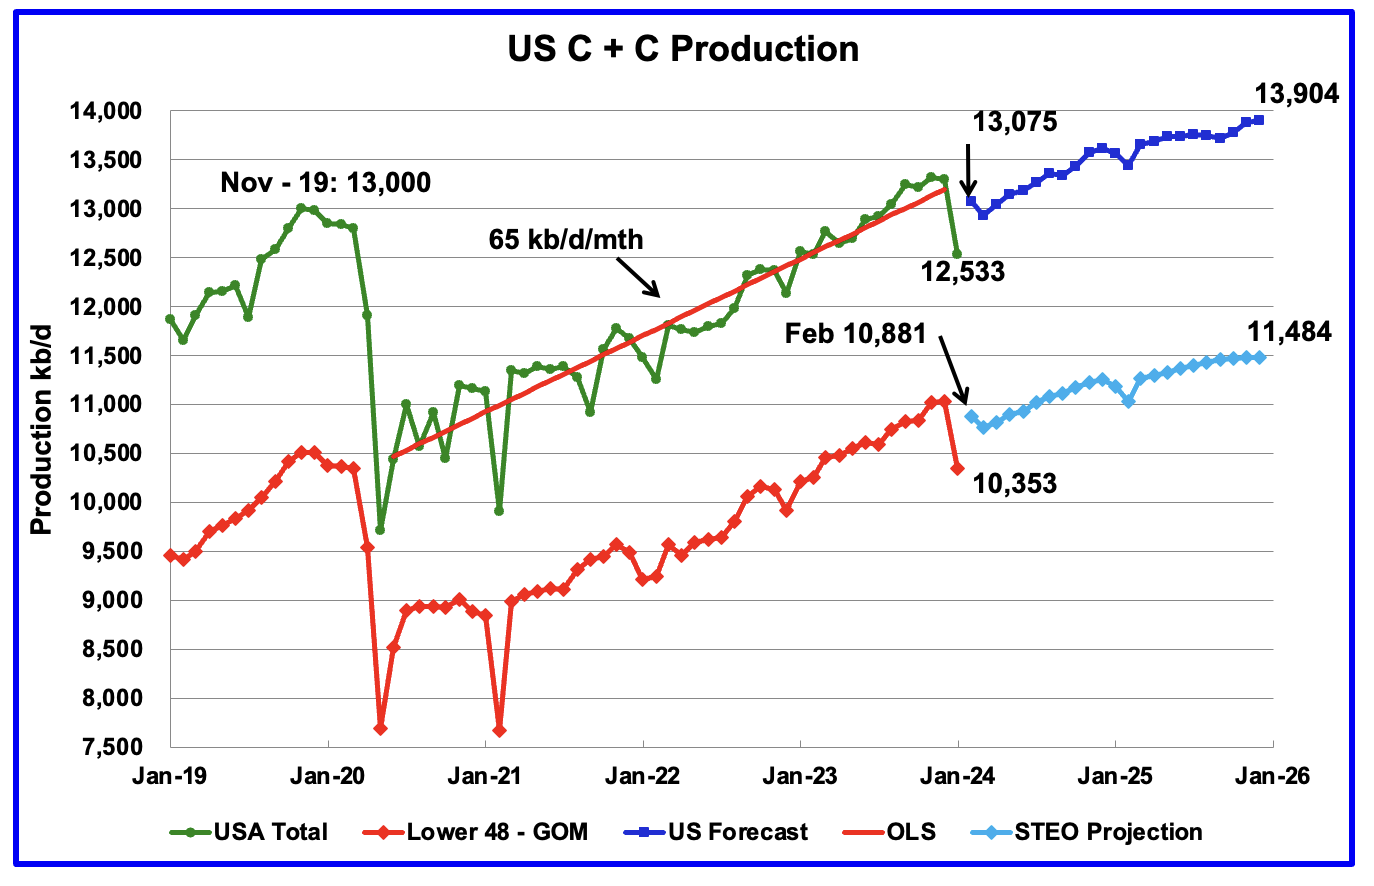
This chart is the same as posted in the US January update except that the light and dark blue graphs have been updated using the April STEO.
US December 2025 production has been increased by 82 kb/d to 13,904 kb/d while the L48-GOM has been increased by 103 kb/d to 11,484 kb/d. The last three months in the L48- GOM graph are essentially flat and may be hinting at a coming plateau.
157 responses to “December World Oil Production at Post-Pandemic High”
https://pboilandgasmagazine.com/too-much-too-fast/
This was posted in the last thread by Lightsout, but that just rolled over. Worth a read.
Mike Shellman of https://www.oilystuff.com/forumstuff
Mike’s argument applies to about all LTO development. OMG! They drilled a bunch! DOOM! Back in 2012 when the Barnett was well along it was an interesting exercise to do a post mortem to find the density of wells/acreage in the Barnett wells where increasing density led to diminishing initial results that could be laid at the feet of a given well density number. Just an exercise when there was plenty of data, but it is probably time to go do the same in the Permian formations just to see if/how much it has happened, where, and the resulting changes in intial production rates and where.
Seems reasonable to crunch some numbers prior to pulling a chicken little routine anyway. Or maybe ALL the numbers. As far as well declines, MIke didn’t mention if he did his analysis on all wells in their respective LTO formations and bench groups? I am really curious about his sample size of wells he fit exponentials, power law, hyperbolics or stretched hyperbolics to in order to draw his conclusions? He might not know this, but if the answer to that question isn’t “all of them”, he might be a little behind in terms of his sample size.
RGR, in an interview like the one I gave I am limited to what I can say, and what I say that gets actually edited in, or out, and published…particuarly from the Permian Basin Oil and Gas Magazine, who deserves a lot of credit for swimming against the current on an important issue.
Or don’t you like different opinions? Or, is the PBOGM article some kind of little girl beef with Berman?
I could have, for instance, easily differentiated between benches in either sub basin, though it is difficult because NO data sell company, neither Novi, Enverus, Rystad, nobody, knows, really, what wells produce from what bench. Thats the 2nd biggest lie in the tight oil biz, after breakeven. You know that. Not even operators know what bench they are producing from.
If you are implying recovery rates are different in different benches, congratulations. But it is a weak argument and smacks of mostly emotions all people are inclined to these days, about everything. You sound like a Democrat.
BTW, US tight oil burned $500B of cash like like an old Aggie bonfire the past 15 years. Up in smoke. Gone.
I am a threat, I understand that. 8-10% RR, if that is all your profession can recover, after 15 years, IS embarrassing, I don’t blame you for being sensitive to that. I would be too.
The world is not coming to an end, its just that the Permian Basin is done growing. Its the oilfield, hand.
Sorry, I am not clear you are a hand. Misuse of the word.
I care about my country, and our kids, and their oily future. How about you? Ego, or money?
What the hell is a hand?
As far as I have heard out of the discussions here in the board over the years, a worker at the oilfield. At the rig, or repairing the pumps etc…
I know what that type of hand is. But that does not seem like the context in which he used the word.
Mr. Patterson, in the physical oilfield it takes a long time to actually become a “hand.”
A “worm,” for instance, is a newby, but can remain a worm forever for lack of experience, or, in this particular case, the lack of ever becoming experienced… enough. Worms just sorta end up being worms forever. They generally get run off and end up being ANALysts.
Being called a hand is a term of endearment on rigs, on locations, around the iron… or in this particular case, a checkbook, etc. Hands are men, and women, who do what they need to do to be productive, to contribute.
Some people are not productive, don’t contribute, and just criticize others. They sorta just bitch. When they have NO actual experience, being a worm and criticizing hands is infuriating. RGR is not a hand. He hides behind a fake name and likes to second guess other people. Therefore he is a worm.
Like Nick G. He is actually an earth worm. The kind you go look for at night with a flashlight. A nightcrawler, I think you call them. Big fats one that fish love to chomp. He knows NOTHING about real life. Why listen to him? Its like listening to wind in tall trees.
All of this may seem stupid to people that don’t understand the actual oil business they so desperately need to understand….but experience is EVERYTHING in the oil business. If you don’t have that, you are NA, as in non applicable. Fact of life. Its important to be aware of the “culture.”
Think of it as commentating on professional football, without ever having EVER tried to thown a spiral. Or EVER having to catch one.
Now try doing that in a crowd.
Getting inteviewed, on camera, or in writing, on the internet, is often fraught with peril. Often it does not come out the way you want. But it takes big nuts to want be put in that position nevertheless. You have to believe the risk your taking is worth it. That it will… help.
I like people who do the work. Who spend their own money. Who take the risks with their own money, who have actually been there, and done that. Engineers tend to be a pompous, know everything lot…like economists. They think they know everything, and in real life don’t know jack shit.
I am about to write a series about Dammam, BTW, a reminder of what an amazing time (1936-1940) was in the KSA, in the entire history of the world.
To Mike:
“RGR is not a hand. He hides behind a fake name and likes to second guess other people. Therefore he is a worm.”
I have a real name I attached to real published research. As far as worms and hands…I started off as a clerk in the oil field 2 days after I graduated college. 11 years later I was running a 1000 well privately owned E&P with operations in 3 states. Experience domestic and international, offshore and on, independents and majors, private and public. Feel free to denigrate anyone you’d like for not being like you, but I haven’t been a worm or a hand for awhile now.
As far as second guessing, what….? I asked an easy question…how many wells did you quantify decline on (and which formations, companies and completion types/sizes and lateral length) in order to make the statement you did to the article? Easy question for any HAND who did it. Are you a WORM because you can’t?
“Getting inteviewed, on camera, or in writing, on the internet, is often fraught with peril.”
Try publishing the proof of your claim in science journals where they don’t take “but I owned some WI!!!” as a substitute for data and knowing how to use it.
From above comments- “I like people who do the work. Who spend their own money. Who take the risks with their own money, who have actually been there, and done that. Engineers tend to be a pompous, know everything lot…like economists. They think they know everything, and in real life don’t know jack shit.”
“Like Nick G. He is actually an earth worm. The kind you go look for at night with a flashlight. A nightcrawler, I think you call them. Big fats one that fish love to chomp. He knows NOTHING about real life. Why listen to him?”
“I am about to write a series about Dammam, BTW, a reminder of what an amazing time (1936-1940) was in the KSA, in the entire history of the world.”
“I am a threat, I understand that. 8-10% RR, if that is all your profession can recover, after 15 years, IS embarrassing, I don’t blame you for being sensitive to that. I would be too.”
“I care about my country, and our kids, and their oily future. How about you? Ego, or money?”
To RGR, the above comments are not about you but the posters own insecurity, lack of self esteem and education.
“A boastful person tends to exaggerate their achievements and belittle others, often to mask their own insecurities. This trait can manifest in various ways, such as bragging, name-dropping, or showing off, and can lead to alienating others and damaging relationships.
“Possible causes of being boastful
1. Insecurity or low self-esteem
2. Need for attention or validation
3. Personality disorders such as narcissism or histrionic personality disorder
4. Fear of failure or rejection
5. Past experiences of being belittled or overlooked
6. Overcompensation for perceived shortcomings or weaknesses
Behaviors associated with being boastful
1. Dismissing or belittling the accomplishments of others
2. Being defensive or reactive when challenged or criticized
3. Seeking attention and validation through self-promotion
4. Overstating one’s abilities or talents
Attitudes associated with being boastful
1. Constant need for attention and recognition
2. Exaggeration of personal achievements and abilities
3. Obsession with status and material possessions
4. Putting down others to make oneself look better
5. Insecurity and fear of being seen as weak or inferior
6. Inability to accept criticism or failure
7. Lack of empathy towards others’ feelings and needs”
https://prowritingaid.com/character-traits/boastful#:~:text=A boastful person tends to,alienating others and damaging relationships.
Thanks, have a couple questions/comments:
For the world excluding top 3, it looks like gains came from only 4 countries, Brazil/Canada/China/Iran
(annual increase of 1,730 which is about equal to Saudi Arabia’s decline).
For Saudi Arabia, based on recent events, it looks like 2019 will remain the peak.
For Brazil, since 1965, they have produced around 25 Gb.
Do you think the November ’23 high of 3.7 mbpd was the peak? 2P reserves are slightly more than 20 Gb…
The top 3 have a combined production of ~32 mbpd (11.7 Gb annually). Together 2P reserves for top 3 are 167 Gb, cumulative production thru 2023 is ~600 Gb. The 50% mark was in 2005. Compared to 2016 when 2P for these 3 countries equaled 237 Gb (and cum. was ~500 Gb), production since then has been 100 Gb, suggesting reserve growth/discoveries of 30 Gb. If the pattern continues, 2030 2P for these top 3 will be ~100 Gb meaning without additional growth there would be no production from the top 3 by ~2040. URR would be a total of ~800 Gb. Applying a similar factor to the rest of the world would result in a final URR of ~2,100 Gb which is 30% lower than some estimates for URR.
For top 3, yearly change indicates a decline rate of 3% which is divergent from the longer 5 year decline rate of only -500 mb (~1.5%).
Kangeo
I don’t track 1P and 2P and not in a position to discuss it.
With regard to Saudi Arabia, I agree November 2018 was a peak but an irrelevant one. It was a one month wonder. More recent events make me wonder what is really happening in SA.
First they announced the cancellation of their plan to increase production to 13 Mb/d. Last week they asked two oil field companies to reduce their drilling rigs by one each. They are in essence reducing their production capacity and may have decided that they want to deplete their oil in the ground more slowly. I still believe that their maximum sustainable production level is somewhere between 10 Mb/d and 10.5 Mb/d. Production in Ghawar is down to 3.5 Mb/d and I believe that the water cut is growing faster than they thought. This cutback to 9.0 Mb/d is giving Ghawar a chance to rest.
As for Brazil, they have a number of fields starting up that could raise production to close to 3.9 Mb/d. However, they have been encountering a lot of maintenance problems with the pre-salt fields and this could limit their peak due to down time.
With regard to decline rates, I don’t see anything in the data implying the big three are in decline. SA has cut back production to 9.0 Mb/d intentionally. Russia may be on a plateau and may be on the verge of entering a slow decline. The US will continue increasing production for another year or two, but not by much, maybe 250 kb/d. I am being optimistic here because their is other data which I posted last month that is hinting at a peak possibly by late this year.
Understood, I think many here miss the fact that 2P reserves are like “gas in the tank” whereas the 2PC/2PCX are like theoretical gas stations that haven’t been built yet and are many many miles down the road…since cumulative (1500 Gb) plus 2P (~500 Gb) are only 2,000 Gb total that means the theoretical oil to be discovered and brought to 2P status is almost double the size of 2P reserves…
So of three barrels, only 1 is real, the other 2 have yet to actually come into existence…this will wreak havoc on supplies and global transport systems.
Kengeo,
The World consumes about 30 Gb per year of crude plus condensate, so there is plenty of time to bring the already discovered contingent resources online and there tends to be reserve growth over time in addition. 500 divided by 30 is about 17 years and we may see demand for oil start to decrease in 5 to 7 years, in which case the 500 Gb of 2P reserves would last a bit longer, but there are still a lot of contingent resources to be developed.
Thanks Dennis, as you know well…we see things differently with regard to the quantity and quality of remaining oil reserves….here’s my best attempt at capturing the URR continuum:
As little as 1750 Gb and as much as double that…the highest reasonable estimate is right in the middle…~2,600 Gb…your shock model is very close to the middle too…
Kengeo,
Something to keep in mind is that most places reach peak well before 50% of URR has been produced. For example US peak conventional output in 1970 occurred at about 39% of conventional URR (about 247 Gb excluding tight oil using 2P reserves (30 Gb) plus cumulative production(217 Gb) at the end of 2021). So the assumption that peak occurs at 50% of URR likely underestimates URR. In the case of US conventional such an assumtion would have led to a URR estimate of 190 Gb for US conventional URR, about 57 Gb (or 23%) too low. Similarly your estimates for World URR are also likely too low.
So your 2100 Gb best guess perhaps should be 2727 Gb, if is as far off as the US estimate would have been in 1970. There is also the fact that if the peak occurs at 50% of cumulative output we had a peak in 2018 at about 1360 Gb, which would imply a URR of 2700 Gb, you seem to believe the peak occurred when cumulative production was 65% of URR (1360/2100=0.648), this is highly unlikely.
If a 2008-like increase in oil price were to occur, we’d see $215 per barrel by June.
Based on current estimates for demand and likely inability to meet it, a large increase in oil price should be expected (this should help to increase the US rig count and max out production).
Peak of $215 in June, $95 by mid April, $120 by May, $145 by mid May, $175 by early June, $195 by mid June. This would be very extreme. Instead, $15 increase per month thru year’s end could be another possibility.
Last year was the worst for conventional oil and gas discoveries. This is report is from Westwood concerning high impact wells. The drop off in discoveries in frontier basins is particularly noticeable, which probably explains most of the (large) overall decline in discovery rates. Large finds are less likely in maturer basins and the move to infrastructure led exploration means more small, one or two well tie backs.
This year is probably doing around the same, there have been a some medium and small gas condensate finds, a few of oil finds – one in China (described as “huge”, but actually quite modest), one in Guyana (although this might be in the more gas prone area of the basin), light oil in Namibia and a small one in the North Sea, and maybe one for light oil Alaska if it proves commercial. I think the trend towards the end of new exploration drilling sometime in the early thirties is continuing. With so few new projects to develop it is likely that finding competitive bids for the engineering contracts and equipment supply starts to become an issue in a few years.
https://www.westwoodenergy.com/news/westwood-insight/westwood-insight-high-impact-exploration-review-of-2023-and-outlook-for-2024
Here is another view of the same thing. It also has a list of high impact wells due this year, which will be interesting to see how successful they turn out.
https://www.spglobal.com/commodityinsights/en/ci/research-analysis/2023-international-exploration-review-and-2024-hiw-outlook.html
“I think the trend towards the end of new exploration drilling sometime in the early thirties is continuing. With so few new projects to develop it is likely that finding competitive bids for the engineering contracts and equipment supply starts to become an issue in a few years.”
Let that sink in….
20 years of looking at these charts, waiting for a significant drop in oil production, but it isn’t happening. April feels like June, and June will feel like Hell? Too hot. Climate is changing rapidly.
Peak Global Combustion Day (all fuel sources) will be in about 10 years.
If we knew the exact time it would be an event that would warrant a global day of absolute silence to mark the profound moment.
But the downslope trend will be slow
and the heat accumulation will continue on for the century, and beyond.
Many people don’t realize that our ancestors had fire as a tool long before we were even a distinct species.
We already had it we when we arrived. Without it we would not have been the fittest to survive, I assert.
Does anyone have estimates on the total world oil decline rate? I don’t think this is talked about near enough.
An older article at link below
https://royalsocietypublishing.org/doi/epdf/10.1098/rsta.2012.0448
Can’t seem to find without paywall
try
https://www.diva-portal.org/smash/get/diva2:670557/FULLTEXT01.pdf
The production weighted mean is about 6.2% per year based on data through 2009, not clear if there are more recent studies. For giant fields the average production weighted decline is about 5.5%.
I don’t know how reputable or reliable STEO forecasts are, but I find it remarkable that for the two years from Dec ’23 to Dec’25:
1. There is only 1mbpd growth worldwide
2. Of that, 600kbpd is from non-OPEC, and
3. of that, 100% is the USA!
So all the projected growth from Brazil, Canada, Guyana only compensates declines elsewhere.
If that is correct, any demand growth above 500kbpd/yr over ’24 and ’25 (which is very likely IMO) will have to be met from inventories.
What it means is that OPEC can basically name the price of oil it wants, and it will stick there.
Kdimitrov,
Average annual growth in C plus C output from 1973 to 2023 has been about 686 kb/d per year. BEVs are expected to reach roughly 41 million by the end of 2024 for World light duty vehicles, these resece demand by about 243 million barrels (assuming they replace ICEVs that travel 10 thousand miles per year with average fuel efficiency of 40 MPG (US gallons)) or about 665 kb/d less fuel needed than if these were ICEVs. For this reason we might see less growth in C plus C demand than the average during the 1973 to 2023 period. My guess is about 343 kb/d per year over the next couple of years, so average output in 2025 at about 82.5 Mb/d.
I am quite surprised that the promised “much healthier growth in natural gas consumption” is now turning into “barely flat if now downward most likely” in the past couple of years and in the coming half decade, hovering at 4 trillion cu meter per year.
While global oil consumption STEO is going up 1~2% or higher in the past couple of years and coming decade starting 103Mb/d now, I guess that the difference from world C+C above at 82Mb/d is from biofuel, synthetic fuel, and hydrogen inflated refinery gain?
Shengwu,
For 2023 EIA has for the World, NGPL=13.18 Mb/d, Other Liquids=4.49 Mb/d and Refinery Processing gains=2.33 Mb/d, Liquids total is 101.81 Mb/d and C plus C is 81.8 Mb/d.
At present the US only has dry gas data for the World through 2022, we will get data from Statistical Review of World Energy in July for 2023. EIA data below.
World transport consumption (gasoline, distillate/diesel, jet fuel) data from US EIA
Great chart, thanks Dennis!
This tells you everything about oil S/D.
1. COVID was really a once in a lifetime shock to demand, that still reverberates
2. Prior to COVID, Oil-based transport fuels have been growing steady and faster than C&C, due to fuel oil phase-out and deeper refinery processing.
Once we get back to the demand trendline, there’s gonna be supply problems. C&C growth will have to match fuel growth, which is 1.5-1.7% p.a., since there is no more “juice” left to be cracked at the bottom of the barrel.
EVs may or may not bend the trendline, it’s to be seen. Keep in mind that the trendline was established during all kinds of oil-intensity reduction initiatives: ethanol/biodiesel blending, butane blending, LPG vehicles, CNG vehicles, rising CAFE standards, hybrids, etc… EV is next in-line, still not clear if it will have a more profound effect than the others, to the extend that the trend gets broken….
you need to see the plot extend back to 1950s and see the other huge dip in the 1970-80-90s — it is even bigger, so large looked like oil already peak then
Sheng Wu,
We don’t have data back to 1950’s, no doubt gasoline consumption was growing more rapidly from 1946 to 1973 than after the Arab Oil embargo. EIA only has data to 1980. Before 1980 I can only find data on light distillates (gasoline plus naptha) from Statistical Review of World Energy.
light distillate consumption grew at an average annual rate of 5% from 1965 to 1979 and a linear rate of 646 kb/d per year.
Kdmitrov,
Thanks. Note that a chart of C plus C output over the same dates (1986-2019) has only slightly less slope than the gasoline, diesel, and jet fuel chart, about 826 vs 873 kb/d per year.
I agree it will be interesting to see what happens, my guess is the trend will become less steep with time, but I am often incorrect and your guess may well be better.
If the world C C production already almost within 1mbpd of pre-pandemic all time high, and the consumption of liquid already surpass pre-pandeic all time high, then the 2023 data for world Gasoline, Jet Fuel and Distillate surpass pre-pandemic all time high as well?
Sheng wu,
Impossible to predict, we will have data in July 2024, my guess is that it will be slightly below the pre-pandemic level for 2023.
Dennis,
right, precisely. Asphalt, lubricants, petchem naphtas, petcoke, refinery gases – where are they in that 800kbpd/yr?
Not sure linear regression is the way to go, and the C&C fit is not great, but the graphs bring-up the point clearly.
Would you mind telling us what is the avg annual growth rate for your two data sets? Off the top of my head I have oil growing at 1-1.1% over past few decades and transport fuels at 1.5-1.6%… Your linear fit with a constant increment is a bit misleading, since oil volume is larger. %growth is larger for fuels than oil.
I think these growth rates will converge in the 1.5-1.7% going forward, because (1) there is not much more left to be gained from fuel oil and residual oil cracking and (2) the faster non-OECD growth is becoming a larger slice and will start to dominate the world aggregate.
Now, the above prediction is about organic demand growth. If there is no affordable supply coming online, well then that’s that, growth becomes supply constrained.
Kdimitrov,
Clearly the smaller denominator for transport fuel will lead to higher growth rates in percentage terms. The chart sure looks linear so that seems the way to go.
Kdimitrov,
For transport fuel the growth has averaged about 1.77% from 1983 to 2019, for C plus C the larger denominator leads to lower growth rates (1.22% average from 1983 to 2019), the linear growth rates are nearly the same (about 826 kb/d). Growth in transport fuel consumption has slowed to about 1.3% from 2015 to 2019 (792 kb/d linear rate of increase). There is likely to continue to be about 25% of C plus C input to refineries that is not converted to transport fuel as I agree we may be close to the limit of how low this number can go (from 1980 to 2015 it decreased from 44% to about 26%, but has been stuck at about 24% to 26% from 2015 to 2022.) Transport fuel might be limited by peak oil to about 64 Mb/d and will allow about a 600 kb/d average increase in transport fuel demand from 2023 to 2028, if we assume 76% of C plus C input to refineries is converted to transport fuel and peak C plus C output is 84 Mb/d in 2028. If electric transport does not bend the demand curve, then high transport fuel prices will have to do the job.
” If electric transport does not bend the demand curve, then high transport fuel prices will have to do the job.”
Yep…one way or another, its going to happen.
Great comment Dennis, thanks.
Yes, I also have doubts that crude supply can grow at the growth rate of fuels going forward.
EV penetration and fuel prices are actually organically connected, subsidies can only do so much. So if crude supply cannot meet demand and prices go up, the system respond will be a combination of alternative drive (EV, but maybe also more CNG and LPG drive) and demand destruction (less mobility as compared to baseline). It’s not a either/or, but an AND type of response.
This demand response is likely non-linear due to non-elasticity. Some people say $200 oil is where you’d see substantial inflection in demand response, and that is probably correct for OECD. However, OECD is not where the marginal demand is, and non-OECD demand is much more price-sensitive. So I am guessing ~$100-120 oil is the supply-constrained equilibrium price.
Kdimitrov,
Thanks. Perhaps $100 to 120 is a high enough crude price to see a significant change in petroleum liquids transport demand, I think we might need to see $150/bo to see a significant step change, but it is difficult to predict as changes in the EV landscape or infrastructure for natural gas refueling for long haul trucks along with unforeseen changes in technology can be wildcards. Good point that there are avenues besides BEVs, LPG, natural gas, hybrids amd plugin hybrids can all play a role in reducing transport fuel demand. Also more use of TaaS with much of the service provided by BEVs is another way that light duty transport demand could be reduced.
Kdimitrov,
There are other inputs besides crude to the refinery, ethanol, butane, hydrogen, etc. Also where we are using volume rather than mass there will be more volume of lighter products, in addition the volume of asphalt, lubricants, and residual fuel is not large. The refining process is complex and I do not understand it fully. If I converted to mass we would see transport fuels have not grown as fast as crude on a mass basis.
Kdimitrov,
I think we want to look at annual averages and from 2023 to 2025 EIA has World C plus C growing by about 2000 kb/d by my estimate, from about 81.8 Mb/d in 2023 to about 83.9 Mb/d in 2025 for World C plus C based on the April 2024 EIA STEO scenario. Note that I think this is too optimistic in 2025, my guess is about 82.9 Mb/d for average 2025 World C plus C output.
Dennis, right the annual averages show larger growth than Dec-to-Dec because exit rate in 2023 was high.
To me however, it is peak production capacity that is more interesting and that is only growing by 1Mbpd from Dec ‘23 rate. I don’t think that’s enough, if it is an accurate prediction.
Kdimitrov,
It has been enough for the past 40 years, in fact the percentage rate of increase has been decreasing with time.
This is interesting…I asked AI to look for a minimum and maximum of URR discussed here at POB…here’s the result:
“Based on the data available, the minimum estimate for global oil reserves is around 1.7 trillion barrels, while the maximum estimate is around 2.5 trillion barrels. These estimates can change over time as new technologies are developed and as more oil fields are discovered.”
My best guestimate is smack in the middle (2,100 Gb).
Kengeo,
The AI is a summary of what is found on the internet, much of which is inaccurate.
Also note the response is global remaining oil reserves so for URR you need to add cumulative production so the estimate is 3.2 Tb to 4 T barrels for URR, the mean would be about 3.6 Tb, about 1.5 Tb higher than 2.1 Tb.
Also consider figure 8 at link below (3.5 Tb URR)
https://www.sciencedirect.com/science/article/pii/S2666049022000524
Half the EIA estimate is 850 Gb plus 1500 Gb cumulative = 2,350 Gb…is that the amount you had in mind?
Here’s direct quote of that article:
“Subtracting oil produced to-date gives estimates of global reserves of conventional oil at about half the EIA estimate. We then use our estimated URR values, combined with the observation that oil production in a region usually reaches one or more maxima when roughly half its URR has been produced, to forecast the expected dates of global resource-limited production maxima of these classes of oil. These dates range from 2019 (i.e., already past) for conventional oil to around 2040 for ‘all-liquids’. These oil production maxima are likely to have significant economic, political and sustainability consequences. Our forecasts differ sharply from those of the EIA, but our resource-limited production maxima roughly match the mainly demand-driven maxima envisaged in the IEA’s 2021 ‘Stated Policies’ scenario. Finally, in agreement with others, our forecasts indicate that the IPCC’s ‘high-CO2’ scenarios appear infeasible by assuming unrealistically high rates of oil production, but also indicate that considerable oil must be left in the ground if climate change targets are to be met. As the world seeks to move towards sustainability, these perspectives on the future availability of oil are important to take into account.”
Dennis – Can you remind me of the URR your most recent model is using?
To recap:
Produced thru Jan 2024: 1,500 Gb
1P Estimate: 250 Gb
2P Estimate: 476 Gb
1/2 EIA Estimate (Laherrare 2022): 850 Gb in 2021 (now ~800 Gb)
EIA Full Estimate – ~1,600 Gb
– – – – – – – –
1P URR – 1,750 Gb
2P URR – 1,976 Gb
2P plus URR – 2,300 Gb
EIA Full URR – 3,100 Gb
2.7 Tb with 80% confidence interval of 2.5 to 3.1 Tb
Kengeo,
See section 5.1 Table 1 shown below from paper linked below
https://www.sciencedirect.com/science/article/pii/S2666049022000524
Chart from Laherrere et al paper for 2P reserves. my reading of this chart is 2P reserves of roughly 720 Gb in 2020. Note that this chart excludes extra heavy oil reserves in Venezuela’s Orinoco belt and in the Canadian Oil Sands, together these add roughly 400 Gb to 2P reserves.
Here’s the decline of backdated 2P reserves as shown in Laherrere and updated for more recent estimates:
Dennis – These 893 fields make up >95% of world oil production from 16 countries; 6 past their conventional oil peak as of 2010 and 8 more past peak as of 2019….only Brazil and Canada peaking after 2020….
Sorry for the busy table, but I think it helps to show the large spread between 1P and 2PC (245 Gb and 1112 Gb, respectively).
URR of 1P is 1745 Gb as of 2023, a possible higher URR based on peak of each individual country is 2222 Gb, and an unlikely 2PC URR is 2,612 Gb.
A reasonable estimate for future growth is ~66 Gb.
What if? Light versus heavy weight oil influences amount of extract able oil prior to less being extract able. For Gehwar wasn’t north end about 90% prior to declines? For USA texas isn’t 50% about amount prior to declines? Hubbert peak depends upon horizontal wells as well… mostly better for light oil? In that vein if most conventional is light and 2P is heavy then declines in 1P are probably world wide at 75% URR for 1P?
CC,
Most conventional oil is medium to heavy weight oil. Also note that 1P=proved, 2P=proved plus probable so the proved reserves are included as a part of 2P. In addition adding proved reserves gives an incorrect result, only 2P reserves can be properly added. For this reason proved reserve estimates should be ignored and note that in most cases 2P estimates get revised higher over time (this is called reserve growth) so even the assumption that the 2P estimate is correct will often underestimate the actual resource.
Also worth noting that global conventional oil peaked in 2016 and is now 5-10% lower than the peak….
Also worth noting that current levels of conventional oil production are at 2010 levels…
Production in 2010: 83.3 mbpd
2022 production [93.9] (minus US tight oil [-8] and Canada XH [-2.57]): 83.3 mbpd
Conventional C plus C output (excludes extra heavy oil and tight oil) for the World was 71.6 Mb/d in 2010 and in 2023 was about 69.2 Mb/d, unconventional output (tight oil and extra heavy oil) output for the World was 2.8 Mb/d in 2010 and was 12.6 Mb/d in 2023. The 9.8 Mb/d increase in unconventional output minus the 2.4 Mb/d decrease in conventional output led to an overall increase of 7.4 Mb/d from 2010 to 2023. Overall World C plus C output was about 1.2 Mb/d below the 2018 peak of roughly 83 Mb/d. I expect we might see a new peak in 2027 or 2028 which I believe will be the final peak in World C plus C output followed by gradually increasing annual decline rates to about 3% per year by 2075.
Time since backdated 2P reserves peaked: 39 years (Max of 1,100 Gb; current value 450 Gb)
Time since Mexico Venezuela UK peaked: 26 years (9.8 mbpd in 1998; current mbpd of ~3.5 mbpd)
Time since US Angola Nigeria China peaked: 14 years (16 mbpd in 2010; current ~15 mbpd [without tight oil])
Time since US tight oil peaked/plateaued: 5 years
Range of oil reserves remaining 500 to 1,000 Gb.
50% of production capacity peaked by 2016
67% by 2017
88% by 2019
100% by 2025
Years remaining range from 8.6 (1P) to 38 years (2PC); most likely ~25 years remaining based on observed peaks (722 Gb).
Kengeo,
I would refer you to the work of Jean Laherrere.
See for example
https://aspofrance.org/wp-content/uploads/2018/10/35cooilforecast-oct.pdf
On pages 18 to 19 Laherrere shows how URR estimate for C plus C less XH (extra heavy) oil has increases from 2100 Gb in 2008 to 3000 Gb in 2018 using Hubbert Linearization to estimate URR. A nice summary on page 134 of the paper with the URR estimate for C plus C less XH of 2600 Gb and for all C plus C the estimate is 2700 Gb (includes only 100 Gb for XH ultimate, though his estimate for the ultimate for Canadian oil sands and Orinoco combined is 215 Gb, so it seems total crude should be 2800 Gb).
Keep in mind that 4 years later Laherrere increased his estimate of World C plus C URR to 3500 Gb, that seems a bit optimistic to me. The 2800 Gb estimate from 2018 seems pretty reasonable and is similar to my best guess, but like Mr. Laherrere I am often too conservative in my estimates.
I show this link again, because thermodynamics is what will terminate oil production:
Alister Hamilton –
Depletion and Thermodynamic modeling;
https://www.reddit.com/r/peakoil/s/fg71PwA2Vx
YouTube: https://youtu.be/r79rxfOFJJY?si=Z3n9AXE10oTQSNn_
and my own views and calculations:
https://www.peakoil.ch/media/files/the_end_of_oil_covered_230920.pdf
Alister has access to temperature and production data of oil fields, which are out of reach for me. So i have been forced to evaluate other data to check the validity of the thermodynamic modell, and i have used car sales numbers.
Both ways complement each other.
Indeed. It would be really nice if Hamilton and his team could rerun their calcs using your TNE, which is terrific, by the way, and I mean, in the best of ways. I don´t know if they have access to water cuts, GORs and the like but anyway, it should be done.
Thank you very much and sending you my deepest appreciation for your work,
They have the access to all data the university of Edinburgh has. And they have used it. Data which is out of my reach. See the video.
They know my book.
Another one for George.
Petrobras makes ultra-deepwater oil discovery in exploration well in Brazil’s Equatorial Margin
https://www.worldoil.com/news/2024/4/10/petrobras-makes-ultra-deepwater-oil-discovery-in-exploration-well-in-brazil-s-equatorial-margin/
Dennis –
Thanks for the continuous references to Laherrere, they are useful but I think you take much of his analysis out of context…please see the figure below, it is world production excluding North America and Former Russia (USSR).
It’s informative as it shows that 1P for this group is 6 or less years of production, it also shows that production for this 60% group must decline by at least 1.5% (0.78 mbpd each year) even if using your Shock Model.
If 1P and 2P reserves do not grow significantly and quickly, this group will likely see declines of 8-10% in the early 30s. In the worst case scenario that 10% decline rate is already in progress…
I would suggest that you take another look at the basic assumptions in your model…they may not reflect what is currently happening in world oil production dynamics…
Added backdated 2P reserves, they become very short by 2030…
Kengeo,
Where does your backdated reserve chart come from? Are you making it up? We have a chart for the World, but that is all I have ever seen, also your shock model is made up as the shock model has not been done for the areas in your chart, I don’t have discovery data for individual nations to create such models, only World discovery data from Laherrere and ASPO.
The fact is that Laherrere’s URR estimates are exactly what I said they were. What is important is World output and 2P reserves don’t tell the whole story. Thinking that they do and that there will not be future increases due to reserve growth leads to underestimates such as yours. Rather than looking at 2P reserves you should look at Laherrere’s estimates of remaining resources for the 35 nations he analyzes that correspond with the areas in your chart, the 2PC estimate is more likely to reflect reality than the 2P estimate.
Dennis – I see 1P and 2P reserves in a different light, they are the foundation for annual oil production, while they may be higher than stated it is unlikely they are too much lower than stated, hence they set the floor for any growth/decline. Analysis of 2P reserves provides a conservative basis to make future production estimates. Just as 1P and 2P provide a foundation/floor, 2PC and 2PCX provide a ceiling for future production estimates…
You should dive into the data and see if you can really make statements like “there tends to be reserve growth over time”, saying such doesn’t make it so. Or statements like “the 2PC estimate is more likely to reflect reality than the 2P estimate”, do you have an actual rationale for this statement (see graph below)?
I’m certainly not saying that I only expect 1P production or even 2P, but if worldwide oil production has rolled over (which it appears it has), then we need to approach the data from a different angle/perspective.
Below is a graph that does just that, cumulative production and reserve decline on the left, peak Gb and year for each country noted on the right. 1P reserves are trending towards less than 1 year supply by 2027; 2P reserves are doing the same by 2029; 2PCX by 2034. Should expect world decline rate to increase substantially over the next 6-18 months.
Kengeo,
Reserve growth is well known, just look at historical US data for reserves and adjust 1P to 2P by multiplying by 1.7 as an approximation (this is based on UK reserves where they have reported 1P and 2P reserves over time and the ratio long term is 1.7.) The conclusion that reserves tend to grow is based on the data.
For UK 2P/1P see
https://www.ons.gov.uk/economy/environmentalaccounts/datasets/ukenvironmentalaccountsoilandgas/current
The average ratio of 2P/1P is about 1.75 from 1995 to 2021.
For US reserves see
https://www.eia.gov/dnav/pet/pet_crd_pres_dcu_NUS_a.htm
As a simple example using US reserves from 1977 to 2005 (to avoid tight oil period), 1P reserves were 31.8 Gb at the end of 1977, 2P reserves would be about 1.75 times 1P reserves, so 55.6 Gb at the end of 1977. From the end of 1977 to the end of 2005, new field discoveries in the US were 6.7 Gb and from Jan 1978 to Dec 2005 the US produced 68.8 Gb. So we have 55.6 plus 6.7 which is 62.7 Gb of crude that could be produced if there was no reserve growth, but 68.8 Gb of crude was produced, how can that be?
What were proved resereves at the end of 2005? They were 21.8 Gb which suggests 2P reserves of 38.1 Gb. Reserve growth over this 28 period (1978 to 2005) was 44.6 Gb, about 1.6 Gb per year on average. My assertion about reserve growth is based on fact. The assertion that the 2PC estimate is going to be a better estimate than 2P is based on the fact that 2PC plus cumulative production is close to the Laherrere estimate from 2018 and also not far from my own estimate. Laherere’s analysis and my own have historically been conservative (that is they have tended to underestimate actual output), Rystad’s 2PC estimate from June 2023 (1263 Gb) plus cumulative C plus C production at the end of 2022 (1473 Gb) which suggests a URR for World C plus C of about 2.7 Tb which matches Laherrere’s 2018 analysis and my own which I think are both pretty good. Note that both of these estimates are less than many other estimates (IEA, EIA, OPEC, Rystad, and USGS for just a few).
Dennis – Do you really believe that 2P “Most Likely” oil reserves are increasing? I highlighted below that Rystad reported 2018 2P reserves were estimated at 663 Gb, but in 2023 they were only 505 Gb (decrease of 31%). Is this incorrect or do you have other data to indicate otherwise? I think that continuing to misrepresent Laherrere’s body of work is a disservice to him, yourself, and the analysis you present here on POB. Maybe your best guess is this is transitory (like inflation) and 2P reserves will change course and start growing sometime in the future? Or maybe you have no idea and prefer to conflate oil reserve expansion from the 1980s and 1990s periods and think those relationships would continue into the post-peak timeframe? Presently, I’m having a tough time understanding how cumulative production of 1,500 Gb plus 1P reserves of ~250 Gb can result in a URR much above ~1,800 Gb…it seems like your estimate of ~2,700 Gb really misses the mark and there’s not much time to grow/produce 1P reserves to the levels that you think are possbile (500% above current level).
Additionally, your URR assessment of 2,700 Gb would require total annual production to climb to a value 20% above present, but your model has very limited growth above present level (~3%). It’s not clear why there’s this disconnect between URR and production level. Matching work done over the past 25 years correlates well with a peak in the 2013 timeframe.
As time goes on it appears your model is getting further off course, is there a point in time when you would consider revising it to better fit the data? Look forward to your response as it seems sooner than later you will have a major revision to make…
Kengeo,
There are an infinite number of Hubbrt curves that can be fit to the data.
Just because someone produced a Hubbert curve in 2000 that does not match the 2001 to 2023 data very well does not make that curve correct.
In addition the Logistic is a special case of a more general solution. My model combines a conventional oil model, a tight oil model, and a model for extra heavy oil as I have explained many times. The model gets revised as I get new data, the most recent version has a URR of about 2700 Gb, this remains my best guess but it could be off by 200 Gb low or high.
Peak so far is 2018 but I expect a new peak by 2027. Older models did not account for rapid rise in unconventional oil, even in 2013 I doubted tight oil could continue its rapid rise and at that point I didn’t realize the size of Permian resources.
Unconventional oil has been significant but will quickly decline after 2028. Conventional oil and extra heavy oil will decline more slowly compared to tight oil.
Kengeo,
I believe the URR has increased over time. See Laherrere’s work for C plus C less extra heavy oil URR estimates over time in 1998 URR=1800 Gb in 2022 URR=2500 Gb. The 2P reserves decrease, but by less than one would expect if they believe that reserve growth will be zero on average.
I have already shown that US 2P reserves from 1977 to 2005 would have been less than zero without reserve growth, reserves grew at about 1.5 Gb per year over that period, this is not the same as saying 2P reserves in 2005 were higher than 1977, you need to account for cumulative production subtract that from 2P reserves and see if the numbers match up.
As a simple example, lets say 2P=50 Gb in year 1 and 2P reserves are 25 Gb in year 27, in the intervening years there was 160 Gb of cumulative production and 10 Gb of discoveries, with no reserve growth 2P reserves would be -100 Gb, but in fact they are 25 Gb so reserve growth was 125 Gb. It is not so much about 2P reserves growing over time, it is more about they will decrease by less than the total cumulative output as reserves grow and contingent resources are added to 2P reserves.
Hubbert Model fit to 1995-2018 EIA data, compared with shock model which accounts for unconventional having a different output curve than conventional oil. Note that 2023 data for World C plus C is 81.8 Mb/d, the shok model presented has 2023 output at 81.1 Mb/d and Hubbert Model at 79.3 Mb/d, the peak for the Hubbert Model is 79.5 Mb/d in 2020/2021.
So far the shock model is more accurate than the Hubbert Model and actually underestimates 2023 output, this shock model has been revised since June 2023 and the peak is about 83.5.
Dennis –
I see where you are off. By the time 2027 rolls around, the rest of the world will have declined between 3 to 5 mb/d, meanwhile tight oil production might increase marginally (maybe 0.3 mb/d per year), both models above appear to be off. By 2030, your shock model has world production of 83-84 mb/d. The HL model is 76 mb/d. My high and low estimates are 71.5 to 76 mb/d. Laherrere May 2023 is ~69 mb/d in 2030. After looking closely at Texas and New Mexico production, I can confirm my low estimate appears most likely. It is also very simple and fairly close to Laherrere’s estimate from a year ago. From 2023 average production of 82.5 mb/d, annual decline of 1.5 mb/d each year results in 2030 production of 72 mb/d. Suggest you reexamine your shock model in 2028-2030 timeframe as it seems very unlikely to be as high as you believe. Assuming this decline trend continues for 50 years results in a URR of ~2,350 Gb. This also aligns with global conventional peak in 2012 timeframe. Time will certainly tell…
Kengeo,
We will see, the Hubbert Model is likely wrong as it lumps all C plus C output together in this case. Unconventional oil consists of both extra heavy oil and tight oil, conventional output is currently being restricted by OPEC nations with about 1.5 Mb/d of capacity not being utilized. The shock model may be incorrect, output might be higher or lower than the model, my expectation is that is will be far closer to future output than your estimate. The Laherrere paper from May 2023 has some differences from earlier estimates where Mr Laherrere separates crude from condensate in his analysis. His ultimate for crude plus condensate is 2200 Gb in this paper, so he has revised his estimate. In this case I think he is wrong. The earlier 2018 estimate of 2700 Gb seems much more likely based on the data. If we do a Hubbert Linearization on 1993 to 2023 World C plus C data, the result is a URR of 2860 Gb.
An alternative would be to take the range of Laherrere estimates say 1800 to 3500 Gb and take the average which would round to about 2700 Gb (assuming 2 significant digits.) I think that estimate would be on the low side, but only by 100 Gb, maybe 200 Gb.
Dennis – So when will 2P + cumulative “reverse the curse”…if it hasn’t happend yet and you agree that peak conventional oil already passed (which you do based on your analysis here)?
The way you arrive at your 2700 / 2800 Gb URR is a bit troubling, I could see you stretching it to 2,200 – 2,300, but not to what you have it at…we continue to agree to disagree on most likely URR for oil…
I think this years Rystad report will be especially telling…we’ll see in ~2 months…
Dennis – Here’s a closer look at 2P shrinkage vs 1P growth.
1P, 2P, and production all converge around 1,650 Gb in 2029.
I think well before 2029 we will see significant decline and production will flatten out a bit.
2P should also stop dropping so rapidly and 1P should increase a bit.
It does appear that 1P and 2P will converge between 1700 and 1850 Gb, which yields 10-20 years of production at lower levels…
This is what the decline phase of peak oil looks like…
Tight oil appears to be topping out at current price levels. How long will they be able to maintain the hamster wheel in good order?
https://oilprice.com/Energy/Crude-Oil/US-Crude-Production-To-Decline-In-2024-As-Shale-Activity-Stalls.html
it is a good pause of reckless drilling and fracing, it is time to take a close look at the venues to optimize.
The news article says it will continue to rebound in 2025 though.
The price will definitely need to climb to well over $80 or better $90 in order for this rebound to happen.
New war rumors between Israel and Iran are rattling through the newsrooms.
Oil is reacting.
Discussion about reserves is somewhat academic when 2 important variables are not used: Politic stability and plain and simple oil price.
10$ in price up and down are very important.
Eulenspiegel,
Historically there has been political instability and significant changes in oil price. I am looking at historical data for reserves where all of these factors have been operating. Nobody can predict future events or future oil prices, it is quite obvious these will be factors, but knowing what will happen in the future is simply unknowable in my opinion.
Iran seizes Israeli ship
https://www.reuters.com/world/middle-east/ukmto-receives-report-incident-50nm-northeast-uaes-fujairah-2024-04-13/
The missiles and drones are coming
https://www.bbc.com/news/live/world-middle-east-68737710?src_origin=BBCS_BBC
Hard to imagine this won’t affect oil markets substantially when they open tomorrow evening.
I’m expecting a gap to $100 at opening. But this has to expands to more than just a weekend of strikes. For those prices to stick and continue to go higher.
Or not lol. This is why I’m not a commodities trader
A response attack is imminent so they say now.
This morning it was we don’t want to escalate. Oil down. We shall see how oil prices respond if this escalates.
Dennis – We can certainly use much older data/analysis, my point is that we now have data that supports peak conventional oil date of >10 years ago…it also agrees well with work done nearly 30 years ago…(Al Bartlett, 2000).
As Bartlett points out: Edwards (1997) – EUR = (2.4 /- 0.4) x 1012 bbl, and Peak Date = (2010 /- 11 yrs).
This is very much in line with the observed world average peak in 2013 (slightly lower) but slightly higher than the average of all scenarios.
Adding 2P Reserves plus cumulative production results in 1,950 Gb URR…growth and revisions may push the overall URR higher (or lower), we can only speculate…
If we take the annual average production between 2009 and 2012 (26.6 Gb) this also suggests that URR is 1,950 Gb.
It’s telling that in the decade since global peak conventional oil production that 2P reserves are shrinking faster than production. In 2018, Rystad indicated 2P reserves of 663 Gb plus cumulative production (1353 Gb) is a URR of 2,016 Gb. By 2023 that dropped to 1,975 Gb (2P = 505 Gb plus C.P. of 1470 Gb). This implies 2P reserves are actually shrinking by ~8-9 Gb per year (about 1.5%). If we expand this trend another 5 years assuming production can continue at current pace (likely a bad assumption), then we could expect C.P. of 1,615 Gb plus 2P reserves of 325 Gb, for total URR of ~1,940 Gb in 2029.
2P reserves are the best estimate for what’s economically viable over the next several years or more (hence why it’s called “Most Likely”, it’s interesting that as of 2023 Rystad shows almost 800 Gb more 2PC than 2P reserves…the delta between 2P and 2PC was less than 500 Gb only 8 years ago…this implies that for some reason reserves are getting held up in the 2PC category and not making their way to 2P, likely a combination of economic, technical, and other factors. But we can rule out discoveries since that would amount to 50 Gb per year which is definitely not the case…
Kengeo,
Peak conventional was about 8 years ago (2016) with cumulative output of 1273 Gb, if we assume this occurs at 50% of URR then a 2550 Gb URR for conventional is implied (very similar to recent Laherrere estimate in 2022). MY current shock model had roughly 2500 Gb for conventional oil and about 200 Gb for unconventional oil (extra heavy and tight oil) which is close to the middle scenario (3000 Gb) by Bartlett. Note the observed global peak (up to current date) is 2018, though it is possible this may be surpassed in the future (2026 to 2028 would be my guess).
Double Trouble: https://wattsupwiththat.com/2024/04/12/net-zero-fossil-fuels-are-leaving-us-before-we-leave-them/
This will get the WUWT’rs in a tizzy. They have a cornucopian oil industry vet named David Middleton posting there a lot who has pretty much indoctrinated everyone
https://wattsupwiththat.com/author/debunkhouse/
Rig Count for the week ending April 12
US Hz oil rigs dropped by 2 to 455. The rig count continues to hover close to 450 since the beginning of October.
– Permian rigs decreased by 1 to 299 and also have been flat around 298 since October 2023.
– Texas Permian was down 2 to 199 while NM was up 1 to 100. In New Mexico, Lea county was flat at 46 while Eddy added 1 to 54. Eddy county rigs have stabilized at the 55 level over the last few weeks,
– Eagle Ford dropped 1 to 47.
– NG Hz rigs dropped 1 to 98. (Not shown).
Frac report is for the week ending April 12.
The frac spread count was down 5 to 252 and is down 31 from one year ago. The frac chart is starting to show a slow declining trend in the frac spread count and could drop below 250 in the next couple of weeks if the trend were to continue.
If we look at the production of oil and gas in Permian in the link below,
https://www.eia.gov/petroleum/drilling/pdf/permian.pdf
we see that GOR is climbing up steadily and now out of control almost,
I did a rough calculation of the GOR (MCF/bbl) at the beginning of each year, and here is the table,
2014, 3.33
2015, 3.28
2016, 3.16
2017, 3.26
2018, 3.30
2019, 3. 20
2020, 3.36
2021, 3.59
2022, 3.80
2023, 3.74
2024, 4.13
at this pace of increase of GOR increase, i.e. 2024 @ 0.4mcf/bbl each year, i.e.we will see GOR topping 6MCF/bbl by 2030? The current gas processing capability will be outrun, and negative gas price …
This sharp increase of GOR is most likely the peak of Permian and fast decline that will follow.
Sheng WU
Attached is a chart using the DPR data.
Clearly Permian GOR is on the rise. The GOR appeared to be in a seasonal pattern up to Jan/Feb 2023 and then it took off.
Long term trend for 2014 to 2024 for Permian GOR is an annual increase of 0.063, from July 2020 to Jan 2024 the annual rate of increase in GOR(using OLS) is about the same as the longer term trend for the Permian basin. Once we see the completion rate start to fall sharply in the Permian basin we may see a higher rate of increase in GOR.
yes, Dennis
new wells help to tamper or cover up the fast GOR rise as it is evidenced before the peak, i.e. when the production is still ramping up or when back to production after Covid.
The pause of production on Jan-2020 is followed by a sharp increase in GOR, ~0.4MCF/bbl, and then stablized for 2 years. This pattern seems to indicate that the slowdown in new wells completed is really doing the GOR increase, while shut-in of old wells does not seem to do the GOR much worse or good.
Shengwu,
I would expect GOR will increase over time, another factor has been the increasing proportion of Permian output from the Delaware Sub-basin which tend to have higher GOR than the Midland Sub-basin. The proportion has increased from about 49% to 54% from 2018 to 2023.
that’s true for Delaware’s higher maturity, GOR and lighter oil , Dennis!
But the EIA report in February of heavier Permian oil is definitely a result of PVT separated oil.
It is actually a rather counter-intuitive fact, that the produced oil actually gets a little heavier when PVT induced bubble point happens, suppose heavier liquid are left underground, and even lighter oil and gas should come out.
The negative price right now in Waha is most likely a result of previous natural gas plant process and pipeline capacity being overrun by fast rising GOR while oil production is not going down fast yet.
the GOR for 2014 to 2024 has been quite closely hovering around 3.2-3.3 from 2014-2020, making us believe that Scott Lapierre’s bubble point death is not that serious. But now, the oil production is still inching up but GOR is all boiling already.
The Saputra paper for Permian URR prediction we discussed actually give a URR GOR at about 4.8MCF/bbl, and if in 2~3 years we already pass that and the ultimate URR GOR will be around 5.4~5.7MCF/bbl, then Permian will have URR oil further shrink 15~25% which is much closer to your numbers.
there is another devil in the detail of GOR, I made a video about using a GOR template to see if the GOR is stable uniphase.
https://youtu.be/tODaBG9RAdE?si=65AA1NLZlMooFCAI&t=243
If you have unstable GOR in the middle of the V — then it is not stable to be in uniphase, and for shale oil, this means it is experiencing bubble point big time.
In the past year, Permian increase oil production by 320K BOPD, but gas at ~3.2BCF PD.
This translate into increase oil and gas production at a GOR of 10MCF/bbl, which for Permian depth and overpressure, fall right in the middle of the V unstable region.
This is a really magic — if we have the isotope values for C123 of the produced gas, we will know the maturity and the original GOR, and compared to produced GOR, we could see the phase and pressure change at the reservoir.
The 180~200K BOPD increase in Bakken is accompanied by 500MCFPD of gas increase, which gives 2.5~2.8MCF/bbl — still in the stable region.
High inflation is a condition that the central banks try to fight with high interest rates, which is an attempt to dampen economic activity. Harsh medicine to swallow in order to achieve the desired result. I’m sure they (and we) wish there was a way to achieve the result of constrained inflation without the pain of higher credit rates.
The fight to offset inexorable fossil fuel depletion requires aggressive new project development.
Higher interest rates affect the funding viability of all sorts of energy projects whether we are talking about oil drilling, pipeline or refining projects, or a nuclear plant, or a photovoltaic project, or a hydroelectric dam, etc.
We may be entering a new long trend higher inflation. This will be coupled with lower economic growth rates than when we (the world) was younger. As I have said previously, a trend towards long term stagflation looks likely.
What are some of the big factors that look to be stoking a long inflationary trend? The big factors that I am aware of are
-Higher energy input costs
-Higher cost of other finite inputs such as fertile land, fertilizers, all of the metals, and labor supply in aging countries
-A roll back in globalization of labor, material supply and manufacturing. Globalization has allowed a massive reduction in pricing around the world. Trade barriers such as tariffs, geopolitical barriers and strife (ex Houti disruption of shipping), and isolationism policies are examples/categories of globalization rollback.
A decades long period of stagflation may be just what precedes the onset of the big contraction.
Hickory,
Currently inflation is not very high at least in the US, poor estimates of shelter inflation are leading to an artificially high CPI. If we leave out this poor estimate inflation is close to target of 2%. Although oil cost is increasing, natural gas prices are quite low.
Inflation is currently high enough that the interest rate cuts have not been as effective as most would have guessed and hoped for. Secondly, while you may state that rates are not too high, if you check in with most people they will tell you that prices of common things like groceries and housing costs have gone up a lot.
My comments were directed to the longer term. I wouldn’t be surprised at all to see episodes of fed rate cutting here and there, but these attempts will be less successful than in the past 30 years and it will be a fight against a rising tide. The big tide wins, even against the fed.
Hickory,
I cannot predict long term inflation, but I think oil price increases will be less of a problem than you believe. What the average person believes is the case, is often far from reality, inflation is not as high as people believe.
See for example
https://www.zillow.com/rental-manager/market-trends/united-states/
In the last 12 months average rents in the US have fallen by $95 per month (about a half a percent), but the US CPI has shelter costs rising at an annual rate of 5.6% and this represents over a third of the total CPI. If we remove this bad estimate from the CPI (everything except shelter cost) the annual rate of inflation is about 2.3% per year.
See
https://fred.stlouisfed.org/series/CUSR0000SA0L2
annual rate is 283.07/276.62=1.0233 minus 1=2.33%
The shelter cost is a lagging indicator which the BLS fails to account for.
Another report on US rents
https://www.rent.com/research/average-rent-price-report/
and also
https://www.apartmentlist.com/research/national-rent-data
Hickory,
It is correct that prices rose a lot in 2021and 2022, they have stopped rising as quickly in the past year. Without shelter cost we are already at close to the 2% target inflation rate, the BLS does a poor job at estimating shelter cost in a timely fashion.
There have not been interest rate cuts since the recent Fed increase, they simply have stopped raising interest rates any further. The cuts in interest rates are expected at some point in the future, maybe Q3 or Q4 of 2024. Part of rising housing costs higher interest rates due to the Fed fighting inflation, for those who already have a mortgage (from before the Fed raised rates) they are not affected, for those whose rents could not rise during the pandemic, because the government had a moratorium on evictions during the pandemic, this policy has ended and people are being evicted and rents raised (this was more difficult during the moratorium on evictions). This results in a step change in housing costs due to government intervention.
Lots of turmoil in the economy and government action at the Federal level is impossible with a House of Representatives that is dysfunctional.
The information I can find suggests rents rose a lot (for the reasons I just described) and have steadied in the past year. See chart below.
Median rents rose on average at about 4.5% per year from Jan 2017 to March 2024, from Jan 2017 to Dec 2020 they rose by 1.9% and from Jan 2022 to March 2023 they rose by only 0.2%. The big increase occurred in 2021 when the federal moratorium on evictions was ended by the Supreme Court, in that year the annual rate of increase in median US rent for apartments was 21%.
I can tell you now, no one on the street is buying that. CPI had dubious veracity in the past, but the last few years have shown how cooked things are.
I’m sure the voters will look kindly on the admin that is gaslighting them on how, actually, inflation is fine and under control. It’s like how in Europe, they talk of energy prices falling to near norms without pointing out that they’re still double what they were pre-2022. There’s a reason Germany is shutting down so much heavy industry, and it’s not because of vibes.
Ignoring, of course, that prices still rose precipitously and have not gone back down. The media and gov’t wonks talking up disinflation as if it means things are cheap again is probably the most disingenuous move they could make in an election year.
I agree, I think the way CPI is measured is biased toward the looser end of monetary policy. Credit need to expand or else the global economy ponzi scheme grinds to a halt.
Iron Mike,
Interesting opinion any experts to back that up?
Consider
https://www.pricestats.com/inflation-series?chart=1837
and
https://thebillionpricesproject.com/datasets/
A poll on experts in the subject would likely tell us that the government inflation data is pretty good.
Dennis,
I am not like you. Believing every “expert” and government data. Your appeal to authority is nauseating. Just like when you were peddling your mate Powells company line “inflation is transitory”.
Iron Mike,
So just your opinion then, I will ignore. Yes the inflation was transitory was wrong, that was Paul Krugman’s opinion. Note that the opinion that it would require a severe recession to bring inflation down, the opposing camp in that debate, also proved incorrect. Experts do not always agree, but when they do they are not often wrong. Except when there is a shift in scientific understanding, see Kuhn’s Structure of Scientific Revolutions.
https://en.wikipedia.org/wiki/The_Structure_of_Scientific_Revolutions
Just curious, do you know everything? No reliance on expert opinion? If you had cancer would you use the internet to solve the problem?
The billion prices project is a check on government inflation data, so not government data.
Do you believe any data? Without it there is not much basis for discussion in my view. Maybe you could give us this impeccable data and we could discuss?
Dennis,
I’d consider medicine a hard science, but even advise given by an “expert” in that field id take with a grain of salt and look at second opinions and counter arguments.
The field of voodoo pseudoscience such as economics my grain of salt is HUGE. Economic experts don’t know shit about anything. Its just speculation and conjecture as far as i am concerned. One thing we know is that as long as the credit flows the economy continues, thats what the fed wants. Wallstreet needs to be kept happy. Thats the U.S system in a nutshell. An obvious contributer to inequality.
Maybe you out to think for yourself once in a while, you are a capable guy with a sound mind as far as oil goes.
Dennis,
You pretend to be humble while pandering to authority and institutions. The same institutions which benefit from inequality and spout nothing but propaganda. Keep patting yourself on the back though.
You’re too naive to see you are living in an oligarchical corporatocracy and the ballot box gives nothing but the illusion of choice, since both parties are bought and lobbied by corporate interests and the military industrial complex, while the mainstream media just divides the peasant class further and further.
Lets agree to disagree because we are never going to see eye to eye on this topic.
Kleiber,
The man on the street knows very little.
Inflation is prices increasing, if inflation is zero prices don’t decrease they stay the same.
The fact is inflation is low, if you want prices to decrease, then you are looking for a depression, personally I think that’s a bad idea.
Link below shows periods of deflation
https://en.wikipedia.org/wiki/Deflation#/media/File:CPI_1914-2022.webp
Right. And this addresses my point how?
Kleiber,
I was responding to:
Ignoring, of course, that prices still rose precipitously and have not gone back down.
Inflation is the rate that prices increase, if inflation was zero, prices would not be expected to decrease. Prices only decrease during severe recessions or depressions, do you think a depression would be a good idea? Perhaps we have different opinions on this.
Energy prices were very low during the pandemic, which essentially was a depression level of economic activity. Are you longing for a depression?
You seem to think a state of recession/depression hasn’t been the case for a large chunk of the Western population for a long, long time.
Pointing to things like flatscreen TV prices dropping, as many pundits do, and stating we’ve never had it so good, belies the hollowing out of the middle-class and crushing of the working class that’s been happening since the ’70s.
It works in the favour of the powers that be to gaslight everyone over this. It is not a new phenomenon and will not be ending any time soon, much like saying unions were the reason for economic stagnation instead of, oh, capital getting greedy and financialisation and redistribution of productivity gains.
If a depression brings about the end of the neoliberal order, I’m all for it.
Kleiber,
Things were better for blue collar workers when unions were strong in my view. Last I checked we do not live in a perfect world. The CPI data is fine, real median income has lagged in the US relative to GDP per capita income has become less equally distributed. Some of this is unions, some is regressive tax policy, there are certainly problems, but I am not in a position to fix them.
The depression you seek may lead to a neo-facist government, personally I am not a fan.
The West is looking at getting some decidedly fashy looking people regardless. The neoliberal model has made people move to this, not the move away from it.
If Brexit and Trump in 2016 didn’t alert people to not doubling down on the system as is, I don’t know what to say. This isn’t just a US thing, it’s across Europe and the Westernised Anglophone nations and all the ones that have basically become financialised service economies since the ’70s.
The US basically expediting the decline of its hegemony over the last two years isn’t going to make the matter any better if BRICS displaces America at the forefront of commerce and military clout.
Kleiber,
I am in the US so am more aware of stats here, we have not seen 25% unemployment rates since 1933, that was the last time we saw significant deflation in the US. Generally deflation occurs during a severe depression, otherwise we see inflation, in most cases in the US inflation has been relatively moderate typically 2 to 3%. I agree there has been a rightward shift in politics.
Global headline CPI inflation (GDP weighted) data from
https://www.worldbank.org/en/research/brief/inflation-database
Dennis, when I mentioned one of the big long term inflationary drivers being “Higher energy input costs”
I was not just referring to oil. Whether it is new oil production, or nuclear plants, or photovoltaics, or wind, or geothermal, and /or batteries, EV’s, fuel pumps, transmission capacity, building retrofits, carbon sequestration, etc…all of this will add up to increase cost inputs just to keep running in place on energy over the next three decades.
Hickory,
The EIA estimates using AEO for prices and IEO for energy demand suggests total fossil fuel costs will increase at about 1.5% per year on average from 2025 to 2050 (in real 2022$). In the US electricity prices remain between 10.5 and 11.5 cents per kWh for all sectors from 2025 to 2050 in 2022$, for residential average US electric rates the price is expected to be between 13 an 14 cents per kWh (2022$) from 2025 to 2050. The global average electricity price is about 15 cents per kWhr in 2023, the EIA does not attempt to predict future global energy prices, I have used US prices for coal, natural gas, and oil finding global prices is more difficult and predicting future prices even more difficult.
Not clear the real prices of energy will rise significantly and possibly by less than real GDP is likely to grow (2 to 3%) so energy costs as a percent of World real GDP may actually fall over time as fossil fuel energy is gradually replaced with non-fossil fuel energy and as energy is used more efficiently.
Well, that would be nice for the sake of stability. I’ll include that scenario in my range of possibilities.
U.S. Crude Production To Decline In 2024 As Shale Activity Stalls
High decline rates for shale wells usually set in soon after commissioning, meaning extra well completions are required to offset declines from existing wells if output is to be maintained. Unfortunately, StanChart has reported that the horizontal rig count started to decline sharply in early 2023, and is currently 20% below its post-pandemic peak after flatlining for the past six months.
The analysts point out that whereas the completion of previously drilled wells and technical change provide an offset, a significant fall in activity, more often than not, leads to a lagged decline in growth. The analysts have predicted that U.S. crude output will clock in 300 kb/d lower than the pre-pandemic peak by the end of the year.
Wall street or oilprice.com just report the rig number and DUCs, but expert engineers tell you the hidden agenda.
The Permian GOR is exploding.
Shengwu,
Using EIA tight oil and shale gas data for Permian basin (see links below)
https://www.eia.gov/naturalgas/weekly/img/shale_gas_202402.xlsx
https://www.eia.gov/energyexplained/oil-and-petroleum-products/data/US-tight-oil-production.xlsx
I get the following for GOR for Permian Basin. If the trend from 2012 to 2023 continues to 2030, the GOR returns to roughly 4 MCF/bo in 2030 (Feb 2024=3.32 MCF/bo).
Dennis,
I guess that EIA has two different datasets for Permian, and the one I used is based on all oil and gas including conventional legacy?
Using the 2 Excel files from EIA you give above, I average 12 month oil and gas production, and use the “change in Gas” divided by “change in oil” and generate the “GOR change”.
I still see that in 2023, the “GOR change” exploded to 10MCF/bbl, for Permian while Bakken is stable.
I looked into Pioneer GOR, and see their oil stays at ~500K BOPD for the past 3 years while Gas jumped from 0.8MMCFPD to ~1.8MMCFPD now — exactly as Scott Lapierre predicted, if not worse. Now, Pioneer is experimenting reinjecting the gas into the wells to do huff-n-puff, and hope it will slow GOR increase…
Sheng Wu,
Comparison of Bakken and Permian GOR Jan 2012 to Feb 2024. Both have risen at about the same linear rate over this 12 year period. The exponential rise for the Bakken has been about 12.3%/year and for the Permian basin about 5.1%/year.
Also keep in mind the Permian data from March 2023 to Feb 2024 may be inaccurate. Best to focus on Permian data only through Feb 2023 and Novilabs data is better than the EIA data (in that case probably just through Sept 2022 as the report is 6 months old.)
Dennis has to be one of the most anti-conspiracy theory people on the internet. Which is admirable.
I assume this comes from a career in data analysis?
The hard part for this site is finding the best data. People usually want to charge a lot for good data. Which is understandable.
Enno Peters had the best free data. I don’t blame him at all for monetizing it.
One thing that has me perplexed is demand. Hasn’t world oil demand exceeded most of the expectations? Or am I wrong on that?
Why is demand still increasing at present rates? I see more EV all the time. My town still has few Tesla, but that is primarily because we live far from a city where they can be serviced. Many now have plug in hybrids, which make more sense in rural areas.
Shallow Sand,
Thanks.
Yes good data is hard to find, you need a high skill level in computer science (which Enno Peters has and I do not) to scrap the data from state oil and gas agencies, I applaud Mr Peters for being able to monetize his work.
On oil demand, we only get consumption data once per year for the fuel that is important (gasoline, diesel, and jet fuel) from Statistical Review of World Energy and the OPEC ASB (around July) so currently we don’t have good data for World demand for gasloine, diesel and jet fuel (or crude input to refineries) beyond 2022, we will have to wait another 3 months for the 2023 annual data. We do have estimates for World “liquids”, but this includes LPG, biofuels, residual fuel, etc and I don’t think that number is very useful.
Not sure if World demand has exceeded expectations because I don’t have recent data. I suppose oil prices are higher than I expected so from that perspective demand has been higher relative to supply than I expected, in short I was wrong.
This happens frequently, so I am not surprised.
On demand-
“TOKYO — The global petroleum market will experience an oversupply in 2025, in large part due to the slowdown in Chinese demand, International Energy Agency forecasts released Friday show.
Supply will exceed demand by 200,000 barrels a day, marking the first glut in two years.
China is a key factor. The nation’s daily oil demand is expected to grow by 300,000 barrels in 2025, down from 500,000 in 2024. In 2023, China accounted for 80% of the demand growth among nonmembers of the Organisation for Economic Co-operation and Development. Its share is projected to shrink to 43% in 2024 and 27% in 2025.”
Notably they are not projecting a fall in demand, rather a fall in demand growth.
Thanks Hickory,
Yes my expectation is the rate of growth in demand for transport fuel may fall gradually to zero by 2030 or so and then the absolute level of demand for transport fuel might begin to decline after 2032 or so. China has sold quite a few plugin vehicles over the past few years and sales may continue to grow (but likely at slower rates in percentage terms) over the next few years. About 8 million plugin vehicles were sold in 2023 in China about a 37% market share of light duty vehicles sold in 2023.
https://insideevs.com/news/707264/china-plugin-car-sales-2023/
In 2024 it is expected that 10 million plugin vehicles will be sold in China.
A quick calculation is to assume each of these replaces a car that averages 35 MPG and drives 10k miles per year, that is about 286 gallons or 6.8 barrels per car. Multiply by 18 million vehicles and that is 122 million barrels per year, divide by 365 and that amounts to about 335 kb/d less demand than an alternative scenario where those 18 million vehicles were ICEVs. This may have something to do with the prediction of less demand growth in the future.
China registered 10% increase in crude import in 2023 AT ~11MBOPD, and probably has some extra unregistered Russian crude, but assuming all increase went to processed fuel export.
China coal consumption also up 8% in 2023 (5.2 Billion tons) compared to 2022 (4.8 Billion tons),
North Dakota February Oil Production
February production rebounded by 144 kb/d to 1,247 kb/d. ND was hit by a severe winter storm in January.
Dennis,
I did a video about using incremental/differential GOR (incGOR) to see production pattern in Permian and Bakken.
https://youtu.be/hoJlZqYulZo
In 2023, the incGOR for Permian is really picking up and this implies decline in acreage quality and boiling of GOR, and fast decline to follow in Permian? Bakken is a lot better somehow?
Bakken Total Organic Carbon is 18% in the immature section. It is very oily and little tendency to generate gas on maturation.
David,
There is a couple of points that I wish to clarify here about Bakken shale oil.
1. The majority of the drilling in Bakken is still in the 4 core counties with the right maturity, i.e. Ro~0.8~0.9. Even though Continental tried Divide Co. quite hard, it is still a marginal county.
2. In the core 4 counties, there are vertically several drilling targets, i.e. Middle, Lower Three Forks(1st, 2nd, or even 3rd benches). These tight rock (nonshale) targets all have close to zero Total Organic Carbons(TOC), and they got oil from the upper and lower Bakken sahle with well over 10% TOCs. Clearly, if the producing target have the right maturity, and they sources from the lower and upper Bakken shale with high TOC, then upper and lower Bakken shale with high TOC must have the same maturity. But, the conventional or mainstream maturity measurement tool, i.e. Tmax, often underestimate the maturity, to usually below 0.6. The much older maturity reading tool, i.e. vitrinite reflection, also have large error, although its average with big datasets are better close to 0.8~0.9.
The reasons the mainstream before shy away from the high TOC shale is based on these assertions:
A. The maturity is low — that’s because someone just got totally fooled by Tmax, even Jarvie, the Tmax father, advise people not to use Tmax here for maturity reading, as a fact Tmax reading gives Ro=0.5 in the lower or upper Bakken. In China’s lower Chang7-3, the Tmax reading gives Ro=0.5, while abover shallower Chang7-2 gives Ro=1.0.
B. There is no porosity in the high TOC shale in the oil window. Unlike in gas window shale, where the nano-sizes sponge like pores are prevalent in TOC materials, there is very few such nano-pores visible in oil window shales. The reason is similar to the “C”, where the oil is dissolved with TOC and not leaving even under vacuum. But they could still be produced with water stimulation, and this is now a proven fact, in Bakken and also in China’s Chang7-3 shale, where TOC is as high as 25%. The conventional porosity tools often reads 1% for the upper and lower Bakken and 5% for the middle, but with Density Difference porosity readings are more like 7~10% for the upper and lower Bakken.
C. Oil are dissolved in TOC and not producible, Jarvie, invented the Oil Saturation Index, which is the ratio of producible oil measured when heating below 350C against the TOC measured when heated over 400C. The problem for such heating based measurement is that in the fracing, the rocks are subject to water at high pressure, but not under high temperature more than 150C. The current OSI for lower and upper Bakken are all below the producible limit, and with the above “A,B”, mainstream nailed 3 times on upper and lower Bakken. The test under water fracing could have a totally different OSI number.
The latest production in Bakken and China’s Chang7-3 high TOC shale seem to successfully debunk the above 3 assertions.
Shengwu,
Perhaps looking at incremental completions vs incremental oil would be more instructive, but keep in mind that the EIA estimates for the Permian basin are not very good. Novilabs data through Dec 2022 for Permian would be more accurate.
Lots of noise in incremental data, not clear much can be learned from such a noisy set of data.
Dennis,
I compared the 3 data sets, i.e. 1 from NOVI (April 2023) and 2 from EIA, 2 Excels and the EIA Permian PDF, they are quite consistent in terms of trend or the differential actually. The main difference are the base numbers.
The incremental data is noisy if you only compare adjacent 2 months, that’s why I used 12 months moving average. You could see the oil change, and GOR change is quite smooth in my video and the trend are quite easy to see.
ShengWu,
I used 12 month average for oil and Gas then took the GOR using 12 month average gas divided by 12 month average oil, sill a very noisy plot in my view, this uses the DPR data. These types of incremental plots will always be very noisy and are not very useful in my view.
Permian natgas hits 15-month low as negative prices linger
“Natural gas prices in the top U.S. shale field hit their lowest level in 15 months this week and continued to trade in negative territory as a supply overhang shows no sign of quickly abating.
Prices at the Waha hub in west Texas closed at negative $2.99 per million British thermal units on Monday, its lowest since December 2022, according to data from LSEG. Waha gas has been trading negative for 23 out of the past 25 days, meaning producers are paying to have their gas taken away.
Natural gas in the Permian and across the U.S. has been oversupplied following a warmer-than-expected winter, offtake constraints, and operational issues at a major liquefied natural gas plant in Texas.
Despite negative Waha gas prices, production in the Permian is expected to rise next month alongside oil output, the U.S. Energy Information Administration (EIA) said this week in a monthly report.”
How is it possible to continue to produce at -2.99/Mbtu
https://boereport.com/2024/04/16/permian-natgas-hits-15-month-low-as-negative-prices-linger/
Ovi,
For Pioneer in 2023 the average price received for Natural gas was $2.59/MCF according to annual report. EOG (one of the larger operators in Delaware sub-basin received $2.70/MCF on average for Natural gas in 2023. The larger operators may contract for natural gas pipeline capacity and there may not be enough for everyone, the smaller operators may get stuck paying to have their natural gas taken away if they are unable to flare the gas due to environmental regulations.
the contract or hedged prices also have a size limit for each operator, if Pioneer signed an annual 1.5BCFPD contract, anything above that as a result of run-away GOR they better just pump it back to the old wells in hope to puff out more liquid.
The following chart compares the centered 12 month average of GOR with the centered 12 month average of the completion rate in the Permian basin.
Dennis,
I have trouble uploading image or other file, so I hope this onedrive link share will work below,
https://1drv.ms/x/c/2171cbedec0e0c3c/EWSZgiiEtYtHq5i-ky4uyooBuv_CvtKBy9VGYHty4SCJ2g?e=L7moCA
The key here is to use or plot the “difference” of previous 12mon with forward 12months — you could play with 12 or 6 or 3 to get less noisy or more sensitive resolution.
I think that 12month moving average “difference/incremental” tells in advance the drilling acreage or GOR boiling or higher GOR acreage or lower rate of completion; to tell exactly what is the cause, we need more analysis, e.g. isotope that tell the original maturity and GOR and coupled with original depth pressure to tell.
For example, from Nov. 2018, Permian completion rate was still high or held flat for another 12 months, but the “incremental or differential” GOR (incGOR) already start to obviously going up, and then from April, 2019, the “covid” effect kick in and we see the fly away of the incGOR. This past 2023, we again see the incGOR to fly, without a “covid like cliff” yet, only a winter, but Bakken did not have this fly up in incGOR this time, only small increase.
Shengwu,
My earlier plot was of the 12 month difference. seems not that useful.
Sheng Wu – Here’s the image I think you were trying to post, size limit is 55 kb…
Thanks Kengeo! yes, that’s what I want to post with 12m average
It seems that with the completion rate in the past 2023, and acre quality, and GOR increase rate will be 0.4MCF/bbl each year, even though we might still see production hold flat for less than a year and then roll off real fast.
Shengwu,
What I see is that the incremental GOR increases when the completion rate was relatively steady or decreasing in late 2022 and 2023, unclear if this will continue and also not clear the recent data is good. Both EIA data sets are suspect and the Novi data is not very good beyond Dec 2022.
Dennis,
I agree that the EIA and NOVI data sets are not that accurate, and such inaccuracy makes simple plot hard to tell the difference from the noise or offsets. For example, using NOVI data sets. they are saying GOR increase is moderate or easily masked by new wells. But, over the time by widening the average window, these data sets will tell you the fact out of the noise; and the differential or incremental just amplify the difference and help forecast several months to a year or so.
Shengwu,
There is enough noise at random intervals that such an approach will lead to false positives where one thinks they see something that is just noisy data due to weather events or other factors, such as end of year capital constraints. The incremental GOR will see large rises and falls due to changes in completion rates which occur for many reasons (weather, lack of frack spread availability, wild fires, earth quakes, changes in regulations, etc).
Note that there are a number of spikes in Bakken incremental GOR which don’t really tell us much.
GOR is certainly higher in the Permian basin than in the Bakken/Three Forks, particularly in the Delaware sub-basin. As activity has become higher in the Delaware sub-basin since 2018 this has raised the overall GOR of the Permian Basin, also older wells will have higher GOR than newer wells so as the proportion of older wells increases we expect the average GOR for the Permian as a whole to rise, none of this seems surprising.
Dennis,
I agree with you that the incGOR is affected by many factors, not just the quality or the deterioration of bubble point in the acreage, but also completion and weather etc.
However, I would like to add that the incGOR is not just incremental or differential, but also with a variable average window width, i.e. from 1 to 12 or more months. This average reduce the noise, while the differential or incremental amplify the changes.
This incGOR offer a different angle to look at the GOR change in each basin. For example, NOVI did an analysis comparing all basins GOR change.
https://novilabs.com/blog/why-is-gor-relatively-stable-in-the-permian/
They seem to indicate GOR increase in Permian is really smaller than Bakken,
“The Williston has had the most dramatic rise of all the major plays”,
especially over the time. But using incGOR above, we see a different picture, this is similar to their figure that followed, but really offered comparison of latest wells to previous window defined — that’s what I want to emphasize the incGOR change in the past 3 years, esepcially the rise in 2023 is forecasting a faster decline for Permian even at current completion rate, not to mention visible production increase.
When using the incGOR, I want to add couple of issues here,
1. the negative incgGOR or ultra-large incGOR is usually an indication of oil dropping or flat while gas still inching up, by setting a cut-off limit, this really reduces the spikes.
2. Average window width is important, and like you showed without average, the incGOR is all noise.
3. The absolute incGOR is also useful, when you compare it to the maturity-matched original GOR from new sub-basins, if they are much larger, then it indicates the contribution of incGOR from each different sub-basin or blocks. That’s the part I found even more useful as I am trying to link maturity-GOR with isotope.
There is one interesting observation here when comparing Bakken and Permian —
it is a well accepted template that maturity-GOR-API (oil density) correlates, unless they experience PVT separation, so for deeply buried original shale oils withou PVT separations, Bakken and Permian both at ~10,000ft, the GOR and API should be correlated. But we see an interesting fact here, Bakken has GOR about half of Permian, i.e. 1.2MCF/bl versus 2.3MCF/bbl in 2019, and even in mid-2023 they are 2.1 versus 3.2MCF/bbl, so we would expect Bakken has lower API than Permian oil, but the opposite is alway true, Bakken API average at over 42, and Permian API at closer to 40. Seems that Bakken and Permian are differently sourced oil, but this is quite hard to tell with other geochemical tools other than API and oil, other tools all say they are type II marine sourced oil, except isotope — Bakken and Permian are different types, type II and I respectively. That’s why when compared the API and GOR and isotope in Vaca Muerta to US marine sourced oil, they are obviously different, and VM is a hypersaline lacustrine sourced oil, like Brazil sub-salt — much larger difference than Bakken versus Permian, but mainstream say VM is similar to EF or Permian a type II marine sourced oil. When you look at PVT phase diagram, this difference in GOR-API match actually also help Bakken to beat down the GOR rise over the time when compared to Permian, although it is a small effect when comparing VM to Permian or Bakken.
Shengwu,
It seems to me you are adjusting the data windows to get a certain result that you are expecting, if you have to do extraordinary data manipulation to achieve the chart you are looking for you might be fooling yourself.
Russia told OPEC it would export less oil. It’s actually exporting more
“OPEC and its economic allies in the OPEC+ bloc have been trying to cut global oil supplies in order to bid up prices lowered by record production from the United States. Russia, for its part, pledged earlier this year to cut crude oil exports as part of that mission. But it has actually been ramping up its exports.
Bloomberg reports that outgoing Russian oil shipments hit nearly 4 million barrels a day this week. That would be the highest level since May of last year. Russia broadcast last month that it would soon be cutting exports by 121,000 barrels a day from the levels of last May and June, but so far this year exports are actually higher than that.”
They never deliver on what they promise
https://qz.com/russia-oil-exports-ukraine-china-india-1851413465
U.S. Shale Oil Production Growth Is Slowing DownBold theirs.
Oilfield service veteran David Messler suggested last month that oil production in the shale patch may be nearing its peak and consequent plateau.
EIA forecasts a 16,000-bpd increase in oil production from the shale patch in May.
When the illusion of unending U.S. shale oil supply growth shatters, the fallout will be significant.
At the start of this week, following Iran’s missile attack on Israel, oil prices inched up. The key word here was “inched”. The attack was a first; it came from the fourth-largest oil producer in OPEC, and it targeted a country notorious for its military prowess. Yet prices only inched up rather than soaring.
One could argue this was because the situation was apparently defused quickly, with neither of the sides willing to engage in an escalation, but this may only be part of the reason for oil prices’ lukewarm reaction. The other reason is U.S. shale supply—and that supply may be about to become tighter.
The Energy Information Administration reported this week that the number of drilled but uncompleted wells, the so-called DUCs, had gone up for the first time in a year in March. The increase wasn’t stunning or anything, at just nine new drilled but unfracked wells, for a total count of 4,522. But it did suggest drillers are not putting everything they have into production growth—despite WTI prices moving closer to $90 per barrel lately.
This is not exactly unexpected, at least in light of earlier forecasts by the EIA about U.S. oil output trends for the year. The authority said earlier this year that it expected a much more modest pace of growth this year compared to last. It’s not the only one predicting a slowdown, either.
There is a lot more to this article. Click on blue link above to read it.
A bit dated but current nat gas price can’t be good for future supplies/growth:
gas so far is hopelessly ovresupplied and underconsumed, we need starships
New posts are up
https://peakoilbarrel.com/short-term-energy-outlook-april-2024/
and
https://peakoilbarrel.com/open-thread-non-petroleum-april-19-2024/