US Oil Output Continues its Steady Decline

A post by Ovi at peakoilbarrel

All of the oil (C + C) production data for the US states comes from the EIAŹ¼s Petroleum Supply Monthly (PSM). At the end, an analysis of three different EIA monthly reports is provided. The charts below are updated to March 2020 for the 10 largest US oil producing states, (Production > or close to 100 kb/d).
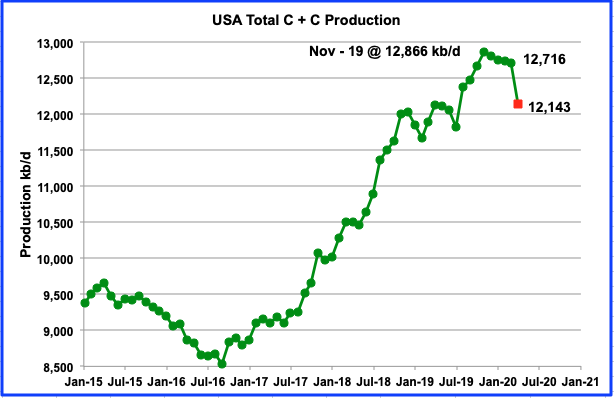
Today’s June 1 update shows the continuous slow decline in oil output from US oil fields from November 2019 to March 2020. March output was 12,716 kb/d, down by 28 kb/d from February’s 12,744 kb/d. Also it should be noted that February’s output estimate from the EIA’s earlier May report, 12,833 kb/d, has been revised to 12,744 kb/d, a downward revision of 89 kb/d. The Red dot is the projected April output from the May Monthly Energy Review.

Read More
Are Non-OPEC’s Best Days in the Rear-view Mirror

A post by Ovi at peakoilbarrel.

While this post updates Non-OPEC production to January 2020, we are now in late May and the direction for future production for the next few years is clear, LOWER than where it was in March 2020. OPEC, in response to the reduced worldwide demand, arranged for a production reduction through a Declaration of Cooperation (DoC) with OPEC and Non-OPEC countries. Also Canada and Norway have indicated they will be cutting production in response to world wide reduced demand. The OPEC + DoC reduction schedule and chart are shown and discussed at the end of this post.

Read More

OPEC April 2020 Production Data

by RON PATTERSON posted on 05/16/2020 [EDIT]

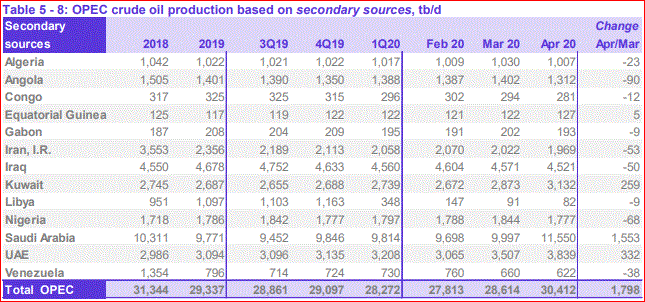
All OPEC data in the charts below are from the OPEC Monthly Oil Market Report. The data is through April and is in thousand barrels per day.

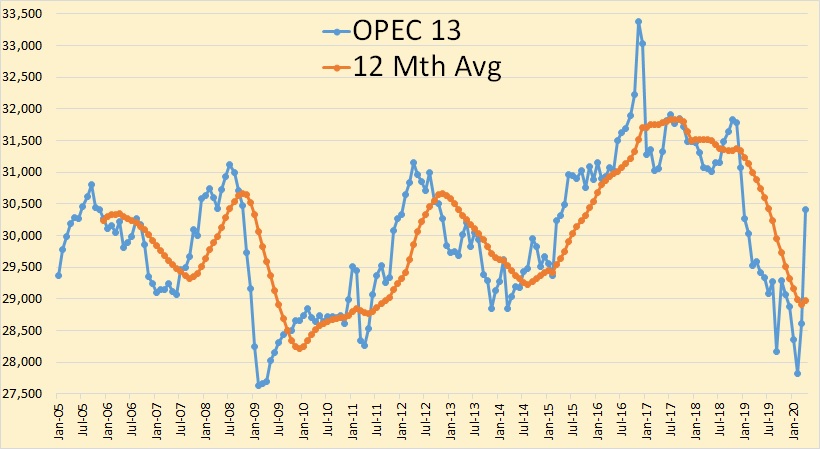
OPEC 13 crude oil production was up 1.8 million barrels per day in April. They are about 3 million barrels per day below their November 2016 High.

As you can see the increase came from only three countries, Saudi Arabia, Kuwait, and the United Arab Emirates.

Read More