A guest post by Bob Meltz
I’ll start with a brief overview of some northern offshore GOM production statistics, and then review what I see as the current state of Wilcox exploration and development projects and finish by discussing Wilcox production data. All production statistics are from BSEE/BOEM.
Cumulative production from the federal waters of the offshore Northern Gulf of Mexico (OCS) through 2020 is 22.7 BB (billion barrels) oil and 190 tcf gas. First production was in 1947. Production from deepwater (defined by BOEM as water depths > 1000’) is 9.6 BB oil, and 22.9 tcf gas. The first deepwater production was in 1979 from Shell’s Cognac platform in 1025’ of water.
The current annual peak in offshore oil production was in 2019. Average production was 1.9 mmbopd. 2020 production averaged about 1.64 mmbopd. So far in 2021 through October average oil production has been about 1.67. With the near term queue of Miocene projects set to come online in 2022 (Mad Dog 2, King’s Quay and Vito), and the queue of Wilcox projects set to come online in 2024-2025 (Anchor, Whale and perhaps North Platte), I believe we will see another peak in production in 2 to 6 years, and this could even exceed the 2019 peak.
The Wilcox, sometimes also called the Lower Tertiary, was thought by many to be the future hope for the offshore Gulf of Mexico, providing long-term production for years. As the shelf and flex trends played out, and as the deepwater Miocene fields started playing out, the Wilcox was going to pick up the slack and keep offshore production going.
I co-authored a paper with several Chevron colleagues in 2005 that led to some of this initial enthusiasm. Here is a link to that paper.
View PDF (searchanddiscovery.com)
The article indicates potential from the play of 3 to 15 billion barrels of recoverable oil. The high-end estimate of 15 billion barrels of recoverable oil generated a lot of industry buzz at the time, but I’m glad we also included the low estimate of 3 billion barrels. As you will see later, I currently believe the ultimate recovery from the Wilcox will be closer to that low estimate.
The oil industry has faced many challenges in pursuing the Wilcox. Some include the technical challenges of drilling and completing these wells. In many cases, they are drilled through thick salt canopies onto total depths exceeding 30,000’. They are some of the deepest wells in the world, and often the top of the reservoirs are encountered below 25,000’. The deepest well in the GOM was a Wilcox test drilled by Chevron in 2013 to 35,935’ TVD_SS. Usually the Wilcox reservoirs are quite thick, often over 1000’ of gross reservoir thickness and over 500’ of net oil pay. Successfully drilling and completing these wells is not for the faint of heart.
So, after 20 or so years of exploration and 11 years of production, how has the Wilcox been performing?
First I’ll discuss the exploration story of the Wilcox.
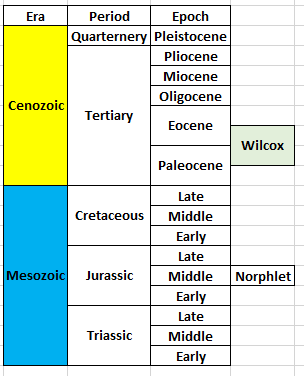
Below is a simplified stratigraphic column showing the primary producing intervals of the offshore Gulf of Mexico.
Figure 1 – Simplified stratigraphic column for the offshore Gulf of Mexico
Read More