A guest post by Ovi
All of the oil (C + C) production data for the US state charts comes from the EIAʼ’s Petroleum Supply monthly PSM.
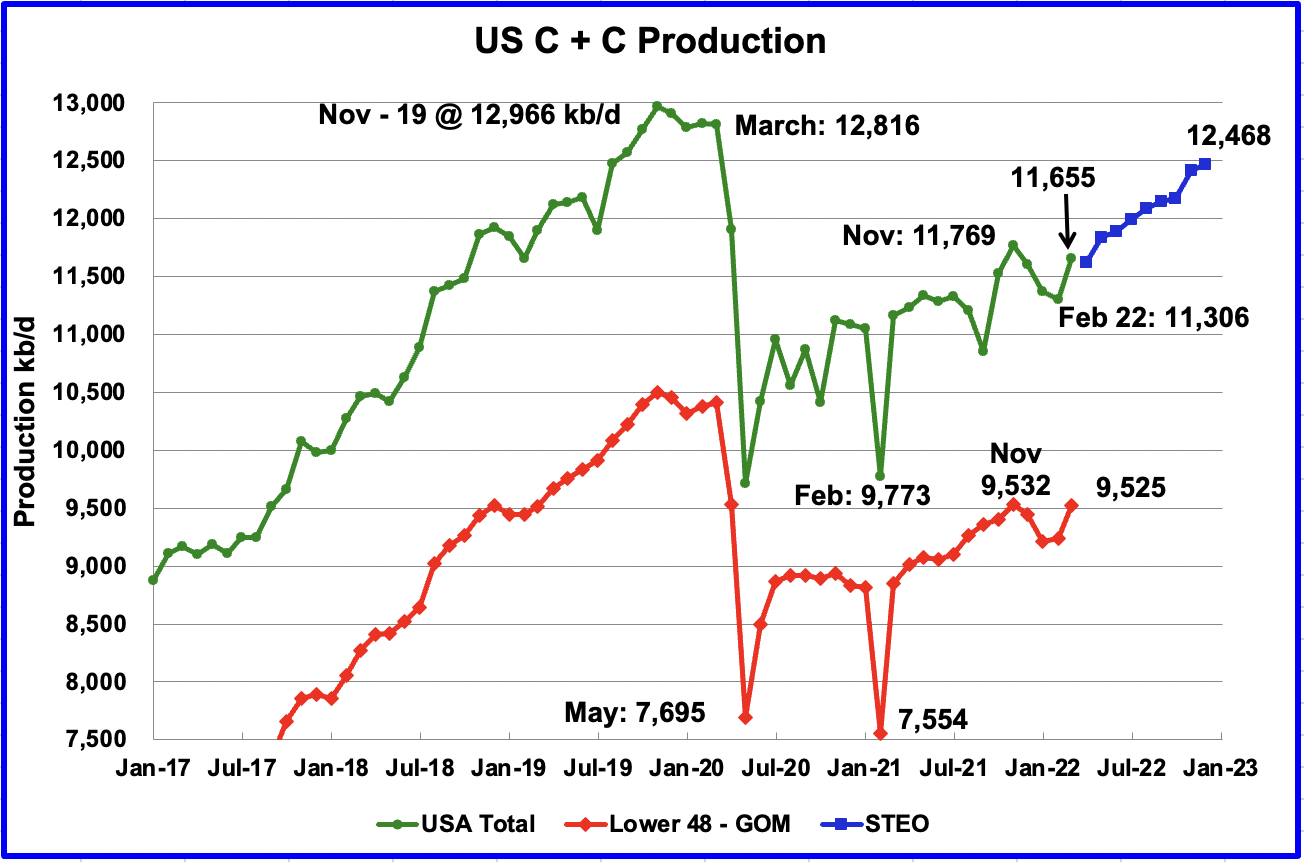
U.S. March production increased by 349 kb/d to 11,655 kb/d. Relative to November’s 2021 production of 11,769 kb/d, March is still 114 kb/d lower. The main increases came from Texas 147 kb/d, ND 66 kb/d and the GOM 75 kb/d.
While overall US production was up, a clearer indication of the health of US onshore oil production can be gleaned by looking more closely at the On-shore L48 states. In the On-shore lower 48, March production increased by 284 kb/d to 9,525 kb/d.
The blue graph, taken from the May 2022 STEO, is the production forecast for the US from April 2022 to December 2022. Note that it is forecasting a decline for April. Output for December 2022 is expected to be 12,468 kb/d, a revision of 129 kb/d lower than was forecast in the April STEO report. From April 2022 to December 2022, production is expected to increase by 842 kb/d or at an average rate of 93.6 kb/d/mth. Note the DPR and LTO reports below do not confirm the optimistic STEO production projection.
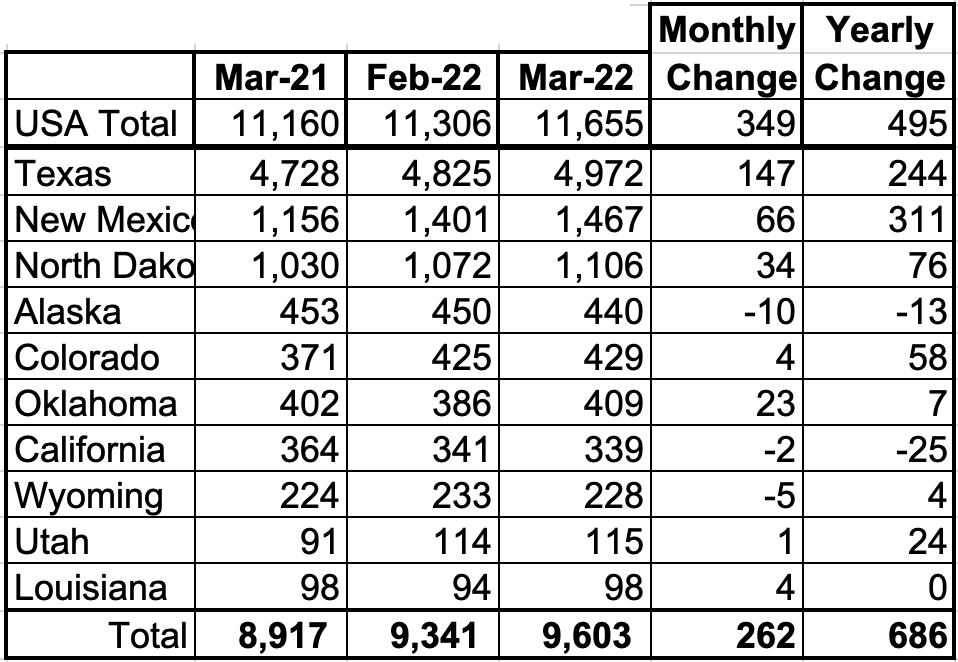
Listed above are the 10 states with the largest US production. These 10 accounted for 82.4% of all US oil production out of a total production of 11,655 kb/d in March 2022. Note that all of the above states, except Alaska and California, produced more oil in March than one year ago.
On a YoY basis, US production increased by 495 kb/d.
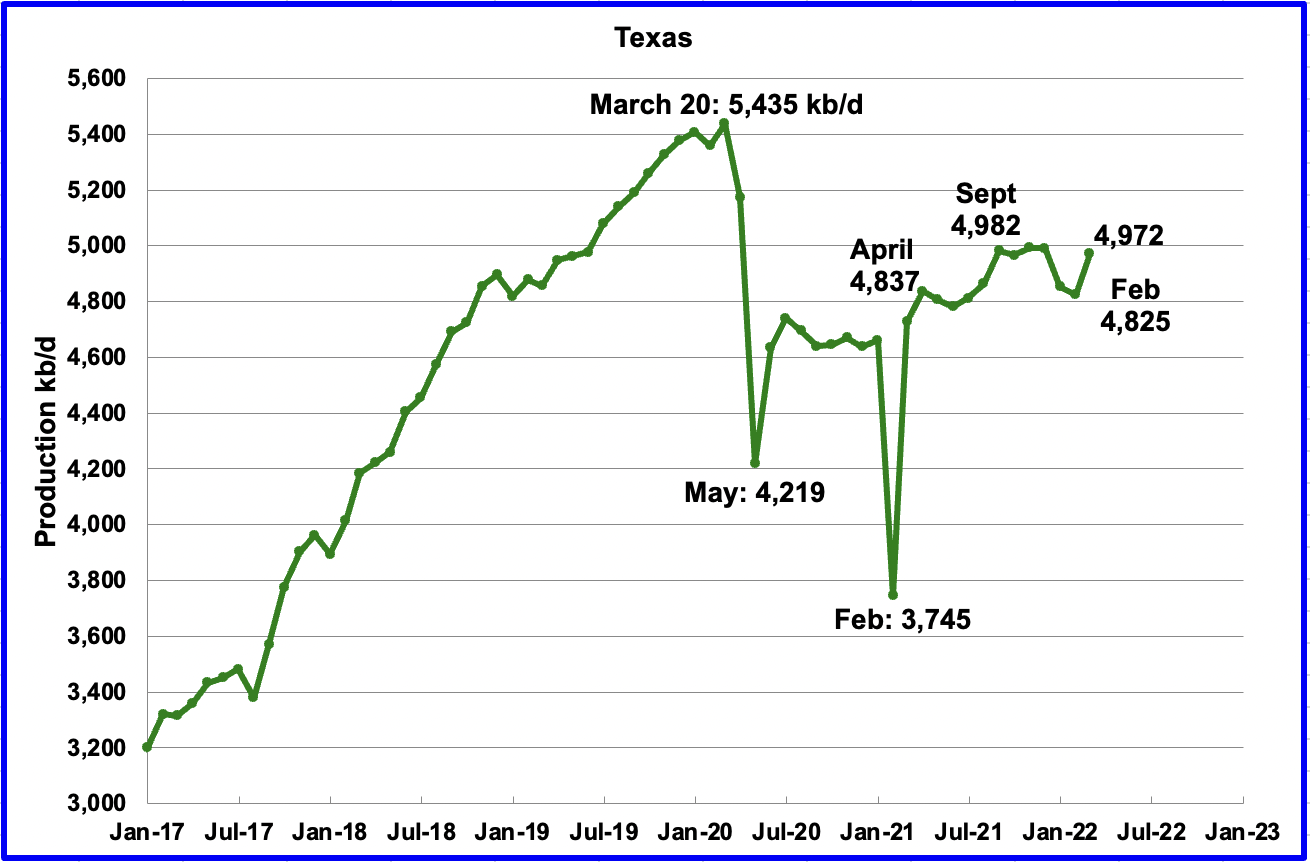
Texas production increased by 147 kb/d in March to 4,972 kb/d from 4,825 kb/d in February.
In September 2021 there were 204 Hz oil rigs operating in Texas. By the last week of March 2022, 275 oil rigs were operating, an increase of 71 rigs and production is back to the same level as September 2021, which was 4,982 kb/d.
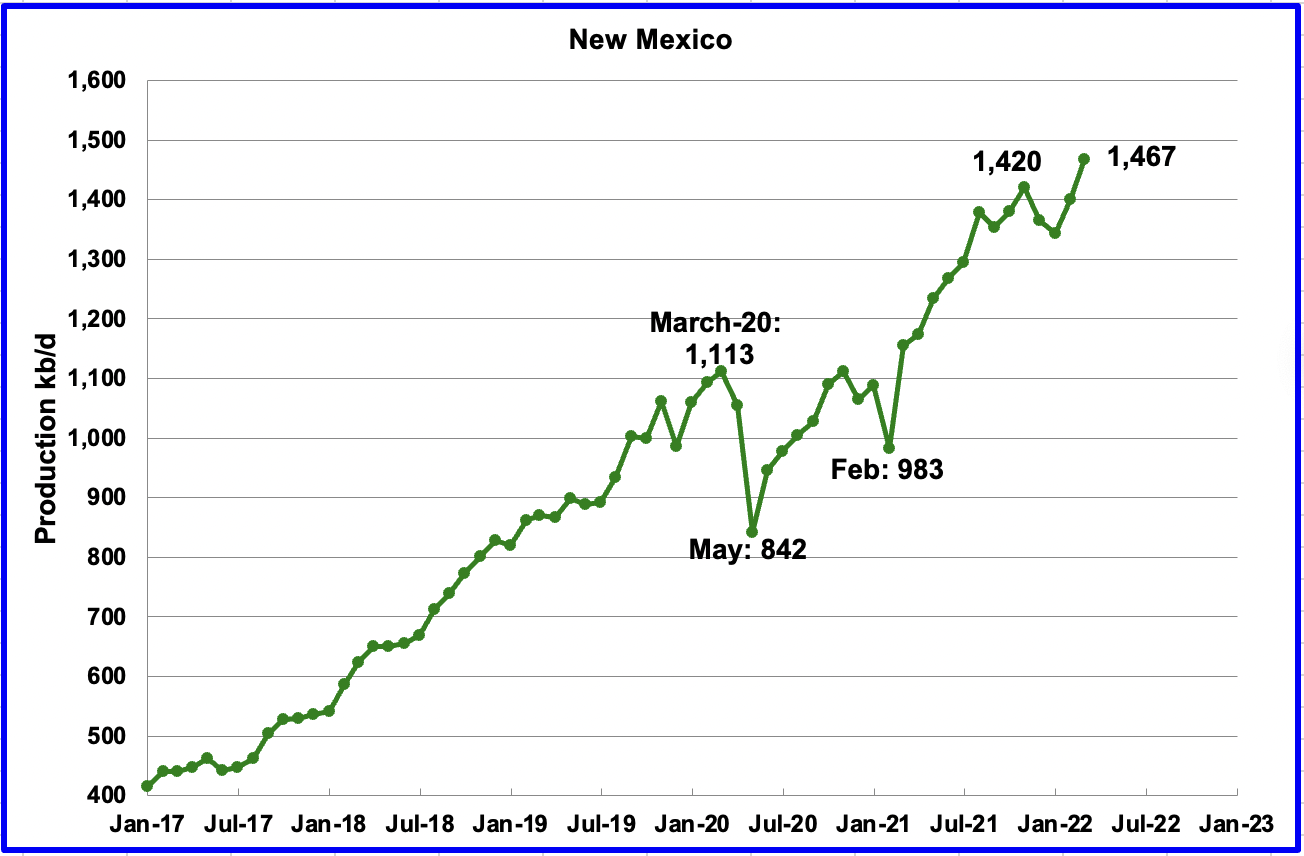
March’s New Mexico production increased by 66 kb/d to a record 1,467 kb/d. Since December 2021, very close to 90 rigs have been in operation in the NM Permian. The production increase is due to more wells being completed than drilled. See DPR section below.
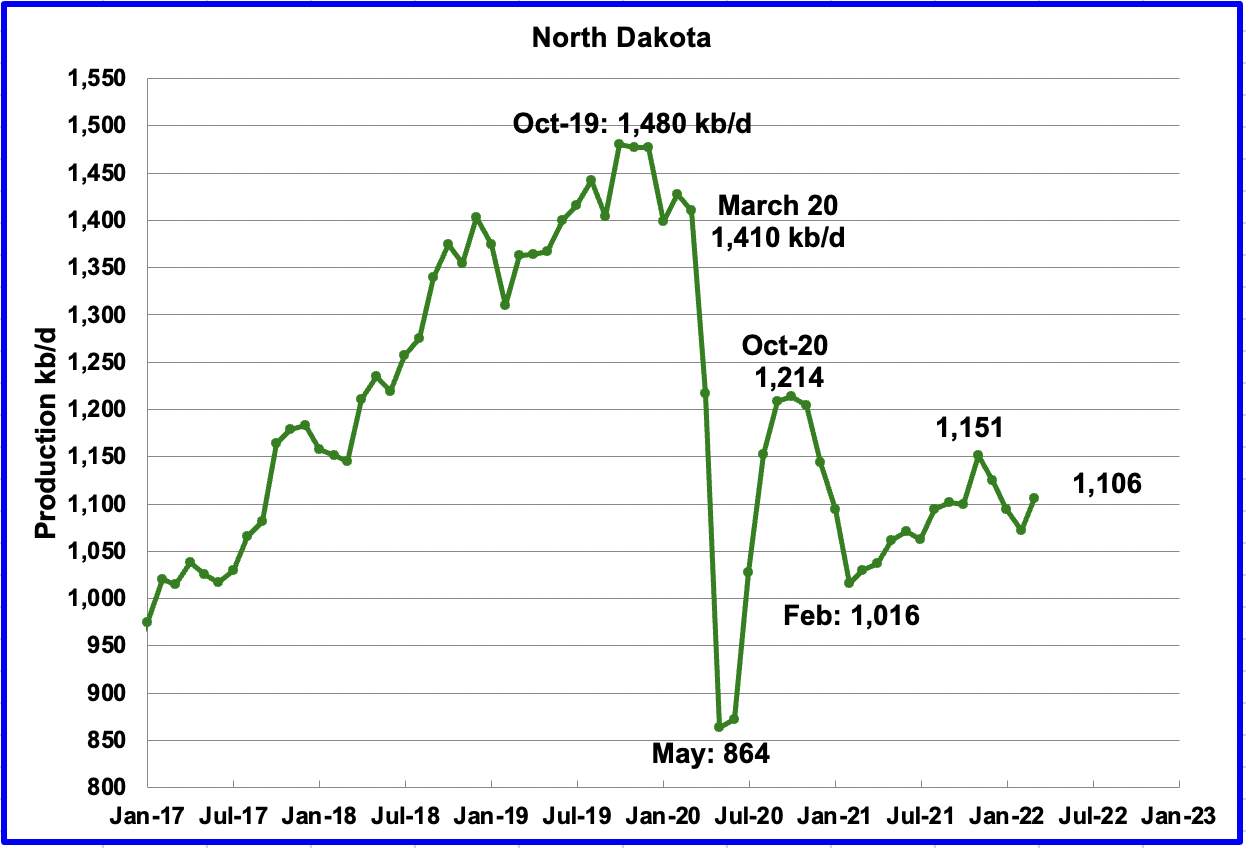
North Dakota’s March output was 1,106 kb/d, an increase of 34 kb/d from February.
According to this source, ND’s April oil production was hit hard by two winter blizzards.
“State officials say a pair of blizzards that smacked North Dakota in April caused a dramatic reduction in oil production. The Bismarck Tribune reported that State Mineral Resources Director Lynn Helms provided state regulators updated production estimates Friday. He said the state’s oil industry had been producing about 1.1 million barrels daily until the blizzards hit. The first storm began on April 12 and lasted three days. Helms says it caused production to fall to about 750,000 barrels per day. The industry had rebounded to 950,000 barrels per day when the second storm hit on April 23. That blizzard caused production to drop to just 300,000 barrels per day. Production has since increased to about 700,000 barrels per day.”
A rough estimate of what North Dakota production could be in April was made using the above information. The projected production is expected to be close to 860 kb/d, a loss of 240 kb/d.
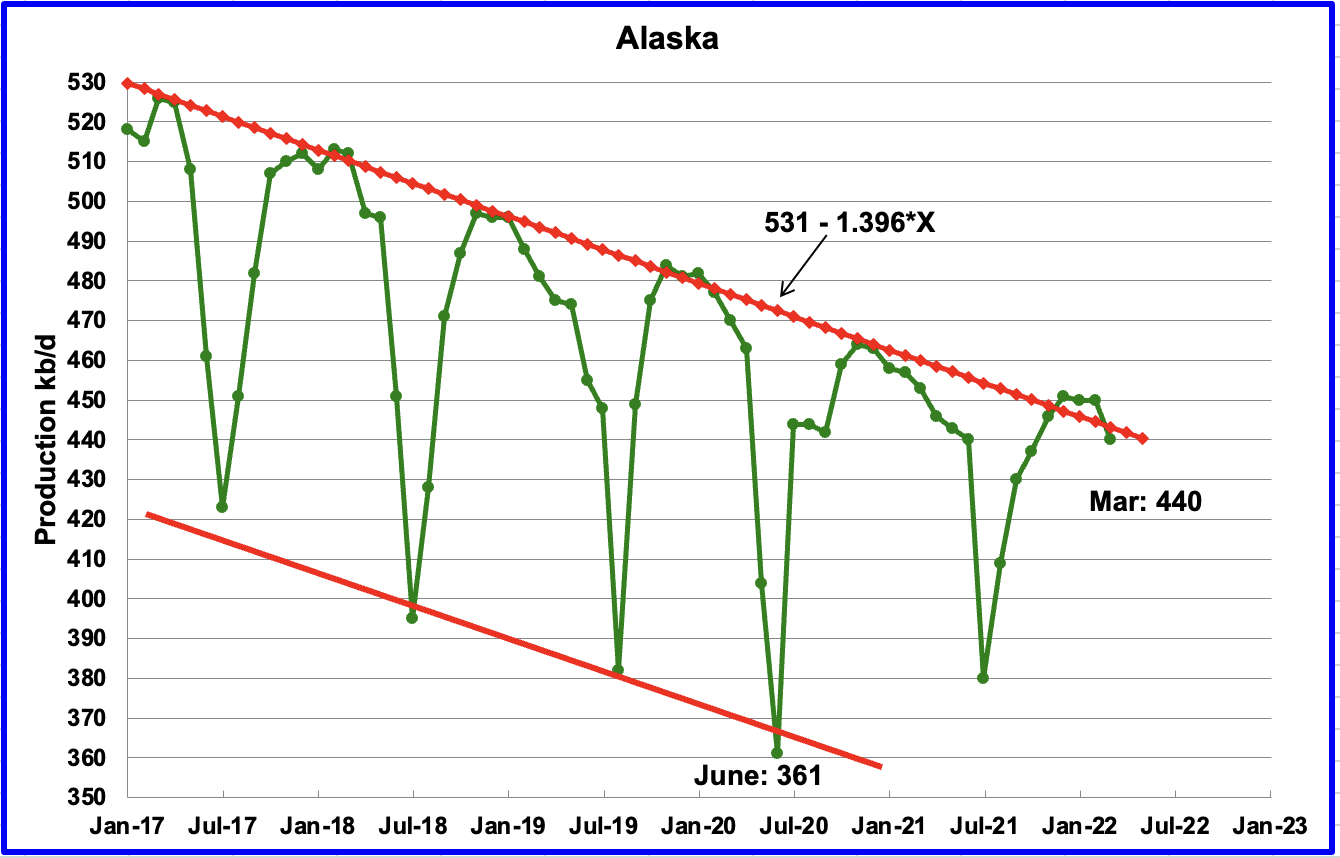
Alaskaʼs March output declined by 10 kb/d to 440 kb/d.
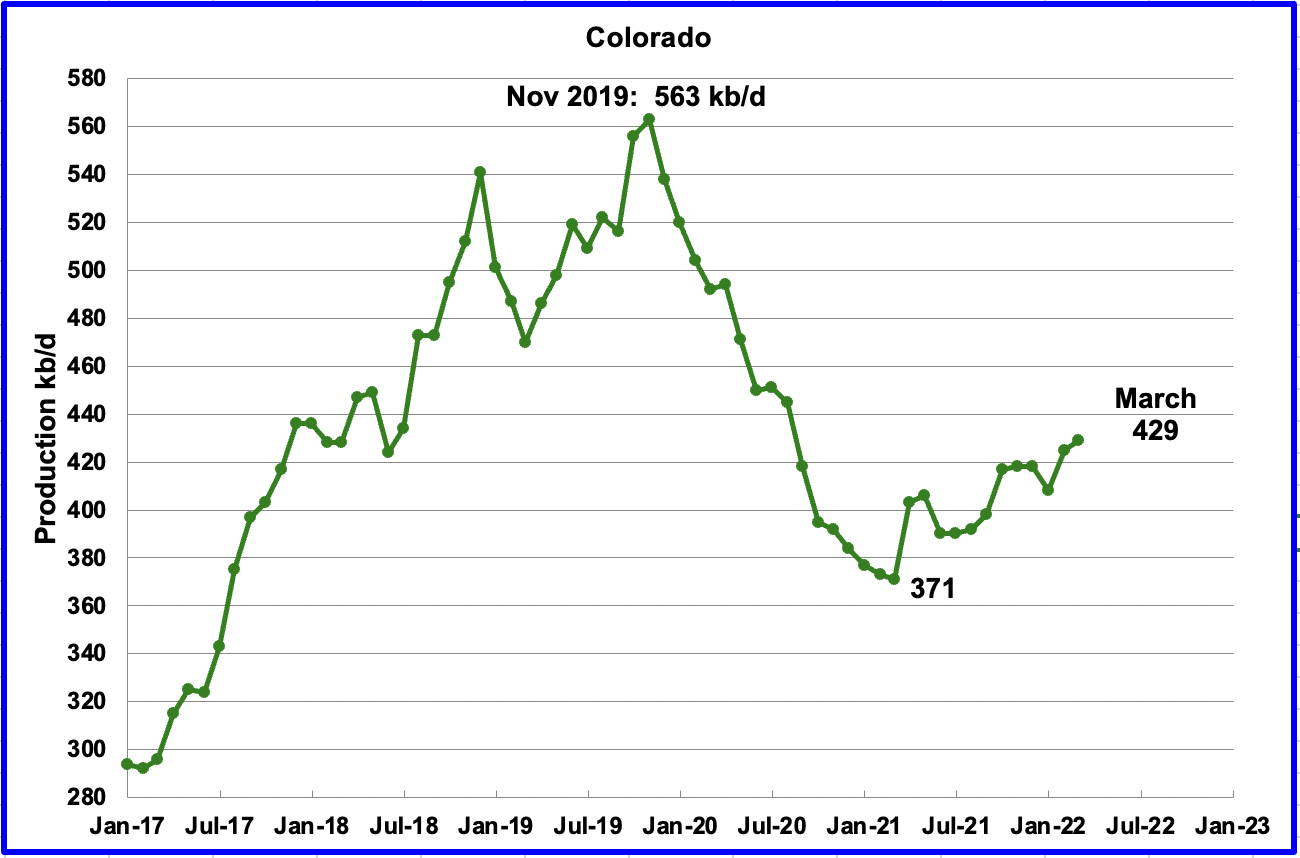
Coloradoʼ s March production increased by 4 kb/d to 429 kb/d. Colorado has had 10 hz oil rigs operating since November and had 12 operating in March.
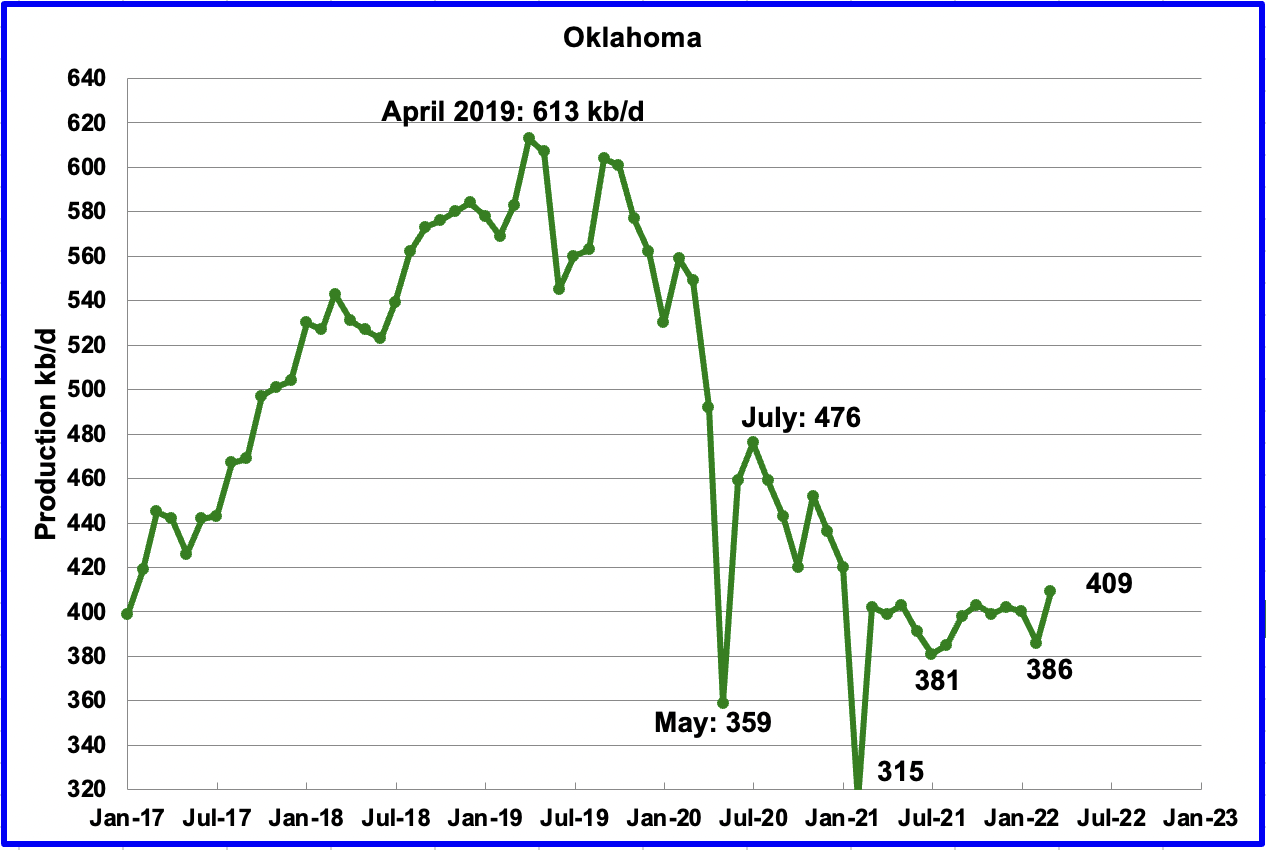
Oklahoma’s output in March increased by 23 kb/d to 409 kb/d. March’s output broke out above the 380 kb/d to 400 kb/d range it has been in since March 2021. The rig count has increased from 17 in March 2021 to 48 in March 2022.
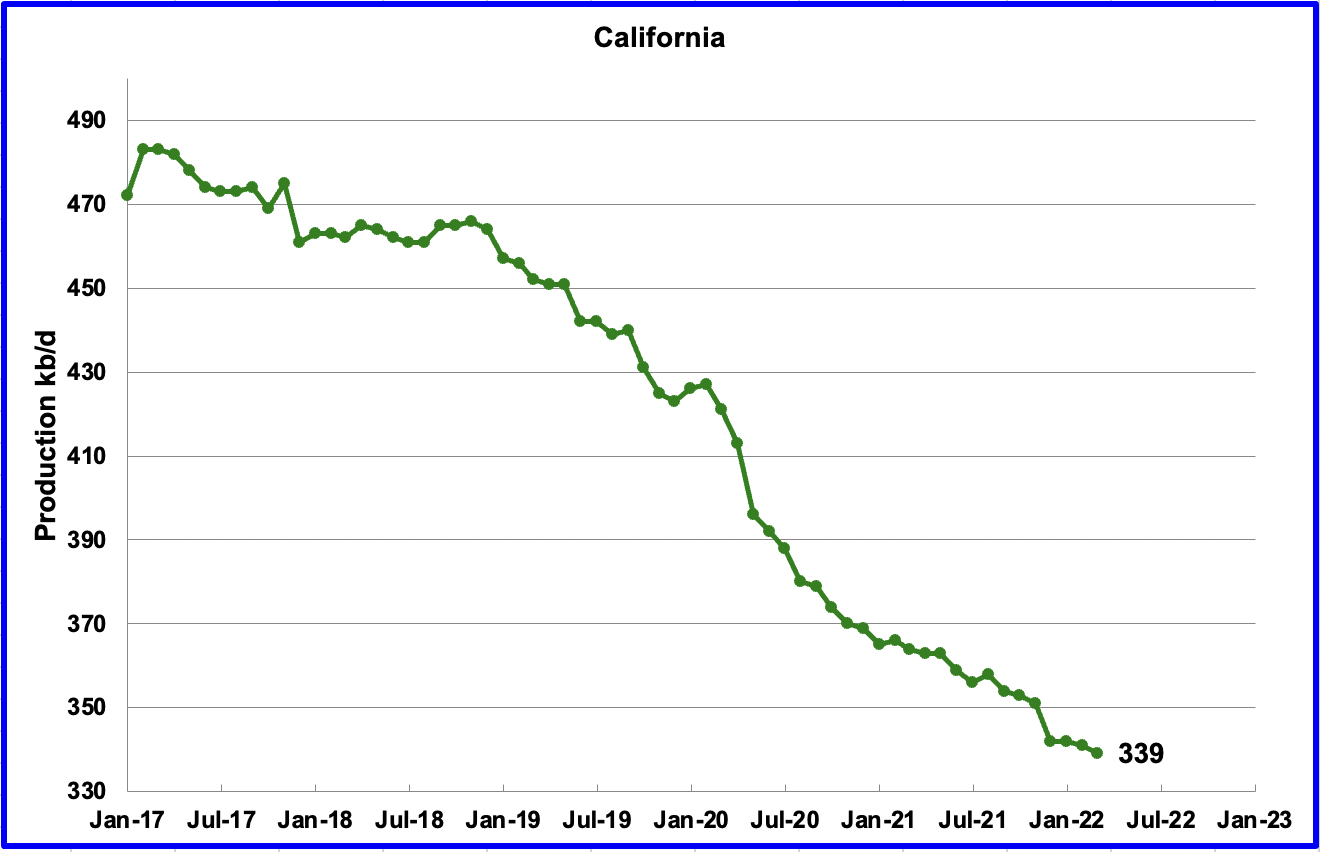
Californiaʼ s slow output decline continued in March. Output decreased by 1 kb/d to 339 kb/d.
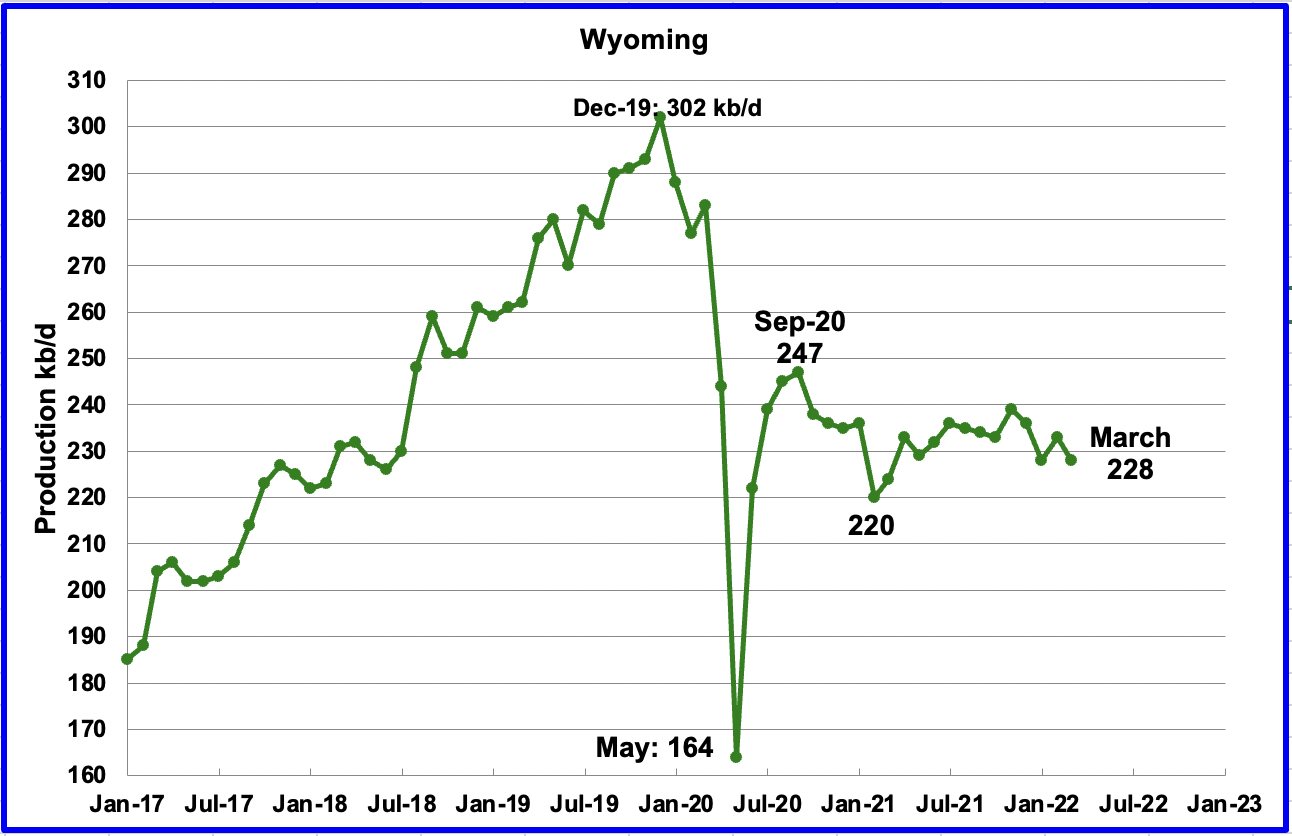
Wyoming’s production has been in a slow unsteady decline since September 2020 when output reached 247 kb/d. In March 2022 output decreased by 5 kb/d to 228 kb/d, down 19 kb/d from September 2020.
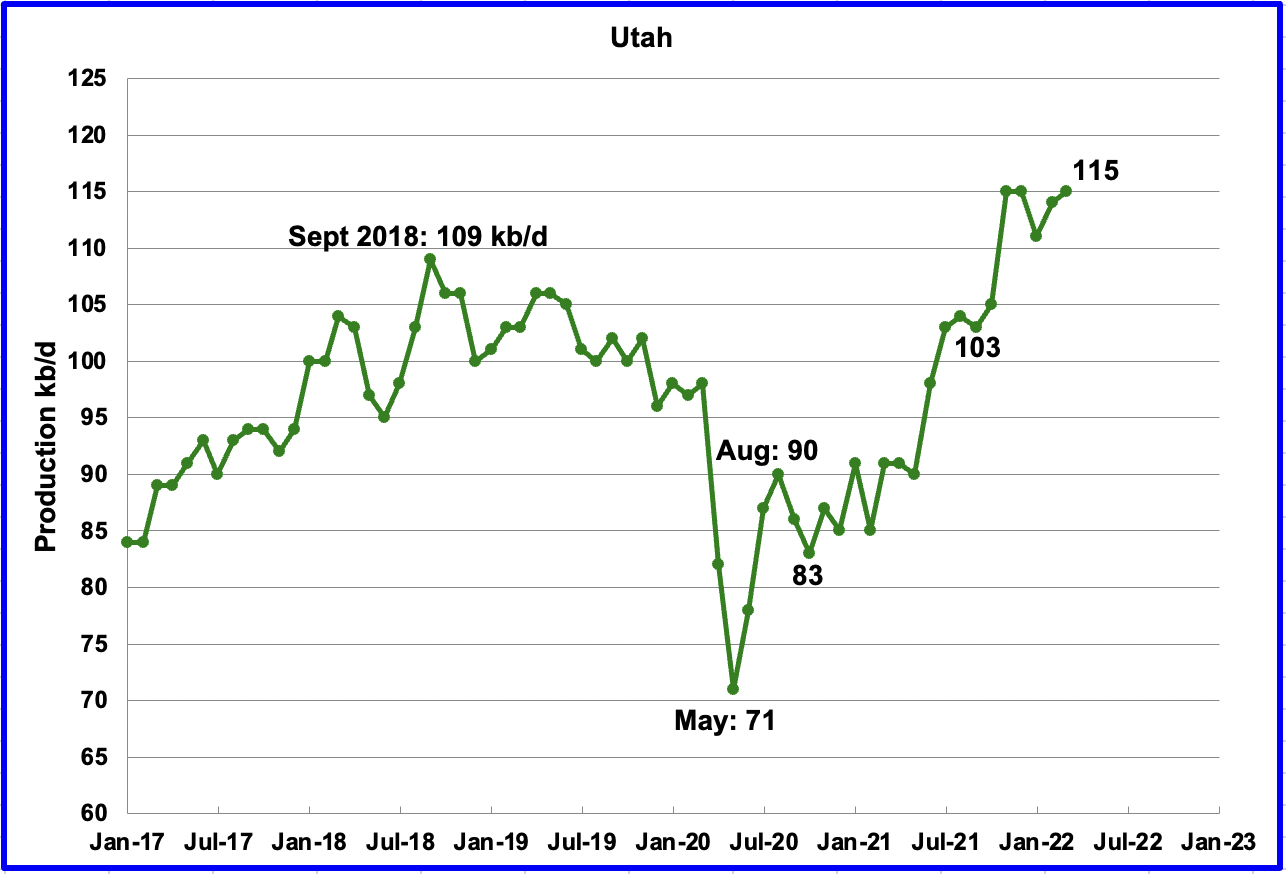
Utah’s production increase from the low of May 2020 appears to have stopped/slowed in November 2021. March’s production increased by 1 kb/d to 115 kb/d.
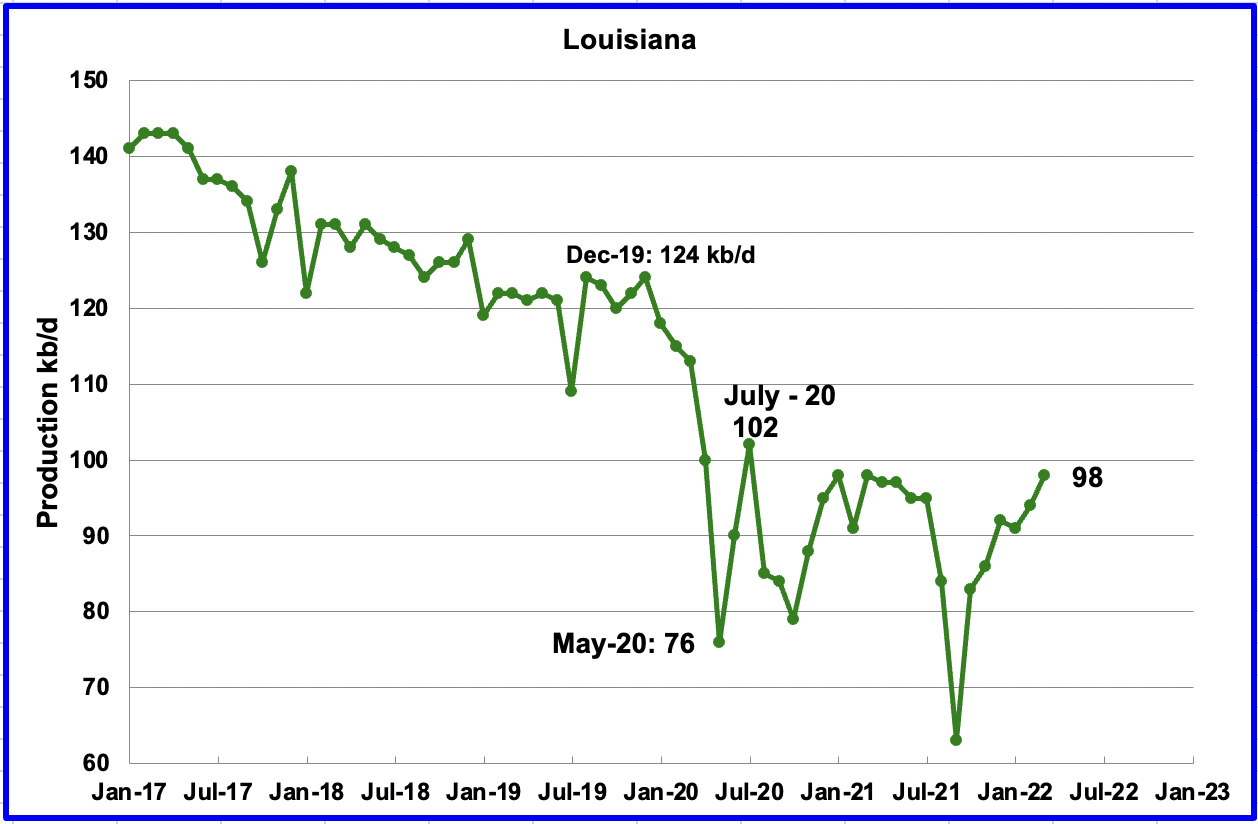
Louisiana’s output increased by 4 kb/d to 98 kb/d in March. Louisiana was one of the hardest hit states by hurricane Ida in late August. March’s output increase indicates that Louisiana’s slow recovery is continuing. Louisiana had 2 Hz oil rigs operating in March.
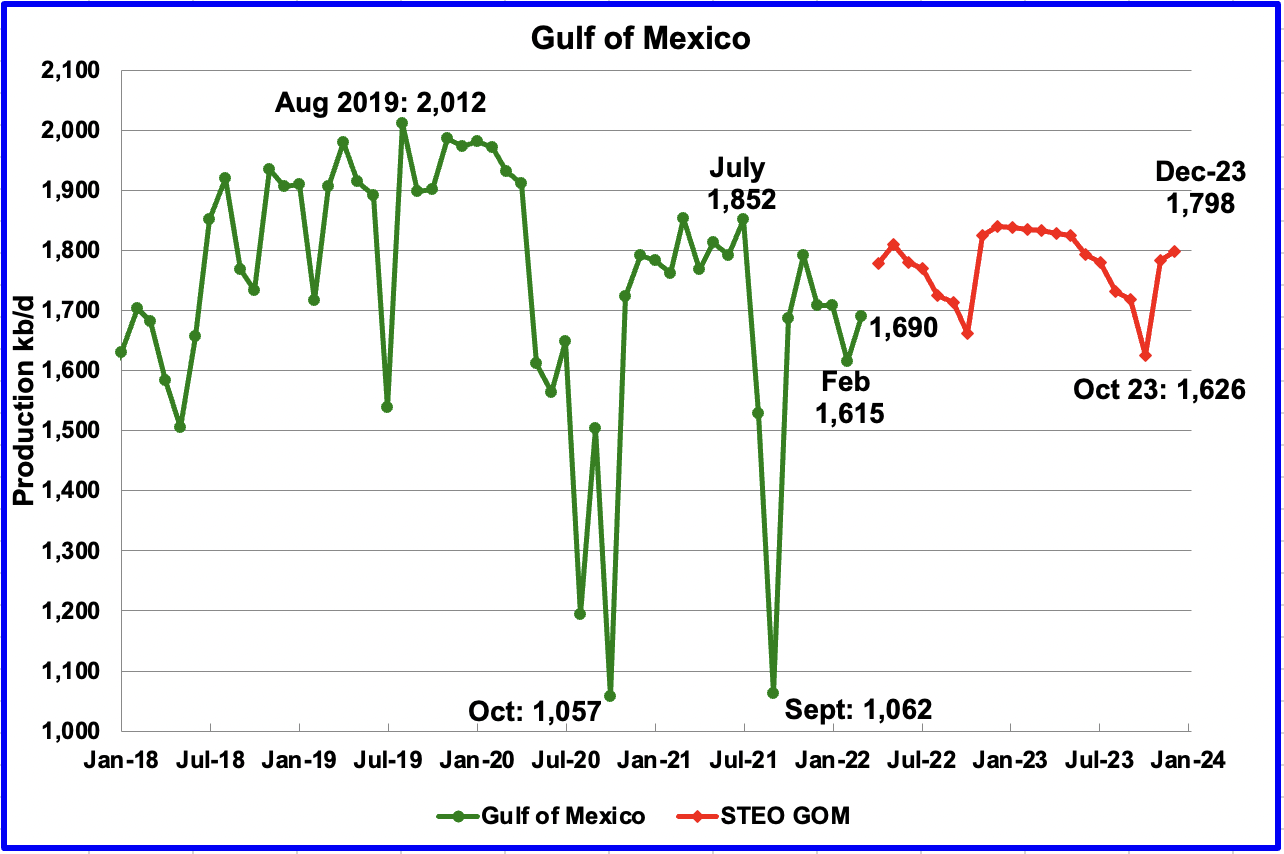
GOM production recovered in March from the decline that started in November 2021. March’s increase was 75 kb/d to 1,690 kb/d. If the GOM was a state, its production would normally rank second behind Texas.
The May 2022 STEO projection for the GOM output has been added to this chart and projects output will be 1,798 kb/d in December 2023. This is 10 kb/d lower than projected in the April report and 214 kb/d lower than the high of 2,012 kb/d in August 2019. For April 2022, the STEO is projecting an increase to 1,778 kb/d.
A Different Perspective on US Oil Production
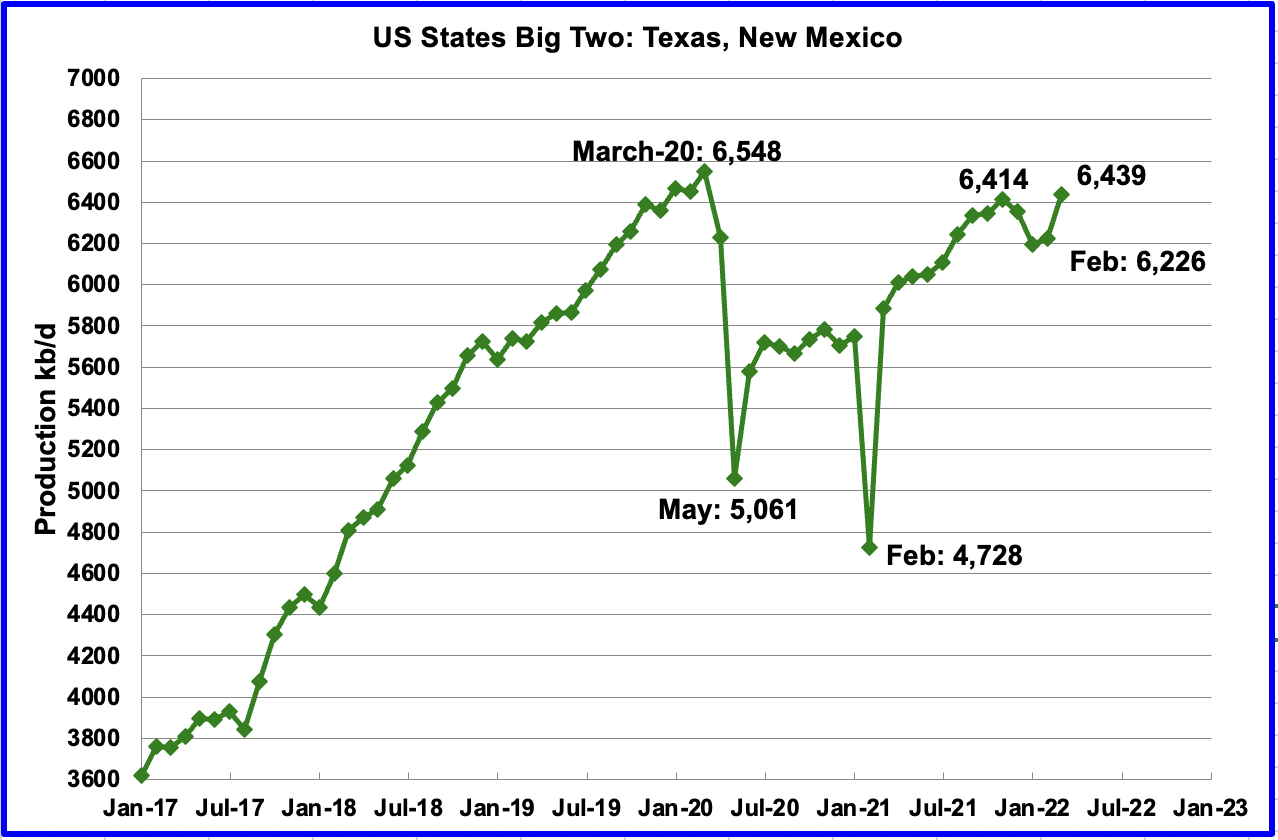
The Big Two states, combined oil output for Texas and New Mexico.
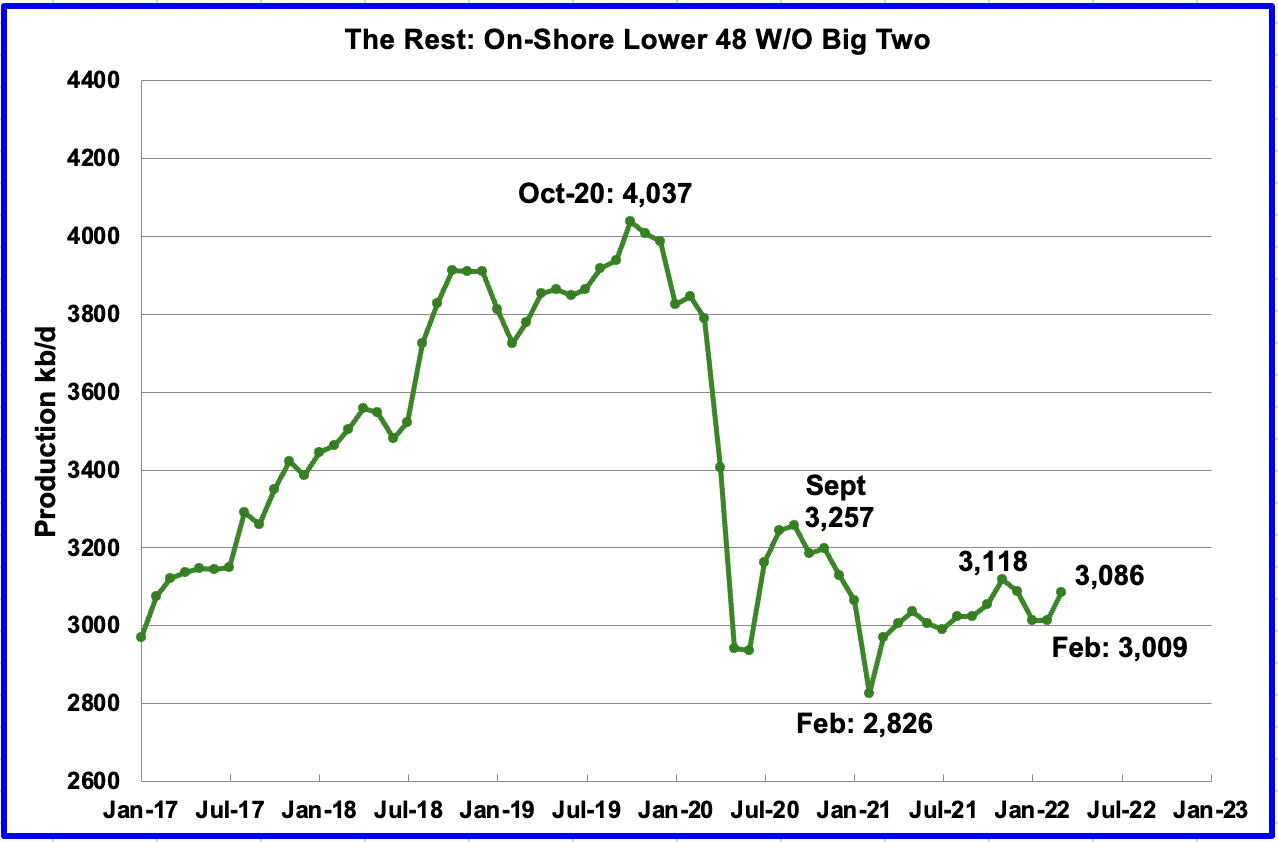
Oil production for The Rest
To get a different perspective on US oil production, the above two charts have broken US state production into two groups, “The Big Two” and the “On-Shore L48 W/O Big Two” or The Rest.
March production increased in the Big Two states by a combined 213 kb/d, with Texas adding 147 kb/d and New Mexico adding 66 kb/d.
Over the last year, the Rest appear to be holding steady at close to 3,000 kb/d. For March production increased by 77 kb/d to 3,086 kb/d.
Rigs and Fracs
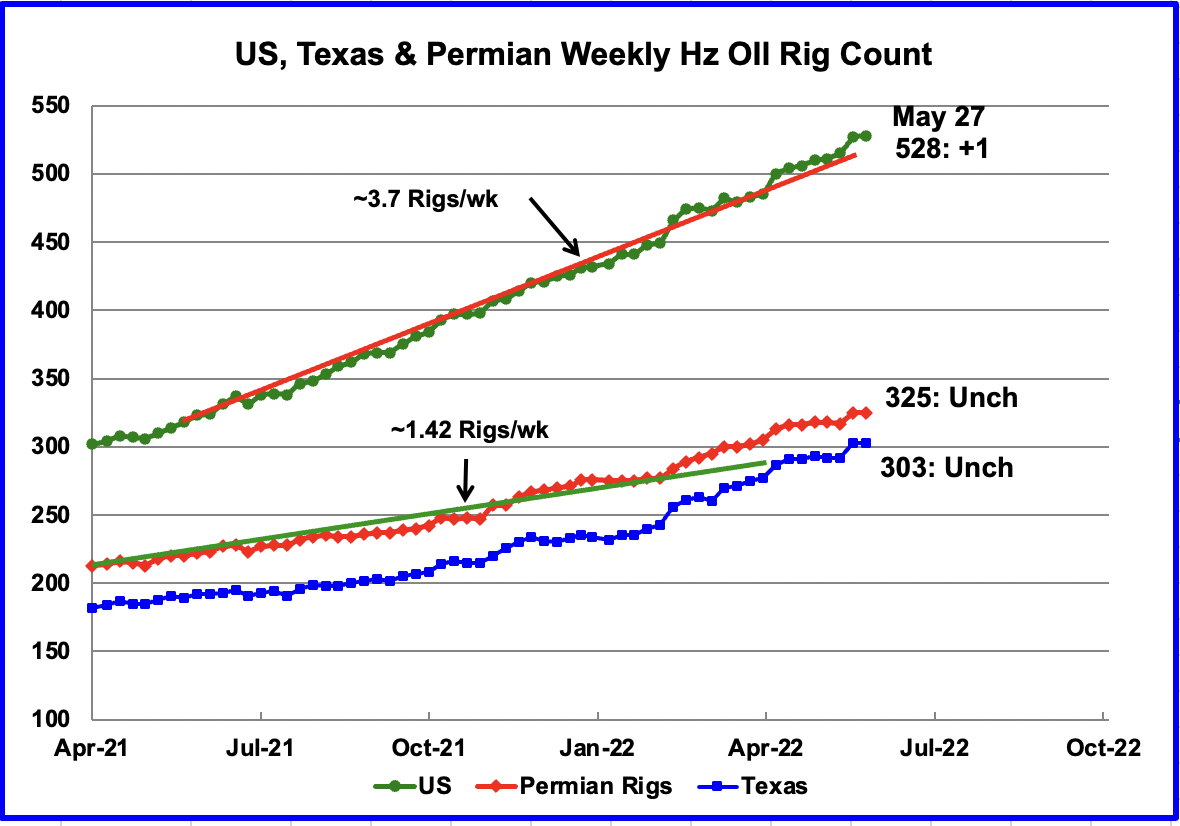
The US total Hz oil rig count for the week ending May 27 was 528, an increase of 1 over the previous week. The latest rig data appears to continue the earlier trend of the addition of 3.7 rigs/wk, on average. Comparing the slope of the Texas rigs since the beginning of 2022 with the US rig chart, it appears that the increase in US rigs is primarily occurring in Texas.
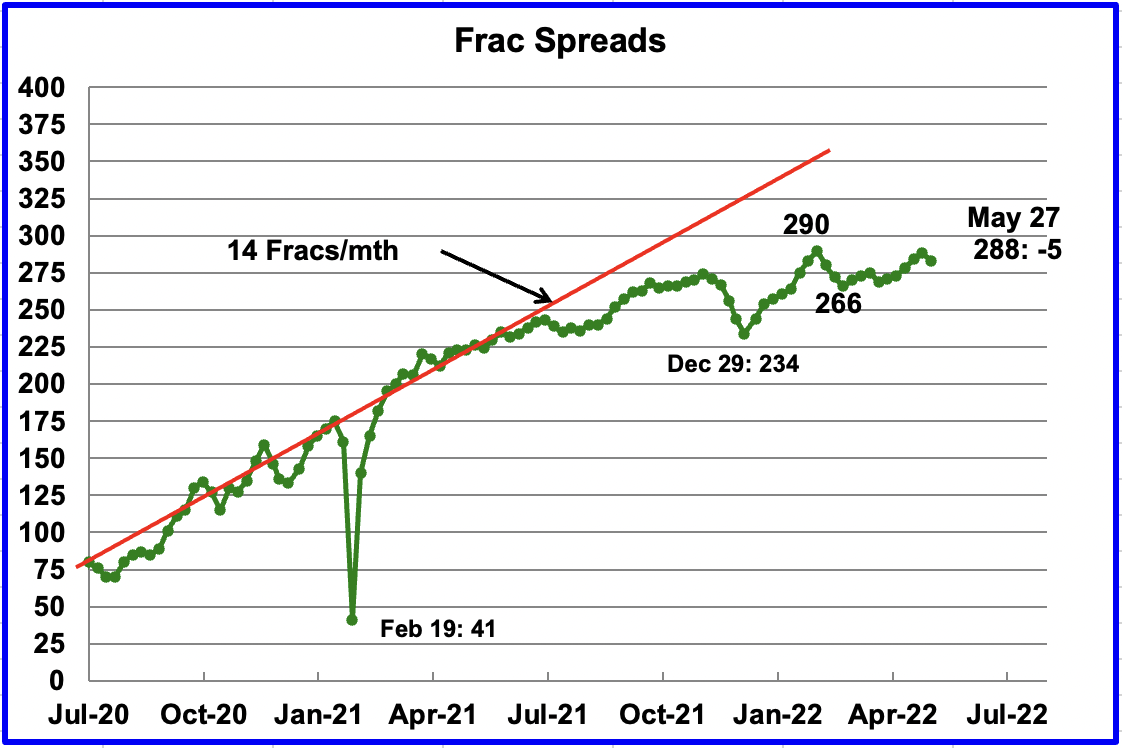
During December 2021, 37 frac spreads were decommissioned primarily due to the holidays and the total dropped to a low of 234 at the end of December. During the month of January, 27 frac spreads were reactivated and in February an additional 29 were added for total of 290.
In the week ending May 27, the frac spread count decreased by 5 to 288 and was down 2 from the high of 290 at the end of February. The drop in Frac spreads could be due to the Memorial Day weekend. Clearly the rate of frac spread additions has slowed since late November 2021.
Note that these 288 frac spreads include both gas and oil spreads, whereas the rig information is strictly Hz oil rigs.
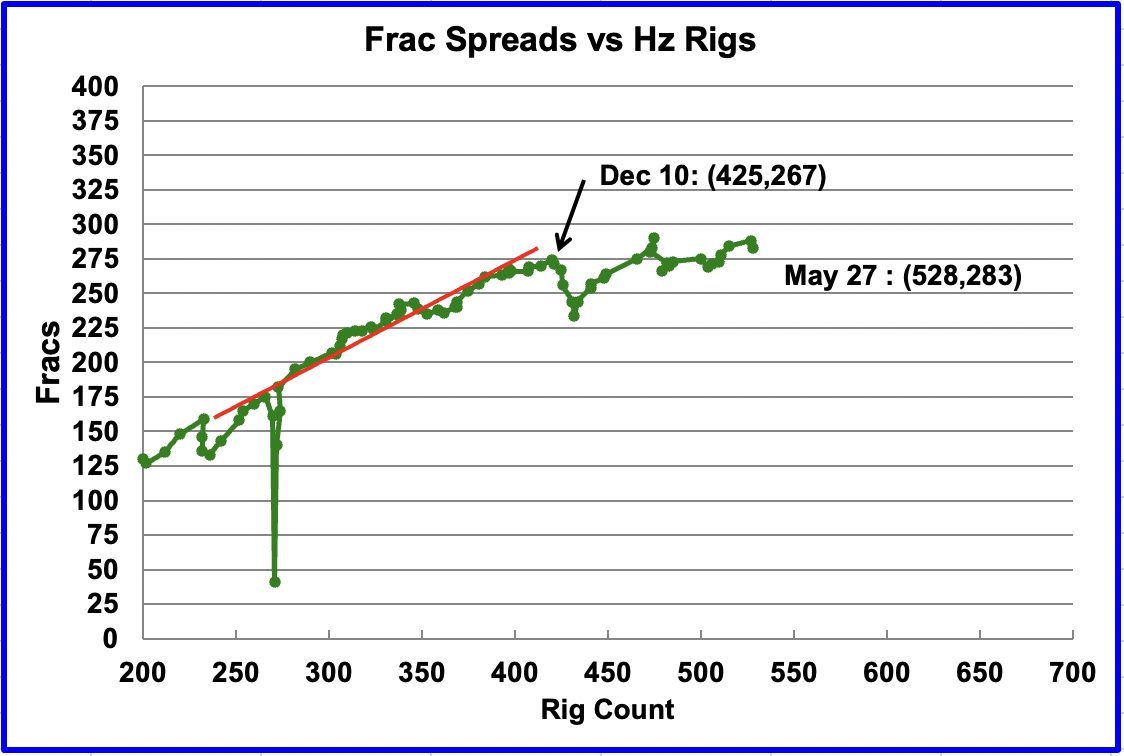
This chart shows the relationship between the rig count and Frac Spreads. Since the week of December 10, 2021 the increase in weekly Frac Spreads compared to the weekly rig increases has slowed. While 103 oil rigs were added over that period, only 16 Frac Spreads were added. Does this imply that Frac spreads are getting more efficient at completing wells or does it imply that companies have decided to complete fewer wells or does it imply a shortage of Frac materials such as water and sand?
WTI
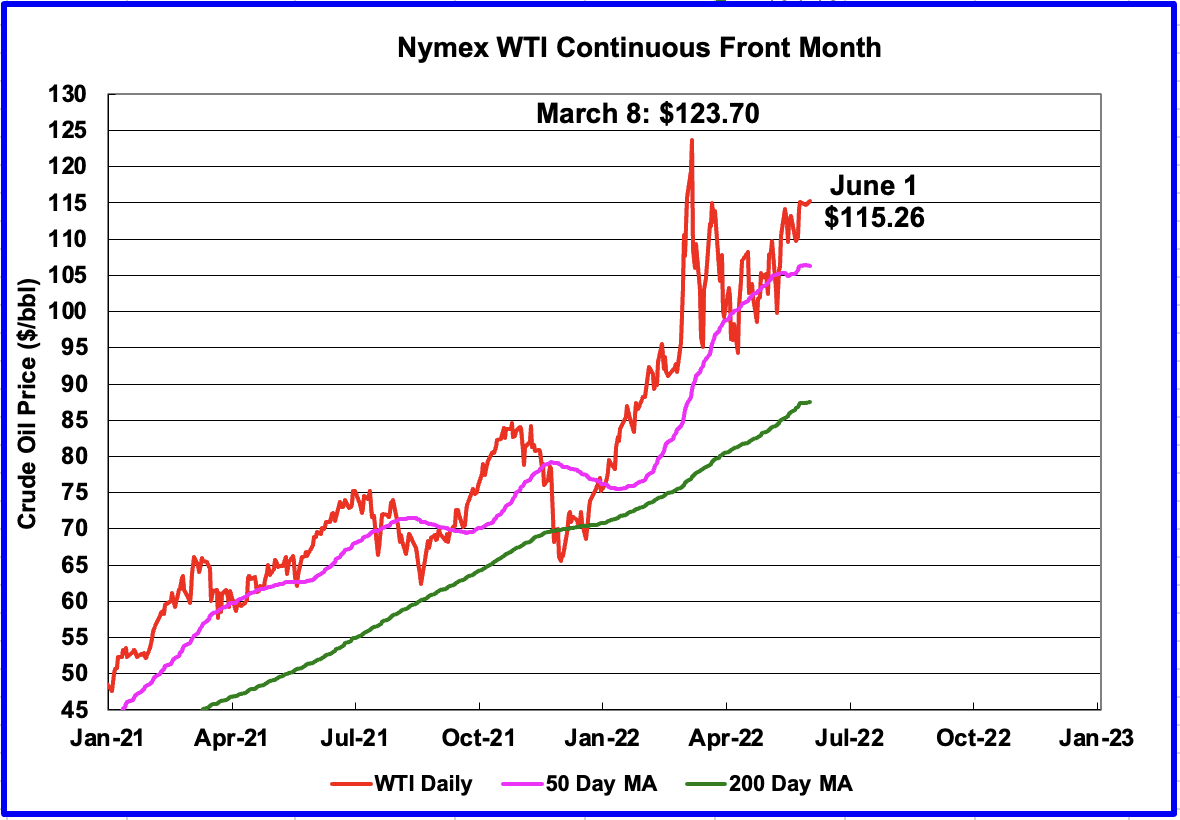
The WTI July contract settled on June 1 at $115.26/b. It is now $8.50/b below the previous high of $123.70. The recent increase is due to Shanghai and Beijing reopening after the lockdown associated with the recent Omicron outbreak. The SPR release is being totally ignored.
1) Short Term Energy Outlook (STEO)
The May 2022 STEO provides projections for the next 22 months, starting with March 2022 to December 2023, for US C + C, OPEC and other oil production related information of interest.
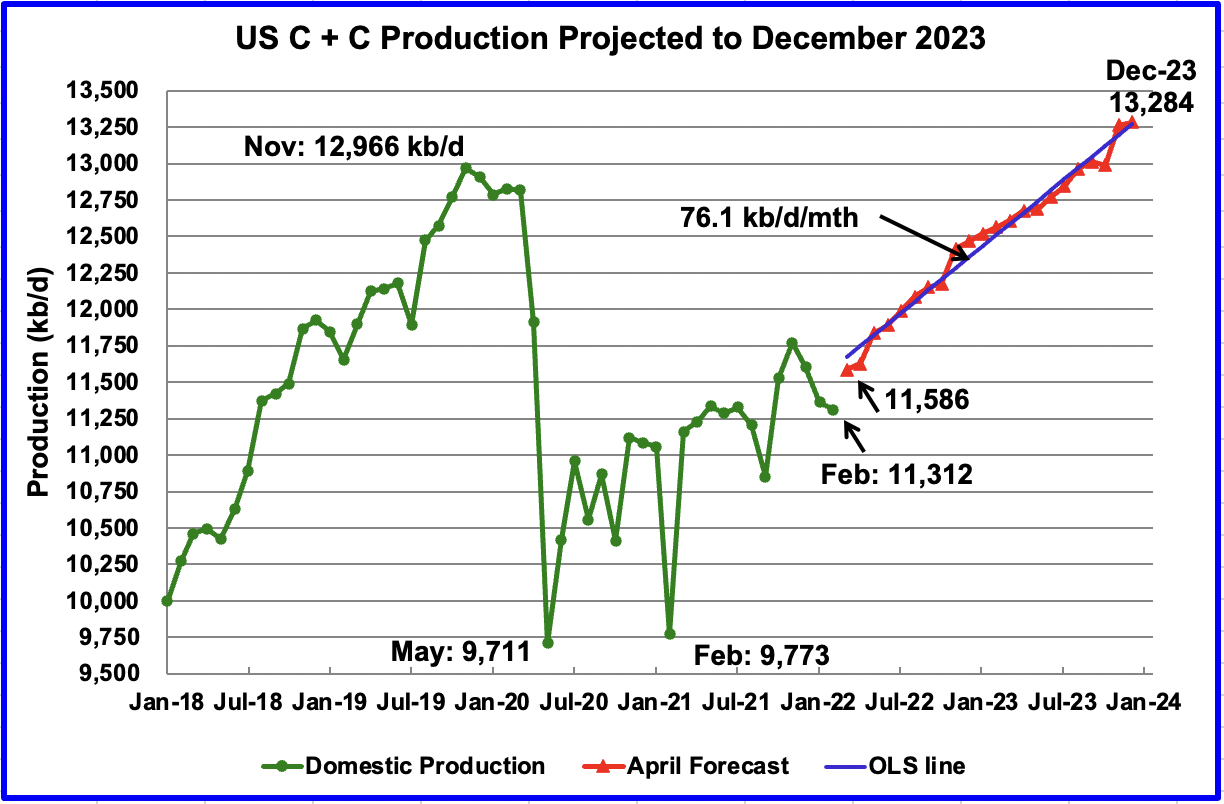
The May 2022 STEO has revised downward its projected US oil output from March 2022 to late 2023, primarily in 2022. December 2023 has been revised up by 30 kb/d from the previous April 2022 STEO. In December 2023 output is expected to reach 13,284 kb/d.
Using only the projected data from March 2022 to December 2023 to fit an OLS line, the STEO is forecasting production will increase at an average rate of 76.1 kb/d/mth, similar to the average rate of 75.4 kb/d/mth estimated in the April report. If the December 2023 output is achieved, it will be 318 kb/d higher than the November 2019 record. The monthly rate translates into a tearily increase of more than 900 kb/d/yr. A difficult challenge.
Note the discrepancy of 69 kb/d between the actual March US oil production of 11,655 kb/d vs the STEO forecast of 11,586 kb/d. A reasonably good estimate.
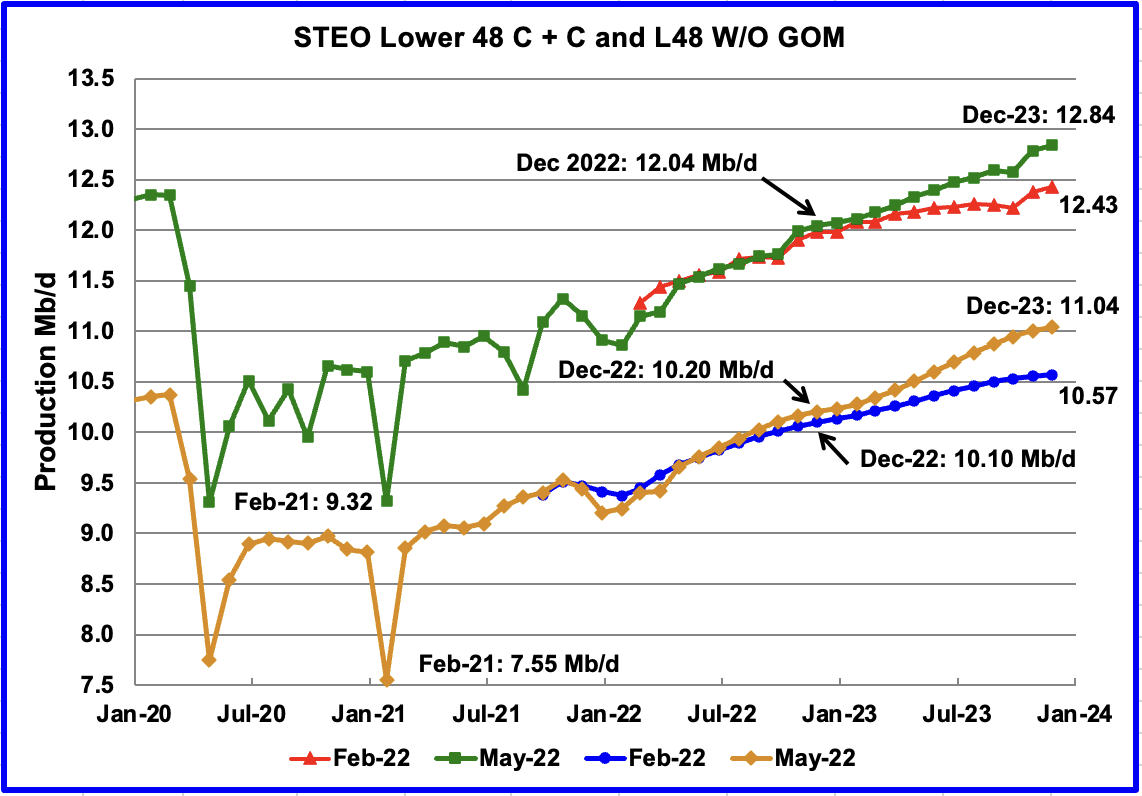
This chart compares the STEO’s forecast for the L48 states from the February report with the current May 2022 report to better illustrate changes in the EIA’s forecast. For the Lower 48, the December 2023 output is essentially the same as in the April report, an increase of 2 kb/d to 11.04 Mb/d. However production in 2022 has moved closer to the original February forecast.
The April STEO output projection for the Onshore L48 states for 2022 has also been revised down in the May report to show decreased production. The output projection for December 2023 is essentially the same, again increased by 2 kb/d while 2022 production has moved closer to the earlier February forecast.
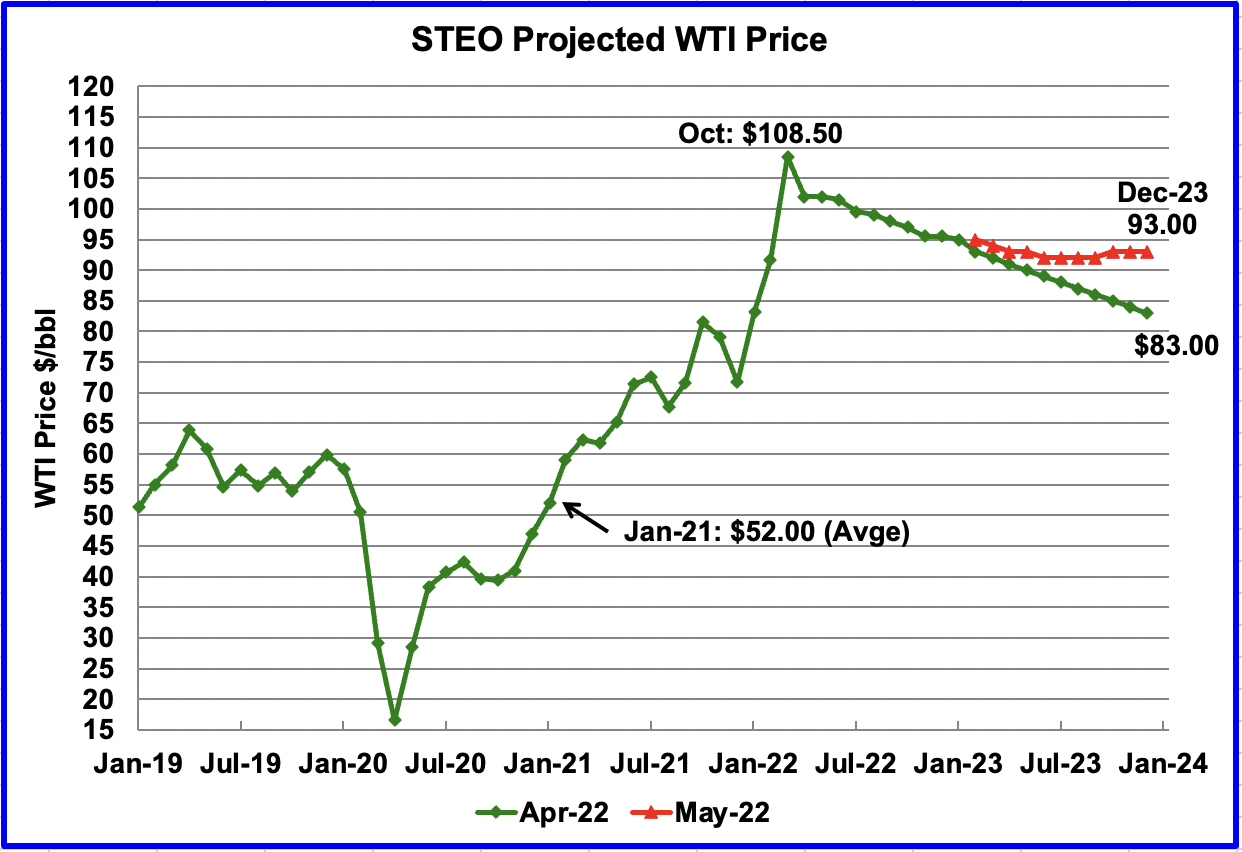
The May 2022 STEO oil price forecast continues to show a steady decline from the EIA’s new March peak of $108.50/bbl to $93/bbl in December 2023. Essentially the EIA is continuing to forecast that the only direction for the price of WTI going forward is down to $93/bbl. However what is different with their latest forecast is that the price of oil is shown to stabilize in the $93/b area during the later half of 2023.
However, it should be noted that the December 2023 price has been increased over the last four months. In the January 2022 report, the December 2023 price was projected to be $62/bbl. December 2023 has now been increased by $31/b to $93/b.
The July contract settled at $115.26 on June 1, $15.75/b higher than the EIA’s forecast of $99.50/bbl average for the July contract.
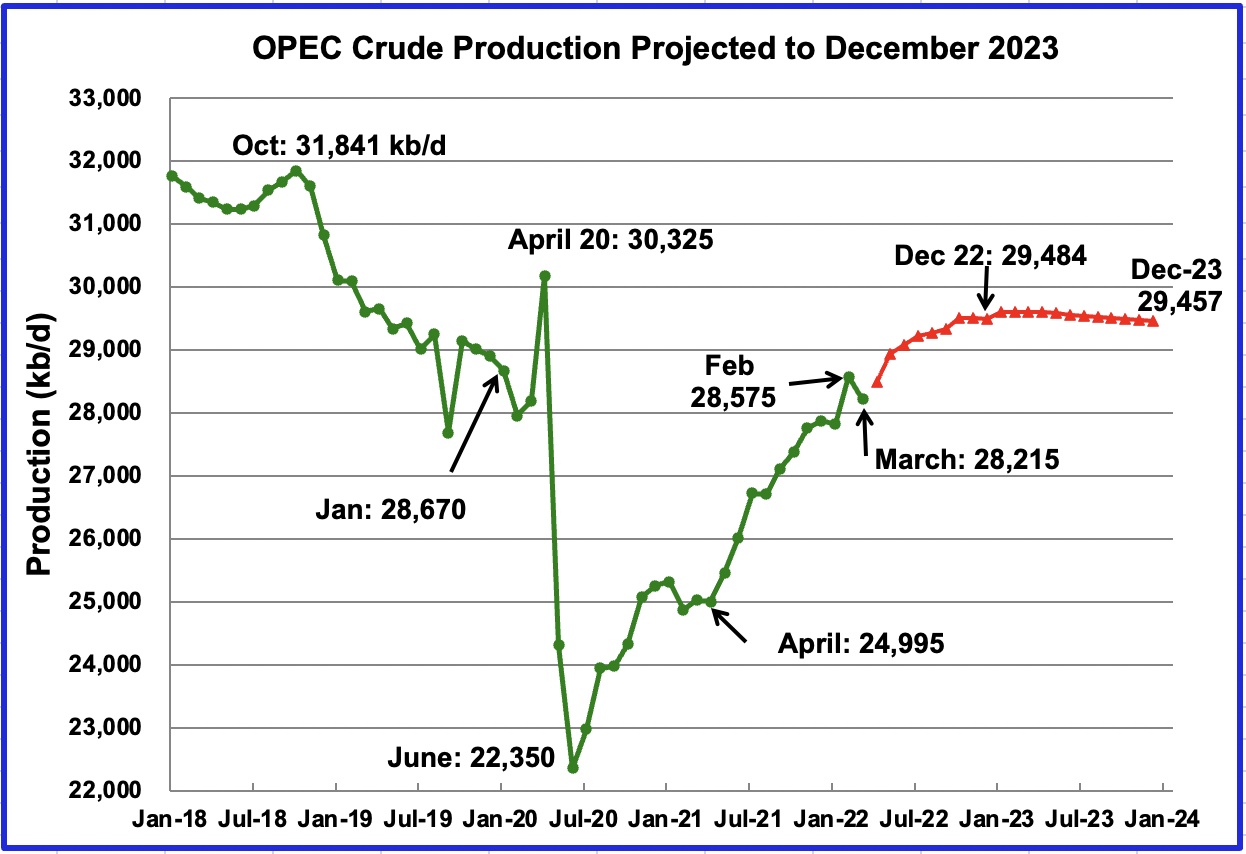
This chart shows the STEO’s May forecast for OPEC crude output from April 2022 to December 2023. OPEC’s output is projected to increase from April 2022 to December 2022 by 994 kb/d to 29,484 kb/d. After December 2022, production remains essentially flat at close to 29,470 kb/d out to December 2023.
The May report has increased OPEC output in December 2022 by 170 kb/d over the April report. Similarly December 2023 output has been increased by 170 kb/d. Considering the the difficulties that OPEC is having in meeting its production commitments, the source of this increased production is not clear.
For April 2022, the May STEO forecasted OPEC production to be 28,490 kb/d. Actual April production as reported by OPEC was 28,648 kb/d, higher by 158 kb/d. It is not clear why the STEO estimate was low.
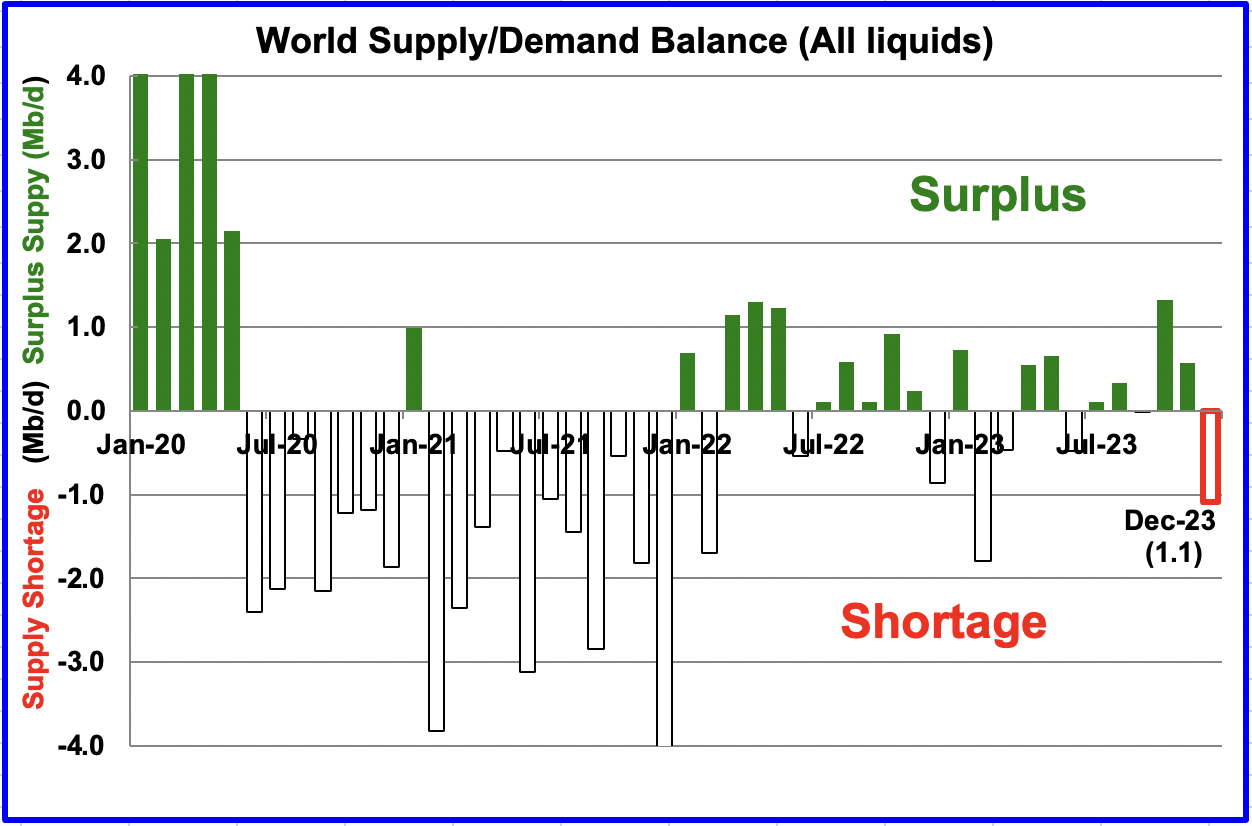
This chart shows the historical world supply/demand balance up to March 2022 and after that, the EIA’s forecast out to December 2023.
From April 2022 to December 2023, the STEO is forecasting an average monthly surplus of close to 167 kb/d down from 518 kb/d in the previous report. The sanctions on Russian oil and increased prices may account for the downward revision to this month’s surplus forecast.
2) Drilling Productivity Report
The Drilling Productivity Report (DPR) uses recent data on the total number of drilling rigs in operation along with estimates of drilling productivity and estimated changes in production from existing oil wells to provide estimated changes in oil production for the principal tight oil regions. The May DPR forecasts production to June 2022 and the following charts are updated to June 2022.
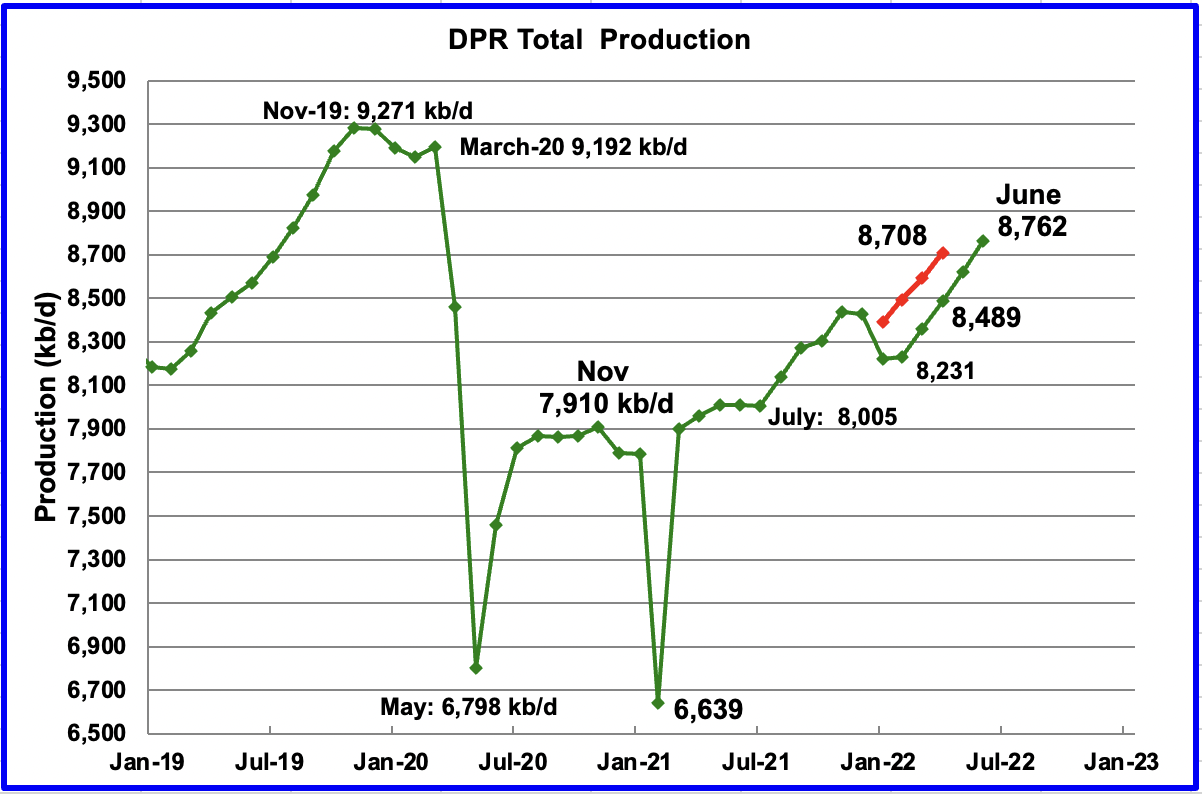
Above is the total oil production projected to June 2022 for the 7 DPR basins that the EIA tracks. Note that DPR production includes both LTO oil and oil from conventional fields.
After the EIA reported lower than expected US onshore L48 production for December and January, the DPR revised its output forecast down.
The DPR is projecting that oil output for June 2022 will increase by 142 kb/d to 8,762 kb/d. From February’s output of 8,231 kb/d to June 2022, output in the DPR basins is forecast to increase by 531 kb/d or by an average of 133 kb/d/mth. Note that this monthly production rate is much higher than the STEO rate of 76.1 kb/d projected for all of 2022 in the STEO section above.
It is difficult to asses what is really happening in the near term in the DPR basins since significant revisions are made to the previous few months. For Instance, did June production really increase by 142 kb/d? In the March DPR report, April output was projected to be 8,708 kb/d (Red markers). The current May report revised April output down to 8,489 kb/d, down 219 kb/d, and June is now 54 kb/d higher at 8,762 kb/d than April’s output reported in the March DPR forecast. So what is the real increase/trend?
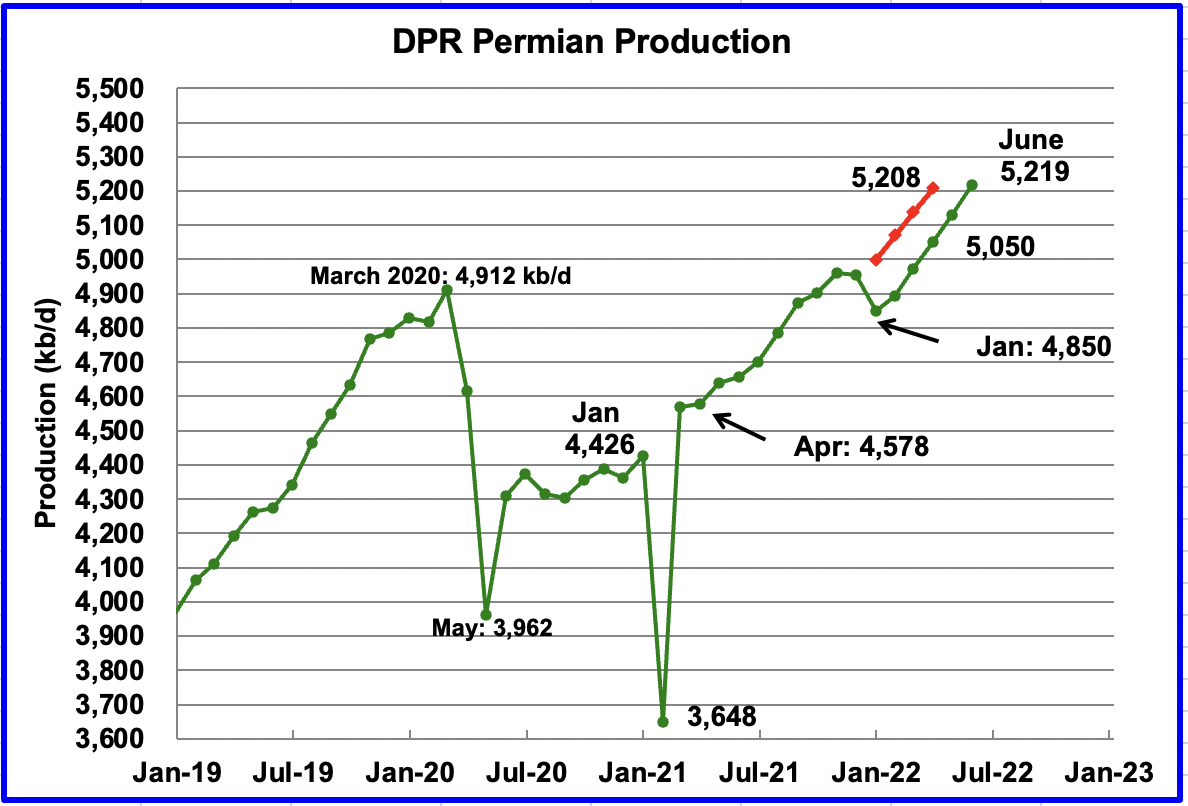
Permian output exceeded 5,000 kb/d in April 2022 and continues to increase. In June, production is expected to increase by 88 kb/d to a new high of 5,219 kb/d. From January to June, production is forecast to increase by 369 kb/d or at an average rate of 73.8 kb/d/mth. If the Permian were part of OPEC, at 5,219 kb/d it would be the second largest producer after Saudi Arabia.
Due to revisions, June’s Permian output is 11 kb/d higher than the DPR’s April’s production forecast of 5,208 kb/d reported in the March report. (Red markers). April was revised down by 158 kb/d to 5,050 kb/d from the May report.
During April, 388 wells were drilled and 434 were completed in the Permian. The completed wells added 349 kb/d to March’s output for an average of 805 kb/d/well. The overall decline was 270 kb/d which resulted in a net increase for Permian output of 79 kb/d. Of the 434 completed wells, 336 were required to offset the decline. It is the completion of the additional 98 DUCs, over and above the drilled wells that accounts for the increase in the production in the Permian.
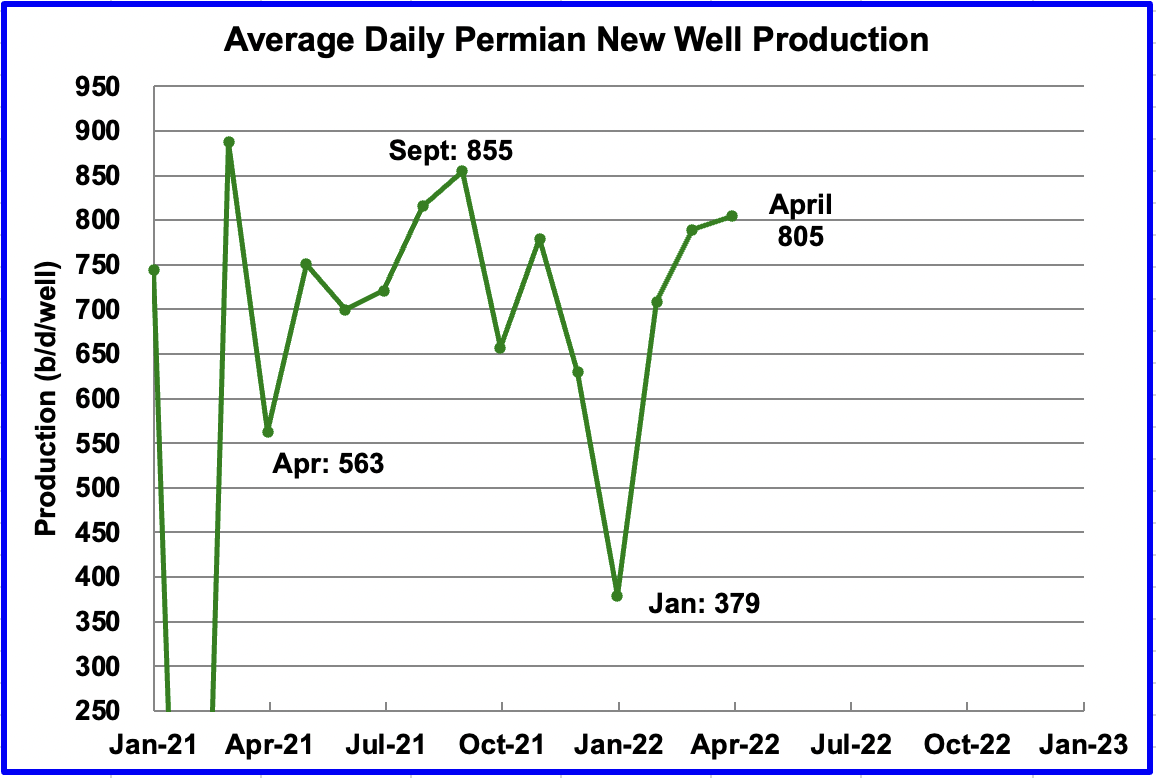
This chart shows the daily production from the average new Permian well tracked on a monthly basis. The daily output for new Permian wells was divided by the number of completed wells, as reported in the DPR and DUC reports. Note this chart is two months behind the DPR production charts.
It appears that the average first month output is close to 800 kb/d. January dropped due to bad weather in Texas. April was essentially unchanged from March at 805 kb/d and February was revised down to 709 kb/d from 795 kb/d.
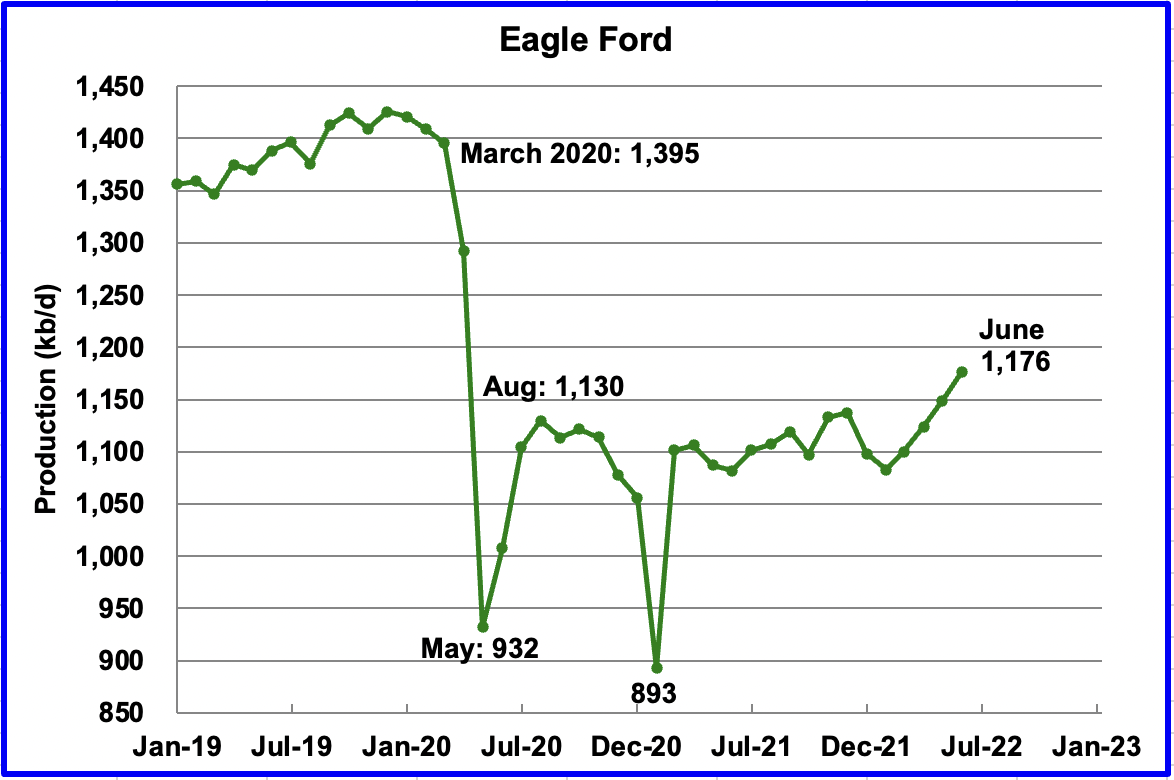
Output in the Eagle Ford basin has been showing an increasing trend since March 2022. For June, output is expected to increase by 27 kb/d to 1,176 kb/d. Since the beginning of the year, 19 rigs have been added up to the end of May for a total of 57, which explains the increasing output.
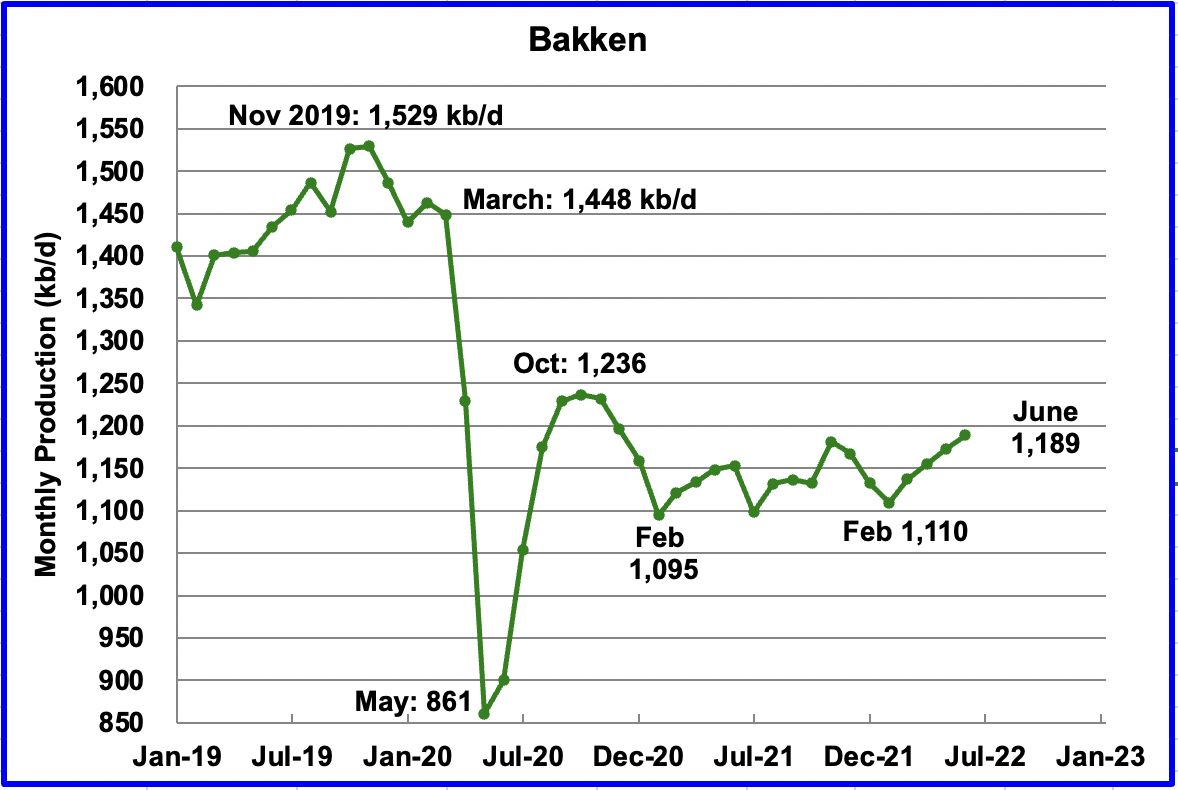
The DPR forecasts Bakken output in June to be 1,189 kb/d an increase of 17 kb/d over April. However after revisions, June production is 3 kb/d higher than was forecast for May in the previous report.
It has been reported that North Dakota April production was hard hit by severe winter weather and clearly this information has not be incorporated in the above graph. It is expected that April production will drop by close to 240 kb/d.
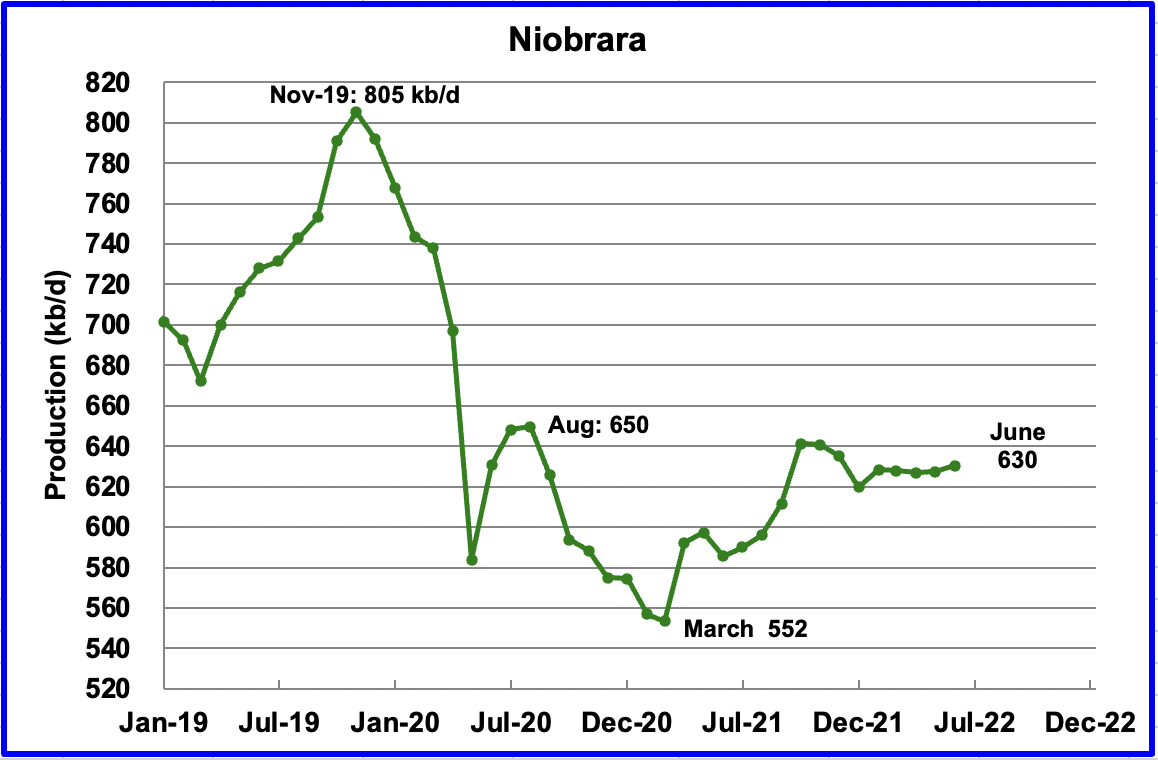
Output in the Niobrara is now showing signs of starting to plateau around 630 kb/d.
DUCs and Drilled Wells
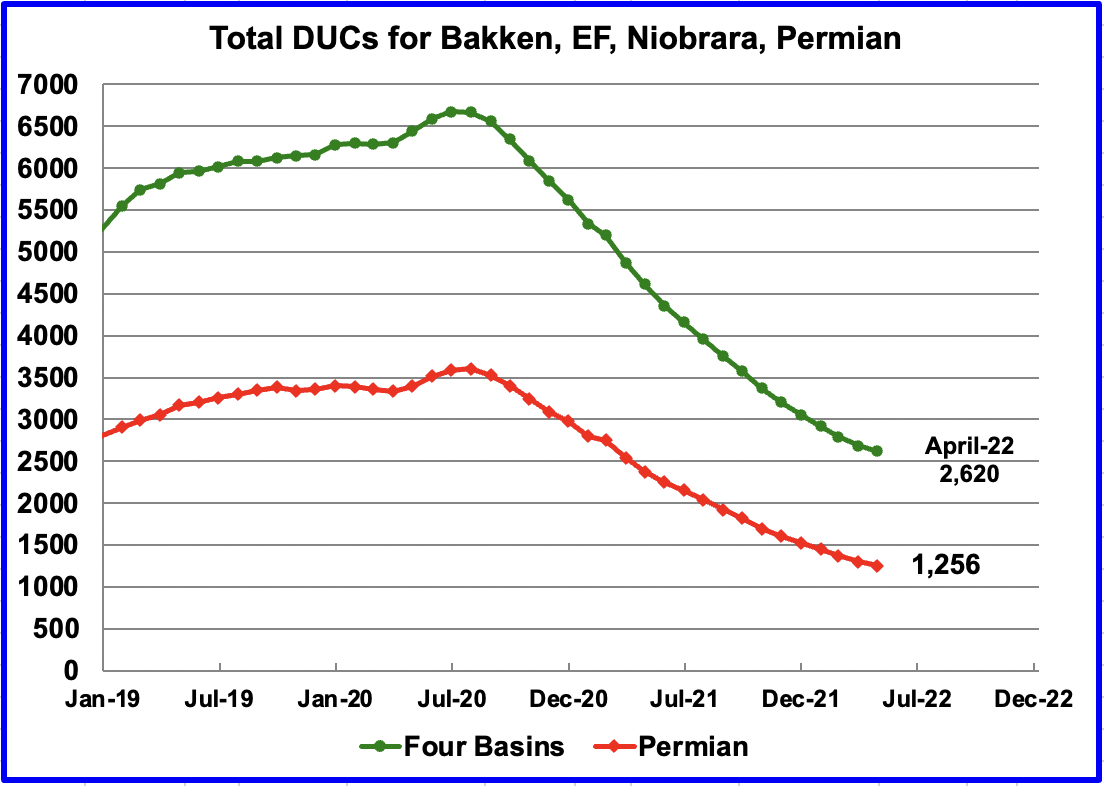
The number of DUCs available for completion in the Permian and the four major DPR oil basins has continued to fall every month since July 2020. Prior to July more wells were drilled than were completed.
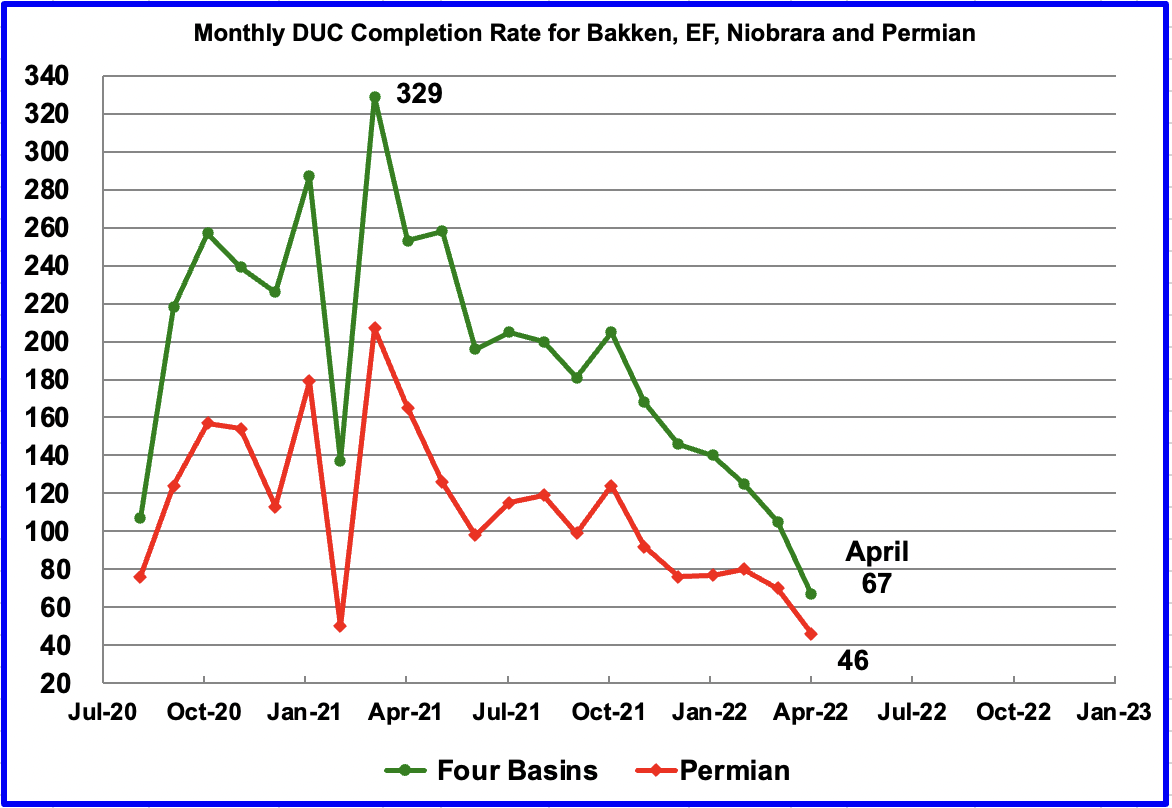
In these four primarily oil basins, the monthly completion rate of DUCs started to slow after peaking in March 2021. For example, in March 2021, 329 DUCs were completed. In April 2022, 67 DUCs were completed, 38 fewer than in March. Similarly the monthly completion rate for DUCs in the Permian continues to fall. It dropped from 71 in March to 46 in April. Is this an indiction that the remaining DUCs are getting less economic.
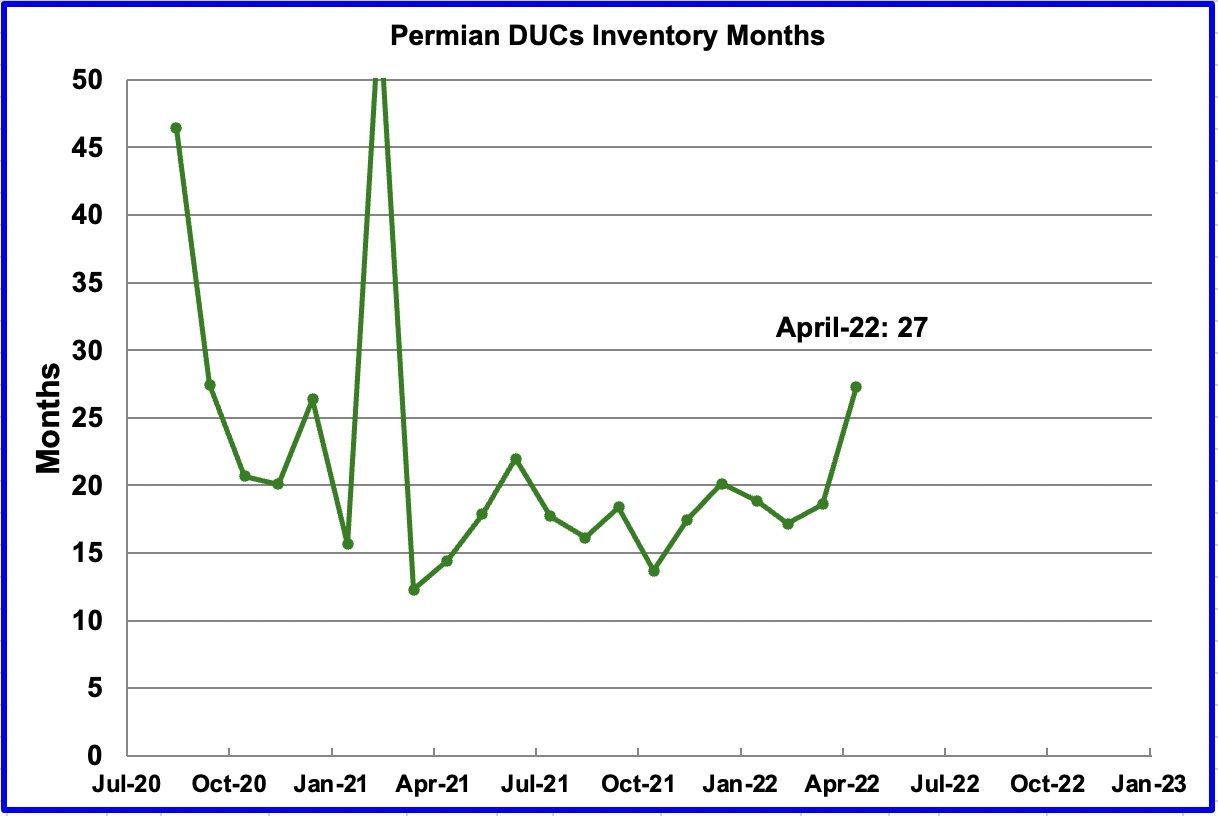
If Permian DUC’s were to be completed at the latest rate of 46 DUCs/mth, that converts into 27 months of DUC inventory, assuming the remaining 1,256 are all commercially viable. The increase in DUC inventory months is due to the slowing rate of completions.
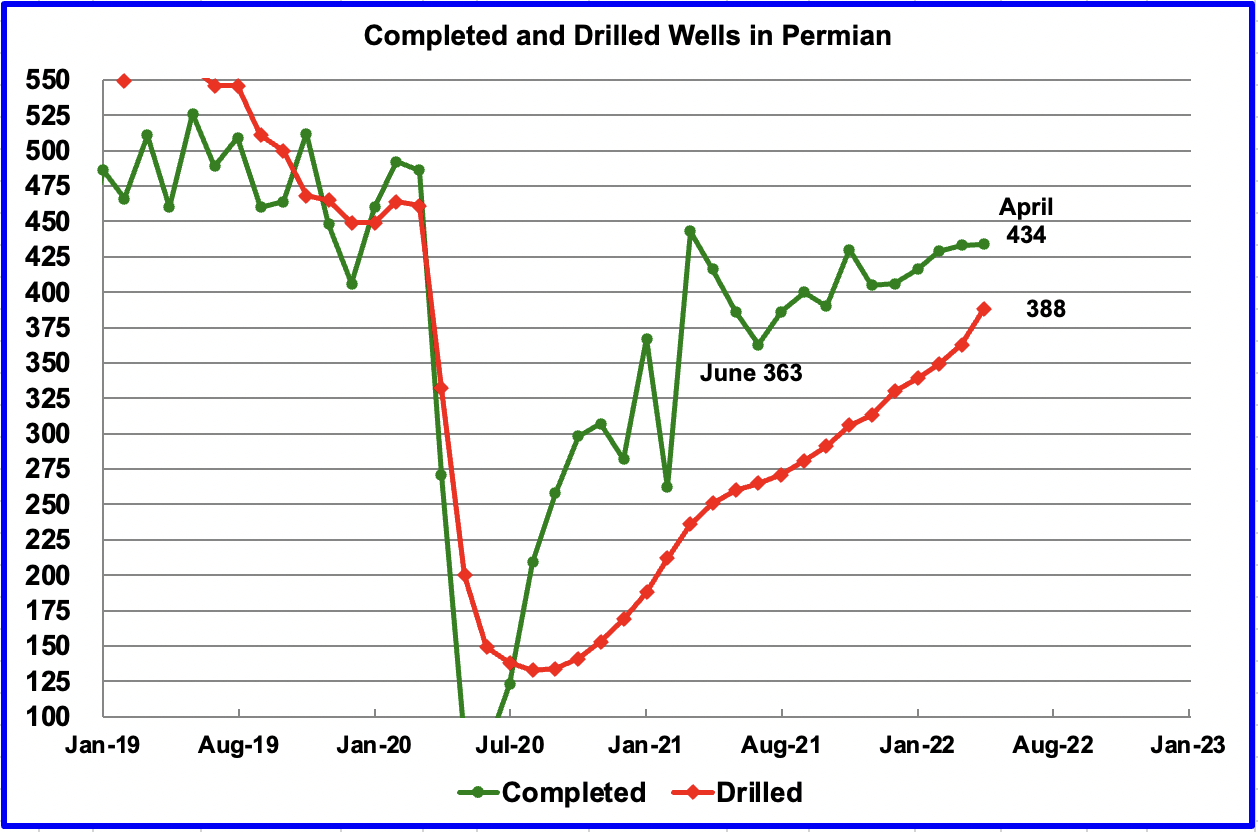
In the Permian, the monthly completion of wells has reversed direction since the low of 363 in June 2021. In April 434 wells were completed, one more than in March and completions are showing signs of a slowing growth rate since February. During April, 388 new wells were drilled, an increase of 25 over March. To counteract the slowing completion of DUCs, drilling has been increased. See next chart.
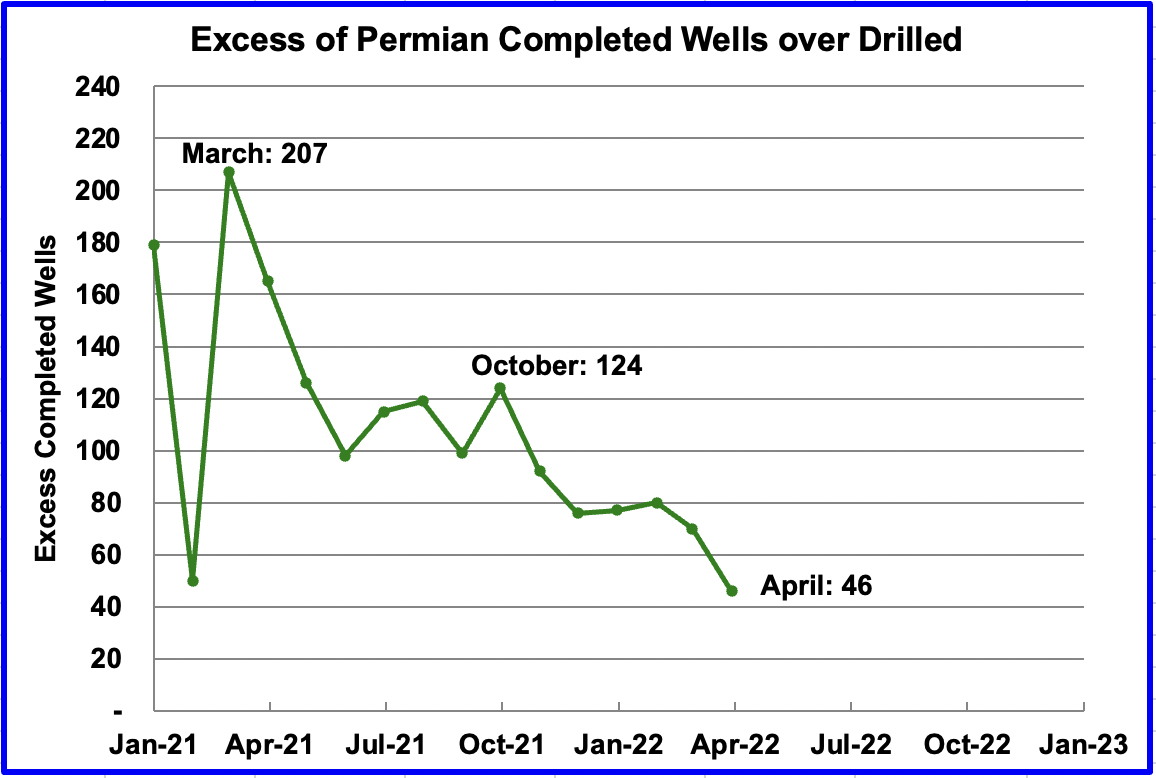
In October 2021, there were 124 more wells completed in the Permian than were drilled. In April the number of excess wells completed was down to 46 since the drilling rate was higher than the completion rate. To offset the drop in the use of DUCs, more wells had to be drilled.
DPR Production Decline Rates
The DPR reports monthly on the past and future production of tight and conventional oil in the seven basins along with decline rates. Typically the DPR is four months ahead of the EIA’s monthly production report.
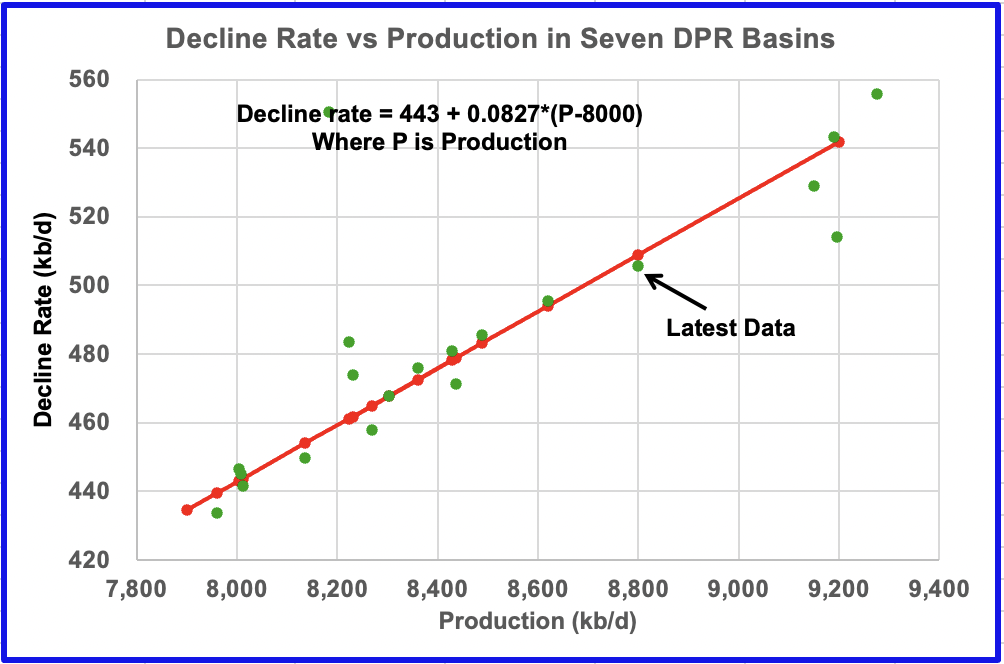
This chart shows the relationship between the decline rate and production rate using only the combined data from the seven DPR basins after April 2021. The OLS line only used the most recent data between April 2021 and May 2022. However the chart includes some data from the time when production was higher, i.e. the four markers around production at 9,200 kb/d. Their position close to the OLS line may be purely accidental since they are from a different dynamic production period.
The latest data for June was added to the chart but the OLS line was not recalculated. Note that it falls very close to the original OLS.
The equation says that for every 100 kb/d of production increase, the decline rate increases by 8.27 kb/d, on average. That makes sense since the newest wells have the highest decline rates.
3) LIGHT TIGHT OIL (LTO) REPORT
The EIA’s LTO database provides information on LTO production from seven tight oil basins and a few smaller ones. The May 2022 report updates tight oil production to April 2022.
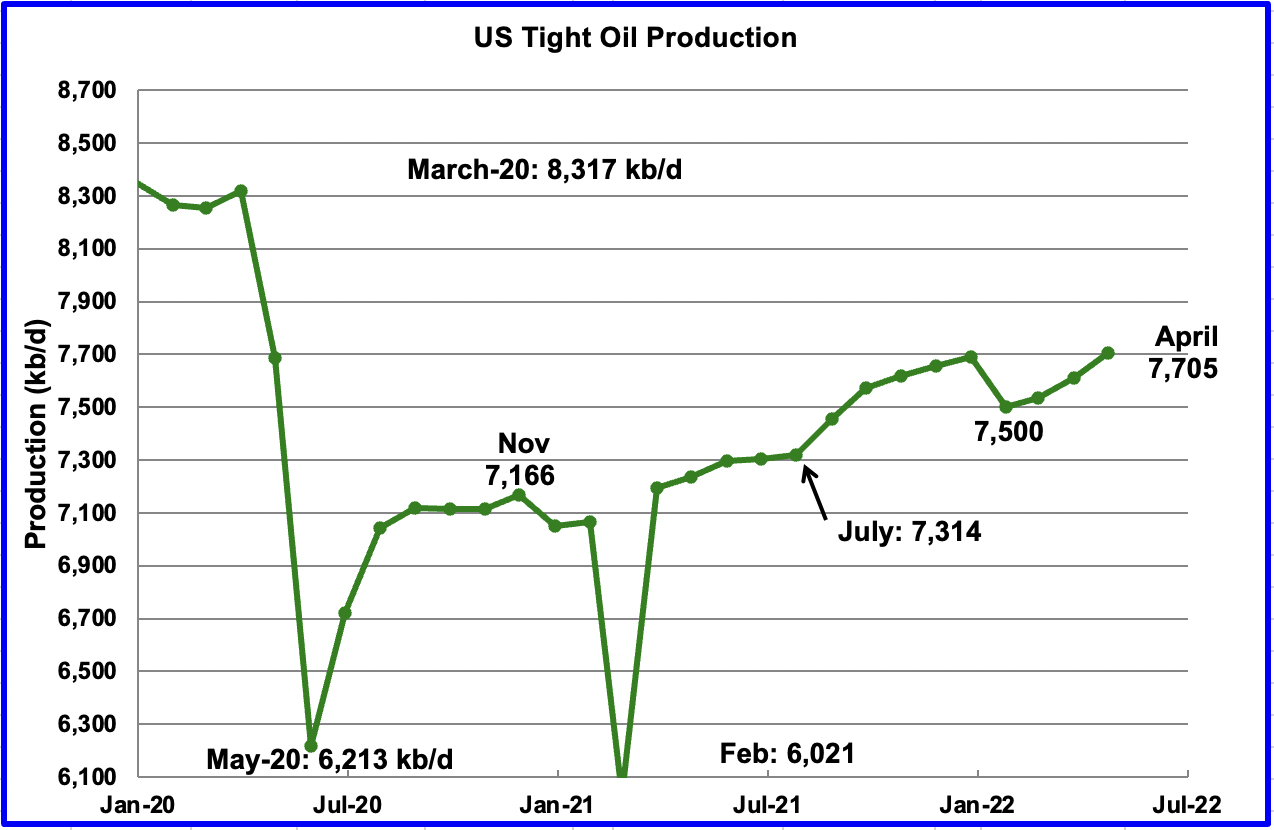
The May LTO report made downward revisions to their April production forecasts reported in the previous post. The biggest revisions in output occurred in February and March and were lower than the previous ones. This follows the same trend reported in the DPR report.
April’s LTO output increased by 95 kb/d to 7,705 kb/d. However, it is just 4 kb/d higher than the March output of 7,701 kb/d reported in the April report.
To get a better indication of the recent trend in LTO growth, it is better to look at the growth from January 2022 to April 2022. Over that period, output increased by 205 kb/d or at an average rate of 51.3 kb/d/mth. This is 67% of the expected US oil production growth rate reported in the STEO section above. There appears to be a disconnect between the STEO and DPR and LTO reports.

Permian LTO output first reached a new high of 4,351 kb/d in September 2021. April’s output increased by 49 kb/d to 4,471 kb/d and is 167 kb/d higher than the high of 4,304 kb/d recorded in March 2020.
Note that the April’s output is 8 kb/d higher than the March output of 4,463 kb/d reported in the April report. The initial estimates for January, February and March were all lowered from last month’s report.
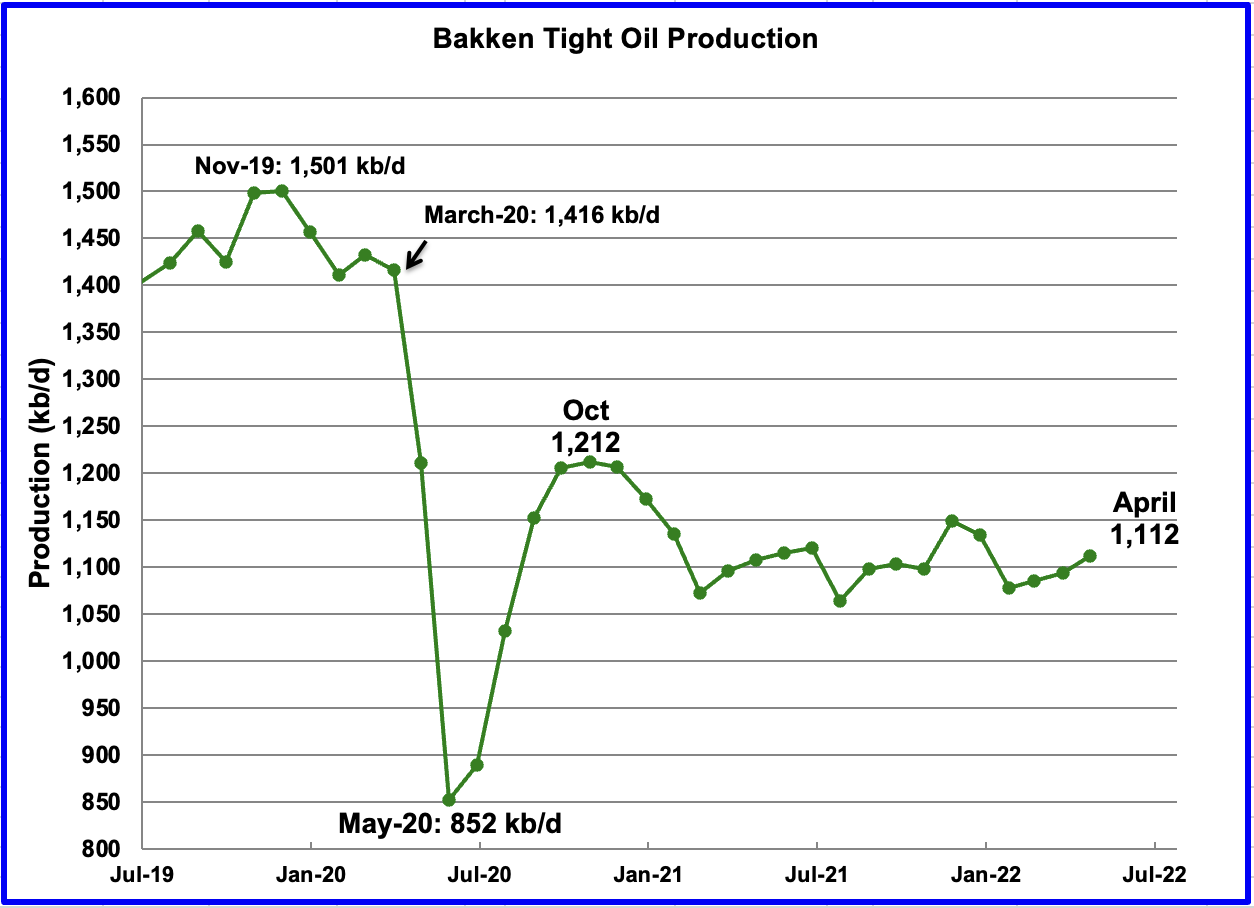
The Bakken’s April output increased by 18 kb/d to 1,112 kb/d. Note it is still below the October 2020 level of 1,212 kb/d and below the 1,125 kbd production reported in the March LTO report. Again February and March were revised lower.
According to this source, ND’s April oil production was hit hard by two winter blizzards. This drop has not been incorporated in April’s LTO production for the Bakken.
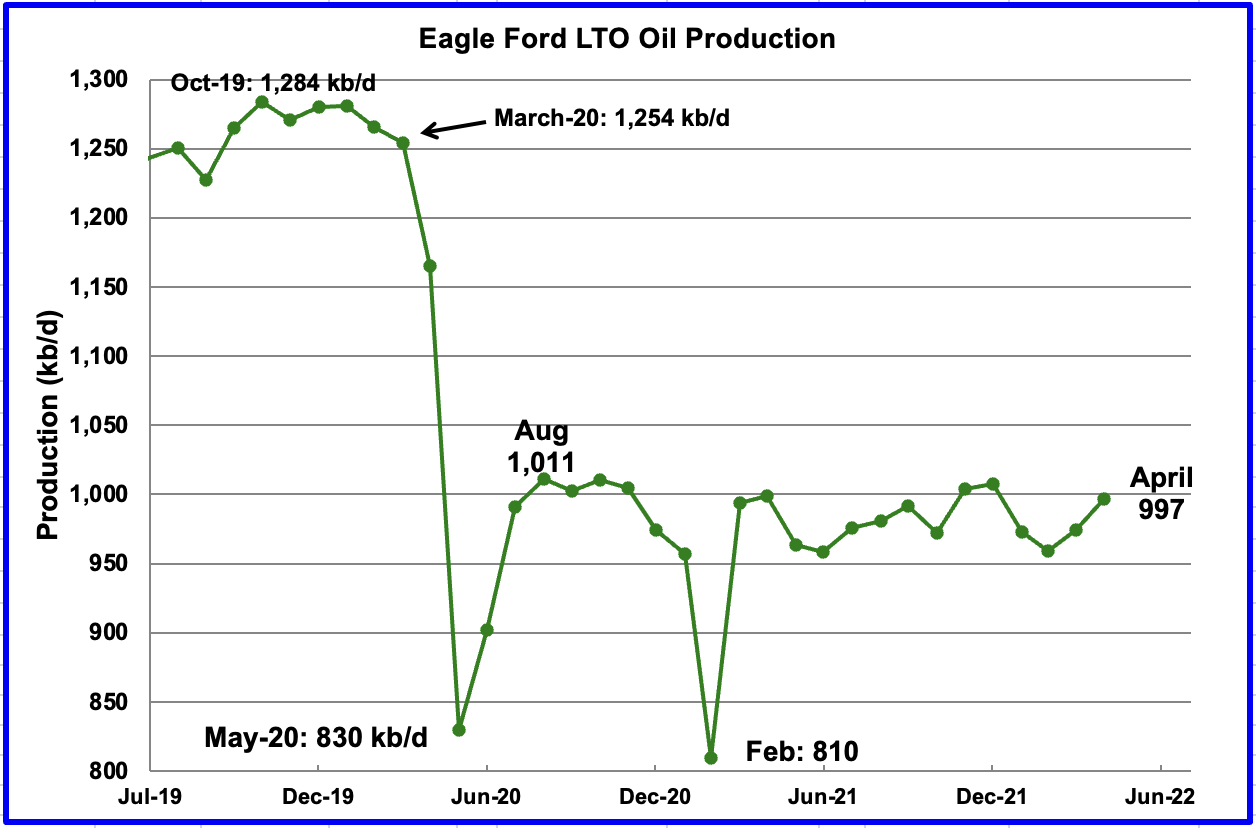
Production in the Eagle Ford basin since August 2020 has been essentially flat at close to 1,000 kb/d. Are the drillers doing this intentionally or is it just accidental or geology?
The Eagle Ford basin production increased by 22 kb/d to 997 kb/d in April.
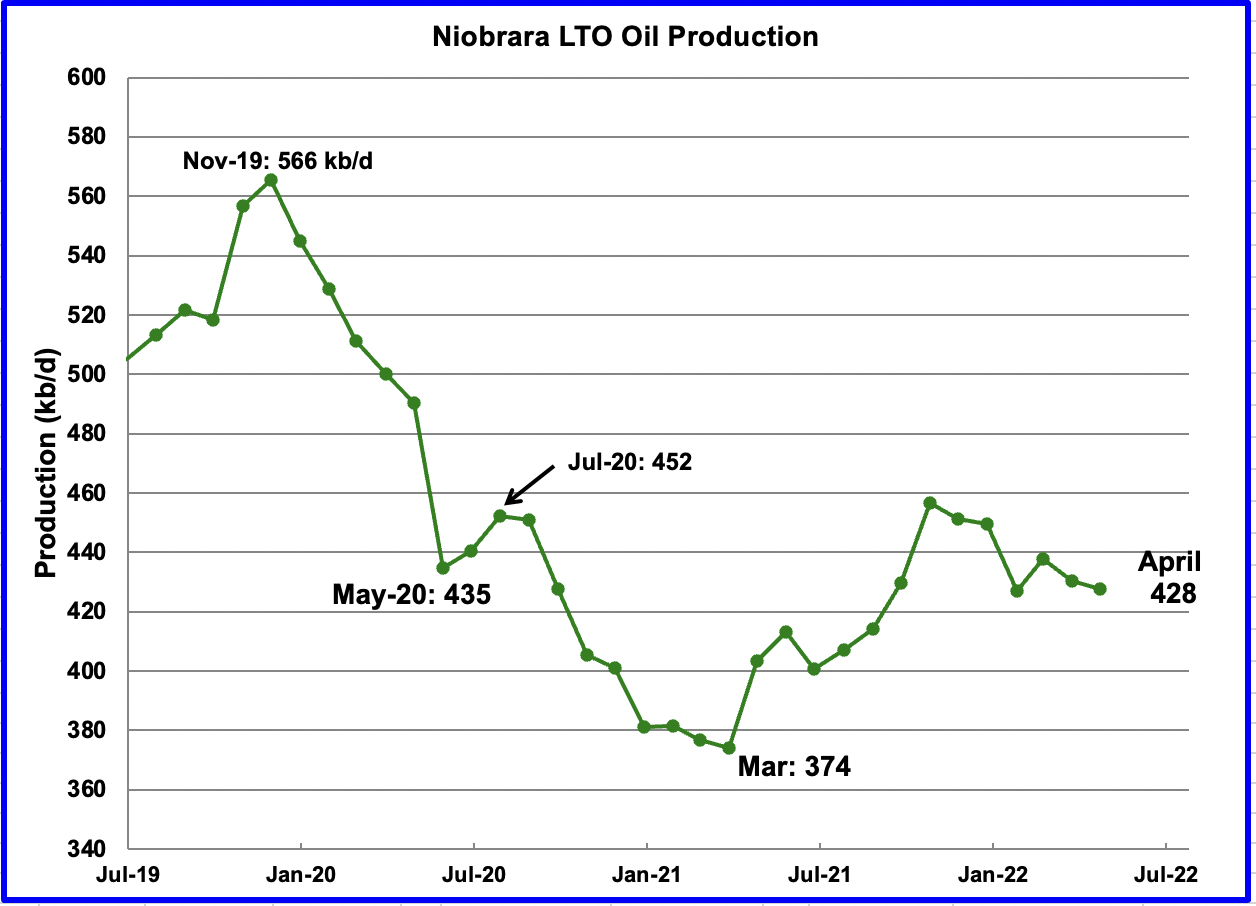
After increasing production from March 2021 to October 2021, output in the Niobrara began to drop in November 2021. April’s output fell by 5 kb/d to 428 kb/d.
On-Shore L48 Conventional Production
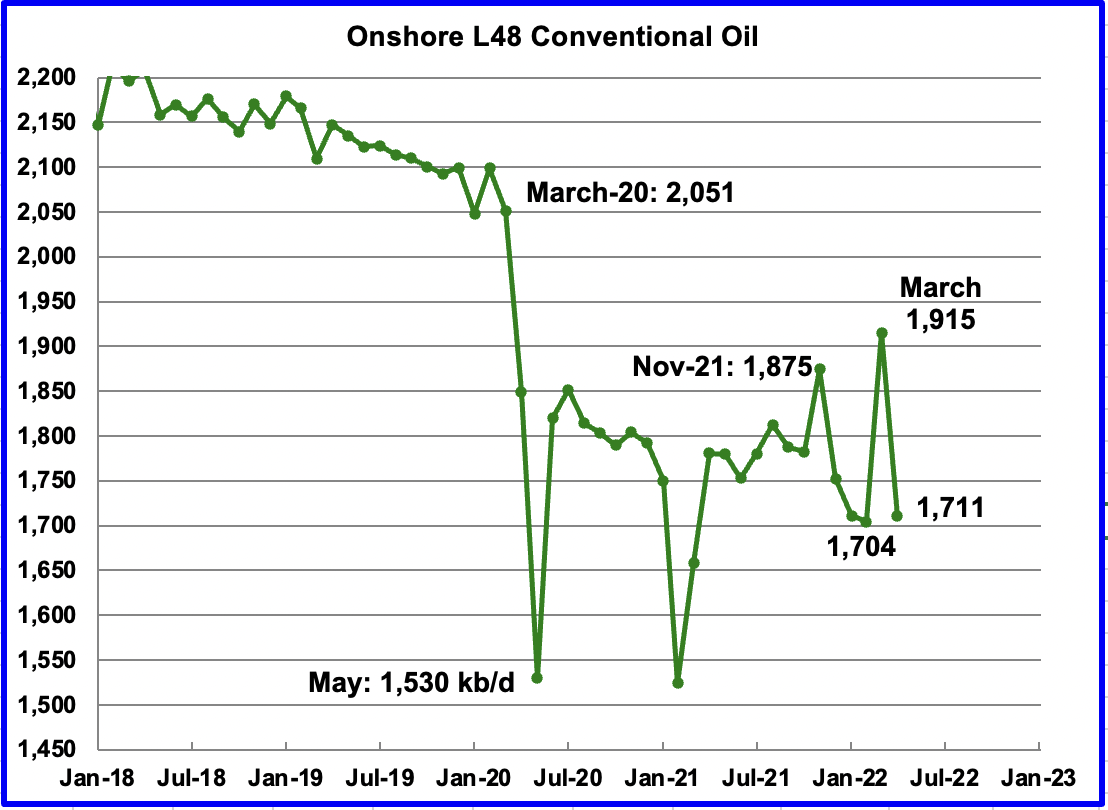
Conventional oil output in the Onshore L48 rose by 211 kb/d in March to 1,905 kb/d but is expected to drop to 1,711 kb/d in April. This estimate is based on a combination of the expected April LTO output and the May 2022 STEO report that has an April 2022 forecast for the US On-shore L48 output. Data from January to March in the STEO has been replaced by the actual EIA production data from the current Mayl report.
A note of caution is in order. This chart is derived by subtracting two large numbers which are subject to revision, particularly the last two months, March and April. Only small revisions were made in the November to February production data.
World Oil Production Without the US
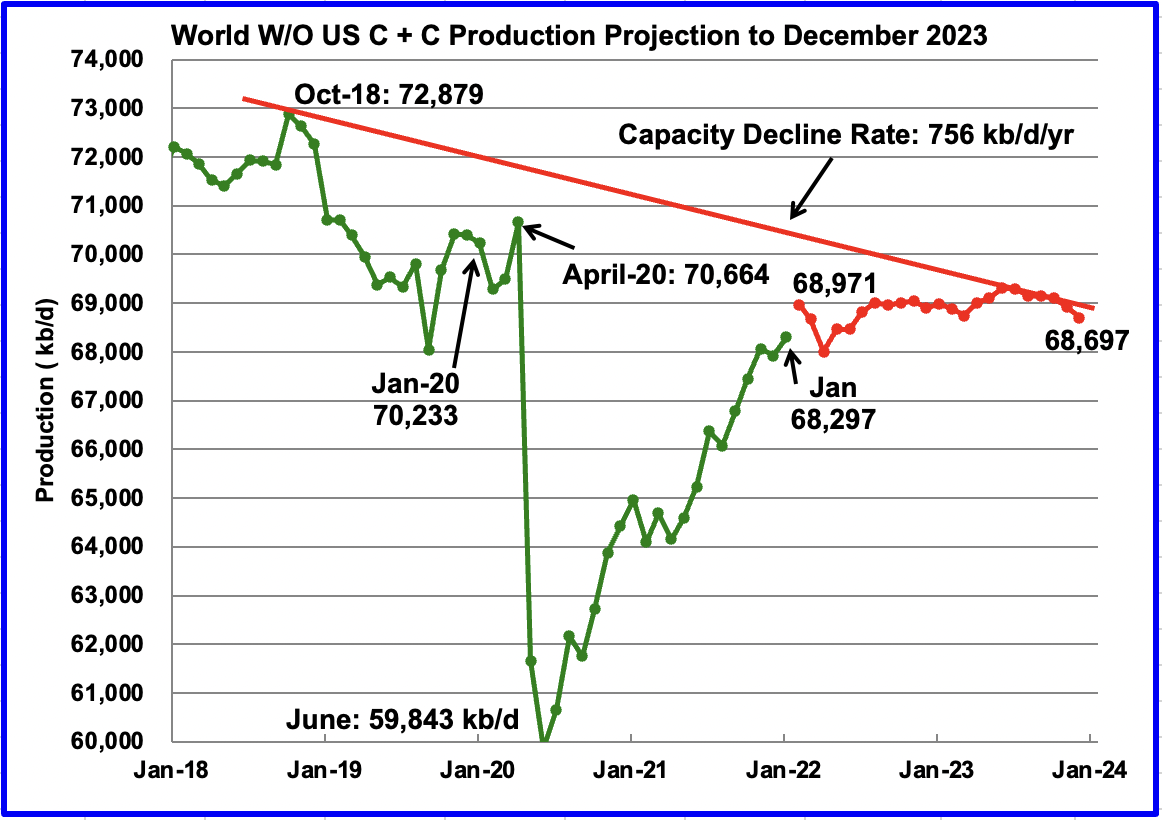
World W/O US oil production increased by 379 kb/d to 68,297 kb/d in January 2021 according to the EIA.
This chart also projects world production without the US to December 2023. It uses the May 2022 STEO report along with the January International Energy Statistics to make the projection. (Red markers). It projects that World crude production W/O US in December 2023 will be close to 68,697 kb/d. Note this projection estimates that World Output W/O US will be essential flat for the next two years. In other words, starting in February 2022, World oil production without the US will be close to 3,900 kb/d lower than in October 2018.
The essentially flat output also means that any increase in World oil demand will have to be provided by the US over the next to years. According to this source, the US permian will be up to the challenge.
Note that the chart also shows a Capacity Decline Rate line of close to 756 kb/d/yr over the years 2018 to 2023. Capacity decline encompasses natural decline and decline associated with reduced investment for drilling and exploration.
263 responses to “US March Oil Production Recovers”
Thanks Ovi.
What do you think of Ed Morse’s $70 WTI call?
$70 is the new $50 IMO (pre-COVID labor and supply crunch).
Really appreciate you doing these posts!!
SS
He is an oil bear. I agree that if a recession starts oil will drop. However so will production out of the Permian. At this point with Russian, Venezuelian and Iranian sanctions, I can’t see oil below $90/b.
It is a bit of a chicken and egg situation. I think that oil above $125/b also begins to slow the economy. Not sure at what point the price of oil pushes the economy into a recession.
Ovi.
Part of the price issue, of course, is lack of refining capacity.
SS
I keep reading about that, but I am not sure that is the whole story. China is the new refinery. They import crude and export a lot of refined product.
I am not sure of the state of the current Europe/US gasoline/diesel trade exchange. Europe used to need more diesel than the US. In the process they made excess gasoline which they shipped to the US. The US was the opposite. They made excess diesel and shipped it to Europe and a reasonable balance was maintained. I do not know what the state of that exchange is now. I keep reading that there is a shortage of diesel in the US. Maybe that is being affected by the refinery shutdown, more so than gasoline.
Ovi.
I’m sure it’s not the whole story, but I’m also sure it is a factor.
The EIA has some very good data on refinery closures. 4.5% of capacity went offline post – COVID in the USA. It was very interesting to me.
Many small refineries closed 1991-2018. But in recent years some much larger ones closed, plants with capacity of over 100K BOPD. COVID did to them something similar as to other industries. In the panic many good employees were terminated, and they didn’t come back. New ones are harder to find as it’s seen as a dead end long term, as is upstream.
Almost 3 million BOPD of refining capacity has been closed since 1991. I think since the Marathon Garyville, LA refinery was completed in 1976 there has only been one new refinery built, a small one in ND. Refineries have added capacity, but apparently not enough for right now.
Refining has been very volatile. I live near a decent sized one and know many who work there. Interesting to pick up tidbits of info and opinion from them.
I’d really recommend readers peruse the EIA refining data. I hadn’t looked at it closely for awhile and had forgotten how much detail is published.
One anecdote, California has lost over 750k BOPD of refining capacity since the EIA began collecting data in 1982.
OTOH, states along the Gulf Coast have added a lot of capacity despite no new refineries being built.
In terms of refining, this is definitely a year we can’t afford to have a hurricane which has major impact upon that Gulf Coast refining. Would be a catastrophe.
Shallow sand,
It is not clear that anybody wants to build new refineries or expand capacity in the US. We can export the excess tight oil to nations that have refineries better suited to light oil and then import finished products from those nations. Or we could ban exports of crude which might force some refinery adjustments, but this might not be the most cost effective solution. The result might simply be lower output of tight oil and higher prices paid for imported crude suited for current refinery capacity in the US because the lower total output of World crude will tend to drive prices higher.
This is counterintuitive, a ban on US crude exports is likely to drive imported crude oil prices higher and the marginal barrel refined in the US is imported and will set the price of gasoline, diesel, and jet fuel.
Dennis.
I wasn’t commenting on anything other than there have been some larger refineries closed in recent years.
I suspect there won’t be another refinery built in the USA.
The executive branch is rumored to be looking into assisting idled refineries back into production.
CA has the highest fuel prices in the lower 48. I know taxes play a big part. Environmental factors matter too. Do you think shrinking refining capacity has also played a part?
All part of the volatility in the bumpy energy transition.
If I am not mistaken, the largest refining capacity decline in the past decade was the big explosion and destruction at the Philadelphia complex in 2019-
335,000 bpd capacity
https://www.hydrocarbonprocessing.com/news/2021/07/refinery-closures-decreased-us-refinery-capacity-during-2020
Shallow sand,
Smaller refinery capacity may be a part of the problem, my guess is that the larger problem is disruption in the entire system due to shortages of oil, both due to OPEC restraint on increasing output and sanctions on Russia, Iran, and Venezuela.
You make an excellent point on lack of spare capacity and problems if a hurricane hits Gulf coast refineries. It would make more sense if SPR was saved for those situations, though I am not sure how long refined product can be stored, it would be good to have some set aside for emergencies, if it is possible.
Centered 12 month average % of operable refinery capacity utilized in US
https://www.eia.gov/dnav/pet/pet_pnp_unc_dcu_nus_m.htm
Weekly chart at link below
https://www.eia.gov/dnav/pet/hist/LeafHandler.ashx?n=PET&s=WPULEUS3&f=W
SS , tks for bringing the refinery issue . I have said earlier that getting the crude from Ghawar to the tank of Six Joe Pack in Louisiana is a closed loop system which is extraction , transportation ( pipelines ) and refining . When one of the chain breaks Six Joe Pack will run on empty .
Refinery capacity in the US
https://www.eia.gov/dnav/pet/hist/LeafHandler.ashx?n=pet&s=mocleus2&f=a
Capacity of 18.8 Mbpd in 2018 and 18.1 Mbpd in 2021, about a 3.7% decrease in refinery capacity. The highest gross input (monthly) was 18 Mbpd in June 2018, average annual input in 2018 (highest annual average) was 17.3 Mbpd. At the 2021 average operable capacity this level would be a 96% utilization rate. By March 2022 operable capacity had fallen to 17.9 Mbpd and at that level a 17.3 Mbpd input would be a 97% utilization rate.
We may indeed be suffering from the lack of refinery capacity that shallow sand pointed us to.
““Building a refinery is a multi-billion dollar investment. It may take a decade. We haven’t had a refinery built in the United States since the 1970s. My personal view is that there will never be another refinery built in the United States.” Chevron CEO June 2022
Ovi,
I agree, 90 to 125 seems like a likely range for WTI over the next 12 to 18 months.
On DPR production decline rates, this is very sensitive to the time period involved and whether the completion rate is rising, falling or relatively stable. During a period with relatively stable completion rate from Jan 2019 to Jan 2020 ( in the range of 900-1300 completions per month, with 9 of 12 months in the range of 1100 to 1300 completions), the decline rate was relatively flat. See chart below.
A more general idea of what DPR decline rate looked like from March 2017 to March 2020 is shown below, for much of the early period from March 2017 to December 2018(green diamond markers on chart), the completion rate was rising rapidly from 900 to 1300 completions per month, then the completion rate fluctuated up and down between 900 and 1300 completions per month over the next 2 years, with 2019 being relatively flat in terms of the change in legacy decline as shown in previous chart. The brown triangles represent data from April 2021 to April 2022 and are shown for comparison, if the completion rate stabilizes at say 1100 completions per month we may see the rise in legacy decline either slow down or stop as it did in 2019. The curve seems to have shifted, perhaps due to changes in the average well profile for tight oil basins, the highest legacy decline rate to date has been about 570 kb/d and if the equation from the recent data holds into the future, that level of legacy decline would be reached at about 9530 kb/d for the 7 region DPR oil output total. Blue upright triangle markers in chart are Jan 2019 to March 2020 data. Data from April 2020 to March 2021 are not shown on chart.
Dennis
Between your two charts you have shown the fallacy of looking at different completion regimes. In an increasing completion regime the decline rates are essentially the same. In the original chart posted above, I chose to look at the period when completion rates stabilized and were growing. Also I wasn’t sure if the earlier wells had a different initial rate and whether that could affect the results. Your chart seems to indicate (Green and Purple markers) that the initial rate has no effect. The main consideration seems to be whether completions are increasing or decreasing.
Regardless, we have come to roughly the same conclusion, the decline rate increases by close to 8.3 kb/d per100 kb/d increase, on average.
Ovi,
Yes I was interested in whether the slope would be similar. There are many variables, probably better to look at individual basins and changes in well profiles may affect the relationship. My thinking was that as the completion rate became somewhat stable, that legacy decline rate may not increase as quickly, this seems to be the case.
By stable, I mean a constant completion rate at some level x, my guess is x may be about 650 for the Permian from 2023 to 2028.
OPEC+ agrees to raise output by 648K BPD in July and again in August
Oil ministers from OPEC+ nations agreed on Thursday to lift output by 648K barrels per day (BPD) in both July and August, according to sources speaking to Reuters, in line with the recommendation made by the group’s Joint Ministerial Monitoring Committee earlier in the day. With Thursday’s meeting having now ended, the next meeting has been penciled in for 30 June.
Thursday’s decision marks a departure from the groups policy over the last year and a bit of raising output at a more measured pace of 432K BPD each month.
The target rates are attached. Note that SA’s production level is above the highest rate it has ever sustained for more than six months. In H2 2016, SA maintained a production level of 10,600 kb/d for six months before dropping back to 10,000 kb/d
https://www.fxstreet.com/news/opec-agrees-to-raise-output-by-648k-bpd-in-july-and-again-in-august-202206021326
Comparing what they require in July versus April production there are a few unreasonable assumptions. Angola will not increase production by 342 Kb/d in three months. Nigeria will not increase production by 886 Kb/d. And of all the rest, only Gabon seems resonable.
But by far the most unreasonable is their projection for Russia. They have Russia down for 10,833 Kb/d, and that is crude only. Russia must hit a new all-time record high in C+C to produce that much crude only. They would have to produce more than their record monthly high C+C of 11,680 kb/d in December 2018 if they are going to produce 10,833 kb/d of crude only.
Sorry about the misspelling of Must increse by. I cannot correct what in in the graph.
Here are the increases for the non-OPEC portion of OPEC+. For some reason Mexico was not included in the report I copied this data from a couple of weeks ago. At any rate, this graph is totally unreasonable for any of the nations except South Sudan. But the Russian data is totally absurd
Ron
Mexico was part of the OPEC plus deal for just one year. They are now committed to 1,753 kb/d and it does not change. They have some deal whereby they sell oil forward and do not want to affect that deal. They may be on the losing side this year.
So far, I have not seen any evidence that Americans are curtailing oil use [or derivative products]
at $120/barrel.
Anyone else seen data to indicate curtailed consumption due to oil price [and not including that due to supply chain disruptions which are a different story] ?
Hickory
Definitely hear a lot of casual/personal comments of not taking a long trip but no hard evidence.
At least that explains the stories for things like 1/3 of those on $250k/pa salaries are living paycheque-to-paycheque and 48% of families needing tax credits to be able to feed their kids.
Also, “excess savings” is dropping like a rock. Gotta love that newspeak lingo for social safety nets.
“Anyone else seen data to indicate curtailed consumption due to oil price?”
My “data” consists of the observation that more and more gigantic, fat-ass trucks with exhaust pipes like garbage cans keep speeding past our house at all hours, without a f*cking care in the world.
So much for rural serenity.
Ovi,
First let me say, I really appreciate your oil updates. I count over 40 charts in this update. I especially find the last chart interesting showing how the REST OF THE WORLD, minus the United States shows a plateau over the next two years. Of course, there could be revisions, but I don’t think it will change the overall scenario all that much.
This is especially bad news for the Global Economy and Financial System. Why? Because, as you are likely aware, our highly leveraged debt-based financial system survives on a growing energy supply to maintain the $300 trillion of debt in the world. When the oil supply plateaus and declines, the entire Highly-Leveraged Debt-Based Financial System begins to unravel.
I don’t believe many understand the ramifications of this predicament. Since the 2008 Financial Crisis, with the help of Ben Bernanke & the Fed, U.S. Shale Oil came to the rescue accounting for 75% of the net Global Oil Production growth over the following decade.
We can see that in the chart below. If we look at two time periods BEFORE and AFTER 2008, the REST OF THE WORLD accounted for 12.7 mbd of growth from 1997-2008. However, this totally flipped after 2008 as the United States and Canada accounted for 12.6 mbd of growth while the REST OF THE WORLD was basically flat.
Thus, we can thank lousy Tar Sands and mostly unprofitable Shale Oil for allowing Business as Usual to continue in the world from 2009-2019.
But, as your last chart shows, there is no real growth ahead. I believe after 2025, the World will begin to head down the ENERGY CLIFF and this will only escalate as we reach 2030, and afterward.
Thanks again for the update.
steve
Could you define what you mean ‘CLIFF’,
seeing as how the downslope rate is a ‘big deal’?
Hickory,
I have posted this chart in this blog before. This chart comes from a video done by Nate Hagens, and how debt was used to bring forward production to a higher level, due to a massive increase in debt, especially since 2000.
The chart is explained in his two-hour video presentation at the 38 minute mark, but discusses the global oil situation extensively, so it may be worth the watch:
https://www.youtube.com/watch?v=qYeZwUVx5MY&t
However, as oil production begins to decline, it will pop the $300 Trillion Global Debt Bubble. When debt implodes, so will oil production. Thus, we have the ENERGY CLIFF, similar to the SENECA CLIFF.
steve
When has the oil industry not had credit available to them? Perhaps in the mid eighties during the S+L crisis in Texas, but mostly they have always had access to debt and utilized it when it made financial sense to do so (such as when interest rates were very low and profits were very high).
As to whether we see a cliff, will depend in part on demand and the transition to electric transport. The cliff will come because nobody needs the oil any longer and it may happen very quickly from 2030 to 2040.
Dennis,
Do you really believe in what you wrote here: “The cliff will come because nobody needs the oil any longer and it may happen very quickly from 2030 to 2040.”
Nobody needs oil any longer???
I disagree with this assessment, but I would welcome any other members to chime in.
steve
Steve —
One oddity of you analysis is equating oil with energy. In fact most energy consumed by humans does not come from oil, as this analysis from Lawrence Livermore National Lab shows.
https://flowcharts.llnl.gov/sites/flowcharts/files/2022-04/Energy_2021_United-States_0.png
The chart shows that oil is mostly used for transportation, and most of this is “rejected” — that is wasted. That’s because most of the fuel you buy goes into pointlessly heating your radiator.
Also LLNL doesn’t even address the fact that America’s transportation system is hopelessly inefficient, burning more than twice as much oil per capita as leading industrial powers like Germany or Japan.
https://www.worldometers.info/oil/oil-consumption-by-country/
It is sometimes argued that America’s massive wastefulness is related
to population density, but rich low density countries like Sweden don’t use anywhere near as much oil.
The reason we consume so much oil is that it is cheap. If the price goes up, people will consume less.
Steve,
Poorly stated by me. The idea is not that nobody needs oil, but simply that demand for oil will be lower than the supply of oil available at a high oil price that prevails before 2030 (likely in the range of $100 to $125/bo in 2021 US$). This will result in falling oil prices and expensive oil such as Arctic oil and tight oil, followed by new oil sands projects and new ultra deepwater offshore projects will no longer be viable. There may indeed be a Seneca cliff in oil demand as the transition to electric transport will be much swifter than imagined by most mainstream agencies (IEA, EIA, OPEC, etc).
Do you remember when you thought to yourself, why would I ever pay $500 for a cell phone? It was not that long ago (first iphone was released in June 2007). In 15 years people will be saying, remember when people use to use liquid fuel in light vehicles and thought they would never own an EV? At that point World demand for crude oil may have fallen to 69 Mbpd and in 20 years demand may have fallen to 48 Mbpd. See chart below for one possible scenario where no approval of full self driving vehicles is assumed, demand drops much more steeply once robo taxis are approved widely.
“It is sometimes argued that America’s massive wastefulness is related to population density, but rich low density countries like Sweden don’t use anywhere near as much oil.” ~ Alim
Thanks Tips; got it, as soon as Americans cease to be wasteful & inefficient gluttons then we’ll be saved. We’ll all set a watch. Cheers.
Survivalist, no worries. President Oz will surely lead the US to energy nirvana.
Diesel haulage trucks are “waste”, lol.
Global electric HGV fleet when? That Tesla Semi, aaaaaany day now… gotta keep the faith…
When will some folks understand that the West is ” The Landfill Economy ” ? Our economic system is based on the premise ” Your waste is my income ” . Keep this up and we are all going to the destination — ” The Landfill ” . Enjoy it till you reach there .
I really enjoy Mike S input. It is great to hear someone who is such an expert. That is a compliment.
I think Dennis does a great job.
Ron, Ovi, Bob, etc….are doing an amazing job.
I don’t understand the insults.
Peak avocado,
I agree that Ovi, Bob, George, and Islandboy do an excellent job.
I also agree Mike Shellman’s comments are wonderful and I am grateful he is willing to share his expertise , the insults are fine.
Kleiber,
A number of truck companies offer heavy duty EV trucks in Europe. At current prices for diesel fuel they may be very attractive.
Dennis. I thought the recent narrative was that banks were getting out of financing fossil fuels?
False narrative?
Confusing, ain’t it, Shallow?
In fact the “narrative” now (on AOB) is that no tight oil company needs to borrow money at all because at these product prices they can, a.) pay down ALL debt in just a few years, b.) replace ALL of the ENORMOUS , and escalating, base decline rates of US tight oil while, c.) continue to grow production in the Permian from 5.3 to 8.0 MM BOPD in just a few years (in the face of a 35% increase in D&C costs) and, d.) continue to increase dividends and buy back shares of stock to appease the people that now own them and control very breath they take.
What else? Oh yeah, that it’s GOOD that America continues to export its last remaining hydrocarbon resources at the rate of 75% of total Texas tight oil production, and now, 20 BCF of natural gas LNG exports….because demand will fall to little of nothing by April 23, 2033 and we won’t need it anyway. Good grief ! All this from an expert from Maine who has never even seen an oil well in his life much less written a check to understand one.
I am unclear why anybody wanting to actually know what the future holds regarding America’s fossil fuel future even reads this dribble. It’s gotten laughable, and the talk of my industry, who believes it all is all anti-oil, let’s get to EV’s ASAP, political minded horse shit.
Ovi, yours is good work. and yours Bob; thank you. I truly don’t understand why you men bother but thanks for trying.
@Mike
It’s fact that we have to phase out the heavy use of oil in the next 30 years. That has nothing to do with anti-oil or being a dreaming woke green pothead.
It’s just the last 20 years, where prospectors found less than you oil men pumped. So we need a plan B. Plan B contains the part not to ruin the existing oil industry, since the switch over will take a lot of time. Lot’s of new infrastructure has to be build, using oil. That’s not done in 10 years.
Money and debt will be the least problems – there is always the possibility of a war economy when things go wrong badly. And money can be created, debt can be destroyed. Yes, it produces some chaos. In my family history one event destroyed a few million $ in current value during a dept shakeoff.
You can stop exporting oil in the USA, but this will shoot the oil price to the moon in the current enviroment. The US refineries can’t intake that much light oil, so you still will have to import some stuff while reducing producing LTO. At the low price of 200$+, since this means another -3 mbpd on the world market – while LTO on the US only market will be cheap. Just more chaos.
Shallow sand,
Financing can occur through selling stock and selling bonds, my guess is that major oil companies and large independent oil companies can get a line of credit as needed.
At $100+ per barrel, these companies can self finance out of operating cash flow. The point was simply that debt has been part of corporate operations for quite a while.
Let’s say someone offers you a loan at 1% interest and you see an opportunity where the likely ROI is 25%, many businesses would take the loan and pocket the net 24% return.
Shallow sand,
Was that my narrative? I think I have said that at prices over $100/bo Permian producers should have positive operating cash flow. As far as what oil companies choose to do with this cash flow, I think they know best what should be done with the money they earn. Currently Permian producers seem to be paying down debt, returning cash to shareholders, and buying back their stock with just enough investment to increase output by about 8.6% per year.
The average 2020 Permian well with assumed well cost of $14 million (40% higher than before pandemic) in 2020$ and OPEX cost of $18/bo over the life of the well and a wellhead oil price of $100/bo, NGL price of $35/b, and natural gas price of $5/MCF would payout after 16 months and at a nominal discount rate of 65% the discounted net cash flow over the life of the well would be $14.6 million. The undiscounted net revenue over the life of the well would be $37 million, leaving a profit of $23 million after deducting the capital cost ($14 million) of the well, that is a return on investment of about 264%.
If we reduce the oil price assumptions to $90/bo at wellhead, NGL at $31.50, and natural gas at $4/MCF (all on 2020 $), cost assumptions the same as previous example.
Then the well pays out at 21 months, at 36 months net revenue is $18.5 million, at 60 months net revenue is $23 million and at the end of the well’s life (assumed to be 20 bopd) at 168 months, net revenue is 32 million. In this case a nominal discount rate of 50% results in discounted net cash flow over the life of the well to be around $14 million.
The cumulative oil output of the average 2020 Permian well is about 284 kbo at 36 months, 348 kbo at 60 months, and 478 kbo at 168 months when well is plugged, cumulative NGL is 168 kb at 168 months and cumulative natural gas is 2030 million cubic feet at 168 months. At 60 months cumul NGL is 100 kb, natural gas cumul is 1209 million Cu ft. At 36 months cumul NGL is 74 kb, and cumul nat gas is 891 MMCF.
Dennis. Not your narrative. This is MSM stuff.
I have read many MSM articles indicating banks are trying to get out of the fossil fuel lending business.
Until the current administration got its ass in a crack with $5 gasoline and $6 diesel, plus $300 coal and $8 nat gas, it was strongly arguing against further financing of fossil fuel production.
IEA said recently that drilling should cease. 2020 Dem Pres. candidates were climbing over themselves in debates that we should “keep it in the ground.”
As with many other topics, a lot of irresponsible sloganeering and impossible policy goals (Green New Deal anyone) (MMT anyone) has had an affect.
In any event, the Dems are screaming about greedy oil companies when they should be thankful for $5 gasoline, as that should speed up the energy transition. I thought that was the idea? I guess it isn’t worth losing and election to stick with that one?
Shallow sand,
Spreadsheet with 2020 avg Permian well breakeven analysis at link below
https://drive.google.com/file/d/1LcqTBCJMGGbquk8iUryGx2oAX3XJJqbR/view?usp=sharing
Shallow sand,
I agree many silly claims are made by politicians of all political stripes. High gas prices hurt politicians, so Republicans will probably do well in November. Biden would be wise to not jump on the windfall tax bandwagon, a recipe for even higher fuel prices. It would also be wise to allow permitting on Federal land and water and open up offshore leases for bids in the GOM. We will need energy to enable a transition to non-fossil fuel energy, there are no magic wands, this will take 15 to 30 years to accomplish.
Shallow sand,
Would love to get your input on my breakeven analysis to correct what I have missed.
If you have a minute. If you would prefer to get it emailed to you let me know. Some people do not trust google links.
Mike–
Your periodic jeremiads are greatly appreciated in this household. I enjoy reading your comments aloud to my mate.
Your gratuitous insults to people who run this site for free, not so much.
“All this from an expert from Maine who has never even seen an oil well in his life much less written a check to understand one.”
MikeB,
Mike S is correct that I have never been involved in oil production in any way. I have never claimed to be an expert, Mike is the oil pro (what I would call an expert) not me.
I also enjoy his comments, the insults are fine, I don’t care.
I have stopped responding to Mr Shellman’s comments because any response is considered insulting. I have learned a lot from Mike and appreciate all he has taught me.
“who has never even seen an oil well in his life”
Funny stuff. I have never seen an electron in my life. I have never been to the sun. I can’t say for certain that the moon isn’t made of green cheese since I’ve never been there either.
The earth sciences is a bleak and plodding research discipline that has the reaction time of molasses.
I really enjoy Mike S input. It is great to hear someone who is such an expert. That is a compliment.
I think Dennis does a great job.
Ron, Ovi, Bob, etc….are doing an amazing job.
Paul,
I think Mr. Shellman just wants to emphasize that he knows the oil business far better than I do.
I agree with him and have attempted to incorporate all he has taught me into my scenarios.
Shallow sand has given me some feedback on my breakeven analysis, I will let him share it here if he would like.
If any other experts would like to take a look at the spreadsheet and let me know the errors it is at link below.
https://drive.google.com/file/d/1LcqTBCJMGGbquk8iUryGx2oAX3XJJqbR/view?usp=sharing
Note that in early 2020 I assumed full cost of a new Permian well was $10 million in 2020 US$ and average OPEX over the life of the well was $14.37/bo in 2020 $, the analysis is done in inflation adjusted 2021 US$. Mr Shellman has mentioned that costs have gone up by 35%, so I used a 40% increase for full well cost in 2020 $ ($14 million) and OPEX increases to $17.87/bo in 2020 US$ over the life of the well.
At $71/bo for crude, $24.85/b for NGL and $4/MCF for Nat gas (all prices in 2021 $), the average 2020 Permian well pays out at 36 months. At a nominal annual discount rate of 27% the discounted cash flow is equal to the capital cost of the well where we assume the well is shut in at an output of 20 bopd at 168 months after first flow. Cumulative net revenue in real 2021$ over 168 months is 24.5 million, so a net profit of 10.5 million 2021$, if the capital cost of the well is paid for in cash (no interest payments).
Dennis,
Geologists, geophysicists, climate scientists, and assorted earth scientists do not like to hear anything new or novel. They are stuck in a discipline that can’t do controlled experiments or any experiments in the lab for that matter. This means that they are conservative and reluctant to adopt any new ideas, since nothing can be verified easily. And many of them become earth scientists because they would rather work outdoors than at a computer or in a lab. That’s why they often seem to have a chip on their shoulder, IMO.
Paul
Dennis this isn’t pre 2008. All loans of all types
are collateralized loans. Banks are a lot more balance sheet constrained then most people realize.
There isn’t enough high quality collateral by a wide margin as central banks have bought it all up. And $2 trillion in reverse Repo. Those treasuries can’t be used to financial engineer or rehypothecate collateral to create more loans. More money. Actual money that goes into real economy. Not bank reserves that never leave the FED.
Capital available to real economy over next decade is going to be scarce.
Shale oil is mainly financed through the sell of junk bonds instead of direct bank loans. Oil in the ground isn’t the collateral used to back the loan as in a direct bank loan.
Treasury bonds mainly T-bills are leveraged up in repo markets to create the money to finance shale oil.
Another reason FED only controls FEDs funds rate which is for interbank lending. They don’t control either interest rates for short term T bill or long term bonds. Which there is huge demand for both because banks use these T bills and bonds to financial engineer everything.
Which is also why FED can’t really hike rates to fight inflation without burning the economy down.
In theory FEDs funds rate should be the floor for interest rates. But reality is T bills are under the floor. Yet they will continue hiking rates even though they have historically always cut the FEDs funds rate to keep it under T bills.
There is a obvious problem here and shit will break as they continue hiking rates
HHH,
At current oil prices, there is plenty of cash flow and little need for new debt for oil companies. The oil companies can choose to not produce more oil and keep output flat and send all the cash flow to pay dividends and pay down debt we could even stop exporting oil and reduce tight oil output and save the tight oil for our great grandchildren, we would need to cut tight oil output by about 3000 kb/d or so, for those who believe that is a good idea. I personally think relatively free markets result in a more efficient allocation of resources, though obviously some regulation is needed for markets to function well.
Hi Mike , “I truly don’t understand why you men bother but thanks for trying. ”
Yes , you have a valid question . Why do we even bother ? We do it to see that the BS , inaccurate information and analysis is nipped at the bud and does not go mainstream . Ron has started this blog to get the correct info out to the public . Many here comment to rectify the incorrect conclusions . Hey ” Someone’s gotta play the piano in the brothel ” . 🙂 . Respects .
I understand the concept, but the Degree to which oil declines after peak for the next 10-20 years is clearly the big deal.
Nobody knows what that downslope will look like.
Could be steep, could be mild/gradual – depends on many interrelated variables.
That was the point of my rhetorical question on ‘Cliff”.
Hickory,
Yes it is clear nobody knows how this will play out. Below is a World C plus C scenario where there is no transition to EVs, output declines less steeply than a rapid EV transition and oil prices remain very high, demand decreases due to demand destruction due to high oil prices (perhaps as high as $200/bo in 2021$ by 2040.)
Thanks Dennis.
This is a very relevant chart for those who like to talk about a cliff.
If you compress the time axis (while keeping the data and time all the same), you can make a picture that looks like a cliff.
I see this chart as a global potential of oil output, but the human element is a big wild card that can diminish the potential, of course. Things like war, failed states, depression, protectionism, currency collapse, sanctions and trade tariffs, taxes and mandates, for example.
Hickory,
Yes the chart assumes we muddle along with something like BAU. An asteroid strike or WW3 would change things, as would Great Depression 2. I think all of these are low probability events, but my ability to forecast the future is not very good. It is certain that any scenario of the future will be wrong. Something between the scenario above and the earlier fast EV transition scenario may be in the ballpark.
Chart below is narrower to emphasize the steepness of the drop in output.
The big question to all of these supply concerns raised by Steve and Nate and most observers who recognize that peak oil is upon us, and that
declining supply is the new normal is-
‘what kind of adaptations are you making to survive in a country where oil and all of its derivative products (from petrol to paint)
are gong to be much more expensive or simply less available?’
[I realize that you project a new peak or at least plateau for this decade Dennis, but for practical purposes i consider that we have been and are roughly at peak currently]
Hickory,
Output may not rise much above the previous peak, but much depends on the speed of the transition, a no ev transition scenario could see World C plus C output rise to 88 Mb/d in 2029. I doubt we see this number due to at least a slow transition to EVs, so 85 Mb/d is my best guess in 2028 or so. High oil and natural gas prices may lead to quicker adoption of electric transport, wind, solar, hydro, and nuclear power, as well as an update to the grid with more HVDC transmission. Much to be done and some better government poicy would help, at minimum a carbon fee and dividend plan at the national level, maybe in exchange for further tax cuts and perhaps more leasing of federal lands to oil and natural gas producers.
So Dennis,
In essence you are basically saying any decrease in oil production in the future will come from a decrease in demand otherwise known as ‘peak oil demand’ due to the transition to EVs. Is that correct ?
Iron Mike,
No that is not what I intended to say. Sorry for being unclear.
With no transition to EVs, oil supply will be the constraint and oil prices will rise to a high enough level that some consumers will be priced out of the market. At that point the quantity consumed will be equal to the quantity supplied (as must be true in general). In the no transition scenario, supply falls because of oil resource constraints, oil prices rise enough to destroy enough demand that the oil market remains in balance.
Dennis,
Thanks for clearing that up. So basically if i understood you correctly, your view is:
Either EV transition occurs which will naturally drop oil demand;
Or we need to experience extended periods of recession to curb oil demand as supply constraints kick in due to geological factors.
Would that be correct?
Iron Mike,
I didn’t mean to imply that there would be a recession, but I can see how one would come to that conclusion, especially if they think the only alternative for current levels of oil use is a transition to EVs, which I tend to focus on.
What else could be done to reduce the use of oil?
1. More efficient and smaller ICEVs
2. Hybrid Vehicles
3. Better urban and suburban planning so more walking and biking can be used in place of vehicle use.
4. Car pools
5. More use of public transportation
6. Other stuff I haven’t considered
Oil demand destruction does not necessarily imply a recession, if oil is used more efficiently in combination with substitution of other means of transport.
In short, oil demand destruction does not equal recession.
Also I think it is unlikely that there will be no EV transition, the main question is how quickly it occurs. The higher the price of oil, the higher the demand will be for EVs and the more quickly that auto makers will move to the production of EVs.
Higher oil prices=faster transition to EVs and plugin hybrids and smaller more efficient ICEV as well as greater use of any mode of transport that uses less oil.
Dennis,
There is some points you and I will disagree on here.
You think with the growth economic system where you need more consumers (the west is importing them from 3rd world), there will be a decrease in oil consumption ? I disagree with you, as long as human population is increasing (regardless of the decreasing rate) and the standard of living is maintained or increasing for the poorer people of the world oil consumption will be maintained or increase depending on supply.
I agree with carpooling this can reduce oil consumption but how much is the question, and I don’t know. Also more efficient ICEVs could lead to Jevons paradox situation so I am not entirely confident on that either.
More efficient public transport is crucial. But this would apply to newly built cities. I mean established cities would seldom fork out billions of dollars to change their public transport infrastructure. So again i am skeptical on how much impact this will have.
The only known event to have immediate and efficient demand destruction of oil consumption are recessions. This is a observable fact historically speaking.
And i also disagree with your hypothesis that higher oil prices lead to quicker transition to EVs. That is not true at all. The price of metals required for battery production are up with oil. Your premise would only be true if oil is the only commodity that is exhibiting high prices while the prices of metals are down. Which is definitely not the case at present.
I’d like to point out that high energy pricing can be one cause of economic contraction but many other causes exist, such as war and pandemic and financial policy choices.
Some of these causes will cut into oil demand more than others.
It looks to me like we run a very high risk of oil demand destruction in this decade and next due to recession/depression, whether from unaffordable energy and/or from the other causes.
EV replacement of ICE will have a smaller role in this.
For a long time, in the absence of economic contraction, any demand destruction due to EV adoption in certain regions will be offset by increased oil demand in many other places in the world.
Iron Mike,
I agree that we see things differently, the future remains unknown, this will always be the case in my opinion.
On your last point, historically new technologies tend to become cheaper as they scale up, this is likely to be true for EVs so costs for EVs are likely to fall.
In the US gasoline currently costs about $5/gallon, a typical US midsize vehicle gets 30 miles per gallon, a cost of about 16.7 cents per mile. A Tesla model 3 goes about 4 miles on a kWh at a cost of about 13 cents per kWhr, so about 3.25 cents per mile.
Over a 150,000 mile life of the car the difference in cost is about 20,000 dollars. Currently the cost of a Chevy Bolt is about 32k. Model 3 is about 47 k.
High prices for lithium are likey to lead to higher supply and this may bring prices down.
People can also drive less and will tend to do so if prices of fuel remain high.
Chart of per capita crude plus condensate output, with projection after 2021 using UN population projection and my model for World crude. Potentially there could be a major depression after 2030, much will depend o the speed of the transition to alternatives to oil and/or greater efficiency.
Also see
https://en.wikipedia.org/wiki/Jevons_paradox
The effect only occurs for oil if the price of oil falls, which might not occur if supply falls as fast as demand falls.
Srsrocco
Thanks. I agree that the EIA outlook in the last chart looks pretty grim. However, there is this Reuters report that says Saudi Arabia is set for oil output capacity above 13 million barrels per day by 2027. Also Iraq will add a another one million barrels per day by 2027,
“MANAMA, May 16 (Reuters) – Saudi Arabia is on track to lift oil production capacity by more than 1 million barrels per day to over 13 million barrels bpd by the end of 2026 or start of 2027, the energy minister said on Monday.”
This may delay the peak, if they both can increase production.
https://www.reuters.com/world/middle-east/saudi-arabia-track-hit-oil-output-over-13-mln-bpd-by-2027-says-minister-2022-05-16/
Ovi,
Yes, I have seen the “Supposed” increase in Saudi and Iraq oil production in the next five years. However, even if we add this amount, what would the total be compared to the peak in Nov 2018? How much of an increase?
Would that push the total back above 101 mbd of total petroleum liquids? Maybe 102-103 mbd? So, from 2018 to 2027, we may see a net increase of 1-2 mbd of global oil production when we enjoyed nearly 13 mbd increase from 2008-2018??
Do you see what I am getting at here? This plateau in global oil production is not good for the Highly Leveraged Debt-Based Financial System.
steve
Steve , ” “The greatest shortcoming of the human race is our inability to understand the exponential function.” Dr Albert Barlett ‘
Here many forget the Liebig’s law of the minimum and Jeevan’s paradox . The end of growth is the beginning of collapse . Preaching to the choir ?
HOLE,
Indeed.
steve
The late Matthew Simmons already in 2007 called for a “Marshall Plan” for oil, and this is what we are seeing. He also said we should do a Manhattan project for alternative energy and throw very wide nets… It is scary to watch some of his older interviews just before the GFC, because they show why things are the way things are today.
The US Shale was the last hurrah of “The Oil Age”. One paraphrased quote I like from him is “Of course you pump more than never before when you are at the peak, but then comes the slope on the other side”. He even mentioned how expensive fracking was and that it would be a short lived phenomenon.
Also the graph above somewhere with the depletion rates using credit is exactly why they released the credit tsunami.
Well no help today from the $Billions invested in the UK, France and Germany. 106,000 MW installed, current production 2:00pm EDST ABOUT 7 MW of wind power Pure insanity.
Ervin , copy paste . “It all sounds a bit like having to pay to keep a taxi running outside your house to cover for when your car won’t start. ” LOL .
Follow up . “Except the car frequently won’t start. Get rid of the car. ” . 😉
For Germany. agora-energiewende.de For the UK and France. gridwatch.templar.co.uk
I just googled for the installed wind energy capacity.
Ervin , this website gives daily info on gas storage in the EU .
https://agsi.gie.eu/
Earth to Ervin…come in Ervin…newsflash 2022…
wind energy is variable….UK oil production peaked in the last century…UK gas production peaked 20 years ago…
its not very sunny in the UK…nuclear power plants are very expensive and take a long time to build…no one promised you that peak energy was going to be some sort of picnic…do you copy?
Hickory
I don’t disagree with anything your saying, BUT my post was at the end of five days where those three countries never got to 10% production of the installed capacity.
One of the concepts I remember from my college classes was in Systems Engineering. Every system has to have energy added to keep it functioning. The “energy” for all of those wind turbines I would say are the government subsidies and the first inline rule. Without that they would never have been built. That is not a solution to provide a modern society with power. Building a system to first and foremost is to reduce carbon dioxide is a recipe for disaster
Ervin , correct . Folks should read David Korowitz ” For something to work all time it should work every time and everywhere . ” Not difficult to understand .
Ervin,
if the UK pretends that there is not a massive wind energy resource offshore,
where do you suggest that the UK gets it energy from?
I suggest that we all will have to come to be thankful for what energy we do have available, even if all the various sources have big shortfalls.
The problem with the U.K. electric power system is too much politics and not enough engineering. Just build the most reliable, cleanest and least expensive system with absolutely no thought to carbon dioxide.
“build the most reliable, cleanest and least expensive system”
That recipe will likely result in the same product choices.
Perhaps coal would be a bigger part of the mix for a decade or two, but that depends on the cost of local production and the state of the combustion facilities.
How To Kill The U.S. Golden Shale Oil Production Goose?
Hit the U.S. Oil Industry with a WINDFALL PROFIT TAX… LOL.
U.S. Economic Officials Says Biden Considering Oil & Tax Windfall Tax
A White House economic advisor told a panel on Thursday that the Biden administration is now considering the U.S. congressional proposal that would place a windfall tax on oil and gas as prices at the pumps continue to soar, Reuters reports.
“We are very much open to any proposal that would provide relief to consumers at the pump,” National Economic Council deputy director Bharat Ramamurti told a Roosevelt Institute panel, as cited by Reuters.
https://oilprice.com/Latest-Energy-News/World-News/US-Economic-Officials-Says-Biden-Considering-Oil-Tax-Windfall-Tax.html
————————————
If the U.S. Govt gets it’s wish on passing a Windfall profit tax on the Oil & Gas Industry, this should do wonders for oil companies’ share prices and future upstream CAPEX expenditures.
Welcome to the ENERGY CLIFF.
steve
Steve
I haven’t heard this yet in Canada. Once it gets more visibility in the US it will spill across the border. Where was the US govt when these companies were losing billions?
In Canada they are now putting a surcharge on banks that earn more than a Billion. Sounds great but every working person’s RSP (Similar to 401k) is 33% populated with Cdn bank stocks. Most people didn’t realize that there RSP were going to be hit but they voted the Libs in.
I figure the next sector to be hit will be oil industry. They will probably call it a WFT and say they will invest in solar and wind. The Wind will be coming out of the capitol.
Ovi,
Agreed. But, the U.S. Govt doesn’t get the credit for being the first to go after those NASTY OIL COMPANIES. It seems as if the U.K. won the FIRST PLACE AWARD last week with a stunning 25% tax.
UK Hits Oil & Gas Companies With 25% Windfall Tax
The UK Chancellor of the Exchequer, Rishi Sunak announced on Thursday a windfall tax of 25% for oil and gas companies.
25% Energy Profits Levy may slow down investments in North Sea oil.
The “windfall tax” is temporary and will be phased out when oil and gas prices return to historically more normal levels.
https://oilprice.com/Energy/Energy-General/UK-Hits-Oil-Gas-Companies-With-25-Windfall-Tax.html
—————————————-
The U.K. will PHASE OUT the Windfall Energy Tax when prices go back to more normal levels. Never gonna happen… LOL.
GOD HATH A SENSE OF HUMOR.
steve
The absolute dumbest tax in the world if you are wanting more supply rather than less. Leave it to the politicians to make the wrong decisions and the absolute wrong time. Reminds me of my past PE Partners.
LTO SURVIVOR,
Agreed… go figure. And, you should see what the U.S. Govt plans with the Strategic Petroleum Reserve by 2028 and then 2032. Besides the LUNACY of selling 180 million barrels from the SPR by the Whitehouse to help with what they label as “PUTIN’S OIL INFLATION,” they will continue to draw down to 400 million barrels over the next 6 years.
All of these future SPR withdrawals are based on PAST LEGISLATION… LOL
Check the chart below.
As they say about most politicians… STUPID IS… STUPID DOES. You can’t make this SHYTE up.
https://www.eia.gov/todayinenergy/detail.php?id=50476
steve
Total lunacy
How many days left?
Steve, the chart you posted doesn’t even reflect the approximately 5 million BO per week we are drawing from the SPR now.
Pretty wild we are drawing so much from the SPR and still having commercial stock draws most weeks.
It’s why Biden is going to KSA hat in hand. Just wonder if they and their fellow Gulf producers can really ramp up that much?
@Shallow
The real fun starts when China gives up on Covid paranoia. They hamper internal travel by a lot (every truck driver has to do a lot of COVID tests crossing a district border), not only in the lockdown regions.
The gulf states can show now what’s their real capacity.
On SPR,
We have about 526 million barrels of crude in SPR and import about 6.4 million barrels per day (and we export about 3.3 million barrels per day of tight oil) so we have 82 days of supply, and if we look at net imports (around 3.1 Mb/d) we would have about 170 days of supply.
Looking at all stocks of crude and products in the US there was 1681 million barrels as of May 27 with product supplied of 19.5 Mb/d, that is about 86 days of supply.
A final way of looking at crude stock levels is that total crude stocks on May 27 were 941 million barrels. Crude input to refineries in the US is about 16 million barrels per day while US output is about 11.6 Mb/d and about 3.7 Mb/d of crude was exported in the past 4 weeks, the rest goes to refineries (7.9 Mb/d), so a net of 8.1 Mb/d would be needed from crude imports, if we assume instead all of this came from the existing stocks we would have 116 days of supply.
LTO Survivor,
There are some who think we should ban exports of crude oil, I think that is a bad idea as my understanding is that we do not have refining capacity well suited to handle 7 Mb/d of tight oil output. What are your thoughts? Do you think a ban on US exports of crude would be a good idea?
Steve,
That will never get passed in the US Senate. Nor should it in my opinion.
Dennis , my guess . He may not ban the export of crude oil but how about banning the export of diesel because that is what is hurting the max to the public in USA . Europe is then FUBAR with the sanctions on Russian Urals . What a web we mortals weave ? Trapped .
P. S : Putin does not have to win votes .
Hole in head,
It is not clear where the authority lies in banning exports, it may require a law to be passed, I am not really sure. Only about 1 Mb/d of diesel net exports from US. US has stocks of about 28 days for diesel consumption, but only about 2 days of stocks of finished gasoline stocks, although there are 25 days of consumption of motor gasoline blending components stocks. Chart with US distillate stocks at link below.
https://www.eia.gov/dnav/pet/hist/LeafHandler.ashx?n=PET&s=MDISTUS1&f=M
Tks Dennis . I thought that the US exported a lot of diesel to EU . My wrong .
Hey Ovi , belated but terrific post . Better late than ever . Thou are groot ( great ) .
HIH
Thanks
One forecast-
“Oil demand from passenger cars, two-wheelers, three-wheelers, and buses has already peaked,” the report said. “Commercial vehicles are now the only segment contributing to growth.”
” The displacement of oil as a road fuel will accelerate through 2025 as the uptake of electric vehicles ramps up, according to a new report. Electric passenger car numbers are seen surging to 77 million over the next four years, according to BloombergNEF’s latest outlook on the sector, up from about 20 million now. That almost four-fold increase will push the amount of oil that EVs curb from transport use as high as 2.5 million barrels a day by 2025, up from about 1.5 million barrels a day now.
Much replacement will be going from passenger cars to using the bus – by cars not affordable anymore to a spectrum of people. Inflation will do this to many people.
Many young people here, especially the green educated town youth, are anti-car. Most of them can’t afford one anyway without the help of the parents – so it’s a kind of sugarcoating it.
A big problem here are flexible work times. I know in the 80s, where office was from 7:30 to 4 pm, car pooling was normal to share the costs.
More important perhaps, the car industry has radically scaled back R&D in new combustion engines. They are betting the house on EVs. For better or worse, the next generation of vehicles is going to be partially or completely electrified.
It takes years and billions of dollars to develop a new model, or a new engine. There isn’t much sense in debating whether EVs are coming or not. The decision has already been made. We just have to wait and see how it plays out.
Updated info on global ev deployment and oil/ICE displacement-
Electric Vehicle Outlook 2022- BNEF
A few random statements from the executive summary-
“EVs of all types are displacing 1.5 million barrels per day of oil usage, equivalent to about 3% of total road fuel demand.”
“The rising cost of batteries does not derail near-term EV adoption. Some of the factors that are driving high battery raw material costs – war, inflation, trade friction – are also pushing the price of gasoline and diesel to record highs, which is driving more consumer interest in EVs. Internal combustion engine vehicles are also becoming more expensive to produce [and operate].”
“China and Europe account for almost 80% of EV sales in 2025, with adoption running much slower elsewhere. The U.S. market starts to pick up from 2023 but still only represents 15% of the global EV market in 2025.”
“The acceleration in EV adoption means that combustion vehicle sales peaked globally in 2017 and are now in permanent decline. By 2025 passenger ICE sales are 19% below their 2017 peak. Managing the decline while investing in the future is a major challenge for some legacy automakers.”
https://about.bnef.com/electric-vehicle-outlook/
Hickory I don’t really understand the excitement of EVs taking over the passenger market when we will surely suffer black outs this summer due to an under supplied electric grid in the United States. Aside from peak oil we also will suffer from an lack of infrastructure to supply the necessary electric power to run homes, factories, computers, bitcoin mines and now electric cars. We should have been building nuclear plants since the 1970’s. There is no magic bullet yet available to defeat the diminishing scarce resources being used by the global population.
While I sincerely hope through ingenuity and brilliant minds we will solve for an energy future reducing dependence on fossil fuels, we are not there yet.
That’s why I say the necessary transition will take 30 years, not 10 years. And there will be a lot of hiccups during the process.
Here in Europe France has huge problems with electricity at the moment, despite having lot’s of nukes.
In fact they are the problem. They build them in the 70s and 80s, and then reduced the nuclear industry and investment to almost nothing.
… and now they are end of life all the same time, having longer and longer maintainance and break downs. That’s how you shouldn’t do things. And in Germany we have 4 professorships for nuclear technology, and almost 200 for gender related science. So no nuclear here.
There are already startups how to build lot’s of nukes new – by going to a middle size and producing them industrial in a factory. The current technology from the 70s, welding them together at the building site is kind of stone age of production.
Agree with you there that the energy transition is going to take a lot of time and also effort.
When even the Chinese now say that they are going to “reduce their coal reliance” from 2026; we are probably on a plateau for energy generation. There is some toggle room for big investment efforts into electric cars and solar/wind (especially offshore wind) for some time to come, and it is sorely needed in order to scale up mining for battery metals and the renewables infrastructure more broadly.
After the offshore wind industry and electric car manufacturing is scaled up in the 2025-2030 time frame, I suspect the question will be more how much focus and sacrifice will be needed to hold up production levels and source enough resources to keep the transition going. It will be an unsteady ride where no sacrifice, quite a bit sacrifice, painful sacrifice and war economy are all possibilities along the road. The goal is a transition that only gives a limited damage to living standards over a long time period, but that requires everything to go very smoothly and some more; not very likely unfortunately.
When I claimed that “we are probably on a plateau for energy generation”: The current high price environment for not only oil, but all fossil fuels, essential metals and other minerals will help maintain such a plateau if it stays like this long enough to influence investment decisions. How to solve the resulting increasing inflation and to serve the debt, I don’t know. But in the long run, I am pretty sure the goal is to have monetary stability and low interest rates. There is no other way to attract the large long term investments needed.
Kolbeinh , “Agree with you there that the energy transition is going to take a lot of time and also effort.”
Sorry boss , we have run out of time . Read the report prepared by Bob Hirsch . He stated it takes 20 years to transition from one energy source to another . Condition is that both energy resources must be available during the transition . From personal experience when my firm transitioned from
manual bookkeeping to computers , the computer company asked me to keep both manual and computerized systems ticking for 18 months to avoid a problem . There is no NETT surplus energy available to do this transition . We have run out of road .
HIH,
The problem with your view is that a resource war escalation leads to war. Listen to H. Kissinger, de-escalation is possible. I align here with what D. Coyne said (once again); within 5 years it is the most probable (de-escalation).
Kolbeinih , incorrect . Have I mentioned war in my comment ? The key is time and NETT surplus energy to affect the transition . You misunderstand me .
Spot on, as usual, HiH
For the first time we are being warned about electricity supply disruptions in the even of a heat wave.
Wouldn’t that be ironic. We shut in for a month in 2020 because of a negative oil price. We may end up shut in at $100 oil because of no electricity.
I will someday write a book. What a crazy ride.
Shallow sand,
I would think you have time of use electricity rates and would run your pumps during off peak hours. that is what most people do with their EVs, they charge during off peak hours when demand and prices are low.
Dennis.
We primarily operate waterfloods. 95%+ of our pump jacks run 24/7/365. Most of our injection pumps also run 24/7/365. We do have some smaller leases where the injection pumps run intermittently.
We produce around 100 BW for every BO.
We did suffer some production loss when we shut in late April, early May, 2020. Thankfully not as much as we feared. But you don’t want to stop that push.
For example, we recently plugged four production wells and two injection wells for the equipment. The wells were making less than 1 BOPD and about 100 BWPD, and were uneconomic. The equipment we salvaged is worth over $100k given the wild inflation we are experiencing now. Some of it has already been put to use. Four strings of 2 3/8” steel, two strings of 2 3/8” lined pipe, four strings of rods, four down hole pumps, two steel stock tanks, one fiberglass water tank, one fiberglass separator, one hydra cell injection pump, four pump jacks. Etc.
Unfortunately, the wells offset another lease we are still operating, 6 wells producing 4 BOPD and about 300 BWPD. At least it was. Now down to 3 BOPD and about 250 BWPD. So maybe we made a mistake plugging those wells? We did try to examine this, but it’s tough to know where that injected water is going.
I wish every well we had was on a time clock making less than one BW for every BO. We have a few of those and we compete with KSA on LOE on those wells.
We have a one well lease which makes 2.5 BO and less than .5 BW per day. LOE on it in 2021 was less than $5 per BO.
After labor, our largest expense is electricity, and those prices have shot up dramatically. 52% over 2020.
Thanks shallow sand,
I remembered you saying at some point that some pumps were on a timer and got pumped intermittently, for some reason I got the impression all of your wells were like that.
Can you recycle the water so that the produced water is simply reinjected to provide the waterflood or is that more costly or perhps not allowed?
All of the produced water is re-injected.
We actually do not utilize many water supply wells (wells that make no oil, just water).
Thus, over time our produced water rates slowly decline and our oil production does as well.
Thankfully the decline rate is very low. We used to offset it with infill drilling. We still have many locations left, we just need to commit to drilling more wells at some point. The volatility of oil prices, labor and materials makes that a challenge.
Anecdotally, rig rate for a 1,000’ or less tubing job in 2019-2020 was $600-700. We just paid for two this week, $1,170 for one and $1,300 for the other.
The tubing test bills in 2019-2020 ran around $180 per well for 1,000’ or less of 2 3/8”. The bills for these two wells were each over $300.
Even very high oil prices cost us more, as pumpers were spending $700-800 per month on truck and four wheeler gasoline and are now spending almost double that amount.
Our chemical price went up 8% at the beginning of the year, which we thought wasn’t bad. Wonder if that will be raised again?
Did find some used tested 2 3/8” tubing for $6.74 per foot. Better than $9.02 per foot for new, I guess?
Thanks Shallow sand,
Interesting stuff. What did you get for a barrel of oil last month? Maybe $95/b and probably about $55/bo a year earlier. Total expenses (including labor) by maybe 40%? At least your gross revenue is up almost 100% and nearly 200% from May 2020.
SS , tks . This is illuminating . 100 BOWPD to get 1 BOPD . From where I come a quote ” The pajama string is costlier than the pajama . ” 🙂
HIH.
It only works because the wells are vertical, very shallow, close together and water is easily disposed of at low pressure. Also water is not very corrosive and decline rates are very low.
Mike kicks our butts when it comes to LOE. You’d have to ask him why. He has one heck of a group of leases with possibly the best produced water I have ever seen.
SS
Mind blowing numbers 1 BOE for 100 BOW.
Where does the water come from. Is it purified city water or from a river or lake. How long will the water supply last. What is the delivered cost per barrel to your wells.
Do you use chemicals or solvent as part of your water flood.
Ovi.
1 BO, we do not produce gas. Gravity is mostly between 30-36, a few leases in the high 20’s, light sweet crude, get a pretty good price in relation to WTI. So little gas that wells cannot burn a flare. Most wells have no detectable methane emissions using a FLIR camera.
All water is produced. Majority from oil wells, a little bit from WSW that are in a slightly deeper zone.
LOE plus maintenance CAPEX field-wide was running $35-40 per BO, (we are checkbook operators). But by lease expense varies quite a bit more than that. Having a hard time getting a handle on 2022 LOE as costs of everything constantly changing.
Most wells are circulated with corrosion inhibitor one gallon every two weeks.
Field will be 117 years old in August. Primary producing formation is 850-1,100’.
SS
Thanks.
LTO: Profound & well said.
LTO Survivor-
“There is no magic bullet yet available to defeat the diminishing scarce resources being used by the global population”
This is one thing we can both absolutely agree about.
To your question [rephrased]- Why are many people, and just about the entire automobile industry, ‘excited’ about the electric vehicles?
Several reasons
-people know that oil is in global depletion mode, with rising petrol prices to be the trend
-cost per mile for electric car is much less than for gasoline, even at $2.50/gallon
-in the long term people and cargo will still be able get around with EV’s
-in many parts of world (and most of the USA) people can generate enough energy from solar on the roof to drive 10-20,000 miles. That prospect gives people a strong sense of security and freedom.
-and here is the big one….it sure as hell beats the alternative!
As to the challenges on a transition from ICE to EV…yes they are massive.
Huge investment and deployment in
-the grid and electric production/storage facilities
-battery mineral supply chain and manufacturing
-vehicle charging infrastructure
Will the job of transition get done?, and will transport look like it does now?
I don’t think so…not completely.
We are late to the effort, with a very limp and confused stance- most people don’t even understand the imperative or the possibilities. Sleep walking into an energy emergency.
And there may just not be enough funding and materials available to get the job completely done even if the global intention was on target.
Some regions will get it right much more likely than others. Being late to the game runs the risk of guaranteed failure or heavy under-performance.
I think that on average the global person will have to get used to less mobility than now.
Which is not the end of the world folks.
I am now going to ruffle some feathers . I had earlier posted that all EV manufacturers are nothing but frauds ( evidence also posted , but can repeat if needed) starting from Rivian ( no 2 in the EV industry ) . Tesla will be the next NetFlix . The countdown begins now .
https://www.bloomberg.com/news/articles/2022-06-03/tesla-pauses-hiring-musk-says-need-to-cut-staff-by-10-reuters-l3y4nb36
Hole in head,
The entire auto industry is moving to EVs. I suppose you will claim they are all frauds.
Tesla is overpriced for sure and Mr Musk is losing his cool in my opinion which will only be bad for the brand. The stock would be a poor choice. I would consider Ford instead. But if you think folks won’t be moving to a technology that is 4-5 times as efficient as energy becomes costly, I’m afraid I don’t understand your logic.
Dennis my comment is pointed to the pure EV manufacturers like Rivian , Nikola , Lordstown , Canoo , Electric last mile and several others . The legacy manufacturers will survive because they will continue to make profits on their ICE models , however if and when they become 100% EV they will all start loosing money .
Hole in head,
I think you are incorrect, time will tell. It won’t be long before there is very little demand for ICEVs. Most major manufacturers plan to increase EV output as fast as possible. You won’t find a lot of EVs sitting in dealer lots, they get sold before they arrive on the lot.
The major luxury car manufacturers can’t sell their ICEVs, the market has been taken over by Tesla, soon they may regain market share, if they can ramp up production of EVs.
Dennis, some have another POV .
ERVIN
IGNORED
06/04/2022 at 4:49 pm
And of course all of the required metals will be available in great quantities at low prices to make all of the EVs. Dream On !?!?!
Hole in head,
Just a matter of opening up more mines to produce the needed materials. Price increases because available supply is less than demand at the current price, high price leads to high profits, more investment, higher supply, and lower prices. This is Econ 101.
Lot’s of electric Porsches, BMWs and Audis seen here, too. The luxury labels are holding their markets. Much more Bling in an electric Mercedes than in a Tesla.
I think we will have several car brands in the future, as in the current. Tesla will be one of them. And it’s just the beginning – short range and town delivery trucking will transition to sodium batteries once CATL has finished their ramping up. No more raw material limitation then on the low end.
@HIH Why do you think Musk adjusting the Tesla managerial headcount by 10 percent when he sees the economy slowing for the next couple of years portend them becoming the next Netflix? They have no debt, are producing hundreds of thousands of very in demand EVs in a very efficient manner. The have two new massive factories coming online right now. All that makes me wonder what your logic is? I responded to your “fraud” post also. But never saw a reply.
Songster , I am not saying Tesla will go out of business . Netflix is still in business . My reference was in regards to it’s share price and Stephen Hiren has clarified the issue . There are questions about Tesla’s balance sheet that are unanswered ( just like that were of Enron and Madoff ) . As to Tesla being debt free ,the debt is on the balance sheet of Space X and Solar whatsoever which are financed via Tesla shares as collateral , just as his twitter purchase will be against the value of the shares of Tesla he can provide as collateral . They call it financial engineering now a days . Used to be called Ponzi ” when men were not transitioning to woman and vice versa “. 🙂
Leveraged positions are always constantly having to be rolled over. As the dealers become more risk adverse they will demand only the best collateral or T bills.
A lot of leveraged players are going to get blown out their positions soon. Watch yields on T bills go negative as there is a mad rush for collateral. Trigger being FED’s QT that actually begins 15th of this month as securities start rolling off the balance sheet .
There are a whole lot of leveraged players in oil futures markets that will over next few months get blown out their positions due to lack of collateral.
Songster , job cuts ?? Only Musk knows what he is doing .
https://www.businessinsider.com/tesla-headcount-will-increase-musk-email-staff-about-job-cuts-2022-6?r=US&IR=T
Fuel saving by decreasing from 80 mph to 60 mph = 27%
“Note: The study of 74 light-duty vehicles included two-seaters, sedans, station wagons, sport utility vehicles, pickup trucks, and minivans for model years ranging from 2003 to 2012 with a wide variety of powertrains (e.g., 4-, 6- and 8-cylinder engines and transmissions with 4, 5, 6 and 7 speeds and continuously variable transmissions). Both 2- and 4-wheel drives were included. Slow Down to Save Fuel: Fuel Economy Decreases About 27% When Traveling at 80 mph Versus 60 mph”
US Dept of Energy- https://www.fueleconomy.gov/feg/driveHabits.jsp
Slowing down is a very simple and effective way of saving fuel. I do it all the time but I’ve noticed that no-one else does, reagrdless of how much fuel costs. Entrenched driving habits are very tough to change.
How to save 100% of jet fuel energy…
Don’t fly.
Sounds obvious and simplistic.
It is.
Air ambulance is perhaps a reasonable exemption.
How high will ticket prices have to be before people will stop taking optional (almost 100%) flights?
It’s funny seeing the brainlets complaining about fuel costs as they drive massive SUVs at 80 on the motorway. Absolutely no sympathy for them, frankly. But, oh, our way of life isn’t negotiable or something.
Kleiber , ” the lifestyle is not negotiable until there will be nothing left to negotiate ” . Best of luck .
They are sadly mistaken if they think this is a negotiation.
Something Crazy in Happening in the Oil Market over the last Few Days
The settled price for WTI posted on June 1 in the chart above $115.26/b. Today it settled at $118.87/b. In after hours trading it has crossed $120/b to $120.29/b at 16:30 EST.
Any guesses?
Low inventories? All are running below five year averages by a long shot. Don’t know for sure Ovi but your guess of $110 average for WTI this year is looking spot on, if memory serves.
https://oilprice.com/Energy/Energy-General/A-Week-Of-Turmoil-For-Oil-Markets.html
Stephen.
If I remember correctly, Ovi predicted $100 averrage WTI price for 2022 — I predicted $90. Right now it looks like Ovi is winning this bet!
Stephen/Frugal
Your memory is better than mine since I don’t remember. I’ll take your word for the bet. Just lucky
Both good guesses as oil was around $65-70 at the start of the year!
High gas prices are alrasdy having an effect on comsumption but not as much as you’d expect.
Gas prices are skyrocketing. Here’s why people haven’t cut back on spending – yet
In the week ending this past Saturday, there was a 5% decline in the amount of gas pumped at US gas stations compared to the same week a year ago, according to OPIS, which tracks gasoline prices and consumption data. That modest decrease happened as the national average price rose from $3.04 a gallon on May 29, 2021 to $4.60 a gallon on May 28 this year, according to the OPIS data released by AAA.
GM to cut prices on EV Chevrolet Bolt up to 18 percent
June 1 (Reuters) – General Motors Co (GM.N) on Wednesday said it will sharply cut prices on its electric Chevrolet Bolt after the Detroit automaker had halted sales for six months following a battery recall.
GM is cutting prices on the Bolt by around $6,000 and by as much as 18% for the lowest-price version, which will start at $26,595, down from $32,495. The Bolt EUV will start at $28,195 down from $35,695.
“This change reflects our ongoing desire to make sure Bolt EV/EUV are competitive in the marketplace,” GM said in a statement, adding “affordability has always been a priority for these vehicles.”
Note there are two versions. Bolt EV and Bolt EUV. The EUV is longer and a bit higher.
https://www.reuters.com/business/autos-transportation/gm-cut-prices-ev-chevrolet-bolt-up-18-percent-2022-06-01/
Just don’t park it in a garage lest it go all arsonist on you.
But all the cool Teslas do that, so GM is only aping the industry leader.
Ovi , they have pent up demand but they are cutting prices . ??? OPEC + is stupid . They are hiking prices because of pent up demand . 🙂 . Whom tp believe . ??
https://www.autodealertodaymagazine.com/367921/gm-looks-to-pricing-power-and-pent-up-demand-to-keep-profits-high
Not a lot of demand for the Bolt.
GM just lost its EV subsidy and the reputation for the Bolt is in the dumpster. A new wave of EVs from GM based on their new Ultium battery technology is about 1-2 years away. Part of the problem here is the idiotic nature of the EV subsidy which manages to punish early entrants into the field such as Tesla, GM, and later this year Nissan by capping the subsidy at 200K vehicles.
“ battery electric vehicles have just a .03% chance of igniting, compared to internal combustion engine vehicle’s 1.5% chance. Hybrid electrics, which have both a high voltage battery and an internal combustion engine, have a 3.4% likelihood of vehicle fires according to their study”
https://www.cnbc.com/amp/2022/01/29/electric-vehicle-fires-are-rare-but-hard-to-fight-heres-why.html
Stephen this must be a pretty poor study. At 3.5% you would be hearing a lot of fire trucks in your neighborhood. 3.5 homes out 100 with cars catching fire in the garage would be a total disaster.
Not true
There will be a massive wave of EV supply coming online in the 2025-27 timeframe. Supply should hopefully catch up with demand by that point and prices will drop substantially with models available in the $20-30K range
https://electrek.co/2022/06/01/electric-car-price-war-coming-ford-ceo/amp/
And of course all of the required metals will be available in great quantities at low prices to make all of the EVs. Dream On !?!?!
Dennis
The problem with the Bolt is that it a Chevy for the working class that has no bragging rights.
Car sales crashing just as Brendt said .
https://www.zerohedge.com/markets/auto-armageddon-may-sales-data-shows-dramatic-slowdown-us-new-car-sales
https://auto.hindustantimes.com/auto/news/car-sales-crash-in-world-s-largest-automobile-market-and-why-that-s-a-big-worry-41652178176487.html
USA and China . EU also down by 20% . Affordability .
Hole in head,
Plugin vehicle sales are up in US
https://www.greencarreports.com/news/1135731_us-plug-in-vehicle-sales-hit-record-high-q1-tesla-and-california
Maybe people are waiting for more EVs and plugins to be available.
At current fuel prices a new ICEV is no longer a smart choice.
Ovi,
I think it is more than that, mostly they haven’t produced many and there are other options that are more compelling from Hyundai and Ford.
Hyundai Kona EV has MSRP of 34000 with Fed tax credit of 7500, so net price is $26500. Bolt is no longer eligible for Fed Tax credit, so price drop is to compete with Hyundai Kona.
Great perspective here for everyone from those with deep knowledge, to our friends and family who need a primer on what is happening. We will need to pull out all the stops to keep too many people from starving.
https://www.youtube.com/watch?v=hnT-PYHaSxA
The Dual Challenge: Energy and Environment | Scott Tinker | TEDxUTAustin
The world faces two important and interrelated challenges. Affordable and reliable energy for all, and protecting the environment
I read one source a few days ago that said OPEC crude oil production increased by about 260 Kbp/d in May. How can they produce more and export considerably less?
3 reasons high oil prices are here to stay Bold mine.
The Organization of the Petroleum Exporting Countries and its allies, a group known as OPEC+, agreed on Thursday to pump an additional 648,000 barrels of crude a day into the global market in July and August — 200,000 more than planned — in a deal that included Russia.
The IEA predicts that global oil production, excluding Russia, should rise by more than 3 million barrels a day for the rest of this year, balancing out the impact of sanctions.
But Smith thinks this could be difficult to achieve. Even before the war in Ukraine, he said, oil producers were winding down investment in production as they pivoted towards renewable energy. And OPEC has its limits.
“OPEC+ is already struggling to keep pace with the current deal — even core OPEC members such as Saudi Arabia, UAE and Kuwait exported considerably less last month than in April,” he said.
Giovanni Staunovo, a strategist at investment bank UBS, said in a Thursday note that “many OPEC+ member states have already hit their capacity limits.”
“That means effective production increases will likely be about half of the target increase,” he said.
I read one source a few days ago that said OPEC crude oil production increased by about 260 Kbp/d in May. How can they produce more and export considerably less?
I think some Middle East countries literally burn oil in their power plants during the summer because of the additional electricity demand caused by using air conditioning.
Touching $ 7.00 per gallon . When do the independent truckers mail in the keys ?
Mistakenly , posted on the other thread . Diesel is king . Locust Grove , VA .
Hole in head,
There is no diesel shortage, just high prices. There are roughly 111,000 petrol station in the US. One station being out of fuel, perhaps due to a missed delivery or a pump not working properly, is not a big deal.
Just for info purposes . Diesel inventory .
“Weekly inventory figures dropped once again for the week ended May 27. They were at 18.8 million barrels, down from 20.4 million barrels just two weeks ago. And when it was at 20.4 million, it was already well below the roughly 38 million barrels at the start of the year in the East Coast area known as PADD 1, an EIA-designated area. “
Hole in head,
See
https://www.eia.gov/dnav/pet/hist/LeafHandler.ashx?n=PET&s=WDISTUS1&f=W
JiE,
The RRC numbers are only reliable for total Texas output about 8 months back from the most recent data. The EIA data is far better.
JIE,
No tight oil output is rising.
https://mishtalk.com/economics/biden-says-pretty-please-to-saudi-arabia-oil-jumps-anyway
Biden seeks Saudi oil boost
Biden will meet with Saudi Arabia in July and OPEC announced a production increase last week. Neither announcement reduced the price of oil.
That’s because anouncing increased production is easy, while actually increasing production is hard and for most OPEC countries impossible.
I will google it, but do we know who President Biden’s oil and gas advisors are? Who do those advisors get information from?
Shallow sand,
I would think his information comes from the EIA.
Bernie Sanders and Maxine Waters
Shallow sand,
See
https://www.energy.gov/person/jennifer-m-granholm
I imagine she is advised on oil and gas by someone at the EIA.
Page below has the biographies of some of the top people at the EIA
https://www.eia.gov/about/senior_executive_bios.php
Organizational chart for EIA
https://www.eia.gov/about/organization_chart.php
Dennis.
Thanks.
On your Permian break even, I reviewed It and don’t have any real criticisms of it, but also state I haven’t kept up on expenses enough to give a solid opinion.
I can barely keep up with what’s going on with our expenses. Just received two down hole pump repair bills totaling $2,200. Would have been $1,200-$1,400 in 2019-2020.
Shallow sand,
Wow, how much have your overall expenses increased? I think you mentioned that it used to be $35 to $40 per barrel, has it gone up to $60/bo? Hopefully you are getting $90/bo and making some money after the lean years of 2015-2021.
Thanks for checking my work, my guesses on OPEX are based on comments Mike S has made over the years, I think LTO Survivor said at some point (maybe in 2019) that the costs were in the ballpark, they are easily changed if anyone has a rough estimate of average OPEX in the Permian basin. Would love to get better information on OPEX from anyone in the know in the Permian basin.
Sorry shallow sand,
I now see that in an earlier comment you said you don’t have a good handle in current LOE due to big fluctuations in cost. I guess we will just assume more than $40/bo.
Shallow sand,
I took a look at Pioneer’s recent 10Q and may have OPEX a little on the low side (assuming Pioneer is representative).
Updated spreadsheet with higher OPEX assumption ($21.27/bo over life of well, and $12.52/boe over life of well) for average 2020 Permian basin tight oil well breakeven analysis.
Well pays out $14 million (2021 $)at 36 months at $76/bo oil at WH, $26.60/b NGL, and $4/Mcf nat gas (prices in 2021 $), annual nominal discount rate for DCF= capital cost is 25%.
https://drive.google.com/file/d/1LMZ8_qsqtRdFkKb-r8nfVtAEt43pE8jk/view?usp=sharing
Up thread I made comments about our wells and readers were surprised at the oil/water ratio.
Maybe also surprised how little oil they make.
I just received an email for an upcoming auction of conventional wells all over the USA. Wyoming, Texas, Oklahoma, Mississippi, and Kansas were the locations. Texas was both Permian Basin and many other locations.
The only wells averaging more than 10 BOPD were some of the Wyoming wells in the Minnelusia, which I think is a deep formation which produces gobs of water. All other wells were below 10 BOPD and most were below 2 BOPD.
Mike Shellman posted a good article on his website written by a Petroleum Engineer who was tasked by a customer to find conventional wells in the lower 48 that were not stripper wells (average of 15 BOPD or more). As I recall, that number was less than 3% of all conventional well in the USA.
If this isn’t a sign of Peak Oil being near, I don’t know what is?
SS, this isn’t a sign of peak oil, it’s a sign of post peak oil. Peak oil was three years ago.
I agree with Shallow sand that the peak may be near, but think it is in the future, the current peak is likely to be surpassed. If 6 years of relatively high prices (over $90/b) don’t result in a new peak in World output, I may change my mind. though if we see a drop in prices due to lack of demand without an obvious recession worldwide, it may simply be that demand has peaked, the dynamics are difficult to guess, too many variables and assumptions needed.
Ron, I think it more likely than not you are correct.
I just don’t know details about horizontal shale possibilities in places such as Russia, South America, Africa and the Middle East, long term.
Ron et al,
what surprises the heck out of me
is that in all of the times I see articles and talk about high gas prices
in the press and on the news and on the street,
I never hear the cause of ‘depletion’ mentioned.
It is always some other temporary, minor, tangential, or outright irrelevant reason that people give.
Seems the people are in bigtime denial of the obvious.
I suppose that for most people, and the culture at large, the reality of it is just too difficult a proposition to acknowledge.
Hickory.
I listen to Bloomberg radio a lot in my pickup truck and watch on TV in the early morning.
I have heard more than one finance person being interviewed claim that the “long term price” for WTI is $70, whatever that means.
First off, the oil price since 2005 has been highly volatile, so no clue how anyone can predict a “long term price.” But, as you say, never discussion about what oil is left to produce/discover. It’s just assumed if companies will only increase CAPEX, the oil is there to be produced in greater quantities.
This is why I asked above about what the DOE uses in the way of info.
I’m very critical of the Ms. Granholm, because I do not get the sense she gets it. But maybe she’s getting terrible information. Her predecessors have seemed even worse.
The Trump Administration and Biden Administration both seemed/seem very clueless to me about these issues.
I know it was politics, but you had either “energy powerhouse” or “ban fracking” in 2020. I just don’t know how one could say either without being extremely ill informed, even if just playing politics.
Biden is going to suffer big losses in the mid-terms because of this. Maybe nothing he could do but gosh, he looks like he has no clue.
One thing is certain-
No politics of any flavor will cure oil depletion.
In fact if we get a leadership that goes for a big push on more and faster drilling then we will just deplete faster than we otherwise will.
The best we could do for domestic US supply is to be very good neighbors with Canada on a longterm basis, and quit exporting. It is a selfish stance, but thats what nations generally do.
I agree.
I don’t know that Biden has actually done much that has slowed US oil production.
I am usually harder on those that I think have more potential because I hope they can be honest, but that’s just not the way politics work. We here are laser focused on this issue, most don’t have a clue.
For example, many think the Bakken is in South Dakota.
Shallow sand and Hickory,
Note that banning exports would not help in the short term, it would actually cause prices to increase for imports because the World oil price will go up because there will be less oil on the market due to 3 Mbpd of tight oil that will be removed from the World market. Long term it might be good policy, except that other nations might follow suit and ban exports just as we have, then we can no longer find oil imports and would be short the 6 Mbpd of crude we currently import, at least until more refinery capacity is built.
Generally with free trade everyone is better off. This is a bedrock principle of free market capitalism that most conservatives agree with, see
https://en.wikipedia.org/wiki/Comparative_advantage
US net imports of crude and petroleum products was 12.5 Mbpd in 2005, now it is close to zero. If we ban exports of crude it will jump to about 3 Mbpd (that is about the amount of tight oil that we export).
It seems you are both in favor of a ban on crude exports. Is that correct? If so, do you think at least Canada and Mexico should be exempt, or at minimum Canada?
Dennis.
I’m not necessarily in favor of a crude export ban IF USA refineries cannot refine it all. But I suspect if the USA could refine all of it, it wouldn’t be exported because it should be cheaper to transport it in the lower 48 than to Asia.
My view on conservation would have been to regulate drilling, which wasn’t done. But that appears to have been politically impossible. Right now even those who wanted to ban fracking upon the 2021 swearing in are now insisting “drill baby drill.”
The reason regulation of drilling will never happen is politically very low fuel prices are a winner. Obama bragged about low fuel prices in 2016 as we were losing money at $25-30 oil early that year. Trump thinks a fair price for WTI is $40. Biden is in big trouble now for high fuel prices despite him having very little control.
My view is that the USA should be realistic about its oil supply and what oil price range is reasonable. But that is probably too socialistic.
I know during previous eras US oil production was more regulated. I think we have better environmental regulation, but we have allowed a lot of waste. In particular, waste of natural gas, which has quadrupled in price. And maybe not so much environmentally, at least in TX given all of the gas flaring.
I definitely get where Mike is coming from regarding an export ban. My solution would have been to not produce the oil till USA refining could handle it, and to incentivize refineries to convert to be able to handle more shale.
But my idea is maybe not doable, I don’t know enough about refining including the economics.
I agree with what Shallow Sand says about the national oil policy.
But a conservative level of production with smart regulation of the resource has never been in the cards.
But we are where we are, and with the resource in depletion mode it is very late to be just beginning the process of ramping up electrification as a gradual offset mechanism.
On Granholm we differ- I rank her understanding of the energy future as excellent. Politics aside.
Shallow sand,
That sounds reasonable. Mike’s position is also reasonable in the sense that a ban would either result in increased refinery capacity for LTO or reduced output of LTO and might conserve resources.
My contention is that before long (next 6 to 10 years) oil demand may start to fall faster than the supply of oil. I think leaving the tight oil in the ground penalizes the oil industry and a lot of the resource may get stranded if oil prices fall below $50/bo (I expect this to occur by 2033 or so). An export ban may sound like a good idea, but it may lead to higher oil prices, shortages of liquid fuel and eventually billions of barrels of tight oil that never gets developed once oil prices fall below $50/bo.
Note that the most recent breakeven spreadsheet (updated higher costs for OPEX of over $20/bo) would have a 60 month payout at $62/bo at wellhead (NGL at 35% pf that price) and NG at $4/Mcf, 36 month payout at $75/bo.
From a climate change perspective an export ban would be good, not sure if that is what Mike S has in mind.
In any case we will see how it plays out, lots of speedbumps/roadblocks ahead no doubt.
Hickory,
Granholm may know energy policy, but I don’t think she knows a ton about the oil industry, or she has never been involved with that industry. I may be wrong as I am not really familiar with her.
Hickory.
When I’m referring to Granholm I am referring to oil and natural gas only.
I know her position involves so much more, but I think most here agree oil and natural gas are still a key part of USA energy.
She didn’t know how much oil the USA consumes per day when asked off the cuff. That leads me to believe she doesn’t know anything specific about US production, midstream or consumption. Is she advising President Biden on such critical matters without even having basic knowledge. Biden is getting hammered on the issue of oil, could be his weakest issue.
I would hope she would have some general facts about US oil and natural gas down cold? I would hope she pays attention to EIA production and consumption data?
Maybe she knows more than I give her credit for about oil and natural gas? I just think this 180 pivot on oil and natural gas production is a sign of basic lack of understanding as to where we are at.
I guess it’s not a winning political strategy to state we need to move away from oil because it isn’t so cheap and abundant anymore, and that if we don’t there will be a day of reckoning.
Sometimes isn’t it just better to be truthful?
Shallow sand,
When someone talks about “long term price” they might be thinking of the centered 3 year average price of WTI as in chart below. My guess for medium term average WTI price is $100/bo up to 2029 and then falling over following 12 years to $30/bo (if the transition to electric transport happens as quickly as I assume.)
“if the transition to electric transport happens as quickly as I assume.”
How fast do you think this transition is going to happen?
Let’s run some numbers:
Total global auto fleet(cars and light trucks): 1.40 billion (in 2008 the global auto fleet was at 1 billion)
Total electric vehicles worldwide: 16 million (1.10%) of total cars/light trucks
Global auto sales 2021: 66 million (pre-pandemic global auto sales were above 73 million)
Global electric auto sales 2021: 6.75 million (about 10% which was up 108% from 2020) This number includes hybrids.
If we added a net 35 million vehicles to the worldwide fleet for the next 10 years, so by 2032 we will have 1.75 billion cars/light trucks in the world. From 2008 to 2022 we added a net of 30 million vehicles per year. If every new car we added was electric, then by 2032 we would have at total of 365 million electric cars out of a total auto fleet of 1.75 billion in the world. This would represent 20% of all cars/light trucks in the world would be electric.
I think the most optimistic scenario is that we get close to 7-8% in ten years. The most interesting thing to me right now is the stability of electric grids worldwide. It seems likely that worldwide electric grids become less stable as we add more renewables especially when we are looking at a massive increase in consumption with the prospect of electric cars.
Don,
folks who study these trends have put out their most recent global update-
https://about.bnef.com/electric-vehicle-outlook/
The executive summary has great charts and info.
Don,
Here is my expectation, based on 30% growth in plugin sales (BEVs and plugin hybrids).
That “net import” chart is deceptive. It doesn’t tell you the US IMPORTS 8.5 million barrels a day to replace what it exports. It’s such bullshit.
The US consumes 20 million barrels per day. It produces 12 million barrels per day. End of story.
Mike B,
The 20 Mbpd number includes about 3 Mbpd of NGL.
Crude Input to refineries is about 16 Mbpd. We currently pruduce about 11.5 Mbpd. So if we look at net imports of crude oil it would be about 4.5 Mbpd. The US produces a lot of NGL and exports a large amount of it.
Mike B,
Here is the chart for net imports of crude oil. Year with highest crude input to refineries was 2018 at about 17 Mbpd, in 2021 it was 15 Mbpd. The most recent 4 weeks (week ending May 27) the average crude input to refineries was 15.98 Mbpd.
For the sum of gasoline, diesel, jet fuel and residual fuel produced over the past 4 weeks the average is 16.63 Mbpd in the US. Note that 0.91 Mbpd of the gasoline is from ethanol input rather than just crude oil, and the total blended inputs to the gasoline are 1.2 Mbpd, a total of about 2 Mbpd. The liquid fuels (gasoline, diesel, jet fuel, and residual fuel) produced are roughly equal to the crude oil input to refineries.
Hi Mike,
I recognize your stance from over on that cesspool by the name of LinkedIn. The propaganda is amazing. A barrel is a barrel whether it’s 20 API or 55 API or corn flakes. No context for energy content or power vs transportation fuel. As Einstein said, “make everything as simple as possible but no simpler.” They did though. They made it simpler, and voila, we are energy independent. But what would happen if we stopped importing actual oil?
Lots of great content and commentary here on peakoilbarrel.com. Glad I found it. As an energy “enthusiast,” I enjoy looking in the rearview to see where we went wrong. Like when the first actor faking to be the president ripped the solar panels off the house in an infantile moment of virtue signaling.
One thing on my to do list is to chart CAFE standards over time with projections for domestic gasoline and diesel use had we stuck to the plan instead of idling / going backwards for 3 decades.
Another fascinating bit of energy information was the intentional transition from railroads (great) to semi trucks (dumb). Why isn’t this discussed? Why are we not rebuilding class 1 and 2 railroads? The only train news is about bullet trains. I’d rather a bullet to the head. (Not mine.)
Cheers,
Dan
EL Dano , welcome . Very relevant questions . Hoping for a good discussion .
Mike B , ” There are lies and then there are statistics ” . No sir , Mr Coyne never lies but statistics , hmmmmm . 🙂
Hickory, I have been saying that for a long time. It almost appears that the press has been instructed to not discuss the reasons for the ever increasing petroleum prices in any rational way. And to top it off, there are even articles discussing Peak Oil Demand such as the one I saw today on the website – oilprice.com & the article entitled – How Close Are We to Peak Oil Demand. Almost psyops.
I listen to the talking heads occasionally and recently there are a couple of reasons given. Most popular is lack of investment. That is blamed on the ESG people and it is also blamed on low prices in recent years. In these instances, money=more oil, with no question. Then also Biden is blamed, along with AOC and even Maxine Waters! The Keystone Pipeline is often mentioned. Lack of spare capacity is talked about, but never because of lack of oil. Overall: Massive denialism. Using less has never been mentioned.
For US see
https://www.eia.gov/petroleum/wells/
At end of 2020 total oil wells 409k, about 382k less than or equal to 100 bpd, and 324k 15bpd or less, so only about 21% of all US wells (includes offshore and unconventional) are not stripper wells. About 304k produce 10 bpd or less with the average output of that group of wells being only 1.8 bpd. The average output of all wells is 26 bpd. The average output of the strippers is 2.352 bpd. The average of the non strippers is about 116 bpd.
In general re: lack of media attention to Peak Oil and Depletion, my feeling is that the media has their reasons for not mentioning it:
– too complex to explain easily (and journos may not understand it)
– scary
– politically loaded
and Politicians have theirs:
– have to take a difficult stand, or lie
– is a harbinger of an indistinct future problem
– nothing they can do will fix it, and knowing the truth will not calm the population or make people vote for you (in fact, probably the opposite).
Another possibility could be, we live in an idiocracy and the elected officials and people in media positions don’t even know or if they know care about the concept of peak oil and its relevance.
No, there is almost nothing about peak oil or the depletion of world oil reserves in the media because they have no idea it is really happening. And those that have been told it is happening don’t believe a damn word of it.
Yeah, and there sure were a lot of people 2015-2020 willing to make fun of “peak oilers.”
I have noticed one is conspicuously absent from another board. I think that one got kicked off this one? Nony?
I said I’d pull my lawn chair up to the gas pump and laugh and laugh when Nony had to fill up for more than $5 per gallon.
Shallow sand,
What is that other board?
Seeking Alpha. Goes by different user name so not 100% sure the same person.
Trolled me some there too when prices were low, which didn’t really bother me much. Kind of enjoy the banter and people who get snarky serious on message boards.
A diversion from me dealing with the death and destruction of meth in my real job.
SS ,A diversion from me dealing with the death and destruction of meth in my real job. ROFL .
HIH.
Unfortunately it is no laughing matter and is a contributing reason for the current labor shortage and high crime rate in my community.
A problem that likely won’t be solved.
Example from today
“Why US gas prices are at a record, and why they’ll stay high for a long time”
All kinds of reasons were given, but not a single reference to oil depletion or peak oil.
Here is what the EIA expects Non-OPEC oil producers to do from March 2022 to December 2023. Winners at the top, Losers at the bottom. This was the month just before the Russian Collapse. The data is total liquids. That is why the US data is so high. Notice the ONLY big loser is Russia. The USA is the big winner but they have the winners outnumber the losers by 1.2 million barrels per day.
I have inserted the data, in million bp/d inside the chart. Small producers are not included in this data but are included in the total non-OPEC totals.
Russian oil and gas: headed for long-term decline?
Boasting a quarter of the planet’s gas reserves and more than 5 per cent of its crude oil, Russia’s economy has long been dominated by the energy sector. As the country’s isolation intensifies following the invasion of Ukraine, the question now is what next for its most important industry?
Key foreign partners BP, Shell and ExxonMobil have made exit plans, international oilfield service companies have promised no more investment and scores of buyers have started to shun Russian crude.
Gas has continued to flow to Europe and oil production, though down, has not collapsed. But even if Russia’s own energy companies are able to sustain operations, a shrinking market for exports, reduced access to international expertise and the need to redirect billions of dollars of infrastructure investment toward Asia threaten to usher in a period of long-term decline.
“It could still grow if everything worked wonderfully, but it doesn’t look like that’s on the cards for the foreseeable future,” said Michael Moynihan, an expert on Russia’s upstream oil and gas sector at consultancy Wood Mackenzie.
SNIP
What the domestic industry lacks is the ability to do some of the more sophisticated technical analysis required to develop complex new oil reservoirs, particularly in remote offshore locations such as the Barents Sea.
“Russian service companies can replicate a lot of the equipment but they can’t really replicate the interpretation software,” said James Henderson, a Russia expert at the Oxford Institute for Energy Studies who is writing a book on the history of Rosneft.
As a result, projects such as Rosneft’s Vostok Oil — a vast Arctic project backed by commodity traders Trafigura and Vitol — were now less likely to advance, he said.
EIA Warns of Substantial Fall in Russian Oil Production
18% fall in a year and a half. Hard to see how the world could approach a new peak in oil production with 2 million barrels a day from Russia gone.
https://oilprice.com/Energy/Crude-Oil/EIA-Warns-Of-Substantial-Fall-In-Russian-Oil-Production.html
$140 oil is ‘the level to watch as a recession indicator’: DataTrek
A sustained high price for crude oil could tip the economy into a recession, researchers at DataTrek warned in a new note on Tuesday.
“We still believe $140/barrel is the level to watch as a recession indicator,” DataTrek researchers stated in a new note. “That would be a double from last summer’s $70/barrel level, and any time since 1970 when oil prices have gone up 2x in a year a recession has followed in the next 12-18 months.”
https://finance.yahoo.com/news/140-oil-prices-recession-strategists-warn-213711337.html
What’s different this time than any other since 1970 is that the United States isn’t importing about 10 million barrels a day and not sending that purchasing money out of the country. Today that money is getting recycled back into the US economy. States like Texas, New Mexico, Alaska, etc. should see an increase in economic activity. Along with investors with energy portfolio’s, EV manufacturers, steel pipe producers etc. Retailers like Target and Walmart who largely sell imports will see less available spending because of increased transportation costs. Point being, today’s increased oil costs doesn’t tax the U.S. economy like in the past, but mostly redistributes the wealth. May’s job report added 390,000 new jobs last month.
Also, your link shows a picture of THUMS island owned by OXY. Occidental spun off all their California holdings 7 years ago to California Resources Corp. The writer of this article seems to be living in the past and hasn’t done his homework. FED tightening will be the primary factor of an economic slow down.
At today’s oil price, 20 years from now demand will be cut in half and two to four percent less within the next 6 months. My guess is prices will continue to climb to about $140 for another couple of months plus or minus. Then a price break that declines a lot faster than it’s ride up to maybe $80. The Russian oil thing is not going away.
That’s great news! So no matter how much energy costs to extract, and no matter how much gas costs at the pump, or to heat or cool one’s home, as long as we just keep handing over ever-greater amounts of money for energy we’ll be fine. The more we pay the better things get?
You need to read my comment again. Your putting words in my mouth. I never said there wouldn’t be pain. The solution to high prices are high prices. It’s a free market. The poor will be the first to use less. It seems to have gotten your attention.
I read it again. Twice! I never said you said there wouldn’t be pain. Read my comment again!
The point I was making that you seem to have wholly missed is about EROEI. Every penny spent on fossil fuels can be recycled and recycled, back down to bare copper (or are they made of zinc or steel now?), and that won’t help one bit!
EROEI doesn’t care if the money goes to you or Putin or Chevron.
The solution to EROEI is not high prices. The solution to EROEI is accepting that there is no solution, when employing BAU, inside-the-box thinking. Alice In Wonderland is a good read.
Understanding Economics and Scarcity
The resources that we value—time, money, labor, tools, land, and raw materials—exist in limited supply. There are simply never enough resources to meet all our needs and desires. This condition is known as scarcity. At any moment in time, there is a finite amount of resources available. Even when the number of resources is very large, it’s limited. There are simply never enough.
Economics is a social science concerned with the production, distribution, and consumption of goods and services. It studies how individuals, businesses, governments, and nations make choices about how to allocate resources.
https://www.investopedia.com/terms/e/economics.asp
Got2Surf- Scarcity is a given in my thinking. It’s ECON 101. I would agree with you, if you believe every human should be educated on the subject.
Got2Surf , Throwing money and higher prices is the only solution that Mr Coyne has for depletion . Dennis for the next FED chairman . 🙂 See his similar reply to an earlier post of mine regarding critical metals required for EV’s .
Hole in head,
Just a matter of opening up more mines to produce the needed materials. Price increases because available supply is less than demand at the current price, high price leads to high profits, more investment, higher supply, and lower prices. This is Econ 101.
Hole in head,
Capitalism is far from perfect, just the best system devised by humans to data, especially when properly regulated to account for externalities (both positive and negative). Europe has a better ability to regulate capitalism because their political system allows consensus to be reached and makes government action possible. The United States system of government was designed to make it difficult for the government to do anything and as a consequence almost nothing gets done. It is unfortunate, but is the reality.
Price signals work pretty well in allocating scarce resources efficiently in the absence of any externalities, in the real world externalities exist. (Pollution, healthcare, infrastructure, etc).
https://en.wikipedia.org/wiki/Externality
Dennis , capitalism at least in it’s current form of practice and implementation is not devised to deal with depletion . It is designed for continuous growth and you have acknowledged the effect of externalities that are in contradiction to the narrative of ” throwing money ” at the problem of depletion . Nothing more to add .
Hole in head,
Changing the allocation of resources and using resources more efficiently is not the same as throwing money at the problem. The economic system as a whole must have a positive EROEI, if it did not it would not exist. The current system wastes about two thirds of fossil fuel primary energy, gradually shifting to a more efficient system that uses less fossil fuel energy in the form of wind and solar power, widely dispersed and highly interconnected (which reduces the overall system intermittency) will reduce the wasted energy by a factor of 6.
Changing prices is an indicator of surplus or scarcity and simply allocates resources where they are needed based on price signals.
This is so obvious to me, I usually see no need to mention it.
Externalities were pointed out as a reason regulation of capitalism is needed, monopoly power is another that I failed to mention.
The free market is best mythology only works in a simplistic perfectly competitive market with no externalities which is not the World we live in. Those that believe no government regulation of capitalism is needed live in a fantasy World.
What about Europe?
I believe Europe’s economy will be forced to completely change in the next few years. My bet is that they adopt agroecology like Cuba did after the fall of the Soviet Union.
They are going to de-industrialize on a massive scale. So is China.
Germany is pretty much already in recession. I think we can call it even if it’s not officially called yet. And ECB has no good options. Technically the should be cutting interest rates and doing stimulus. But there is this pesky little thing called inflation. Heck they are still buying bonds when the CPI is at 9%
Europe is going to burn to the ground economically. If they hike rates it will be seen as not supporting asset prices and money will leave assets causing their currency to fall against the dollar which makes everything more expensive. But if they don’t hike rates CPI doubles and goes to 18-20% and their currency will looks more like Japan’s does at the moment. Either way the cost of everything goes up as purchasing power falls like a rock.
When your currency implodes your not going to be importing all the things needed to build out a transition away from fossil fuels economy. Because you can’t afford it.
An old problem of spreads between Germany and the PIIGS has cropped up . What is the ECB going to do about this . ? Flying blind .
ECB will have to buy all the PIIGS bonds . No alternative .
Yep, Euro debt crisis 2.0 on deck.
Only this time you get a currency crisis to go with it.
High price oil has a shelf life of maybe 6 more months at best.
It seems the issue of bonds yields jumping involves all european countries. It is not comparable to 2012 bond crisis.
HHH, what is keeping the junk bond market still alive ? Funds still searching for yield instead of safety ? It should have exploded by now .
Same thing that keeps stocks alive in my opinion. Dumb money is buying in at these levels. Thinking/hoping sell off is over. Bear market rallies can be really strong.
Money has been trained to buy bad news over past decade. FED put.
Only this time there is no FED put due to inflation.
Are you telling me that Sri Lanka can’t just get itself going again by moving to green energy, EVs, and organic agriculture?
Oh, what is to become of our non-USD printing brethren…
Failed state status, like Lebanon, Afghanistan, Venezuela, Haiti, etc. Not everyone will make it to the other side.
They got killed by paranoid corona policies, trying to protect western 80 year+ old and chinese 80 year+ old by stopping the world economy.
Much of their $ income was by tourism, this payed the fuel bill. And was killed of more efficient than by a direct war.
Corona policies (not Corona directly) created very heavy damage world wide – most of it isn’t accounted still. Prisoning and masking school kids here for 2 whole years for an illness that doesn’t affect them will backfire on the long run, too. A lot more kids already died to suicide than to Corona directly.
These are the way things look when the phenomena of Overshoot
has been ignored for 50 years.
Just starting to approach the top of the hill.
Madeline.
Another difference from the 1970’s is that
-“Hybrid, plug-in hybrid, and electric vehicle sales in the United States have increased in recent months as sales of non-hybrid internal combustion engine (ICE) vehicles fueled by gasoline or diesel decreased. In the fourth quarter of 2021, hybrid, plug-in hybrid, and electric vehicles collectively accounted for 11% of light-duty vehicle sales in the United States”, and growing very rapidly
and
-average US vehicle mileage increased 13 mpg in 195 up to 26 mpg in 2021
Ovi,
Not the case for the price increase from 2009 to 2010 for WTI (from $40/bo to $80/bo). No recession in 2010 or 2011. So the claim of oil prices doubling in a year leading to a recession is true in most cases but not all. In 2000, the recession was likely due to the crash in the stock market associated with the internet bubble. In 2008/2009, the financial crisis was due primarily to a real estate bubble and poor financial regulation. The 2009 to 2010 increase in oil prices shows that other factors are a necessary condition for the doubling in price to cause a recession. I guess we will get the test soon, we do seem to be heading for a recession, WTI was $68/bo in Aug 2021, if we get to $136/bo by Aug 2022 (average monthly price) maybe we will see a recession by Aug 2023 to Feb 2024. Much depends on how aggressive central banks are in reigning in inflation along with energy prices, note that probably looking at coal, natural gas and oil prices would be a better measure. Currently all fossil fuel seems to be short on supply. Natural gas futures at Henry Hub are over $9/MMBtu, WTI futures are about $121/b, and the Australian coal price is about $394/metric tonne. So natural gas prices have tripled in the US over the past 12 months, coal prices in Australia have more than doubled in past 12 months, and oil prices have nearly doubled on past 10 months (low point for WTI futures on daily basis was Aug 2021 at about $62/bo).
Dennis
What is the statistic to look for that indicates the economy is slowing. Q2 GDP? Falling gasoline demand?
For the World we only have annual data and I look at real GDP in constant $, if you mean the US, we have quarterly data where real GDP fell in 2022Q1 and we would look at 2022Q2 to see if we have a recession in the US, the advance (preliminary) estimate for Q2 will come out near the end of July, last year it was July 29.
https://www.bea.gov/data/gdp/gross-domestic-product
There is also an estimate done by the Atlanta Fed called GDP Now
a so-called nowcast, see link below, the current estimate is about 0.9% growth for 2022Q2, but this changes often and is often different from the BEA estimate.
https://www.atlantafed.org/cqer/research/gdpnow
Dennis
Thanks
Ovi , not an expert opinion . Too many moving parts . Cannot focus on one parameter . Trade deficit reduced . Good or bad . Bad because it shows consumption is down ( 70% of the economy is consumer spending ) , good it means USA owes less to the world . Credit card spending up , good are bad ? Good ,the consumer is bumping up demand , bad because he is going in debt . Ovi is sick , good are bad ? Good for the healthcare sector GDP figure , but bad for Ovi . 🙂
Many facets to economy.
One indicator- mortgages
“Mortgage demand falls to nearly half of what it was a year ago, as interest rates continue to rise”
A lot of people who used to refinance every year or so no longer do so because of rising rates… mortgage demand is not necessarily analogue to housing demand…
Rgds
WP
Let’s pray that the UK has a better summer solstice than last year. During the weeks before and after the solstice last year the best those $100,s millions of solar cells could do was match the output of Drax burning pellets. The UK has 16.5 hours days right now..
$140 oil is ‘the level to watch as a recession indicator’: DataTrek
“We still believe $140/barrel is the level to watch as a recession indicator,” DataTrek researchers stated in a new note. “That would be a double from last summer’s $70/barrel level, and any time since 1970 when oil prices have gone up 2x in a year a recession has followed in the next 12-18 months.”
With the exception of two to three OPEC members, all are maxed out on oil production. The world needs to come to terms with this brutal facts. It is a global challenged. – OPEC general secretary Barkindo
Ron will like this. Good discussion. There are still smart people out there. References to Matt Simmons, etc.
“Rethinking the US approach to Energy” From the Council on Foreign Relations. The former intelligence analyst is on it!
https://youtu.be/3VN-5-F3I6I
No idea why $140 is a magical number.
GDP is, in today’s US of A, largely dependent on G in the formula, which also buttresses C.
But G is done now. The stimmis are done. There ain’t gonna be an infrastructure bill, which assumes an Apocalyptic economic unfolding does not happen because if one does, it is gubmint money, from the Fed or Congress, that will intervene. Maybe via some panic I bill. It will have to be that because Capitalism with a capital C failed in 2008. Everything happening since then has been created or borrowed (from the creator) money thrown into the system in somewhat desperate fashion.
A good exercise is to look at GDP, in dollars, not % growth or decline, and compare it to the total of QE and outright deficit in the relevant timeframe. The dirty secret is GDP grows a smaller number of dollars than the sum of the . . . intervention. That is a failed economy or failed capitalism or both.
Suspicious LNG explosion. ZH says 3 weeks. We’ll see. One would think that would be low-balled.
Watching Columbia. Alleged $17B influx from a shipwreck. 800K bpd. Can fund more drilling.
A new February Non-OPEC Oil production thread has been posted.
https://peakoilbarrel.com/february-non-opec-oil-production-climbs/
A new Open Thread Non-Petroleum has been posted.
https://peakoilbarrel.com/open-thread-non-petroleum-june-9-2022/