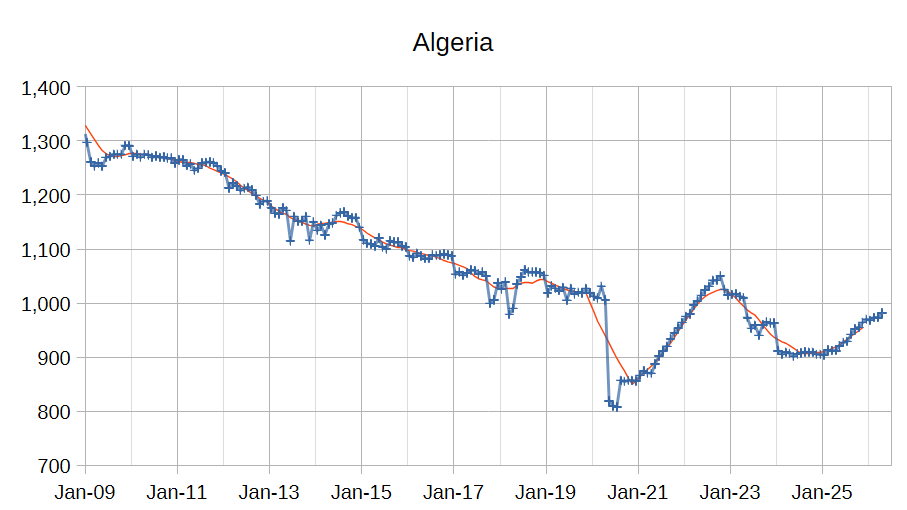
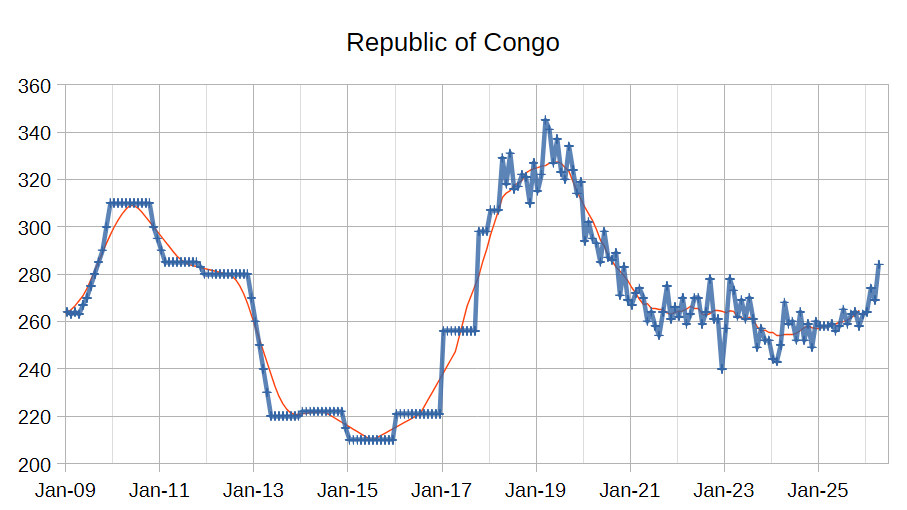
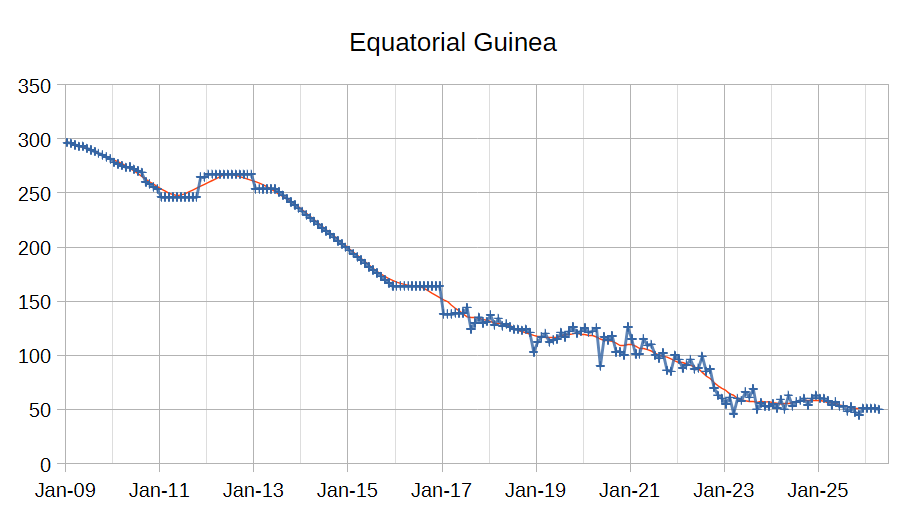
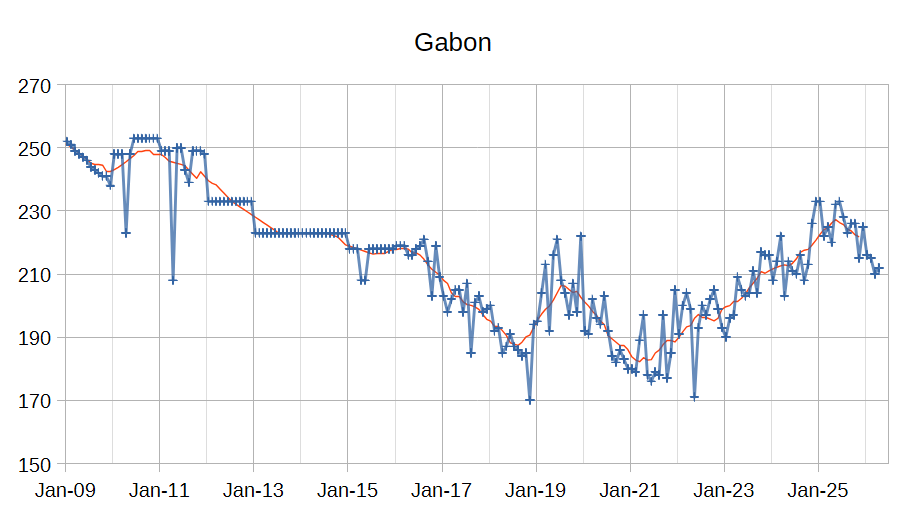
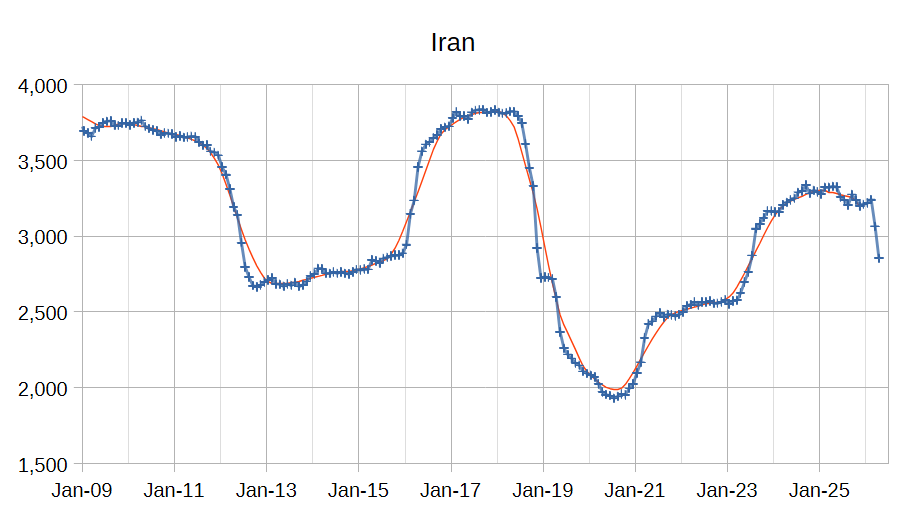
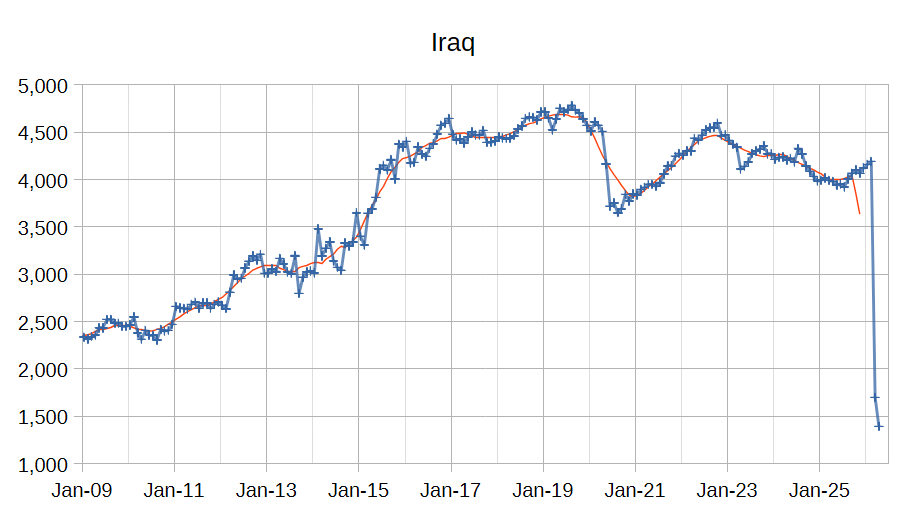
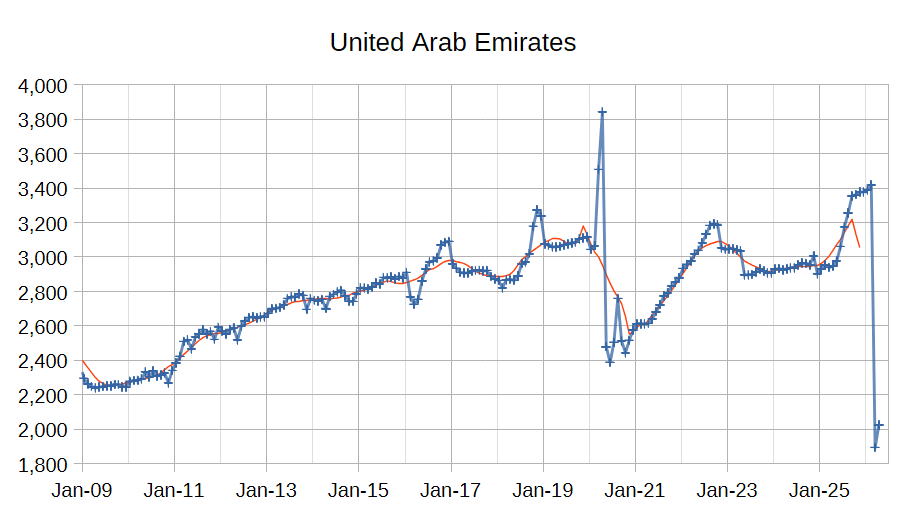
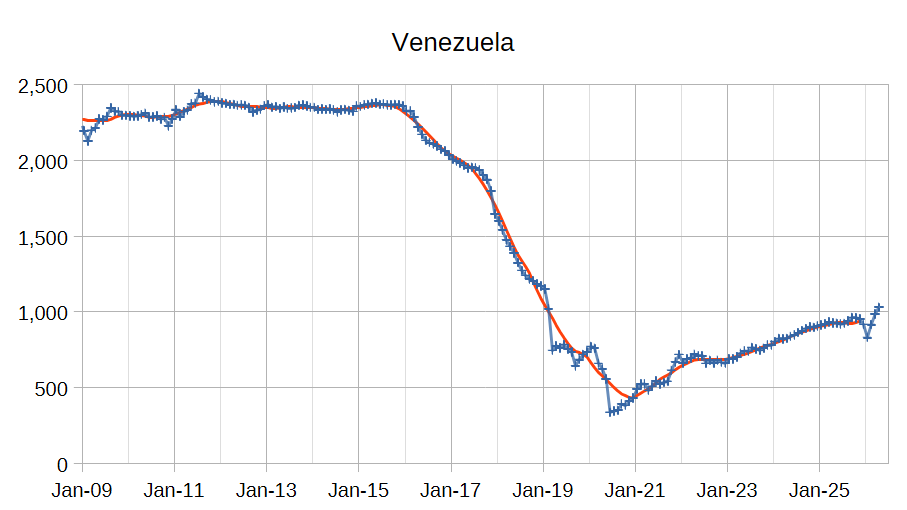
The OPEC Monthly Oil Market Report (MOMR) for May 2026 was published recently. The last month reported in most of the OPEC charts that follow is April 2026 and output reported for OPEC nations is crude oil output in thousands of barrels per day (kb/d). In the OPEC charts below the blue line with markers is monthly output and the thin red line is the centered twelve month average (CTMA) output.
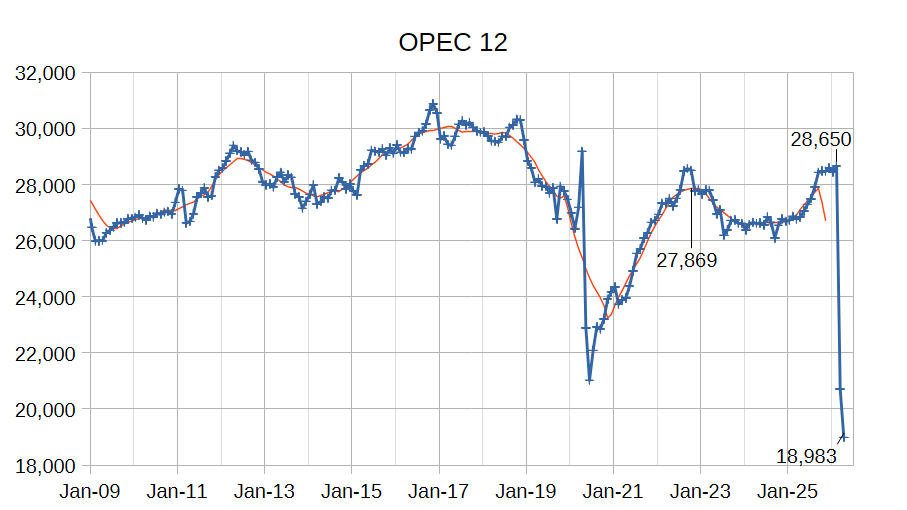
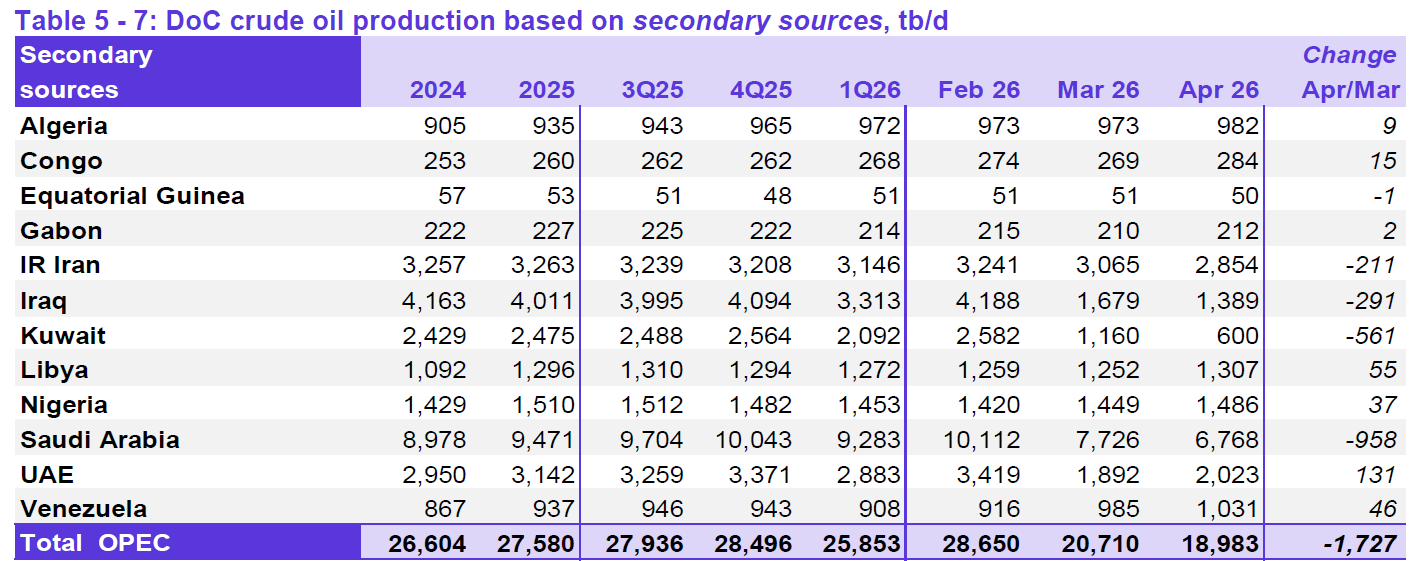
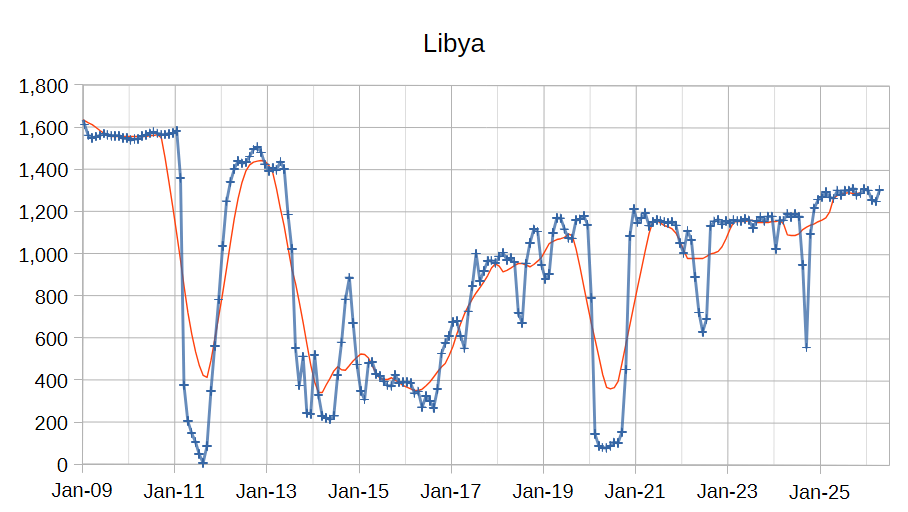
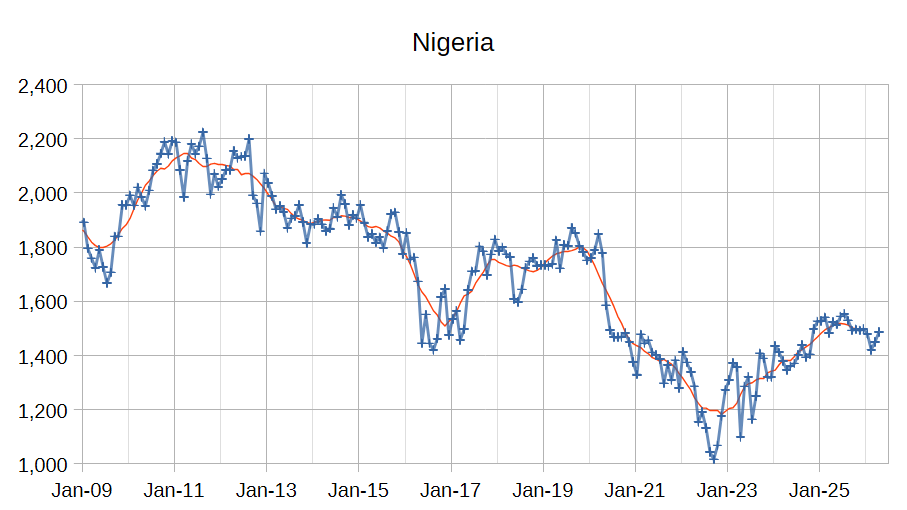
OPEC 12 output decreased by 9667 kb/d from Feb 2026 to April 2026 with the largest decreases from Saudi Arabia (3344 kb/d), Iraq (2799 kb/d), Kuwait (1982 kb/d), UAE (1396 kb/d), and Iran (387 kb/d). Other OPEC producers besides the large producers affected by the closure of the Strait of Hormuz collectively saw an increase of 241 kb/d over the past 2 months.
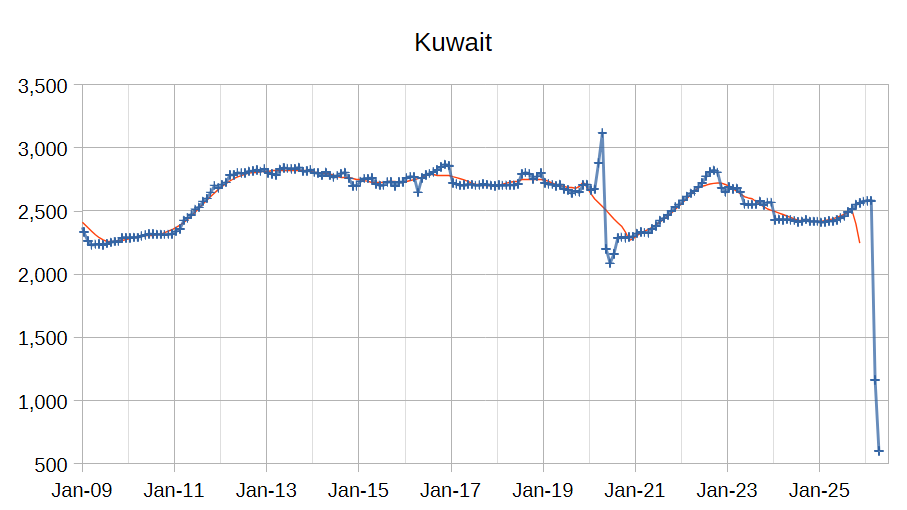
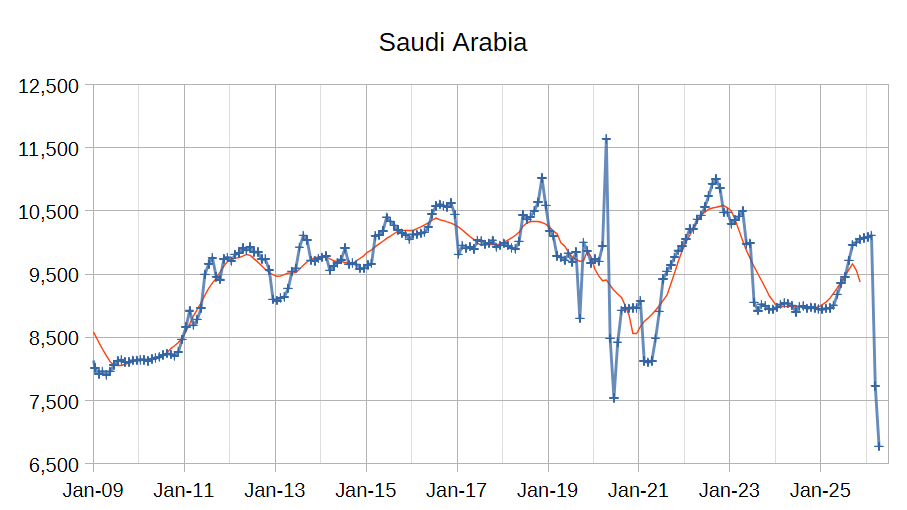
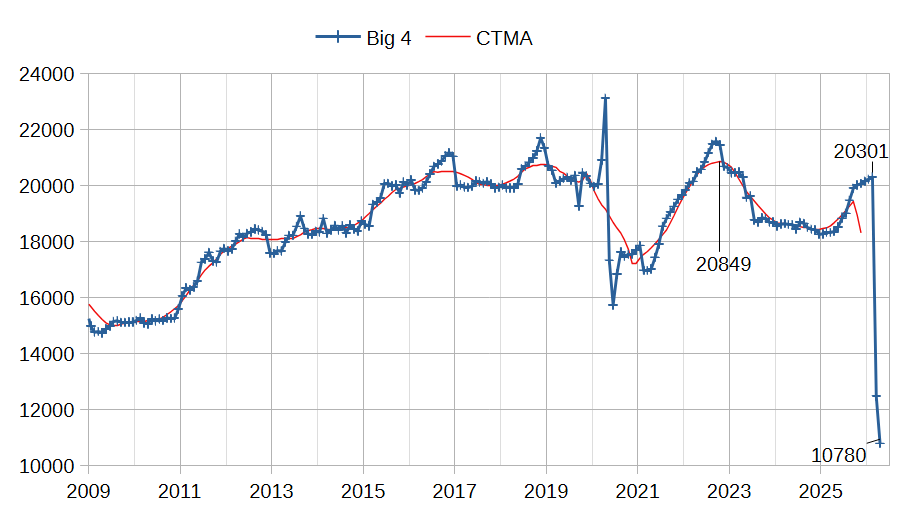
The chart above shows output from the Big 4 OPEC producers that are subject to output quotas and where most of OPEC spare capacity currently exists (Saudi Arabia, UAE, Iraq, and Kuwait.) In the past 2 months output from the Big 4 has fallen by 9521 kb/d. OPEC spare capacity has increased to about 10069 kb/d in April 2026, though an opening of the Strait of Hormuz would be needed to utilize that spare capacity.
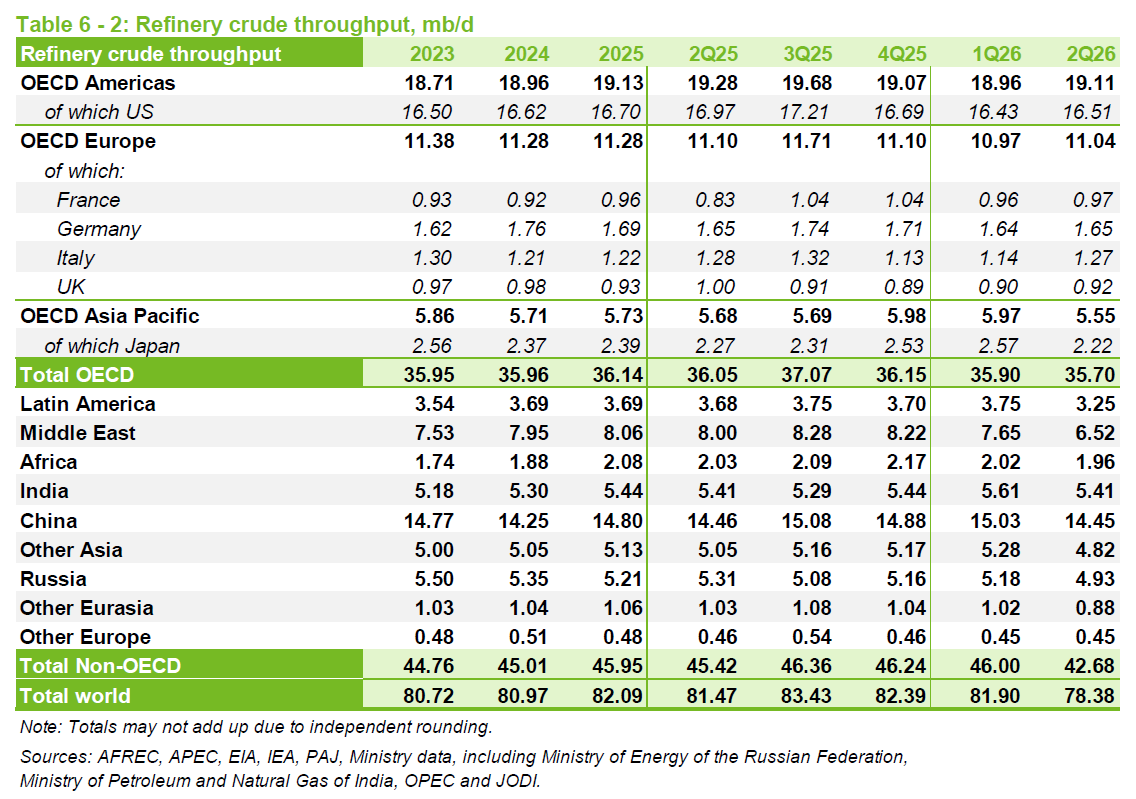
World demand for crude oil has decreased by 3.09 Mb/d from 2Q25 to 2Q26, probably due to higher prices and constrained crude availability.
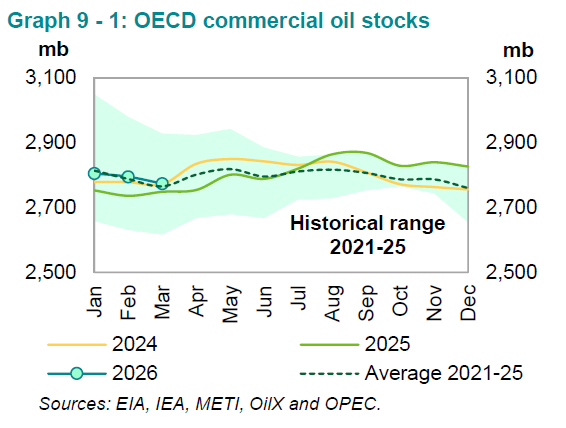
In March preliminary OECD Commercial petroleum stocks were 2774 Mb which is 8 Mb above the 5 year average from 2021 to 2025.
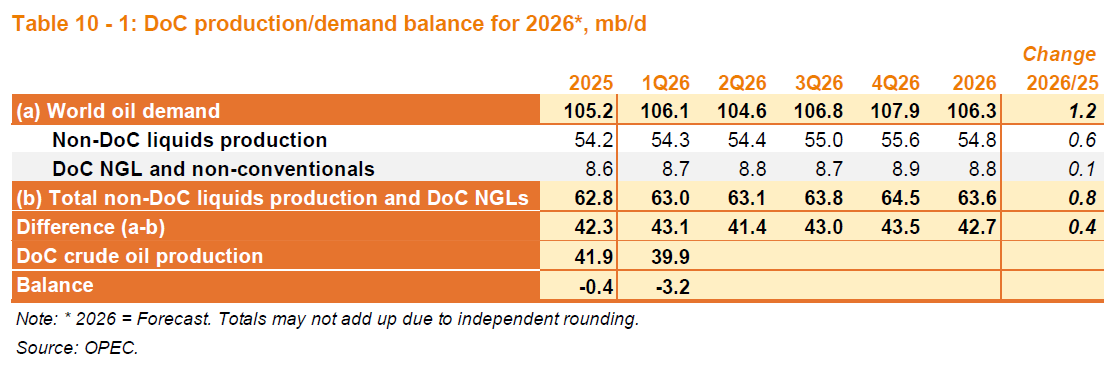
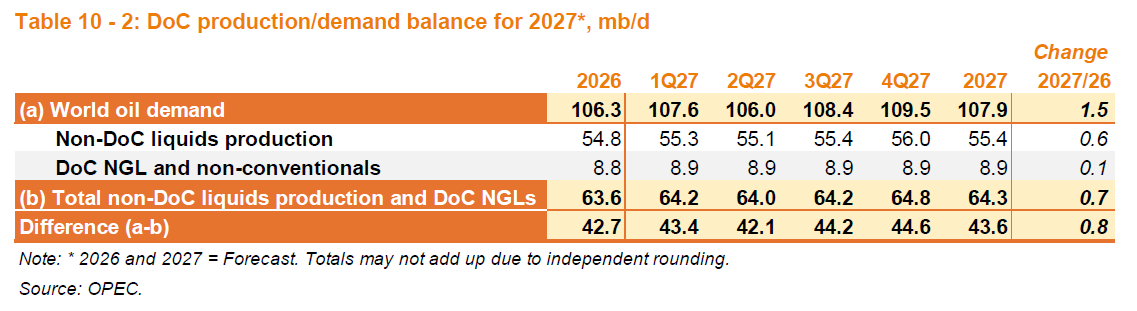
Note that April DOC crude output was 33.2 Mb/d, if that level of output continues for the rest of Q2 then World Stock draw will be about 720 Mb for 2Q26.
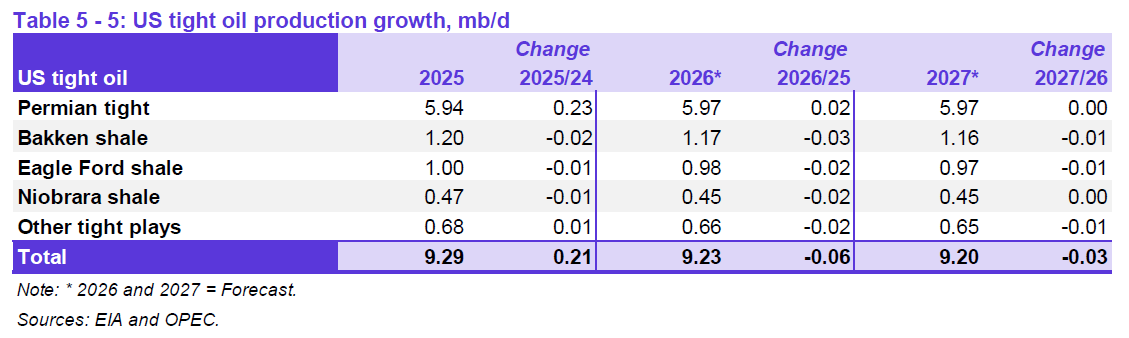
OPEC expects US tight oil output will decrease in both 2026 and 2027.
World Oil Stocks
An interesting commentary by G&R can be found here regarding the Hormuz crisis. Regarding commercial petroleum stocks here is an excerpt:
Taken together, our analysis suggests the minimum commercial inventory required to
keep the global petroleum system functioning is approximately 5.4 billion barrels —
against reported non-SPR inventories of roughly 6.5 billion barrels at the end of
February. The implication is rather sobering. If our estimates are approximately correct,
the global energy system can realistically draw only about 1.1 billion barrels from
commercial inventories before beginning to seize up operationally.
The IEA Oil Market Report from March 2026 can be found at this link. IEA estimates about 8.21 Gb of Global petroleum inventory, if we assume the 6.5 Gb estimate for commercial inventory is roughly correct, this suggests about 1.71 Gb of Global SPR with perhaps 80% of this SPR inventory available as their are minimum levels that must be maintained in the system. so roughly 1.36 Gb of SPR. About 0.4 Gb is already scheduled for release reducing the SPR to about 1 Gb which can be added to the available commercial inventory of 1.1 Gb for a total of 2.2 Gb.
Let us assume there is a deficit of about 8 Mb/d with the Strait of Hormuz closed and a total of 2.5 Gb of available stocks at the end of Feb 2026, the stocks would last for 312 days if run down to absolute minimum levels, but note that March, April and May 2026 already account for 90 days, so we will be down to 222 days of stocks at the end of May, just over 7 months of supply left. Consider that Iran may hold off on an agreement until November 2026 to punish Trump in the mid-term elections, that adds another 5 months with stocks dwindling bringing us to 2 months of stocks to plug the gap, at that point oil prices might rise to $350/b.
Not a nice scenario, but maybe a 25% probability it will become reality.
118 responses to “OPEC Monthly Oil Market Report, May 2026”
Thank you for that update DC!
With OPEC down nearly 10 mbd, that might be a nice round number to work with in terms of global daily supply/inventory losses (assuming demand is flat).
According to the analysis here (https://x.com/CRUDEOIL231/status/2059354174861754819?s=20), which I have not verified myself, it is possible that as much as nearly half of the drop in supply is being absorbed by China’s radical reduction in crude oil imports.
“Three months into the Hormuz crunch, and Beijing is completely blindsiding the market with its crude playbook. A heavyweight that easily sucked in 11mb/d over the last five years just saw its import prints plunge to 9.3mb/d in April. Now, the forward data says May and June seaborne arrivals are about to crater straight into the gutter at 6.5mb/d.”
The implications for naphtha supply in Asia is also of concern:
“Beijing explicitly told state majors like Sinopec and PetroChina to ditch chemical feedstocks and prioritize flooding the market with gas and diesel, and these plants immediately saluted by shifting their product yields by several percentage points on a dime.
As a result, the real bloodbath isn’t happening at the refining gate—it’s completely decimating the downstream petrochemical chain. With Hormuz blocked, their seaborne naphtha inflows were already sliced in half, but a 5% run cut is about to bleed domestic naphtha and LPG supplies by tens of millions of tons a quarter, sending a compounding, fatal shock straight through the petchem feedstock backbone.”
THC,
You’re welcome. I used 8 Mb/d rather than 10 Mb/d assuming that demand might fall by 2 Mb/d. If that is incorrect and the deficit is in fact 10 Mb/d as you suggest, then there would be about 250 days of available stocks, minus the 90 days from March 1 to May 29 which would reduce available stocks to 160 days, about 5.26 months, so under that scenario stocks run dry by election day in November 2026 (assuming a 10 Mb/d deficit for the May to November period, so Hormuz remaining closed). Not a pretty picture which is why Trump is contemplating a deal that looks like an unconditional US surrender.
Note that I think this scenario is lower probability, maybe 10%.
Hi DC!
Thanks for the feedback!
Quick question re “which would reduce available stocks to 160 days, about 5.26 months, so under that scenario stocks run dry by election day in November 2026″
Are we talking about burning inventory down to zero, or does the 160 days take us to a level where we have reached the bottom of practically useable inventory?
I’m not familiar with the details, but I recall hearing that:
*Storage tanks cannot be run down to completely empty (0% of capacity), as the material towards the bottom is likely to be heavy sludge, and a certain amount is necessary for the tank to function properly.”
*Pipelines need a certain amount in the pipes to maintain pressure and flow rates, and they cannot be completely emptied.
*If oil in transit is included in inventory, this too cannot be reduced to zero or there would be no more flows of oil to areas of refining and consumption.
Any idea how long we have before we start to see real shortages in nations/regions with low running inventories of specific products (diesel, jet fuel, etc.)?
The naphtha shortage is already hitting Japan and Asia in general hard. The list of things in shortage is growing. I assume most of the products in Costco, Walmart, and Amazon US that contain petrochemicals of some sort are dependent on Asian supply chains, so perhaps it will become noticeable there as well in the coming weeks as less stuff starts to show up in shipments arriving in the US?
THC,
This reduces commercial stocks by 5.4 Gb to 1.1 Gb to account for pipeline fill, tank bottoms, oil in transit, etc, SPR is assumed to be 80% usuable ( a guess on my part, based on US SPR maximum fill of 750 Mb and minimum fill of 150 Mb, 600 Mb usable or about 80% and I then assume this is the right figure for the entire World SPR, probably incorrect.)
In short, the number is based on usable stocks of 2.5 Gb out of total stocks of 8.2 Gb.
Hi DC,
“the number is based on usable stocks of 2.5 Gb out of total stocks of 8.2 Gb.”
The math does indeed work with that number.
But, WOW, when global inventories are reduced to usable stocks of 2.5 Gb, things look considerably more dicey than when using 8.2 Gb.
It’s hard to imagine we could get close to burning through 2.5 Gb without starting to see localized shortages.
Perhaps this unusual shipment is a sign that things are getting tight:
https://oilprice.com/Latest-Energy-News/World-News/US-Sends-Rare-SPR-Oil-Cargo-to-Asia-as-Hormuz-Crisis-Reshapes-Trade.html
China’s Return to the Energy Market Could Become the Next Global Price Shock
https://oilprice.com/Energy/Crude-Oil/Chinas-Return-to-the-Energy-Market-Could-Become-the-Next-Global-Price-Shock.html
*China’s reduced oil and LNG imports have helped stabilize global energy markets during the Iran war, as Beijing drew down inventories, cut refinery runs, and delayed spot purchases instead of competing aggressively for scarce cargoes.
*Analysts warn this strategy cannot last indefinitely, with China likely to re-enter markets in coming months to rebuild crude and LNG stockpiles, potentially pushing Brent back toward $120–130 per barrel and tightening global gas supplies.
*Europe and Asia could soon face renewed competition for LNG cargoes as China resumes buying.
~~~~~
“The main reason at present is that Chinese buyers have relied heavily on strategic and commercial inventories accumulated during previous years of low oil prices. This inventory drawn down should now be seen as **the single most important hidden stabilizer in global oil markets**.”
“A growing number of analysts now believe that China’s opaque strategic reserves are being used far more aggressively than publicly acknowledged. This could mean that the same mechanism that stabilized prices could soon reverse, becoming highly bullish.”
~~~~~
” Consider that Iran may hold off on an agreement until November 2026 to punish Trump in the mid-term elections”
Hadn’t thought of that. I suppose it would be in their interest to have it go that way. Most of the world would suffer badly, and the blame will be primarily on the US and Trump.
Startling charts from the Gulf producers. People finally get the Seneca cliff view they have been waiting for so long, courtesy of the human factor rather than geology.
Look at those gulf nation charts and consider what this does to their budgets.
Hickory,
For Saudi Arabia and UAE, they are getting higher prices for the oil they can export, Kuwait and Iraq are in dire straits as they have little ability to export oil, that might change, but it will take time.
Hickory, DC,
Hi!
Yeah, oil exports aside, I wonder how the GCC nations are doing in terms of getting enough food and daily use supplies. Their imports primarily came through the Hormuz I assume, so it is conceivable they may have food shortages that hit before financial problems due to low oil income.
1. Food shortages ->
2. Riots/social instability ->
3. Movement to overthrow ruling class (viewed as traitorous Epstein class by some of their people)
It would make a bad situation worse if the GCC started to have an “Arab Spring” set off by food shortages.
Apparently, about 70% of all food imported into the GCC typically passes directly through the Strait of Hormuz.
https://goumbook.com/when-the-route-is-the-risk-gcc-food-import-vulnerability-through-the-strait-of-hormuz/#:~:text=Source%3A%20FAO%20RNE%20Strategy%20and,food%20supply%20transits%20through%20Hormuz.
“Across the GCC, between 70 and 90 percent of food supply is sourced from international markets.”
“virtually all of these imports flow through a single maritime chokepoint: the Strait of Hormuz. With tanker traffic through the Strait declining by more than 90 percent within days of the 2026 escalation, the principal route through which food imports enter the region came under severe strain”
“Bahrain, Kuwait, Qatar, Oman, and the UAE each record full chokepoint exposure, meaning that 100 percent of their imported food supply transits through Hormuz.”
They must be having some issues already.
Not sure why, but I’ve noticed Jeff Currie is suddenly appearing almost daily in the news.
~~~~~~
https://oilprice.com/Energy/Crude-Oil/Shrinking-Oil-Inventories-Raise-Fears-of-Prolonged-Energy-Crisis.html
“Global oil inventories are fast approaching a critical point, with Asia the first facing “minimum operational levels” and Europe close behind. ”
“Jeff Currie, Senior Advisor at the Carlyle Group, told CNBC this week. Speaking on the sidelines of an industry event in Singapore, the energy market vet said, “We’ve seen explosive prices on products. Jet fuel has come down, but diesel has now gone up above jet fuel. So, the problem here in Singapore continues. It just moved from jet to diesel.””
“According to Carlyle’s Currie, Europe has less than that before it meets the oil shortage head-on. It may be painful, because “All of the inventories that are drawing out of the United States out of the U.S. SPR [Strategic Petroleum Reserve] are being exported into Europe, so the Europeans think they have no problem because they’re getting all of this oil being imported from the United States, but that can’t continue on,” the commodity expert said. What’s worse, the crunch will not spare the United States either, with shortages beginning to be felt by July, Currie also said.”
““I would say, Asia, you’re there. Europe, give it about another month, and look for July being a problem in the U.S.,” he said”
Thanks THC,
I was also going to post this piece from Oil Price, very pessimistic view that Currie has, much more so than many other analysts.
Another excerpt from the piece you linked:
Global oil inventories are fast approaching a critical point, with Asia the first facing “minimum operational levels” and Europe close behind. This is the latest in a growing series of warnings from industry experts about the state of oil supply and the prospects of a severe shortage.
…
The problem is not isolated to Singapore, either, with total Asian oil stocks already on the brink of minimum operational level, Currie also said, and other parts of the world set to reach those levels by July. In that, Currie took a more pessimistic—or possibly realistic—stance on the state of inventories than his former colleagues from Goldman Sachs, who earlier this month said they did not expect global inventories of crude oil to reach minimum operational levels this summer, although they acknowledged that the situation with supply is challenging.
Hi DC,
Yes, Currie is probably a bit on the extreme side of the spectrum. His timelines are relatively short, and it will be interesting to see how things play out for his shortage forecasts.
Art Berman also takes the Hormuz situation quite seriously, although his timelines are perhaps longer than Currie’s.
Art Berman: Coming Oil Shock ‘Worst Thing’ in Modern History, Shortages Inevitable
https://www.youtube.com/watch?v=xvKgU1w0_pM
Forget the WH hype: Oil to $180/bbl by Year’s End w/Art Berman
https://www.youtube.com/watch?v=YSSTy5A5CT4
A small addon – russian production has fallen and will fall more now the Ukraine can build a few 100 long range attack drones a day. I think it’s already 1mb/d down, more incoming since they bomb reffineries, loading terminal and pumping stations to keep Putins war chest down.
Note that the U.S. will say “uncle” before Iran. From Iran’s point of view, they are in an existential fight with a psychopathic, genocidal adversary. Their future depends on winning this fight. It does not matter to Iran that the world economy falls apart. Sanctions have deprived Iran of participating in this economy for the last 47 years. It is just a question of how much time will pass before leaders in the collective West come to this conclusion and admit defeat. We may have to wait for Trump to be out of office before this occurs.
Putin is coming under pressure in Russia to implement Iran’s tactics of attacking all countries directly or indirectly involved in the conflict in Ukraine. In other words: to attack NATO.
Schinzy,
That would be another mistake by Putin, even without the US, NATO is a potent adversary, a battle which would be lost by Russia. The main point of leverage for Iran is Hormuz, not clear Russia has that much leverage at present.
@DC
So NATO cannot defeat Iran and open Hormuz straight and yet NATO will defeat Russia?
No wonder people tolerate LLMs, nothing matters anymore if there’s a bare minimum of grammar.
Schinzy wrote: Note that the U.S. will say “uncle” before Iran. From Iran’s point of view, they are in an existential fight with a psychopathic, genocidal adversary.
Schinzy, please note: That psychopathic, genocidal adversary is not the United States of America! That guy is Donald Trump. Yes some people in Washington really screwed up giving that stupid idiot the power he has. And they are still screwing up by not impeaching his stupid ass. But by a huge majority, the American people do not support Donald Trump’s stupid war.
Another point. NATO does not have a standing army capable of doing anything. NATO is a group of nations that collectively decides whether to intervene in a battle if and only if one of its member nations is invaded.
And yes, if Putin did invade one of the NATO member nations, he would get his royal ass kicked by the collective power of ALL NATO member nations. End of story.
Svaya,
If NATO wanted to open the Strait of Hormuz, they could do it. NATO comes to the defense of a member if a member is attacked. There has been no attack on a NATO member, so NATO is not involved directly with the War in Iran. This was a war of choice by Israel and the US and a big mistake. It has long been known that Iran’s response to an attack would be to close the Strait of Hormuz, the US and Israel badly miscalculated.
As Colin Powell once told Bush, if you break it you fix it. Trump now has to fix the problem he has created.
Russia is no match for NATO, even without the US, in addition Russia has been weakened by the War in Ukraine.
The problem is that it’s not about who can beat whom. All Iran has to do is survive and maintain a low level of conflict. Hormuz has to be *peaceful*, it has to be quiet and safe for it to be usable.
Schinzy. Perhaps the current Iranian government considers this conflict existential, but that does not apply to the people or to the country. And, no the US is not genocidal toward Iranians. in fact, the Iranian government is a much bigger threat to Iranians than is the US.
But I do agree with the gist of your posting. Trump has performed his role miserably. Massive error. No one should be surprised by that.
It does not matter whether or not Iran’s adversaries are genocidal. What matters is what the Iranians believe. Iran has considered Israel to be an illegitimate apartheid state since 1979. More recently they have characterized Israel as genocidal. Iran feels that the U.S. is fighting on behalf of Israel. It does not matter whether or not this is true. This is what they believe.
The U.S. produces about 80 tomahawk missiles per year. The U.S. admits to having fired 850 of them at Iran. That is more than a decade of production.
Ron, let’s not forget the fruitcake’s partner-in-crime, Netanyahu. Jeffrey Sachs refers to them as the “folie a deux”.
Mike, I am not forgetting Netanyahu. He is just as stupid as Trump. Well… close anyway, after all it is very difficult to get any stupider than Donald Trump.
If Trump had lived 100 years ago, and had not inherited one dime. He would just naturally become the village idiot.
Good morning (evening) everyone!
I’m starting to develop a rather intense feeling of cognitive dissonance regarding the Iran War (Hormuz closure) and the oil price.
If at the end of last year someone had told me what was to happen these 90 days in 2026 and guess what the oil price (front month of WTI) would be at the end of May 2026, I’m certain my guess would have been significantly higher than $100.
And yet here we sit with WTI below $90, and the stock market making new highs, and its as if there are no significant problems heading our way.
Anyone else having trouble making sense of it?
The Atlantic has a good article about this paradox:
“The whole world expects President Trump to end the Iran war any day now. Trump keeps insisting that he’s in no rush to do so. Through it all, the oil markets remain surprisingly calm. These facts are all related.
When the war broke out, experts warned that if the Strait of Hormuz remained closed for more than a few weeks, oil prices would spike to $150 or $200 a barrel. The strait has now been closed for three months. Yet the price for a barrel of the most heavily traded type of crude oil sits at about $94, not so far from where it was in early March, shortly after the war broke out. Even after Trump’s latest declaration, in yesterday’s Cabinet meeting, that he felt no pressure to reach a peace deal (“I don’t care about the midterms,” he said), crude prices jumped by only 2 percent. “The math just doesn’t add up,” Rory Johnston, an oil-markets analyst who writes the widely cited Commodity Context newsletter, told me. “For people like myself who spend all day analyzing this stuff, we’re looking at prices wondering: Am I going insane? What is happening?””
That assumption is rooted in a deeper underlying belief: that Trump will inevitably back down once the economic pain gets high enough. This is the so-called TACO theory of Trump’s decision making, as in “Trump Always Chickens Out.” “The market has correctly realized there’s an audience of one who will determine the outcome of this, and that’s Trump,” Arnab Datta, a managing director at the think tank Employ America who specializes in energy markets, told me. “Among traders, the assumption is that the pain can only get so high before Trump retreats.”
That logic turns out to be dangerously circular. Prices are low because investors expect Trump to end the war before prices get too high; but because prices are low, Trump faces less pressure to end the war. In fact, the president seems to have figured out that he can calm the oil markets simply by gesturing at the prospect of a peace deal every so often. Of course, a peace deal or a new cease-fire could still be announced at any moment. But the dynamic between Trump and the markets—call it the TACO equilibrium—is what has kept the war going longer than almost anyone expected.“
https://www.theatlantic.com/economy/2026/05/oil-prices-iran-trump/687344/
Hi Nick,
Thank you for sharing the excerpt from that article.
It generally makes sense on a basic level:
1. Most market participants don’t imagine the conflict could go on for much longer.
2. Most market participants believe the flow of shipping/tankers through the Hormuz will rapidly return to normal once Iran and the US reach an agreement.
Does the article discuss point 2 in depth (how long it would take Hormuz oil exports to return to pre-war levels)?
Based on what I have heard, it is not just like flipping a switch, and that there are many factors will make it hard to return to that level by year end, if ever.
The realities/challenges in restoring flows “post agreement” might be worthy of discussion or sharing info here.
No, the article doesn’t deal with any lags or delays in restoring oil production & distribution.
The big problem here is that if the president never chickens out, the shortages/high prices will hit suddenly and with much greater harm to the economy than a smooth adaptation.
“ This strategy, analysts assured me, can’t last forever. Markets are starting to catch on. Johnston pointed out that the impact of Trump’s peace announcements on oil prices has been diminishing over time, as traders begin to recognize the pattern. Even more important, the law of supply and demand will eventually become unavoidable: Countries are running through their stockpiled oil reserves quickly and could begin to exhaust them over the next month. At that point, there won’t be enough barrels to go around, and buyers will start bidding up the price of the remaining ones. “It’s a ticking clock,” Gregory Brew, the Eurasia Group’s senior analyst for Iran and energy, told me. “We’re losing 13 million barrels of oil every single day. Eventually that reality is going to set in. And when it does, prices are going to rise very very fast.””
Hi Nick,
Thank you.
Yes, I’ve noticed none of the mainstream commentary I’ve seen touches on:
1. What things will look like if the conflict or Hormuz shortage continues long-term. They refuse to perform any analysis of what a long-term closure might look like.
2. Potential difficulties and time-lines in re-establishing normal production and transportation flows. They all seem to assume shipments just start right up the next day.
In Japan the Naphtha shortage became apparent first, and the govt continues to maintain that there is no shortage in spite of many users of end products reporting difficulty getting the products and materials they need in time to perform work.
Clearly they are trying to brush the risks/problems under the rug and hope that “Donald” (as Takaichi calls him) will get things back to normal before they have to tell people that we are headed for an uncomfortable rendezvous with a painful new reality.
.
Hello all,
I read this blog (and its comments) here and there, and regarding the current oil situation, something that strikes me is that the discussions seem to be very short term regarding Hormuz etc, but what about the projections of US production in 2027 28 (which isn’t so long term) ?
I mean lahérrere might be a bit extreme in his forecasts, but the peak/decrease in US oil production in 2027/2028 could be quite violent :
https://aspofrance.org/2026/02/01/new-us-oil-and-gas-production-update/
Or below a bit more recent, but I guess similar data :
https://aspofrance.org/2026/03/07/production-actualisee-du-petrole-et-gaz-des-etats-unis-damerique-jean-laherrere-17-fevrier-2026/
(also “scary” for NG)
Ok this might not be the “standard” view, although the EIA has also revised its forecasts down.
But my question would be to what extend do you think these “perspectives” have or have had an influence in the US admin diplomacy and actions ?
In the sense : time to secure some new sources.
For Venezuela it seems quite clear to me (although I really don’t know whether or not Trump(and his close admin) knows about the forecasts, and believes in its own “US has plenty” narrative).
But even for Iran : a regime change exit to the crisis and Western majors being allowed back in Iran could clearly add an area where production could grow.
But here again, I have no idea to what extend it is part of the reasoning of current US admin. Surely bringing Iran back in the “western camp” together with its oil resources is seen as a huge business opportunity, but is it also seen as “vital” to maintain “oil security” for the US in the coming years ?
Do you think somebody in the Trump admin has “realistic” views regarding the challenges to maintain US prod in the coming 2/3 years ?
Rex Tillerson for instance clearly had some “realistic” views I guess, somebody similar these days ?
Yves,
Trump does not listen to his advisors and few of them are willing to give him realistic assessments for fear of being fired. Trump is living in his own reality which is not fact based.
For US tight oil, see my scenario below with a URR=71 Gb, vertical axis is Gb per year (similar to Laherrere’s recent charts,) peak is about 3.5 Gb/year=9.6 Mb/d.
tight 2605b
Yves,
For World C+C here is an oil shock model from November 2025 with URR of 3000 Gb at link at end of comment. An explanation of the shock model can be found at link below
https://oilpeakclimate.blogspot.com/2015/02/the-oil-shock-model-with-dispersive.html
Note this early model used a lower URR of 2700 Gb based on analysis by Jean Laherrere from around 2013.
This piece from 2019 looks at a variety of possible future oil shock model scenarios
https://peakoilbarrel.com/oil-shock-model-scenarios-2/
An oil shock model from 2019 compared to EIA’s IEO 2019 at link below
https://peakoilbarrel.com/eia-international-energy-outlook-2019-and-oil-shock-model-scenarios/
oil shock 2511
Yves, if the US government was concerned about oil supply the 2 most important things they would have done are
-make a long term mutually beneficial agreement with Canada regarding oil production, pricing and transport. Instead the US chose an extremely adversarial and disrespectful approach, with Canada expanding export capacity to Asia instead.
-restrict export of oil and nat gas, in order to extend the life of domestic oil reserves.
They would also be filling the Strategic Reserve to the brim rather than emptying it out.
The policy has been shortsighted, misguided and helter skelter. And mean spirited.
Hickory,
The best policy to prepare for possible oil shocks would be…to reduce oil consumption and dependency. CAFE efficiency standards could be sharply increased – it was increased under democratic administrations. Instead this administration is sharply reducing CAFE and eliminating EV tax credits. Incredibly perverse and counterproductive.
The biggest and best adaptation the US made in the last 50 years? CAFE. CAFE increased MPG by 100% over about 15 years. If US average MPG were the same as it was in 1975 we’d be consuming 9MBPD more than we are…or trying to.
9M barrels per day. That’s more than tight oil has added.
How have oil benchmarks (WTI and Brent) been maintained at comparatively low levels?
There was a quick decision to begin aggressive early use of strategic stockpiles (= govt intervention in physical markets). And there has been a LOT of jawboning, “leaked” news articles of impending deals that never happened, and “well timed” trades that coincide with the leaked news.
But is that enough to push WTI below $90 after roughly 90 days of Hormuz closure?
There is some speculation that Western gov’ts or financial markets are *also* intervening in the futures markets during illiquid hours to yank down prices and trigger sell stops, as was likely done for decades in the gold and silver markets.
But I haven’t seen any strong evidence of direct financial market intervention.
In April, the Japanese government admitted it was considering intervening in the oil futures markets. The Reuters article also states the US had considered it, but “gave up” on the idea (maybe they changed their mind?):
https://jp.reuters.com/markets/japan/5QMIGCGYYZLHTCXWBD7OWC6DJE-2026-03-23/
[TOKYO, April 23, Reuters] – Japanese monetary authorities are consulting with several financial institutions regarding the possibility of intervention in the crude oil futures market, multiple market sources revealed on April 23.
According to one of the market sources, financial institutions have been inquired about specific methods of intervention in the crude oil futures market. Market sources believe the government is in the process of gathering information to explore the possibility of intervention. Government intervention in the crude oil futures market was considered by the United States in early March but was ultimately abandoned.
I think a long term closure of Hormuz (until end of August) will result in Brent oil prices around $250/b to $300/b.
In past years this site has invited bets on end of year production rates and prices.
Does anybody want to speculate on how much production has been permanently lost as a result of shut ins and formation damage.
I’d be interested to hear any informed speculation on this point……..
Look at my prediction from last year
117 end of year; 100 average.
I specifically cited Trump attacking Iran (they tried to assasinate him) and decline in Permian as the reason.
Story of my life…..always a year off.
Lightsout- No guess on that from me, but on a related note
I would be very interested to know
-What cargoes have Saudi, UAE, Qatar, Kuwait etc put on order for import related to oil/gas infrastructure repair? I suppose some equipment like valves and pumps could be flown in at greater expense.
-How serious is the damage to the various Russian oil infrastructure…quick or long repair?
Further aside- I wonder if the Gulf nations are seriously rethinking the relationship with the US. Did allowing the US to use their land for bases and military operations do them net good? Now they will at constant threat from Iran. Maybe they’d be better off partnering with China as a stabilizing force.
Andre,
I didn’t think Trump would be dumb enough to attack Iran, but here we are. Really a clown show at the White House these days.
Regarding production loss after a shut-in I have been thinking about that too, but there is also an effect of less consumption for some period due to higher prices that might mask it a bit, for some time at least. Unless the MOL is breached at some point of course, then most, but not all bets are off.
But eventually the production/consumption numbers will match over a longer sample period, so potential effects will be felt, but possibly after some time.
Traditionally oil price shocks have simplycaused damage to economies without much hope of correction. If you buy a gas guzzler when oil prices are low, you just have to accept the added costs when prices spike, because you can’t just go out a buy a new car. You miught not get one before prices fall again. Commodity price volatility moves much faster than investment can.
Solar is changng that. The current LNG shortages are being met with a huge upturn in solar panel and battery installation. These systems are extremely fast and easy to set up. Furthermore they are competitive when gas prices are low. Many consumers are switching away from gas in time to deal with the current crisis, and probably won’t switch back when it’s over.
So I expect this oil crisis to play out somewhat differenty than previous crises.
In the last few years I moved my personal energy consumption away from fossil fuels as much as possible. EV, solar panels, 20KWh battery , and in February, a heat pump to replace my natural gas furnace. By using arbitrage and time of day charging from my utility company, I have cut my energy and fuel bills by 80% here in the UK, which reportedly has the highest electricity prices in the major economies of the world. I expect my total bill in 2026 to be about $500 or less. It was expensive to buy the hardware, but I will not feel the direct effects of price rises or fuel shortages. The indirect effects, unfortunately, are beyond my control. I have also helped my wife move her pension savings out of stocks and into long term bonds.
“Supermajor Warns Oil Prices Could Hit $160 Within Weeks”
https://oilprice.com/Energy/Oil-Prices/Supermajor-Warns-Oil-Prices-Could-Hit-160-Within-Weeks.html
Getting close.
Most people have no idea how slowly it will be to get the ball rolling up to full function once the SOHormuz ‘reopens’. A solid two to three months minimum to get refinery tanks around the world to reverse the drain mode so many are currently in-
“It will take at least four months to get back to 80% of pre-conflict flows, and full flows will not return before the first or even second quarter of 2027,” Adnoc chief executive Sultan al-Jaber said during an Atlantic Council event on May 21.
Surprising to see that oil companies such as Chevron, Equinor and Petrobras stocks are back down to a level they were at 6 weeks ago.
Hickory,
By the end of June, the market will stop believing Trump’s bullshit, oil prices will skyrocket when it is realized that the president has no clothes.
Just read the piece you linked, it is excellent, I encourage everyone to read it. Several Major CEOs and many analysts are on the same page now, once this becomes common knowledge, prices will rise to at least $160/bo, once nations panic and start to refill SPR it may go to $250/b or more. A recession might reduce demand and keep oil prices under $200/b, we will see.
Watch Berman’s talk on Daniel Davis’s channel to get a picture of what it would take to get ships moving again.
Your hair is sure to fall out.
I watched CVX CEO Mike Wirth on Bloomberg TV this morning. Impressive interview.
He brought up a point I’ve wondered about but nobody in the media is reporting on.
First, the assumption is when the SOH opens the stranded ships will depart, and this will take some time. But you have no ships going in for quite awhile. Wirth is concerned few shipping companies will allow ships back in, at least for a considerable period of time.
Wirth said CVX has 6 cargoes stranded. He also said that there have been shots fired at ships that haven’t been reported on by the media.
Wirth also discussed Venezuela. Right now CVX is operating on a temporary agreement where it is being paid back a debt the Venezuelan government owes it through oil sales. Once the debt is paid back, Wirth said there is no agreement going forward yet on royalty and tax structure.
Good interview.
DC,
Do you actually see this scenario playing out ? IRGC knows the longer they hold out the higher the leverage, but don’t you think a half-assed deal will be made to prevent such a scenario ?
Iron Mike,
I do not know what will happen. I think Trump may not make a deal as the deals being offered by Iran look very much like a US surrender, I doubt a deal occurs before the end of August, but I am wrong all the time, this may be one of those cases. We will see.
I would like to bring up a point that I have only seen Ron P mention, that no one ever considers.
I am sure to get this wrong, so please correct me.
Oil companies ( I think in Saudi Arabia atleast ) have been using advanced reovery techniques for decades.
I think it is called “creaming”.
This pulls forward the production but lowers the ultimate recovery of the well.
This has been going on for decades ( I think ).
Can anyone comment on this? When will this kick in?
Al Jazeera:
Why Oil Doesn’t ‘Restart’
https://t.me/eroipeakoil/2286
Strange how close to the same 3/26 EIA monthly was to 2/26, even state by state.
Rig Report for the Week Ending May 29
– This week’s rig count has reversed the previous three weeks trend of rising rig counts.
The dropping rig count that started in early April 2025 when 450 rigs were operating dropped this week. Drilling continues at a steady rate of 367 ± 5 rigs per week since August 2025 while WTI closed at $87.54/b, down $9/b from last Friday.
– US Hz oil rigs dropped by 6 to 371, down 79 since April 2025 when it was 450. It was also up 9 rigs from the low of 362 first reached in the week ending August 1, 2025. The rig count is down 18% since April 2025.
– The New Mexico Permian rig count dropped by 5 rigs to 74. Eddy rose by 1 to 34 while Lea dropped by 6 to 40. As a side note the Rig report showed that 11 directional rigs were added to Eddy county for a total of 14. Not clear if this is an error or correct. Will check again next week. Could these rigs be drilling U shaped wells?
– Texas was unchanged at 192. Midland and Martin were both unchanged at 22 and 24 rigs respectively.
– Eagle Ford was unchanged 32.
– NG Hz rigs were unchanged at 106.
A Rig
Frac Spread Report for the Week Ending May 29
The frac spread count rose by 3 to 192. From one year ago, it is up by 2 spreads but is still down by 23 since March 21, 2025. The Frac Spread count has now increased for 6 weeks in a row.
A Frac
US Oil Production was flat in March
A US
“Our Billionaire Overlords, tired of playing with their rockets, now want computers that will see into the future and allow them to shape the future into a Billionaire’s Shangri La.”
Amazing how they are even getting the public to pay for their digital prison by launching these giant IPOs of money-losing ventures (SpaceX, Anthropic, OpenAI) right at the peak of a historic bubble.
I would not be surprised if the stock market peaks and oil starts being allowed to find an appropriate (higher) price level once enough of the public’s money has been sucked up into these companies via the IPOs.
Just read this
https://x.com/DarioCpx/status/2060052305907704058 where it claims MOL for US commercial crude is about 380 Mb, for SPR the MOL is about 150 Mb. Based on most recent EIA weekly report US has usable crude stocks of about 177 Mb above MOL, in the most recent week the crude stock draw was 12.4 Mb, if that level of stock draw continues the US will be at MOL (minimum operating level) for crude stocks in just over 14 weeks (14.27) or roughly mid-September.
Note that Asia has already reached MOL, Europe is fast approaching MOL, the shit hits the fan very soon and the US won’t be able to make up the difference, maybe Canada will come to the rescue?
Dennis
Canada does not have an SPR and is not capable of ramping up its oil production rapidly. A reasonable pace for Canada is around 100 kb/d/yr. Not clear for how many years.
Thanks Ovi,
I didn’t really think Canada could help much, will higher oil prices (say $150/b) lead to faster growth in output? My guess is not much, but you would probably have better insight.
Dennis
Right now there is a lot of concern with CC and the price producers have to pay for the carbon that is emitted. Ottawa and Alberta have come to a tentative deal to lower the carbon pricing structure that Trudeau brought in.
“The federal government and the Alberta government are nailing down a deal on industrial carbon pricing, largely considered Canada’s most important policy for driving down harmful greenhouse gas pollution.
CBC News has confirmed that both levels of government have agreed that Alberta’s effective carbon price would increase to $130/tonne by 2040.”
https://www.cbc.ca/news/politics/alberta-mou-carbon-pricing-9.7197919
Alberta is having a vote on a referendum question in October on whether Alberta should consider separating from Canada. If the answer to the question is Yes, then a separate vote will be held on a formal question to separate from Canada.
Trudeau did not like the oil sands and his environment Minister wanted them shut down. This really alienated Albertans. Carney has sought to roll back those harsher CC rules. One result is that Trudeau’s former environment minister resigned from the government last week. Terrible time to have a referendum on separation.
Ovi,
Maybe Alberta can become the 51st state? 🙂
Energy Secretary Chris Wright claims that in the past 30-45 days, US is back to #1 crude exporter in the world and along with #1 LNG or natural gas exporter.
some of the export probably is generated by mixing shale light tight oil/condensate with Venezuela import heavy.
There is a news says that this diluting of Orinoco heavy only started in March, and could accelerate like never imagined.
https://energynow.com/2026/03/venezuela-resumes-exports-of-diluted-crude-oil-after-15-month-pause-document/
Sheng Wu,
The piece you linked has very little data, it says a single cargo of 0.5 million barrels was sent to the US Gulf coast. This is an insignificant quantity. Venezuela only produces 1000 kb/d, it matters very little if it is exported from Venezuela or the US, maybe Venezuela’s crude output will increase rapidly, I will believe it when I see it.
US crude net exports in the most recent week were -772 kb/d, see
https://www.eia.gov/dnav/pet/pet_move_wkly_dc_NUS-Z00_mbblpd_w.htm
Product net exports are pretty high (6613 kb/d), but a significant portion of this is propane (about 39% of total product net exports is propane.)
see the sharp spike in the historic plot here,
https://www.eia.gov/dnav/pet/hist/LeafHandler.ashx?n=PET&s=WCREXUS2&f=W
the key is to control the trading, with import from Venezuela increase, just adding some diluents and export at higher margin, while control the SOH oil flow, the US will be effectively controlling 35% of the global crude trade — that’s exactly Trump is bragging about.
Sheng Wu,
Trump is not very smart, the price of oil is determined on World Markets, a shortage of petroleum will crash the World economy.
Also note that the focus needs to be on net exports, if the US exports a million barrels of condensate to Venezuela, then that condensate is blended with 2 million barrels of extra heavy oil and then this 3 million barrels is imported to the US, the net imports are only 2 million barrels, the important number is the output of C+C, that number is not changing very much so far. With SOH closed total World C+C production is down by at least 8.5 Mb/d, about 10%. of World C+C output, World petroleum stocks will be down to minimum operating levels within 7 months (December 2026) unless oil price increases destroy some oil demand.
It does not look like a deal will be reached with Iran by the US in the short term.
Sheng Wu,
See link below for net imports of crude by the US, that is the number that matters
https://www.eia.gov/dnav/pet/hist/LeafHandler.ashx?n=PET&s=WCRNTUS2&f=W
It has deceased a bit.
Exports of crude have increased by about 1 Mb/d, while crude stocks have decreased bu nearly 2 million barrels per day over the past 4 weeks.
So the US is exporting its petroleum reserves, from the perspective of many US citizens this seems unwise.
Sheng Wu,
For the past 7 weeks US crude oil stocks (including SPR) decreased by 71244 kb, while US crude oil exports increased by 63791 kb compared to the preceding 7 weeks, so about 89.5% of the stock draw is being exported, the other 10.5% of the crude oil stock draw is being used to reduce crude oil imports for the most recent 7 weeks in comparison to the preceding 7 week period.
In 27 weeks (just under 7 months) the US crude oil stocks will reach the minimum operating level, if the stock draw continues at the rate of the past 7 weeks.
Not a smart move to export a nations emergency reserves of crude oil.
Wait! So OPEC has the liquid balance for 2025 at negative 400 kbpd? This is in drastic disagreement with IEA and others. Also, most satellite trackers showed pretty substantial builds in 2025. I don’t trust that figure one bit. I think it was more like +600kbpd… So 1Mbpd off.
One month before the Statistical Bible of Energy comes out for 2025. It will be interesting to see their number.
Kdimitrov,
There are different estimates out there, OPEC tends to be very optimistic about demand. Their estimate for 2025 World petroleum demand is about 1.2 Mb/d higher than the EIA estimate and the IEA estimate (both are around 104 Mb/d for 2025.) I think you are probably correct that the OPEC estimate may be too high. Notice the high miscellaneous to balance category in the IEA stocks, about 1.2 Mb/d of the 2.1 Mb/d stock build.
It is possible this “miscellaneous” stock accounts for an underestimate of World demand by both the IEA and EIA and that the OPEC estimate is more accurate.
Also note that the OPEC estimate for 2024 world petroleum demand is about 0.5 Mb/d than the IEA estimate.
In any case the numbers are surely uncertain. Note that last year’s Energy Institute “Bible” had World liquids consumption in 2024 about 0.9 Mb/d higher than the OPEC estimate from December 2025. So we will see.
Art Berman claims 700,000 barrels a day will never come back in the Persian Gulf. He also says if all political problems stopped today, one might expect 45% of pre-war traffic to go through the Persian Gulf in a year: https://www.youtube.com/watch?v=IyVUgJ_5H5k
DC,
Thank you for digging into the topic of minimum inventory levels required for the system to keep operating! I think I follow your math and it appears reasonable based on the publicly available data I can see. I expect that the uncertainties around this are quite large. I suspect the clock is running out even faster than you suggest, in part because at some point there may be a reluctance for state actors to completely draw down SPR stocks and leave their militaries dry.
T Hill,
You’re welcome. I agree the uncertainty is very high on these estimates.
I too am shocked at how low the price of oil is now, and that oil company valuations are where they were before the war. Even at $100/barrel, oil is much less expensive than, for example, back in 2008 when it was $150/barrel. Even oil services firms have valuations that are not too high.
Is the current price insufficient to open up much more production?
Also, I would imagine that Gulf states would be working like mad to build pipelines that bypass the SOH. Is that not the case?
Only Saudi Arabia and UAE can easily bypass SOH with pipelines, Iraq has some potential to do so, but these projects will take time to implement. Also they are vulnerable to attack by Iran.
I would guess the current oil price is due to a variety of factors:
*Verbal jawboning
*”Leaked” deal news headlines + shorting during illiquid hours to punish longs
*Obsession with tech/AI and failure to realize magnitude of Hormuz problem
Unfortunately, with WTI below $100, it is not sending the right “drill baby drill” signal to the market. Companies are probably hesitant to aggressively ramp up investments in drilling at current price levels.
Eventually as we get closer to minimum inventory levels in local areas, things should become more interesting.
Rystad: U.S.-Iran Re-Escalation Could Drive Oil To $180 By August
https://oilprice.com/Latest-Energy-News/World-News/Rystad-US-Iran-Re-Escalation-Could-Drive-Oil-To-180-By-August.html
It does not look like negotiations with Iran are going well
https://oilprice.com/Latest-Energy-News/World-News/Oil-Prices-Up-3-As-Trump-Demands-Changes-To-Iran-Deal.html
Thanks for the link DC.
The first link reporting the Rystad forecast also notes the recent Goldman analyst note “that rapid demand destruction caused by high crude prices is heavily countering the risk of severe Middle East supply shocks.”
It seems like the simplest metric to judge how the world is or is not able to adapt is net stock build/drawdown. The IEA report for March and April shows drawdown at a pace of 4mbd. That certainly seems to indicate that at least short term adaptation is not sufficient to balance this supply shock.
“ short term adaptation is not sufficient to balance”
Well, oil prices are not very high – they’ve been talked down by this president claiming, every 15 minutes, to be on the edge of a diplomatic breakthrough. A lot of adaptation (both on the supply and demand sides) isn’t happening because of this constant PR effort to convince people this is a very short term problem.
Supply and consumption will balance in the short term when prices rise further. How painful that is, and whether it hurts the world economy, will depend on whether governments are smart or stupid. So far they’ve been muddling through: too many are trying to ignore the basic problem and trying to keep prices low to keep their citizens happy. They’d be far smarter to level with their citizens, allow prices to rise, and implement limited rationing where price signals don’t work well (like new vehicle purchases, which tend to come from the most affluent) and subsidies only for the truly low income. Pushing efficiency, like telecommuting, carpooling, lower travel speeds, etc, and substitutions like solar power, EVs, induction cooking, heat pumps,would go a long way.
Thoughtfully regulated decentralized free markets are very efficient. Allocation and distribution by fiat is (mostly) extremely inefficient and creates large, weird shortages which do indeed hurt economies. Export controls, price controls, badly planned rationing can do a great deal of harm.
One small example: the lines of people at gas stations in the late 70’s were largely created by panic hoarding (filling 200M gas tanks all at the same time) which was amplified by rationing (alternate day allocations, etc).
T Hill,
Consumption estimates and stock estimates are not very reliable. Demand will probably fall more as oil prices rise. Keep in mind that their are at least 3 opinions for each economist in the World on how this will go, basically nobody knows. Rystad does pretty good work, also many major oil company CEOs have been sounding the alarm on how bad things might get if Hormuz doesn’t open. Also keep in mind there has been a 400 million stock release by IEA nations and China has been reducing imports of crude and probably drawing on its stocks as well. Eventually the stocks run down to MOL, then we see consumption reduced to output levels and forced there by very high oil prices. The $180/b estimate seems pretty reasonable if the SOH stays closed until October. We will have to wait and see.
Very good lecture about shale oil in US and exports: https://youtu.be/xNWLzfPnCuI?si=gBjQ8QjwSppamnae
The “Drill baby drill” camp view the “PEAK SHALE” or “Export All US can today” as a bridge to regain premium control of crude oil — trade of the low-cost barrels, i.e. Venezuela and Iran and maybe Russia.
Sheng Wu,
These people (the drill baby drill crowd) think draining the US dry of its energy resources is smart policy, it is not. The US is a net importer of crude oil, as shale oil peaks and declines, US net imports of crude oil will increase.
See
https://www.eia.gov/dnav/pet/hist/LeafHandler.ashx?n=pet&s=wcrntus2&f=4
The recent decrease in US crude oil net imports is due to a big stock draw from US crude stockpiles.
Looks like we have Jeff Currie live on Zerohedge in about 15 minutes:
https://x.com/i/broadcasts/1RKZzzpLaqoKB?s=20
Maybe someone can get in there and ask him his thoughts re when we start hitting minimum operating levels.
https://mishtalk.com/economics/exxon-warns-of-150-crude-here-are-the-supporting-charts/
Exxon says 150 ……. says we are at record low fuel levels
They must have read my prediction from last year.
The interesting question is if Trump will capitulate, Mish believes he will, I think this is correct eventually, but I think it only happens after oil prices spike to $150 or maybe $180/b and stay there for 2 to 4 weeks.
Trump will try to talk oil prices down by saying a deal is around the corner, but the oil market will no longer believe Trump.
Even at $150/barrel, oil is not as expensive as it was back some 20 years ago.
The peak was $147 (for WTI) in mid-2008. Inflation in the 18 years since then has been 55%, which brings it up to $228 in today’s dollars.
I don’t recall too much angst back in 2008 at the high cost of oil. There was a tiny draw on the reserve back then, but it was pretty much at its peak.
WTI at the current price of $91/barrel, seems crazy inexpensive given the Russia-Ukraine and Iran wars. And at that price there seems little incentive to “drill baby, drill”. The world appears to be awash in oil.
The low oil prices are an illusion, as World stocks approach minimum operating level we will see oil prices rise. The World is being fooled by large stock draws of crude oil, the stocks will run low and oil prices will rise unless Trump capitulates in order to open the Strait of Hormuz. I don’t think he will do it and when the market realizes this, oil prices may rise.
A great analogy, for those of us old enough to remember Peanuts, is Lucy holding the football for Charlie Brown to kick. Trump keeps saying he’ll hold the football this time (they really want to make a deal) and financial markets keep believing him.
I think we are in a situation similar to that of 2008: A contraction in oil demand indicates a decrease in economic activity (canceled flights, 4 day school week in the Philippines, etc). This makes it more difficult to pay back debts (Tverberg). At the same time higher oil prices are sparking inflation making it difficult to justify lower interest rates. If I were a betting man, I would be short the market.
I feel a huge gap in perception with the mainstream narrative/assumptions on the following points:
1. There is an assumption that the flow of trade through the Hormuz “must normalize soon.”
This is a false assumption. There is no reason why this absolutely “must” happen.
2. There is an assumption that the major players/powers “want to normalize trade through the Hormuz.”
What if that is the opposite of the truth, and the major players (Iran, US, Israel) have no interest in normalizing trade flows, or even worse, have hidden motivations to maintain the limited flow through the Hormuz?
This is going to be an interesting year of discovery…………
THC,
It looks lately like Netanyahu is trying to prevent this president from declaring victory and going home – he’s continuing to attack Lebanon in a way that is calculated to keep Iran from participating in any kind of peace deal, especially one that gives this president any kind of fig leaf for giving up (like an open Strait).
Its not real hard to understand the Israeli motivation- Simply do what ever it takes to avoid extinction.
The Islamic Republic of Iran (government) has made it crystal clear over the past 47 years that erasure of Israel from the map is a paramount goal, even to extreme detriment of the citizens of Iran, Lebanon and the Palestinian people it has turned out. The Iranian government actions since 1979 have enabled the extremists on all sides- Hezbollah, Hamas, Israel- to flourish.
I wonder how important that goal of Israel destruction is to the citizens of Iran.
Israel doesn’t have a viable off ramp in this world.
For Iran, its a 100% optional project.
The tail wags the dog. Netanyahu clearly has something on Trump and in fact the entire U.S. government. Any other country defying Trump gets immediately hit with sanctions, tariffs, and any possible levers of power the U.S. has. Israel is using U.S. weapons to attack Lebanon. The U.S. could stop these attacks in an instant by suspending U.S. aid to Israel and ceasing to supply them with the weapons they are using.
What is congress doing? They are debating H.R. 8445 which would extend U.S. veterans rights to U.S. citizens who fought for the IDF. They are also considering integrating Israel into the pentagon’s military technology research: https://responsiblestatecraft.org/israel-us-military/
Schinzy- I ask ‘then who would stop Hebzollah’.
I’m simply pointing that Israel has very strong motivation to disarm Hezbollah, Hamas, and other similar groups, as best they can manage. I sure as hell wouldn’t want to trade places.
‘The 1985 Manifesto: In its first open manifesto, Hezbollah declared that its struggle would not end until the State of Israel was obliterated’
‘the eradication of Israel is a primary and foundational goal of Hezbollah. The Lebanese militant group and political party has been officially committed to the destruction of the Jewish state since its founding in the early 1980s’
From my Email
Jean Laherrere
4:09 AM
dear all
new paper
“Fossil fuels production forecast”
https://aspofrance.org/2026/06/03/fossil-fuels-production-forecasts-2/
comment is welcome
best
https://oilprice.com/Energy/Crude-Oil/US-Crude-Oil-Inventories-in-Freefall-EIA.html
Also see
https://ir.eia.gov/secure/wpsr/overview.pdf?Policy=eyJTdGF0ZW1lbnQiOlt7IlJlc291cmNlIjoiaHR0cHM6Ly9pci5laWEuZ292L3NlY3VyZS93cHNyLyoiLCJDb25kaXRpb24iOnsiRGF0ZUxlc3NUaGFuIjp7IkFXUzpFcG9jaFRpbWUiOjE3OTg3Nzk1NDB9LCJEYXRlR3JlYXRlclRoYW4iOnsiQVdTOkVwb2NoVGltZSI6MTc4MDQ5NzAwMH19fV19&Signature=L8L5OdBG2v4B10rjfcxUIJd2yESK50aDVTljUr9ZdlsiDS4GhQFBK2oBIpz5K8NIpIJPc2Cyerl-PfMaxJauP8pAcTubXr7J9AA1eeEb1cgH679TAyIyKwwDsDSMuvwDcsH7A-GAceh~SJjc31VmUV8rJuPVuA4mkjo52IxDm~b7FzeVH6BvP9P-xPaEMYnEMMWnkwSI9OexB4TBWJIbR264fipIQ4QPkxH6ttN8qYe7NZn9LtUrfs5U8jSNZjvWy5hgbm7b4SV5zs97vG1xE6mMlI~Zal85yxqFfV0e7-QCoVHaQBLwrcZpl1mGfRK1AKiiKAGOCPxIiSivui8I6A&Key-Pair-Id=KIOCHB5SW09FS
Where SPR plus US commercial crude stocks decreased by 16 million barrels for week ending May 29, 2026. The US is about 280 million barrels above minimum operating levels for Crude stocks (including SPR), so if the stock draw continues at the level of the most recent week reported, we would reach minimum operating levels in 123 days or roughly 4 months, around September 30.
https://www.msn.com/en-us/news/world/trump-s-bizarre-negotiation-tactic-in-iran-war-exposed-by-bbc-expert/ar-AA24fikS
I agree with this piece’s assessment that a deal is not close.
Also
https://oilprice.com/Energy/Crude-Oil/A-Barrel-Trapped-Behind-Hormuz-Isnt-Spare-Capacity.html
Only oil that can reach consumers matters. Spare capacity in the Persian Gulf matters little when the Strait of Hormuz is closed.
The Oil Market has its head in the sand it seems.
One final piece on stress level vs operational minimum
https://www.msn.com/en-us/money/investment/world-oil-inventories-falling-fast-towards-hard-operational-floor/ar-AA22UWsi
Here’s an interesting claim:
“ China’s oil demand has dropped 9%, or roughly 1.5 million bpd, as consumers shift to EVs; the key question for the market is how much of that demand comes back once the conflict ends.”
That would be a significant change for China in just 3 months. Raises the question of how much oil consumption is being reduced elsewhere in the world by a shift to EVs, especially 2 and 3 wheel versions. I read about people using electric scooters and recharging by just carrying the LFP battery (much lighter than lead) up to their apartment and charging it there.
And, as they say, the following question is whether people will shift back from electric when oil prices revert.
https://oilprice.com/Energy/Oil-Prices/How-Long-Can-Demand-Destruction-Keep-a-Lid-on-Oil-Prices.html
“Raises the question of how much oil consumption is being reduced elsewhere in the world by a shift to EVs”
Yeah, that’s an interesting one. The IEA estimates this in its yearly releases of EV outlook reports. The last one (https://iea.blob.core.windows.net/assets/3718cf37-fac6-4ee2-aeb0-1546e6222cfc/GlobalEVOutlook2026.pdf – page 259) indicates 1.7Mbpd displaced as of 2025 by the global stock of EVs. 2026 and the current crisis will boost this (I personally made the switch in March 🙂 ).
I don’t think 2-3 wheelers account for much of the oil consumption (2-3% if memory serves).
I still believe that Trump will leave the Gulf in a heavily unstable condition. Iran may agree to a quiet period where they can recover economic footing, and rebuild their military capability in preparation for the next phase of exerting control over the gulf shipping and working on the long term goal of erasing Israel.
The other gulf nations will enter the local arms race with urgency they never had to adopt before.
The rest of the world will have a long term job of adapting to world where gulf shipping is no longer a reliable part of economic planning, and where the US is even more clearly not a reliable (trustworthy or smart) partner.
“Just in time” production has become “just in case” production.
Things are going to be picante/spicy over there for the foreseeable future!!!
Hey all,
Another day of waking up to find the Hormuz is still closed, and oil is still near $100/barrel. Amazing……
Anyway, I’ve noticed Art Berman’s tweets have started to diverge from his long-format work. He was until recently calling for shortages and price spikes later this year, but it now backing away from that based on last 24 hours of activity on twitter.
Here are a few samples:
1. Demand destruction more that imagined:
https://x.com/aeberman12/status/2062515881423278556?s=20
2. Local shortages are not a sign of broader trends (inventory declines)
https://x.com/aeberman12/status/2062502440499294706?s=20
3. “A few months of inventory data now provide a clearer picture, suggesting some concerns were overstated”
https://x.com/aeberman12/status/2062496828667384260?s=20
4. “Markets have learned how to absorb shocks” & “The Hormuz crisis is serious. But this isn’t 1973”
https://x.com/aeberman12/status/2062486041173323881?s=20
=============
Given how the stock markets keep making new historical highs, I personally think the global community is severely underestimating the seriousness of the Hormuz closure.
I don’t think Art is helping by reversing his position.
We need more awareness, not less.
One thing we might keep in mind — a global hydrocarbon shortage/panic would be a convenient way to drive society towards “sustainable” fuels.
Here is a UK Sustainable Aviation’s report about decarbonization of flight:
NET ZERO CARBON ROAD-MAP
SUMMARY REPORT
https://www.sustainableaviation.co.uk/wp-content/uploads/2023/04/SA9572_2023CO2RoadMap_Brochure_v4.pdf
“We remain committed to cutting carbon emissions from UK aviation to net zero by 2050.”
Which also means, less travel (for the ordinary folk):
“Reduction in projected aviation activity of 14.3% is expected in 2050 because of the costs of
decarbonisation associated with the purchase of carbon credits, greenhouse gas removals (GGRs) &
Sustainable Aviation Fuel (SAF).”
If the true goal is to keep Hormuz permanently closed, this agenda is one potential explanation/rationalization
~~~~~~~
Absolute Zero
2019 University of Cambridge
https://www.repository.cam.ac.uk/bitstream/handle/1810/299414/REP_Absolute_Zero_V3_20200505.pdf?sequence=9&isAllowed=y
(From table on pages 6/7)
**Flying**
2020-2029: All airports except Heathrow, Glasgow and Belfast
close with transfers by rail
2030-2049: All remaining airports close
**Road vehicles**
2020-2029: Development of petrol/diesel engines ends; Any
new vehicle introduced from now on must be
compatible with Absolute Zero
2030-2049: All new vehicles electric, average size of cars
reduces to ~1000kg.
**Fossil fuels**
2020-2029: Rapid reduction in supply and use of all fossil
fuels, except for oil for plastic production
2030-2049: !!!Fossil fuels completed phased out!!!
I assume most here are sufficiently aware of EROI concepts…..that if they eliminate crude oil/natural gas and switch entirely to hydrogen/solar etc……there will barely be any net energy for society.
I wonder if Cambridge also published a roadmap to reduce population to match he reduction in net energy availability???
THC
That is not at all clear, with recent research suggesting otherwise.
THC- “If the true goal is to keep Hormuz permanently closed, this agenda (sustainable fuel replacement of fossils) is one potential explanation/rationalization”
I think this paints the picture poorly/backward.
Diminished reliability on the gulf product shipping results in a big tailwind for all sorts of other energy sources, whether it is coal, or solar, or nucs, or biofuels, and certainly deployment of electric vehicles and batteries. It also favors oil sourced from other regions, such as South America.
But these things are repercussions of the Gulf disruption and not a motivating cause.
Hi Hickory!
Well, let’s say you wanted to accelerate/force the switch from crude oil to electricity/alternative energy sources — making crude oil less available by shutting down a major supply artery is logical.
(However, this would never be admitted to the public.)
THC,
That’s a conspiracy theory. Conspiracy theories are attempts to explain things that don’t make sense. Sadly, there are many things in the world that are simply random, and many things that are just the result of incompetence.
The Iran war is simply the result of incompetence.
—————————————-
A few other thoughts:
-There are a lot of different net-zero plans and strategies: some make sense and are realistic, some don’t and are not. The plans of the aviation industry do not appear serious to me, especially the reliance on biofuels.
-I agree with T Hill – solar, wind, hydro, geothermal, even nuclear: all have perfectly adequate E-ROI. This has been clear for some time. Serious people, like the leaders of Germany and China, don’t invest in things that don’t produce adequate net energy.
-Many alternatives to oil & gas will be incentivized by the Hormuz Nuz. The ones that are most competitive will persist after the blockade fades – that very likely does not include coal, biofuels and nuclear. Coal is understandable in the short term, but it will go back to being a pariah. Nuclear isn’t competitive, and is very likely simply a short term place to drop subsidies on connected cronies. Other slush funds will replace it.
Hi Nick,
I try to keep an open mind. Sometimes things that don’t make sense from a conventional perspective can make sense if one looks at them through a different lens.
Anyway, another possible factor in the low oil price — authoritative news sources are telling the public that oil from the Hormuz is no longer a serious matter.
~~~~~~~
NY Times – The Strait of Hormuz Is Getting Less Dire by the Day
https://www.reddit.com/r/oil/comments/1twkix5/ny_times_the_strait_of_hormuz_is_getting_less/
“……with every passing day, the world is learning to live without the Gulf’s seaborne exports…..”
Jet Fuel Crisis Update: European Top 50 & Top 20 Non-European Countries – 31 May 2026
https://www.bostonwarwick.com/blog/jet-fuel-crisis-update-31-may-2026
From the free download:
The most at-risk European airports in terms of days of on-site inventory.
London/Gatwick: 5 to 8 days
Milan: 6 to 9 days
Heathrow: 7 to 10 days
Frankfurt: 7 to 10 days
Park CDG: 8 to 12 days
According the non-European list (in the main article):
Manila/Cebu: 5 to 8 days
Sydney/Melbourne: 9 to 12 days
LA/SF: 7 to 10 days
https://www.bostonwarwick.com/europes-top-50-jet-fuel-risk-airports-full-dataset
June 03, 2026
INTERVIEW: Mercuria shipping head says fuel shortages could idle 10% of global fleet
https://www.spglobal.com/energy/en/news-research/latest-news/refined-products/060326-interview-mercuria-shipping-head-says-fuel-shortages-could-idle-10-of-global-fleet
Since the Middle East war erupted, markets have been preoccupied with potential shortfalls in the diesel and jet fuel traditionally exported in large quantities from the Persian Gulf.
However, as refiners strain to capture soaring clean product cracks, residual fuels have suffered. Increasingly, feedstocks have been held back from the marine fuel market to kept for further processing, leaving the shipping sector at risk of crippling shortages, Johnson said.
“My view on marine fuel oil is there will be regional stock-outs by July and that there are potentially outages in the major hubs by August, September, at the latest,” Johnson said.
Unlike other sectors, the shipping industry lacks a buffer of state reserves to manage emergency crises.
“For marine fuel oil, there’s no buffer. There’s nothing. So once you’re out, you’re out. And then ships will have to try to buy diesel fuel, for example,” Johnson said.
Should trade disruptions last another month, Johnson says mass fuel shortages could trigger trade congestion on the scale of the Covid-19 pandemic – shutting down as much as 10% of marine traffic.
As vessels jostle for limited supply, lower-margin segments like dry bulk are most likely to be caught short, he said, potentially exacerbating challenges for agricultural sectors relying on fertilizers for next year’s crops.
An updated string on US March Oil Production has been posted
https://peakoilbarrel.com/us-march-oil-production-flat/
FWIW Morgan Downey has a live net oil-importer strategic reserve exhaustion clock/timer:
https://oil101.morgandowney.com/chapters/iran-strait#outlook
Current forecast is for appx. July 7, 2026
Good link THC, excellent summary of the SOH situation