By Ovi
The focus of this post is an overview of World oil production along with a more detailed review of the top 11 Non-OPEC oil producing countries. OPEC production is covered in a separate post.
Below are a number of Crude plus Condensate (C + C) production charts, usually shortened to “oil”, for the oil producing countries. The charts are created from data provided by the EIA’s International Energy Statistics and are updated to Febuary 2026. This is the latest and most detailed/complete World oil production information available. Information from other sources such as OPEC, IEA, STEO and country specific sites such as Brazil, Norway, Mexico, Argentina and China is reported to provide an extra one or two months production preview beyond the EIA’s latest report.
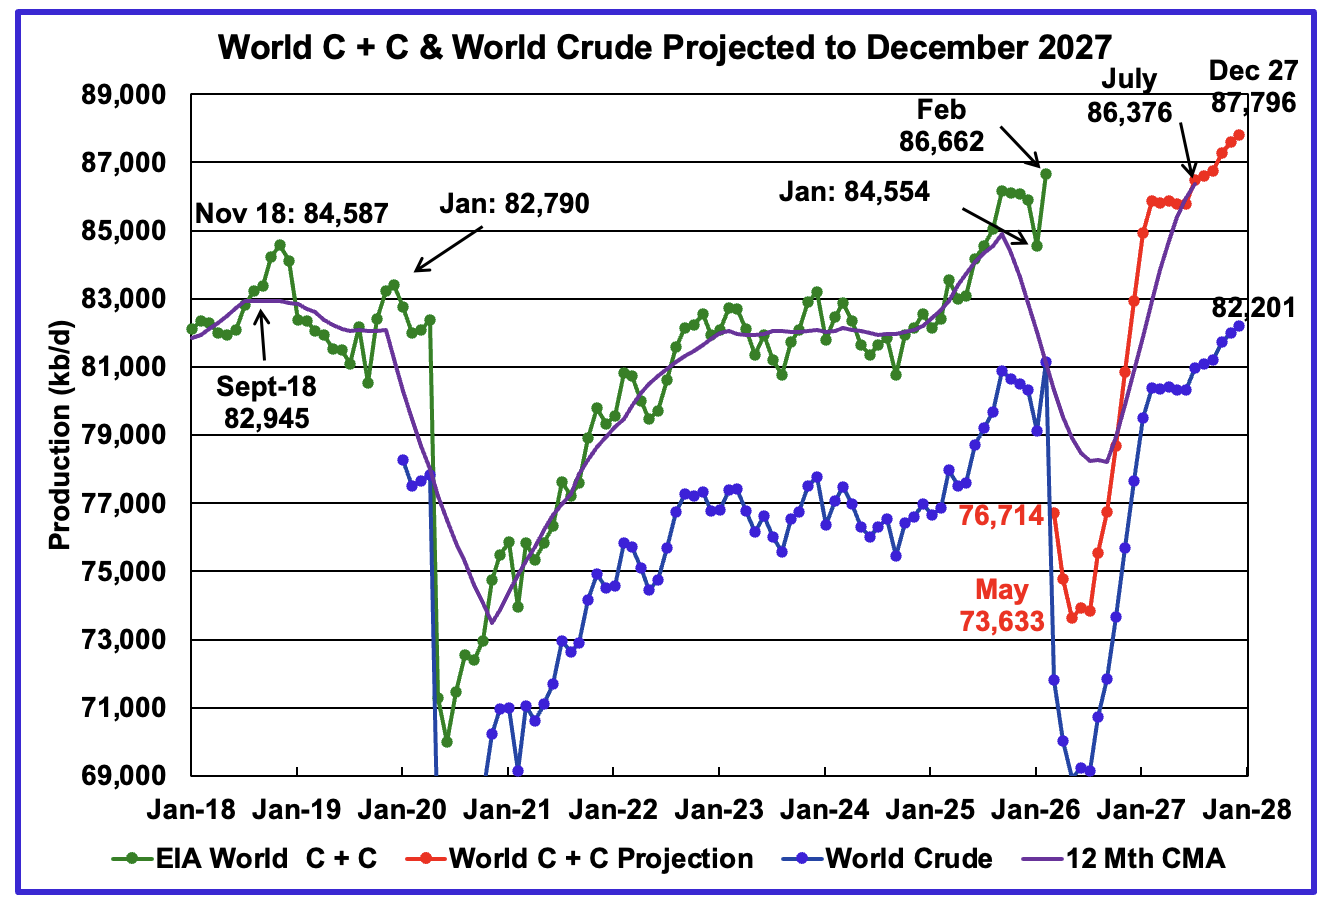
The EIA’s June STEO report continues to make significant and major revisions to the World’s projected oil production after February 2026 due to the US/Iranian war. Also US December 2027 projected production has been revised upward. See US chart at the end.
The World’s February oil production increased by 2,108 kb/d to 86,662 kb/d, a new high, and is over 2,000 kb/d higher than November 2018. The largest contributors to the increase were Saudi Arabia, US and Kazakhstan.
This chart has been updated using the June 2026 STEO to project World C + C production out to December 2027. It uses the STEO report along with the International Energy Statistics to make the projection. Production in March 2026 is projected to fall by 9,948 kb/d to 76,714 kb/d. May production is forecast to be the bottom and is projected to be 73,663 kb/d.
The 12 month Centred Moving Average shown at July 2027 is 86,376 kb/d.
For December 2027, production is projected to be 87,796 kb/d, a new projected high. The increase comes from a combination of Non-OPEC countries and the US.
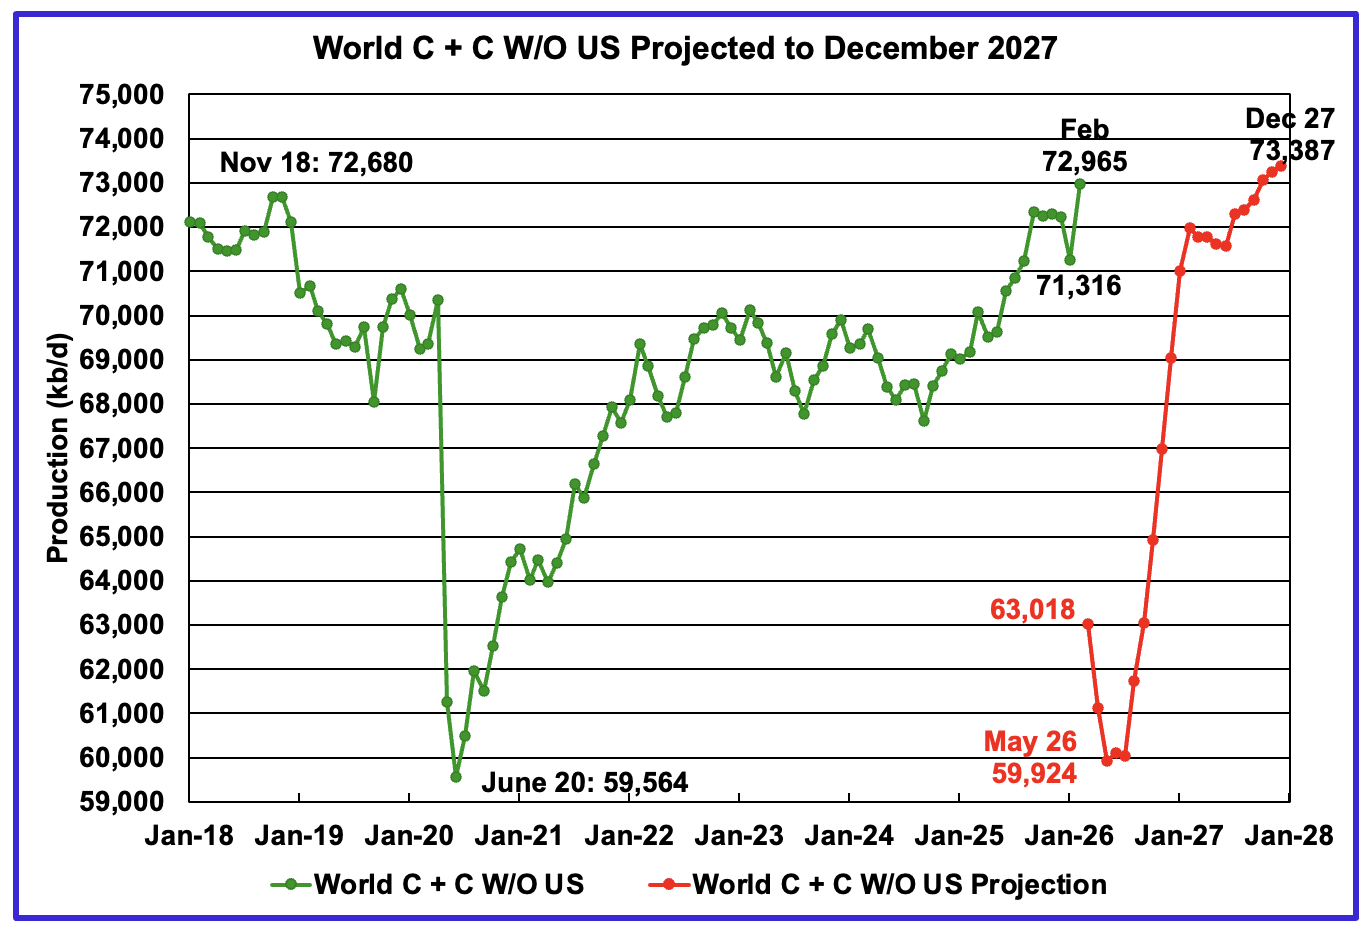
February World oil output W/O the US increased by 1,649 kb/d to 72,965 kb/d, a new high. March production is expected to drop by 9,947 kb/d to 63,018 kb/d.
The projection is forecasting that December 2027 World W/O US oil production will be 73,387 kb/d. This is only 422 kb/d higher than the expected February production of 72,965 kb/d. Very little growth is expected from the Non-US World oil producing countries over the next two years. This small increase may be more than welcome to offset the demand destruction occurring now.
A Different Perspective on World Oil Production
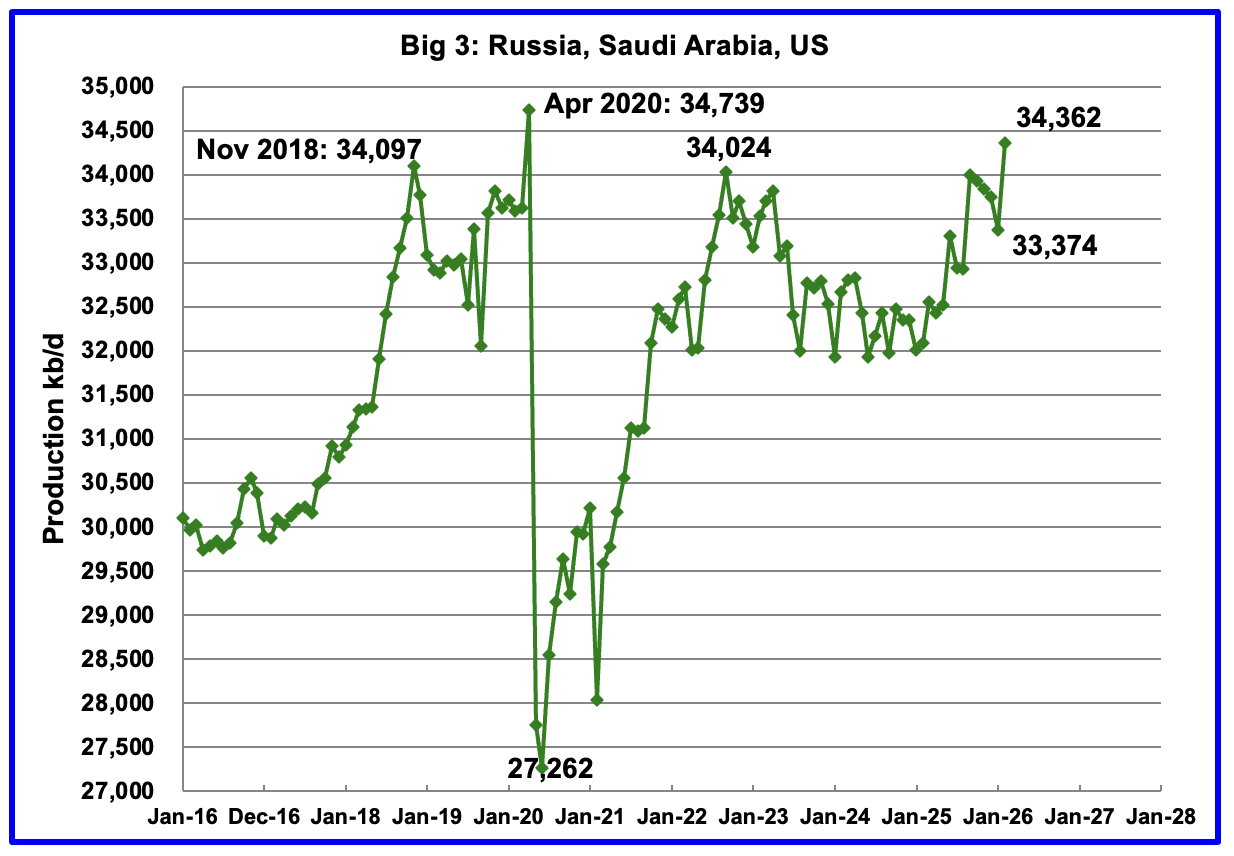
February Big 3 oil production increased by 988 kb/d to 34,362 kb/d. The US and Saudi Arabia had increases while Russian production dropped.
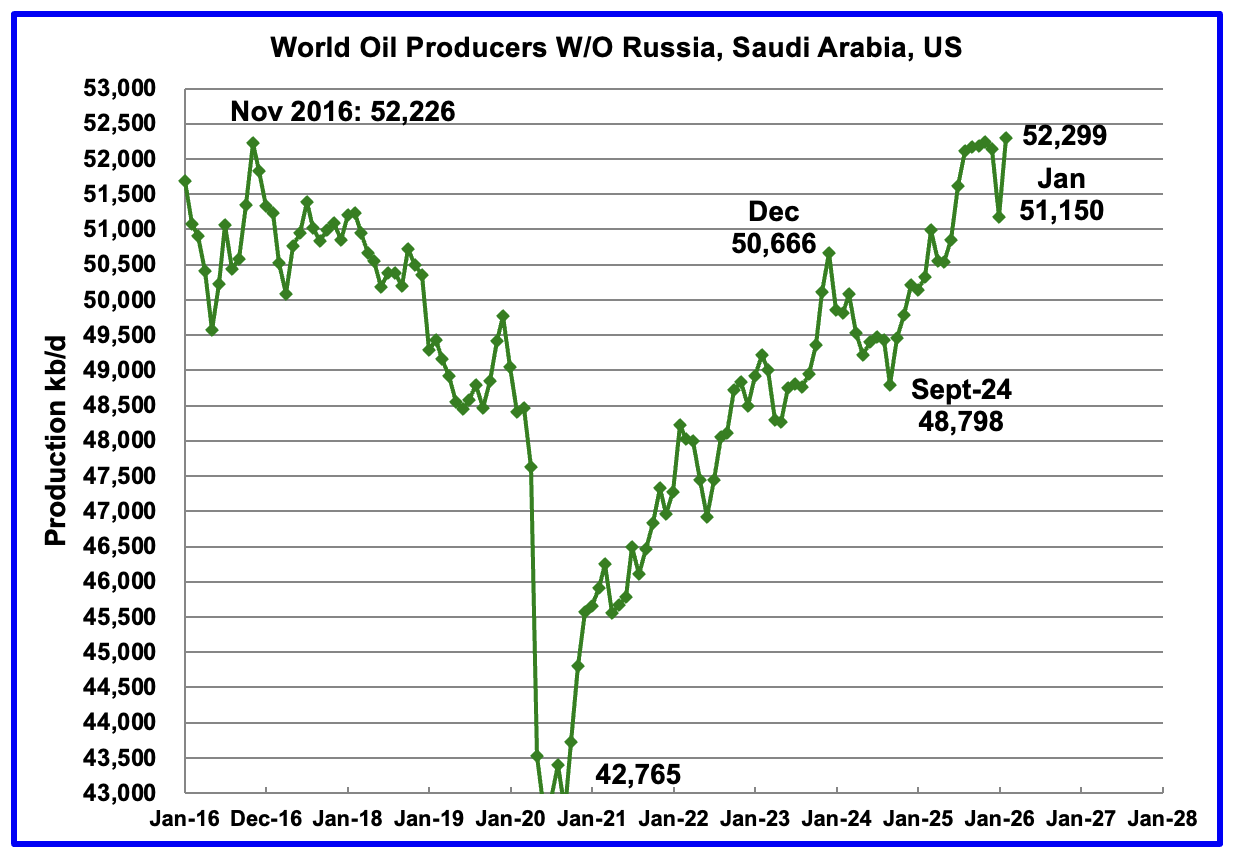
Production in the remaining countries has been slowly increasing since the September 2020 low of 42,765 kb/d but dropped sharply in January. February 2026 production rebounded to 52,299 kb/d by adding 1,149 kb/d. The biggest contributors to the gain were Kazakhstan and Venezuela.
Countries Expected to Grow Oil Production
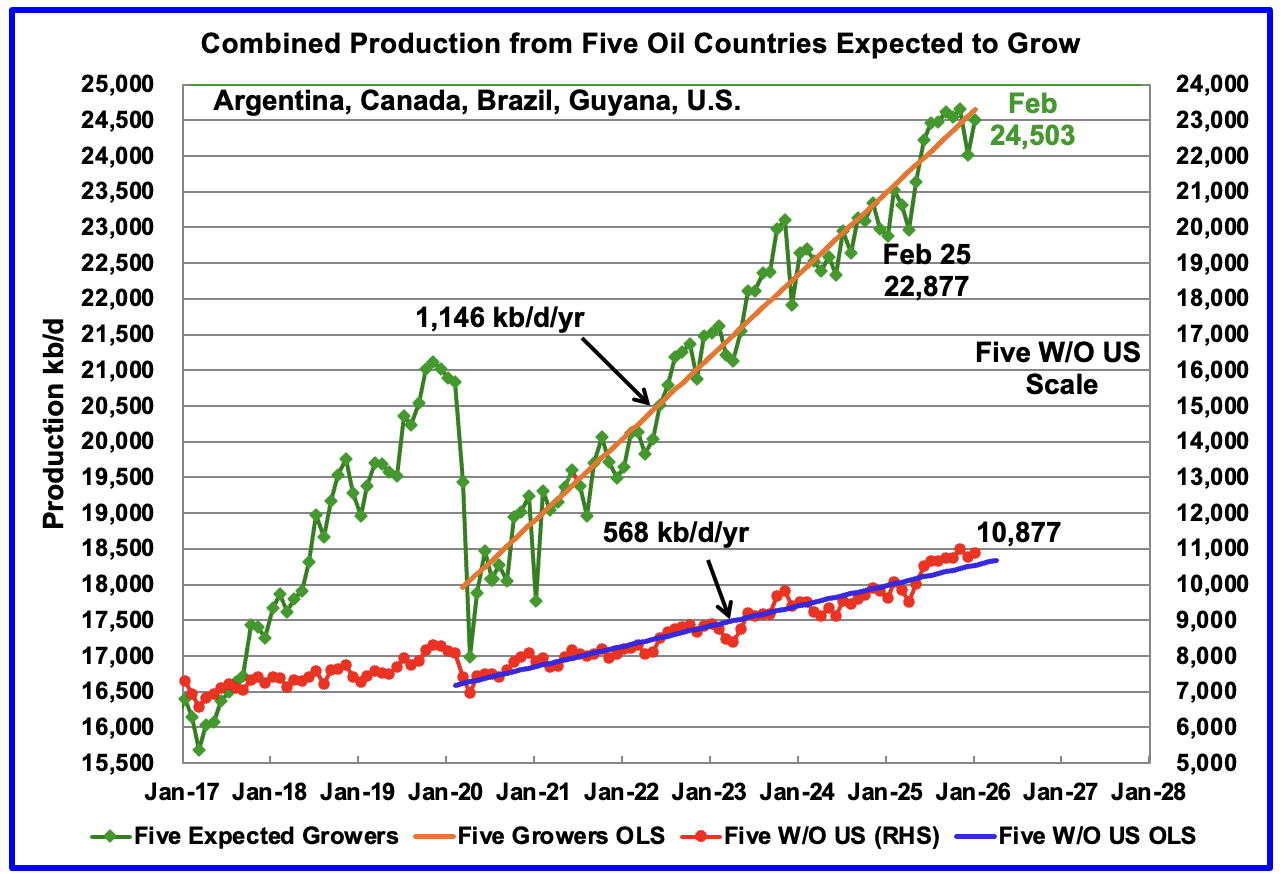
This chart shows the combined growing oil production from five Non-OPEC countries, Argentina, Brazil, Canada, Guyana and the U.S., whose oil production is expected to grow in coming years. These five countries are often cited by OPEC and the IEA for being capable of meeting the increasing World oil demand for next few years. Production from these five countries from April 2020 to February 2026 rose at an average rate of 1,146 kb/d/year as shown by the orange OLS line. This is an updated OLS and the growth rate rose slightly from 1,130 kb/d/yr to 1,146 kb/d/yr. Since February 2025, production has risen by 1,626 kb/d.
To show the impact of US growth over the past 5 years, U.S. production was removed from the five countries and that graph is shown in red. The production growth slope for the remaining four countries has been reduced by 578 kb/d/yr to 568 kb/d/yr.
February production has been added to the five growers chart and it rose by 485 kb/d to 24,503 kb/d.
World Oil Countries Ranked by Production
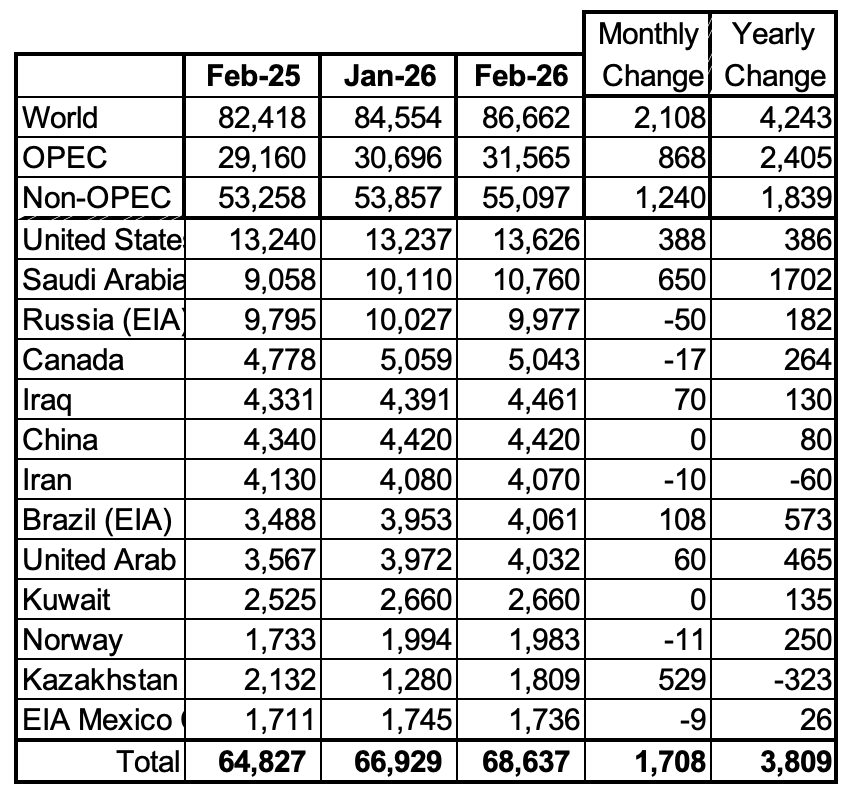
Above are listed the World’s 13th largest oil producing countries. In February 2026 these 13 countries produced 79.2% of the World’s oil. On a MoM basis, production increased by 1,708 kb/d in these 13 countries while on a YOY basis production rose by 3,809 kb/d. Note the large YoY increases from Saudi Arabia, Brazil and the UAE.
Non-OPEC Oil Countries Ranked by Production
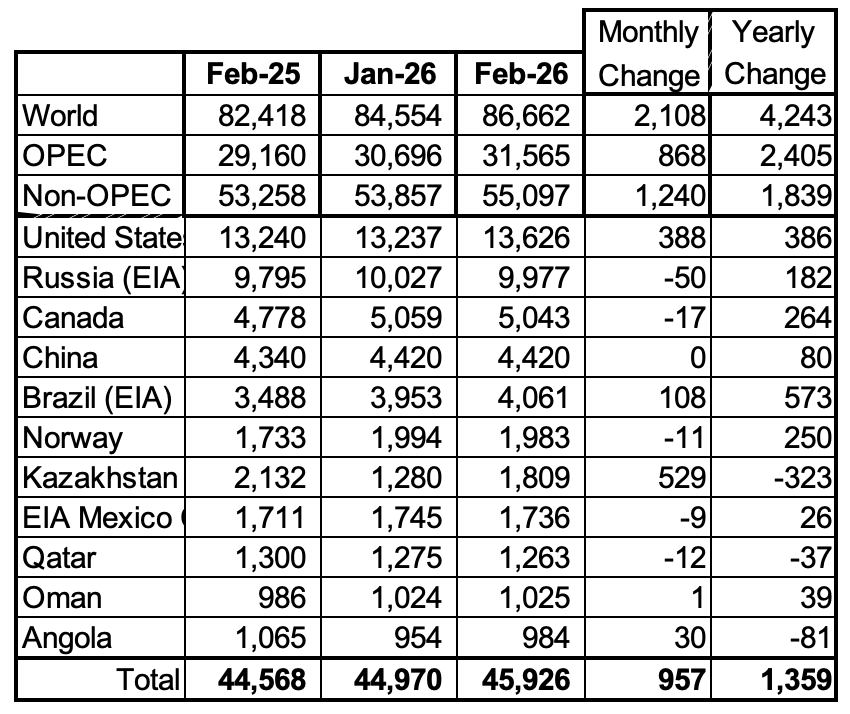
Listed above are the World’s 11 largest Non-OPEC producers. The original criteria for inclusion in the table was that all of the countries produced more than 1,000 kb/d.
February’s MoM production decreased by 957 kb/d to 45,926 kb/d for these eleven Non-OPEC countries while as a whole the Non-OPEC countries saw a yearly production increase of 1,839 kb/d to 55,097 kb/d. Major yearly gains came from US and Kazakhstan.
In February 2026, these 11 countries produced 83.4% of all Non-OPEC oil.
Non-OPEC Country Oil Production Charts
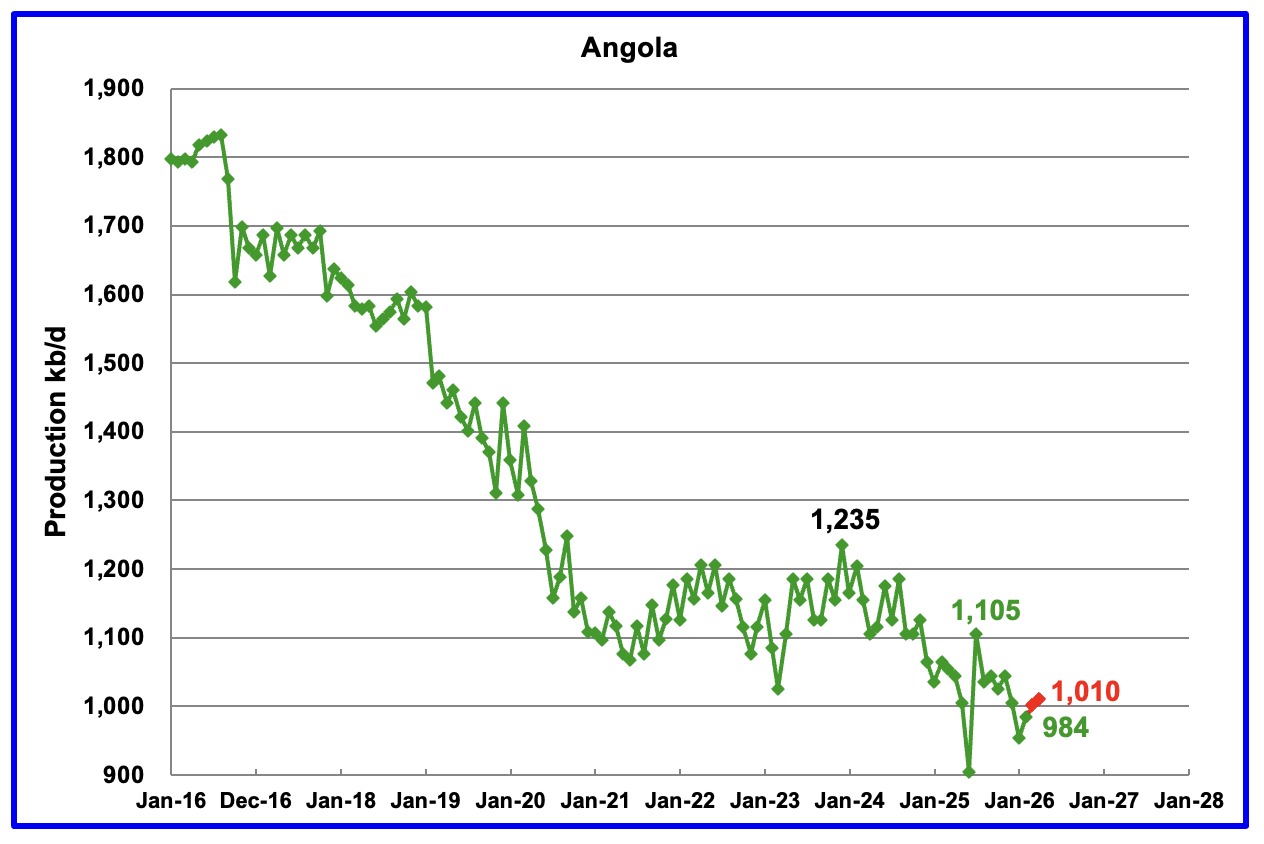
The EIA reported Angola’s February oil production rose by 30 kb/d to 984 kb/d.
According to Angola’s National Agency for Petroleum, production in April rose to 1,010 kb/d, red markers. Note that the 1,010 kb/d projection comes by reducing the ANP’s estimate by 20 kb/d since the EIA’s reported production numbers are typically 20 kb/d lower that the production reported by the ANP.
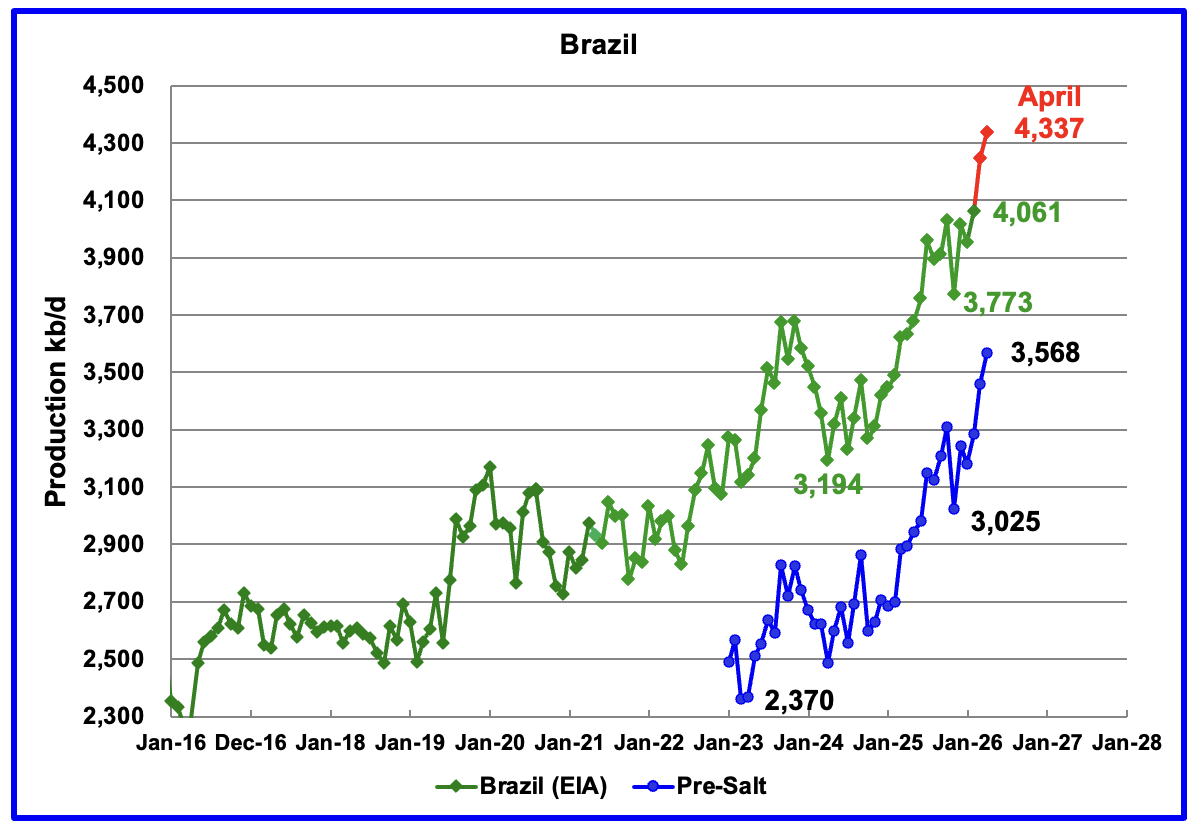
The EIA reported that Brazil’s February production rose by 108 kb/d to 4,061 kb/d. According to this Article, the pre-salt reservoirs remained the backbone of national production, accounting for nearly 80 per cent of total oil and gas output.
Brazil’s National Petroleum Association (BNPA) reported that production rose both in March and April to a new high in April of 4,337 kb/d.
Pre-Salt production was a major contributor to the March and April production rebound.
According to the June OPEC MOMR: “In 2026, Brazil’s liquids production, including biofuels, is forecast to rise by about 270 tb/d, y-o-y, to average 4.7 mb/d. Upstream liquids production is set to surge through production ramp-ups at the Buzios (Franco), Mero (Libra NW), Marlim, Bacalhau (x-Carcara) and Wahoo projects.
Rising development costs and sustained inflationary pressures are increasingly challenging offshore project economics. Consequently, final investment decisions could be pushed back, moderating the expected pace of growth.“
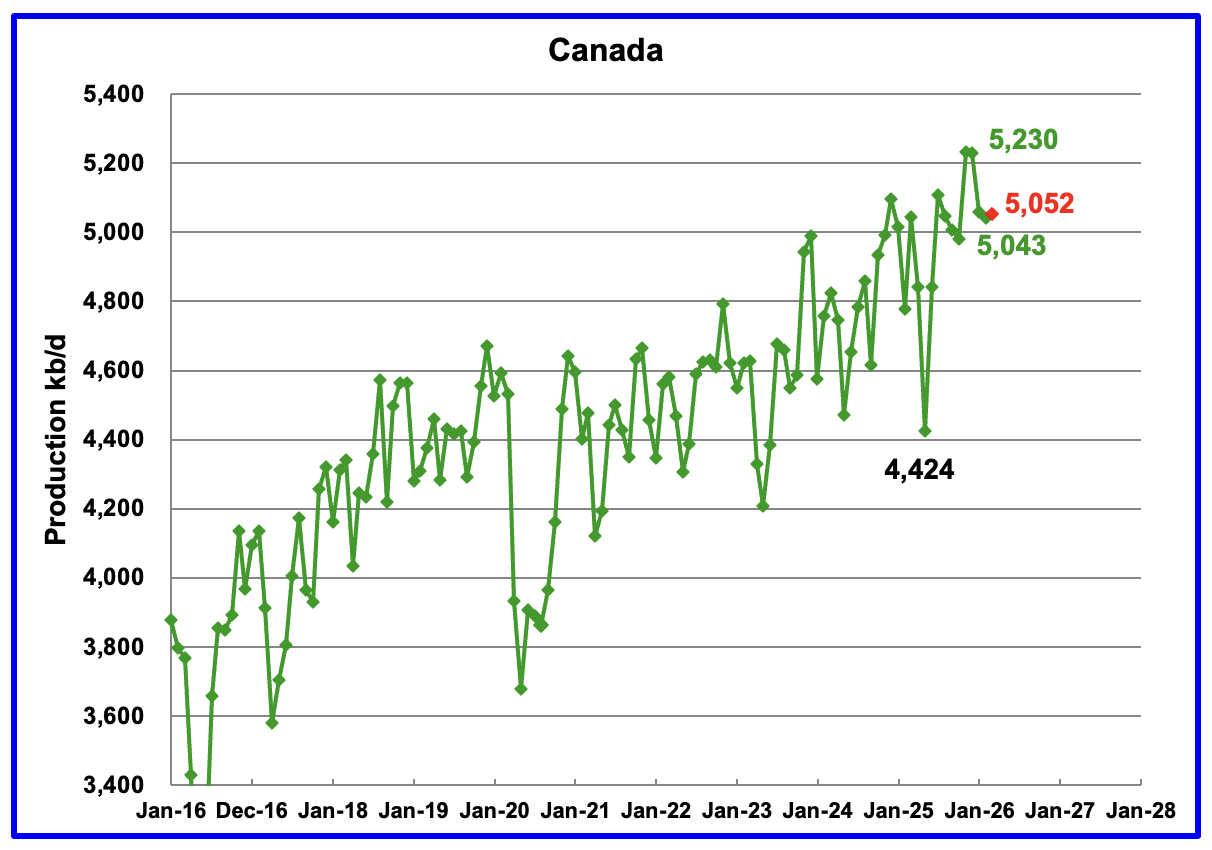
Canada’s oil production decreased by 17 kb/d in February to 5,043 kb/d.
Canada’s January and February production was down due to unexpected downtime at a few oil sands companies. March production is expected to grow by 9 kb/d to 5,052 kb/d, red marker.
According to the IEA’s May OMR: “May is expected to see further losses as both the Syncrude and Suncor Base Plant upgraders have scheduled maintenance. Annual production is forecast to increase by 90 kb/d to 6.5 mb/d on average.”
According to this Article, President Trump signed an executive order to build a smaller version of the Keystone XL pipeline.
The pipeline, proposed by Canadian pipeline company South Bow (SOBO.TO) and its U.S. partner Bridger Pipeline, could increase Canada’s crude exports to the U.S.by more than 12% if it goes ahead. A presidential permit was required for the project to proceed.
According to this Article: SOBO announced it has secured the shipper commitments it was seeking to advance the project. However SOBO will not make a financial commitment “Without assurances that a new U.S. administration would not revoke the permits in 2029, as Biden did with KXL, the project is likely to be stalled,” O’Donnell said.”
In January 2026 the TMX pipeline, which exports oil through the port of Vancouver, was operating at 80% capacity. As of June the pipeline was slightly apportioned, 0.2%, due to increased demand associated with the Iran/US blockage of the straits of Hormuz. New/increased demand is coming from China, India, and South Korea to offset losses from ME countries.
“The Trans Mountain pipeline has reached full capacity for the first time since its expansion was completed, boosting the pipe’s total carrying capability to 890,000 barrels daily. Indeed, this month the pipeline has seen more demand than there is capacity, a senior executive at the same-name company said, as quoted by Reuters.”
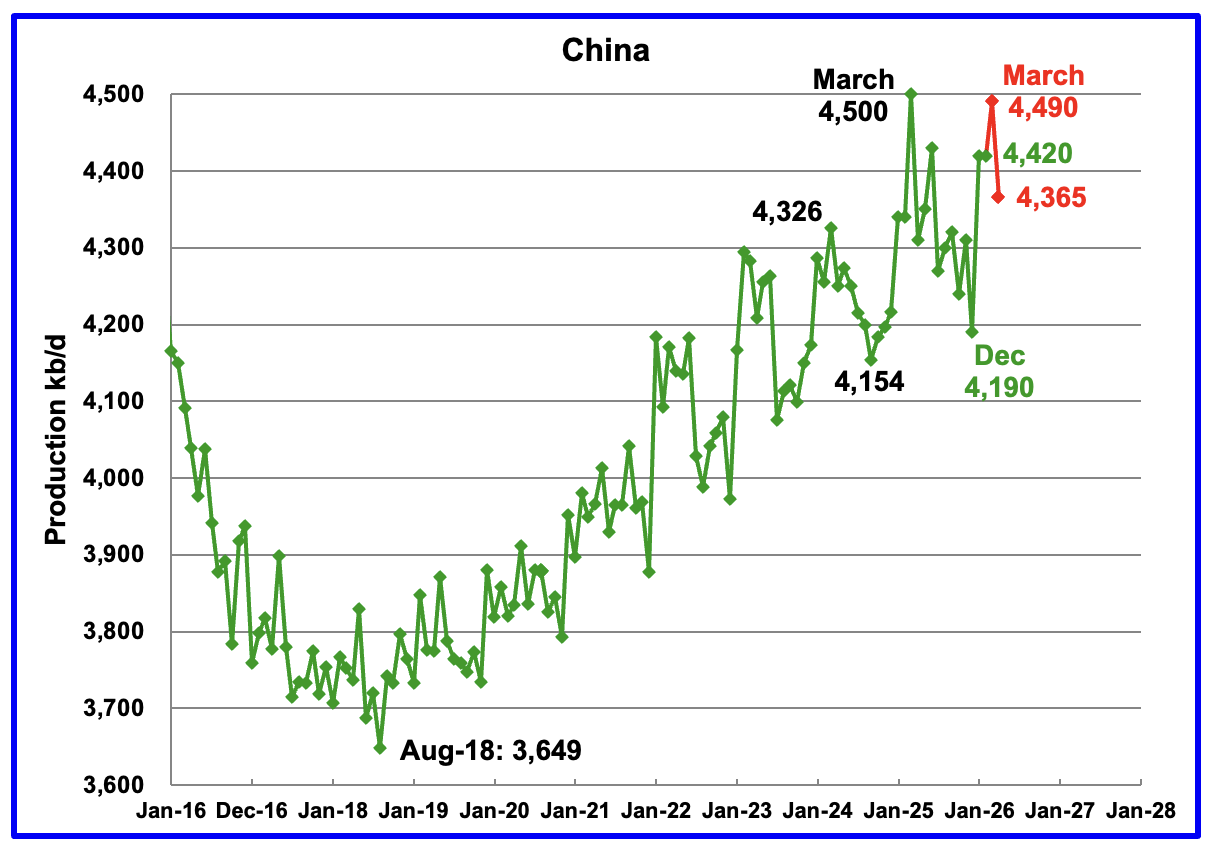
The EIA reported China’s February oil output was unchanged at 4,420 kb/d. On a YoY basis, China’s February production rose by 80 kb/d. For March, China reported average production of 4,490 kb/d, red markers.
For the last two years, March has proven to be a record production month. Again this year March showed a large gain but it did not exceed the March 2025 peak of 4,500 kb/d. Does this hint at an upcoming peak in China oil production?
Note that April production dropped by 125 kb/d to 4,365 kb/d.
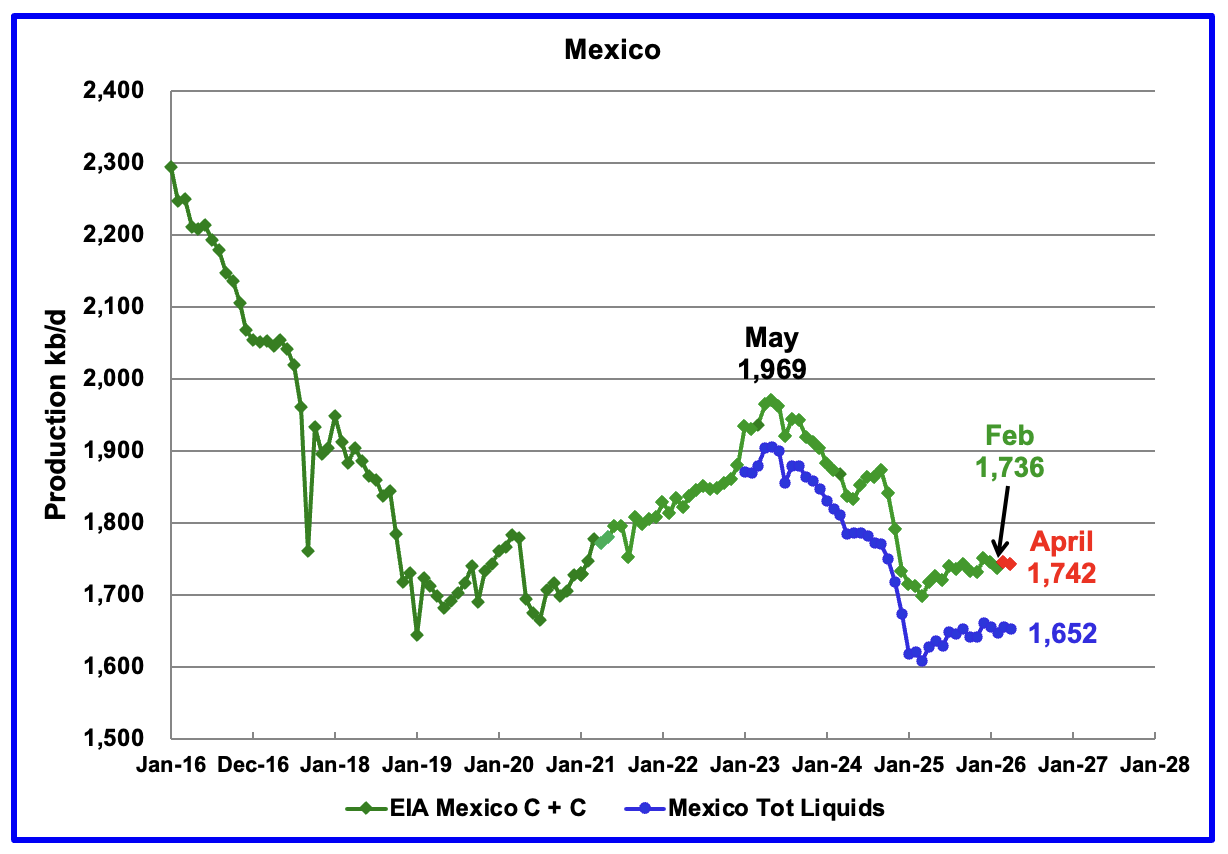
According to the EIA, Mexico’s February output dropped by 9 kb/d to 1,736 kb/d.
In June 2024, Pemex issued a new and modified oil production report for Heavy, Light and Extra Light oil. It is shown in blue in the chart and it appears that Mexico is not reporting condensate production when compared to the EIA report.
In earlier EIA reports, they would add close to 55 kb/d of condensate to the Pemex’s “Total Liquids” report. More recently the EIA has been adding 90 kb/d of condensate to Mexican production. For March and April production, 90 kb/d have been added to the Pemex report. April production is estimated to be close to 1,742 kb/d. Note that Mexico’s production, as reported by Pemex for the last eight months has stabilized around 1,650 kb/d, blue graph.
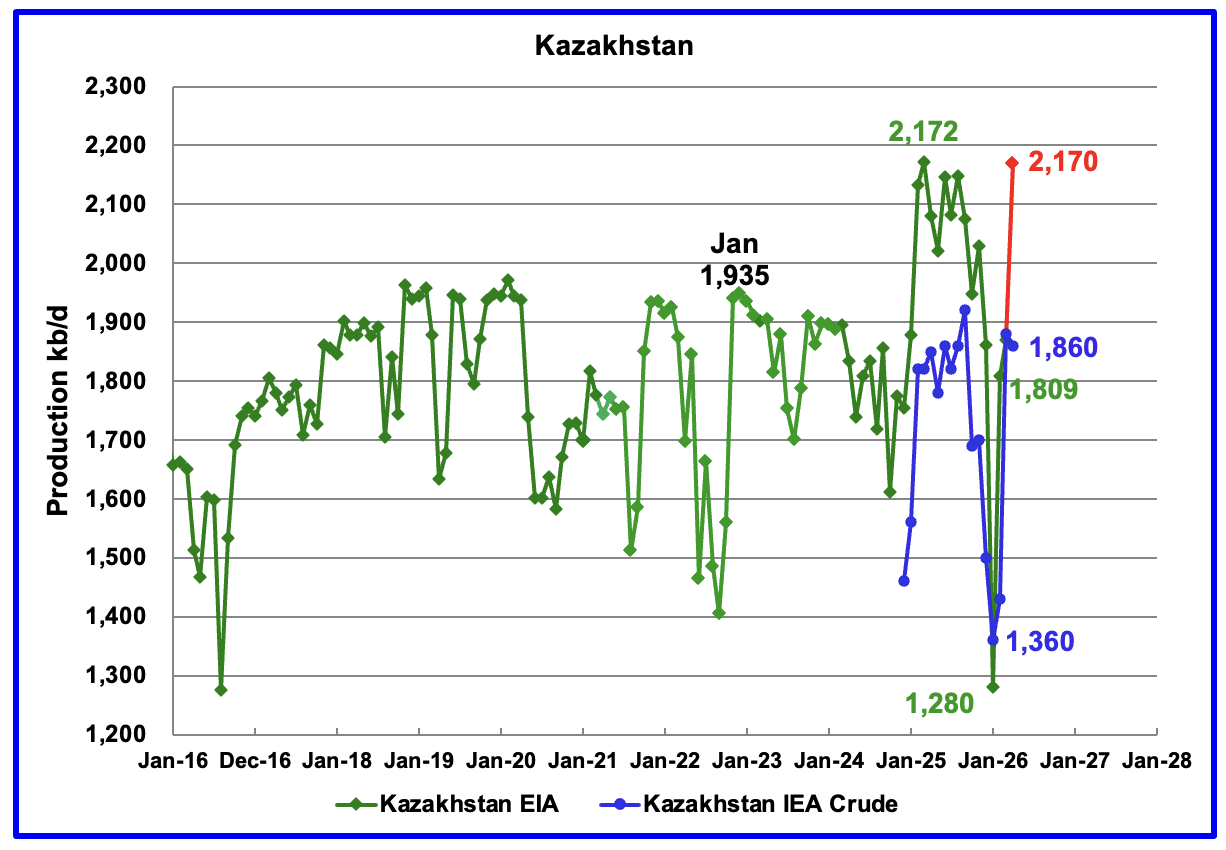
According to the EIA, Kazakhstan’s February oil output increased by 529 kb/d to 1,809 kb/d after the fire damage to the Tengiz oil field power generating plant was repaired.
Since Argus no longer reports OPEC + crude production, production data for Kazakhstan will now be taken from the monthly IEA reports. March production rebounded by 450 kb/d to 1,880 kb/d even though Kazakhstan was supposed to reduce production in March. The May IEA OMR reported that crude production in April dropped by 20 kb/d to 1,860 kb.
The C + C production for April, red marker, was taken from this Report.
The increase was driven mainly by higher output at Tengiz, the country’s largest oilfield, where the source said production jumped 39% to 973,000 bpd.“
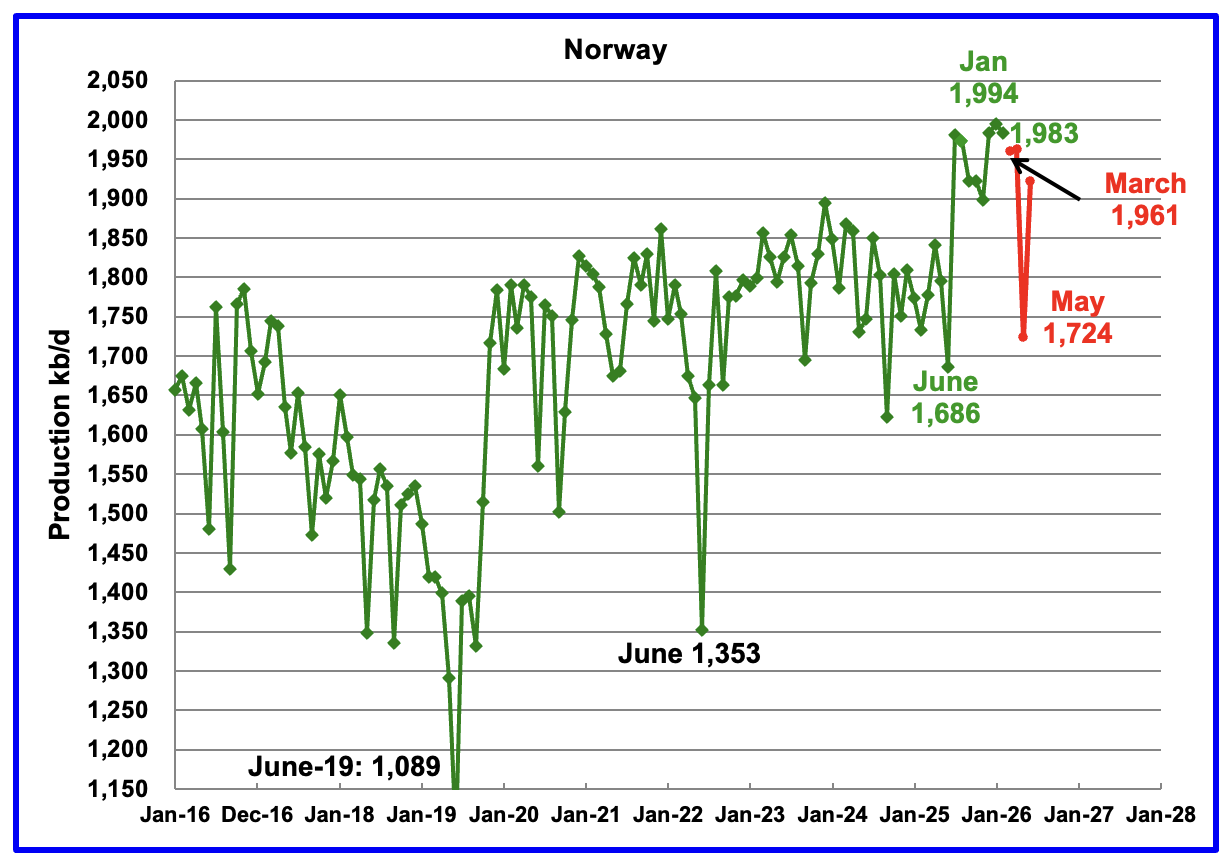
The EIA reported Norway’s February production dropped by 11 kb/d to 1,983 kb/d.
Separately, the Norway Petroleum Directorship also projected that oil production from February will drop to 1,728 kb/d in May. The red markers are the NPD’s production forecast.
According to OPEC’s May MOMR: “Norwegian liquids production is forecast to rise by about 10 tb/d to average 2.0 mb/d in 2026. This has been revised upward due to higher-than-expected output in recent months.
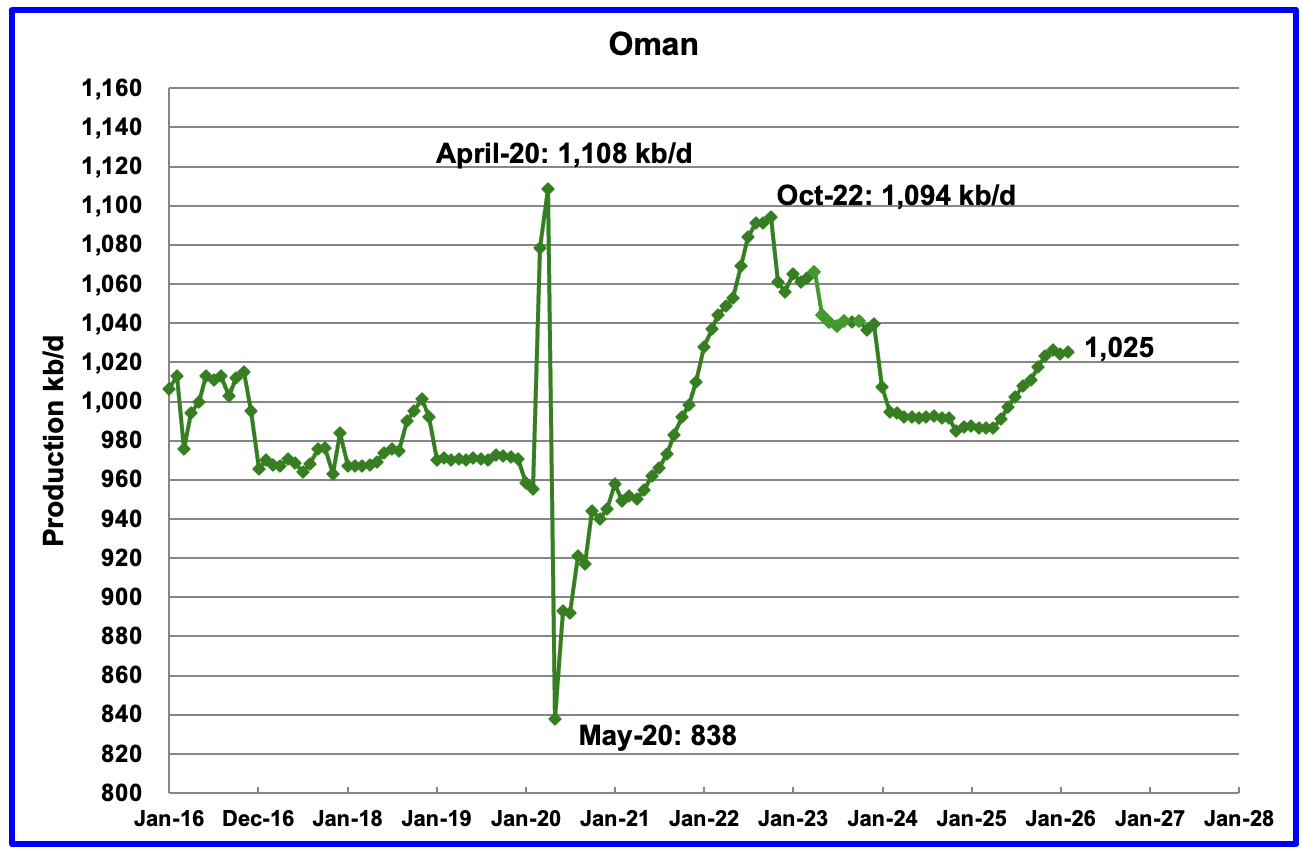
According to the EIA, February output rose by 1 kb/d to 1,025 kb/d. Oman’s production appears to have started a budding growth phase. Previous production peaked in October 2022.
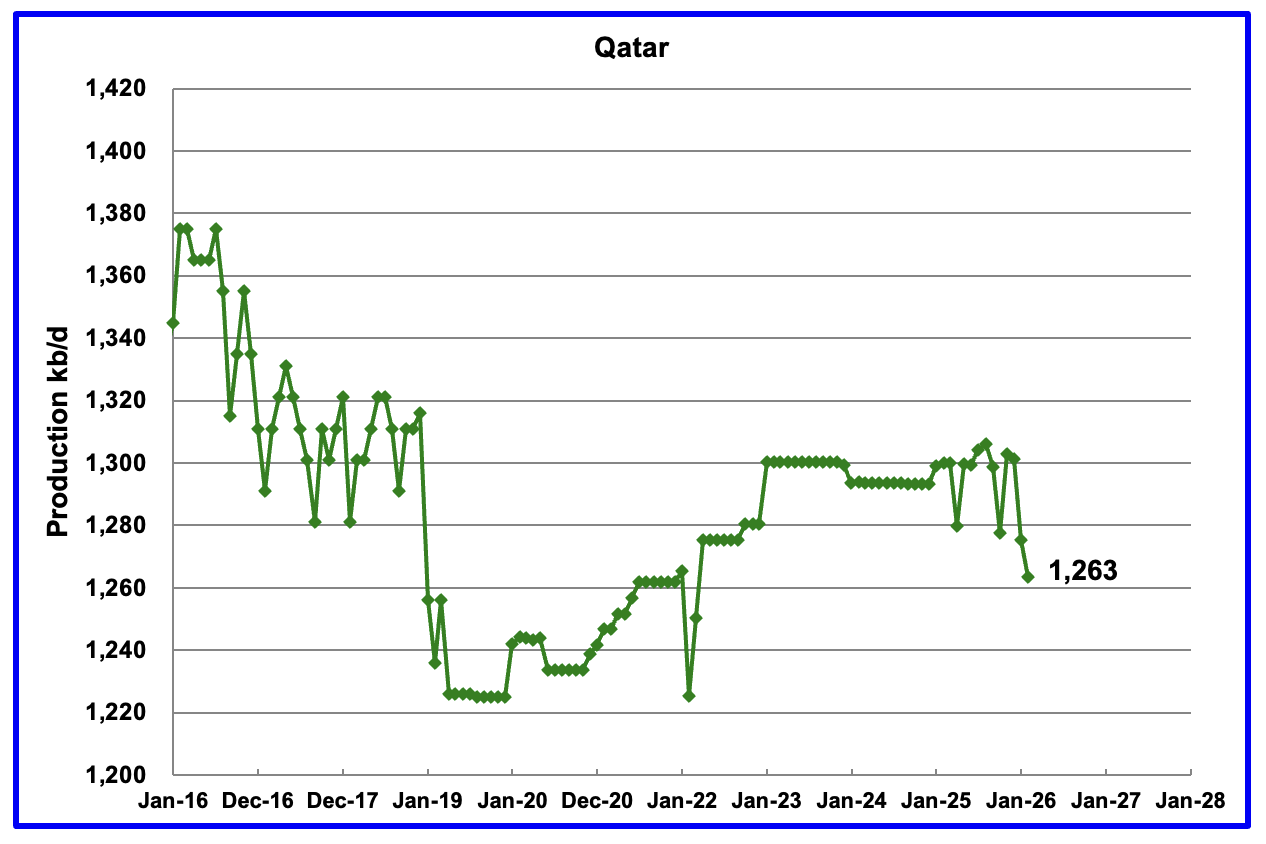
Qatar has restarted providing the EIA with monthly updated oil production.
Qatar’s February output dropped by 12 kb/d to 1,263 kb/d.
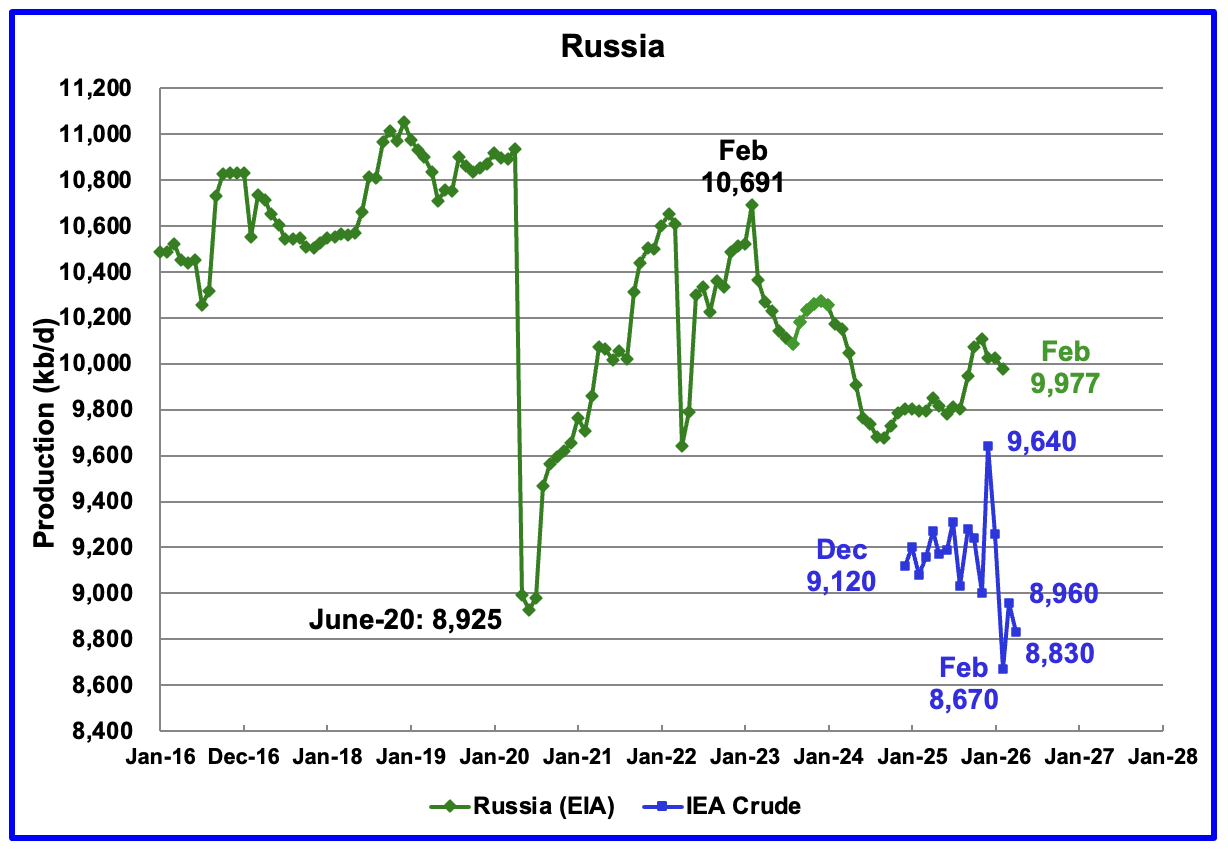
The EIA reported Russia’s February C + C production declined by 50 kb/d to 9,977 kb/d and was up by 264 kb/d from February 2025.
The above chart also shows Russian production as reported by the IEA. It is difficult to assess the accuracy of the IEA report since over the last few months the IEA’s Russian production had been around 100 kb/d to 150 kb/d higher than Argus’ Media. The best that can be done at this time will be to compare the production trends between the EIA and the IEA. I think that Russian oil production continues to be a major state secret at this time because of the damage being caused by the heavy bombing to its related crude oil processing facilities.
According to the IEA’s April report, February crude production dropped by 590 kb/d to 8,670 kb/d. The IEA’s May OMR reported that Russian crude production rose by 290 kb/d in March and then dropped by 130 kb/d in April to 8,830 kb/d. This is the first clear indication that Russian production is being affected by the Russia/Ukraine war.
The OPEC June MOMR is reporting Russian Crude production in April and May was 9,019 kb/d and 9,009 kb/d, respectively. For April, OPEC’s Russian crude production is 189 kb/d higher than the IEA’s report.
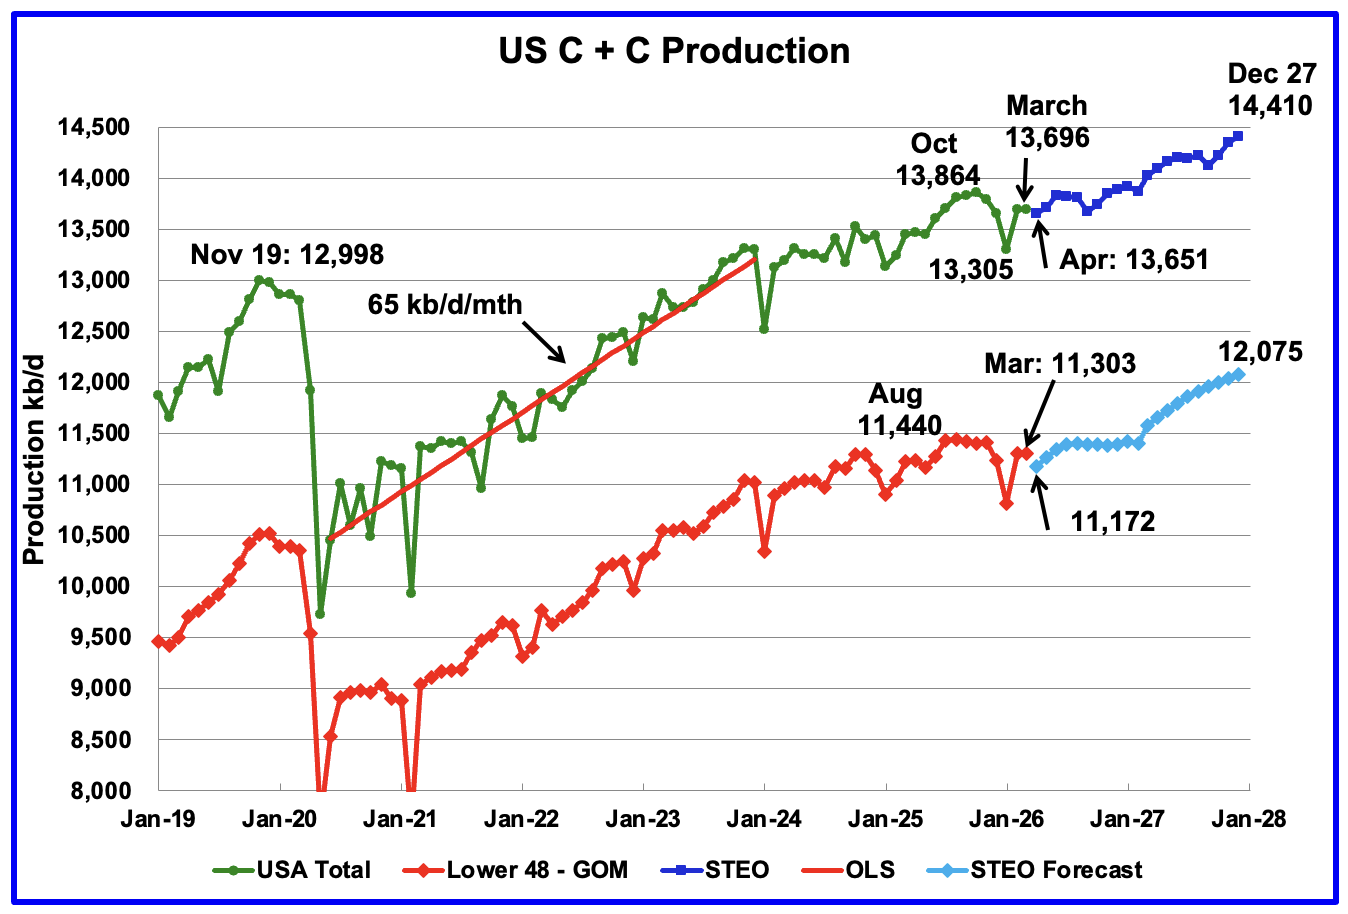
This US production chart showing output up to March 2026 is the same as the one published last week in the US update. However the projected portion of the two production graphs, light and dark blue, have been updated according to the June 2026 STEO.
For US projected production, December 2027 has increased from 14,282 kb/d in the April STEO to 14,410 kb/d in the June STEO, an increase of 128 kb/d. For Onshore L48 production, December 2027 production has risen from 11,892 kb/d in the March STEO to 11,961 kb/d in the May STEO. The rising production is projected to come primarily from the Permian basin.
Surprisingly US April projected production has dropped from 13,745 kb/d down to 13,651 kb/d.
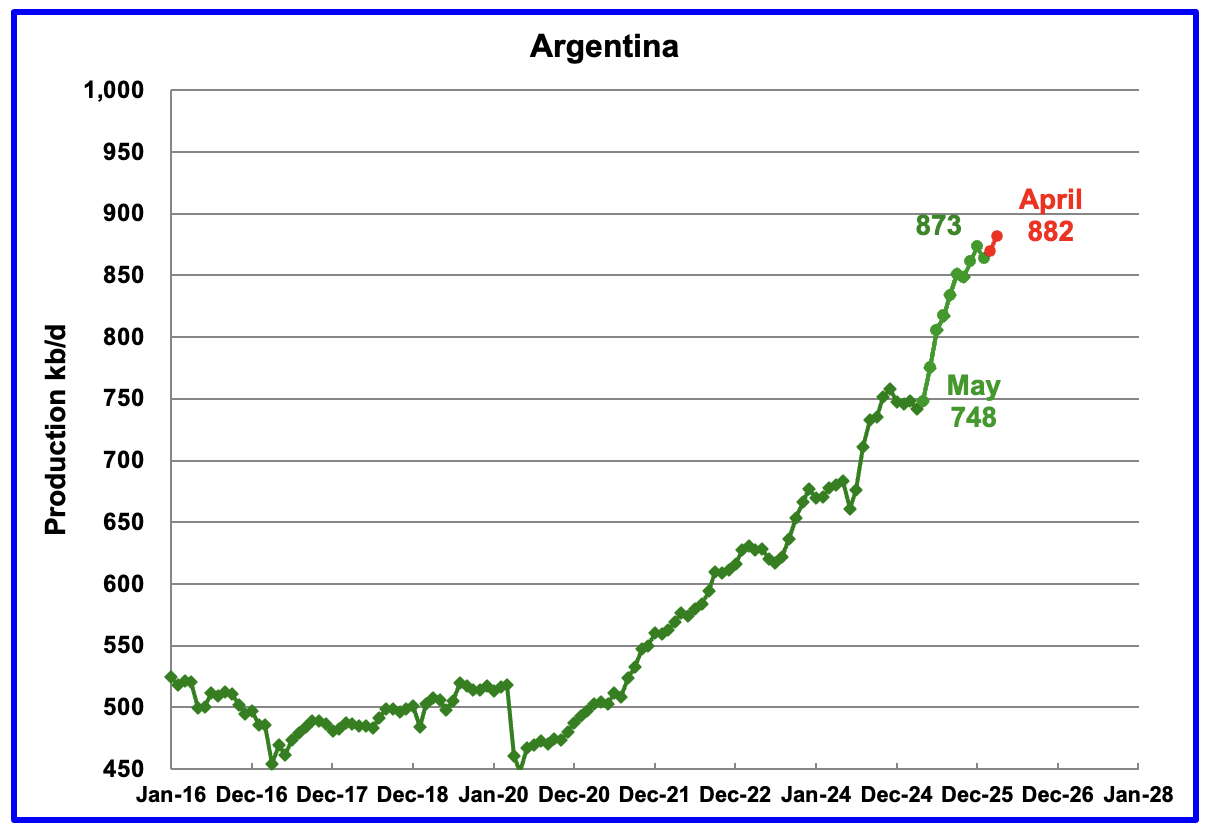
Argentina’s production has grown by 134 kb/d from May to April. Red markers are production as reported by the Argentina Ministry of Energy.
145 responses to “Record High February World Oil Production”
I remember reading Kenneth Deffeyes book, “Hubbert’s Peak” a few decades ago. He predicted that world oil production would peak in 2005, that is, two decades ago. He had impeccable credentials: worked with Hubbert at Shell Oil, was a Princeton geologist.
But he was completely wrong.
He didn’t understand that you could not apply Hubbert’s methodology to world oil production. There was no incentive back in the 1970 for domestic oil producers to look for better ways to extract oil as you could buy it overseas for peanuts. There was an incentive some years later when world oil prices got high. In short, he failed to realize that high prices are incentives to produce new technologies, which they did.
When will world oil production peak? No one knows.
Take the Kern oil field in Southern CA. In 1942 278 million barrels had been produced and it was estimated that 54 million remained. 1995 an additional 736 million barrels had been extracted and it was estimated that 970 million barrels remained. By 2007 a total of 2 billion barrels had been extracted and an estimated 627 million remained. Estimates of recoverable oil are almost always low, usually way low.
My guess is that oil production will peak in mid-century with a slow decline thereafter. Demand will drop in wealthy countries, largely due to population decline.
Hmm, conventional oil peaked in the 2010-2015 timeframe for almost every country, so being 5-10 years off seems pretty reasonable. A pessimistic view of remaining conventional oil supply is 300 billion barrels (Gb), or approximately 10 years of world supply. If you ask Dennis (optimistic view), he thinks a more accurate estimate for remaining conventional oil might be 2 times (or even 3) the low end, let’s call it 750 Gb. So even the optimist can see that we are 10 years beyond the peak, your mid-century estimate implies there is twice as much oil (easily extracted) as there actually is, maybe 2.5 to 3 times more. Even Dennis can’t agree with that view.
The Rystad report should be out soon, so we will get an update to their annual proven reserve estimates soon!
When it comes to what Kenneth didn’t know, sure, it was legion. But what was more legion were the number of suckers that went for it for firing off a single neuron first. And you shouldn’t mention reserve growth so quickly, turns out it really does matter and folks were quite unhappy with those of us who not only knew it, but had it in our usernames.
Congratulations. If it’s in your username it must be true, impressive logic! Do please tell how current conventional oil production is presently below levels of 20 plus years ago, (hint: could it be related to worldwide conventional oil production peak from 10 plus years ago)?
Decline rates turn oil supply into a treadmill. New reserves and new production do not simply add to the total; they first have to replace the barrels being lost from existing fields. If conventional fields decline around 5–6% per year after peak, and shale declines much faster without constant drilling, then the industry must develop millions of barrels per day of gross new supply just to keep global output flat.
That is why reserve growth is not the same as easy supply growth. The best conventional fields were generally discovered and developed first, while newer barrels are increasingly smaller, deeper, tighter, heavier, more capital-intensive, or politically constrained. Shale can add barrels quickly, but it also requires continuous drilling, infrastructure, water, sand, labor, and financing. Oil sands and deepwater can add large volumes, but they are slower, more expensive, and less flexible.
So the limit is not that hydrocarbons do not exist. The limit is whether enough replacement supply can be developed fast enough, cheaply enough, and reliably enough to offset natural decline. Higher prices can move resources into reserves, but $100 oil is not abundance — it is expensive supply. Decline rates determine whether reserves become usable supply.
New peak around next July, the graph projections show.
Not far fetched if there is sustained pricing above $70 or so,
and if Iran and Russian oil get sanction relief enacted.
Countries, in addition to ramping up non-fossil energy industries/deployment, will be working to build up oil reserve storage capability after seeing how important it was to US and especially China during this episode of supply disruption. That equates to oil demand.
Canada and Brazil on a long production upswing. Guyana, Venez and Argentina too.
Rising much more quickly is the percent of global auto sales that have a plug, now up to 25-27%. Accelerating rise. Eventually this will seriously bite into oil demand.
RGR/Hickory,
Good to see you post again, RGR.
Hope you continue to contribute.
Although a somewhat trivial matter, tiny Greylock just moved its headquarters to Potter county where it has brought online a few successful Utica wells.
As Terry Pegula has shown production from Potter county Utica is viable, we may continue to see the northwestern expansion of the App Basin footprint.
Hickory, as Sheng Wu – and others – continues to state, the Dead Cow has a very promising future.
One simply cannot downplay the ginormous potential of both Canada and Venezuela. (I would include Iraq and Russia, also).
Look for Surinam to merit some hydrocarbon love within the next 24 months and the ongoing Beetaloo to start posting some impressive natty numbers as well.
Down below, there is an hilarious comment referring to psychological needs surrounding the ability to recognize the obvious when it comes to hydrocarbon bounty.
This is a topic I’ve long pondered as it applies to the ‘running out any day now, folks’.
Interesting conclusions to be drawn.
Who cares if the oil is conventional or not? Oil is oil, however it is extracted. When you buy an item made of steel or aluminum, do you care about its origin; if it is recycled steel or aluminum. Yes, oil companies make more money from easily extracted oil, but they were doing quite well earlier this year when oil was $60/b.
Tools invented by the US to extract tight oil – fracking, horizontal drilling, etc. – are quite inexpensive to apply. They are not yet universally employed by any means by other countries. As we’ve seen with US oil production, they dramatically increase the amount of oil that can be economically produced.
And, should the price of oil go up to roughly $100/b oil shale, tar sands, etc. become economically viable and there is a lot of those sources.
In 1984 we had reserves of (according to the EIA) 30 (200) billion barrels of oil (trillion cubic ft of gas). We were producing about 3 (17) billion barrels (trillion cubic ft) of oil (gas), which meant that in 10 (12) years we would have depleted all of our oil (gas). Some 40 years later we have 45 (600) billion barrels (trillion cubit ft) of oil (gas). Not only did we not run out of oil and gas, but we have much more reserves.
Bottom line: no one knows how to estimate reserves. We will have plenty of oil and gas by mid-century.
Asklepias,
By mid century demand will be the issue rather than supply of oil. Probably the peak in output will occur within a few years, it is incorrect that tight oil and extra heavy oil producers were doing well at $60/b, they were barely scraping by and accumulating debt.
If the oil futures market is roughly correct on future oil prices, we are not likely to see the rebound in output that the EIA forecasts in the STEO or the IEO.
You are certainly correct that nobody knows how much will be produced in the future (including both you and me).
The futures market has Brent at $71/b in June 2030 as I write this.
Hi DC,
Do you have an opinion on what the US rig count might look like if WTI stays in the $70’s or even drops into the $60’s?
Thank you,
What psychological needs are being soothed when someone who thinks “oil is oil” and that theres shitloads of it comes to this blog?
“Oil is oil” ignores decline rates, cost, crude quality, infrastructure, emissions, and scalability. U.S. shale is not magical; it depends on unique geology, capital markets, mineral rights, and service capacity that are not easily replicated worldwide.
$100 oil does not mean abundance, it means scarcity prices. The issue is not whether hydrocarbons exist.
The issue is whether enough affordable, timely supply can replace declining conventional oil through mid-century.
THC,
Rig counts might not change significantly, there was not much of a move when oil prices increased, companies mostly kept things the same, prices returning to Feb 2026 level may not change things much.
Yes it matters what kind of oil just as it matters what alloy of aluminum or steel you need. All metals aren’t the same. All oil doesn’t have the same molecules or cost of extraction.
Asklepias,
… 1984, reseves of 200 trillion cubic feet of gas
40 years later, 600 tcf.
This is just some of the perspective/history that makes we hydrocarbon boosters laugh out loud.
Few weeks back, USGS released updated assessment for Bossier (entirely separate from Haynesville, despite location).
Mean TRR (Total Recoverable Resource) of 343 TCF.
Upper bound potential (F5) over 600 TCF.
Despite the enormity of this resource and its far reaching impact, nary a mention anywhere.
Bokoo natty far, far off into the future.
DC, thank you!
Business as usual, but no “drill baby drill” unless prices go back up I assume…….
Coffeeguyzz,
The USGS Bossier assessment is wishful thinking, actual production is likely to be on the low end of the assessment of around 100 TCF close to the f95 estimate as most of the area is untested for the continuous Gas AU between 99.4 and 100% of area untested, see Table 1 at link below and Table 2 where if we ignore the low output peripheral AU (100% untested) we have an F95 estimate of 90 TCF for 2 continuous AUs (99.4% and 99.7% of these Assessment Units untested). This is a very poorly done study by the USGS.
https://pubs.usgs.gov/fs/2026/3004/fs20263004.pdf
Coffeeguyzz,
Amazing USGS response to West Haynesville is so quick and confirming!
According to the USGS Bossier Assessment report, the western part is actually the same as what they called as “Western Haynesville”, ultra-deep. The other part of Bossier is only 1/5th of the EUR as the Western Haynesville”.
The Utica has similar dual-stack shale, and the current main target is actually lower Point Pleasant (PP), not Utica shale.
Maybe somewhere in Utica, they will discover a true Utica shale that work out like the “Western Haynesville”.
Oil and gas will certainly decline as a percentage of the world economy over the next 20 years.
Alimbiuqted,
It is correct as a percentage FF will decline, but absolute numbers will still climb,
I read a post that after industrialization with coal in Britain, the use of wood logs increased significantly, for building railway and mine/coal digging.
In Ford model T, they used so much of wood/timber, that Ford became the vendor for fire logs, that’s where the KingsFord brand started.
Sheng Wu,
The future of FF is a political question. It’s a choice – will we stay with it due to the political power of legacy industries, or move to higher quality alternatives?
Petrostates like Russia, KSA and the US will move slowly, but my guess is that the rest of the world will move reasonably quickly away from FF. Heck, even in the US renewables are overwhelmingly the choice for new generation – this is true even in Texas. Overall demand will decline, and soon thereafter the laggards will have to follow or become uncompetitive.
One sees historical analyses that suggest that old, obsolete forms of energy, like biofuel, persist for a long time – this is a favorite argument of Vaclav Smil, a closet FF advocate. One has to remember that there was little reason to phase out the old forms. FF, OTOH, has clear harms, and needs to be phased out ASAP. This is clear to almost everyone – the only question is how long the fog of political resistance will last.
Question for everyone:
A new narrative that has been rolled out recently is that considerably more oil has been getting through the Hormuz than we have been led to believe, due to, among other things, tankers going dark and a US operation to guide ships along the Omani coast.
One problem I have with this narrative is that if this were the case, the OPEC gulf nations would not have had to reduce production so radically (down over 9 mbd in April 2026).
Does anyone have an opinion as to it would be possible or likely for OPEC to understated April production by millions of barrels a day?
https://peakoilbarrel.com/opec-monthly-oil-market-report-may-2026/
I read somewhere that it is not VLCCs getting through the Strait of Hormuz, but rather smaller ships that then fill up VLCCs off the coast of Oman.
Hi Schinzy,
Yes, they pitched some story about the US having small boats going back and forth, loading and unloading. BUT somehow they also claimed the US military was not directly involved in protecting the smaller ships.
Not sure what it means, but it seems unlikely to have gone on a scale that would change the dynamics of the draining of inventory.
If so many oil tankers have been sneaking through Hormuz undetected and unreported, how could this be happening……..
~~~~
API was supposed to be more BEARISH than EIA on crude for this week.
Because API reported -8.33 million bbls, EIA will report between -9 to -10 million bbls.
SPR release of 8.9 million bbls.
Total crude draw of 17.9 to 18.9 million bbls, or the largest crude draw in history.
~~~~~
https://x.com/HFI_Research/status/2066985062122565635?s=20
Interesting for me is that US inventories matter little when it comes to oil prices.
Commercial plus SPR will likely drop to the lowest level since the early 1980’s in today’s EIA report. But that won’t be relevant to the oil prices.
Monetary policy seems to be more relevant than oil inventories.
shallow sand,
Yes, indeed. It could be argued that prices can stay low even when there is a production deficit and inventory is being consumed.
We’ve seen it in metals markets (silver, palladium, and probably other metals), so there definitely is a precendent.
But eventually, if there is simply not enough available for sale to match buying needs, people will have to bid for barrels.
Cushing 06/12: 20,034,000 barrels.
At this rate, sub-18m barrels in a couple of weeks or so?
I see that Bloomberg as published the text of the 14-point agreement between the US and Iran. Oil and other commerce to move through the SOH within 30 days from all countries.
https://www.yahoo.com/finance/economy/policy/articles/read-the-14-point-draft-memorandum-between-the-us-and-iran-220917023.html
Stunning. I recall reading at least one post here comparing our fearless leader to ‘Sun Tzu’. Somehow I don’t quite see that.
Yet another reminder of how completely differently 77M people in the US see reality than the rest of us.
On a practical note, the only oil tankers currently using the strait openly are Iranian, even though the US blockade does not officially lift for another two days. Large numbers of empty tankers are currently sailing towards the gulf, but will take a few days to arrive. Commercial tankers will still need insurance cover for traversing a war zone, and Iran has not relinquished the right to demand tolls. Few tanker captains will be keen to be the first to test Iranian permission to use the strait, and if Israel continues to attack Lebanon, Iran could close it again without warning. The regular shipping lanes are still assumed to be mined, full clearance could take months. Even if evrythin goes smoothly, it will be 3 weeks before any oil reaches Asia, a full month before it reaches Europe. We also won’t know for several weeks or months how much damage has been done to production capacity by war damage and well shut-ins. We could still reach MOL in parts of the world for some products this summer.
1. “an immediate and permanent end to the war on all fronts, including Lebanon, ”
Since Hezbollah is not a signatory to this agreement it seems to rely on the idea that Iran has 100% control over Hezb, rather than just 97%.
And it assumes that Israel will not take action against the Iran proxy (Hezb)who is dedicated to the eradiction of their country (not just leadership change).
3. “The Islamic Republic of Iran and the United States undertake to negotiate and reach a final agreement within a maximum period of 60 days, extendable by mutual consent.”
It will be long extended, mutually or not.
4. “The United States also undertakes to withdraw its forces from the surrounding areas within 30 days after the final agreement”
Does that include the Gulf country bases? I bet the US and Iran see that very differently.
6. “create a comprehensive plan agreed upon by both parties for the rehabilitation and economic development of the Islamic Republic of Iran, While ensuring financing of at least $300 billion.”
So Iran will get 1/3rd of a trillion dollars in order to allow shipping through the strait (independent of fees it decides to charge on particular countries). Great.
I doubt that an agreement will be reached that congress would ratify without much more capitulation by Iran, especially on its program of involvement in the internal affairs of regional countries via mechanisms of funding, ballistic missiles, weaponized drones, shipping curtailment, terrorism.
Confidence building-
Trump at G7
“Trump says he likes idea of blaming Vance if Iran deal doesn’t work out”
DON TZU
The joke on the Chinese internet is calling Trump Chuan Jianguo (川建国) — Chuan is a Sinified pronunciation of his name, and Jianguo means “build nation” or nation builder.
The nation in question is China, who looks like the big winner of the Iran war.
The free flow of commodities by sea is the keystone of Pax Americana, and the main reason the US participated in two world wars.
Trump’s erratic foreign policy have brought an end to that era. The world is being forced to find affordable reliable replacements for oil and gas in transportation and electricity generation. That means Chinese “new energy” products.
https://ember-energy.org/latest-insights/electric-asia/
Meanwhile almost nobody in the world now considers the US government to be a reliable partner in anything.
Anyone up for a little “barrel counting”?
**Cushing**
Currently 20,034,000 (06/12)
Oft referenced MOL: 20,000,000
Last time Cushing went below 20 MMbbl for a meaningful length of time was 2007~2008, when max. capacity was 55 MMbbl.
2026 Max. capacity: ~76 MMbbl
Currently 20/76 = 26% of total capacity
2008 = 13/55 = 24% of total capacity
In 2~3 weeks, maybe we get to 18mb, which would be 24%. Below that things may get spicy??? Anyone care to speculate on Cushing real MOL?
**SPR**
June 12, 2026: 340 MMbbl
Drainage rate: roughly 9 MMbbl/week
*Legal limit: 252 MMbbl
Time to legal limit: 10 weeks (2.5 months, or early Sept 2026?)
I gather that to go below 252, the pres would need to declare a severe energy supply interruption, but given Trump’s behavior to date, this would not be surprising.
*MOL: 150–160 MMbbl?
Time to 150 mmbbl: 20 weeks
So it’s a ways off, but eventually the party must end even for US SPR drawdowns as well as Cushing.
Also worth remembering the recent SPR releases are loans that must be repaid in oil.
~133 MMbbl have already been loaned to companies so far in that program, with interest rates at ~8–20% range, depending on market conditions and contract structure.
Article on SPR
https://oileyes.com/news/spr-release-2026-impact-analysis/
They claim a minimum of 250 Mb in US SPR for national security, the US reaches that level in 10 weeks if the 9 Mb per week withdrawal rates continue. Not clear Hormuz traffic will return to normal quickly, we will see.
Hi DC,
Thank you for sharing that article, it’s got a lot of valuable information!!
We definitely should keep an eye on how much oil makes it out of the Hormuz, with a sharp eye on whether it is (1) trapped tankers that loaded months ago finally getting out, (2) tankers carrying newly loaded oil from Gulf nations’ filled to the gills storage, or most importantly (3) *new* production from the Gulf nations.
Until/unless we actually see Gulf nations/OPEC ramp up production back to pre-war levels, we are still just moving inventory from one place to another while continuing to burn through storage/inventory.
Hi Again DC,
I just wanted to pick up a few notes from the fantastic SPR link you shared.
“Why You Can’t Draw Faster
The SPR’s maximum draw rate is theoretically 4.4 million bpd. But in March 2026, the Department of Energy (DOE) is only achieving 1.5 million bpd. Why? Because the salt caverns are losing pressure, and the “Salt-to-Oil” ratio is deteriorating.”
“The Degradation Problem:
Every time you pump oil out (by injecting water into the bottom), the water slightly dissolves the salt. Over 50 years of use, many of the caverns have become “misshapen” or unstable.
The Pumping Limit:
The DOE is reporting that several caverns in the Big Hill and Bryan Mound sites are showing “unstable pressure signatures” at higher draw rates. They are capped at 1.5 million bpd to prevent a structural collapse that would trap the remaining oil forever.
The Maintenance Backlog:
Years of underfunding have led to rusted pipelines and failing manifold valves. In 2026, the DOE is operating on a “Patch-and-Pump” model, which is inefficient and slow.”
(Source of future oil demand)
“the DOE must buy oil back at some point, providing a guaranteed demand of 170+ million barrels.”
“The National Security Minimum: How Much is Enough?
The “National Security Minimum” is generally considered 250 million barrels. In July 2026, the U.S. will be below this minimum for the first time since the reserve’s creation.
The Military Requirement:
The U.S. Department of Defense (DoD) requires a specific amount of high-grade sweet crude to be available for localized refining in case of a global war. The 2026 drawdown is eroding this specialized reserve.”
“Using AI to Manage the Salt Caverns
Here’s how it works: To prevent cavern collapse during the 2026 release, the DOE is using “Real-Time Acoustic Tomography.”
The Tech:
Sensors placed inside the cavern walls map the salt’s structural changes in 3D.
The Execution:
If the AI detects a “Spalling Event” (where chunks of salt flake off), it automatically throttles the pump rate to stabilize the pressure.
The Limitation:
Even with AI, you cannot change the laws of physics. The SPR is an aging infrastructure being pushed to its breaking point.”
https://www.mediapart.fr/journal/international/170626/la-chine-t-elle-stabilise-le-prix-du-petrole
Has China stabilized oil prices?
“According to some analysts, China helped limit the rise in oil prices by voluntarily reducing its imports. But the reality seems more concerning: it is global economic stagnation that has slowed the price increase.
At the start of the Iran War, global oil market experts predicted an apocalypse. The closure of the Strait of Hormuz, through which a quarter of the world’s oil and gas traffic passed, was considered a kind of “nuclear bomb,” a threat feared for decades. As recently as the end of April, the head of the International Energy Agency (IEA), Fatih Birol, spoke of “the greatest threat to energy security in history.”
Yet, the anticipated cataclysm did not materialize. Of course, the price of oil rose, exceeding $118 per barrel of Brent crude at the end of March and again at the end of April. Naturally, this increase was felt by consumers and businesses. The French inflation rate, for example, jumped from 0.3% to 2.4% year-on-year between January and May.
There will indeed be an economic slowdown as a result, which has already begun, particularly in Europe. The European Commission is thus forecasting GDP growth of only 0.9% for the eurozone in 2026. That’s 0.3 percentage points lower than last autumn’s forecast. And INSEE predicts another year of weak growth for France.
But we must also acknowledge that we are far from the catastrophic scenario of an “oil shock” and economic Armageddon that we could legitimately have feared. At their peak, Brent crude prices were up 62% compared to the level at the end of February (around $72.50).
And these levels were only reached briefly. The announcement of the Iran-US agreement brought prices back down to pre-war levels. On June 17, a barrel of Brent crude was at $79.50, just under 10% above the level of February 27. Since May 26, the price of a barrel of Brent crude has fallen below $100.
It must therefore be acknowledged that the “worst energy crisis in history,” according to Fatih Birol, did not trigger a crisis more violent than Russia’s 2022 invasion of Ukraine, which propelled Brent crude prices above $122 a barrel. This is a far cry from the scenarios of the oil crises of the 1970s, which were both more severe and more prolonged.
China to the Rescue?
What happened? For the past few weeks, a theory has been circulating: China helped stabilize the market by reducing its crude oil imports. This idea is supported by Bloomberg, which points out that official data from May shows a one-third drop in Chinese oil imports, which have returned to their level of eight years ago. Shipments by sea have fallen by 40% compared to the 2025 average.
Hence the idea that China has the capacity to voluntarily suspend part of its crude oil consumption to control the market. By reducing its crude oil purchases, China is said to have mitigated the impact of the war on the global market. It made nearly 3 million barrels of oil per day available to other countries, equivalent to the consumption of a country like Japan and twice the production of the United Arab Emirates. Supporting this theory is the fact that some tankers operating for Chinese state-owned companies delivered their cargoes to Europe, particularly during the month of April.
How could China have voluntarily deprived itself of a third of its imports? Part of the problem is easily solved: China has been building up gigantic strategic reserves for years, which amounted to 1.4 billion barrels before the war. To build them up, Beijing bought more oil than the country needed. Cessing these purchases automatically led to a decrease in imports. But, at best, only a third of the observed decrease can be explained by this.
For the rest, the explanations are less clear. It is unknown whether Beijing used these reserves and to what extent. Bloomberg also mentions the country’s electrification drive, which would reduce its oil needs. Since the country has overcapacity in these sectors, one can imagine that there was a shift. But this hypothesis seems unlikely, given that a massive shift towards so-called clean energy is difficult in two months. More certainly, China has used coal in certain industries, particularly petrochemicals, to replace oil.
This vision, which casts China as a stabilizing power in the oil market, is appealing. It would allow Beijing to cloak itself in the role of savior of the global economy, as it did in 2008-2009, when its massive stimulus package revived global demand, particularly in Europe. But this time, the situation is not so simple. The hypothesis put forward by Bloomberg is highly questionable.
The weak economy held back the rise in oil prices.
Other economists, such as Robin Brooks, currency strategist at Goldman Sachs, believe that the decline in Chinese imports is not the result of a desire to stabilize the market, but simply a consequence of the closure of the Strait of Hormuz, which deprived the People’s Republic of a portion of its supplies. The measures mentioned above would therefore not be deliberate, but rather adaptations of Chinese production capacity to the decrease in deliveries.
Indeed, Japan saw its oil imports fall by 58% year-on-year in May, and no one would dare claim that Japan attempted to stabilize the price of crude oil and the global economy. Indeed, like India, major Chinese companies resumed their purchases of Russian oil in March, which had been suspended in October 2025. This suggests that China, like most Asian economies, has suffered the effects of the war in Iran and has not been able to control them.
But then, why hasn’t the price of crude oil soared to $200? Undoubtedly, primarily because the underlying level of economic activity is fundamentally weak. In the industrial sector, the overall level of profitability is extremely low.
This means that any increase in the price of oil leads to a weakening of demand, preventing prices from skyrocketing. The $120 level appears to be a maximum beyond which the downward forces of demand prevail over the upward forces of the supply crisis.
It’s often forgotten, but the crisis of the 1970s occurred when the industry’s profitability was high. Demand therefore remained strong despite price increases, which is why shortages arose at the time. The situation is very different today. What has stabilized oil prices is the lack of any real economic momentum outside of financial bubbles like artificial intelligence and SpaceX.
In China, household demand remains weak due to the ongoing real estate crisis and has even deteriorated. Retail sales fell by 0.6% year-on-year in May. This is the first decline since the lifting of COVID-19 restrictions at the end of 2022.
Leading indicators are equally alarming. Loan demand in May totaled 520 billion yuan (approximately €66 billion), a year-on-year decline of 16.1%. According to analysts at CICC bank, “the weak appetite of households for credit is now being passed on to businesses.” Investment is therefore weakening in turn.
Faced with the effects of the war, demand deteriorated even further, contributing to price stabilization. However, in response to this situation, the People’s Republic was able to react by attempting to support the only remaining engine of growth: exports. Indeed, Chinese industrial production remained robust at +4.5% year-on-year in May (after +4.1% in April) thanks to strong external demand. Exports thus increased by 19.4% year-on-year in May.
Dans ce cadre, les autorités chinoises ont pu prendre des mesures de soutien pour maintenir la capacité productive du pays, qui, incidemment, ont pu jouer sur la stabilisation du prix global de l’or noir : interdiction de l’exportation des produits raffinés, fin des achats supplémentaires destinés à la constitution d’une réserve ou recours au charbon.
Mais ces mesures n’ont pas été les forces principales du marché pétrolier mondial. En réalité, les Chinois n’ont pas réellement besoin de maintenir le pouvoir d’achat de leur clientèle, précisément parce que leur stratégie est de profiter de la crise du pouvoir d’achat et de la faiblesse globale de l’activité. Les faibles prix chinois permettent de répondre à une telle situation.
La situation est donc loin d’être rassurante. La relative faiblesse de la flambée du prix du baril n’est que la conséquence d’une stagnation économique dont la logique a été renforcée par la guerre. La Chine a tout intérêt à favoriser l’idée qu’elle est capable, à elle seule, de fixer le prix du pétrole. Mais ce récit oublie que l’économie chinoise elle-même est frappée par ces forces de stagnation et qu’elle reste engluée dans une profonde crise immobilière.”
Romaric Godin
I don’t think an economic crash in China explains their lack of attempted oil imports, but if so it will show up in the data over the next 6 months.
Thanks for the perspective though.
For example-
“In 2026, China’s export sector achieved record-breaking highs, driven by soaring global demand for semiconductors, electronics, and AI hardware. Despite U.S. tariffs, manufacturers successfully pivoted to emerging markets, helping the country’s total exports surge 19.4% year-over-year to a record $376.78 billion in May.”
“ China has been building up gigantic strategic reserves for years, which amounted to 1.4 billion barrels before the war. To build them up, Beijing bought more oil than the country needed. Cessing these purchases automatically led to a decrease in imports at best, only a third of the observed decrease can be explained by this.”
They really need to explain this argument, with numbers. 1.4B barrels in reserves is more than enough to allow 5MB per day for 200 days (the article estimate a reduction of only 3M). So that could easily explain the reduction in Chinese imports.
So much journalism seems to have trouble with numbers. Why are so many people, including professionals, innumerate? I’ve known lawyers, who were otherwise competent, who couldn’t calculate simple percentages!
NIck,
Yes, people would rather jump to their conclusions as supported by the article (China is “consuming less oil”) rather than think carefully and do the math.
It is much more likely that China is simply “importing less oil and consuming their domestic oil inventory.”
I’m always reluctant to put anything on here, as it seems there are a bunch of people out there eager to tear down anything that makes sense, but I notice a lot of confusion about the drawdown at the Cushing Hub and a total lack of attention to how domestic U.S. production/refining/export got us to this point. So here goes.
With regard to commercial crude oil hubs in the United States, things really turned upside down during the Iran War. Domestic crude output surged by an astounding amount, which reflects a lot of chokes being loosened on producing wells. But the real story is that of WTI Cushing as opposed to WTI Midland. The Cushing Hub blends its incoming oil, whereas oil making up WTI MIdland is pure light sweet, coming from the distribution entities ECHO (Enterprise) and MEH (Magellan). Since unblended light sweet was exactly what European and Asian refineries were looking for, and since those two big sources feed directly into Gulf Coast export facilities and was readily available, this widened the spread between WTI Cushing and WTI Midland. As the demand for reliable U.S. oil grew, the Cushing sent large volumes into the Gulf Coast export facility, as well. The Cushing Hub gets all the national attention about going tank bottoms dry but most of the action was via the Gulf Coast export of WTI Midland crude oil, and it moved a lot of it during the blockade. Luck of the draw, fresh shale oil wells just coming online moved production quickly at $100/bll.
Cushing is still NYMEX pricing, which has been the holy grail in the past. But the war may have changed the calculus. In point of fact, there has been so little transparency about OOW, how much oil was actually piped around the blockade, and how many tankers were excorted out of the Persian Gulf that no one really knows what the true situation is with regards to global supplies. Not the EIA, not the IEA, and due to even legitimate tankers turning off their GPS or outright spoofing satellite surveillance, marinetrackers is scratching its head. This is an intolerable situation which may yet cause an unexpected pricing movement, but for now it doesn’t seem to matter to markets that Cushing is at the MOL. In other words, it’s almost down to the sludge and nobody gives a damn. This is remarkable in the extreme, but the Cushing Hub has likely lost its status for good.
MOL is minimum operating level for those who may be unfamiliar.
Hi GLM,
Thank you for sharing that.
I’m intrigued by what has been happening and what might happen to WTI/Cushing going forward.
Theoretically, Cushing is the delivery point for the Nymex contract, which is an important benchmark with LOTs of money riding on it. We saw how much Cushing can affect the pricing mechanism during covid when there was no storage space and the longs couldn’t get out of their positions.
Things theoretically could go the other way if there is not enough oil for delivery and the longs demand it from the shorts.
WTi has had a stronger backwardation than brent recently, which probably reflects this to some degree.
BTW I recall hearing the refining systems of Japan, South Korea, and much of China are generally optimized for Middle Eastern medium/heavy sour crude, not U.S. light sweet crude. Some Japanese commentators have suggested it is perhaps not sustainable/ideal to keep buying/using such large amounts of US light sweet.
Can you reconfirm if Asian refiners were actually looking for light sweet oil, or whether they just bought it because it was the only thing they could find?
Gerry,
You said “ Domestic crude output surged by an astounding amount”.
Could you point us to any publicly available sources of information about this? It sounds like an insider’s POV – I’m not pushing back on that as much as asking for information that could help the rest of us who don’t have that access.
Good to see you posting again, Mr. Maddoux.
Hope you continue and are doing well.
Count me among the confused then.
I could have sworn we got to this point because 77M in the US voted for our fearless leader who then ordered the US to go to war with Iran.
US weekly crude output from EIA at link below
https://www.eia.gov/dnav/pet/hist/LeafHandler.ashx?n=PET&s=WCRFPUS2&f=W
week ending 2/27/26 crude oil output was 13696 Mb/d and week ending 6/12/26 US crude oil output was 13806 Mb/d, an increase of 112 kb/d if accurate (these are weekly estimates which are based on STEO which is often inaccurate.
For monthly estimates see link below
https://www.eia.gov/dnav/pet/pet_crd_crpdn_adc_mbblpd_m.htm
The most recent estimate is March 2026 where output was 13696 kb/d ( 1 Kb/d less than Feb 2026).
When we look at tight oil output for US (most recent estimate from May 2026) output increased by 98 kb/d from March 2026 to May 2026.
The US did export more oil, but did so by draining its stocks (importing less and exporting more), eventually this has to stop. US output has increased by roughly 100 kb/d over past few months which does not substitute for a 10000 kb/d decrease in Persion Gulf output.
Thank you DC, these numbers help even if they are uncertain. Less than a 1% bump in US crude oil production during what is widely characterized as the largest supply disruption in history. Not a surprise.
https://oilprice.com/Energy/Crude-Oil/How-the-Oil-Sands-Became-the-Lowest-Cost-North-American-Producer.html
if Canadian oil sands break-even cost is $40, including diluents;
Vz heavy oil is probably only $10~$20.
These breakeven costs ignore the cost of the initial investment, they are bullshit pure and simple.
We will know if the costs are actually that ow when we see an increase in oil sands output in Canada, so far the increase has been quite gradual.
Venezuela is a much more risky place to invest, I will believe that much more oil can be produced when I see it. So far Venezuelan output has not increased by much.
https://thecriticalthoughtlab.com/the-echo-chamber-trap-why-leaders-surrounded-by-yes-men-are-destined-to-fail/
Why leaders (Donald Trump, Elon Musk, Sam Altman, etc) surround themselves with “YES” men.
And why their ideas inevitably fail:
Trump:
1) Select people based on if they are good looking or a billionaire or have a sellable image (“General Mad Dog Mattis”).
2) Only select people who are 100% loyal and massage your ego.
3) When Trump’s ideas inevitably fail, blame the “Yes” man (Pete Hegeseth)
“Hegeseth really loves to go to war” – Trump
Rinse Repeat
Hilarious turn of events:
1. Change name of “Department of Defense” to “Department of War”
2. Start a stupid and unecessary war.
3. Lose the Department of War’s first war.
At the same time Trump signed the treaty in Versailles, Moscow got bombed by drones even more scarring than Ju-87 in 1941.
The modern warfare has changed, and will revolutionize in the coming months/years.
Sheng Wu,
“The modern warfare has changed …”
That might be the understatement of the year.
Interesting analyst/commentator – Stanislav Krapivnik (Luhansk-born, former US Army officer, now residing in Moscow) – says that frontline Russian soldiers are using 3D printers to continuously modify FPV drones for specific maximal effectiveness in their areas.
If successful, models are sent to manufacturing plants for quick mass production.
This is an ongoing, daily process.
Hezbollah FPV (First Person View) drones costing ~$500 are routinely destroying $10 million Merkava tanks.
At least one of the two Israeli ‘bases’/outposts set up within Iran were actually mini drone ‘factories’ that were producing drones right on Iranian soil.
To say this dramatically expands the operational footprint of these devices would be an understatement of the highest order.
Entire legacy armaments and doctrine (looking at you, $10 billion+ aircraft carriers) are now – or rapidly becoming – functionally obsolete.
Coffeeguyz,
Do you have a source other than Hezbollah itself that confirms your claim that “Hezbollah FPV (First Person View) drones costing ~$500 are routinely destroying $10 million Merkava tanks” ?
T Hill,
Drones now seem to be a major component of military power. It would not be surprising to hear that they are now an issue for the IDF in Lebanon.
It looks like this death occurred inside a tank hit by a drone:
Hezbollah rockets and drones killed Sgt. First Class Nir Ben Ari
https://www.ynetnews.com/article/b16zxu4fmg
The IDF has announced the death of two soldiers in Kfar Tebnit, southern Lebanon
Sgt. Yoav Klein and Staff Sgt. Nir Ben Arim were eliminated **inside their tanks** after being ambushed by Hezbollah ATGM crews and FPV drones.
https://t.me/Middle_East_Spectator/33796
THC
Can drones destroy armored vehicles? Yes, that has become clear in Ukraine.
My question relates to the details of the statement. $500 drones and ‘routinely’ successful. Scale matters. These qualifiers would have larger implications about the conflict between Israel and Hezbollah, which would in turn have implications about the possibility to successfully re-open and maintain the SOH.
Hi T HILL,
Yes, I understand. Quantitative information matters.
The Fog of War has been awfully thick these past few years, and it is highly difficult for someone not in a priviledged position to have an idea of what is really going on in the battlefields.
some geopolitical analysts believe that now Trump want to focus on Russia-Ukraine war to totally control EU and rest of the world.
BREAKING: US Vice President Vance has cancelled his Switzerland trip for Iran negotiations which was intended as the start of nuclear talks, per Press pool.
This follows Iran’s cancellation of the same Switzerland trip and 60-day negotiation period with the US after Israel…
https://x.com/HormuzLetter/status/2067792955524432118?s=20
Verified by Trump mouthpiece:
https://www.axios.com/2026/06/19/us-iran-talks-vance-switzerland-trip-postponed-white-house
Re Doomberg & China,
This doomberg fellow apparently has been claiming that China not only reduced oil imports, but reduced consumption.
“Doomberg said China didn’t touch its reserves for weeks and when it did pulled out **only 500k – 1 million barrels per day**. Do you think that’s incorrect?”
https://x.com/Katagorically/status/2067038847959994824?s=20
I’m hearing this indirectly, as I don’t want to listen to long-form audio interviews with a giant green chicken.
But apparently a lot of people seem to trust him (nice PR job).
Does anyone here have solid evidence China actually reduced end-user consumption of fuel (gasoline/diesel/bunker oil/ jet fuel) by millions of barrels a day during the 100 days of Hormuz?
If so, please share it………I’m interested if there is any data behind these claims/stories.
the differences between China and US SPRs are
1. China only fast increased SPR in recent 2 years, and according to some sources, as large as 2MBOPD at the very late last year; while US SPRs have been stabilized or even downward trend in recent years?
2. China SPRs are less transparent, and non centralized than US SPR, and many were operated by 3 major NOCs, and many even by tea pot refineries. China central government only have SPR statistics, but not ground level direct management.
One simple estimate of China reduction of crude use is the Taxi/DD market, about 5million are EVs only recently (2~3 years), and each day replaces 20 gallon of gasoline (half a barrel), that along is 2.5MBOPD replacement.
me too suspect the over 1 billion SPR (some sources even quoted 2B or larger) by China, it is like China has forecasted the abduction of Vz oil and war with Iran?
The key issues here — last 2 years, especially 2025, it is like “differential/change”, here is my analysis,
1. China SPR stockpile rate probably increased to just over 1MBOPD (not 2MBOPD), the other 1MBOPD extra is due to China’s forecast of fast refined fuel export. China basically leverage the industrial “overcapacity” with low global crude price to expand the refining sector and make money much like India has done with Russian crude, but China got more discounted Vz and Iran Crude along with Russia crude. The jet fuel production/export data is one perfect example.
China’s 3 NOCs and teapots, increased SPR (non centralized) not because China forecasted the Vz takeover and Iran war, but because they want to refine more crude and therefore increase stockpile. The refined fuel export, i.e. effectively hiding demand cave-in, increase to 1.6MBOPD, but the stockpile/SPR probably increased another 0.5~1MBOPD.
2. China EV displacement (1.5~2.5MBOPD, yes, THC, in the last 2-3 years) and economic slow-down (~1MBOPD) also happened in the last 2-3 years in large scales, and they interact with the refining/export force above.
The net results are
1. In 2025, real SPR~1MBOPD (+) ordered by central government, EV displacement 1.5~2.5MBOPD (-) compared to 2023, slow-down ~1MBOPD (-), and export ~2MBOPD (real export 1.5MBOPD and forecast induced stockpiling 0.5MBOPD) (+). The (+) means increased import and (-) means decreased import. So net import stay the same (+1-1.5~2.5-1+2) around 11MBOPD.
2.Effectively increase the “obvious SPR stockpile to over 3MBOPD” (my analysis here, +1+2), but other sources give CHina SPR from 1.5~2MBOPD in late 2025);
or “hiding the demand/consumption caved-in” to close to 5 MBOPD under the over 11MBOPD import as soon as SOH price hike happened, i.e. China stops SPR and fuel export, and related stockpiling.
Hi SW,
Thank you for sharing that!
I agree that Chinese gov’t and commercial inventory data is likely much more opaque than that of the US.
Regarding the reduction in end-use of fuels derived from crude oil, you referenced the increased use of electric vehicles among taxis/delivery drivers during *the past 2 or 3 years*.
Just to be clear, I am specifically looking for data pointing towards a multi-million barrel per day decline in end use during the Iran war that began on Feb. 28, 2026 (past 3.5 months).
I’d be interested if anyone has any specific data or even a theory for what areas of end-user consumption could have been cut on the order of millions of barrels per day since Feb. 28 of this year.
Thank you!
https://www.independent.co.uk/news/world/americas/us-politics/elon-musk-grok-ai-iran-missiles-pentagon-b2997321.html
Pentagon uses Musk’s AI Grok to fire missiles at Iran.
Insiders at Pentagon believe this may have led to one of missile hitting the girls school that killed many children.
“Outside analysts have suggested that the Pentagon’s AI-driven targeting — in addition to human error that failed to check whether target maps were up to date — may have played a role in the bombing.”
AI psychosis is really out of control.
Anyone who watches a few YouTube videos on Machine Learning and Neural Networks can easily see they are probabilisitic in nature. They “Hallucinate” and cannot be trusted without a human reviewing their conclusions.
The algorithms have a learning/error rate built into them.
They can’t detect the numbers 0 – 9 (as pictures) with 100% accuracy
the same FSD software for Model3
Keep perspective of timescales and you can easily see how easy it is to err. We are extracting hydrocarbon deposits that formed over millions of years. In comparison a 50 year error in estimated depletion date is barely a blip. It looks meaningful to us humans, since our timescale perception is heavily biased by our limited lifespan. Compared to a human life 50 years is a lot. Compared to the geological deposition rate its nothing….
China May 2026 vs. 2025
Metric May 2025 (mmbbl/day) May 2026 (mmbbl/day)
Gross Crude Imports 11.3 8.1
Refined Product Imports 1.1 0.6
Refined Product Exports 1.6 0.9
Net Adjusted Imports 10.8 7.8
Net crude & products imports declined 3.0 MMbblday.
**Gemini 3.1 Pro estimated breakdown of 3.0 mmbbl/day**
Inventory Consumption (2.2 mmbbl/day)
The vast majority of the missing imports are being replaced by liquidating domestic reserves. Because China spent the previous years building near-record stockpiles, they have the physical buffer to absorb the initial shock.
Continuous drawdowns from commercial and independent “teapot” refinery tankage account for approximately 0.9 mmbbl/day.
Direct releases from the Strategic Petroleum Reserve (SPR) and state-mandated floating storage offload account for an estimated 1.3 mmbbl/day.
Demand Destruction (0.8 mmbbl/day)
Actual reductions in end-use consumption accounts for the smaller share of the deficit. This reduction is driven by intentional rationing and unfavorable refining margins rather than civilian consumer shortages.
Petrochemical feedstock demand (primarily naphtha and ethane) has collapsed, accounting for 0.5 mmbbl/day of the destruction. Refiners have idled cracking units as the raw input costs became instantly unprofitable.
Reductions in aviation fuel, marine bunkering, and marginal heavy-duty road transport account for the remaining 0.3 mmbbl/day.
`~~~~~~~~~~~~
Based on the data gathering and analysis by Gemini 3.0 Pro, in May 2026, Chinese end-use consumption of fuel only declined 0.3 mmbbl/day.
Basically a neglibible amount.
More “fact checking” using Gemini 3.0 Pro**
Q. How much crude oil in mmbbl/day has been making in through the Hormuz in May and the first half of June 2026? Search for filetype:pdf, IEA, EIA, and direct maritime logs.
A. Based on the latest maritime tracking data, IEA emergency updates, and EIA reports from May and June 2026, the volume of crude oil physically transiting through the Strait of Hormuz waterborne route is effectively zero.
Maritime Log Confirmations
Direct satellite tracking and AIS (Automatic Identification System) maritime logs indicate a complete cessation of tanker traffic through the chokepoint itself due to the ongoing 2026 closure and associated maritime risks.
May 2026 Flow: 0 mmbbl/day
June 1 – June 15, 2026 Flow: 0 mmbbl/day
Prior to the closure, average daily transit was approximately 21.0 mmbbl/day.
Alternate routes:
Using the standard flow estimate for Fujairah combined with Yanbu’s practical port capacity, the total combined export figure is 5.5 mmbbl/day.
“May 2026 Flow: 0 mmbbl/day
June 1 – June 15, 2026 Flow: 0 mmbbl/day”
In real life, CNN and other news sites, together with amateur monitoring of AIS, shows that there are typically 10 or so vessels transiting the strait every day, together with an unknown number with no operating AIS.
So the ‘fact-check’ is just AI slop. It hasn’t checked ‘AIS maritime logs’ or anything else. It’s produced a core number which is demonstrably wrong, surrounded by fluff language.
I’d hate for this site to deteriorate into another AI-slop site.
Hi Gerry,
Yes, fair enough, there is likely some degree of stuff transiting, but I don’t see any verifiable quantitative data.
Perhaps it would be best to focus on numbers that are at least official gov’t stats, such as US weekly inventory data, OPEC production numbers, etc.
It will be interesting to see the next monthly OPEC data. For now, OPEC production data shows HUGE declines, from which it can be inferred they are not getting enough oil through the Hormuz to allow them to restore production to anywhere close to pre-war levels.
Fair point on the AI — I’ll try to resist the urge to post AI stuff here.
If this agreement comes anywhere close to current terms, then no USA administration has ever given more to enable an adversary than this one. Not even close by a thousand miles.
And who has presided over such massive damage to US bases and squandered munitions ($) and international standing more? Maybe Bush, or the administrations who engaged in the Viet Nam tragedy perhaps.
Great time for the Iranian Theocracy.
Hi Hickory!
Yeah, I have trouble imagining any of the major players (US, Israel, Iran, Gulf Arabs) have the intention to fully comply with this document that Trump signed in Versailles.
So what is really going on?
All we can do is speculate.
This substack article explores some possible scenarios:
https://ajsignalnotnoise.substack.com/p/my-49-indicators-are-flashing-red?r=83255l&triedRedirect=true
I could not find any information about the author, so I assume AJ Jaff is a pseudoym and that his substack account is being promoted by the algos for some reason (psychologial manipulation?).
A couple of short snips:
“When the visible event does not match the structural conditions, the framework asks one question. What is the visible event actually accomplishing if it is not what it appears to be?”
“The first possibility. The MOU is exactly what it appears to be. The American institutional architecture has genuinely calculated that a phased peace with Iran serves its long-term interests better than continued kinetic exchange. ”
“The second possibility. The MOU is another tactical pause. The American institutional architecture has calculated that 60 days of compressed risk premium, replenishment cycle (etc)……is more valuable than continued kinetic exchange right now for this phase of the battle plans. The deal is signed because the deal serves an immediate tactical purpose.”
“The third possibility. The MOU is theatre that produces the diplomatic cover for the kinetic resumption that follows. The Vance media tour pre-positions Iran as the eventual non-compliant party…….The cognitive dissonance manufacturing seeds the public for the framing that when the MOU fails, the failure is Iranian bad faith rather than American structural impossibility.”
Anyway the Iranians closed the strait again. Trump can’t even surrender right.
Alimbiquated,
Obviously, both Iran and Trump need 60 days Taco time to have a breath and then fight will resume
THC,
That article seems to have the silly idea that this president is playing 7th dimensional chess. He’s not, and he doesn’t have a deep bench of sophisticated advisers (what the heck is an “institutional architecture”??). He’s incompetent, and his staff and appointees are incompetent. Further, his Secretary of war(!) is deeply incompetent and has been purging competent and independent military officers. This president has created a wide circle of incompetent sycophantic loyalists.
The simple explanation is that the war failed, and the president simply exited and declared victory because oil reserves were about to run out and he was forced to take the best (terrible) deal he could with a MOU that attempts to paper over it’s deep problems.
Hi Nick!
“That article seems to have the silly idea that this president is playing 7th dimensional chess.”
I recall mentioning here before that I do not see Trump as capable of formulating any sort of grand strategy (or playing 7D chess). If that is happening, it is being done by others behind the scenes.
Please also note that the article’s speculation refers to “The American institutional architecture” as behind whatever is going on, not “Trump the individual.”
THC,
Well…please re-read my comment. I don’t believe there is an “American institutional architecture” providing intelligent support here. This president has created a wide circle of incompetent loyalists. Wealthy people in the background that influence this president, like Charles Koch, Peter Thiel, and Elon Musk, are deeply committed to irrational, unrealistic ideas.
OTOH, I’ve noticed some pushback against some of the president’s goofier policies from people like Koch and Rupert Murdoch. It seems clear that this president rejects anyone who disagrees with him, and believes that he can do anything, no matter how unhinged, without consulting with anyone. As we have seen lately, this is a recipe for disaster.
Rig Report for the Week Ending June 18
The dropping rig count that started in early April 2025 when 450 rigs were operating was unchanged for this week. Drilling continues at a steady rate of 367 ± 5 rigs per week since August 2025. Today WTI closed at $77.54/b, down from $84.54 last Friday..
– US Hz oil rigs were unchanged at 372, down 78 since April 2025 when it was 450. It was also up 10 rigs from the low of 362 first reached in the week ending August 1, 2025. The rig count is down 17% since April 2025.
– The New Mexico Permian Hz rig count dropped by 1 rig to 70. Eddy added 1 to 37 while Lea dropped 2 to 33.
– Texas was unchanged at 195. Midland dropped 1 to 21 while Martin was unchanged at 23. The only changes were in Upton, +1, and Midland -1.
– Eagle Ford was unchanged at 34.
– NG Hz rigs added 1 to 104.
– Directional rigs (Drigs) rose by 1 to 55. While Eddy county was unchanged at 20, 1 Drig was added in Texas for total of 15. Texas Drigs rose slowly from 8 in mid-May to 15 this week. The HZ plus Drig count rose by 1 to 427.
A Rig
Frac Spread Report for the Week Ending June 19
The frac spread count was unchanged at 192. From one year ago, it is up by 10 spreads but is still down by 23 since March 21, 2025.
A Frac
Today President Trump admitted that he did the Iran deal in order to subvert a 2nd Great Depression. That admission puts the Iranian theocracy in the catbird seat, as it reveals to the whole world that they are in position to control the Middle East. They have learned that they can likely charge a substantial toll on tankers in transit the SOH. They are aware that all Gulf neighbors are putting in pipe to bypass Hormuz. And they are gleefully aware that the pipe will circumvent the Strait, only to wind up near the mouth of the Red Sea for exportation, just inside another chokepoint called Bab el-Mandeb, which is in close proximity to one of the most cunning and angry Iranian proxies, the Houthies. I doubt the Middle East oil market is ever the same.
In the U.S. it was bedlam getting as much crude oil to the Gulf Coast export terminal during a time of good prices and oil scarcity. The ECHO and MEH pipes put at least 5mbopd into immediate export, but then the Cushing Hub was drained as well, almost to the MOL. Not only that but the SPR was drained down to about the 35% marker (enough to cause calving of the salt in the caverns if not refilled pronto). WTI Midland was all the buzz, because it was immediate and secure and available no matter what, even drawing a significant premium to WTI Cushing. All this was done not to help out the oil-thirsty countries but to keep gasoline prices low in the United States. I doubt the domestic U.S. oil market is ever the same.
The Asian refiners (mentioned above), like most, prefer Murban crude oil from Abu Dhabi, because it drops out more middle distillates when heated: like kerosene for jet fuel, and diesel. But they receive enough heavier grades from Russia and the Baltic states to mix with the light sweet oil of the shale fields, and besides, even the tight oil gives up some middle distillates.
Conventional oil production in America went all in during these halcyon days, producing as hard as it could, because it has been a sector seriously winged by the shale basins. If you’re an owner in conventional oil you feel pretty good about that, until you realize just how dwarfed you are by shale oil. And then ponder the circumstances by which you became important again.
This post-kinetic looking glass makes the last decade all the more tragic, seeing a sad reflection of how recklessly we’ve sold away one of our most precious commodities. Of all the ink that has been spilled talking about when the end of oil in America will be, think of the fact that we had the bull by the balls on a downhill pull: that is to say we had anough oil in place to last as long as any American needs oil. Sure it requires blending for some uses, but add in a little Canadian oil, or now the ridiculously inexpensive road tar from Venezuela, and we were as snug as a bug in a rug, secure with oil until whenever, so maybe, uh, regulate it a little bit.
I am an American, and a capitalist of sorts, but something like this war shows the absolute hubris of man, the greed of an overly erect Homo erectus, the contest to get richer faster. As anyone who has read these pages knows, I am old-fashioned, and believe we should support the president whenever possible. But lordy, the world oil market has been turned on its head (see above, which is the toned-down version)! I thought we might have dodged a bullet, but now I’m beginning to think no, we have just changed positions in the musical chairs game. Now, it would appear, the Arab Cooperative is willing to pay a paltry $300B to get Iran to stop shooting at them, and we’re thinking that’s a great deal because the S&P500 is going up and the price of WTI down, and besides it’s not American money, so we’ll just scooch over into this other, smaller chair and cower like a weak sister until the arguing is over and everyone is rich from betting on Nvidia and SpaceX putting data centers into outer space. Who gives a shit if the uranium is still in Iran somewhere? I mean, for God’s sake, they swear they won’t annihilate Israel!
One can only pray at this point: that a concerned Congress will not ratify this deal. And while we’re praying to our God, you know damned well the mullahs are praying to theirs, thanking Him for their great good fortune.
“ I am old-fashioned, and believe we should support the president whenever possible. ”
I think most people feel that way. I really, really, really, really want to be able to support the president. It’s just that with this president it’s so, so difficult!!
Beavis and Butthead chiming in :
“You said ERECT HOMO erectus”
Gerry, very much appreciate your perspective. It’s human nature to align with authority especially when one is not abused by that authority. Oil wealth aligns one naturally with gov’t authority as that resource empowers gov’t as it does each of us individually.
The war was initiated without Congress or consultation with Gulf countries. The MOU isn’t a treaty requiring Congressional ratification nor does Trump wish to recognize Congress’ Constitutional responsibility to wage war or sign treaties. Theoretically if the MOU leads to a treaty that would be Congress’ entry into the process.
My guess is the most likely outcome if Trump remains active in negotiations is continued stalemate as Trump doesn’t believe in compromise only dominance and his representatives in negotiations aren’t diplomats.
Methinks the US has to burn through more wealth and power before considering wisdom learned from sacrifice.
“ The war was initiated without Congress or consultation with Gulf countries.”
And, crucially, there was no effort to inform, educate or consult with the general public.
“The MOU isn’t a treaty requiring Congressional ratification”
The MOU is not legally binding without Congressional ratification. The Iranians should not rely on it without ratification.
https://www.execfunctions.org/p/the-president-is-legally-barred-from
Of course, this president tore up the 2015 agreement without notice or clear justification, so it’s not clear why the Iranians should rely on *anything* the US promises.
It’s going to take a while for the US to regain *some* of the trust and credibility it had before.
Gerry, you may be human after all. The idiocy of this war was evident to every other nation on this planet from the 1st March onward. Only one person now controls how this will end, and that is Netanyahu. Trump is terrified of the economic harm that he has caused, and everybody know it, and Iran will push every lever imaginable to wring every last dollar in restitution. However Netanyahu also knows this and his own political survival depends on continuing the endless war, so he will simply ignore Trump and keep fighting. We are in a game of rock paper scissors, and there is no easy end. Iran will close the strait, Trump will resume bombing and people will keep dying, and the impending global recession will keep growing deeper. The real terrifying possibility is that Trump will escalate to bombing Iranian energy and/or water and electricity infrastructure..At that point with 100% certainty Iran will retaliate against the oil and gas infrastructure throughout the Gulf, and that will trigger the collapse of the global financial system. Permanently. The great simplification will have begun.
Ralph,
I agree with most of what you said, but…it’s worth saying that “the great simplification” is highly unrealistic. It comes from a belief of Nate Hagens that FF has almost magical properties that can’t be replaced by other energy sources (wind, solar+batteries, nuclear, hydro, etc.).
Now, a big oil shock is going to put big stress on the finance system, no doubt. But the idea of financial disaster comes from a notion that oil is irreplaceable. Without that assumption one can see that disaster isn’t inevitable or even the most likely thing.
Nick G,
I think I can see some of your perspective, since Hagens does come across as a bit of an evangelist.
However, unless I’m missing something the fundamental issues of the scale and rate of transition away from FF remain. I would be interested to hear if you can point to any solid work showing our ability to climb these two mountains. Not the underlying technical feasibility of any one particular process.
Would it be possible to maintain our modern industrial society using only solar, wind, and batteries (or similar “rebuildable” energy technologies)?
Can anyone direct me to a published, independently validated experiment which demonstrated a completely closed, fossil‑free system in which wind, solar, and batteries are the only energy sources used to mine raw materials, manufacture, transport, assemble, and install all of the wind, solar, and battery capacity in that system?
Nick G
The problem of a potential 15-20% cut in fossil fuels essentially overnight is the rate of change, far too high for the financial system to absorb, which is based on exponential growth to sustain the ever growing debt. Such a cut would lead to the US defaulting on its government debt (along with many other sovereign states) which has the highest national debt in the world (40% of all sovereign debt globally). However, the point of the great simplification is that exponential economic growth is unsustainable regardless of energy. Humanity has already been identified as passing 7 of 9 global natural systems sustainable limits. Irreversible global economic contraction is baked in, probably in the next 20 years. Trump is simply accelerating the process. The key is to preserve as much of the benefits of civilization whilst preparing a nucleus of humanity intellectually, socially and emotionally to pick up the pieces from the wreckage.
The modern technological and logistical underpinnings of civilization depend on abundant, and ever increasing amounts of fossil fuels. Wind solar and batteries cannot replace them.
Similarly, the extraction and transport of fossil fuels are limited by the ability of coopers, wagon makers, and drovers to make sufficient barrels, wagons and mule teams to carry the fuel from well to railhead. Even scaling up to thousands of barrels per day would require more mules than exist in the entire world. It is pure fantasy to speculate that fossil fuels can ever be produces at rates anywhere close to a million barrels per day. We are surely better off continuing to rely on our abundant coal resources to power civilization. Nothing bad could possibly happen from the subsequent release of carbonic acid into the atmosphere from the combustion of coal.
Liquid fossil fuels are at most a useful niche product and are destined to remain so for the foreseeable future.
FF questions
Wehappyfew,
I enjoyed your comment – I’m assuming it’s intended as humorous irony. Sadly, written irony on the internet is often confusing. I’m told that Europeans tend to use and understand irony more than Americans…
T Hill,
Speed of scalability is a reasonable question, but it’s not the central question for Nate. See THC’s question for an example of this POV. So, I’d be happy to discuss questions of speed of transition, but first it would be helpful to address the basic question of whether there are substitutes for FF.
THC,
The answer is yes, it’s quite clear that FF can be replaced.
First of all, we can certainly find places where non-FF energy sources provide all of the power: hydro in Scandinavia (especially Norway), geothermal and hydro in Iceland, nuclear in France (it’s not 100%, as that wouldn’t be optimal, but it could be with a bit more nuclear buildout).Denmark gets 60% from wind and solar. Have you looked at Mark Jacobson’s scenarios for this transition?
2nd, Norway is now at 97% of new passenger vehicles being EV. Nepal is at 76%. China is at 62% and moving aggressively to grow that.
“mine raw materials, manufacture, transport, assemble”
All of that can be powered by electricity, with existing commercial equipment. Mining, especially underground, is quite electrified. Manufacturing, transport, assembly ditto.
Now, there are niches where liquid fuel is likely to be essential for a while – aviation is the obvious one. But liquid fuel doesn’t have to be FF. Just talk to almost any chemical engineer: they’ll cheerfully confirm that. Now those liquid fuel competitors may be substantially more expensive, at least at the moment, but they’re perfectly viable. And the same is true of synthetic versions of various forms of FF: n gas, diesel, jet fuel, etc. You can create solid hydrocarbons – charcoal is obvious – though I don’t know why you would want to.
This is a big topic, but you might want to look at Germany and China: they’re both clearly leaders in tech and engineering, and they’re both moving away from FF as quickly as possible. Germany in particular has made it clear that they intend to completely move away from FF, and seriously, do we think they’re committing to something that won’t work?
A couple more thoughts: the word “rebuildables” is silly. It’s an attempt to dismiss the fact that renewables tap into a power source that is non-depleting. Any human system will require maintenance and occasional replacement -that’s just not a serious objection,
The idea that we can’t do something that hasn’t been done before is also silly. Standard engineering principles and methods allow analysis of new systems, and give reliable results that allow people to move forward with confidence with things that have never been done before. Occasionally very large systems run into problems with time and cost overruns – complex IT systems are notorious for that, and nuclear has that problem (which is why it’s a also-ran in the competition for new power), but asking for evidence in the form of a 100% non-FF country is just..non-serious.
Finally, scale is just not a problem: the sun drops 187,000 terawatts continuously on the Earth, and human civilization only currently uses maybe 20TW at the most.
wehappyfew
I like the sarcasm, very entertaining! Last time I checked that niche of yours is still more than 30% of the global energy makeup.
The question remains. The scale of any such transition is daunting. Smil does a decent job in illustrating this here for Canada:
https://vaclavsmil.com/wp-content/uploads/2024/06/HALFWAY.pdf
Do you have experience with this scale of infrastructure buildout? Does anyone? My own experience limit is a few billion US a year, and that is a tiny fraction of the several trillion per year that the IEA estimates would be required (link below). And that is entirely setting aside the flaws in the IEA roadmap.
https://iea.blob.core.windows.net/assets/8ad619b9-17aa-473d-8a2f-4b90846f5c19/NetZeroRoadmap_AGlobalPathwaytoKeepthe1.5CGoalinReach-2023Update.pdf
I agree with the energy transition goal, and that the finite nature of the resource ensures eventual ‘success’. It seems like that success will come after a long tail of combustion though.
THC,
Sadly, Vaclav Smil is a closet FF advocate. He hides it some of the time, but it’s clear. Here’s a quote from one of his books (Numbers Don’t Lie, page 112) “And diesel engines are here to stay. There are no readily available mass-mover alternatives that could keep integrating the global economy as affordably, efficiently, and reliably as Diesel’s machines.” That’s just silly. Electric motors are cheaper, more efficient, and more reliable than diesel engines. And electric is also much cleaner: diesel produces a lot of pollution.
So…you have to read his stuff very carefully and skeptically when it comes to the transition. The name of this particular book is instructive (Number Don’t Lie) because Smil is expert at misleading his audience. For instance, the quote above talks about “integrating the global economy”. Well, he can argue that diesel fuel is the best way of fueling the water and air transport that “integrates” the global economy, and there’s a splinter of truth to that, but water and air transport are a relatively small fraction of total oil consumption. Passenger transportation is by far the largest segment at about 40-45%, and it’s easy to electrify. Trucks, trains, and buses are very amenable to electrification, as China is demonstrating. So Smil is making a misleading argument – his audience will think he’s making a larger argument, and if challenged he can retreat to a defense of water and air transport.
The simplest way to replace FF infrastructure is simply to stop building it and start replacing it as it wears out. We’re really at that point now with electricity. It’s not the fastest approach, but it would get us there fairly quickly. The world could, if it desired, fairly easily end ICE manufacture in 10 years (that’s roughly 2 auto industry development cycles, and 2 doublings from the current EV production level).
Heck, if we were really serious we could stop manufacturing ICEs right now – it would require WWII type economic transformation, but it’s certainly doable – WWII demonstrated it. Have you read the stories of conversion to military production from that era?
Smil also mixes, in a misleading way, discussions of technical & economic barriers with totally different political problems. It’s certainly true that there’s a great deal of resistance to a transition from politically powerful players, and a great deal of pro-FF misinformation being propagated online and in rightwing media. That’s a real and very serious problem, but it’s very different from real, fundamental technical problems.
I could go through this presentation point by point, but I don’t have time right this second. Sadly, refuting pro-FF arguments is a tedious game of whack a mole: there’s always new ones, though the old ones keep coming back repeatedly, no matter how often they’re refuted.
As far as scale goes, I think you should look at how much is being spent on FF infrastructure, and how much on renewables and electrification. On the one hand, it reminds you of the large scale of energy spending, which suggests that large numbers in this area are nothing new; and on the other hand you’ll see that renewable/electrification spending is already higher than you may have noticed. A quick search indicates that total spending on wind and solar is about $1,000B per year, about twice the number for upstream oil.
So….I agree that the transition is likely to take longer than our best aspirations, but I would argue that it’s primarily a political/crony capitalism problem, and that the best way for us to understand this is as a political challenge. If we want things to be better, we should be politically active: have you called your representatives lately to let them know that this transition is a priority to you?
“the financial system to absorb, which is based on exponential growth to sustain the ever growing debt. Such a cut would lead to the US defaulting on its government debt (along with many other sovereign states) which has the highest national debt in the world (40% of all sovereign debt globally). However, the point of the great simplification is that exponential economic growth is unsustainable regardless of energy.”
This is unrealistic.
Sure, a big and fast reduction in oil supply would be a shock. Such a shock would require good management, something we definitely don’t have in the Whitehouse right now. OTOH, there are still good old fashioned bankers in the Fed (despite Warsh & the president).
Exponential growth – well, first it’s not required for our current economy – that’s just a myth. If growth ended, so would significant interest rates. IOW, growth causes interest rates, not the reverse. For example, Japan has recently had low growth, and rates went negative!. Now, lack of growth would be very disappointing – it’s also unlikely. Oil & FF are not needed for growth.
“exponential economic growth is unsustainable regardless of energy.”
I think if you look closely you’ll find the primary argument against growth is about energy. If you can find text that clarifies that’s not the case, I’d be interested.
Nick G
We agree in some areas, but I can’t tell if we’re talking past each other elsewhere.
A transition away from fossil fuels is about much more than liquids & transportation in your comments. Think cement, steel, glass, haber-bosch, plastics, etc. As I understand it, the science is clear that there are technically feasible alternatives for all of these.
Whether or not the scale, resource availability and transition rates balance with depletion on a path of continued growth is not as clear.
It also seems fairly clear that any such transition is not sustainable for 10B people, and would/will have a limited duration linked to how many people it supports.
I also don’t understand your comment that “the primary argument against growth is about energy”. This makes no sense to me. Think LTG, the theory of planetary boundaries or simple ecological arguments.
“A transition away from fossil fuels is about much more than liquids & transportation”
Sure. But liquids & transportation account for 70% of oil consumption, and their consumption can be reduced quickly – just look at China, with 62% of new passenger vehicles already being EV. ICE vehicles clearly peaked several years ago, while oil production has not clearly peaked. And, there’s really no clear evidence that oil is going to peak in the near term. Actually, I think we’d all be better off if it did – sadly, we’re going to have to choose to move away from FF – depletion isn’t going to do the job for us…not fast enough, anyway.
“It also seems fairly clear that any such transition is not sustainable for 10B people, and would/will have a limited duration linked to how many people it supports.”
Well, I’m not an expert on all of the environmental problems that we’re creating. But that statement isn’t realistic for the energy realm.
“that “the primary argument against growth is about energy”. This makes no sense to me. Think LTG, the theory of planetary boundaries”.
Well, LTG is all about energy. So is the most popular analysis of our environmental “footprint” (see below). IIRC the Planetary Boundary analysis makes the unfortunate assumption that GHGs are “waste”. This is based on a false analogy between biological waste and FF emissions. In fact, FF is not essential, so its byproducts are not “waste”, they are pollution.
————————————————————
The Club of Rome Limits to Growth 1972 study is sometimes presented as evidence for an inevitable collapse. But…it’s not. It’s simply an analysis of what it might look like if we DID hit resource limits.
It’s a very, very simple model. It had 5 major variables: population, industrialization, food production, resource depletion, and pollution. Resource Depletion models non-renewable resources, which in both the original version and in a recent revision is explicitly modeled on fossil fuels. Except for food (aka agriculture) there is no provision for renewable energy such as wind, solar, hydro, geothermal, etc, despite the fact that these resources are much, much larger than fossil fuels. The only renewable resource is a relatively small one, agriculture: “Non-renewable resources, measured in resource units Meadows et al. (1972), include all non-renewable resources on Earth… In order to provide suitable and accurate data, fossil fuel consumption is chosen. Although this proxy does not include metal resources, it is the most appropriate and available data. “ https://onlinelibrary.wiley.com/doi/10.1111/jiec.13442
So, basically we’re dealing with a prediction about Peak Oil. Which is not, repeat not, going to cause collapse. Modern society is, of course, complex and volatile. It’s certainly possible that we could screw things up completely: there are many possibilities: runaway climate change, malevolent super intelligent AI, engineered pandemics, nuclear war, etc. But PO is pretty low on the list.
“Can anything be learned from such a highly aggregated model? Can its output be considered meaningful? In terms of exact redictions, the output is not meaningful.…The data we have to work with are certainly not sufficient for such forecasts, even if it were our purpose to make them” (Meadows et al. 1972, p. 94).” http://wtf.tw/ref/costanza.pdf
Meadows was right – the Club of Rome LTG models were not predictions, they weren’t forecasts: they were *scenarios* that assumed near-term limits to growth, and simply modeled the dynamics we’d see in the model outputs when the economy hits those limits. Basically, they modeled “overshoot” – what happens when there are lags, delays and positive feedback between the point of hitting limits and seeing the results in the economy.
Most of all, they *assumed* limits to growth were close enough to be a problem – they didn’t prove that those limits *were* close.
Sadly, Dennis Meadows has forgotten this basic fact, or chooses to not remember it, and lately has been talking as if those scenarios were in fact forecasts, and discussing how close they came to reality. In fact, the overshoot modeled in those scenarios has not been seen in any way – so far the world economy is pretty much simply growing in the same exponential way as before.
The Club of Rome models did do us a service, by showing us what overshoot might look like, and showing us the impact of lags and delays. This appears to be relevant to Climate Change, though probably not relevant to Peak Fossil Fuels – for Fossil Fuel, the lags, delays and positive feedbacks that might impair mitigating the impact of a peak are much smaller and shorter.
“Footprint” is primarily about fossil fuel. Here’s a quote:
“It would take 1.5 Earths to produce the resources necessary to support humanity’s current Ecological Footprint. This global overshoot means, for example, that we are cutting timber more quickly than trees regrow and releasing CO2 faster than nature can sequester it.
Growth in the Ecological Footprint is largely attributable to the carbon Footprint, which has increased to comprise 53 percent of our Footprint in 2010 from 36 percent in 1961.”
If our carbon footprint is 53% of our overall footprint of 1.5 Earths, then if you subtract the 53% you’re left with 47% of 1.5, which is .71 Earths…which is lower than overall capacity.
Eliminate fossil fuels, and we’re no longer in overshoot
http://www.footprintnetwork.org/en/index.php/GFN/page/living_planet_report2/
footprintnetwork.org/en/index.php/GFN/page/world_footprint/
Now, the logical objection here is that this is an oversimplification, but it’s a problem with the structure of the model. The result of this analysis is still illustrative.
Whoa,
Did someone say “Dennis Meadows”?
Co-author of The Limits to Growth & Director of the “Club of Rome Project on the Predicament of Mankind”………..
Earth “can support …a billion people.”
https://www.youtube.com/watch?v=VqDnUhoRAoM
OTOH, he’s an optimist if we compare him to the Georgia Guidestones:
“Maintain humanity under 500,000,000 in perpetual balance with nature”
Well, if these fellows, whoever they are, manage to keep the Hormuz and possibly other chokepoints closed or way below capacity for several years, they may be off to a good start.
Thanks Nick G
That does clarify points of agreement and disagreement
We seem to agree that there are technically feasible alternatives to FF. We also agree that a transition away from FF is necessary, and that vested interests are a large impediment to such a transition. The old Upton Sinclair quite is always present in my mind in this regard.
Liquid fuels for tuck/car transport does seem like the easiest transition lift at the moment, and I get your focus on that in this venue after all.
We seem to continue to disagree on the overall scale of the FF transition challenge and rate of transition. We also disagree over the range of issues that do (or don’t) contribute to sustainability of the current paradigm. Ecological aspects of this status seem to be one aspect of this disagreement.
I don’t mean to be disparaging, but your perspective does come across as a magical ‘Jetsons’ future. That would be great, but the evidence suggests otherwise.
T Hill,
Well, please look over my arguments carefully, and then feel free to clarify how, specifically, you would finetune these ideas. I certainly admit that I’m not fully up to speed on all of our environmental challenges – I’m more focused on energy (none of us can know everything!). OTOH, it seems to me that climate change is by far our most important environmental challenge at the moment, and moving away from FF will solve 80% of that, so…
One thought: my replies were addressing the concepts of collapse and “simplification” due to energy poverty. I think these ideas are unrealistic, and that was my focus. I think it makes sense to stick with that topic until we’ve come to a rough consensus.
Nick G,
You’re simply wrong on multiple points and appear completely unfamiliar with some topics that you are commenting on.
The planetary boundary framework originated from a group led by Johan Rockstrom. You seem to be conflating this with LTG.
Here are two example topics in particular for you to quantify.
First, the current extinction rate is at least 2-3 orders of magnitude larger than the normal background rate. Tell me how this is ecologically sustainable or why a renewable energy transition is going to solve it..
While there may indeed be some weaknesses in Smil’s work, he is certainly on the mark in many areas. Look at his work on one critical component of modern society, steel, and what it would take to remove from fossil fuels to hydrogen in steel production. How much wind/solar would be required, what are the materials resources required for the panels & turbines, what are the grid impacts, etc. Then, after you do this for the first iteration recall the 2nd law and determine the steady state replacement demands and tell me how long that would last if we were to even get there the first time.
Well, here’s an article that looks helpful, about the relationship between planetary boundaries and fossil fuels:
• It’s well known that the fossil fuel industry made the industrial age possible and raised much of humanity’s living standard, while also causing the current climate crisis. Less known is how oil, gas and coal are destabilizing other vital Earth operating systems — impacting every biome. This is Part 1 of a three-part exclusive Mongabay miniseries.
• Scientists warned this year that, of the nine identified planetary boundaries, humanity has now overshot safe levels for six — climate change, biosphere integrity, land system change, novel entities (pollution), biogeochemical flows of nitrogen and freshwater change.
• Fossil fuels, petroleum-based agrochemicals and petrochemicals (including plastics) are now significantly contributing to the destabilization of all nine planetary boundaries, based on the review of numerous scientific studies and on the views expressed by dozens of researchers interviewed by Mongabay for this article.
• According to multiple experts, if humanity doesn’t find alternative energy sources and phase out fossil fuels, agrochemicals and petrochemicals, then their production will continue driving the climate crisis; polluting the atmosphere, water and land; creating deoxygenated kill zones in the world’s oceans; and poisoning wildlife and people.
https://news.mongabay.com/2023/11/beyond-climate-oil-gas-and-coal-are-destabilizing-all-9-planetary-boundaries/
“the current extinction rate is at least 2-3 orders of magnitude larger than the normal background rate.“
I agree that this extinction rate appears very risky. Like climate change, I have the impression that these risks are understood in rough magnitude, but not well understood in detail (I admit that I could be wrong). I agree this should be a high priority – personally, I like the idea of setting aside half the planet for wild systems. Various refuges, reserves and parks are getting larger – much work remains. But…this is outside the topic we started on, which was the risks of “collapse” and “simplification” from energy shortages.
Finally, Smil’s argument sounds like a classic form of “wow, that’s a big number”, without actual context to allow understanding of whether it’s actually difficult to achieve. For example, In the book I cited above, he says on page 148 “To make the steel required for wind turbines that might operate by 2030, you’d need fossil fuels equivalent to more than 600 million tons of coal.”. He doesn’t provide his calculations, but…that’s not a particularly difficult amount of energy to produce. He admits that when he says “Undoubtedly, in less than a year a well-sited and well-built wind turbine will generate as much energy as it took to produce it.” That’s an Energy Return On Investment of over 25:1, which tells us that this amount of energy input is not really a barrier.
https://www.youtube.com/watch?v=zrZiatyAUTc
new OPEC in Latin america?
from Vz to Argentina to Columbia, from Brazil to Guyana,
https://www.shale24.com/oil-gas/miguel-galuccio-shale24-somos-ciento-ciento-vaca-muerta-mayor-exportador-independiente-argentina-n72
Vista claims $4.5 billion investment could bring up production in Vaca Muerta 60% to 180KBOPD in 2028, this is much more efficient than Chevron’s 13.5Billion to get to 90KBOPD. Why? Because Vista is drilling in the low GOR black shale oil blocks, while Chevron is in the volatile oil blocks.
Argentina also have several other hypersaline lacutrine shale basins like Vaca Muerta with low GOR&API black shale oil, and same in Columbia and Vz, Guyana.
splash news
Vz crude export more than doubles, touching 2MBOPD
Bullshit.
What is the source for that Venezuelan crude export?
Output in May was roughly 1100 kbpd.
here is the link,
https://splash247.com/venezuelan-crude-exports-more-than-double/
Sheng Wu,
Thanks. The piece says exports increase to 1.5 Mb/d.
Note that at the World level this probably is not important as it is crude production that matters. Venezuela can import condensate from the US, blend it with extra heavy oil from Orinoco and then export the crude plus condensate blend. Doesn’t change the World level of C+C produced which has decreased by about 10 Mb/d from Dec 2025 to May 2026.
If Hormuz actually opens and remains open, then World production will eventually rebound, probably by the end of 2026. The question remains if Israel and Hezbollah will settle their differences, if that occurs the Iran may allow continued traffic through Hormuz. I remain skeptical.
SPR at lowest level since filling completed??
SPR oil stocks are at 340 mmbbls as of June 12.
The data shows this as the lowest level since 1983.
https://www.eia.gov/dnav/pet/hist/LeafHandler.ashx?n=PET&s=WCSSTUS1&f=W
BUT
The US first began filling the SPR in 1977, which reached full authorized capacity in 2009.
(DOE: “authorized storage capacity of 714 million barrels” https://www.energy.gov/hgeo/opr/strategic-petroleum-reserve)
The current level is the lowest since the US completed the filling of the SPR.
If we look at US total crude oil stocks (commercial and SPR) the level on week ending June 12 was the lowest since March 8, 1985. Interesting that US net imports of crude oil in March 2025 were a similar level as March 2026. Note that commercial stocks are similar to 52 weeks ago (only half a percent lower). The SPR is about 15% lower than 52 weeks ago and is about 90 thousand barrels above the security minimum advised by US armed forces (250 million barrels). The SPR has decreased by about 44000 barrels in the past 5 weeks, if that rate continues we reach the minimum in about 10.3 weeks.
Data at https://www.eia.gov/dnav/pet/hist/LeafHandler.ashx?n=PET&s=WCRSTUS1&f=W
DC,
Thank you, I appreciate your sharing an interest in this!
“US total crude oil stocks (commercial and SPR) the level on week ending June 12 was the lowest since March 8, 1985.”
Yep, this mirrors the situation in the SPR.
And I do think it is noteworthy that since the time it reached full capacity, the SPR has never been this low, and it continues to drawdown weekly.
**Cushing**
I wasn’t aware of this, but apparently Cushing is the world record holder for the largest crude oil tank farm:
https://www.worldrecordacademy.org/2023/10/worlds-biggest-tank-farm-world-record-in-cushing-oklahoma-423520
It’s breathtaking.
The SPR is at lowest level since filling was completed.
The world’s largest oil tank farm in Cushing is at barrel bottoms.
And global inventories are dropping daily.
All is fine, buy tech stocks and go back to sleep??
Sooner of later, something is going to Break Bad.
From the link you shared earlier:
https://oileyes.com/news/spr-release-2026-impact-analysis/
“The SPR is an aging infrastructure being pushed to its breaking point.”
Here’s one of a number of trackers for the Strait of Hormuz.
https://hormuzstraitmonitor.com/
showing for instance, that the average today is 2.1M DWT throughput, which is 28% of normal. The 7 day average is just under 2M DWT/day
It doesn’t allow a look back more than a week, but perhaps there are other trackers around that do.
Hi Gerry,
It would be nice to know which tracker is most accurate, as everyone is VERY interested in trying to figure out how much is getting in and out of the straight.
Here is the tracker Polymarket uses for its Hormuz traffic bet:
https://portwatch.imf.org/pages/cb5856222a5b4105adc6ee7e880a1730
It’s useful that it specifies the type of ship (container, dry bulk, tanker, etc.).
BTW I think the number shown on hormuzstraitmonitor.com is 20% of normal (12/60), the 0 looks like an 8.
I’m interested to see how many tankers will be going *IN* to the Hormuz to pick up new loads of crude oil.
If I were a shipping co owner, I’d be hesitant to send a tanker in there now.
Russia crude and refined exports outages probably will add another 1~over 2MBOPD now?
https://oilprice.com/Latest-Energy-News/World-News/Novak-Russia-Considers-Complete-Ban-on-Diesel-Exports.html
https://oilprice.com/Energy/Energy-General/Why-Russias-Diesel-Exports-Are-Suddenly-Soaring.html
Sheng Wu,
Those pieces refer only to refined product exports. Not clear there will be much change in crude oil exports from Russia unless output increases. At some point (assuming the futures curve is correct) low profits due to low oil prices will lead to decreasing output of World C+C.
https://www.youtube.com/watch?v=TU7-LfdyUPs
Iranian drones that cost 200-300 Euros and can be made with civilian accesible materials
Are able to take out Israeli ( 6 million per) tanks.
They don’t show up on radar, because they move so slowly (suprise to me)
https://www.youtube.com/watch?v=QwIbfSbOzz4
Downed US F-15 fighter said the drones came at him in a “Jellyfish” formation
Many drones moving as a single unit.
Iranian drones appear to be more advanced that thought
Andre,
Re the ‘jellyfish’ characteristics of these drone swarms …
Reportedly, there is a single drone operated in FPV mode (First Person View, ie., a human controlling real time actions) and this ‘mother’ drone is able to communicate with dozens (hundreds?) of smaller, nearby drones which mimic the movements of the ‘mother’.
This exponentially expands the effectiveness of each ‘human’ input,
Speculation that this technology has been refined by the Chinese.
The footage coming out of Ukraine – and now Lebanon – is almost surreal in showing the uses/consequences of these devices …
Ground level reconnaissance in thick forest
Entering underground bunkers
Entering buildings
Remote mine emplacement (explosive-laden drone lands on roadways at night, motion activated sensors cause detonation when troops/vehicles are nearby)
The recent adoption of fiber optic tethering (somewhat akin to large ‘fishing reel line’) has made them near unstoppable up to – current – range of ~ 20 miles.
When one encompasses the cost/effect aspects (as mentioned in your linked vid), an entire sea change is now seen to be unfolding before our eyes in the realms of kinetic warfare.
So Trump accuses “Big Oil” of price gouging at gas stations.
This is straight out of the Elizabeth Warren playbook. Gavin Newsome just made this same accusation within the past two weeks.
When will you MAGA’s admit this guy isn’t even a conservative?
Can we finally be done with MAGA at the end of 47’s term please. I’ve had enough of his help with my farm and oil investments.
“We’re from the government and we are here to help”
The pendulum swings widely as stability becomes more of a theory than actual condition.
The US is at risk of either authoritarian leader like Putin and/or escalating social fragmentation.
I hope people don’t get behind Darth Vance. That guy is prone to being a hard-handed and cruel leader.
The upcoming (at some point) economic turmoil phase is going to be very risky in a political sense, like playing Russian roulette.
As I’ve mentioned a few times before, the world has plenty of oil. Hence the low prices.
There is another effect going on here, which is an undershoot. Oil price goes up because of supply concerns due to some event (war with Iran, for example). Supply concerns disappear as the event ends and then price goes down, but down further than before the event. It is irrational, but I’ve seen it happen before.
Spot price on June 22, 2026 for WTI is $78.94/bo and for Brent $76.49/bo. An interesting flip in WTI becoming more expensive than Brent as Cushing approaches tank bottoms. For week ending June 19, 2026 stocks at Cushing, OK were 18957 thousand barrels, last time Cushing was lower than this was July/August 2014 when spot price for WTI was about $103/b in 2014$ (or about $145/bo in 2026 US$).
If Hormuz opens quickly and OPEC Big 4 output can also be ramped up quickly, perhaps oil prices remain at $70/bo. If you believe that I have a bridge in Brooklyn to sell you. 😉
Dennis,
you are comparig the WTI Jul to Brent Aug future. Meanwhile only Aug futures are traded and Brent trades above WTI. This is what it has to be as Europe needs to import WTI barrels and the arbitrage has to be open..
Toby,
I was specifically looking at spot prices for WTI and Brent, not the same as a futures contract.
See
https://www.eia.gov/dnav/pet/pet_pri_spt_s1_d.htm
This is the price of a physical barrel of crude on June 22, 2026.
Dennis.
The total crude draw was over 15 million barrels, over 6 from commercial and over 9 from SPR.
There was a product build however; so the total stock draw was 9.6 million.
It appears USA is exporting a lot of oil from the SPR.
Sorry for my frustrations venting above. Thankfully I will be ok regardless of how low oil and grain fall, as I’ve survived some pretty bad times in the past.
Just don’t understand why 85% of farmers and 95% of independent oil producers support President Trump. I guess one benefit for oil producers is retention of the percentage depletion deduction (the Democrats have been hell bent on eliminating it but have never been able to get it out of the Senate.
The other would be the radical methane rules requiring the $80k camera for monitoring oil wells with little to no detectable methane emissions. I guess we got a reprieve there.
I assume given President Trump’s current polling and continued decline, we will see Progressive Democratic sweeps in 2026 and 2028, and then they will be able to finally kill the percentage deduction and we will be back to some harsh methane stuff.
There is no room for reasonable people in US government. Have to be radical one way or the other to get any juice.
Shallow sand,
I was focused on the SPR in particular on the recent stock draw. At current rates of draw we reach the 250 million barrel SPR minimum needed for national security in about 9 weeks. Supposedly the plan is to drain the SPR to 243 million barrels, we get there in about 10 weeks if we continue at a 9 million barrel draw per week.
I doubt there will be enough Democratic Senators (there would need to be 60 and that’s not going to happen) to change oil field rules. But I am often wrong.
DC,
How much do you know about how the SPR releases work?
Do they only release oil when they have contracted for an exchange (loan)?
Last time they offered 40 million barrels, the only taker was Vitol who took just 500,000 barrels on June 22, 2026:
https://www.spr.doe.gov/posting/EXCHANGE/FY26%20SPR%20Oil%20Release%20No.%203/1-Request%20for%20Proposal/FY26%20SPR%20Oil%20Release%20No.%203%20Award%20Information.pdf
If there are no/few takers, will SPR flows dry up?
It doesn’t seem like a great business plan to borrow crude oil at $70 to put oneself at risk of having to later buy it at over $100 (if price is pushed up by war or shortages) and return an extra 10~24% in volume.
Mr Shellman was away fishing for a couple of weeks, but he is back with some great insights.
See
https://www.oilystuff.com/groups
Good piece I found at oilystuff.com. Thanks Mr Shellman, well worth a read.
https://www.msn.com/en-us/money/markets/trump-jawboning-has-masked-a-global-oil-supply-disaster-and-the-reality-could-mean-135-crude-says-industry-veteran/ar-AA26goHX?ocid=entnewsntp&pc=EDGEDB&cvid=8df65d4a942d4980dd38de3c5f834739&ei=23
Nice spicy article!!
“At $70 WTI and some change, no shale oil well in America makes money. Not enough money to pay full-cycle corporate costs, interest on debt, dividends, future plugging liability and keep drilling $11 MM wells and pay back all the money they borrowed. Anybody that says differently is lying. “
Good stuff!
I have followed Dan Dicker for decades and he is usually right (as is Shellman). The thing that bothers me most when I read the work of experts who do this for a living (Dicker, Berman, etc.) is a total lack of comment regarding exactly HOW the price of oil futures has been kept under $120, despite kinetic war, total blockade of the Strait of Hormuz, depletion of global oil supplies, and a profound dislocation of the supply/demand balance.
It would seem that everyone subscribed to the notion that Mr. Trump could jawbone the price of oil down to a desired level. The man can jawbone, I’ll give him that, but the oil market is massive, involving many intricate strategic reserves in scores of countries, and tankers and electronic money transfers. There are at least 1,500 tankers in the Shadow Fleet alone. VLCC’s have been known to turn around in the ocean and head for a different port for an extra ten million, and this dynamic spot market is tied fairly tightly to the futures market. The Cushing Hub has probably forty pipelines that run into it, and when it’s basically down to the sludge, the price of WTI ALWAYS turns up on the NYMAX. Until now. Oil markets have been emotionally trained to move volatively to geopolitical excitement but to mostly hew pragmatically to supply/demand on a global platform. In brief, the oil market doesn’t give a tinker’s dam about jawboning–from anyone. So that theory is toast.
The only feasible possibility is that Mr. Big is shorting oil in such massive tranches that no trading entity can counter it, and expect to live to fight another day. Mr. Big on this scale is usually a government, or several. Scott Bessant has explicitly denied that the U.S. government had stooped to such a level. Interestingly, the Japanese government made the same disclaimer at almost the exact same time,which seemed strange to me. Neither said a word, though, about sweetheart deals with large banks, and it is public record that international banks were short crude oil at a time when it made no sense at all to have literally hundreds of billions riding on a paradoxical position.
WTI selling for $75 in this environment is like the turtle my father showed me when I was a young boy. It was upside down on a cornerpost: I don’t know how it got there but you can bet it didn’t get there under its own power. Corollary: somebody is jacking with the oil futures market. It’s probably not illegal or even unconstitutional, as nothing else seems to be, but it is enormously distressing.
if all the classic panelists fail in their predictions, then Trump is the unconventional president and deal maker.
Hi gerry,
You summarized the situation very well.
There is no way natural price/profit/risk driven forces brought WTI to $69 in these circumstances.
There were 2 or 3 articles in the Nikkei about the Japanese gov’t investigating ways it could intervene in the oil market other than just through the SPR release. And given how subservient recent administrations have been, I would not be surprised if they had agreed to intervene if asked to do so by Trump. Korea is another candidate.
The manipulation is on a scale that feels like it is about more than money (= keeping down oil to prop up the ponzi stock market).
That aside, Cushing is at 18.9 mm barrels as of June 19. It’s june 25, so we are probably around 18 million now, and as we drop a million or so a week, it won’t be long before there will be problems.
Do you or anyone else know the mechanics of what happens when Cushing starts to hit bottoms, what kind of problems might arise, and what options exist to fix those problems?
WTI deliveries on futures (https://www.cmegroup.com/delivery_reports/EnergiesIssuesAndStopsYTDReport.pdf) have been really low most of this year (1~2 million barrels a month). I wonder what might happen if someone tried to take a large delivery of 5 to 10 million barrels in one month……..
Also, the financial interests (swap dealers) are short over 540 million barrels of WTI futures, roughly 250 million barrels of which were shorted as tension ramped up with Iran and the war began.
https://www.barchart.com/futures/commitment-of-traders/interactive-charts/CL*0
Scandium was not something we here talked about much around the dinner table.
“Bloom Energy’s SOFC technology depends on scandium, a critical metal used in its electrolyte chemistry. At full utilization of its planned 2 GW manufacturing expansion, Bloom’s theoretical scandium requirement would approach the size of the entire global market, currently estimated to be around 60 tonnes per year. This potential bottleneck is compounded by the fact that China heavily controls the global scandium supply chain”
AI Data Center Boom Could Drive Fuel Cell Market to $30 Billion by 2030-
https://oilprice.com/Energy/Energy-General/AI-Data-Center-Boom-Could-Drive-Fuel-Cell-Market-to-30-Billion-by-2030.html
For those who may be unfamiliar- you pipe nat gas into a fuel cell and get electricity out, without combustion. Bloom Energy demand for fuel cells is huge, reflected in a 1 yr stock rise of 1239%!
[yes, the company was founded by an immigrant]
AI centers are another time bomb as serious as SPR or Cushing depletion.
some left-extremists might even approve data centers, but not oil and gas drilling,
https://oilprice.com/Latest-Energy-News/World-News/UK-Energy-Secretary-Vetoed-Plan-to-Boost-Oil-Output-for-Defense-Funds.html
The Great Tang!
“The BYD Great Tang is coming at a price of just $35,500, or up to $45,900 on the fully loaded end, while offering 497–590 miles of range on a full charge, ultra-fast charging thanks to the new and improved Blade battery, and a luxury 7-seat interior.”
https://cleantechnica.com/2026/06/24/byds-new-35500-suv-is-a-big-deal/
Hickory,
Tesla is no longer competitive with BYD. Maybe at some point US citizens will have access to these cars. Europeans and Canadians may have better luck.
Dennis,
Is it just price, or do you feel that BYD doing better with design and tech (besides the battery)?
Commercial vs. Governmental Reserves
Cushing, the NYMAX hub, is well run. There are approx. 40 pipelines carrying crude into Cushing. The tanks can remain a few inches above sludge without getting into trouble. So the fix is to take in more crude oil than you let out. This slightly precarious position can be remedied fairly quickly.
The SPR, the big government storage, is a different animal. There are roughly 60-some caverns that were sculpted out of natural salt domes, within four separate facilities. These were created in the mid-seventies for desperate times, not as political levers. The salt is more or less dormant when the caves are filled and kept at 800 psi, but when oil is removed the salt begins to “grow.” Oil is removed by waterflooding, raising the oil on top of a water column. This oil is mostly light sweet at this point. They don’t empty one cavern completely, but remove judicious amounts from several caves, but when they are repeatedly tapped, or left largely empty, the salt tends to calve off into the crude oil.
It’s not my place to be judgmental about what is best for my country. But it is acceptable to query why the future hydrocarbon needs of my country have been sacrificed, especially when prices are kept low through dubious means.
“It’s not my place to be judgmental about what is best for my country.”
Actually…it is. That’s the whole concept of the United States: that the government represents the people, and acts only with the consent of the governed. Legitimacy and consent flows from the people up to their representatives, in contrast to the traditional monarchies where the monarch was thought to own everything and power flowed down.
So, in a democracy it is essential for the people to voice their concerns and priorities, and criticize their representatives when they feel that things are going wrong. It is not only the right of the people to do so, it is their *responsibility*.
Let me say that again: we are citizens, not subjects. We are adults, not children. We certainly should treat our elected and appointed government people with respect, and listen to their expertise, but at the end of the day they work for us.
A new post has been published at link below
https://peakoilbarrel.com/short-term-energy-outlook-june-2026/