By Ovi
All of the Crude plus Condensate (C + C) production data for the US state charts comes from the EIAʼs Petroleum Supply monthly PSM which provides updated production up to May 2025.
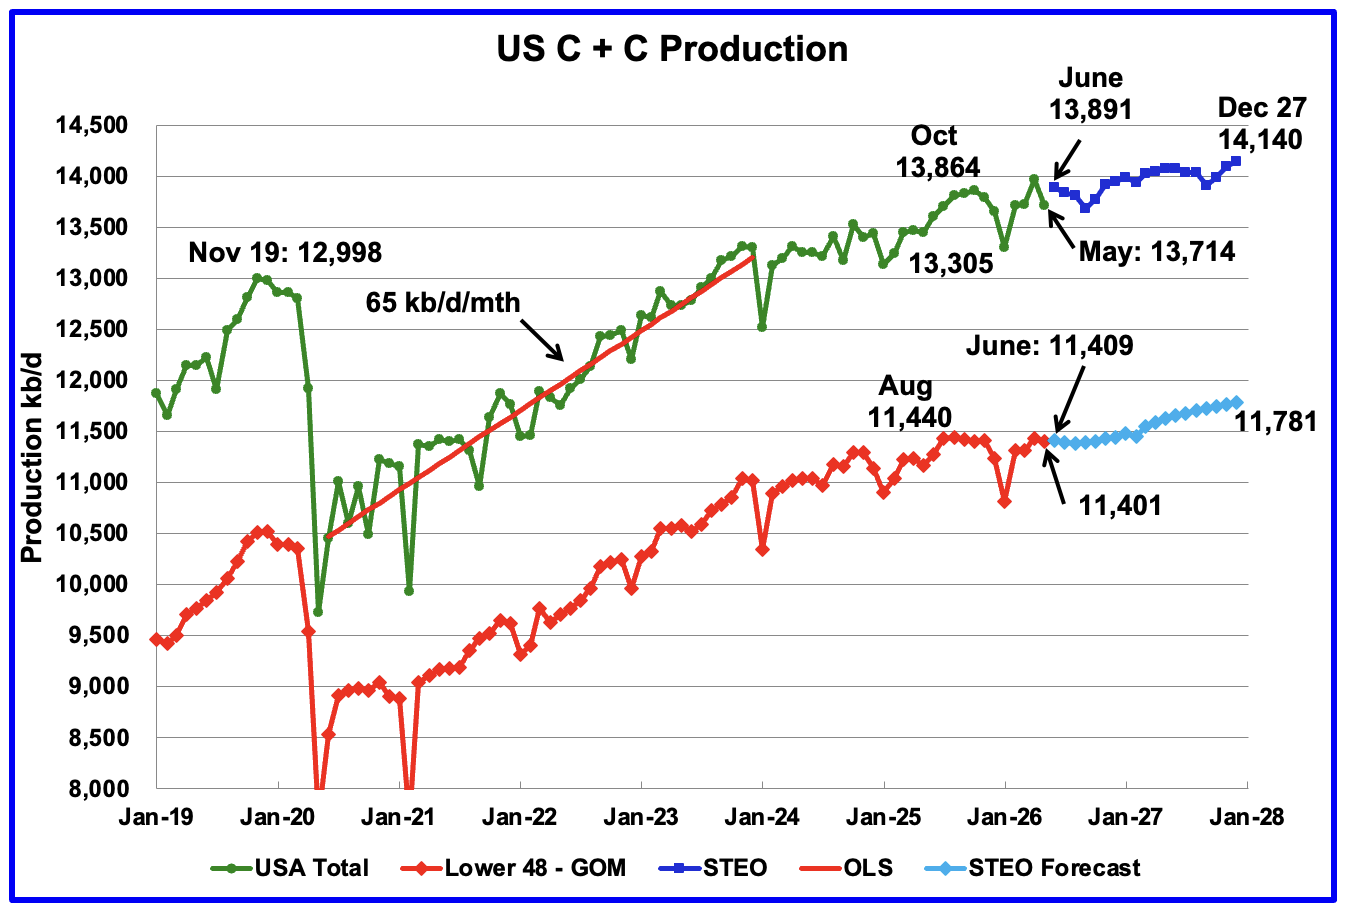
U.S. May oil production decreased by 253 kb/d to 13,714 kb/d, The largest decrease came from the GOM, 212 kb/d, while the largest increase came from the New Mexico, 41 kb/d. June production is expected to rise by 177 kb/d to 13,891 kb/d according to the July STEO. Production is expected to drop every month going forward until September 2026.
The dark blue graph, taken from the July 2026 STEO, is the U.S. oil production forecast from June 2026 to December 2027. Output for December 2027 is expected to rise to 14,140 kb/d, revised down by 270 kb/d in the June STEO report. The new STEO forecast may be reflecting their expectation for lower WTI prices going forward. From June 2026 to December 2027 U.S. oil production is expected to increase by 249 kb/d.
The light blue graph is the STEO’s forecast for the Onshore L48 output to December 2027. May Onshore L48 production decreased by 35 kb/d to 11,401 kb/d. From June 2026 to December 2027 production is expected to increase by 372 kb/d to 11,781 kb/d. Note how production is essentially flat out to February 2027. The 2027 production increase may be due to the recent addition of 20 Hz rigs into Eddy county. Check Eddy county further down.
U.S. Oil Production Ranked by State
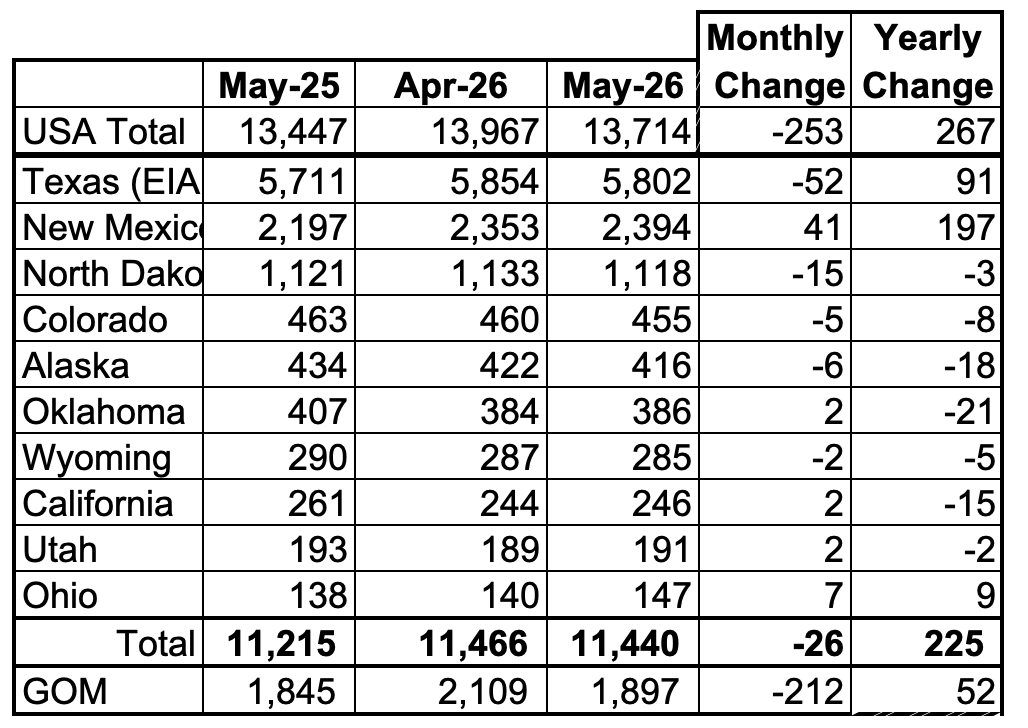
Listed above are the 10 US states with the largest oil production along with production from the Gulf of Mexico.
These 10 states accounted for 83.4% of all U.S. oil production out of a total production of 13,714 kb/d in May 2026. On a MoM basis, May oil production in these 10 states dropped by 26 kb/d. On a YoY basis, US overall production increased by 267 kb/d with the largest contributor being New Mexico.
State Oil Production Charts
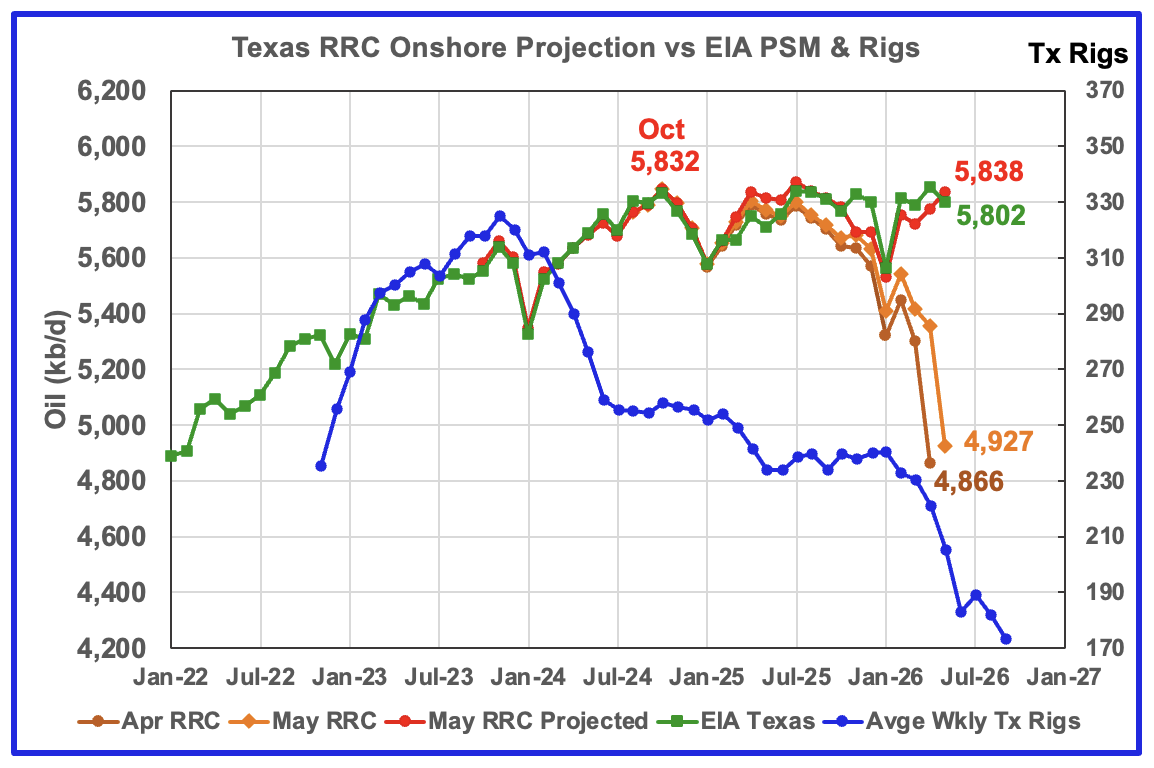
Texas’ May oil production decreased by 52 kb/d to 5,802 kb/d according to the EIA. YoY production rose by 91 kb/d.
The Texas’ RRC initial production for May, orange graph, dropped by 430 kb/d from April to 4,927 kb/d. The projection added 1,036 kb/d to May’s initial production to raise it to 5,838 kb/d, 36 kb/d higher than the EIA estimate.
The red graph is a production projection using the preliminary April and May Texas RRC data.
The blue graph shows the average number of weekly rigs reported for each month shifted forward by 8 months. So the 257 rigs operating in January 2024 have been shifted forward to September 2024. From March 2025 to May 2026, the rig count dropped from 234 in time shifted March to 189 in May 2026. That drop of 45 rigs has had little impact on Texas production up to May 2026.
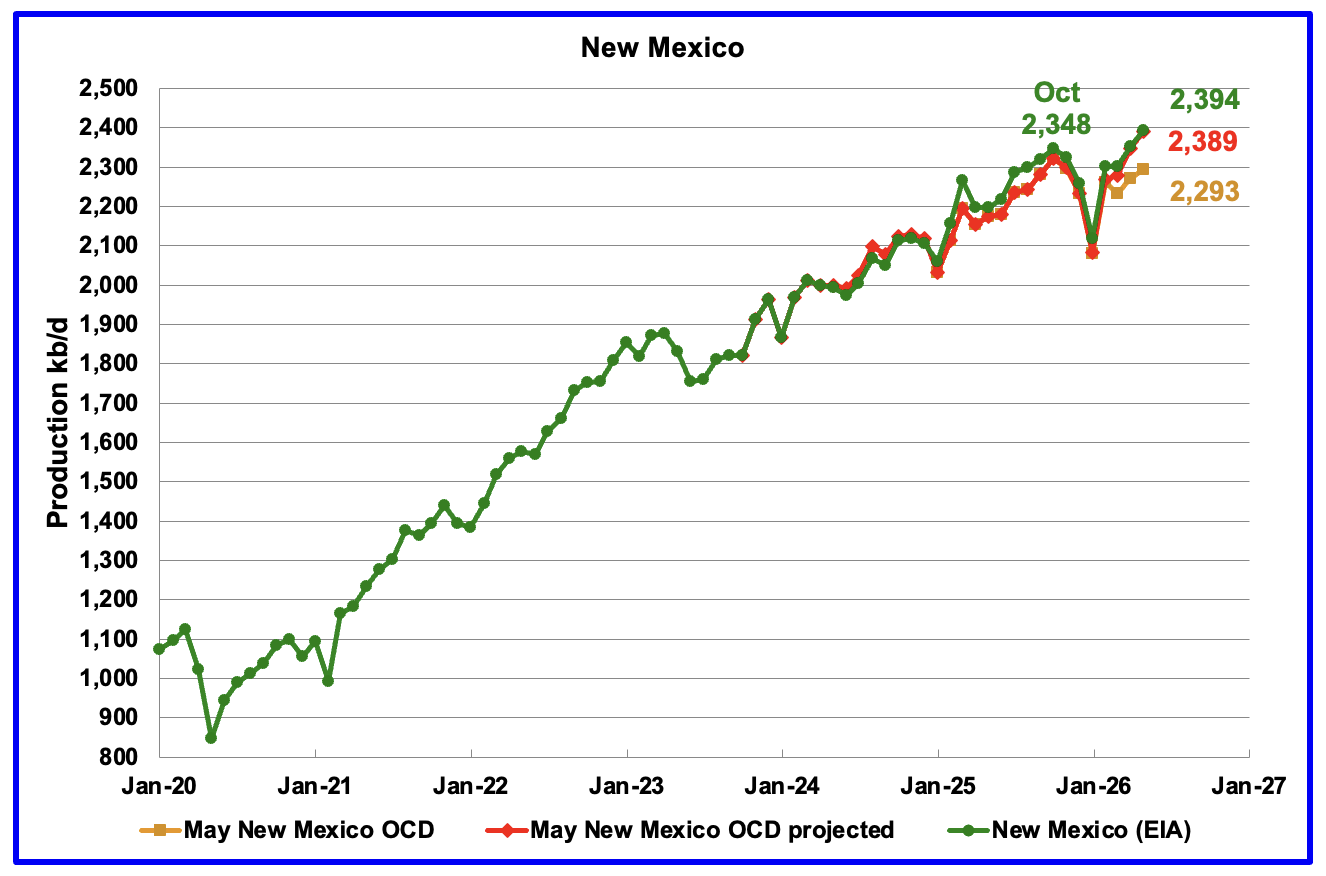
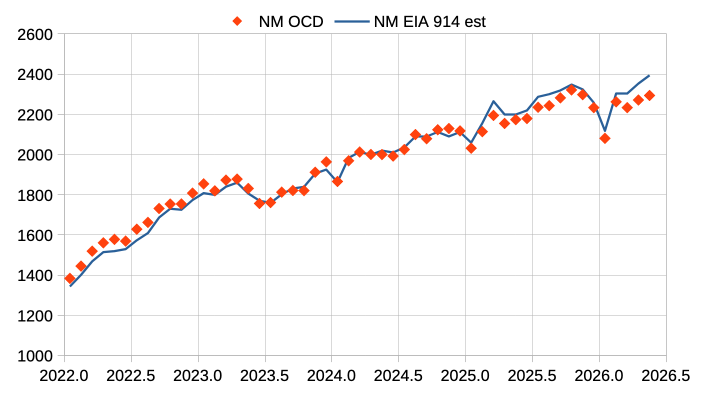
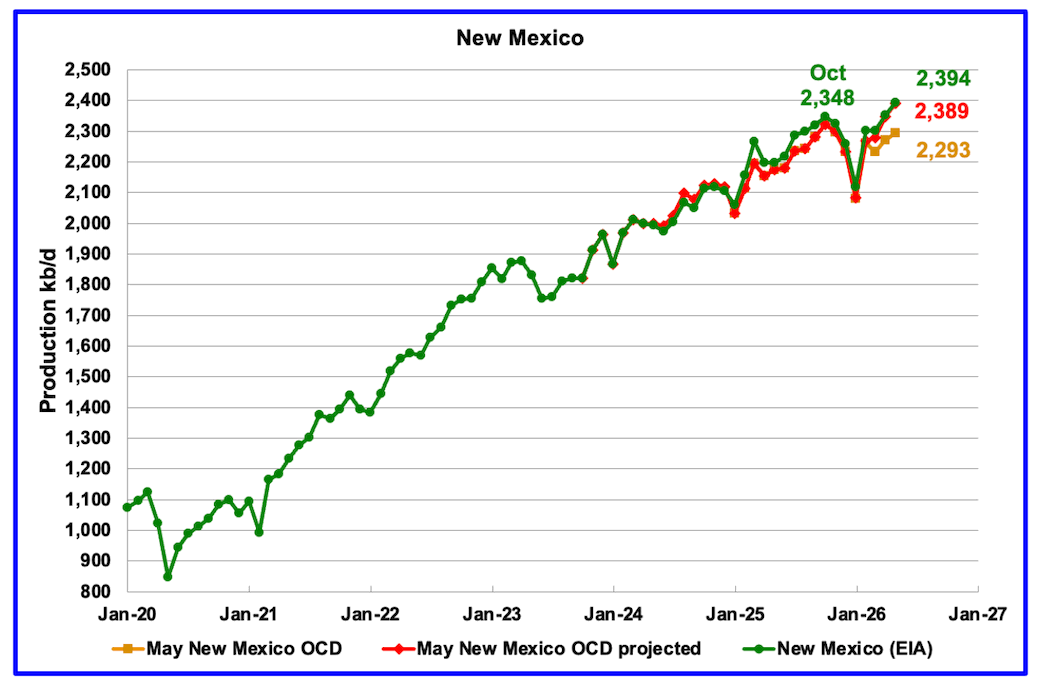
According to the EIA, New Mexico’s May production rose by 41 kb/d to 2,394 kb/d. YoY production rose by 197 kb/d, 106 kb/d more than Texas.
The red graph, partially covered by the green graph over the last few months, shows NM’s projected output up to May and is calculated using the preliminary March and April NM OCD production. May projected production increased by 42 kb/d from April to 2,389 kb/d and is 5 kb/d lower than the EIA’s reported May production of 2,394. The EIA and the projection numbers have the same trend.
Production in both Lea County and Eddy County rose. See Permian section further down.
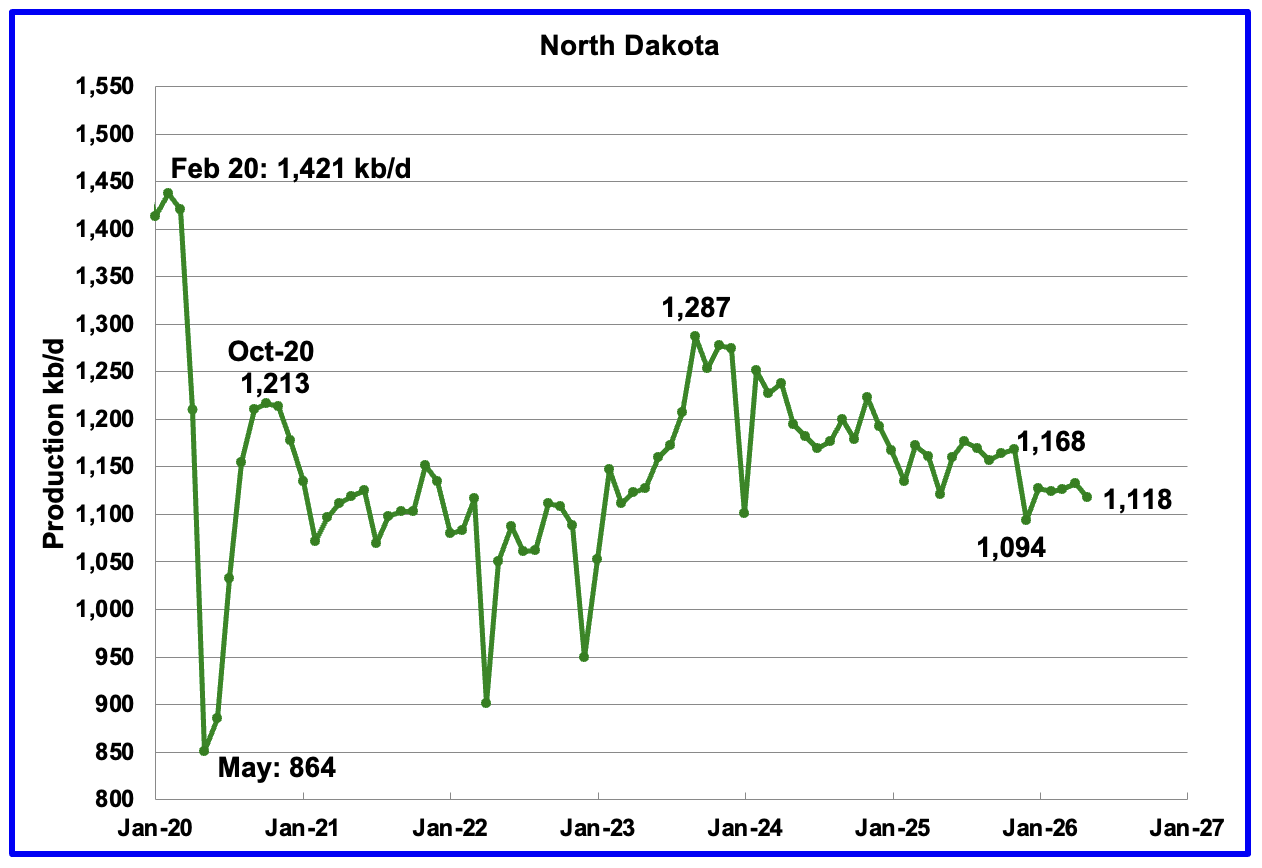
Production in North Dakota dropped by 15 kb/d in May to 1,118 kb/d, according to the EIA. May 2026 production is 3 kb/d lower than last May. The current trend in ND appears to be towards declining production.
The North Dakota Department of Mineral resources reported May production decreased by 16 kb/d to 1,125 kb/d, which is 7 kb/d higher than the EIA’s estimate.
According to this Article, North Dakota oil received a premium over WTI.
“North Dakota collected an estimated $29 million more in oil tax revenue in May as a result of a pricing anomaly that hadn’t happened in decades.
Justin Kringstad, director of the North Dakota Pipeline Authority, said Wednesday crude oil produced in North Dakota sold for an average of $2.56 more per barrel than the West Texas Intermediate oil price benchmark in May, the most recent data available.”
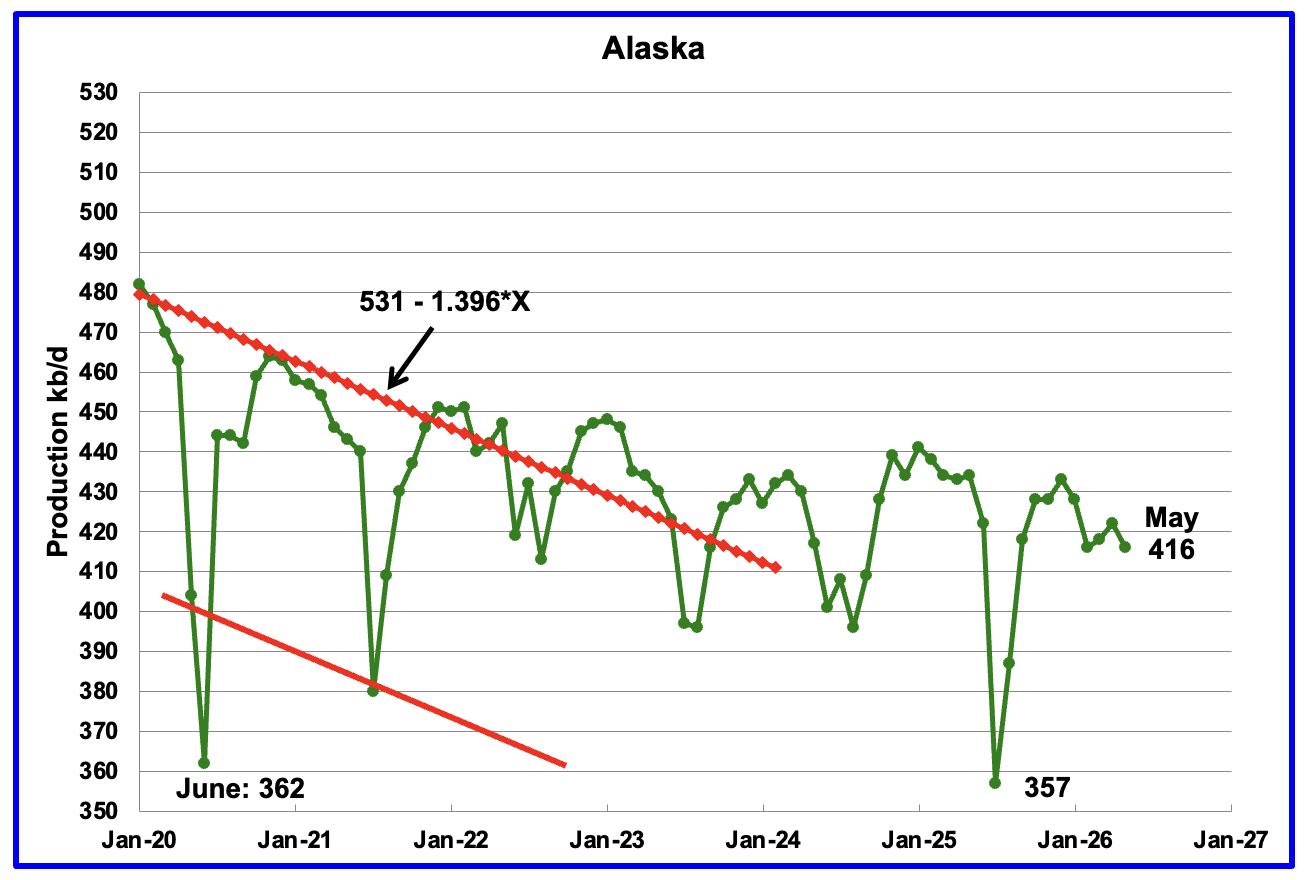
Alaskaʼs May output dropped by 6 kb/d to 416 kb/d while YoY production decreased by 18 kb/d. The EIA’s weekly report for May indicated that May production would average close to 416 kb/d.
According to this Article: Santos Starts Continuous Oil Production at Alaska’s Pikka Project.
“Santos has started continuous production operations at the Pikka Phase 1 oil project on Alaska’s North Slope, marking a key milestone for one of the largest new oil developments in the United States.
The first production wells are now online and producing around 20,000 barrels of oil per day (bpd) on a gross basis. Santos said it plans to begin seawater injection in the coming weeks to provide reservoir pressure support before gradually bringing additional wells into operation. The company is targeting plateau production of approximately 80,000 bpd during the third quarter of 2026.”
Based on this article, Alaska could be close to producing 500 kb/d by late 2026.
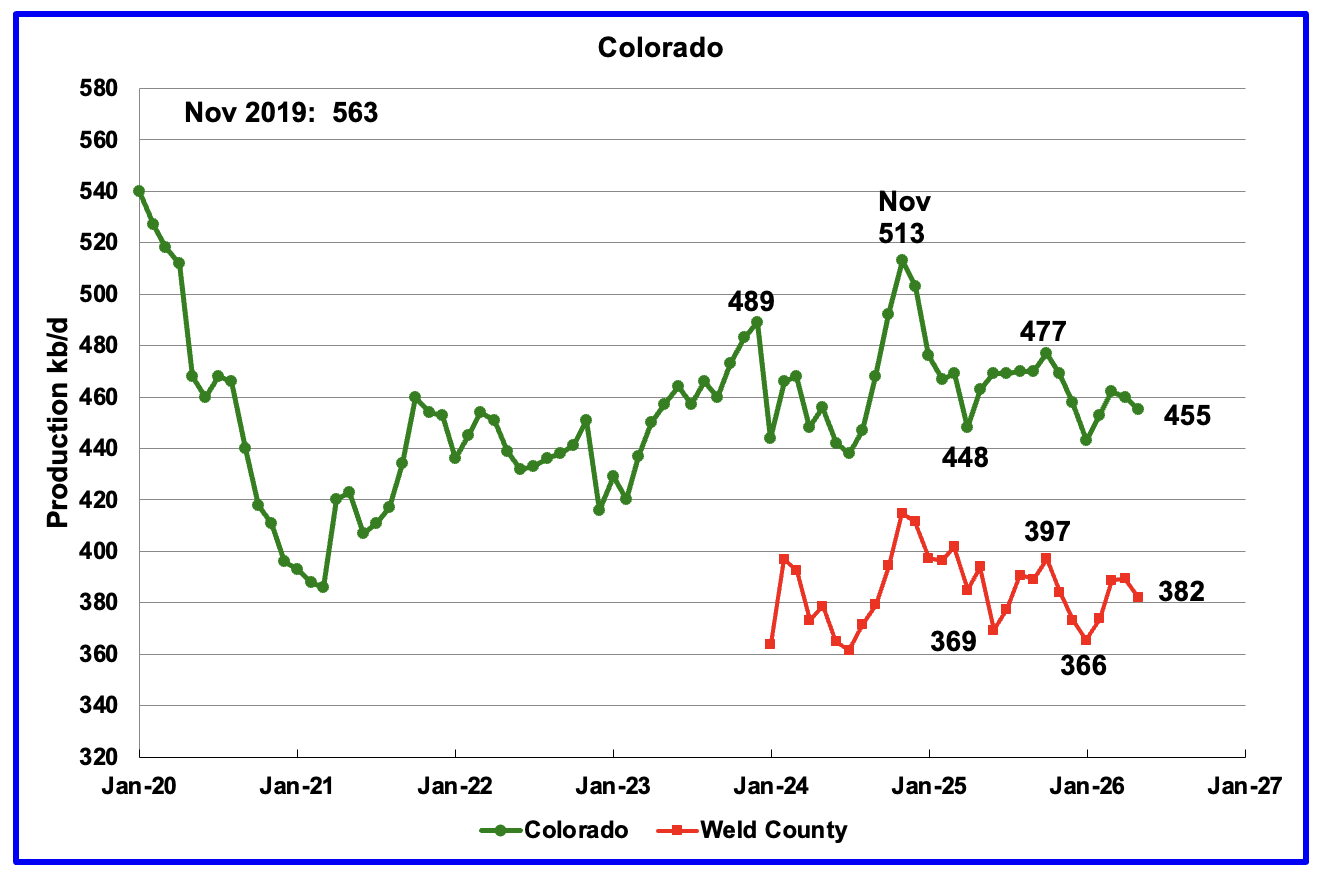
Coloradoʼs May oil production dropped by 5 kb/d to 455 kb/d.
The biggest oil producing county in Colorado is Weld County and its production has been added to the chart. The two graphs have almost been parallel over the last six months. Weld’s production dropped by 7 kb/d in May to 382 kb/d.
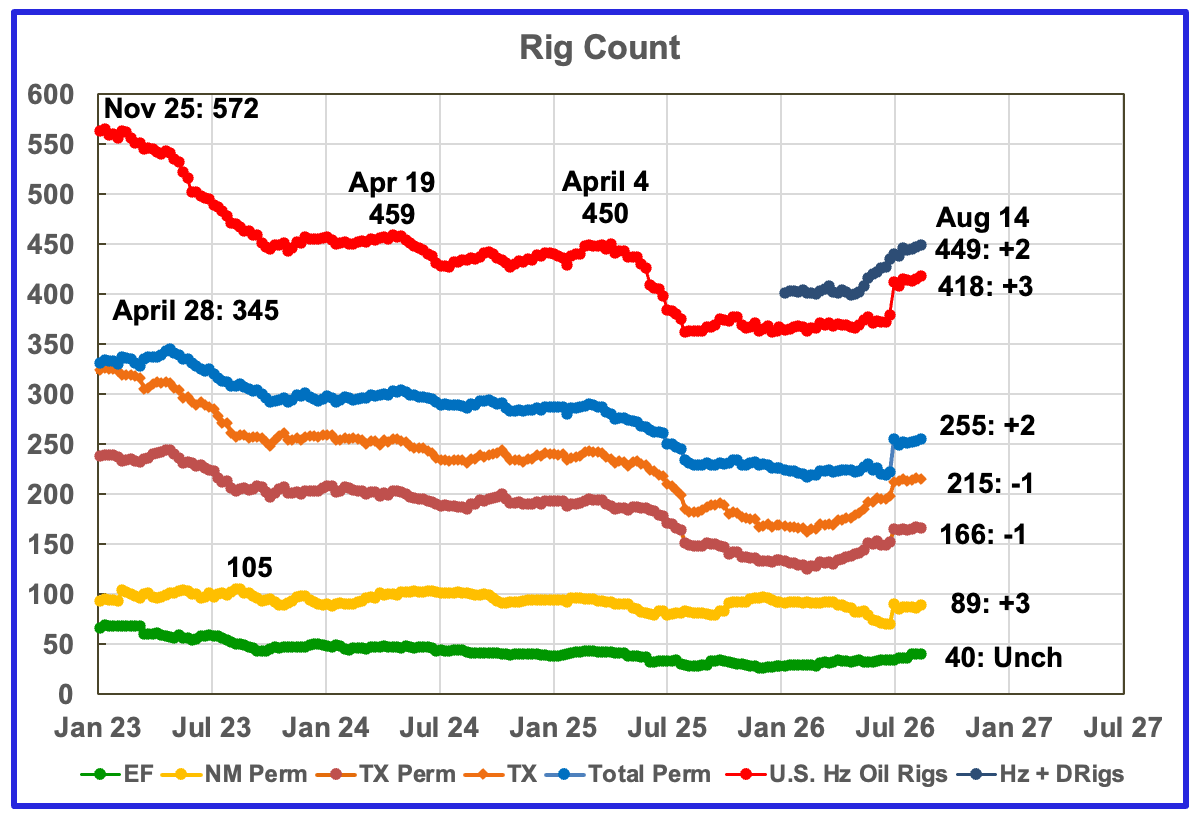
Colorado began 2026 with 7 rigs in January and they rose to 10 rigs in late July. Of the 10 rigs, 6 were stationed in Weld county.
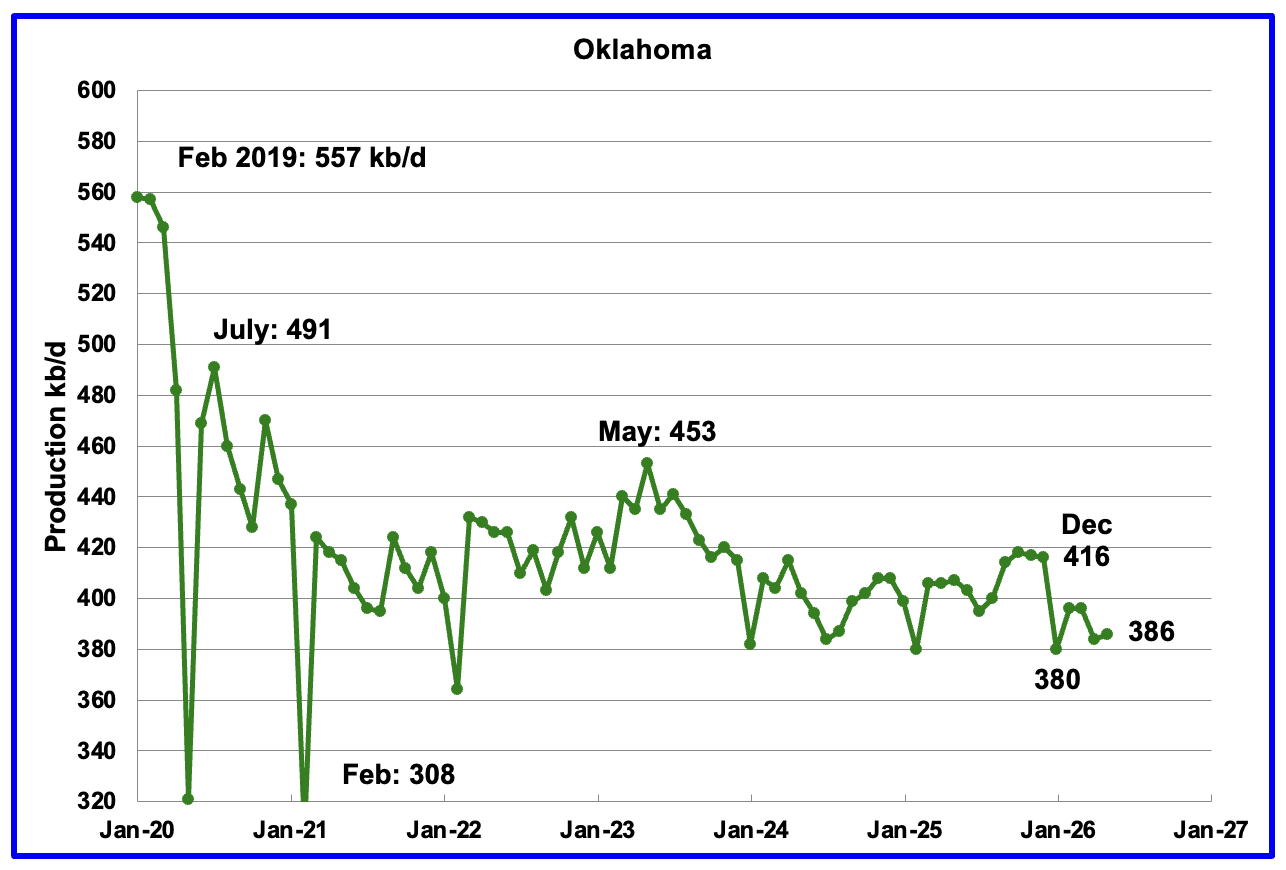
May oil production rose by 2 kb/d from April to 386 kb/d.
Oklahoma’s January output dropped by 36 kb/d to 380 kb/d due to severe weather. Production remains below the post pandemic July 2020 high of 491 kb/d and is down by 67 kb/d since May 2023. Oklahoma’s production continues to stay within the 400 kb/d ± 20 kb/d range.
Oklahoma had 40 operational rigs in January 2026 and they have slowly increased to 47 in July.
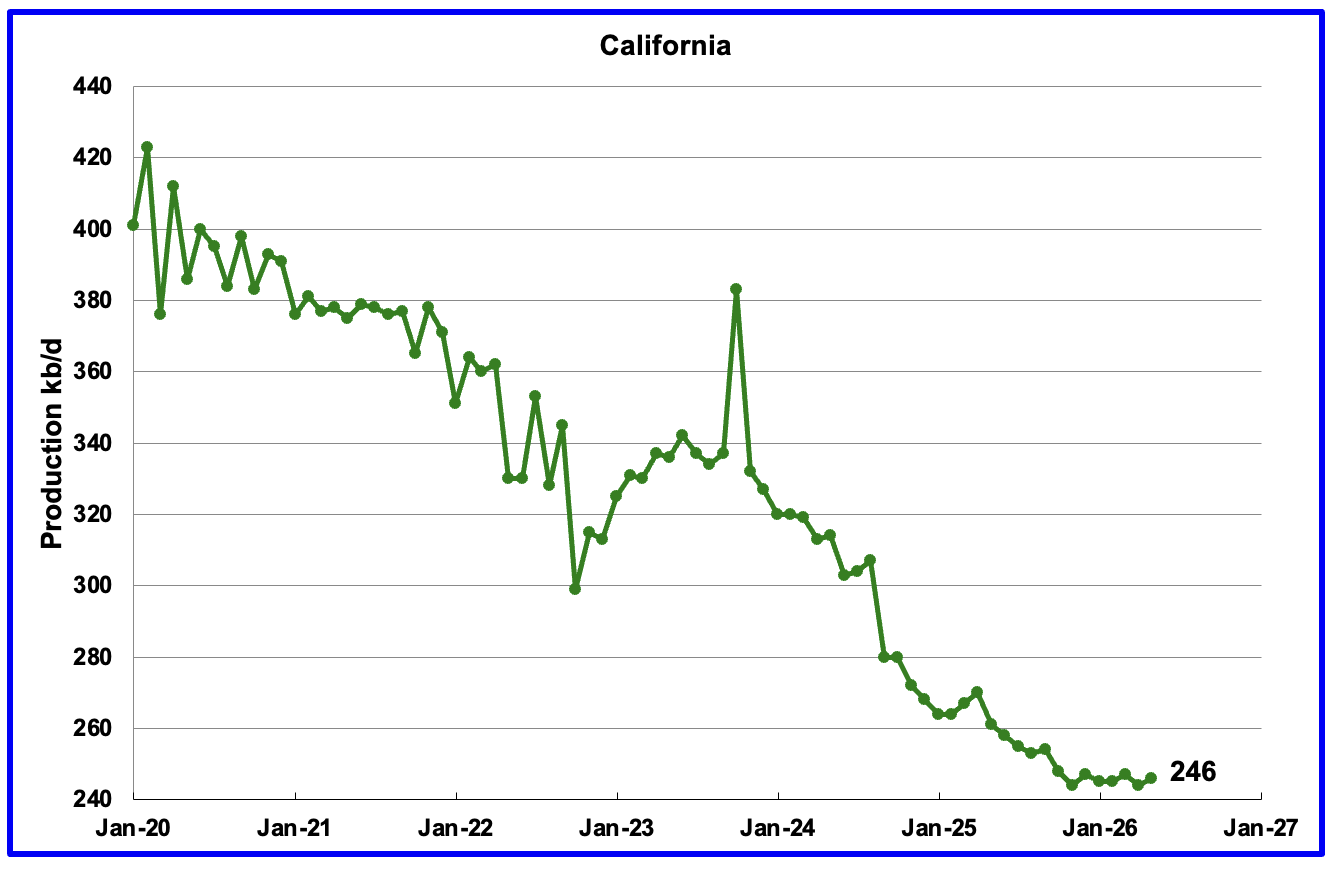
California’s overall declining production trend appears to have temporarily stopped. For the past 7 months production has stabilized at close to 245 kb/d. May production rose by 1 kb/d to 246 kb/d. YoY production dropped by 15 kb/d.
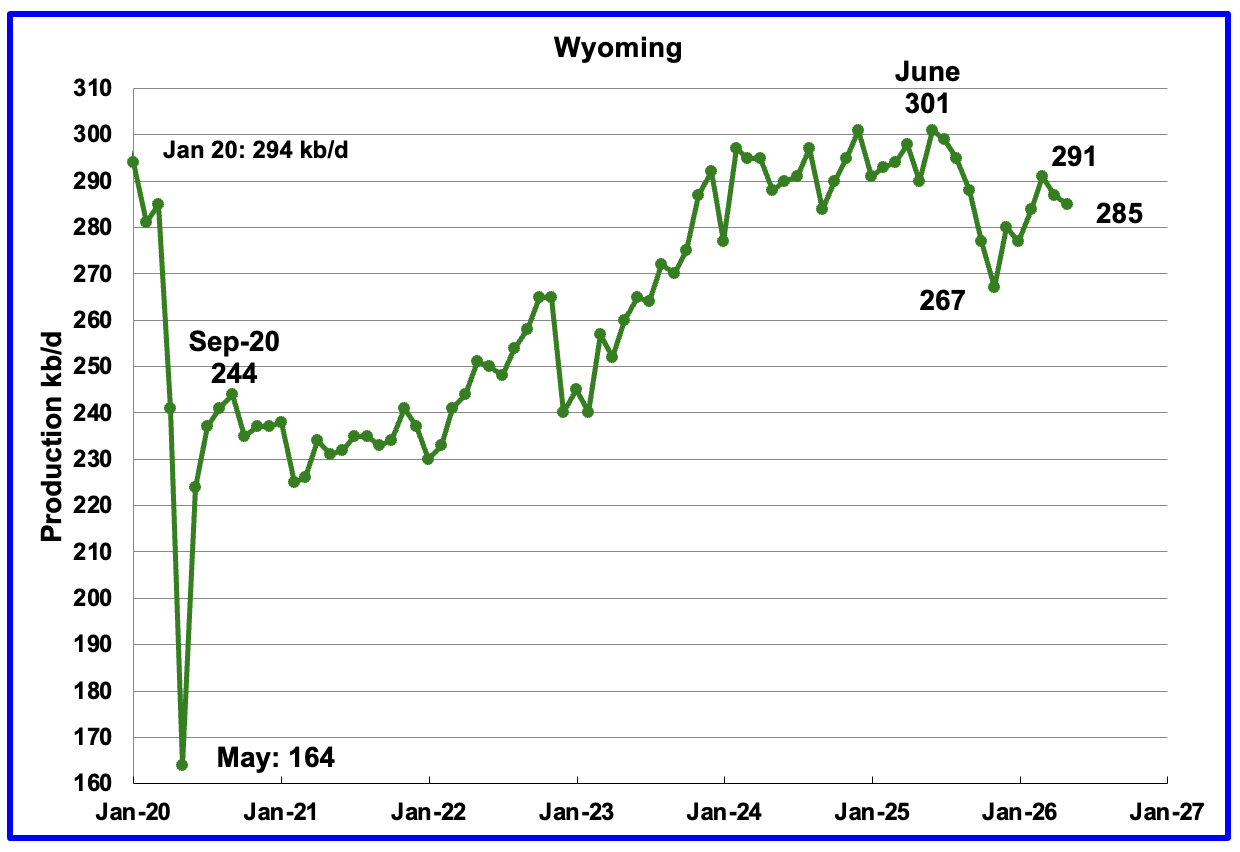
Wyoming’s oil production reached a post pandemic high in June 2025 of 301 kb/d. Production dropped in each of the subsequent 5 months before rebounding in December. May production dropped by 2 kb/d to 285 kb/d.
Wyoming started the year with 13 rigs and in July added 1 to 14 operational rigs.
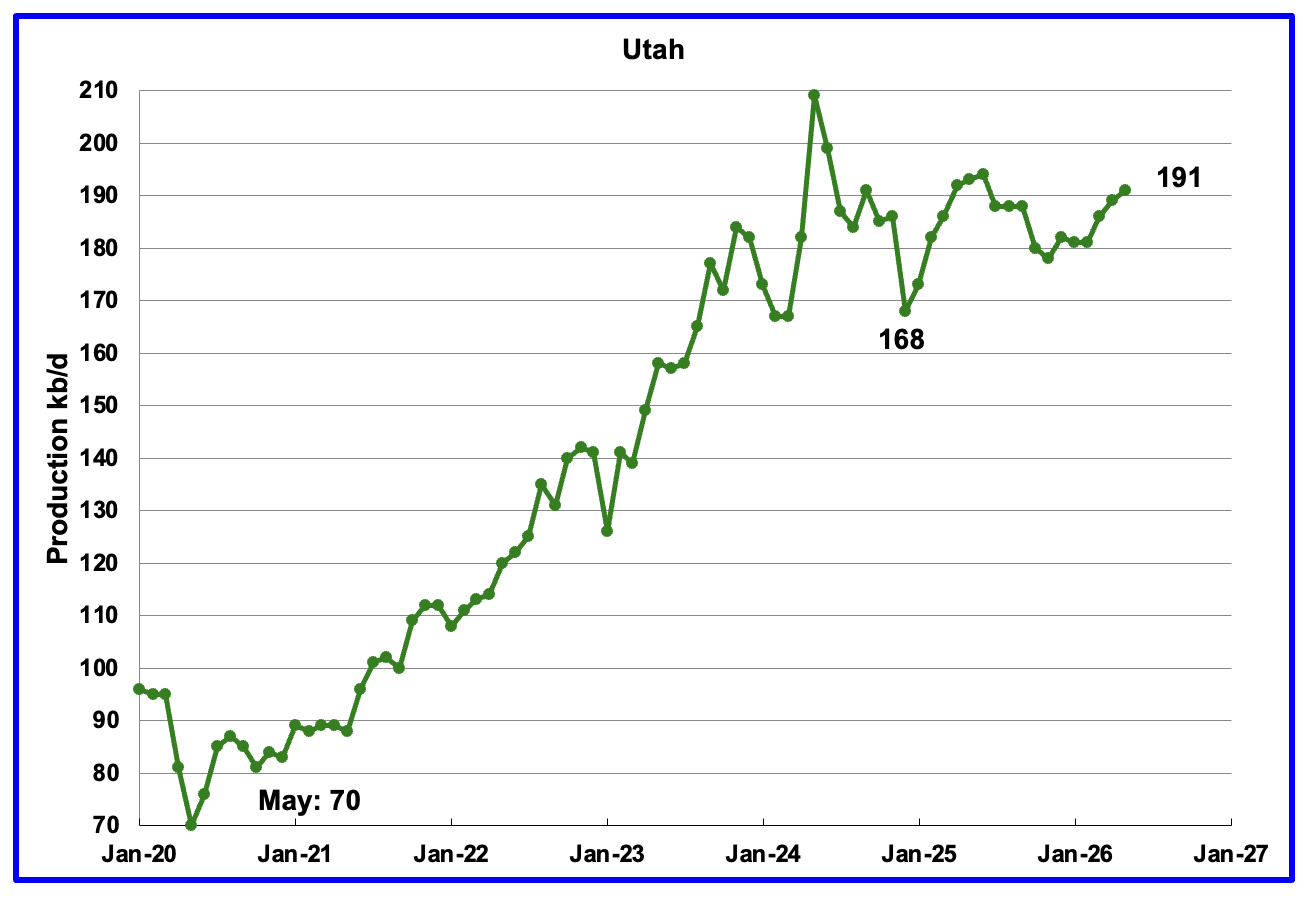
May production rose by 2 kb/d to 191 kb/d. Utah had 11 rigs operating in late January. In late July the number of operational rigs had dropped to 10.
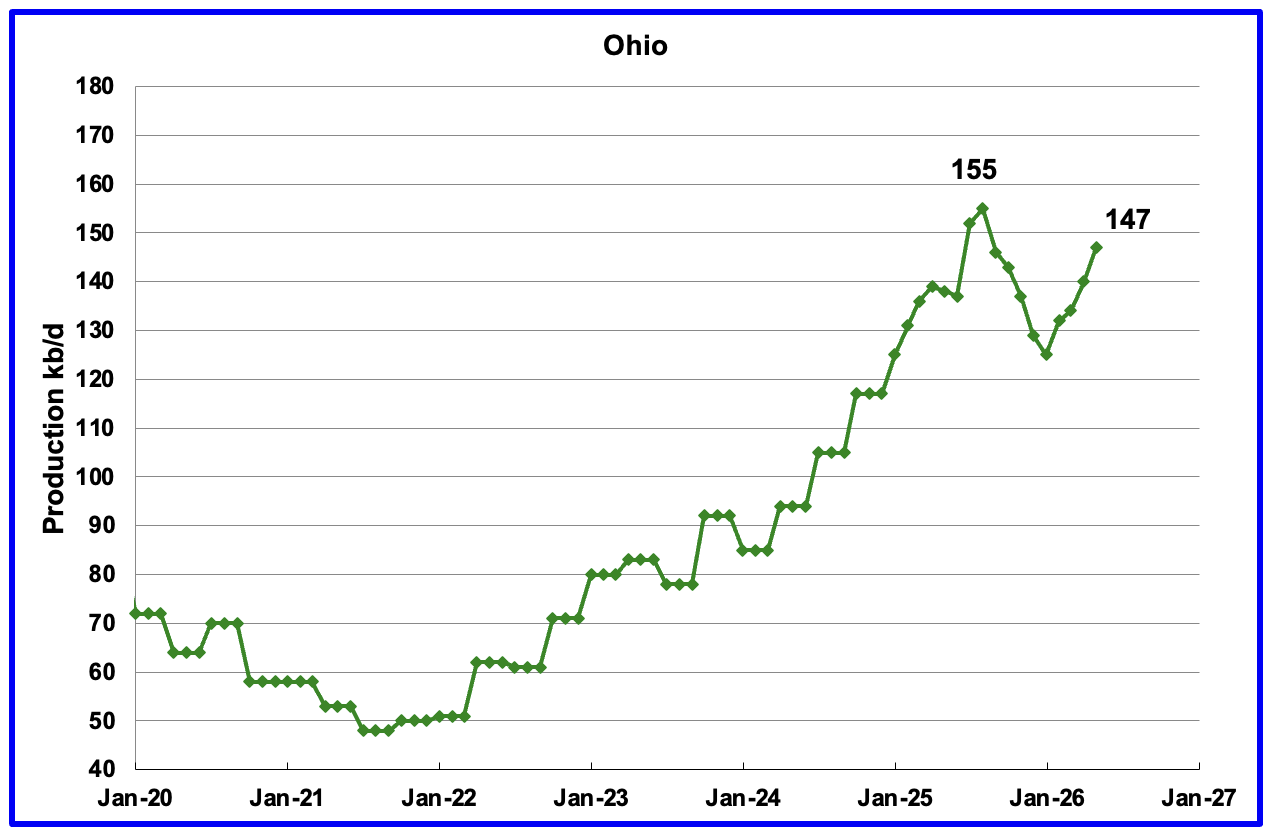
Ohio’s May oil production increased by 7 kb/d to 147 kb/d and was 8 kb/d lower than the August 2025 peak of 155 kb/d. In January 2026 Ohio had 12 NG rigs operating. In July, nine NG rigs were operational along with one oil rig.
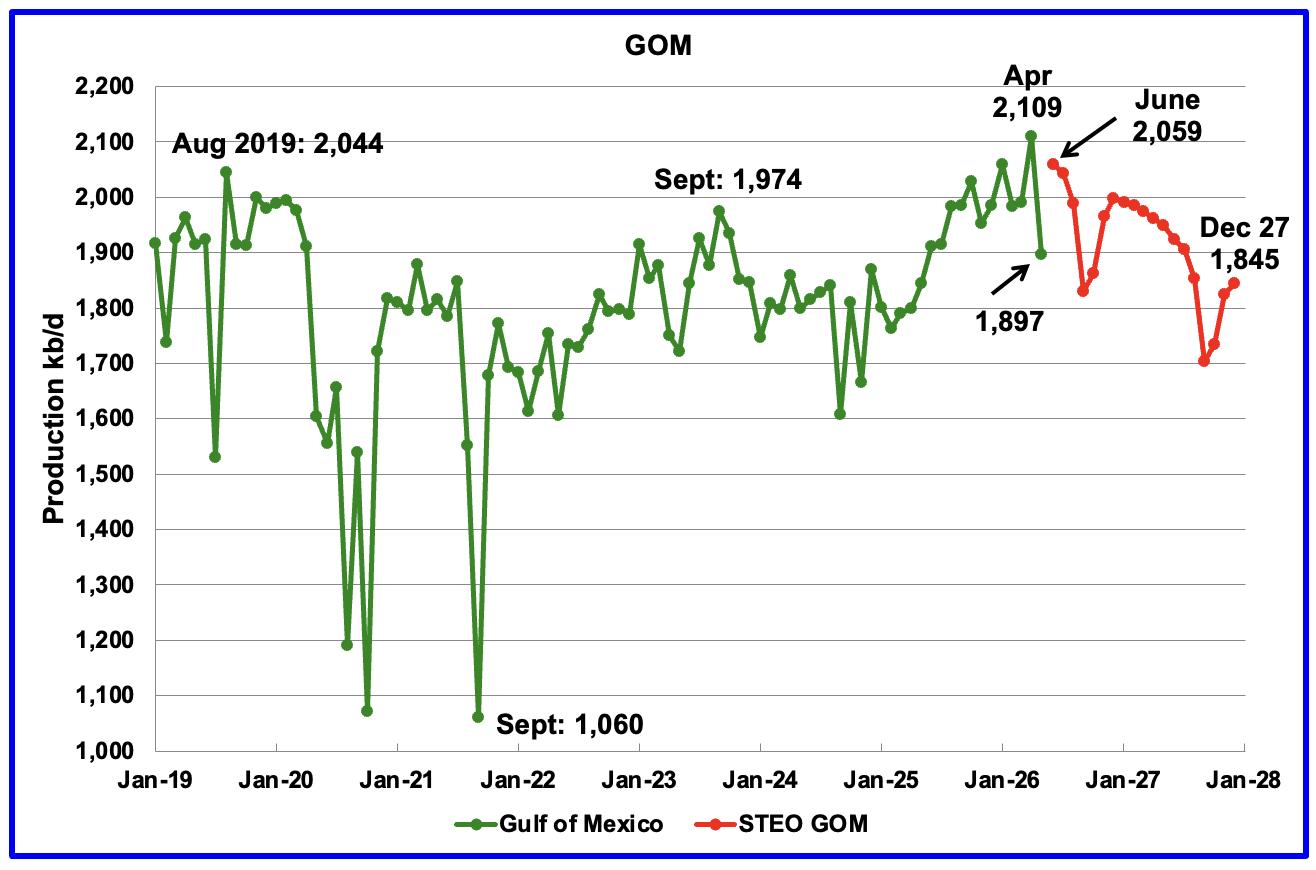
GOM production dropped by 212 kb/d in May to 1,897 kb/d. It is up by 52 kb/d YoY.
The July 2026 STEO GOM projection has been added to this chart. For June production is projected to rebound to 2,059 kb/d, an increase of 162 kb/d. It also projects production in December 2027 will be lower than 2,000 kb/d at 1,845 kb/d.
A Different Perspective on US Oil Production
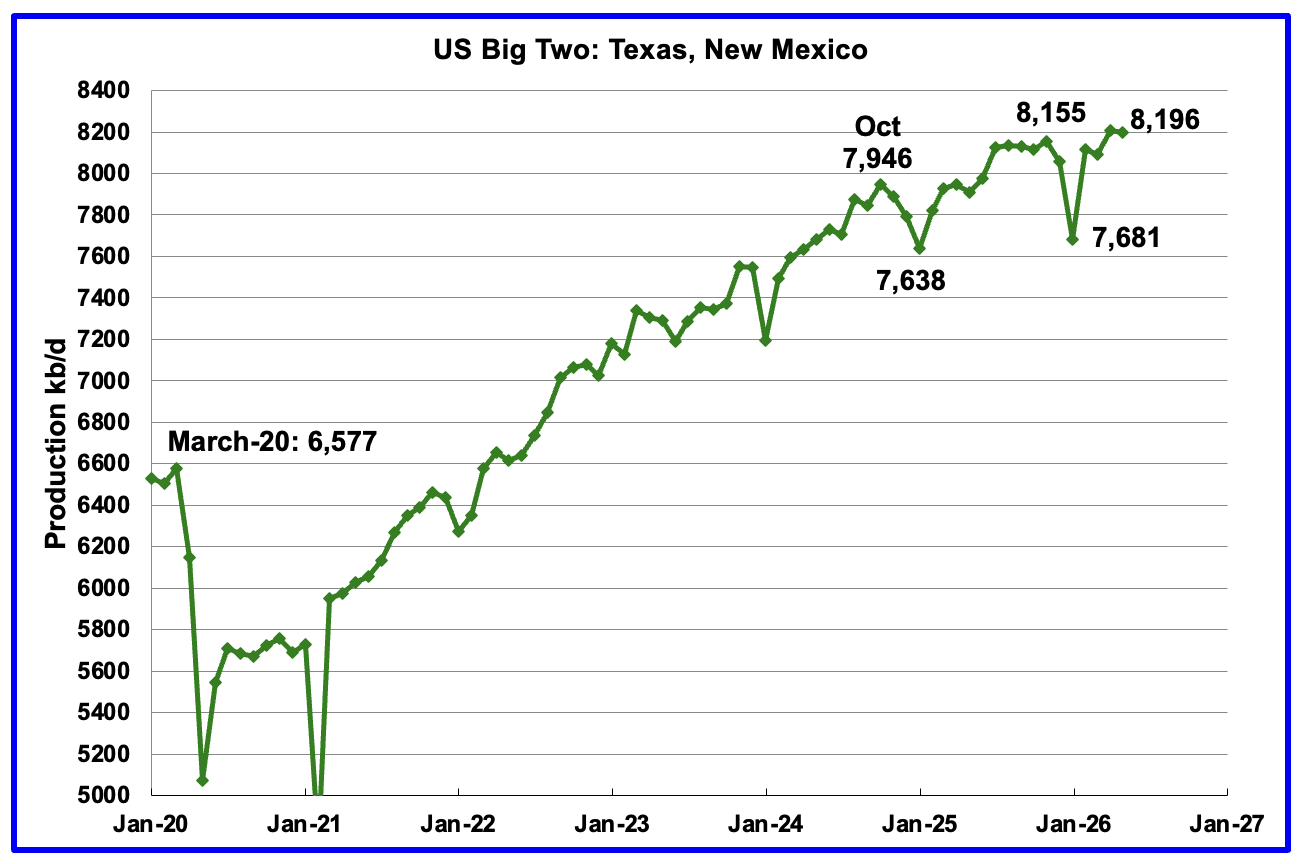
Combined Oil output for the Big Two states Texas and New Mexico.
May production in the Big Two states decreased by a combined 11 kb/d to 8,196 kb/d. The small decrease was due to a production rise in New Mexico, +41 kb/d, and a drop in Texas, -52 kb/d.. Clearly these two states were the drivers of US oil production growth up to October/November 2025. The essentially flat production starting in October 2025 was the first sign that production in these two states was close to peaking. The next few months will determine whether these two states are in their plateau phase.
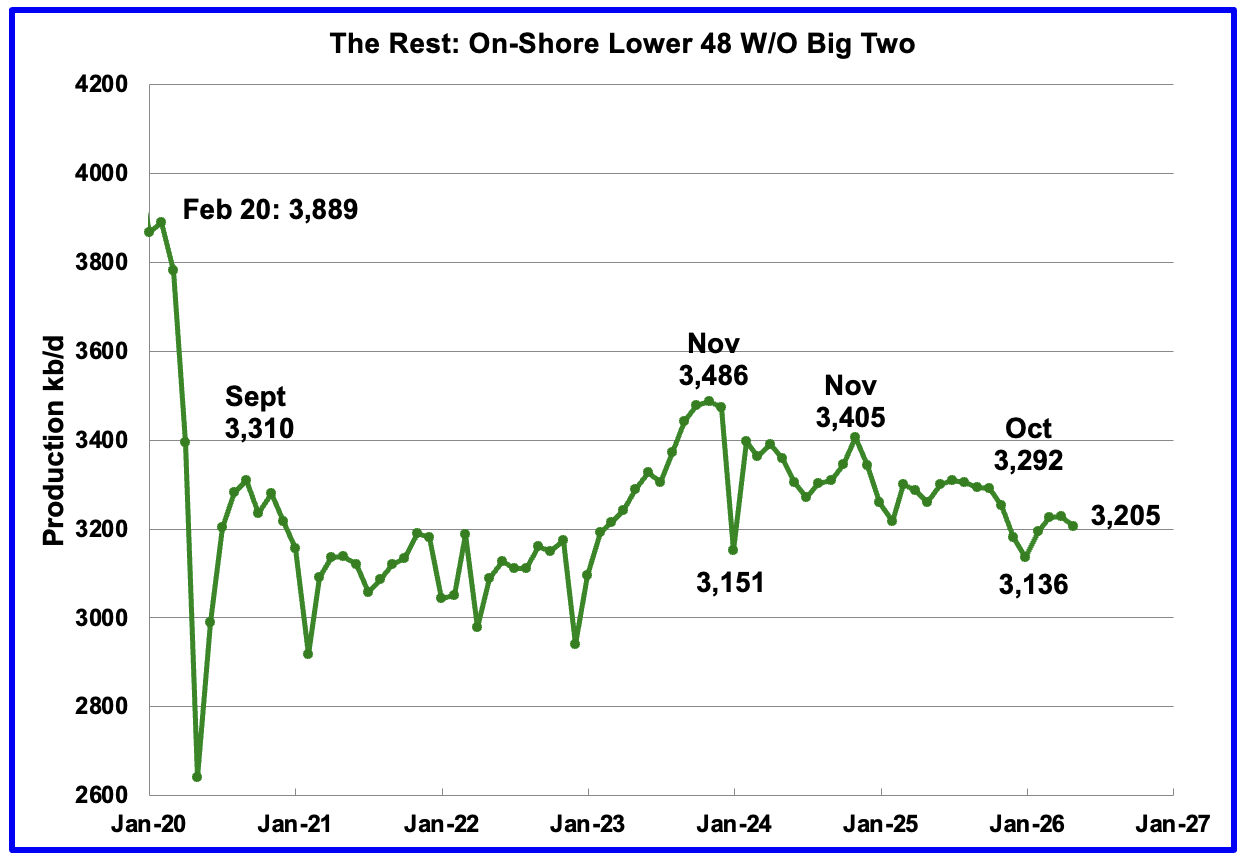
Oil Production by The Rest
May oil production by The Rest dropped by 24 kb/d to 3,205 kb/d and is 281 kb/d lower than November 2023. The remaining states may have entered a slowly declining phase.
Permian Basin Report for Main Counties and a District
This special monthly Permian section was added to the US report because of a range of views on whether Permian production will continue to grow or will peak over the next year or two. The issue was brought into focus many months back by two Goehring and Rozencwajg Reports and Report2 which indicated that a few of the biggest Permian oil producing counties were close to peaking or past peak.
A more recent report was issued and can be reviewed Here. In this report they state:
“For years now, we have outlined with what we hoped was clarity, and what we now submit was prescience, the view that U.S. shale oil, that great source of modern supply, could not grow forever. It would mature, crest, and begin its long descent. That moment, by our models and measures, has arrived: shale has plateaued, and 2024 appears to be its high-water mark. And yet, investor sentiment has scarcely been more downbeat.”
This section will focus on the four largest oil producing counties in the Permian, Lea, Eddy, Midland and Martin. It will track the oil production and the associated Gas Oil Ratio (GOR) on a monthly basis. The data is taken from the state’s government agencies for Texas and New Mexico. Typically the data for the latest two or three months is not complete and is revised upward as companies submit their updated information. Note the GOR shown in the charts uses the gas coming from both the gas and oil wells.
Of particular interest will be the charts which plot oil production vs GOR for a county to see if a particular characteristic develops that indicates the field is close to entering or in the bubble point phase. While the GOR metric is best suited for characterizing individual wells, counties with closely spaced horizontal wells may display a behaviour similar to individual wells due to pressure cross talking . For further information on the bubble point and GOR, there are a few good thoughts on the intricacies of the GOR in an earlier POB comment and here. Also check this EIA topic on GOR.
New Mexico Permian
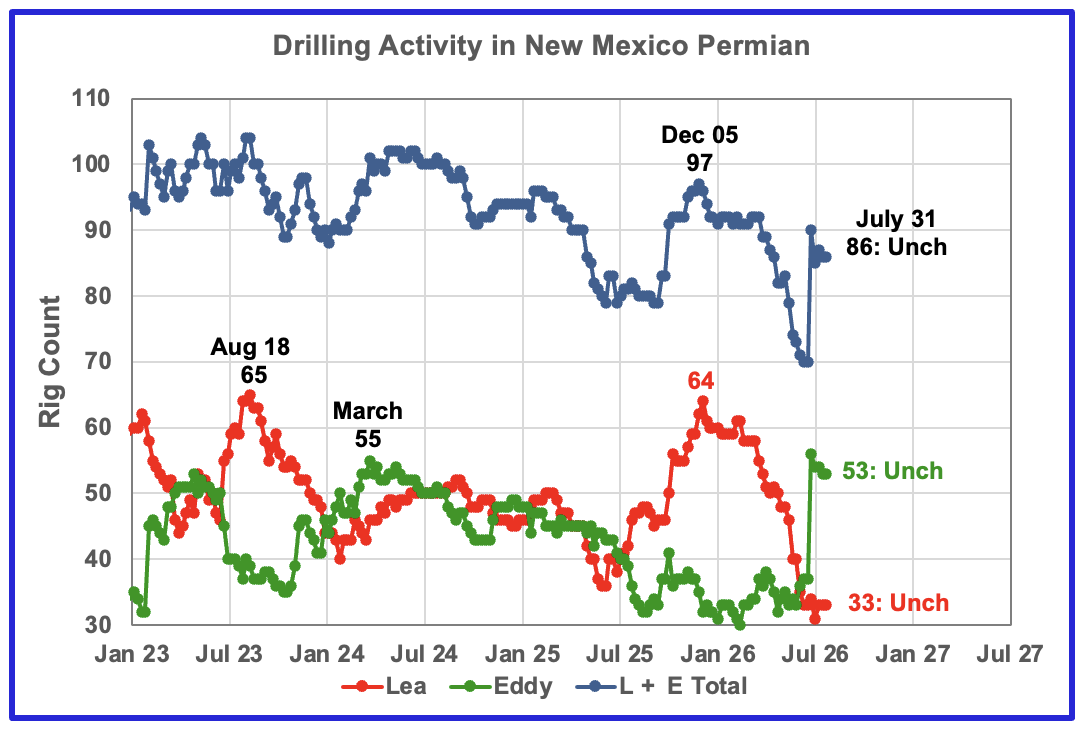
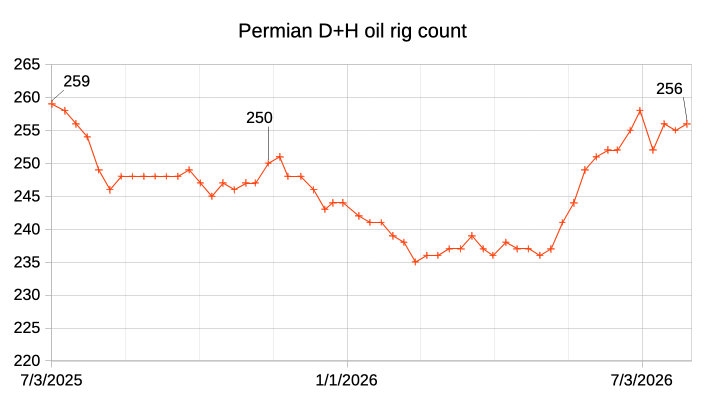
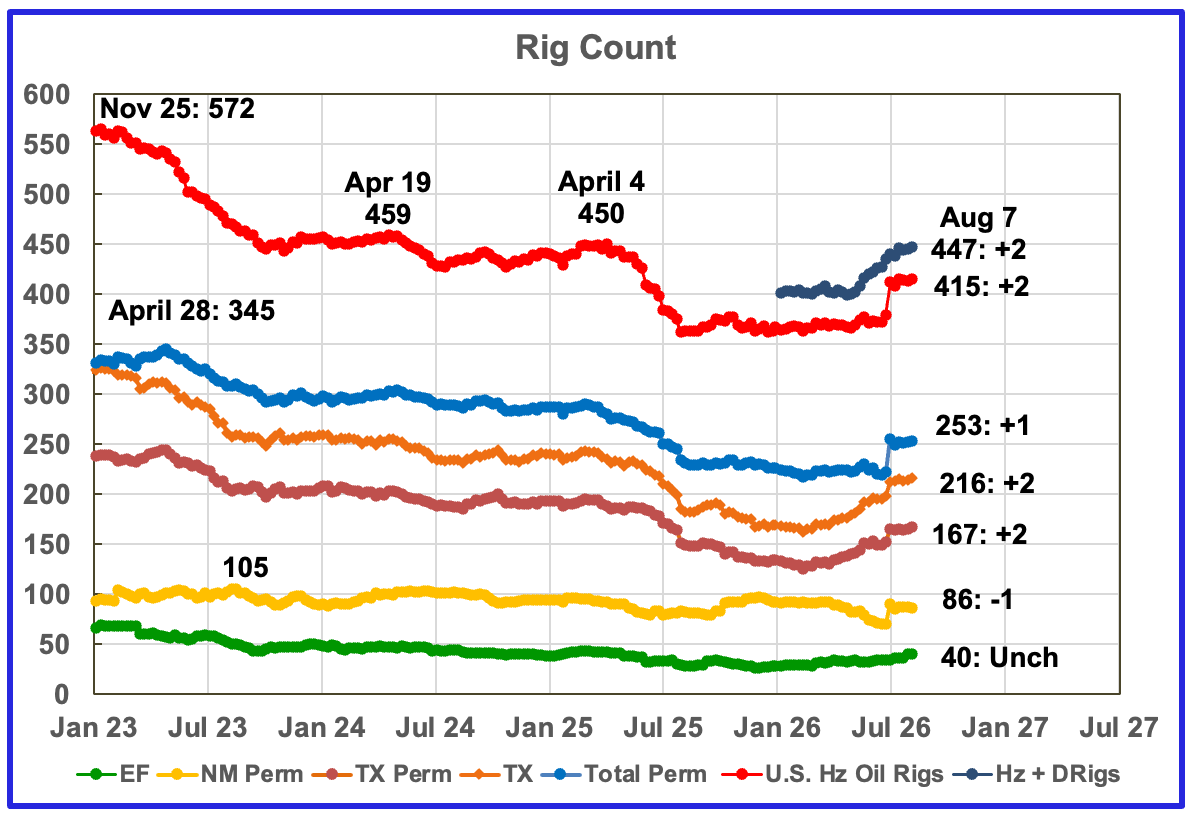
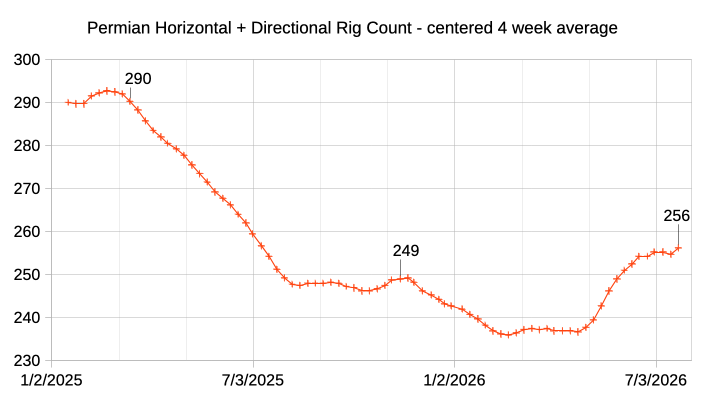
The Hz oil rig count in Lea County has stabilized at 33 over the last 7 weeks. Over the past six months Lea County dropped 30 rigs to 33 while Eddy added 15 Directional rigs in June. Actually the 15 Drigs operating in Eddy county were re-classified to Hz rigs in July. This is a significant addition to drilling capacity and future production regardless of whether they were Hz or Drigs.
Oil Production in New Mexico’s Primary Permian Counties
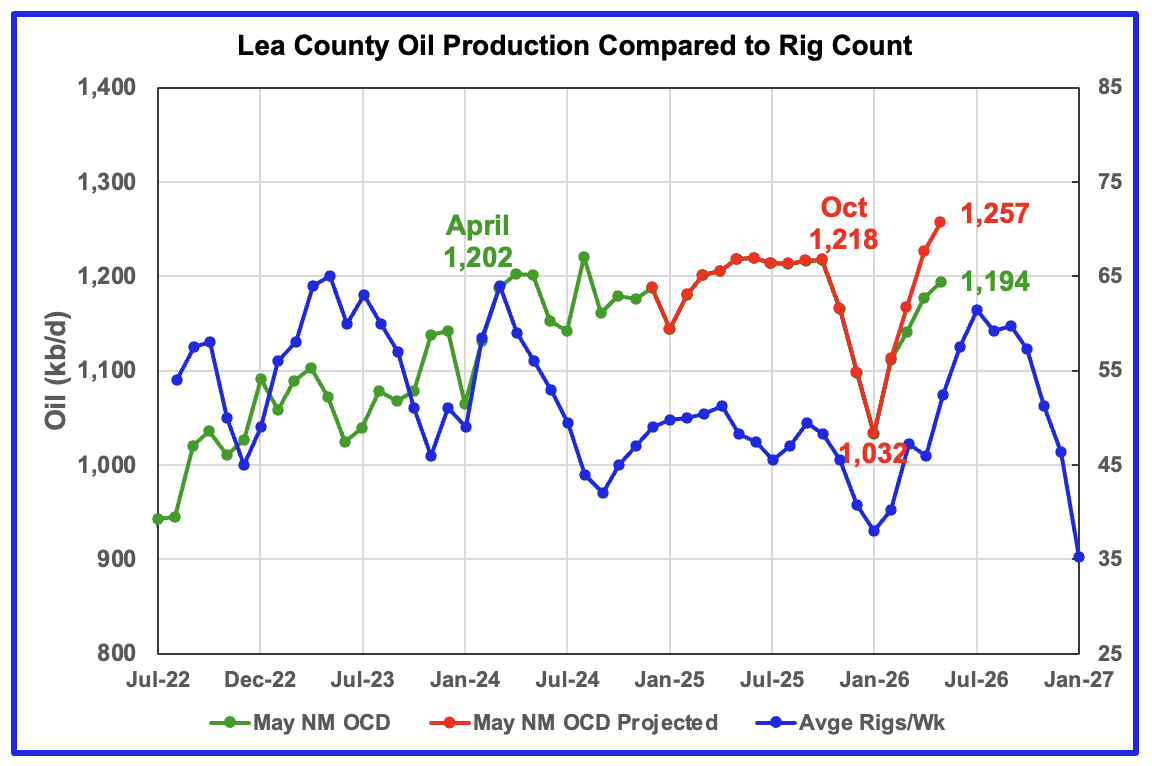
Lea County’s oil production started its plateau phase in April 2024 at 1,202 kb/d and it continued to October 2025. November 2025 to January 2026 has seen steady production drops in both the projected and NM OCD’s preliminary production. However the majority of January’s projected production drop of 66 kb/d was due to the severe January weather. February projected production rebounded and came in at 1,110 kb/d.
May projected production increased by 31 kb/d to 1,257 kb/d, a new record high. With May’s increase paralleling the time shifted rig count, it now appears more likely that the projected production increases in March and April are related to the time shifted increasing rig count. Note that from time shifted April 2026 to July 2026 the rig count increased from 46 to 61.
Preliminary May data from New Mexico’s Oil Conservation Division (OCD) indicates Lea County’s May’s oil production rose by 16 kb/d to 1,194 kb/d, green graph.
The blue graph shows the average number of weekly rigs operating during a given month as taken from the weekly rig data. The rig graph has been time shifted forward by 7 months. So the 64 Rigs/wk operating in August 2023 have been time shifted forward to March 2024 to show the possible correlation and time delay between rig count, completion and oil production.
Note that rig counts are being used to project production as opposed to completions because state completion data is not available. Completion data from the Drilling Productivity report below indicates that the number of completed DUCs slightly exceeds newly drilled wells in the Permian basin.
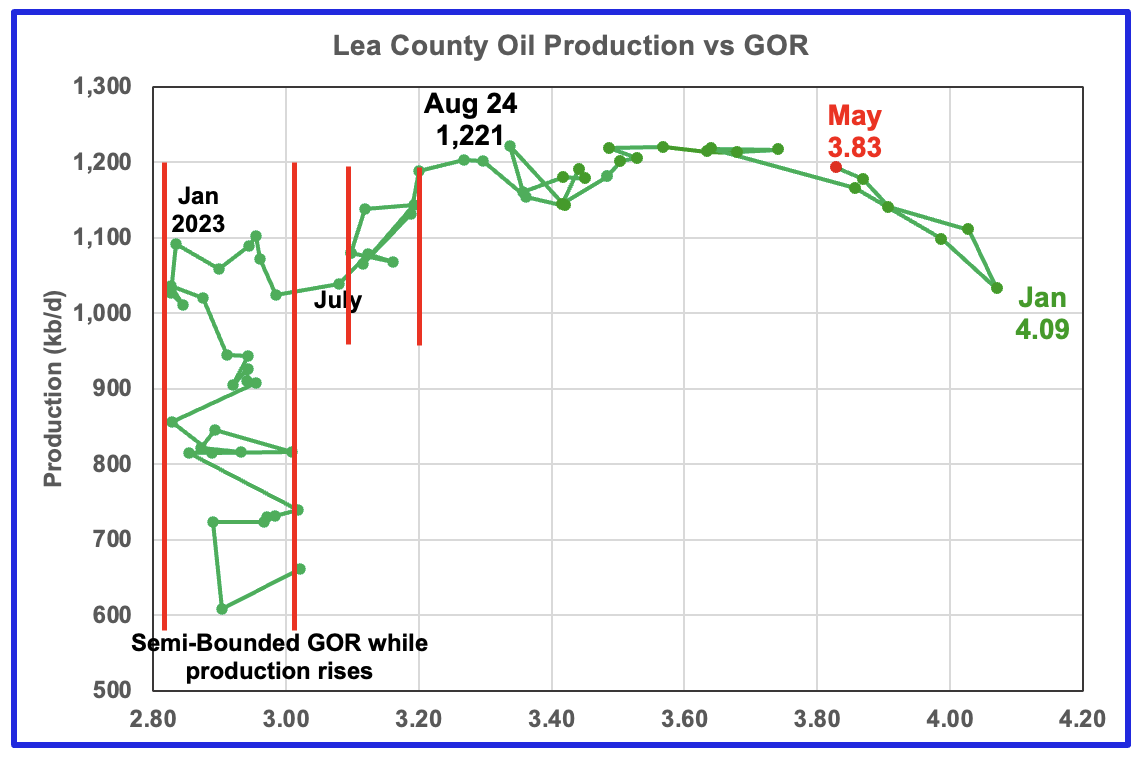
After much zigging and zagging, oil production in Lea county stabilized just below 1,100 kb/d in early 2023. Once production reached a new high in January 2023, production appeared to be on a plateau while the GOR started to increase rapidly to the right and first entered the bubble point phase in July 2023.
Since July 2023 Lea County’s production continued to increase as the GOR remained within a second semi-bounded region. This may indicate that additional production was coming from an oilier part of a layer since the GOR’s behaviour since August 2023 to March 2024 time frame appears once again to be in a second semi bounded GOR phase accompanied with rising production.
The GOR moved out of the second semi-bounded GOR region in April 2024 and production hit a new high of 1,221 kb/d in August 2024. February 2026 through May 2026 saw a double change in direction, both a production increase and a GOR decrease to 3.83, which may be consistent with rising production.
This zigging and zagging GOR pattern within a semi-bounded GOR while oil production increases to some stable level and then moves out to a higher GOR to the right has shown up in a number of counties. See a few additional cases below.
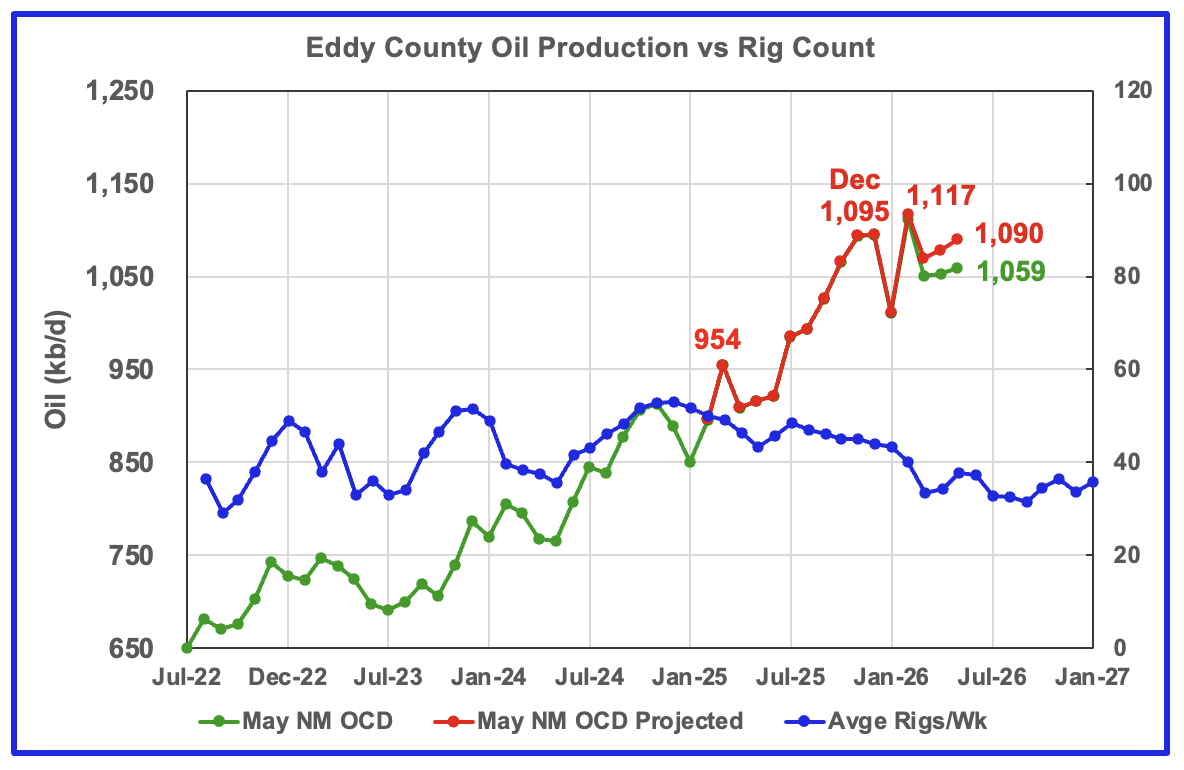
Eddy’s May projected oil production increased by 12 kb/d to 1,090 kb/d while preliminary production from the NM OCD increased by 7 kb/d to 1,059 kb/d. Most of the February production rise was due to a rebound from the severe January weather. If the storm had not occurred January production would have been closer to 1,100 kb/d.
The dropping rig count starting in time shifted January 2026 may have finally shown up in falling production in real March followed by both a small production and rig count rise. The May production rise of 12 kb/d may be the end of this small production increase as the rig count begins to stabilize around 35 rigs.
The blue graph shows the average number of weekly rigs operating during a given month as taken from the above weekly drilling chart. The rig graph has been shifted forward by 7 months to roughly coincide with the increase in the production graph starting in September/October 2023.
Between May 21, 2026 and July 3, 2026, 15 Directional Rigs, later reclassified to Hz rigs, were added to Eddy County. These additional rigs should provide a significant boost to Eddy oil production by year end.
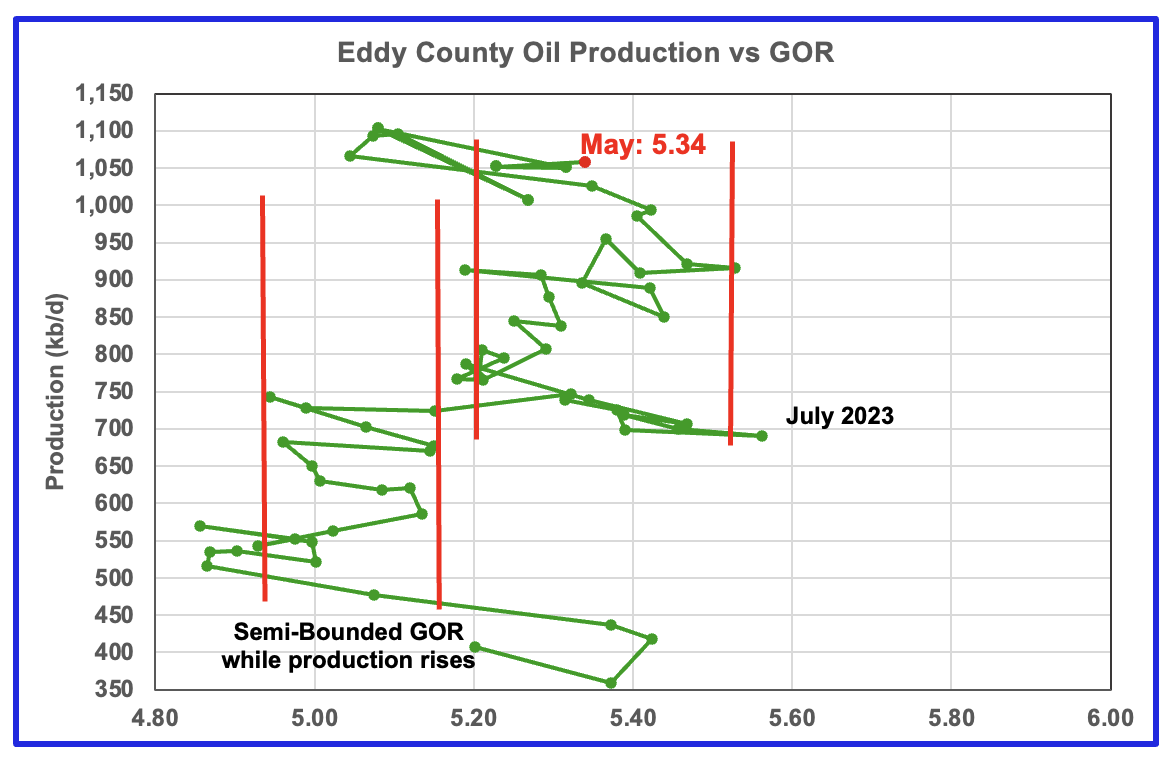
The Eddy county GOR pattern is similar to Lea county except that Eddy broke out from the first semi bounded range earlier and then added a second wider semi-bounded GOR phase.
For May New Mexico’s Oil Conservation Division (OCD) reported preliminary oil production increased by 7 kb/d to 1,059 kb/d while the GOR rose to 5.34 and moved back into the second Semi-Bounded GOR range.
Texas Permian
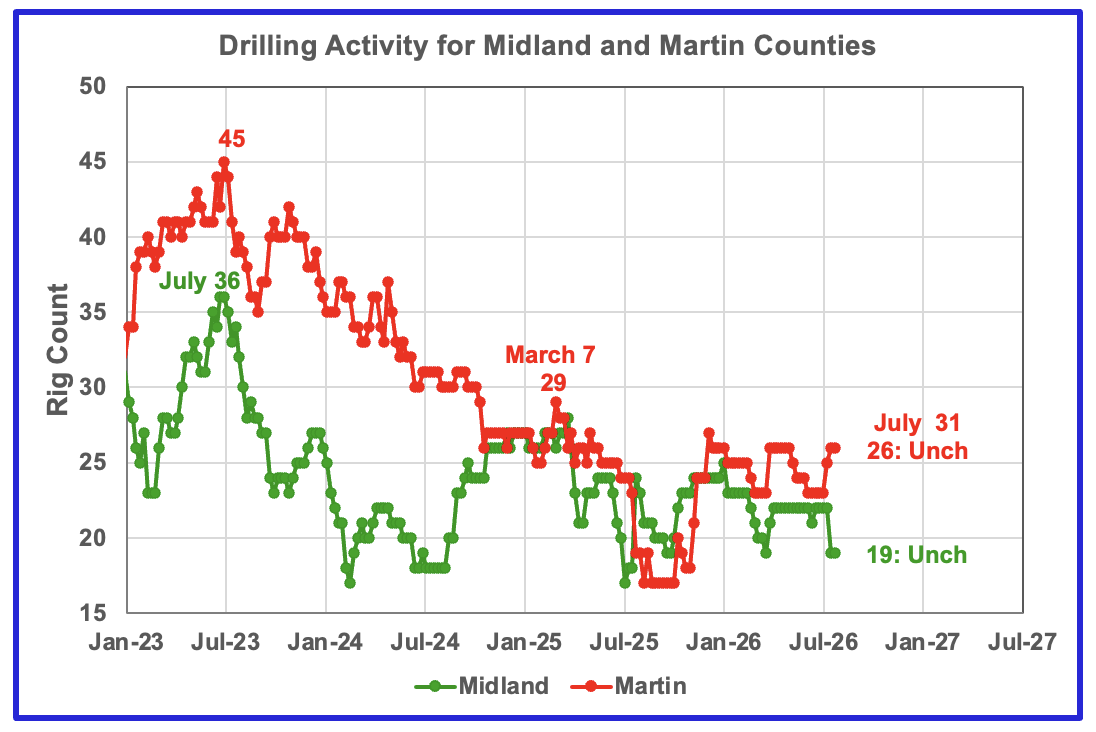
The rig count in Midland county has remained essentially unchanged for twelve weeks at 22 up to early July but then dropped to 19 at the end of July while Martin county increased its rig count from 23 to 26 over the past month.
Oil Production in the Two Primary Texas Permian Counties
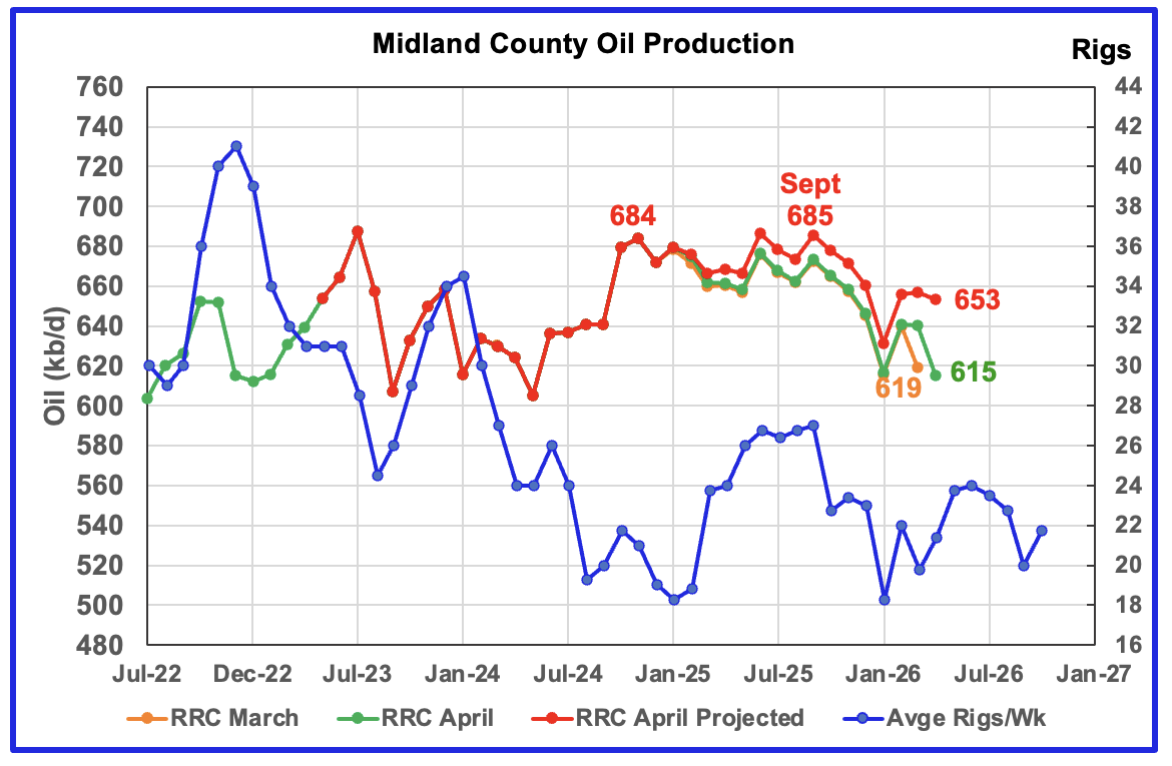
Comparison chart from last month.
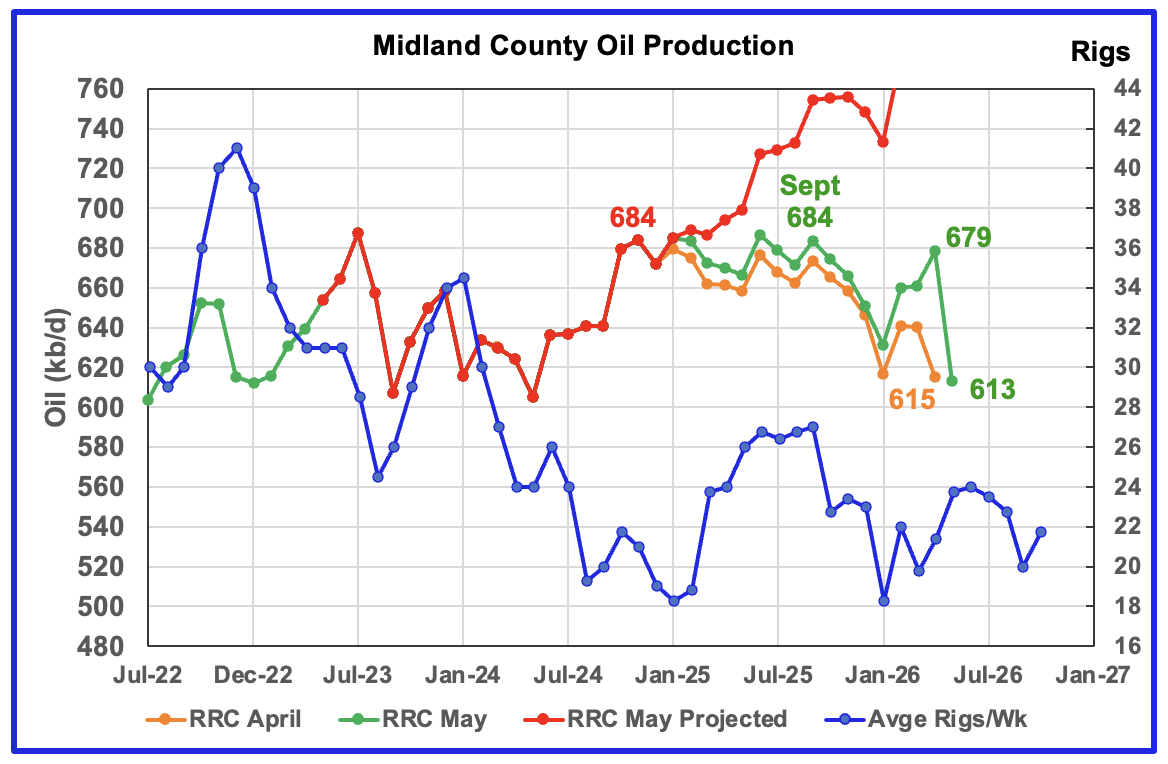
In the past, the Texas RRC has reported their monthly production on the 19th or 20th day of the month. For July the production report did not appear till July 22 and an inquiry to the RRC revealed that the system was being updated. As a result the projected production is not credible because the monthly increments are too large. Note how the April production of 615 kb/d was revised to 679 kb/d in the July report.
The most significant reported production is for May, 613 kb/d, which is 2 kb/d lower than April, 615 lb/d. As a result, I think the projected May production would be very close to the April comparison chart shown above.
The orange and green graphs show preliminary oil production for Midland County as reported by the Texas RRC for April and May respectively. The red graph uses April and May production to project production as it would look after being updated over many months.
The blue graph shows the average number of weekly rigs operating during a given month as taken from the weekly drilling chart. The rig graph has been shifted forward by 6 months to better align with the latest production.
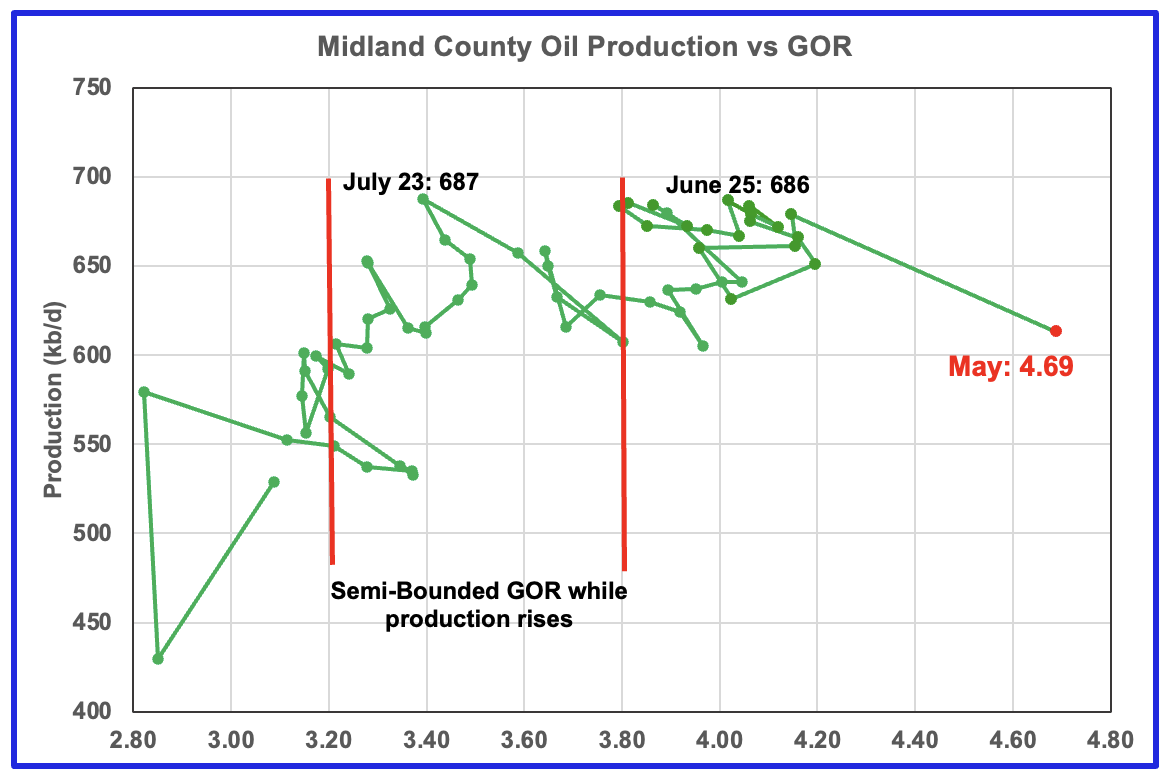
For May the Midland GOR ratio rose to a new high of 4.69 while the reported preliminary oil production dropped by 66 kb/d to 613 kb/d.
When the Midland county GOR initially moved into the bubble point phase, oil production and the GOR stayed within a narrow GOR range of 3.8 to 4.2 outside of the initial Semi-Bounded GOR region from March 2024 to December 2025. For May the GOR rose to a new high of 4.69, which is another indicator of dropping production.
The oil production and GOR shown in this chart are based on the RRC’s July preliminary production report.
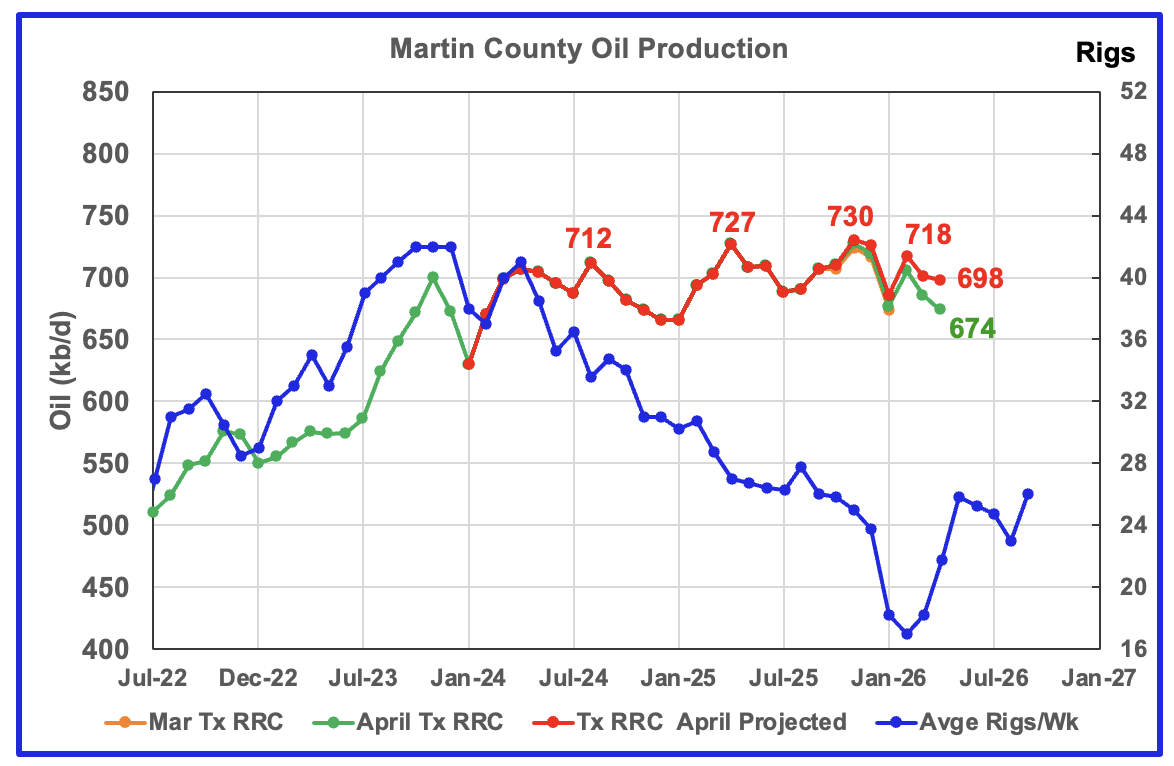
Comparison chart from last month.
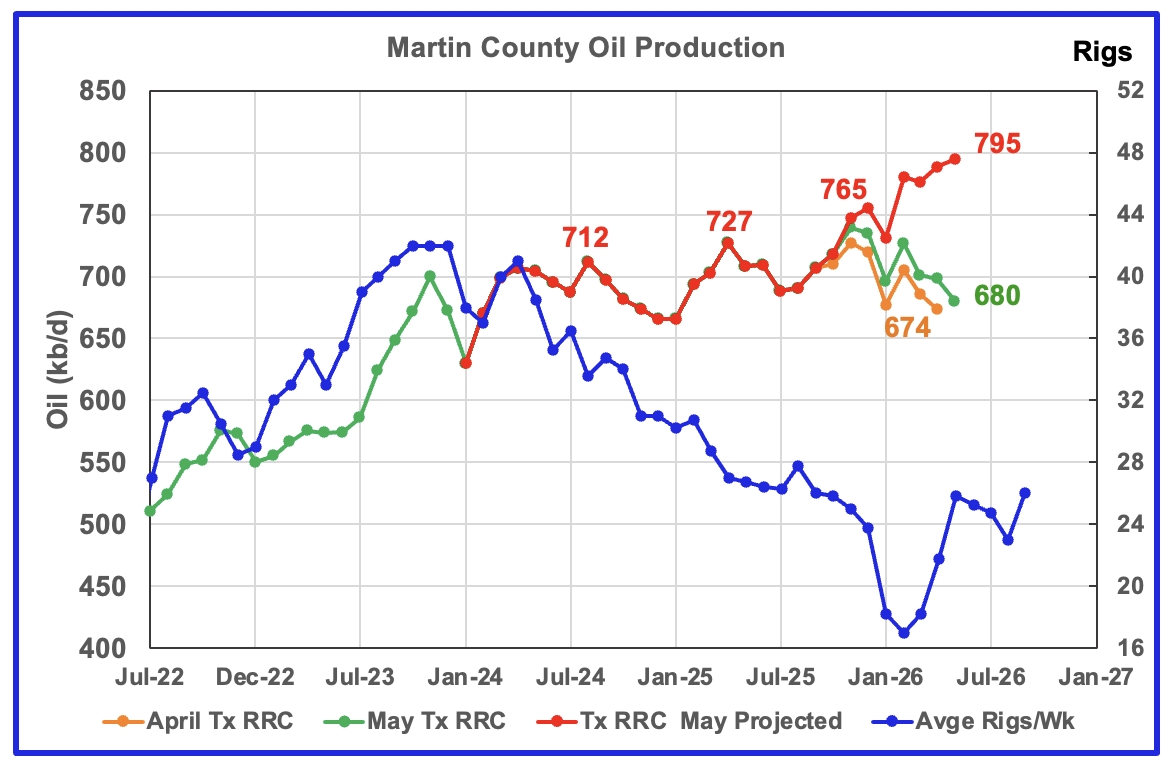
The comments regarding Midland’s projected production apply equally well to Martin production. Again note that the preliminary May production, 680 kb/d is very close the preliminary April production, 674 kb/d. As such, May projected production would be very similar to that shown in the April comparison chart.
The orange and green graphs show production for Martin County as reported by the Texas RRC for April and May. The blue rig graph time shifts the rig count forward by 5 months.
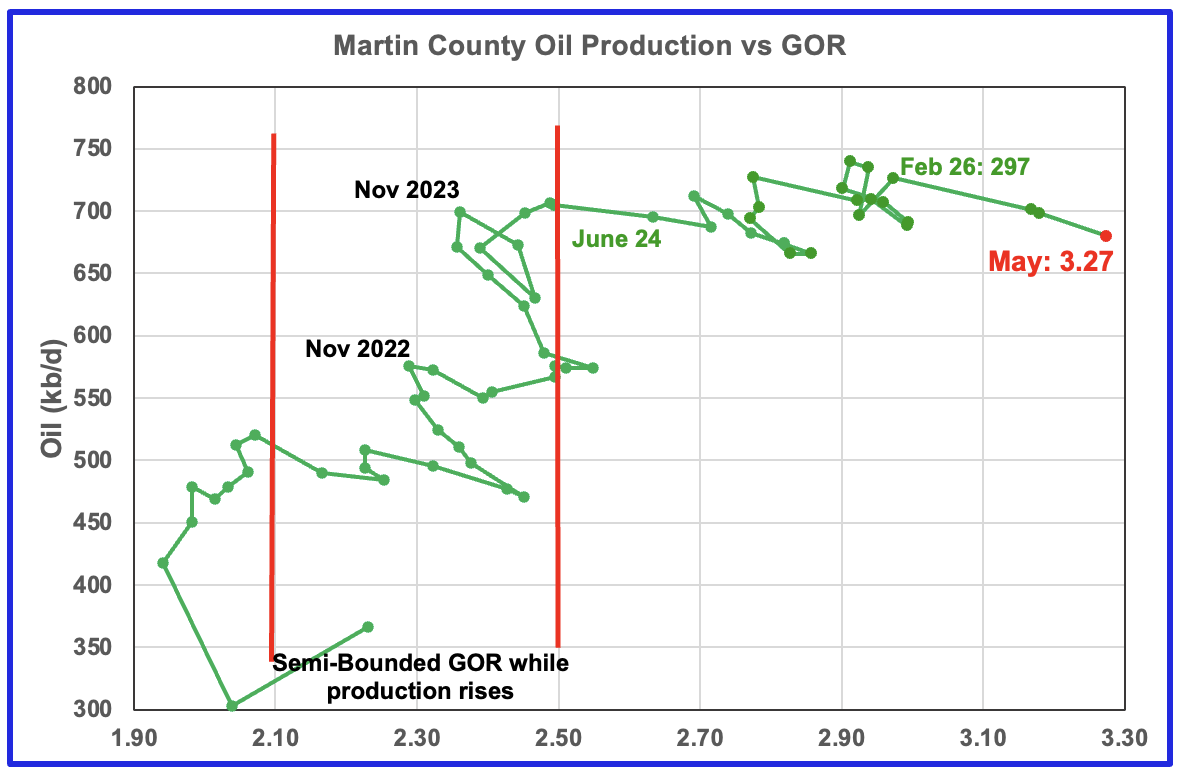
Martin county’s oil production after November 2022 increased and at the same time drifted to slightly higher GORs within the semi bounded range. However the June 2024 GOR saw its first move out of the semi bounded region.
The RRC’s preliminary May 2026 production for Martin County shows a 18 kb/d decrease to 680 kb/d accompanied by an increase in the GOR to a record 3.27.
Martin county has the lowest semi-bounded GOR boundary of the four counties at a GOR of close to 2.50. The May GOR is now clearly out of the semi-bounded region. Martin County has now entered the bubble point phase that should result in a plateau phase that should shortly turn into a slowly dropping oil production phase.
Texas District 8
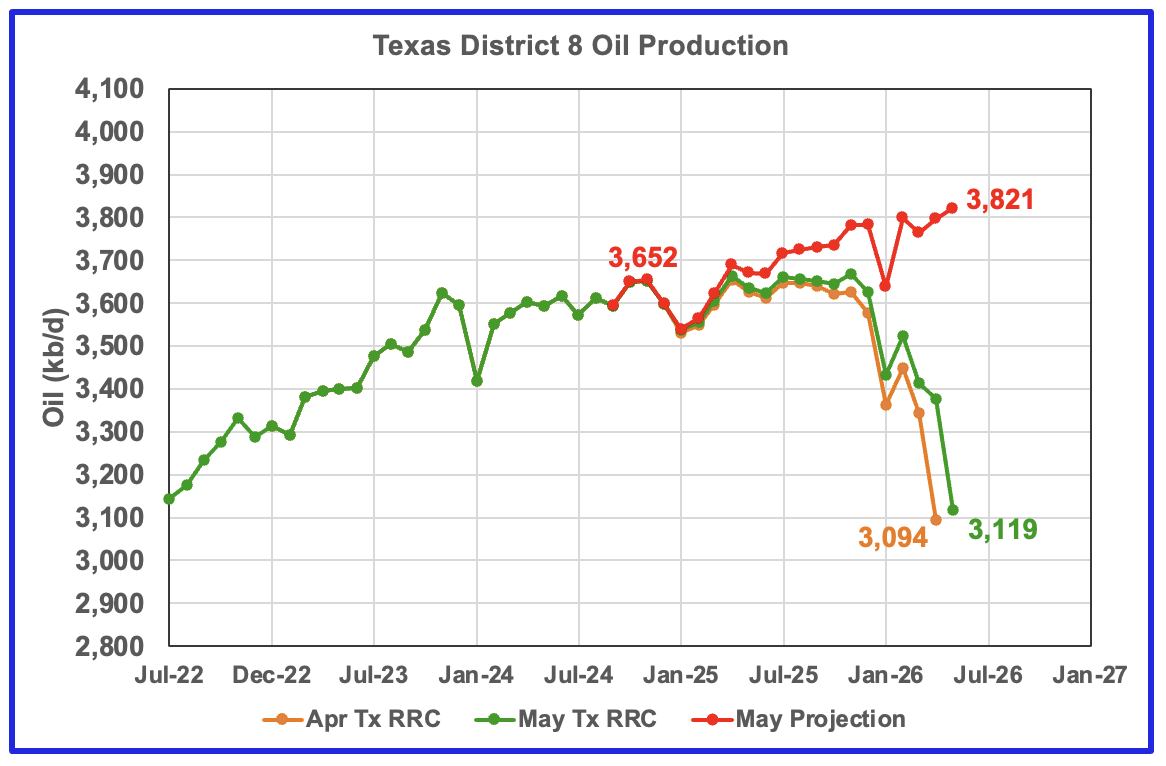
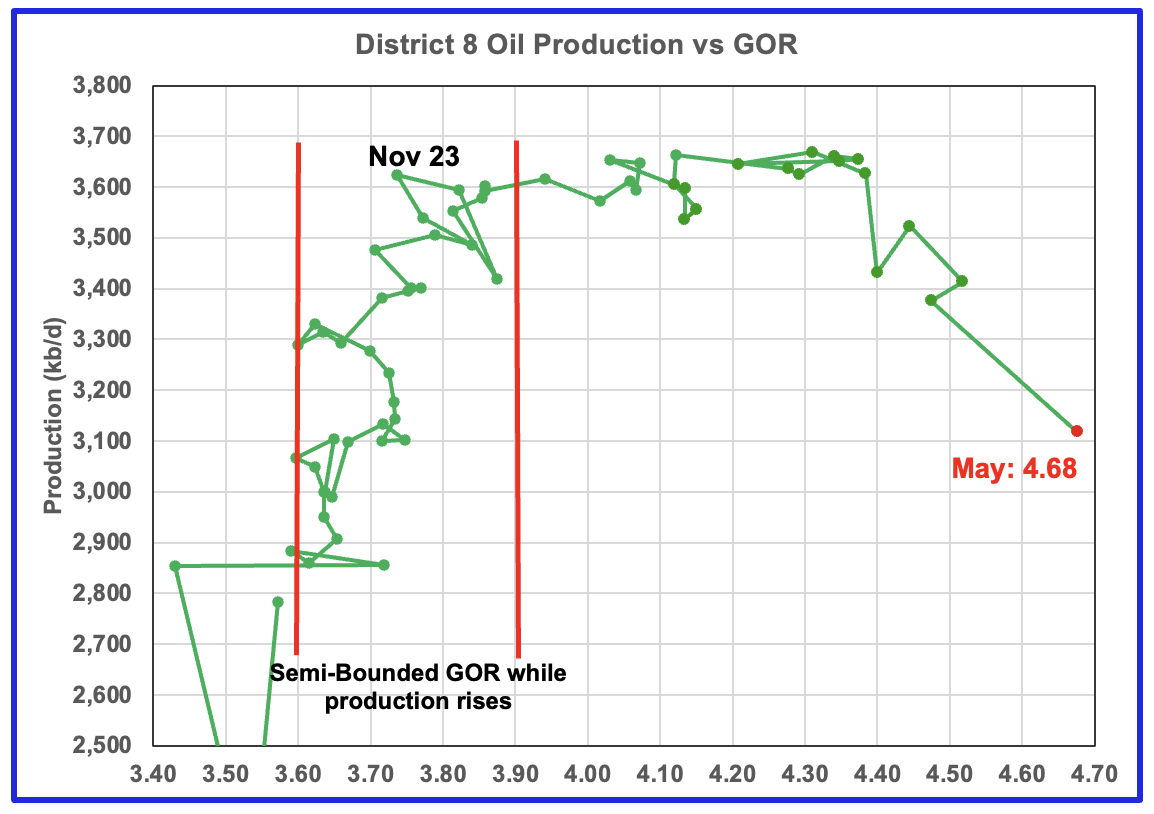
District 8’s projected production has the same issues as Martin and Midland counties and is too optimistic. However the GOR is not affected and it has moved to a new high of 4.68
Drilling Productivity Report
The Drilling Productivity Report (DPR) uses recent data on the total number of drilling rigs in operation along with estimates of drilling productivity and estimated changes in production from existing oil wells to provide estimated changes in oil production for the principal tight oil regions. The new DPR report in the STEO provides production up to June 2026. The report also projects output to December 2027 for a number of basins. The DUC charts and Drilled Wells charts are also updated to June 2026.
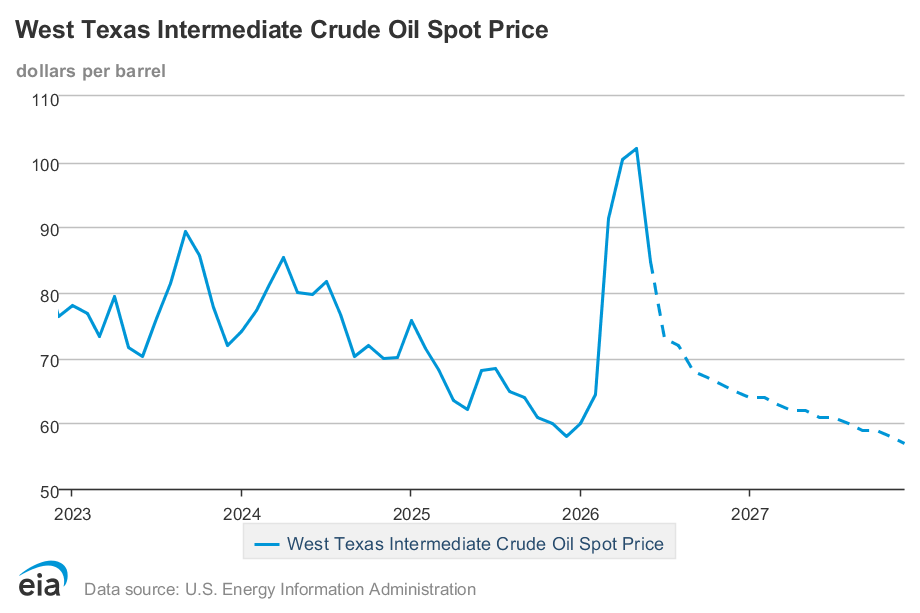
The DPR has made significant downward changes to the oil production forecasts for the three combined tight oil basins, Permian, Eagle Ford and Bakken reported here. It is not clear if the decreases are related to the sudden drop in the WTI oil price from over $100/barrel in April 2026.
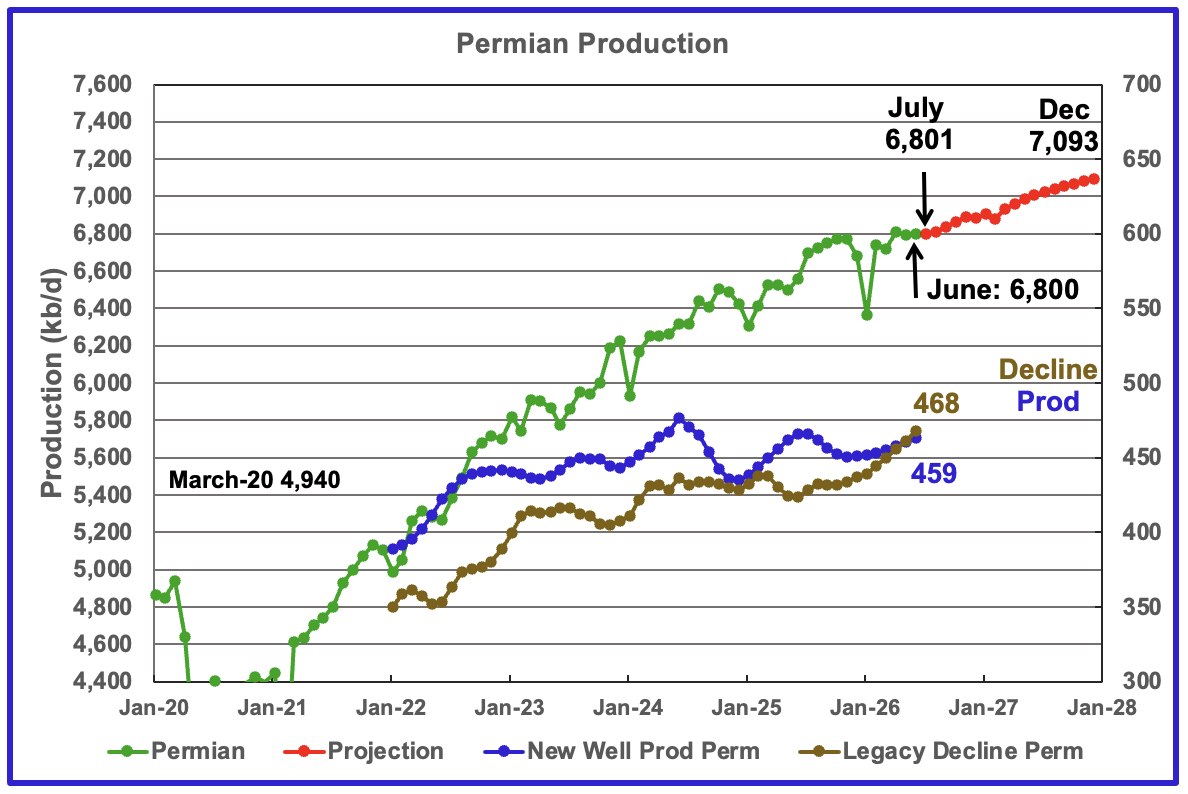
The EIA’s July STEO/DPR report shows Permian June output rose by 4 kb/d to 6,800 kb/d. July production is expected to increase by 1 kb/d to 6,801 kb/d. From June 2026 to December 2027 output is expected to increase by 293 kb/d to 7,093 kb/d. December 2027 production has been revised down by 275 kb/d from the previous report.
Note that production begins to rise steadily from September 2026 to December 2027. According to the EIA, this is due to more NG pipelines being built. The gas pipelines are needed to capture the associated flared gas coming from new oil wells. Also the production increase starting in the September/October time frame could simply be related to increased drilling.
Production from new wells and legacy decline, right scale, have been added to this chart to show the difference between new production and legacy decline.
These numbers reflect a one year production trend and provide the production contribution from new wells over a rolling 12-month period to determine if the rate of new production is increasing or decreasing compared to previous periods. The averaging process approximately adds a six month delay. Currently, decline is slightly larger than new production. With growing projected production going forward, this should change.
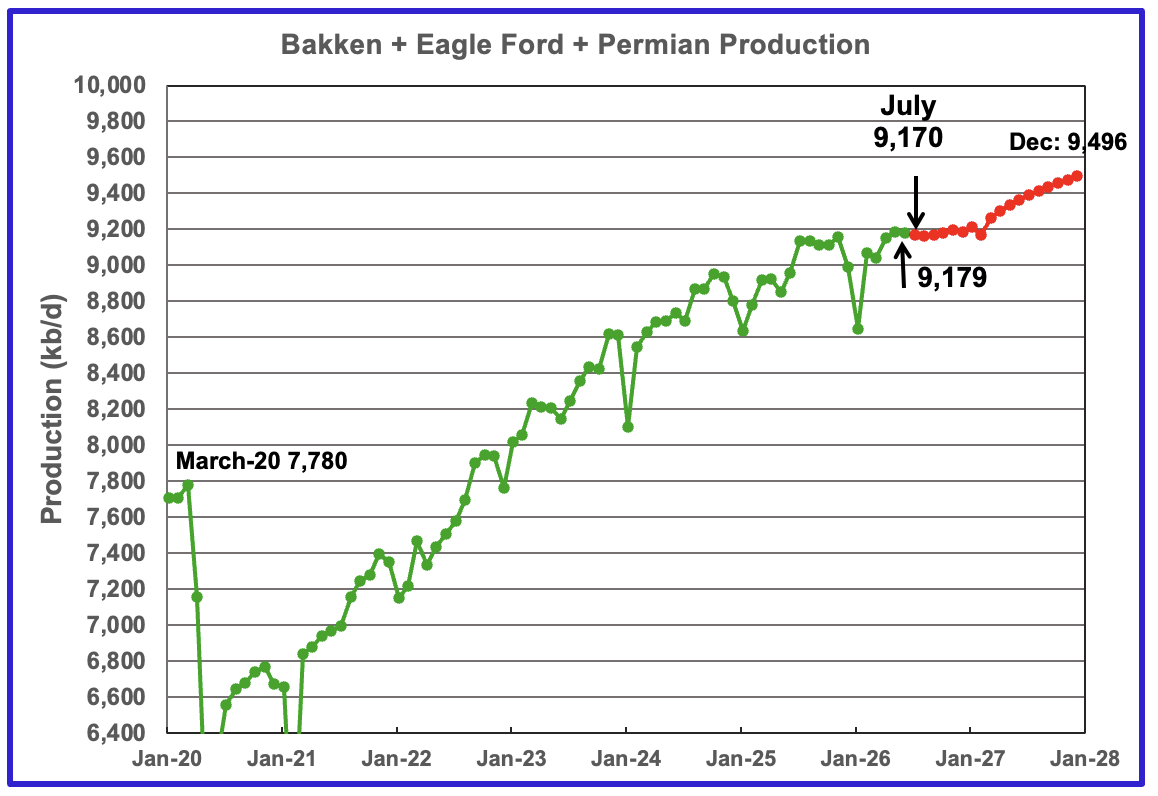
This chart plots the combined production from the three main LTO regions. June output decreased by 6 kb/d to 9,179 kb/d. July is expected to drop an additional 9 kb/d to 9,170 kb/d. Production for December 2027 is forecast to be 9,496 kb/d, revised down by 361 kb/d from the previous report.
DUCs and Drilled Wells
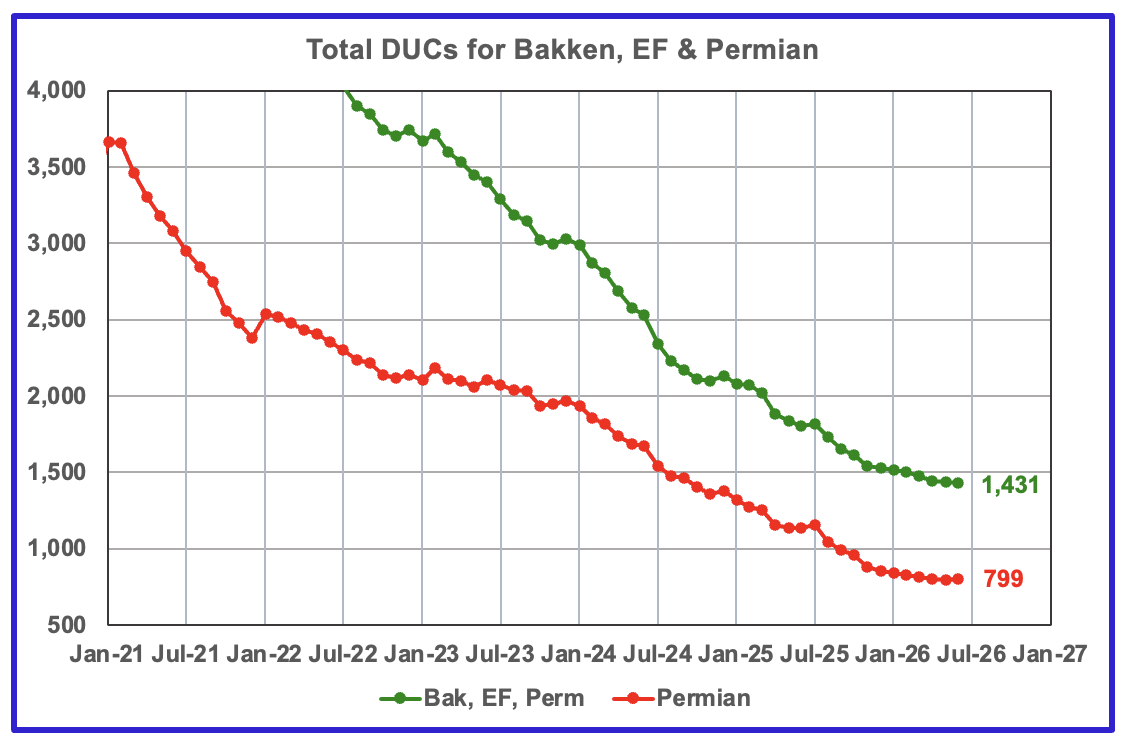
The number of DUCs available for completion in the Permian and the three major DPR regions continues its dropping trend. The June DUC count for the three basins dropped by 3 to 1,431. In the Permian the DUC count added 2 to 799.
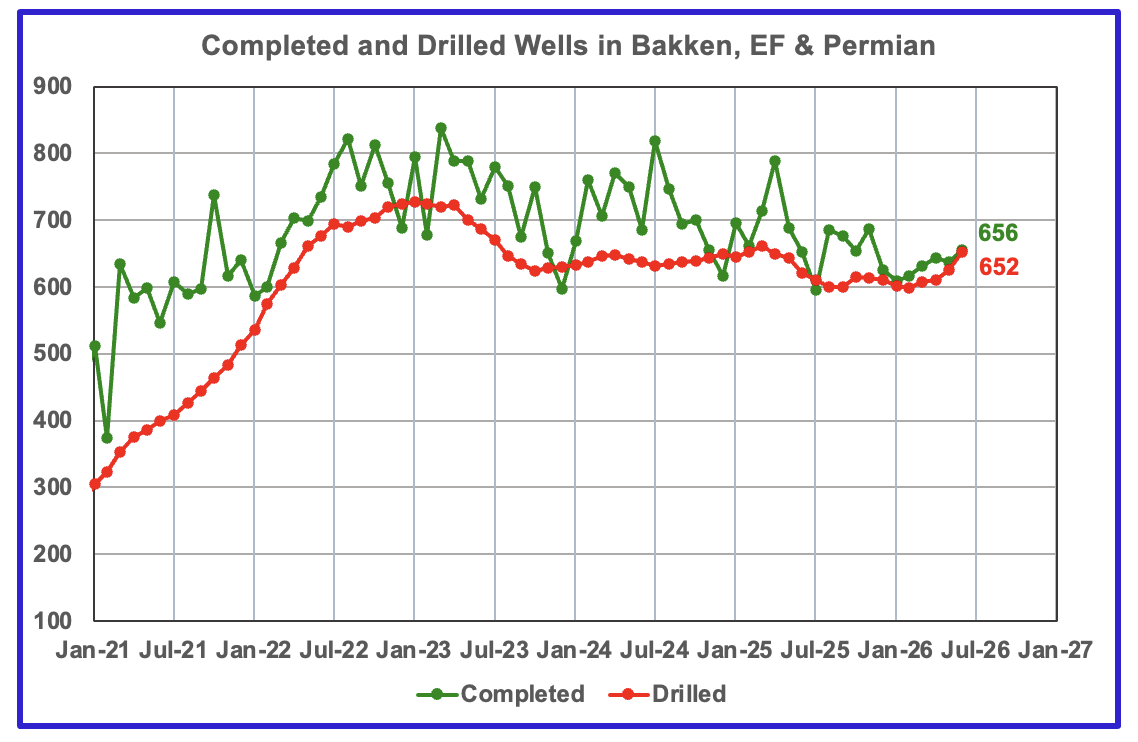
In the three primary regions, a total of 656 wells were completed in June, 19 more than in May. There were 652 wells drilled in June 2026, up 26 from May 2026.
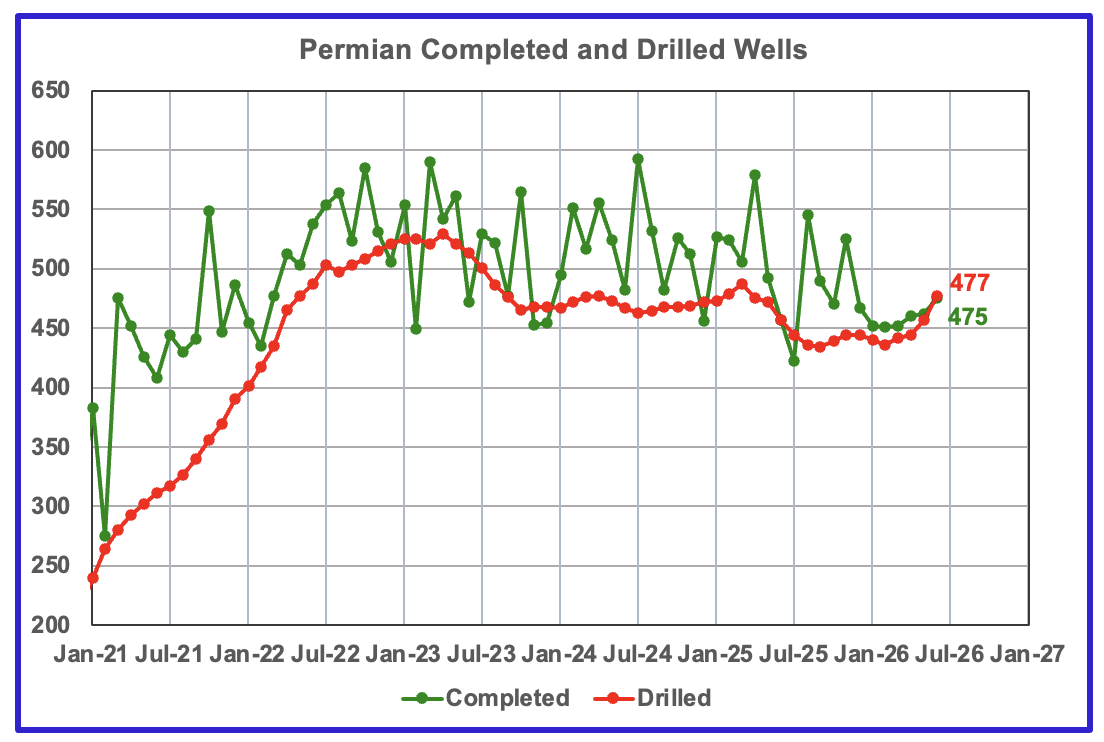
In the Permian, 475 wells were completed in June and 477 were drilled. Drilling and completions have been increasing since March.

Leave a Reply