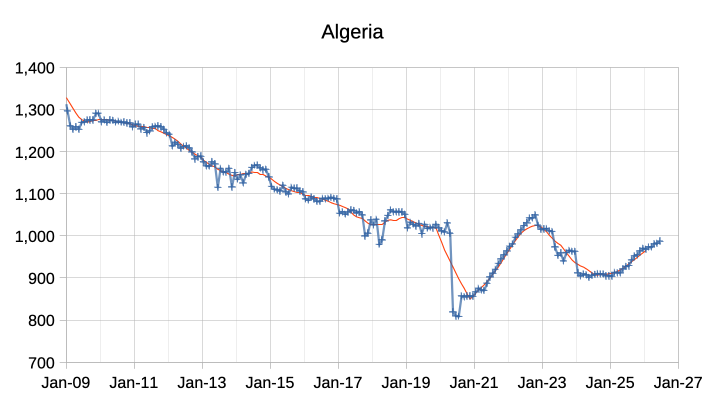
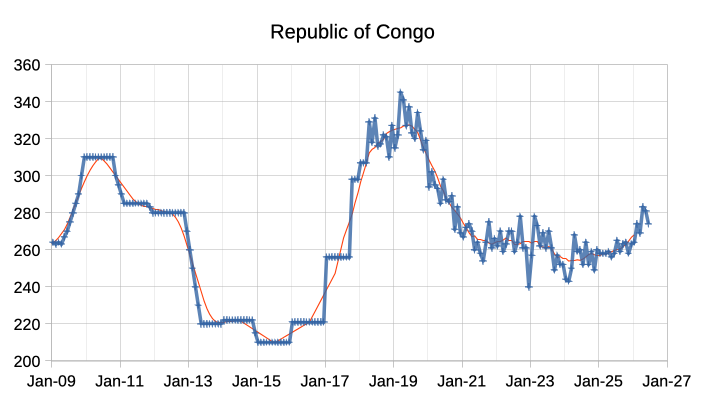
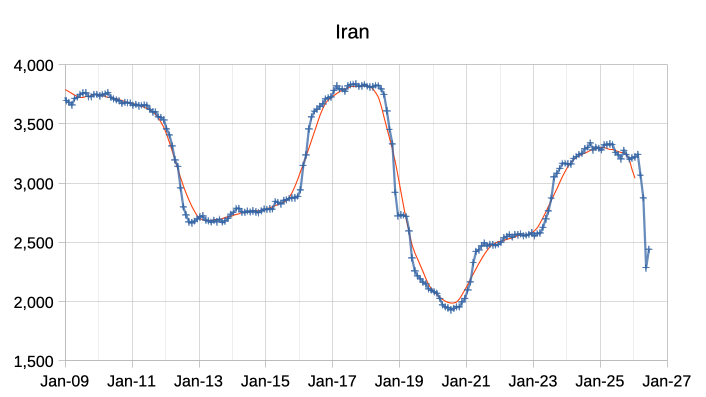
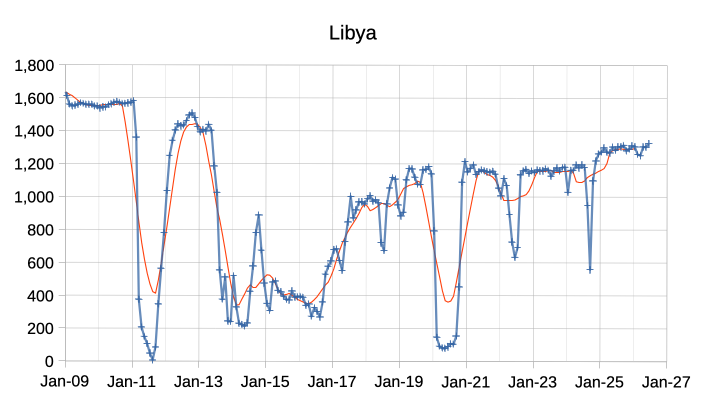
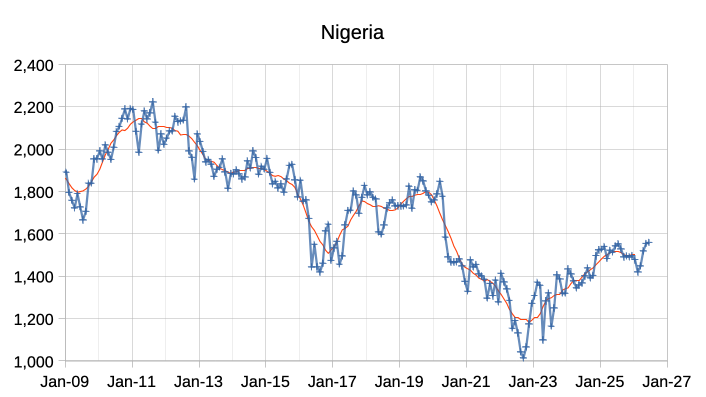
The OPEC Monthly Oil Market Report (MOMR) for July 2026 was published recently. The last month reported in most of the OPEC charts that follow is June 2026 and output reported for OPEC nations is crude oil output in thousands of barrels per day (kb/d). In the OPEC charts below the blue line with markers is monthly output and the thin red line is the centered twelve month average (CTMA) output.
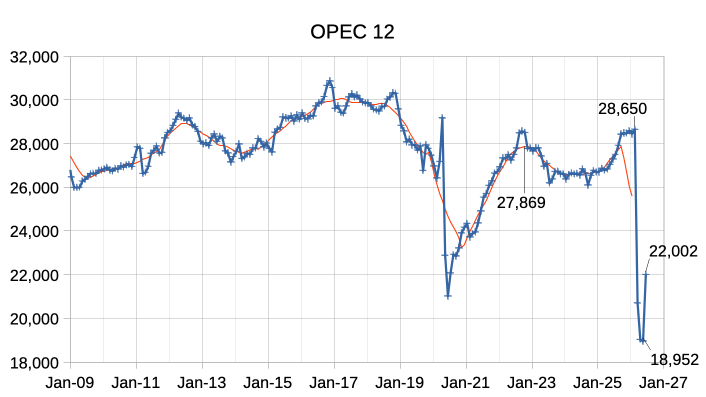
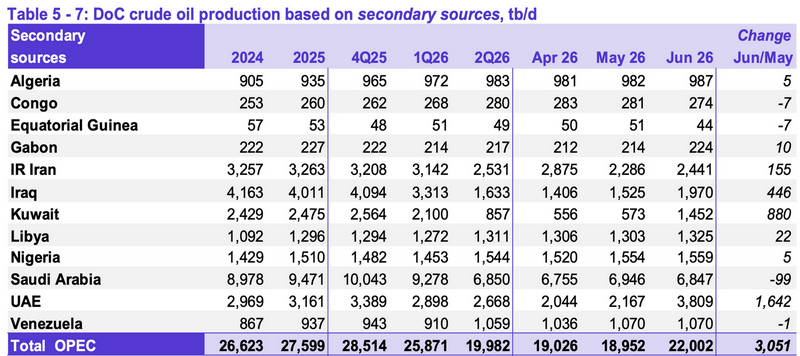
OPEC 12 output increased by 3051 kb/d from May 2026 to June 2026 with the largest increases from UAE (1642 kb/d), Kuwait (880 kb/d), Iraq (446 kb/d), and Iran (155 kb/d). Saudi Arabia saw a 99 kb/d decrease, Libya had a 22 kb/d increase in output in June and other OPEC nations had small increases or decreases of 10 kb/d or less (collectively they had a 5 kb/d increase in crude output.) The 4 OPEC nations with large increases collectively increased OPEC output by 3123 kb/d with UAE accounting for more than half of this increase. Note that UAE has left OPEC, but OPEC continues to report UAE output as if it were a member. If we omit UAE the OPEC increase in June was only 1409 kb/d.
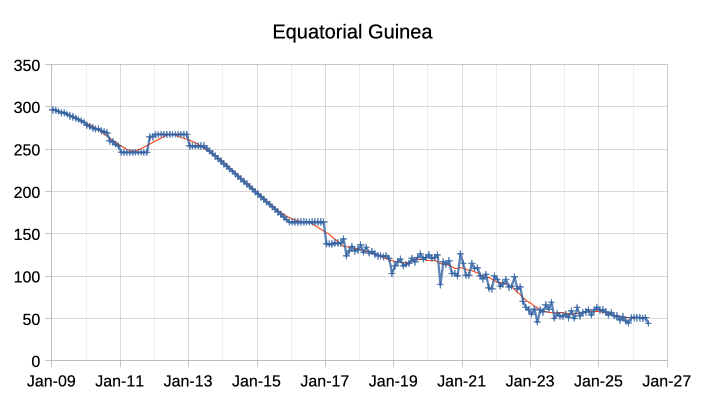
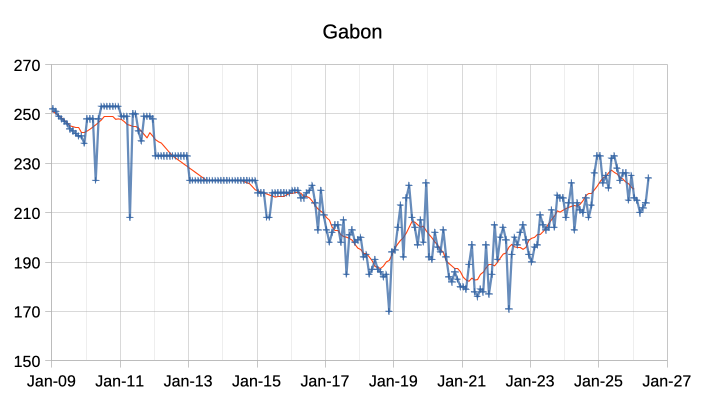
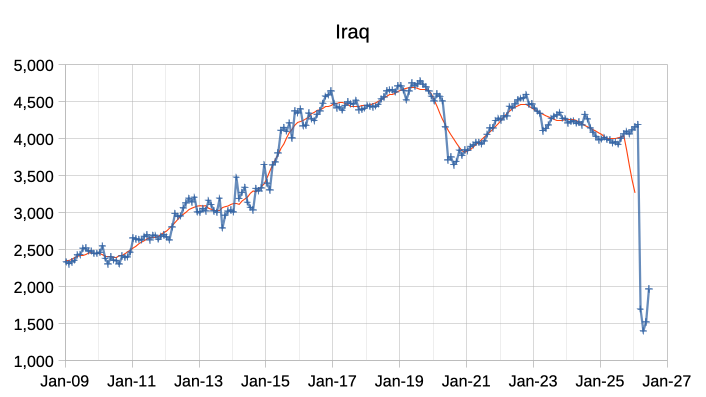
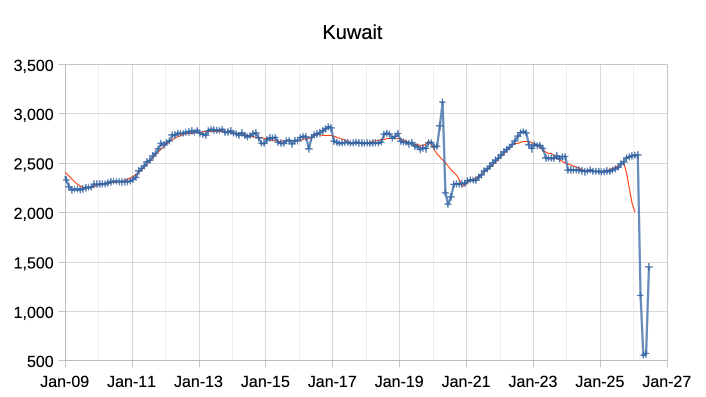
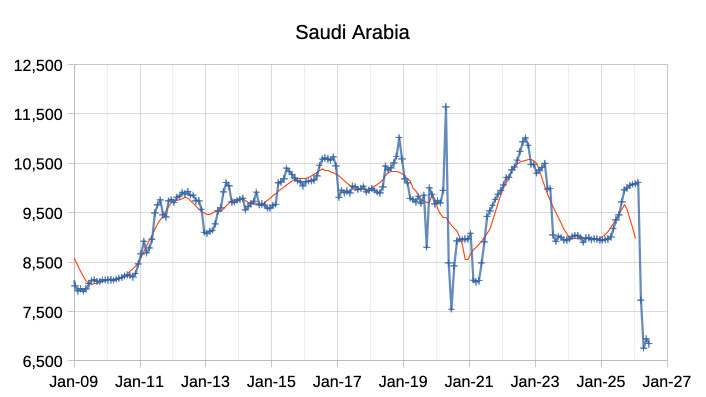
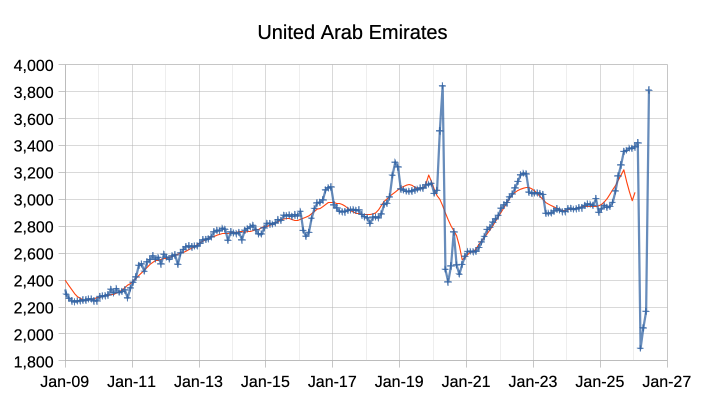
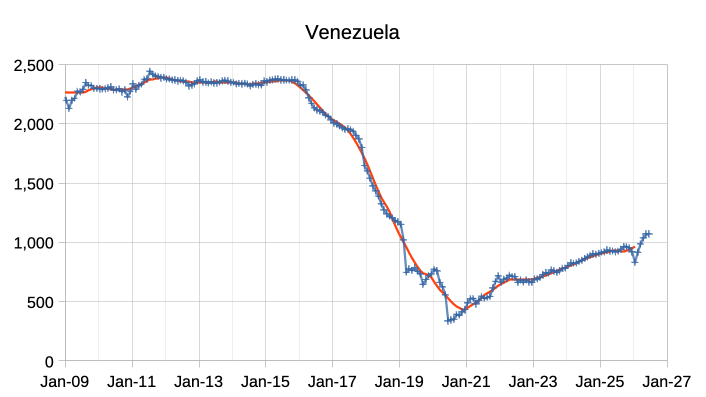
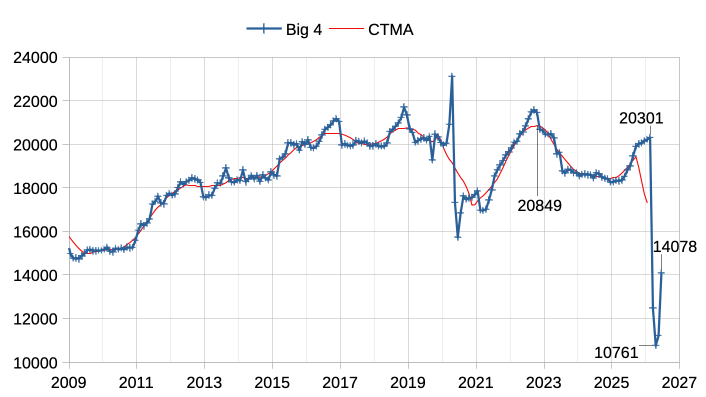
The chart above shows output from the Big 4 OPEC producers that are subject to output quotas and where most of OPEC spare capacity currently exists (Saudi Arabia, UAE, Iraq, and Kuwait.) Since February 2026 output from the Big 4 fell by 9540 kb/d by April 2026 and has since increased by 3317 kb/d over the past 2 months. OPEC spare capacity has decreased to about 6771 kb/d in June 2026. This spare capacity estimate is 4009 kb/d less than my estimate 2 months ago. I expect the recent closing of the Strait of Hormuz may reduce OPEC output in August and spare capacity from OPEC may increase yet again.
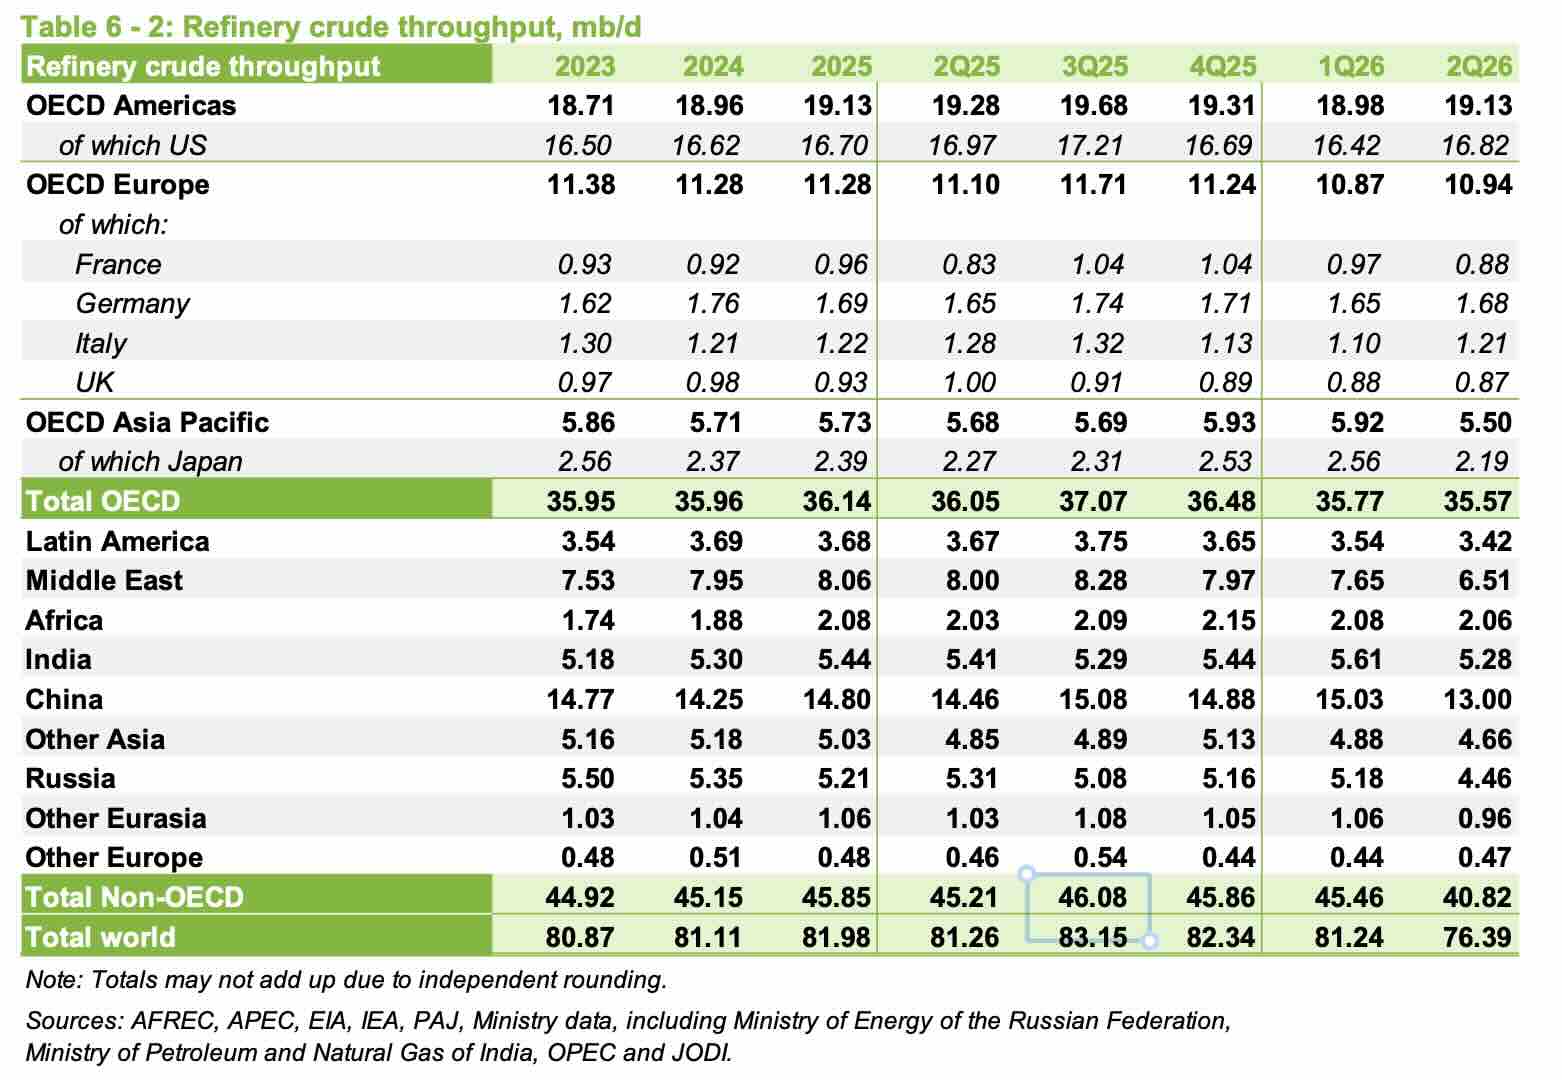
World demand for crude oil dropped from 81.26 kb/d in 2Q2025 to 76.39 kb/d for 2Q2026, a drop of 4.87 kb/d which is about a 6% drop in World demand for crude oil. It may be that draws on commercial product stocks accounts for some of this drop and some may be consumer response to higher fuel prices. In my previous OPEC update from 2 months ago the estimate for crude demand decrease in 2Q2026 was 3.09 Mb/d so this new estimate is significantly higher than 2 months ago. Also note that China and Russia combined saw a 2.31 Mb/d drop in crude input to refinery from 2Q2025 to 2Q2026, about 47% of the World decrease.
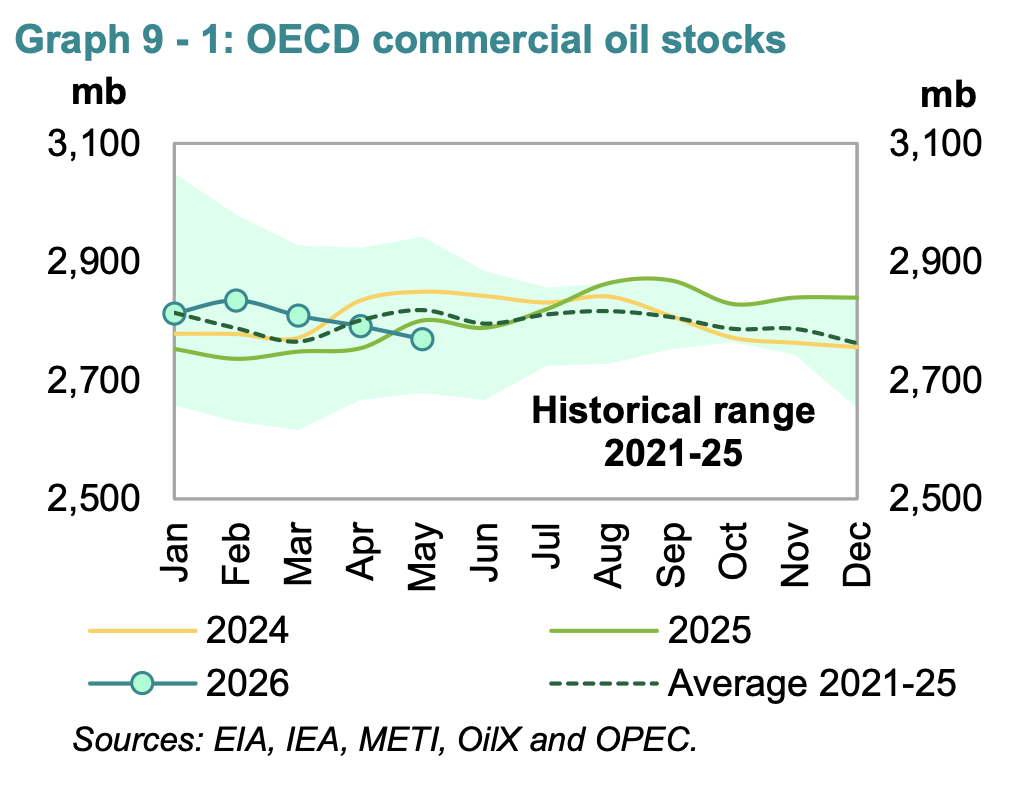
OECD commercial oil stocks fell to 48.6 Mb below the 2021-2025 average in May 2026.
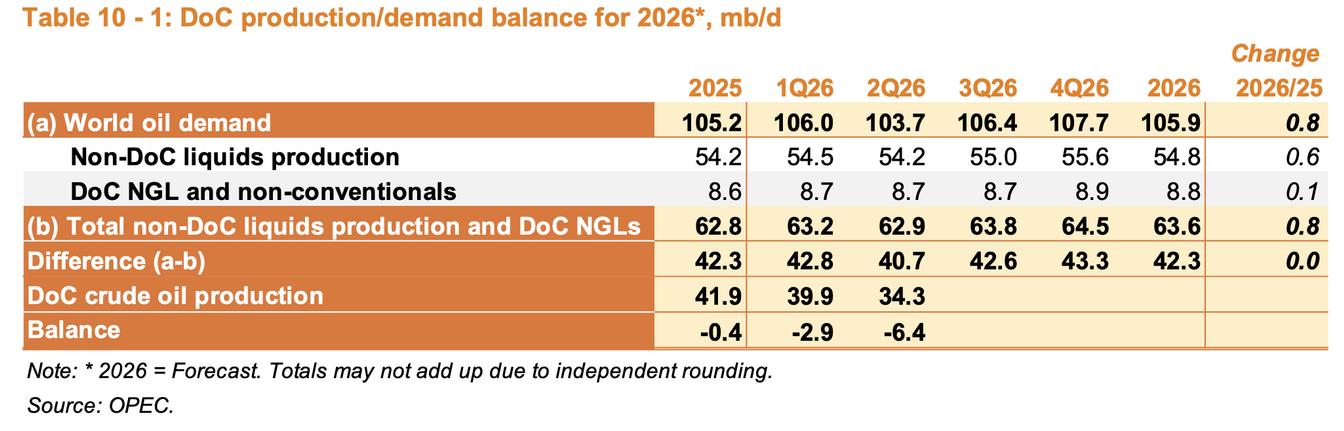
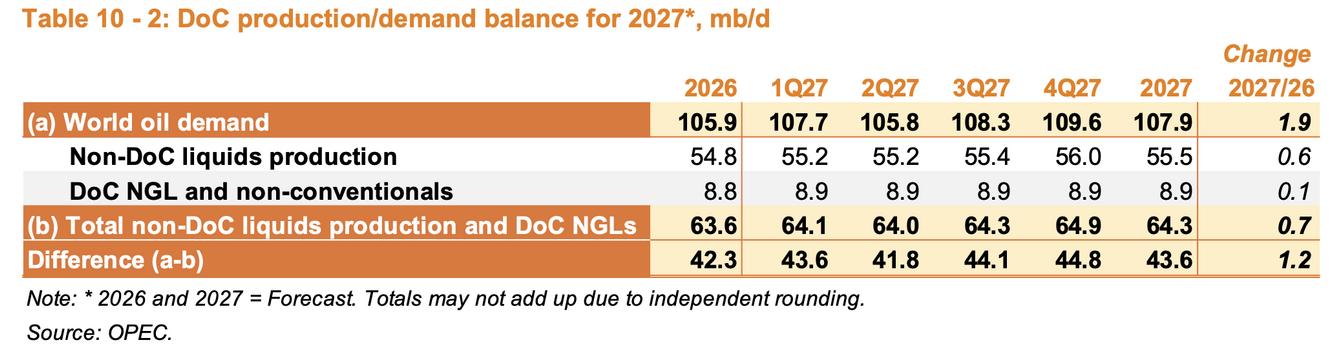
For 2026 the average annual forecast for World Demand for liquid fuel was reduced from 2 months ago (May 2026 MOMR) by 400 kb/d in the July 2026 MOMR, demand for 2027 is unchanged. Also the implied stock draw based on the OPEC supply and demand estimates for 1H2026 is 837 million barrels. If World importers of crude oil maintain about a 90 day stock level of crude oil in SPR and commercial stocks combined the at the end of 2025 this would be roughly 4 Gb of crude oil stocks for the World.
If we further assume about 50% of these crude stocks are oil on water, pipeline fill and minimum tank levels, AKA minimum operating level (MOL), this would suggest only 2 Gb of that 90 day crude stock level is useable. About 58% of these useable stocks remain as of June 30, 2026, about 1163 million barrels or 26 days of World average crude imports in 2025. If Hormuz and Red Sea are closed we could see crude stocks run down to MOL in 2 months or less, unclear how high oil prices might rise in that case.
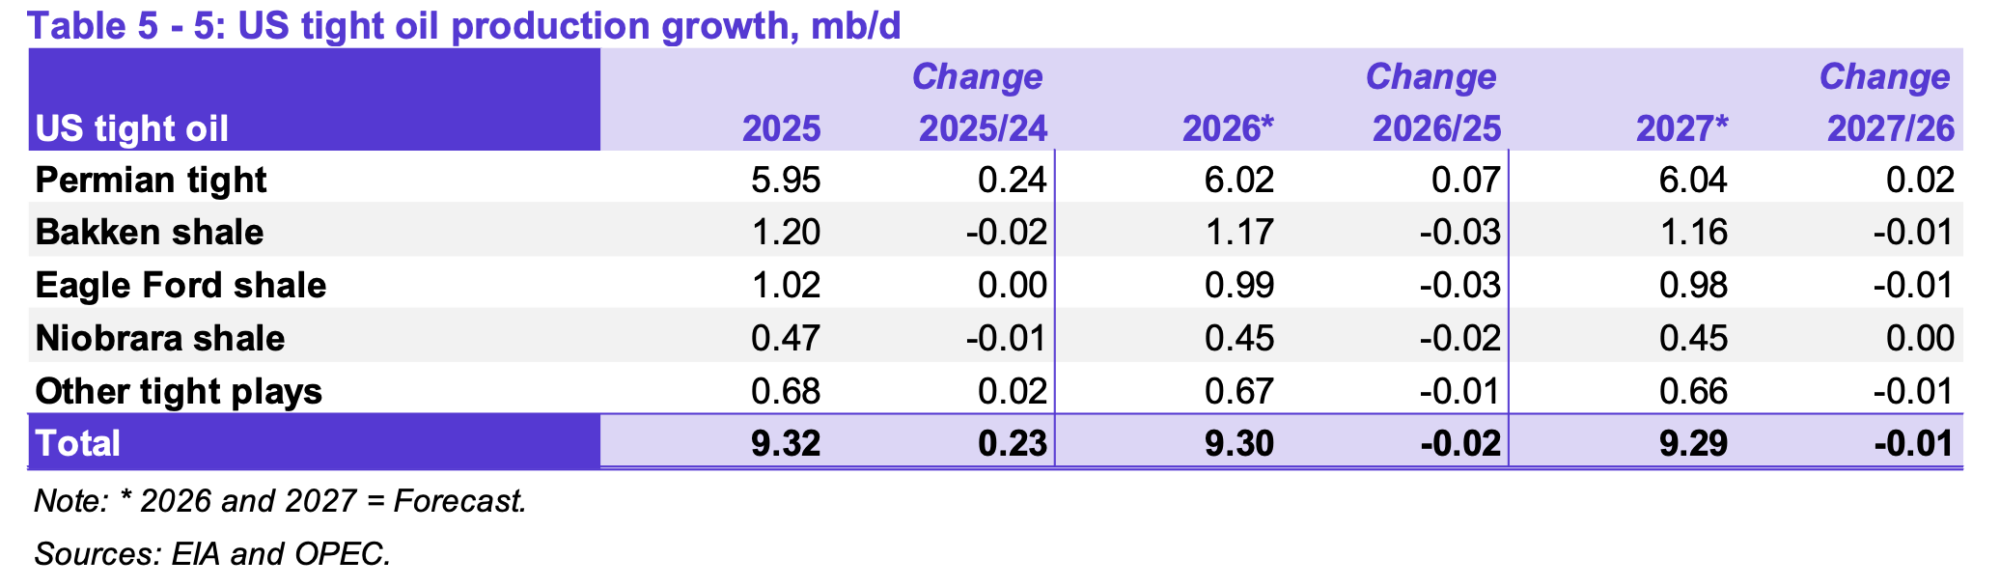
OPEC forecasts a small drop in US tight oil output in 2026 and 2027 with a total decrease in average annual output of 30 kb/d over those 2 years from 2025 to 2027. The recent Short Term Energy Outlook from the EIA has average annual tight oil output at 9.36 Mb/d in 2025, 9.40 Mb/d in 2026, and 9.66 Mb/d in 2027. Given the recent problems with shipping crude oil out of the Middle East and the potential for high oil prices, perhaps the higher estimates from the EIA will prove correct.
Future Permian output will depend on oil and natural gas prices at least in part. Under a low oil price scenario and low natural gas price scenario (under $75/b for oil and under $3/MCF for natural gas in the Permian Basin), I have the following scenario for the Permian Basin, note that after June 2026 the “data” is based on the STEO forecast for Permian tight oil.
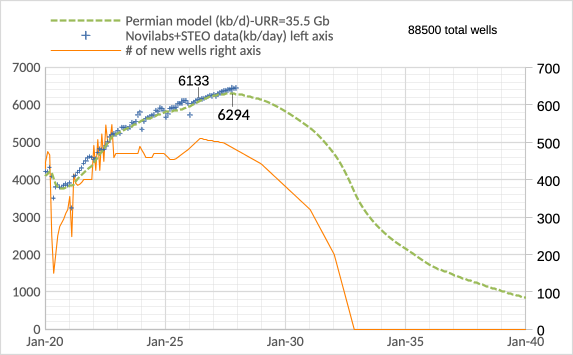
The scenario spreadsheet is at this link.
For a higher oil and natural gas price scenario (oil over $100/b and natural gas over $5/MCF in the Permian Basin) we might see higher Permian output as in the scenario below.
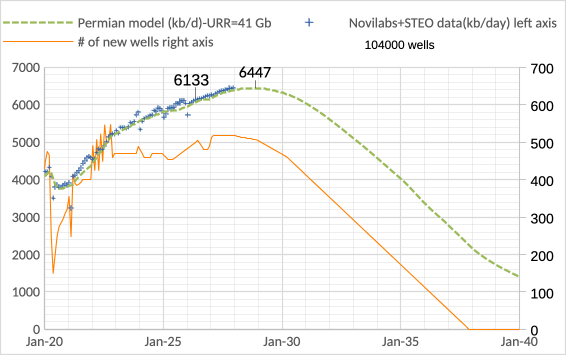
The spreadsheet for this high price scenario is at this link.
Note that these two scenarios are chosen from an infinite set of possible future scenarios, odds that either is correct is exactly zero.
166 responses to “OPEC Monthly Oil Market Report, July 2026”
Saudi crude oil exports have been reduced by about 5.37 Mb/d from the January level in June according to the piece linked below
https://oilprice.com/Latest-Energy-News/World-News/Saudi-Red-Sea-Crude-Exports-Have-Sank-41-Since-March-Peak.html
Note that World crude exports in 2025 averaged about 44.3 Mb/d, so this represents a 12% drop in World crude exports from one nation alone (Saudi Arabia).
Thanks for the detailed plots, DC!
looks like that UAE is increasing/rebounding fast, assuming they are bypassing the SOH.
Also, if Saudi has reduced their export by 5.37MBOPD, while their production has decreased only 3MBOPD, then this implies that they are stockpiling 2MBOPD?
looks like Haynesville just made a new high of 18.2BCFPD
https://www.oilpriceapi.com/basins/haynesville
6months ago, January, 2026, Haynesville marketed gas is just 10.8BCFPD, and in 2025, probably a low of just over 9BCFPD.
This youtube link
https://www.youtube.com/watch?v=6uPHL5NWpZU
gives only 22 rigs in legacy LA Haynesville and it is making this rebound? The western Haynesville is still under 1BCFPD with roughly 6 rigs total. The majority of oil and gas observers emphasize that the problem with Western Haynesville is the cost, and or more specific the cycle to drill one well, roughly 12 wells TIL for Comstock in Western Haynesville, and with 4 rigs, only 1 well per rig in 3 months?
The above youtube link above also indicates the number of rigs in Gulf of America at only 8!
With only 1 well per month per rig in the Gulf, this translates into only 100 wells. This 100 wells and along with legacy wells are able to make the 2MBOPD and still increasing!!!
The Haynesville hasn’t been under 10 bcf/d of production for the last 5 years. Who knows what “marketed” means to some folks. It currently is just getting back to 15 bcf/d from a recent low in 2023 of maybe 12.5 bcf/d. The West Haynesville isn’t the Haynesville Formation, it is the Bossier. Spent some time with the Texas BEG a couple months ago, they hated having to admit it, wanted to sell the Haynesville Fmt bad, and couldn’t. Issues with the Haynesville for awhile now have been decreasing efficiency per 1000′ of lateral length. It is also showing up in all the Permian formations at this point, but obviously those are mostly oil wells (initially). If you examine all wells in the Permian irrespective of formation, it requires about 48 months before a majority of once solid oil wells become gas wells.
RGR,
To anyone with a smattering of knowledge of oil and gas, marketed natural gas includes NGL, as distinct from dry natural gas which has been processed by NGL plants and has the NGL moved from the gas stream.
Marketed gas production at link below
https://www.eia.gov/dnav/ng/hist/n9050us2m.htm
Dry natural gas production at link below
https://www.eia.gov/dnav/ng/hist/n9070us2m.htm
Chart below has monthly US natural gas output for marketed and dry natural gas, marketed about 10% higher than dry in April 2026.
nat gas
Haynesville dry shale gas output in BCF/d in chart below
haynesville
US Shale Gas, logarithmic vertical scale at link below, 12 month average output is up about 5% for shale gas in past year.
shale gas
thanks DC for the plots and explanation of “marketed”, “dry” gases!
The Haynesville from the link that I posted above has several unique properties,
1. it is all dry gas, 98% methane, no NGL or other liquid
2. the link says wells completed is 62 while drilled is 54 per month, and with 564 DUCs, seems that they are turning the DUC as an inventory for meeting uptick demand and better prices.
https://blog.synmax.com/hyperion-client/haynesville-break-evens
this link shows that the Eastern legacy Haynesville has dramatically lowered break-even price and per foot cost, by drilling longer laterals. The per pad IP production is now well over 50MMCFPD, and with 2 laterals at close to 30kft lateral length, the average IP per lateral is higher than 25MMCF now.
3. the Haynesville wells have ultra-high IP for the first 3~6 months, at over 25 MMCFPD now, and with 4 months at 62 completed, or ~250 wells from March to June, there is a good change they might add about 5BCFPD in 5 months?
5. The Western Haynesville has limited production now, under 1BCFPD, due to slow drilling and high cost. It declines much slower than the original part in the Eastern part. The deeper Haynesville might have even more gases than the shallower Bossier.
https://www.searchanddiscovery.com/documents/2011/50379steinhoff/op_steinhoff.pdf
the paper above seems to show that the Western Haynesville has the Bossier to Haynesville all as non-shale lithology, while the Eastern original Haynesville has shale as the main lithology for Haynesville shale formation, and quite some non-shale in the Bossier there.
Sheng Wu,
A better source for the data is the EIA see link below
https://www.eia.gov/outlooks/steo/data.php?type=tables
download spreadsheet near top of page and look at natural gas table 5a.
For the Haynesville region the EIA estimate for June 2026 is 16.4 BCF/day, so the 18.2 BCF/day estimate for June 2026 is likely incorrect. The EIA forecasts and increase in Haynesville region marketed gas output to 18.2 BCF/d by December 2027. Chart linked below has STEO data and forecast after June 2026 for Haynesville region marketed natural gas.
haynesville marketed ng
DC,
you are right, that link I posted above now removed the 18.2BCFPD data,
https://www.oilpriceapi.com/basins/haynesville
and my guess is that they read the EIA estimate and mistook the 2027 data of 18.2BCFPD as current number.
I want to point out that the Haynesville might experiencing a third round of comeback, based on the detailed description of productivity, IP and even EUR gains.
https://blog.synmax.com/hyperion-client/haynesville-break-evens
drilling & completion costs down 16% per foot, while IP increased significantly, i.e. typical pad lateral length increased 15% from 2023 and 7% from 2024), and pad IP increased 22% from 2023 and 27% from 2024, translate into real IP per foot increase of 5% from 2023 and 8% from 2024.
This is quite different from Permian in the past 3 years, where the IP per foot actually dropped.
Note, a year ago the mainstream were quite pessimistic about Haynesville,
1. NOVI has several reports on Haynesville and none was optimistic
2. Art Berman again came with another death sentence for Haynesville, he even “mistakenly” inflated 2021 prior EUR and lowered 2022~2024 EURs.
It is amazing that the drilling and completion, IP and EUR could improve continuously, especially for shale gas.
Even in deep (11~13kft TVD) Haynesville, they could have lateral to 15Kft long now. Although the drilling is much slower than in SouthWest Marcellus.
In SW Marcellus, they could finish a 20K ft lateral in less than a week, or even a U lateral, and completion cost and speed way faster than any shale basin/formations. Yet, the liquids and gas are quite high.
That’s why the PA NE Marcellus dry shale gas has been flat or down for past 3 years, but in WV and SWPA the gas and liquid production have been increasing.
There is also another note about Gulf of America, the crude production has been getting heavier, and decline obviously slowed down.
https://www.eia.gov/dnav/pet/pet_crd_api_adc_mbblpd_m.htm
In this link above, choose the API grades for Federal Gulf of America
Hi DC,
Thanks for all of the great info.
Any insights on the status of the Saudi Abqaiq refinery?
Based on this sattelite assessment, things don’t look great:
https://t.me/GeoPWatch/37886
Overview of Abqaiq issue
https://oilprice.com/Energy/Crude-Oil/Abqaiq-Is-a-Warning-That-Oil-Markets-May-Be-Misreading.html
“Abqaiq is the real heart of the Kingdom’s hydrocarbon export machine. It is the center where crude from the giant Ghawar, Khurais, and Shaybah fields is stabilized before entering storage, pipelines, and export terminals. The facility holds a daily processing capacity of more than **7 million bpd**. Without any doubt, it is the single most strategically important piece of energy infrastructure anywhere in the world.”
THC,
I have not looked into that, sorry.
THC,
That is a great piece (second link you posted), thanks. It is interesting how little attention the attack on this processing facility (the largest in the World for the largest exporter of crude oil) has received.
Hi DC,
Thank you for taking a look!
“It is interesting how little attention the attack on this processing facility”
Absolutely odd.
This one facility produces 5% of global oil supplies and HALF of Saudi production is dependent on it for stabilization.
It gets hit in multiple locations, ostensibly by “resistance groups in Iraq”, clearly showing the US/Saudi security arrangements are not capable of protecting this facility even from local/2nd tier forces.
And both MSM and alt-media/social media barely mention it?
(I couldn’t find a single youtube video from the last week from a major mainstream or alt-geopolitics channel.)
My guess— they don’t want people to notice it, so they don’t mention it.
Kudos to Rory Johnston:
“It’s *really* bizarre that we don’t have official (or even firm) confirmation of the current operating status of Abqaiq.
Most important single oil facility on planet earth, was very obviously on fire earlier this week, and we know… very little atm.”
https://x.com/Rory_Johnston/status/2082917119587410019?s=20
Well, I assume if they don’t want us to think about it, we SHOULD be looking into it.
Quick finds:
1. The Hormuz bypass East–West Pipeline BEGINS AT ABQAIQ.
2. All Saudi super-giant field oil production is processed at Abqaiq:
Ghawar: The King
Abqaiq field: The Dowager Queen (Simmons’ Twilight in the Desert)
Shaybah
Khurais
Etc.
Saudi Oil Reroutes Hit Capacity and Security Limits
https://oilprice.com/Energy/Crude-Oil/Saudi-Oil-Reroutes-Hit-Capacity-and-Security-Limits.html
Thanks for the work DC, great job as usual.
Bab el Mandeb strait filtered. We will see what this does to Saudi production.
Thanks DC- those high and low price Permain projections at the end are very useful.
Hats off to THC who offered up an excellent info link at the end of the last post. Unfortunately the report was from late march. I hope they do an update. All sorts of excellent reports they post.
This was the one on the Gulf situation that THC posted-
https://www.atlaspeakresearch.com/report/c2d6d6
Much appreciated, Hickory!
DC, does the uptick to 22.002 Mb reflect the short lived increase in shipping after the MOU was started?
LeeG,
That would be my guess.
Article on World stocks and minimum operating levels at link below
https://www.intellinews.com/world-oil-inventories-falling-fast-towards-hard-operational-floor-442105/
Thank you DC!
Thanks Dennis,
Oil prices seem astronomically out of whack. Must be anticipation of reduced demand and higher U.S production ? I can’t really make sense of it.
Iron Mike,
Much of the disconnect is on whether a resolution is reached on the US/Iran conflict. The oil market seems to believe that the conflict will be resolved in short order. Such an assumption strikes me as delusional, but note that I am often incorrect on future oil prices, maybe the market has it right. Difficult to guess, but I am on the same page as you.
DC,
I also think the market is pathetically delusional. I actually think nothing will be resolved, the IRGC actually wants U.S forces to put boots on the ground and engage in another forever war that is how i see it, but we’ll see, like you i am almost always incorrect about oil prices.
I think Iraq just struck another aramco oil facility in Saudi Arabia too. I get most of my news from Iranian outlets and more often than not they seem to be correct.
Hi, do you know where to get a more up to date graph of inventories? The one in the article that you link goes up to the beginning of the Iran war, then it is just extrapolation. It seems weird that the extrapolation goes down so fast.
Thanks!
Superkaos,
It is difficult to find information on World Oil Stocks. What we can do is take the level when the war started (8.5 Gb) and subtract the MOL (6.9 Gb) to get 1.6 Gb of oil stocks that we can use. Now consider the Balance of Supply and Demand chart for 2026 which suggests a stock draw of 837 million barrels from the end of February to the end of June which would leave about 0.76 Gb of useable stocks. In June OPEC output was 6.5 Mb below the 4Q25 level and July was probably larger, so at minimum another 200 million barrels were drawn from World stocks in July which brings us to 560 million barrels.
This may be the reason that Trump and Iran have stopped shooting at each other, but lets say that does not continue and OPEC output falls to 10 Mb/d below the 4Q25 level for August and September. Unless demand falls, the MOL would be reached before the end of September in that scenario.
Interesting times indeed.
Thank you Dennis so much!!!
Jizan Aramco refinery burning:
https://www.techtimes.com/articles/321583/20260725/houthi-strike-burns-jizan-aramco-refinery-yanbu-attack-seals-saudi-arabias-oil-trap.htm
It was actually the tank farm east of the Jazan refinery which was hit
https://www.turkiyetoday.com/region/aramco-refinery-in-jazan-burns-after-houthi-missile-and-drone-strike-3224596?s=1
I’ve been trying to get info on the damage Abqaic. Seems to me these attacks are reminders more than attempts to destroy the facilities if they’re hitting just a few tanks.
The Australian Energy Minister lives in a dream world where he thinks the Middle East will turn normal again
25/7/26
Australian Energy Minister at ease despite Hormuz closure and detour of Saudi tankers to Asia via the Cape of Good Hope
https://crudeoilpeak.info/australian-energy-minister-at-ease-despite-hormuz-closure-and-detour-of-saudi-tankers-to-asia-via-the-cape-of-good-hope
I monitor the arrival of tankers in Sydney:
https://crudeoilpeak.info/tankers-arriving-and-departing-in-sydney
He is singing a gentle lullaby to keep the sheep calmly asleep on their pillow of retirement “wealth” bundled up in US tech stocks, until TSHTF and then suddenly they will roll out the “crisis” countermeasures, which were quietly announced in March 2026:
**2026 Energy Crisis Policy Response Tracker**
https://www.iea.org/data-and-statistics/data-tools/2026-energy-crisis-policy-response-tracker?tab=Energy+conservation
**MENU of Demand-side measures available to governments, businesses and households**
https://www.iea.org/news/new-iea-report-highlights-options-to-ease-oil-price-pressures-on-consumers-in-response-to-middle-east-supply-disruptions
Some of these overlap with globalist agendas proposed for covid and/or the “climate emergency”
1. Work from home where possible
3. Encourage public transport
4. Alternate private car access to roads
5. Increase car sharing
8. AVOID AIR TRAVEL
(Q. Will Gates, Zuckerberg, Satan Klaus, Elon, GCC royalty et al also not be flying?)
THC- all of those so-called ‘globalist’ agendas you listed are exactly what are appropriate for a world of 8.3 B people living with finite and poorly distributed oil. We have become accustomed to living as if there is no tomorrow, and no consequence to our actions.
Hickory,
You might be right, but I have a problem with a couple of points:
1. We don’t know exactly who “they” are, but we do know no one elected them or gave them the power to dictate to the other 8 billion people how to live.
2. “They” will be exempted from all of the rules/restrictions that they apply to the masses.
I’d bet my life Satan Klaus, Gates, Elon, the Royals, and all of the others above them whose names we won’t ever know will fly freely about in their private jets carrying their private gasoline powered limos, security details, chefs, concubines, etc.
Rules and restrictions for the “people” (=slaves), and freedom to do as they please for the 0.000001%.
Working from home – far better than going to the office.
Taking the train – faster, quieter, safer than driving. With luck you can read, sleep, relax…
Carpooling – a bit inconvenient, but easier and more social.
Zoom vs business travel – far, far better. Business travel is way, way overrated (you often never leave your hotel/conference center), you fly on your own time, bad in every way.
Electrifying transportation and cleaning up electrical generation are the simple, effective solutions, but they take a little longer to implement, and face obstructions from FF interests.
Nick,
Those things “might” work out, but do we want them forced on everyone?
How would the coercion work?
Will the coercion be applied evenly to everyone, or will it be along the totalitarian handbook of “all animals are equal, but some animals are more equal than others.”
Kill Gates claims it’s cool for him to cruise around in his private jets while the plebs’ movements are restricted.
https://www.euronews.com/2023/02/09/i-am-not-part-of-the-problem-bill-gates-says-his-private-jet-and-climate-activism-are-comp
“Kill Gates has shrugged off allegations that he’s a hypocrite for climate campaigning while travelling by private jet.
In an interview with the BBC’s Amol Rajan last week, Kill addressed the accusation by saying he offsets his family’s carbon footprint and contributes to solutions.”
“Should I stay at home and not come to Kenya and learn about farming and malaria?”
“ do we want them forced on everyone? How would the coercion work?”
I don’t see coercion, except by Mother Nature, whose FF is depleting, causing climate change, and very unequally distributed (which leads to oil wars).
The role of government is to facilitate these things. For instance, employers need to be told to allow working at home, and to facilitate carpooling to work, and allow teleconferencing instead of business air travel. And, government is the primary actor for mass transit.
Why are you so mad at Bill Gates? I admit I’m disappointed that he listens to Vaclav Smil (who is an unreformed FF advocate) and that he pushes nuclear, which is a red herring. But to suggest that people shouldn’t fly is to blame the individual when we need systemic change. Blaming individuals (and renewable advocates like Gore) is a FF industry tactic, which we should try to avoid.
Nick G
25 years ago scientists studying environmental destruction were sayings 3 things.
CO2 emissions must peak before 2010.
Land destruction, which includes soil erosion, desertification, soil salinity and deforestation must not only stop but be reversed.
Global over extraction of aquifers must be reversed.
https://www.theguardian.com/world/2026/jul/31/wildfires-extreme-weather-europe-spain-france-climate-crisis-analysis
Every day we are losing thousands of hectares of productive land. The land that is left has to produce more, using more pesticides, herbicides and and artificial nutrients.
https://www.unccd.int/resources/factsheets/desertification-and-drought-day-2025-factsheet
We are running out of fresh water aquifers and 40% of global crops rely on them.
https://unu.edu/inweh/news/world-enters-era-of-global-water-bankruptcy
So don’t worry about oil or gas there is plenty of those things.
The environmental scientists back twenty years ago, calculated that the world would have to spend $1 trillion per year to reverse desertification, soil erosion,people and crops.
That figure is now about $2 trillion.
Nobody is willing to bridge the $1.5 trillion gap.
Lack of water and dead land is what is going to destroy the global economy.
According to my sources:
Oil facilities successfully targeted in Saudi Arabia the past 48 hours:
– Saudi Aramco, Jazan Refinery (16.8841879, 42.5803417)
– Saudi Aramco, fuel storage tanks in Jazan city (16.8742617, 42.5605715)
– Saudi Aramco, Abqaiq Refinery (25.9282786, 49.6842320)
Take the accuracy with a grain of salt.
Meanwhile Trump is claiming Tehran wants to negotiate, anyone else getting sick of the groundhog day antics of this mentally ill individual ?
We are really living through the age of idiocracy.
Ukranian attack(s) on Iranian ship(s) has now led to speculation the two conflicts may merge into some larger world war level situation.
https://x.com/TOzgokmen/status/2081407090258538684?s=20
Also, talk of Iran drawing up list of EU-linked energy targets over Zelensky provocations.
https://x.com/DD_Geopolitics/status/2081727947791020165?s=20
And here we are with WTI near $80. Totally makes sense (not).
Cheers!
THC,
FWIW, I think that Iran is making a (possibly large) mistake.
Ukraine feels that Iran is a supplier of Russia’s war effort, because…it is. Iran supplied Shahed drones as well as apparently licensing the design to Russia.
So, Ukraine apparently attacked Iranian ships in the Caspian that they say were delivering war-related supplies to Russia.
Iran, OTOH, claims to have no involvement in the Ukraine war. IMO, this is unrealistic on their part. If they attack Europe because of Ukraine’s actions, that would create more enemies for them, with no benefit.
Hi Nick!
The fog of war is thick!
Looks like Iran is assumign Ukraine/Iran is a proxy force for the EU/US (reasonable assumption) and that if Ukraine attacks Iranian interests, then imposing costs on the EU is a deterrent.
For clarification, here is the list of the alleged IRGC targets of energy infrastructure that supplies Europe. It appears that the idea would be to punish the EU by reducing energy supplies, rather than attacking the UE directly (except for the Greek targets).
https://x.com/DD_Geopolitics/status/2081727947791020165
Pipelines linked to Europe:
— Baku–Tbilisi–Ceyhan
— Baku–Supsa
— Saudi East–West Pipeline
— Southern Gas Corridor
— Trans-Caspian Pipeline
— East Med Pipeline
— Arab Gas Pipeline
— El Arish–Ashkelon Pipeline
Oil and gas fields linked to Europe:
— Azeri–Chirag–Guneshli (ACG), Azerbaijan
— Shah Deniz field, Azerbaijan
— Absheron field, Azerbaijan
— Leviathan field, Israel
— Zohr field, Egypt
— Cronos field (Block 6), Cyprus
— GGIP project, Iraq
LNG facilities linked to Europe:
— Idku LNG plant, Egypt
— SEGAS LNG plant, Damietta, Egypt
— Revithoussa terminal, Greece
— Alexandroupolis terminal, Greece
Other:
— Green hydrogen projects in Oman backed by European investment
“‘a proxy force”
Hmm. An interesting idea. I suspect that it can be badly misleading to think in those terms. For example, Israel is considered an imperial colony by many in the M.E., and on the left in the US and Europe, and yet I’m pretty sure that Israelis don’t think of themselves that way, and that analysis based on that idea will be misleading. Similarly, Ukraine very much thinks of itself as an independent entity, not a pawn for anyone.
Trying to coerce Ukraine by attacking those who are helping it defend itself from Russia seems…counterproductive. I wonder if anyone in Iran has tried to work with Ukraine to prevent conflict on a win-win basis, rather than trying to coerce it by “imposing costs”.
Great hubris can lead one to overestimate one’s power. In the longterm, I wonder how many people in the M.E. realize that oil can and will be replaced by importing countries, and that this conflict is greatly accelerating this transition?
Iron M “anyone else getting sick of the groundhog day antics of this mentally ill individual”
Its been like this since he started running for Pres about 12 years ago. No surprise even back then.
The scariest thing about it is what it says about the 32% of US eligible voters who picked trump in 2024.
These people are not exhibiting any different behavior from the Germans who selected Hitler in the 1930′. But have no illusion folks- tyranny, ignorance, cruelty, kleptocracy can come the right, the left or the ‘middle’. And from the pulpit.
I doubt Americans have learned much.
(of eligible voters in 2024 36% did not vote, 31% voted for Harris)
To those who don’t live in the USA I’ll point out that a huge swath of Americans are profoundly embarrassed by the behavior of this country, over and over and over again.
THC, some degree of sideways escalation doesn’t imply an immediate move to world war level of conflict. There are degrees just as a lack of growth is not dying or a decline of oil production is not a square wave dropoff.
Hickory,
“The scariest thing about it is what it says about the 32% of US eligible voters who picked trump in 2024.”
Really, it says these people grew up in and are living in a community with unrealistic ideas, and listening to right wing media with pervasive misinformation. They are unlucky…
On the oil market’s delusions, I recently watched this vid on the equities market’s delusions.
http://www.youtube.com/watch?v=n0iHxB4ecOU&t=1329s
TLDW: An increasing share of the markets are passively managed index funds, basically every payday there is an influx of dollars that is price insensitive, they just come in at whatever the price.
I can’t help but think the paper market for oil is the same. It is supply and demand, yeah, but the supply that matters is how much liquidity is sloshing around, not how much oil.
Obviously I know nothing about it or I wouldn’t be on here blathering.
Just looked at the SPR report. Draws the last 2 weeks have been around 3-4 million barrels as opposed to prior weeks at 6-10MM.
Any opinions on whether this is simply the mechanics of the caverns and pumps losing ground, or is is a lack of demand or?
http://www.eia.gov/dnav/pet/hist/LeafHandler.ashx?n=PET&s=WCSSTUS1&f=W
Hi Pops,
My guess is the oil execs/traders are not interested in borrowing oil at $70~$80 and taking on the risk of having to return the oil plus an extra 10~20% in volume as interest when oil could be well over $100 in a few months or so (oil execs are probably well positioned to see that this is a high-risk low -return trade).
Refining margins are insanely high, and refiners are apparently operating at near fully capacity in the US (95% or so?) — probably making GREAT money.
I guess for now they are finding enough crude without going to the SPR — US shale + Canadian oil sands + some Latin American imports (apparentely….)
THC,
there are reports that the money, over $10Billion now, from selling Venezuela oil is not accounted for.
all the trading houses, and big oil (Chevron) could collude to cover up the cost& profits as they control how much diluents, pricing from diluents, logistics (just inflate blaming the heavy), selling, refining (as I said it has extra high margin as rare earth oil)….
The Chinese oil companies and refineries used to grab these from Venezuela, and now US at 3~5X scale.
“The Trump administration has raked in about $13 billion after taking over Venezuela’s oil exports in the wake of its kidnapping of President Nicolás Maduro, according to a Financial Times analysis. But six months later, and one month after two devastating earthquakes, that money is nowhere to be found.”
Hi SW,
Hope all is well.
“over $10Billion now, from selling Venezuela oil is not accounted for.”
I wouldn’t be surprised to hear of massive grift, but it would be helpful if you could share links/sources — I’d like to take a look.
Cheers!
Here is a video of difficulties Saudis are facing.
https://www.youtube.com/watch?v=fj7oSrmZNvk
Thank you, Seppo!
“600,000 barrels of crude oil every single day just to power air conditioning and desalination plants for human survival”
WOW — that’s a lot just to keep the air-con on and the water flowing.
Yes, it is. Pretty insane to burn oil when solar could do it much cheaper.
KSA – the Saudi Arabia of…sunlight…
Haha, indeedy.
If there’s one place where solar “should” work it’s Saudi…………..
“Vulnerability of Persian Gulf Desalination Systems: An Emerging Security Issue”
This is internal research from a “well-known 3-letter agency.” I am a somewhat paranoid type, so I will not post a link, but if you do a search for the title shown above, you can find the sanitized version.
Unfortunately the best version appears to be at the 3-letter agency’s reading room web site (web archive versions are mostly blank pages), so just be aware of that.
If things are going to continue spiraling downwards and there is no intention of normalizing energy flows out of the ME, desalination systems are a real risk, IMHO.
Share of Drinking (Potable) Water Met by Desalination-
When looking strictly at municipal drinking water, reliance across the region:
Qatar: More than 99%
Kuwait: 90%
Bahrain: Over 90%
Oman: 86%
Saudi Arabia: 70%
UAE: 42% to 90% (depending on the specific emirate and local reporting metrics)
https://www.csis.org/analysis/could-iran-disrupt-gulf-countries-desalinated-water-supplies
They were not consulted prior to this ‘escapade’.
Hi Hickory,
Did you get a chance to look at the 3-letter agency paper on this?
It was internally published in Oct. 1983, and the sanitized version was made public in March 2010. Given the high degree of communication between military and intelligence organizations in the US and GCC nations, there is no way the GCC were unaware of this.
It’s almost like this existential structural weakness was left in place so the GCC countries could be threatened/controlled/destroyed as necessary.
“It’s almost like this existential structural weakness was left in place so the GCC countries could be threatened/controlled/destroyed as necessary.”
No. They rely so heavily on desalin water because that is their only option. Their population has artificially outgrown the carrying capacity of the region by roughly 90%. The enabling artificial mechanism is the same one we see all over the world- massive energy input, primarily fossil fuel.
Same deal applies to food in every single country in the world, whether it is produced domestically or imported.
The odd thing here is that we’re discussing municipal drinking water,
Municipal drinking water can be recycled – it’s easier, cheaper and much less energy intensive than desalination. I wonder why it’s not used there?
Hi Hickory!
“Their population has artificially outgrown the carrying capacity of the region by roughly 90%. ”
Yep, that’s for sure.
Based on the desalination numbers, the GCC + Israel is probably near or at the top of the list of radically unsustainable societies of major influence/importance.
That might be an interesting topic (extent to which major nations are unsustainable & the potential timing of collpase) to research at some point.
That being said, the Saudis have known this for over half a century. They could have addressed the robustness/defensibility of their desalination infrastructure.
Some piggies, who are “more equal” than other piggies, want to tell the ordinary piggies how much corn they can consume.
**Fatih Birol, Executive Director of the International Energy Agency**
*Chairman of the World Economic Forum (Davos) Energy Advisory Board
“The world needs a grand coalition to tackle climate change”
Fatih Birol for WEF:
https://www.weforum.org/stories/energy-transition/the-world-needs-a-grand-coalition-to-tackle-climate-change/
*BILDERBERG MEETING 2025
https://www.youtube.com/watch?v=WGNKukkmGJ8
**Davos / WEF leaders**
Take a look at the fanciest private jets and government aircraft that took the rich and powerful to Davos
https://www.businessinsider.com/fanciest-private-jets-and-government-aircraft-photos-davos-2026-1
“On Monday alone, there were around 160 private jet arrivals from over 40 countries spread across five continents.
(Zurich airport) expected more than 1,000 extra takeoffs and landings due to the WEF.”
“On Monday, 31 of the 157 private jet arrivals were Gulfstream G650s.
Throughout the week in Switzerland, data from JetSpy showed such planes belonging to: Elon Musk, Bill Gates, Blackstone, BlackRock, and JPMorgan Chase.”
“The most awe-striking private jets were decked-out versions of the Boeing 737 airliner.
Flight-tracking data showed a private 737 that flew from Dubai to Zurich on Sunday. Another one from Dubai went to Friedrichshafen, a lakeside German city just over the Swiss border, on Tuesday.
Some governments also use the 737 to transport political leaders. In Switzerland this week, flight-tracking data showed such planes belonging to the United Arab Emirates and the Netherlands.”
“The French governmental jet was nearly as stylish as its president’s sunglasses.
Emmanuel Macron appeared to arrive in Davos on Tuesday. That morning, two French government jets — a Dassault Falcon 7X and a smaller Falcon 900 — flew to Zurich from an air base near Paris.”
~~~~~~~~~~
Sorry fellas, I’m not drinking any of this cool-aid.
I don’t mind if people tell me that being overweight is bad for me. Even if the doctor telling me so is badly overweight – that’s his problem.
I don’t mind if the doctor puffs on a cigar while he tells me not to smoke – it’s his life (or death).
I’ll listen to a heroin user who tells me to not use drugs. He may be addicted, but he’s still right.
——————-
The fact is that the alternatives to FF are better. And flying may be statusful, but it’s not especially fun.
Don’t allow the FF industry to distract you with silly claims of hypocrisy, or arguments about inequality. It’s just irrelevant.
It’s getting hotter, is there any question? I thought we were past this. If anything, the geopolitical impacts happening now should make clear that even without climate change and peak resources a shift in energy production is beneficial. Add in those two factors, and it becomes mandatory for a viable future for humanity. Wouldn’t you rather Star Trek than Road Warrior? We gotta at least try. I can’t understand the reluctance to acknowledge that burning literally billions of tons of material might possibly have an impact on our finite atmosphere.
Sorry, did I say billions? It’s almost two trillion tons burned, an unimaginable volume. But puny humans can’t affect the weather! OK.
Per EIA SPR draw plus commercial draw was 11 million last week.
It’s a very slow sleepwalk.
The Russian invasion of Ukraine and the US disruption of the Gulf oil trade. Was either a reason to drain the SPR?
I was under the illusion that the reserve was only for emergency/existential threat use.
At some point our accumulated policy errors (for example optional wars, spending more than we can afford, bullying behavior) are going to turn around and kick this country square in the face.
Looks like the above ground factors impacting oil in the Iran war continue to experience strategic drift. Several media outlets are reporting joint US and KSA strikes on Iranian backed militias in Iraq. Perhaps the Saudis would prefer to avoid a repeat of the impactful 2019 strike on Abqaiq. Another completely unpredictable step in this conflict, who could have known?
Nnoxks
Yes it is getting hotter, No, there is no doubt. No, we’re not past this. Anti-science propaganda and FF vested interests remain quite effective. Upton Sinclair’s famous quote remains a touchstone here. Also, sign me up for a red shirt!
Nick,
Agree that if there is any good to come out of this conflict it may well be an accelerated transition away from fossil fuels. We’re 5 months and counting for the Iran war, and I do see some limited information about increased Chinese PV panel and EV exports. Have you come across any particularly good sources on accelerated transition accomplishments? I would expect that there will be a longer time lag before we see any clear inflection point.
Ember is particularly good.
T Hill,
Yes it will take a few more quarters to see the trend shifts.
Here is an early indication on vehicle sales-
“EV sales rebounded sharply in the second quarter, rising by 35% compared with the first quarter “as the energy crisis sparked by the war in the Middle East brought fuel price volatility back into sharp focus,” the IEA said.”
“EV sales in the second quarter reached record-high levels in 50 countries as drivers preferred electric vehicles amid soaring fuel prices. In sizable car markets such as Brazil, India, Australia, and Vietnam, electric car sales roughly doubled between March and June compared with the same period in 2025, according to the IEA’s analysis in the report.”
https://oilprice.com/Latest-Energy-News/World-News/Oil-Price-Shock-Fuels-35-Surge-in-Global-EV-Sales.html
It looks clearer and clearer like most of the world has a major grid capacity shortfall.
This may be an early indication of the response in the US. Used EV prices increasing in 2026 rather than depreciating. Quite the reversal.
https://www.cnbc.com/2026/07/31/used-ev-prices.html?msockid=03e6553d482068ce1a8e475049af6964
Hey T!
Yes, it might be smart to get an EV. Could be problems getting liquid fuel at some time in the near future.
BUT, ironically, the world’s main EV manufacturer (China) is effectively banned from selling EVs in the US.
*100% Section 301 tariff on Chinese-made EVs
(https://evseekers.com/can-you-buy-a-chinese-ev-in-the-usa/)
*Commerce Department rules prohibit Chinese software and hardware in connected vehicles
(https://www.reuters.com/business/autos-transportation/biden-administration-finalizes-us-crackdown-chinese-vehicles-2025-01-14/)
Cushing at 18.599 mmbbl as of 07/24
https://www.eia.gov/dnav/pet/hist/LeafHandler.ashx?n=PET&s=W_EPC0_SAX_YCUOK_MBBL&f=W
SPR: 307,650,000 barrels
Both Cushing and SPR are at the lowest levels since the start of the Hormuz crisis.
I’ve noticed a lot less people on social media doing barrel counting and Hormuz tanker crossing counting……
Are people just bored/tired of it?
When TSHTF eventually, people will wake up to a nasty surprise.
Cushing likely won’t fall below 18 or so as that price will bid up to keep above operational levels.
The SPR is going to 243 absent some major change. The US committed to that quite a while ago.
Commercial on a weekly basis is kind of like the weekly EIA production estimate. It’s an estimate and a bit of a crap shoot.
My refining friends still do not seem worried. But they might not tell me if they were.
Hi Shallow Sand!
This is interesting:
“My refining friends still do not seem worried. But they might not tell me if they were”
Please keep us updated if you get any new info or observe any changes in their behavior/words!!!
Am I remembering correctly that the 243 number for the SPR is the military’s reserve number and not the bottom? If so there is an undeclared war going on and I assume the military will be wanting their reserves. Seems like we would see both continuing draws and increasing refined prices at that point.
Nobody is too concerned tho, I think we are exporting 1.8MMB / week of diesel right now – up about half a million barrels per week since last month.
America First! (well, profit first anyway)
In the past 5 months the SPR has been reduced by 105 million barrels, the US committed to a 172 MMb release from SPR from a starting number of about 415 MMb (415-172=243 MMb), so another 67 MMb to be released. The average monthly release has been about 27 MMb per month (most of the release since the start of April) so if that average rate continues we reach 243 MMb in 2.5 months. If the SPR falls below that level the storage facilities may become unstable.
Found this
https://www.cnbc.com/2026/07/28/us-strategic-petroleum-reserve-spr-iran-oil-strait-hormuz.html
The piece suggests a minimum level between 70 and 103 MMb for the SPR. Though I have read elsewhere that the release of oil from the SPR becomes much less efficient when the level falls below 250 MMb. So perhaps 140 MMb more can be released after reaching 243 MMb remaining in SPR, but the rate this oil can be removed may be far slower (maybe 14 MMb per month vs recent rate of 27 MMb per month as a WAG).
Another interesting piece on SPR
https://therailroadman.substack.com/p/draining-the-us-strategic-petroleum
THC
“My refining friends still do not seem worried. But they might not tell me if they were”
Nothing major as of yet in my part of the world as well. This could change quickly, but more likely it takes weeks/months even if the disruptions are severe.
A price signal would in the end be necessary to balance demand/supply. Basic economic 101 lecture. We had one of the best summers if working in the lesuire industry when it comes to air flight miles in Europe. And that is amid a supposed oil crises. Figure it out!
They’re going to string things along until the world’s buffers are depleted, an energy crisis ensues, and we cry uncle. We’re still in the “depleting buffers” part, so it can feel like markets are being irrational. On a short-term basis things are appropriately priced, but we’re over here focusing on the obvious next phase where “I told you so” will also sting because it impacts everyone, everywhere.
More on desalination
Dependence on desalination for drinking water:
Qatar 99% (near-total dependence)
Bahrain 90-95%
Kuwait ~90%
UAE 40-42%
Saudi Arabia 70%
In Saudi, desalination is only 18% of the total water supply (consumer use + agriculture) — why do they need desalination for drinking water?
1. The Groundwater Is Running Out — Fast
Saudi Arabia’s groundwater is almost entirely fossil water — ancient aquifers filled thousands of years ago.
“Drained Dry
When intensive modern farming started, there was a staggering 120 cubic miles (500 cubic kilometers) of water beneath the Saudi desert, enough to fill Lake Erie in the U.S……(according to) the School of Oriental and African Studies in London, the Saudis were on track to use up at least 96 cubic miles (400 cubic kilometers) of their aquifers by 2008. Experts estimate that four-fifths of the Saudis’ “fossil” water is now gone.”
https://www.nationalgeographic.com/environment/article/saudi-arabia-water-use).
2. Much of the Groundwater Isn’t Drinkable Without Treatment
3. The Water Isn’t Where the People Are
4. Energy Was Cheap, Groundwater Pumping Is Getting Expensive
**Israel’s HIGH dependence on desalination for drinking water**
Desalination as a % of:
Drinking/potable water: 50-85% (wide range of estimates)
Total water supply: 24%
**Iran’s NON-dependence on desalination**
Desalination as a % of:
Drinking/potable water: Less than 1%
Total water supply: ~3%
~~~~~~
Related article:
Freshwater, Bitter Prescription:
How Israel’s Desalination Miracle Became a Strategic Trap
https://www.turkishnews.com/en/content/2026/05/02/freshwater-bitter-prescription-how-israels-desalination-miracle-became-a-strategic-trap/
“Almost all of Israel’s desalination capacity is situated along a narrow coastal corridor of roughly one hundred and fifty kilometers, stretching from the Lebanese border to Gaza. This geographic constriction paints an extremely risky picture in the face of modern warfare’s requirements.”
“The Sea of Galilee and the mountain aquifers, which were once fallbacks in water crises, have been severely degraded by years of over-extraction, population growth, and agricultural policies dependent on desalinated water. Because the system is built on the assumption that the desalination plants will run continuously at full capacity, natural sources have ceased to be a “backup” and have become, in effect, a complementary part of daily consumption. ”
“When all these factors come together, the fate of Israel’s water security becomes tied to a handful of industrial facilities and the success of the air defense systems tasked with protecting them. ”
“The Water-Energy Nexus: Two Breaking Points of a Single Chain………..the electricity grid and the energy sources feeding it must operate uninterruptedly for the water taps to flow. A severe rupture in energy supply is capable of stopping the water supply overnight.”
In the US, 80% of water is used by agriculture, and most of it is wasted. In the US and around the world, farmers’ water is heavily subsidized. The M.E.. is no exception:
Farmers in the Middle East are not charged the full cost of water. Across the Middle East and North Africa (MENA) region, agricultural water is heavily subsidized, meaning farmers pay only a small fraction of what it costs to deliver, pump, or desalinate the water.
Structure of Water Subsidies:
Deeply discounted pricing: Governments routinely charge nominal or flat fees for surface irrigation or canal water that cover a negligible percentage of actual operation and maintenance costs.
Energy and fuel subsidies: Many nations indirectly subsidize agricultural water by offering low-cost electricity or diesel for groundwater pumps, enabling farmers to extract fossil aquifers at minimal personal expense.
Cost avoidance on advanced tech: High-cost alternatives like desalinated water or treated wastewater are heavily subsidized by public funds when supplied to farms, keeping prices far below production costs.
Economic and Environmental Impacts
Depleted aquifers: Cheap water removes economic incentives to conserve, leading to severe over-extraction and the rapid mining of non-renewable underground water basins.
Distorted crop choices: Low water prices encourage the large-scale production of thirsty crops (such as fodder and cereals) that cost far more in water value than the market value of the food produced.
Fiscal strain: Governments face mounting budget pressures to maintain aging infrastructure while recovering almost none of the capital investments required for water delivery.
WIKILEAKS DIPLOMATIC CABLE
CRITICAL INFRASTRUCTURE PROTECTION IN SAUDI
“Jubail Desalinization Plant provides Riyadh with over 90% of its drinking water. Riyadh would have to evacuate within a week if the plant, its pipelines, or associated power infrastructure were seriously damaged or destroyed. The current structure of the Saudi government could not exist without the Jubail Desalinization Plant.”
Date:2008 August 11, 16:10 (Monday)
https://wikileaks.org/plusd/cables/08RIYADH1230_a.html
Author: GFOELLER (Michael Gfoeller from the US Embassy in Riyadh)
Iran may not desalinate much water, but their water situation is pretty desperate – they’ve seriously considered evacuating Tehran…
Hi Nick,
Whoa, yeah, you are right:
~~~
Tehran may be evacuated as taps run dry due to water crisis
Iranian officials have floated the idea of moving the capital after years of severe water shortages
https://www.independent.co.uk/news/world/middle-east/iran-tehran-drought-water-shortage-rainfall-evacuated-b2878755.html
~~~
That being said, in Iran’s case it’s more of chronic problem than something that could be triggered overnight by an attack on a single desalination plant.
THC,
If you’re on the edge of a severe shortage, it only requires a decent push to put it over the edge.
If a region is dependent on dams or reservoirs, it’s very vulnerable – those things can be destroyed with a single big bomb.
Someone should mention that destroying any of these infrastructure items is a war crime. Just sayin…
Hi Nick!
War crimes ->
Just for a dark moment, imagine all of the war crimes that have been committed since the end of WWII. It’s A LOT.
It never stopped, and it is not realistic to assume it will stop (although we can always hope/wish/pray).
FWIW desalination attacks have already started on small scale:
March 7, 2026: Iran’s Foreign Minister Abbas Araghchi accused the US of attacking a desalination plant on Qeshm Island, affecting water supply for 30 villages.
March 8, 2026: Bahrain’s interior ministry said an Iranian drone “caused material damage” to a desalination plant there.
July 17, 2026: Iranian attack on Kuwaiti desalination plant
July 18, 2026: US attack on Jask desalination plant
THC,
Lots of murders, rapes, robberies, etc have happened since WWII. We still condemn them, and prosecute them when we can.
And, when a president says out loud that he wants to bomb dams, etc, everyone should say out loud “that’s a war crime, and that’s a despicable threat”.
Everyone.
To DC
Dennis I rarely post on your blog nowadays as I dislike the intensely biased and political statements made by some who disproportionately dominate the narrative.
I would like to clarify the distinction between produced gas, marketed gas (wet gas) and dry gas.
Produced gas is the total gas produced ( that is recorded)
Marketed gas is the Total Produced gas minus the gas that is re-injected for pressure maintenance in and oil well.( i.e Wet gas)
Dry gas or Sales gas is the gas produced for sale as natural gas which typically contains 4-14% by volume ethane.
The Sales gas spec is essentially a calorific value of 1050 BTU/cu.ft. +/- 5%. The calorific value spec does vary a little in some countries.
The are 3 main definitions of produced gas.
1. Dry Gas 1-2 GPM
2. Wet Gas 2-4GPM
3 . Associated Gas 5-12 GPM from the GOSP (gas oil separation plant which stabilizes the crude stream)
GPM means gallons (NGL’s) per 1000 scuf – gallons are UG gallon or x 3.78 Lt
The are two types of gas plant.
Treating gas plants that remove acid gases (carbon dioxide and hydrogen sulphide. The treating gas plant will produce a treated gas that might meet the dry gas spec ( dry gas wells). Generally there will also be some produced condensate known as lease condensate. C5+ also referred to as natural gasoline and casing head gasoline.
The treated gas stream is (typically wet gas and associated gas) to then sent to an extraction plant which produces an NGL mix stream called Y grade condensate which contain C2, C3, C4 and C5+ hydrocarbons. The extraction plants are bigger than the treating plants and take in feed from multiple gas treating plants. The Y grade condensate is shipped via pipeline to gas fractionation plants, most which
are along the Gulf Coast. The Y grade mix is fractionated into C2, C3, C4 and C5+ streams. Ethane is primarily used as petrochemical steam cracker feed to produce ethylene. Some ethane is exported.
The Gas extraction plants use two main technologies to remove the NGL’s from the sales gas stream.
a. propane refrigeration extraction that will reduce the ethane in the sales gas to about 14 %
b. cryogenic extraction that can remove the ethane down to about 2% in the sale gas.
Generally the extraction plants are producing sales gas with the maximum allowed ethane (lowest cost). Reducing the ethane to <14% incurs extra cost.
In some publications there is reference to rejected ethane. This is a misnomer. The rejected ethane term is simply ethane that is not recovered from the sales gas stream because there is either no market or the cost of deeper extraction is not covered in the sales price of ethane. AS the cost of ethane rises there may be an incentive to produce more ethane. The attached graphic explains the process.
Nitrogen is often found in the sales gas. It is not removed in any of the treating or extraction steps and will affect the calorific value of the sales gas.
Thanks for the info.
Are the cryogenic plants primarily used to produce input gas for LNG trains?
Thanks in advance.
My file was 57 kb so it did not load.
The spec for LNG is attached. It is not necessary to remove all of the ethane (and propane, butane) from the LNG feed. The presence of ethane + boosts the calorific value which some end users prefer(gas power). The Wobbe index is the main control.
https://www.ariyancorp.com/wp-content/uploads/2024/05/Standarad-Specification-Of-Liquified-Natural-Gas-LNG.pdf
Presentation2 54
Carnot,
Thanks. The specification you linked suggests not more than 9.2% ethane for the LNG which seems to imply a cryogenic process might be needed based on your 14% ethane content for non-cryogenic process?
Thanks for reposting the graphic, very nice.
files have to be reduced in size to less than 55 kB to post, sometimes using a GIF format results n a smaller file or reducing the dimensions of the chart also sometimes can reduce the file size of the chart.
Was just looking at International data from EIA and noticed that the drop in World C+C output in March was 10320 kb/d, about 11.9 % of the previous month’s output level (February 2026 at 86715 kb/d). During the height of the pandemic output dropped by 11109 kb/d in May 2020 which was 13.5% of April 2020 output (82380 kb/d). It will be interesting to see the April and May estimates in the future.
DC
Read the spec units. C1, C2,C3, C4 are in mole % not volume %. Methane is MW 16 and ethane MW 30g -one mole of methane will weigh 16 g and one mole of ethane 30g. However 1 SCUF of gas at STP is about 1.1980 moles for an ideal gas. A close approximation would be that mole% = volume % and that ethane might need to be reduced in the feed.
An LNG plant will be able to recover C2, C3 and C4. It is a cryogenic process. The link below is a description of a typical process.
https://instrunexus.com/lng-plant-process-explained-a-step-by-step-guide/
Carnot,
Thanks.
I read an article on US shale which stated 2024 annual decline on existing oil wells was 4 million barrels per day, and was 0.7 million barrels per day in 2010.
Does this seem accurate?
Hi Shallow Sand!
I found some hints re 2024:
https://www.eia.gov/todayinenergy/detail.php?id=66564
“n December 2023, L48 crude oil production averaged 11.0 million barrels per day (b/d). Production from wells that came online in 2023 or earlier fell to 6.7 million b/d in December 2024, a decline of 4.3 million b/d. Those declines were offset by the more than 15,000 new wells that were brought online in 2024—about 11,700 of which were horizontal wells.”
Hi Shallow sand,
My Permian model has an annual decline of 41% from Dec 2024 to Dec 2025 for wells completed by December 2024. If we assume the decline rate is the same for all US shale output (9.27 Mb/d in Dec 2024) then the annual decline for 2025 for wells completed by the end of 2024 would be about 3.8 Mb/d. If we further assume the annual rate of decline in 2010 was also 41%, then decline in 2010 for wells completed by the end of 2009 would be 0.2 Mb/d (tight oil output was only 0.52 Mb/d at the end of 2009). It is unclear how much decline would be from existing non-shale wells. If we assume in 2024 output from non-shale was about 4.17 Mb/d and decline was 6% per year that would add 0.25 Mb/d which brings us to about 4 Mb/d for decline from existing wells at the end of 2024. In 2010 we would have about 0.3 Mb/d from non-shale wells so about 0.5 Mb/d from all US wells completed by the end of 2009 in 2010. So the 2010 estimate may be a bit too high, if my assumptions are correct.
in 2010, shale oil is still just starting, with only Bakken (if it is counted as shale) barely reaching 200KBOPD.
EF and Permian were virtually all zero.
So, the decline of 0.7 million BOPD is based on conventional oil of ~5.3MBOPD, or 13% annual decline rate.
Now, the total production is 13MBOPD, and 4MBOPD annual decline translate into about 30% annual decline rate for existing wells.
My guess,
In GOA, the decline rate for existing wells (2MBOPD) is probably less than 10%., or under 200KBOPD decline. With 100 wells TIL per year, and each producing at ~3KBOPD, will be able to offset decline and even add a little.
In other conventional, like California and Alaska, probably ranging from 6~13% for existing producing wells.
So, total legacy conventional oil production, including Alaska and GOA, probably at over 3MBOPD, with annual decline around 9%.
The shale oil at close to 10MBOPD for current production, with annual decline rate close to 50%. The new wells coming up each year will have to offset this 50%, and also they have annual decline rate ~60%.
https://www.youtube.com/watch?v=qOQq3c71lps
5 minutes
Iran to close off Saudi oil exports by passing SOH
Hi Andre,
I find it amazing that after all that has happened to the global oil market in the past 155 days of the Iran/Hormuz war, the media, politicians, and financial markets are all still playing the tune of:
~~THIS IS FINE~~
Obviously, it is not fine.
Tick tock.
How much time left on the clock?
I fear that the Ukraine has provided the blueprint of “David vs Goliath”.
Asymmetric Warfare.
We have COLD WAR militaries and commercial vessels trying to stop a guy with a pick up truck with 2 $5000 drones in the the bed.
And underwater drones are picking up steam.
What do you do to stop those?
Send an Electromagnetic pulse in the water.
Andre
Concur. It seems clear that (at least in the short term) above ground risks to our energy infrastructure supply and demand are at least as great if not greater than the traditional focus on peak oil geology, etc.
The issues of low cost, large scale and autonomy make drones a huge concern. How many drones with what mix of ranges and payloads fit into a TEU? What ports around the world are likely to fail in intercepting such a container? How many key energy sites are in proximity to these ports? How many of those sites are prepared for such attacks? What state or non-state actors have the capacity and will for such attacks? The risks seem obvious if you start asking the questions.
Operation Spiderweb seems to be the most obvious example of the potential of this type of scenario.
None of these questions and concerns are new, just more obvious today. I can already hear the responses of ‘who could have known’. Completely unpredictable, right?
I dearly hope that my observations are naive and that the military and national security systems have this entirely under control. I fear that is not the case.
There are many ways that a complex civilization that has overshot to 8.3B people could slide into reverse mode. Pick your mechanism. Lots of choices.
T Hill,
That’s another advantage for solar. Both China and Ukraine are very aware of that, and it has affected their plans.
US C+C output dropped to 13714 kb/d in May 2026 from 13967 kb/d in April, a drop of 253 kb/d, the US GOM output dropped by 212 kb/d accounting for 84% of the US drop in C+C output.
Directional plus Horizontal oil rigs operating increased by 1 to 445 rigs for week ending July 31, 2026. This count is up by 46 rigs from one year ago and up by 45 rigs since the start of the War with Iran.
Directional plus horizontal oil rigs in the Permian Basin increased by 1 to 256 rigs for week ending July 31, 2026, this is up by 7 rigs from 1 year ago and up by 20 rigs since the start of the War with Iran.
Rig Report for the Week Ending July 31
The dropping rig count that started in early April 2025 when 450 rigs were operating had a small drop this week. The rig count broke out from the previous steady rate of 367 ± 5 rigs per week since August 2025 and may be creating a new steady state rate between 410 rigs/wk and 415 rigs/wk
– Today WTI closed at $84.67/b, down from $89.31 last Friday.
– US Hz rigs + DRigs rose by 1 this week to 445.
– US Hz oil rigs dropped by 1 to 413, down 37 since April 2025 when it was 450. It was also up 51 rigs from the low of 362 first reached in the week ending August 1, 2025. The rig count is down 9% since April 2025.
– New Mexico Permian Hz rigs were unchanged at 86. Lea and Eddy were unchanged at 33 and 53 respectively.
– Texas rose by 1 to 214. Midland and Martin were unchanged at 19 and 26, respectively. There was one big change, Karnes added 3 rigs 6.
– Eagle Ford added 4 to 40. Big change. What is happening in the EF basin?
– NG Hz rigs were unchanged at 107.
A Rig
EF and Haynesville have been adding rigs for shale gas DRY. Karnes is the close to black oil part of EF.
Current Rig Count in the Haynesville Shale
As of early 2026, Haynesville rig activity has reached a multi‑year high of around 60 active rigs GoHaynesvilleShale.com. This follows a recovery from a low of 36 rigs in December 2024, with counts steadily climbing through 2025 and holding near 60 in February 2026 GoHaynesvilleShale.com.
The uptick is driven largely by Apex Natural Gas (formerly Paloma Natural Gas, now Citadel‑owned), which has ramped up to as many as 13 rigs at a time, adding 40 drilled‑but‑uncompleted wells (DUCs) since mid‑2025 GoHaynesvilleShale.com. Other major operators include Expand Energy (~33 DUCs), Comstock Resources (31 DUCs), Aethon/Adamas (27 DUCs), and TG Natural Resources (18 DUCs), bringing the total DUC inventory to about 149 wells GoHaynesvilleShale.com.
This build reflects a coordinated industry strategy to stockpile wells ahead of anticipated Gulf Coast LNG demand, with completion decisions tied to price environments GoHaynesvilleShale.com.
Summary:
Current active rigs: ~60 (multi‑year high) GoHaynesvilleShale.com
Recent trend: Up from 36 in Dec 2024, steady climb through 2025 GoHaynesvilleShale.com
Key driver: Apex Natural Gas’s aggressive drilling program GoHaynesvilleShale.com
DUC inventory: ~149 wells across top operators GoHaynesvilleShale.com
Sheng Wu
Attached is a picture showing the weekly NG Hz rig counts in Texas starting in June up to the end of July. There is no increase in the EF in the last few weeks and only a small increase since early June in Haynesville.
This is from the latest Baker Hughes rig count. Seems to be different from data?
A Gas
Hi Ovi,
For Haynesville Gas plus oil rigs the count increased from 40 for week ending August 1, 2025 to 56 for week ending July 31, 2026. If we look at Haynesville gas rigs only the count for the most recent week is 53 and was 40 1 year ago. For Eagle Ford, gas plus oil rigs increased from 39 to 48 rigs over the past 52 weeks.
The thing that many forget (not you but many others) is that there is about a 7 month delay between changes in rig count and changes in output, so the relevant number for today’s output is the rig count 7 months ago. For eagle ford 7 months ago the count was 40 rigs which was down by 5 rigs from 12 months earlier. For Haynesville the oil plus gas rig horizontal plus directional count was 41 rigs 7 months ago which was 14 rigs higher than 19 months ago. The increasing rig count from the end of Dec 2025 to the end of April 2026 may lead to increased Haynesville output over the next 4 months (unless operators are just going to build there DUC inventory for a future date.)
Dennis
I had the impression from Sheng Wu that there was an increase in NG drilling.
The table that was posted was for Hz NG rigs. When checking all rigs it does jump to 53 from 47 shown in the table above. Four of the six are directional rigs.
Ovi and Dennis,
In the past 2 years, the natural gas shale drilling (rigs) are concentrating to Haynesville, actually up a little bit in SW Marcellus (WV+OH+SWPA) and EF, while dwindling in NEPA and elsewhere.
In Haynesville, the legacy Eastern Louisiana part has had most of the increase in drilling (rig numbers); while the newly emerged Western Haynesville (WH) still has trouble lowering the cost — currently taking more than 2 months to drill one less than 10Kft lateral while the Eastern Haynesville (EH) part taking just 1 month to drill a 15Kft lateral.
To compare, in SW Marcellus(SWM), they could drill a 15Kft lateral in 3~5 days at 300ft/hr; similar time scale for completion if more contrast. The last 2 longest laterals with over 35kft total measured depths, and several 15Kft long U laterals were all drilled in SWM, all under 2 weeks.
While the gas EURs are about 1(SWM) : 1(EH) : 2~3(WH), but SWM has a lot of liquids, significantly increase the economics.
Sheng Wu,
For Horizontal plus directional gas rigs the count has increased from 96 to 119 over the past 2 years a 24% increase over that 2 year period. For Texas and Louisiana the increase over that 2 year period was from 46 to 73 a 59% increase. For the Haynesville the increase was from 33 to 53 rigs, a 61% increase. Two years ago the percentage of horizontal plus directional gas rigs in Haynesville was 34% and for WE July 31 the percentage of Haynesville rigs increased to 45%. For Marcellus plus Utica the count went from 31 to 33 with the % 2 years ago at 32% and last week at 28%. For Ohio and West Virginia the count increased from 13 to 16 over the past 2 years, for Pennsylvania the count went from 19 to 17. In all of this data I am looking at horizontal plus directional gas rigs. I don’t know the counties of Pennsylvania well enough to tease out NE from SW PA.
The number of H+D gas rigs in the Eagle Ford has been in the 4 to 13 rig range over the past two years with the recent count at 8 rigs. Most of the rigs in the Eagle Ford are oil rigs (40 of 48 for most recent week).
A large part of the increase in H+D gas rigs over the past 2 years has indeed been in the Haynesville with 20 of 23 rigs or 87% of the increase from increased Haynesville rigs.
Much of this is due to demand from LNG export facilities in Texas and Louisiana.
Frac Spread Report for the Week Ending July 31
The frac spread count dropped by 4 to 194. From one year ago, they are up by 27 spreads but are still down by 21 since March 21, 2025.
A frac
New cockamamie deal talks incoming
BREAKING: Trump says the ‘perimeters of a deal’ with Iran ‘has been agreed to’
https://x.com/AJENews/status/2083738138573152453?s=20
TACO. Most indecisive incompetent moron ever witnessed by man, possibly ?
Unfortunately, odds are they will keep repeating this “rich man’s trick” while they destroy incremental amounts of the energy infracstructure in each round of fighting and draw down the inventories until it’s all over.
They are not messing around this time.
Trump has been “buying the dip”
He is now offering a service where investors can get first access to his “Truth Social” posts.
Kushner nailed a 550k bet on the Ayotollah being assasinated.
Brazen. Unconcerned with consequences.
I guess we have reached the stage where the pigs are at the trough. And some animals are more equal than others.
Iron Mike,
100%!!!
Andre,
It’s beyond surreal — “Truth API” gives firms “a direct, licensed, real-time feed of the platform’s most market-moving Truths” —the service reportedly costs as much as $100,000/month.
I think he now knows there is no effective military action, other than destruction of Kharg Island.
The negative repercussions of that action even he seems to understand.
Its always better to avoid war,
including ones that you have very little chance of winning.
Better to elect people who know stuff like this.
Interesting information from Novi on tight oil and shale gas at post linked below
https://novilabs.com/blog/can-100000-wells-reveal-what-single-basin-analysis-misses-the-hidden-biases-undermining-unconventional-production-models/
Pretty good Novi article, Dennis. But it left out the most important part of the backstory.
It has been long known that if you can get hold of minerals in the section where an “open hole” parent well was drilled, you will predictably do very well. There were over 100 of these wells drilled in the Bakken (none that i know of in the Permian). The process of horizontal wells for oil was new in 2000. In North Dakota you had 3 years from the time you purchased a lease during which to HBP your leasehold, so drillers ran through the sweet spots, drilling a single well in each section.
In many cases in those starter wells, the lateral well bore was left uncased. A slotted sleeve was delivered to the log-productive zone and that area was perforated, but the sleeve was never cemented. In the Williston there is interbedded carbonate, usually limestone but occasionally a good amount of strontium carbonate, which makes the shale brittle and causes it to naturally fracture. With no cement to impede those natural fractures some of those primitive old wells were pretty decent. But the real money was in the child wells, because the reservoir had been largely untampered with, and was overpressured, so gas in solution would give you one heck of a set of child wells.
As to AI not being able to show off its “machine learning,” there is no reason to even try. In the Bakken the ideal spacing, based on child well production, is 1,200 feet, but they can get pretty good wells, usually, with 600 feet spacings. In the thinnest benches, in Divide county, four-mile laterals have allowed for decent yields even with tight spacings, as those thin benches are oil-dense.
He was right about clay being one of the dispositive issues. The Austin Chalk in what has traditionally been called the Woodbine is usually overpressured and has good porous rock and a lot of NG but the clay poses an issue with oil production.
This may be just introducing my bias, but I think these data companies are trying too hard to sell concepts handled by AI, when in reality all they have to do is look at the archives. Today it is unheard of to consider an open hole horizontal well that wasn’t even fracked. But drilling infill wells in those sections, using multistage fracking was the way this thing turned into a big deal.
Interesting that you used “tight oil and shale gas” instead of “shale oil and gas”.
The NOVI link has no “shale oil” in the post, amazing the mainstream could brainwash even AI bot to acquiescent there is only “tight oil and shale gas” but no “shale oil”.
The underlying detail for “shale” oil and gas is “clay” in this NOVI post, which has been consider by mainstream and this post to make true “shale oil” and even “shale gas” harder to produce than conventional reservoir non-clay rocks.
I found many “no shale oil” or even earlier “no shale gas” believers like to extend the conventional oil and gas model & wisdom to shale and tight unconventional resources. They use readily accepted conventional wisdoms like “clay expansion and collapse stops oil and gas” and “TOC adsorption gas and oil” to claim that there is no “shale oil” and “shale gas”.
Inherently, they are searching for conventional wisdom like “permeability” and “porosity” control, which kills “clay and TOC” and “shale”.
Similarly, mainstream media and lots of geologists and petro engineers with no phase-diagram knowledge readily accept the other easy to understand conventional terms, i.e. “viscosity” and “adsorption”, as main control for oil production. This “viscosity” overhype also kills “shale oil”, as oil has orders magnitudes larger viscosity and adsorption than gas, and therefore only shale gas could produce from shale which is the tightest of all rocks plus TOC adsorption for oil is also orders stronger.
Similarly, the mainstream could further easily kill Venezuela heavy crude and the “Low GOR&API shale oil”.
The previous post here about western Haynesville is not “Haynesville” but rather the Bossier shale with lower TOC? is another effort to brainwash TOC and clay hurt shale production?
The mainstream claims that the reason Hayneville legacy has high decline is the “clay and TOC rich” which block the flow passages. I have been touching Marcellus shale first hand the past half a year, and shocked to find they are super high in TOC and clay-rich and yet super productive, not just shale gas but oil too.
Next time if I have a chance to present in the URTEC exhibition hall, I want to loudly yell to the hall that “mainstream don’t believe in “shale oil and gas”!!!
Sheng Wu,
People use tight oil and shale oil interchangeably, to me there is not a distinction, I use tight oil so that people don’t get confused between oil shale (kerogen converted to a useable product) and shale oil. I imagine many others do the same.
Hi Gerry,
If you download the paper there is much more information, I found it pretty good, but I know less than you. I have heard that 1200 foot spacing is probably the sweet spot in core areas, maybe 600 foot spacing works well in some cases, but my understanding is that you will see lower output per well compared to wider spacing so it may be an inefficient approach if the aim is to maximize profit.
DC,
I believe majority of Marcellus shale gas laterals definitely has spacing under 1k ft, and EQT in SW Marcellus has them around 750ft where they have lots more liquids than NE Marcellus, the shale thickness is much thinner too, usually <50~70ft; whereas in NE Marcellus the lower Marcellus alone is over 100ft, and the space is also under 1k ft.
Usually shale oil has much tighter spacing because majority just believe in "viscosity" and because oil viscosity is orders of magnitude larger than gas, it is intuitive to apply shorter spacing for shale oil laterals than shale gas laterals.
The most prominent advocate for larger spacing in shale oil is Scott Lapierre, where he is the first/most well known to emphasize the PVT bubble point limit the spacing and EUR.
But, a good larger majority believe in much tighter spacing, i.e. over drilling, including Scott's previous employer, Pioneer.
According to Scott model, US shale and tight oil overdrilled 50~100%, and get up to 50% recovered than if they only drill half of the number of laterals.
When you hear about various battery chemistries it refers to the cathode material.
You may have recently started to hear about the anode portion, or if not you will soon.
The anode has all been graphite until recently.
Now silicon based anodes are beginning to gain traction and will probably dominate within a decade.
with substantial advantages to charge speed, weight and/or energy capacity.
From cellphones to drones, vehicles to robots. Probable long duration storage once mass production is in full swing.
https://autos.yahoo.com/ev-and-future-tech/articles/forget-solid-state-ev-battery-143423270.html
https://www.thecooldown.com/green-tech/general-motors-silicon-anodes-ev-batteries/
https://insideevs.com/news/802397/sila-silicon-anode-lithium-ion/
Thank you Hickory!
It’s honestly really hard to keep up with changes in the battery industry and technology, but it is a key component of electrification and highly important.
If we think of solar + batteries as a potential major source of global energy, EROI of the combination seems important.
I found a recent study, but have not looked at it carefully — just sharing FWIW.
Photovoltaics beyond the panel: system-level net energy under grid and firming constraints
https://arxiv.org/html/2607.14784v1
“Photovoltaics can exhibit favourable installation-level energy return on investment (EROI), yet electricity must also be delivered when solar and wind generation are insufficient. This study evaluates how the energy balance changes when the boundary is expanded to reliable electricity supply. A fleet-equivalent benchmark model includes component turnover, grids, storage, renewable overbuild, dispatchable backup, and fuel supply. ”
Bulletpoints:
“Unfirmed renewable fleet EROI: 10.7–16.0 (does not provide continuous electricity)
*Battery load-balancing of 1 hr EROI: 7.1–12.5
*Battery load-balancing of 24-hr EROI: 0.7–2.3
You should note that this is a development of a model, NOT an actual analysis. They make this clear:
“A fleet-equivalent benchmark model includes component turnover, grids, storage, renewable overbuild, dispatchable backup, and fuel supply. It is not a simulation, optimization, or real-system prediction.”
Not a real-system prediction. Not a simulation or optimization. So….don’t rely on those EROI numbers!
Hi Nick,
Hickory was initially referring to auto batteries I believe, so I am guilty of taking this one off topic.
However, re EROI of renewable + batteries, I’m going to just guess/speculate that the EROI numbers are not great when compared with hydrocarbons with energy (fuel) stored in the form of crude oil / coal.
Well, that was what made me look into the basics of that article, because…EROI of solar/wind are much higher than for FF. Solar had an EROI of 30 more than 20 years ago – the cost of solar has dropped by 95% since then, so the EROI could only have gotten better. Similarly, wind was at 65 at least 15 years ago.
Batteries would have an impact, but not great enough.
NickG, still spouting nonsense. Those EROI numbers you always talk about are from studies with very narrow boundaries of what they include, never real world full total cost of energy inputs, to account for all energy inputs.
The built environment of mines, processing plants, factories, trucks, roads, bridges, ports are excluded form such studies as non energy inputs, yet I know of none of these features that get built without energy. Then there is the human labour from designers, to managers, accountants, lawyers, foremen and workers all that also have zero energy input in the studies Nick refers to.
So Nick how do people get to work without energy inputs?
How do they survive without food, which requires energy to grow, move and cook?
If the numbers Nick gives were close to true, then every Aluminium Smelter would go off grid on their own Solar and batteries and out compete all the fossil fuel smelters, but none do anywhere in the world, as it’s not profitable to do so.
“ human labour from designers”
Sigh.
People are not inputs. They’re ends in themselves. The whole purpose of an economy is to allow them to live. Which is the reason why, for instance, the IRS does not allow people to deduct the cost of normal food as a work expense.
“ how do people get to work without energy inputs?”
Same thing. The IRS doesn’t allow you to deduct the cost of commuting, because….that’s just part of life. Whatever work you do, you’ll need to get there. It’s life., Energy is there to support people, and not the other way around.
Let me put it this way: if you include people, and everything people need, like food, housing, infrastructure, you’ll inevitably extend your analytical boundaries to include *everything*, and your EROI will always end up being 1:1.
Not a helpful analytical tool.
Hi Nick
CC Hideaway:
If human labor were completely ignored as an energy input, the EROI of manual/primitive energy sources (like handcollected wild firewood) would be essentially infinity or an absurdly high number because the human labor is the only direct input.
Proof in the pudding guys.
How much does the energy cost?
What energy supply and equipment purchases are being made?
Keep in mind that energy supply security/stability is a also abig part of the equation, along with price.
And no, I wasn’t talking about solely automotive battery anodes. All batteries will be making the shift from graphite to silicon it looks like.
Will coal to diesel in Australia make sense someday, when you consider the very high cost.
Perhaps if imported diesel is unavailable or costs over $10/g.
Put that in the ERoEI blender.
THC,
Yes, that says something about the difficulty of using EROI as an analytical tool. Normally EROI is used for extrasomatic energy, not human physical energy.
In theory, you’d need to allocate the *extra* energy expended in the collection and processing of firewood. As a practical matter, hand collected residential woodburning, isn’t a sufficiently important energy source to spend a lot of time on analysis. The little that’s done these days is done with chain saws and trucks.
Now, if you’re looking at something like Drax, that’s a whole Nother animal. That’s industrial biomass.
Hickory,
Yes, in practice we should look at what’s actually being done.
——————————
CTL can be done. It was seriously considered in the 1980’s. But the projects were very large, very expensive, and very GHG intensive. It was clear that it was too risky in an environment where government policy could turn decisively against GHG emissions (maybe because of major firestorms and massive heat waves, droughts, etc?)
Synthetic diesel is also relatively expensive, but it has inherently far lower emissions. And, heck, large parts of Australia are getting free electricity during the mid-day, due to solar. That inexpensive surplus power is ideal for conversion of syndiesel (the power inputs are the major cost).
NickG, Bigger sigh!!
You just don’t get it do you. Our civilization is a thermodynamic one driven by the physics of energy use. Nothing happens without energy use.
We built up to our current technological civilization by using a pre concentrated energy source of fossil fuels. We don’t need to work out their EROEI as we wouldn’t have 8.3B humans and our level of technology without them at all.
I’m always arguing strict thermodynamics, total energy input vs total useful energy output, I’m not arguing what stories humans can make up to deceive ourselves in EROEI research or IRS tax deductions or any other ‘story’ we want to make up to deny reality.
If the average wholesale price of energy is $X/Mwh then this will determine the full energy cost of making and operating any energy source. If whatever your energy source returns $X x 10 over it’s life after all building, operating and maintenance costs, then thermodynamically it has an EROEI of 10:1
You have simply answered the question of why no-one anywhere sets up an off-grid Aluminium smelter based on solar and batteries, despite having these huge surpluses according to the EROEI numbers (stories we make up that deny reality). We, as in humanity leave out a lot of the actual energy cost to convince ourselves of something that’s not thermodynamically real.
Go back 150 years or 250 years when coal then later oil became extremely popular to use. They didn’t require any subsidies at all. Businesses took up using these energy sources as there was a huge profit in doing so. They found and started utilizing these resources well before governments thought of charging for the privilege, though private landholders did charge a royalty (from around the 13th century!!). Despite the royalties paid, it was highly profitable to use the coal, it had a high EROEI. Of course both the profitability and EROEI declined as the coal was deeper or further away from where it could be sold and used.
The initial history of oil use is pretty much the same..
Governments put on their own taxes and royalties on fossil fuels as they could eventually see that they were so profitable to the owners and miners. Taxes had to be paid for with money, as that is how governments and our economies distribute energy around our system of civilization. Cheap energy made businesses highly profitable, despite the effect on the environment and allowed our modernity to develop.
We can tell ourselves stories that don’t involve thermodynamics to make out any energy source is better than another by leaving out huge gobs of input energy, but the stories are no better than Grimm’s fairy tales in a thermodynamic sense.
At some point Nick, you have to get your head out of the stories we tell ourselves and look at the thermodynamic reality. None of the environmental reasons of damage done by fossil fuels via CO2 emissions, microplastics, endocrine disruptors, etc, changes the thermodynamic reality of our need for cheap, high thermodynamic, EROEI energy, to produce and maintain modernity.
I’m interested in reality, not fairy tales we tell each other..
Hideaway, nice summary!
Oh my. So many things to address, so little time.
Here’s one: the myth of the one-time, irreplaceable gift of FF that built our tech civilization:
There is a common meme of fossil fuel being a uniquely large, one-time energy source. Here’s another perspective: fossil fuel was convenient for the tech of the 1700s to 1900s (it’s relatively simple to burn stuff), and more scalable than wood (for a short time) but it’s not large compared to other sources.
In particular, solar power is much, much larger. Humans burn about 10-25 terawatts of fossil fuel per year, but the sun drops 180,000 terawatts of power on the earth, continuously. One tenth of one percent of solar power is 5 to 10x as large as current FF output.
Let’s put it another way: Fossil fuel could provide about 67 Zetajoules of energy or 18.6 million terawatt-hours, based on https://peakoilbarrel.com/projection-of-world-fossil-fuel-urr/
That’s about 4 days of sunlight. Only 4 days of sunlight is equal to the whole FF resource.
FF is not an incomparable, one-time gift of energy. It’s very, very replaceable.
EROI is almost impossible to calculate including everything related.
A much more simple approach: Just take the cost, and the energy usage of the producing country / $ industry products.
That’s not exact, but gives a good estimate instead of calculating from every screw to the manager jetting around in the company Lear Jet.
looks like Vaca Muerta will overshoot the target of 1MBOPD earlier than 2030, and now targeting 1~1.5MBOPD by 2030.
https://oilprice.com/Energy/Energy-General/Argentinas-Oil-Production-Soars-as-Vaca-Muerta-Breaks-New-Records.html
The amazing opinion from this oilprice.com thread is that they still hold the “The oil produced has an API gravity of 39 to 41 degrees ” conventional wisdom from US marine shale oil.
The actual fact is that VM right now has the most productive blocks producing LOW GOR(<350scf/bbl) & API(<35deg, true black oil) shale oil (LGBSO). Such shale oil only found in hypersaline lacustrine shale formations, i.e. Uinta and China Bohai bay etc.
Such LGBSO has been considered as too viscous to produce, like in Venezuela, but actual phase diagram actually enable LGBSO to outproduce marine shale light tight oil with high GOR (HGLTO). LGBSO features lower IP than HGLTO, but it ramp up slowly and reach max IP usually 2~3 months later, and then have much slower decline.
https://www.linkedin.com/pulse/low-gor-api-shale-oil-wells-make-top-vaca-muerta-now-further-sheng-wu-pfv2e
https://www.youtube.com/watch?v=k4tExRcocj4
~10 minutes
US defense missile stockpile is depleting rapidly.
It can take 3 years to replenish.
Only 847 interceptor missiles world wide for all those naval vessels and bases
Absolutely terrible management.
Hopefully nobody will try to take advantage of this self-imposed weakness, since it raises the possibility of a desperate ‘tactical’ level nuclear response from our brilliant leadership.
“U.S. tactical nuclear weapons are short-range, low-yield battlefield systems centered on the B61 gravity bomb and low-yield submarine warheads. They are designed for localized military use rather than full-scale strategic destruction”
Hey all,
A quick thought…….
Why, in the middle of the war, would somone leak strategically critical information about weapons’ inventory levels? If the leak were real and from a military insider there would probably be a manhunt to find those responsible and throw them in jail forever.
After watching the Ukraine conflict and hearing endless failed predictions/leaks about what country is running short on weapons, I have trouble believing these stories.
Good point THC.
https://www.youtube.com/watch?v=0JmZbW00kWQ
~25 minutes
Joe Kent, former Head of Counter Terrorism in the Trump Admin. He resigned.
He thinks it is a combination of Pentagon whistle blowers that are looking at the burn rate and are being ignored
— and —
War Hawks and Military Industrial Complex pressuring Trump to buy more
With the global oil supply clock ticking it seems like Trump will be forced to make a big move before too long. My rational mind thinks he will cave in, leave a mess but try to describe it as a win.
China will quietly get some great contracts.
rumors say that US will send 300 B1, B2, B52 bombers depleting all conventional bombs in 14 days starting Aug. 7~8th. Disable 90% of oil and gas production and distribution in Iran.
Then, declare victory no matter what’s the outcome.
The oil price crash seems to indicate that the market is betting on Trump/US/Isreal victory.
Sheng Wu,
The market is delusional.
The rumor you cite would change very little, anyone who thinks an air campaign will change the situation to any extent knows little about conflict and how it is resolved.
Trump is clueless along with the secdef.
Sheng Wu. I see the surprisingly low oil price as signaling that ‘the market’ thinks Trump has failed and will cave in rather than set Iran and the Gulf on fire.
If he was going to blow the place up the pricing would be much much higher. And US bond rates would go much higher (very unfavorable).
Sheng Wu,
What are you smoking ? If that rumour came to reality, oil prices would be > $200 a barrel. Iran would likely destroy all oil and gas infrastructure in the area.
Trump is desperately looking for an exit ramp with his tail between his legs. They will probably sign any deal they can get. The whole thing has Afghanistan vibes. Has the U.S won any conflict since WW2 ?
If Trump wasn’t such an idiot they could have finished the job last year in the 12 day war, Israel knows what it is doing and is much better prepared and strategised. Trump and his administration are going to be remembered as the TACO administration, what an embarrassment to a superpower like the U.S. China is loving this whole situation. They are probably thinking, if we take Taiwan what the hell is the U.S going to do when they cannot even beat an economically bankrupt country like Iran.
Things look bad in Hormuz and Red Sea see link below for an update
https://oilprice.com/Latest-Energy-News/World-News/Hormuz-Tanker-Traffic-Stalls-at-Two-Month-Low-as-Attacks-Escalate.html
At some point the oil market will realize that Trump is not to be believed.
Currently with oil price futures at $79/b for Brent, the oil market has not learned this, in time it will.
Also see link below
https://oilprice.com/Latest-Energy-News/World-News/Oil-Markets-Price-In-an-Iran-Deal-That-Does-Not-Exist-Yet.html
Some people have been optimistic about the potential in Venezuela. The piece below is a reality check, Exxon and Chevron are not interested in new investment in Venezuela.
https://oilprice.com/Energy/Crude-Oil/Seven-Months-After-Maduros-Fall-Big-Oil-Still-Wont-Commit-To-Venezuela.html
An excerpt:
Venezuela’s oil production has climbed to roughly 1.07 million barrels per day, up from about 937,000 last year, but it remains a fraction of the country’s late-1990s peak. With the majors proceeding cautiously, the Trump administration has increasingly looked to smaller independent producers that can move faster and provide immediate capital. Several privately held firms have already signed preliminary agreements, though analysts caution that fully developing Venezuela’s heavy-oil resources will ultimately require the deep pockets, long investment horizons, and technical expertise that only the largest international oil companies can provide.
US refineries are running at 96%, no shortage of crude, yet. Crude price is therefore still muted but the tightness is in product. US SPR draw is falling and China is/will re-enter the market so crude will tighten. Hopefully fall demand will fall and ease product pressure.
Good video, Paul Sankey.
https://www.youtube.com/watch?v=A8oovRNCzTI
Driverless Trucks Delivering Propant in the Permian
One of autonomous trucking’s most convincing commercial proof points isn’t running down an interstate. It’s hauling frac sand along a 42-mile conveyor in the Permian Basin.
Atlas Energy Solutions (NYSE: AESI) announced Friday an expansion of its driverless proppant delivery program with Kodiak AI (Nasdaq: KDK), adding a second simultaneous load-out point along its Dune Express sand conveyor system. The companies also agreed to a timetable that grows the Atlas driverless truck fleet from 28 trucks to 100 by mid-2027.
https://finance.yahoo.com/energy/articles/atlas-grows-kodiak-driverless-truck-162511377.html
US SPR down to 304809 kb the lowest level since week ending Feb 18, 1983, see
https://www.eia.gov/dnav/pet/hist/LeafHandler.ashx?n=PET&s=WCSSTUS1&f=W
I have read the minimum level acceptable to the US military is roughly 250000 kb, over the past 4 months the average monthly decrease has been about 27000 kb each month so we would approach this minimum level in about 2 months at the average rate of decrease of the past 4 months.
A resolution to Hormuz and Red Sea chokepoints may occur before then, but odds seem quite low in my view. The US has lost all leverage with the Iranians, they no longer believe Trump’s threats.
An Update to US Oil Production has been posted
https://peakoilbarrel.com/us-may-oil-production-drops/