By Ovi
The focus of this post is an overview of World oil production along with a more detailed review of the top 10 Non-OPEC oil producing countries. OPEC oil production is covered in a separate post.
Below are a number of Crude plus Condensate (C + C) production charts, usually shortened to “oil”, for the oil producing countries. The charts are created from data provided by the EIA’s International Energy Statistics and are updated to March 2026. This is the latest and most detailed/complete World oil production information available. Information from other sources such as OPEC, IEA, STEO and country specific sites such as Brazil, Norway, Mexico, Argentina and China is reported to provide an extra one or two months production preview beyond the EIA’s latest report.
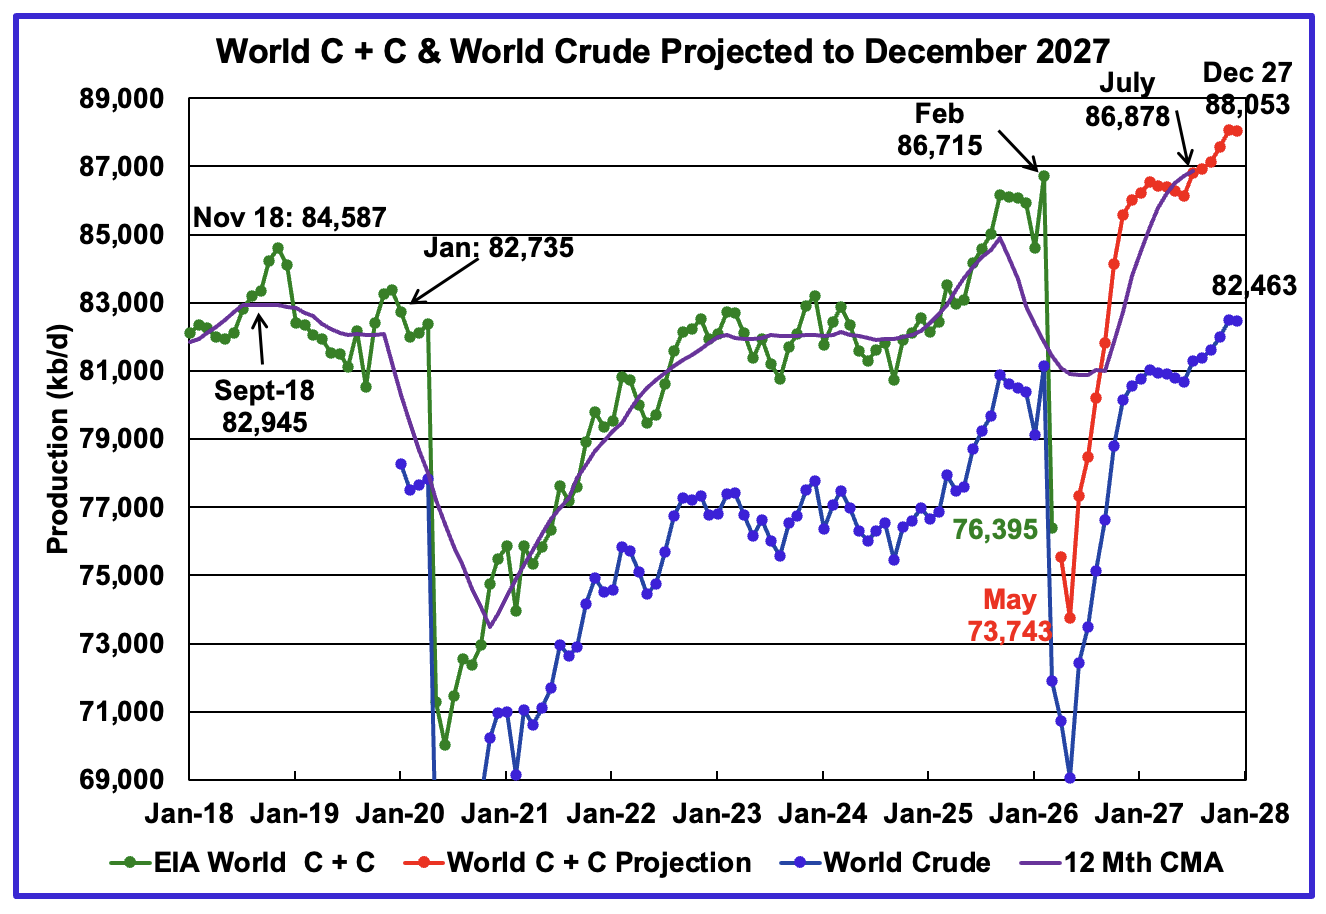
The World’s March oil production dropped by 10,320 kb/d to 76,395 kb/d due to the closing of the Hormuz Straits. The largest contributors to the drop were Saudi Arabia, Iraq, Kuwait and the UAE.
The EIA’s July STEO report continues to make significant and major revisions to the World’s projected oil production after March 2026 due to the US/Iranian war.
This chart has been updated using the July 2026 STEO to project World C + C production out to December 2027. It uses the STEO report along with the International Energy Statistics to make the projection. Production in May 2026 is projected to fall to 73,743 kb/d and is forecast to be the bottom.
The 12 month Centred Moving Average shown at July 2027 is 86,878 kb/d.
For December 2027, production is projected to be 88,053 kb/d, a new projected high and is an upward revision of 257 kb/d over the previous post. The increase comes from a number of Non-OPEC countries.
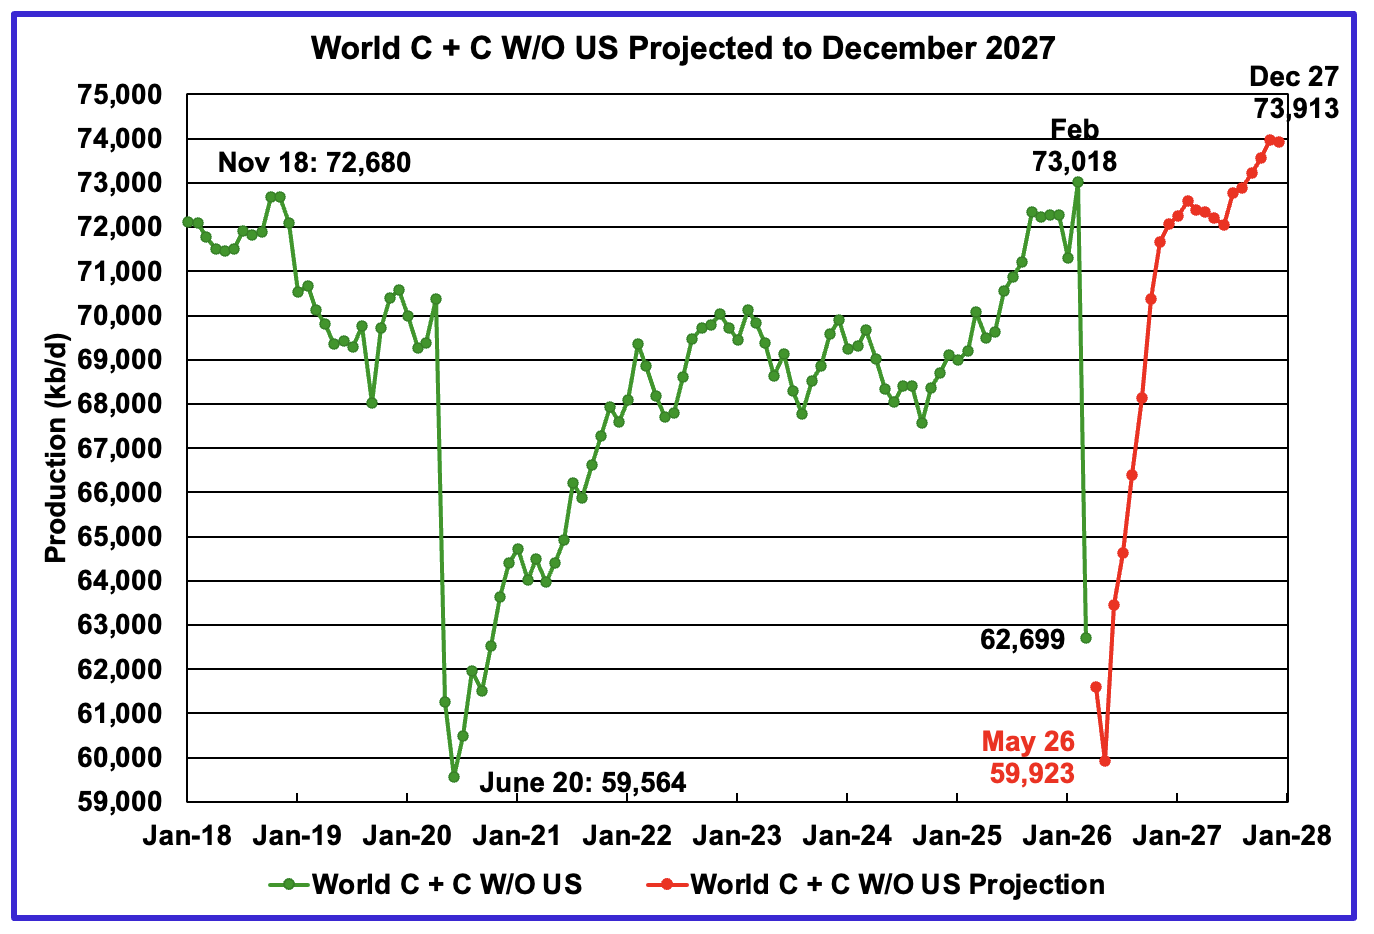
March World oil output W/O the US decreased by 10,319 kb/d to 62,699 kb/d. May production is expected to be the low point at 59,923 kb/d.
The projection is forecasting that December 2027 World W/O US oil production will rebound to 73,913 kb/d. This is 895 kb/d higher than the previous February projection of 73,018 kb/d.
From February 2026 to December 2027, production is expected to grow by 895 kb/d. This small increase may be more than welcome to offset the demand destruction associated with higher oil prices.
A Different Perspective on World Oil Production
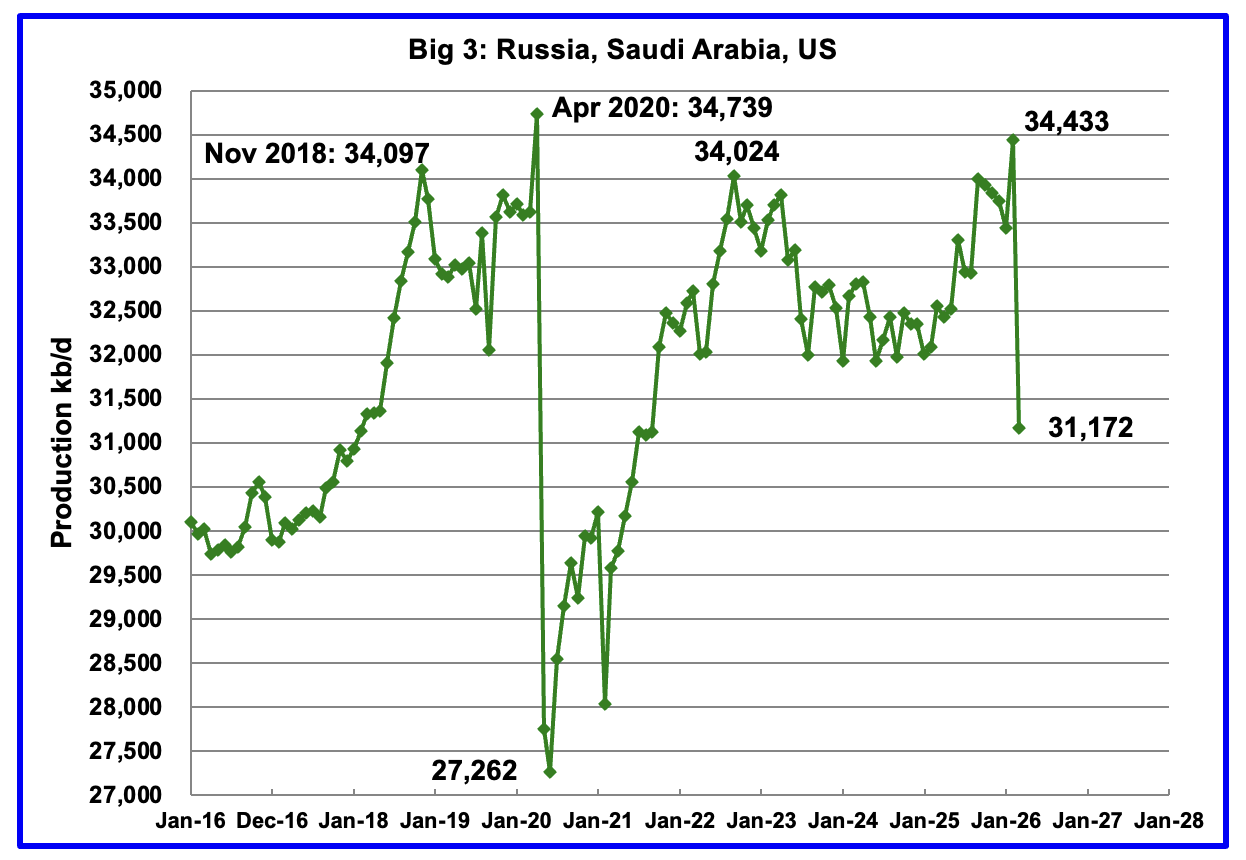
March Big 3 oil production decreased by 3,261 kb/d to 31,172 kb/d. Of the 3,261 kb/d drop, 3,260 kb/d came from Saudi Arabia.
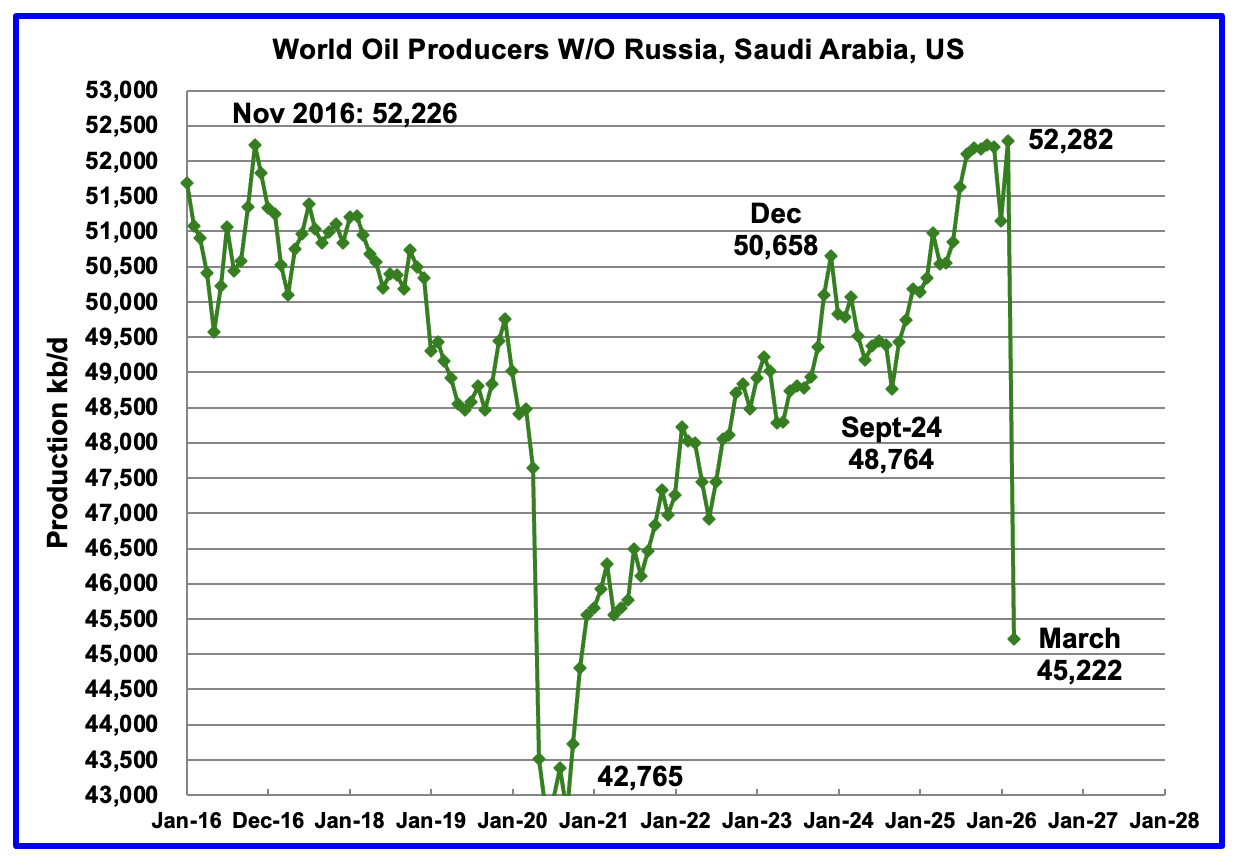
Production in the remaining countries also dropped due to the closing of the Straits of Hormuz. March 2026 production dropped by 7,060 kb/d to 45,222 kb/d. The biggest contributors to the drop were Iraq, UAE and Kuwait.
Countries Expected to Grow Oil Production
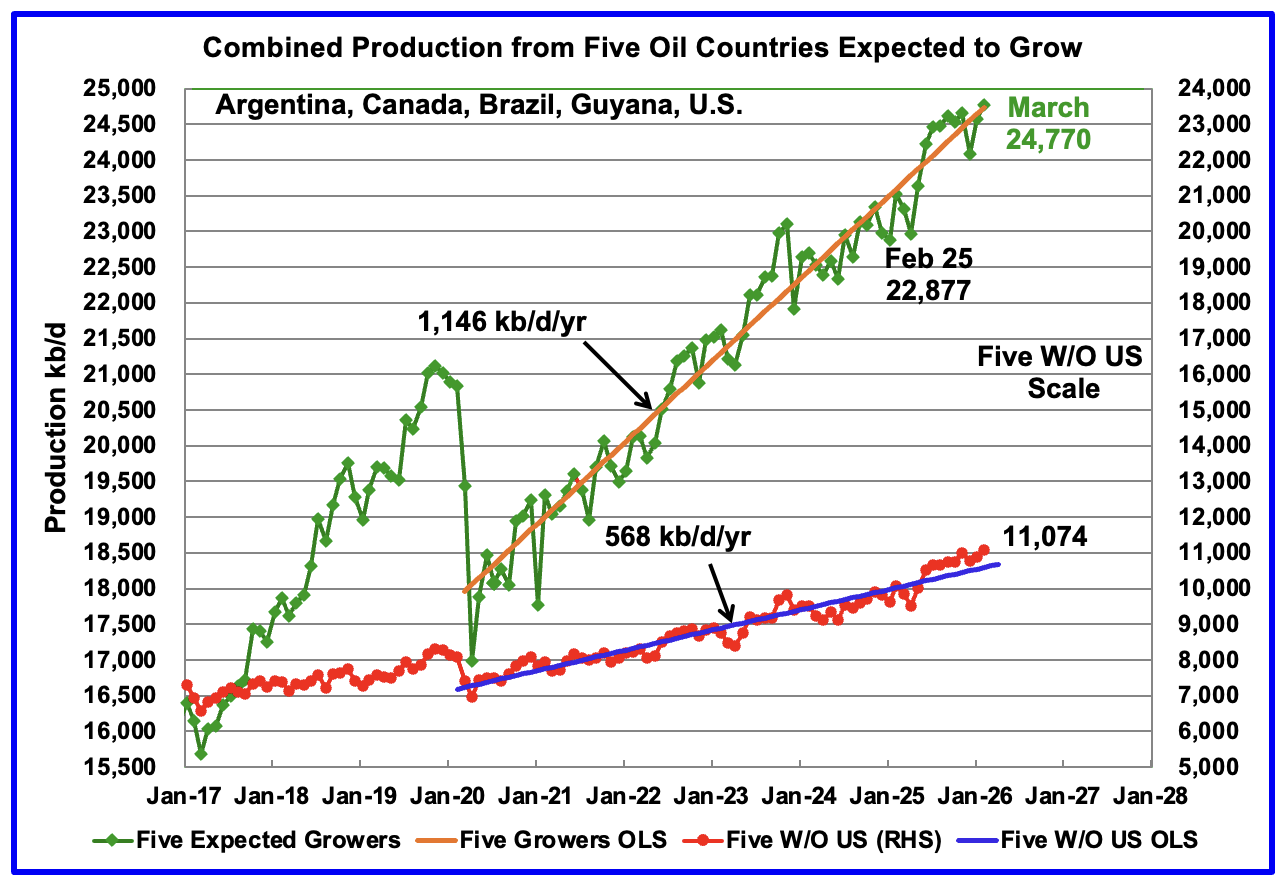
This chart shows the combined growing oil production from five Non-OPEC countries, Argentina, Brazil, Canada, Guyana and the U.S., whose oil production is expected to grow in coming years. These five countries are often cited by OPEC and the IEA for being capable of meeting the increasing World oil demand for next few years. Production from these five countries from April 2020 to February 2026 rose at an average rate of 1,146 kb/d/year as shown by the orange OLS line. This is an updated OLS to February 2026 and the growth rate rose slightly from the previous rate of 1,130 kb/d/yr to 1,146 kb/d/yr. From March 2025 to March 2026, production rose by 1,252 kb/d.
To show the impact of US growth over the past 5 years, U.S. production was removed from the five countries and that graph is shown in red. The production growth slope for the remaining four countries has been reduced by 578 kb/d/yr to 568 kb/d/yr.
March production has been added to the five growers W/O US chart and it rose by 196 kb/d to 11,074 kb/d.
World Oil Countries Ranked by Production
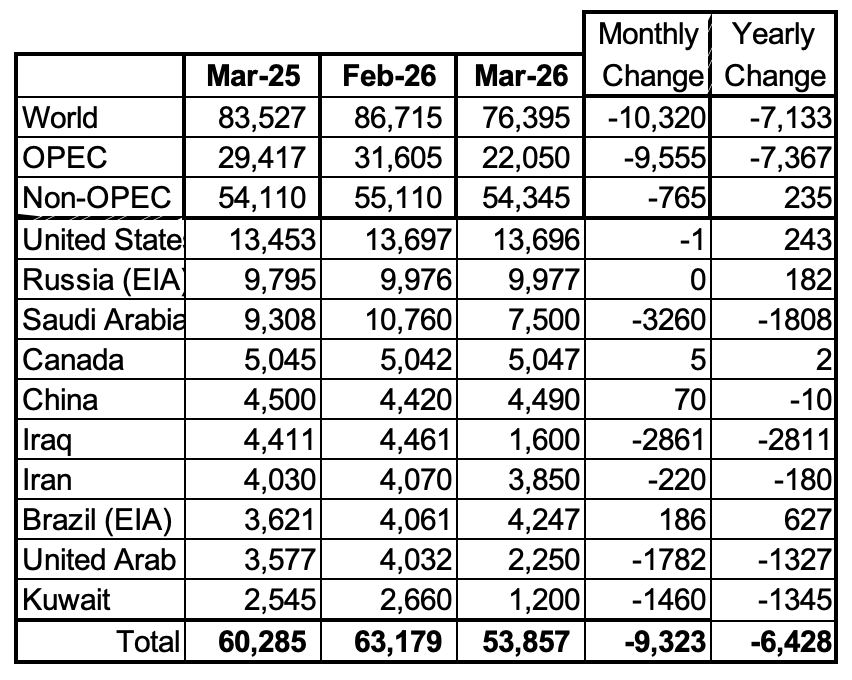
Above are listed the World’s 10th largest oil producing countries. In March 2026 these 10 countries produced 70.5% of the World’s oil. On a MoM basis, production decreased by 9,323 kb/d in these 10 countries while on a YOY basis production dropped by 6,428 kb/d. Due to the ongoing US/Iran war, the countries are ranked using March 2025 production.
Non-OPEC Oil Countries Ranked by Production
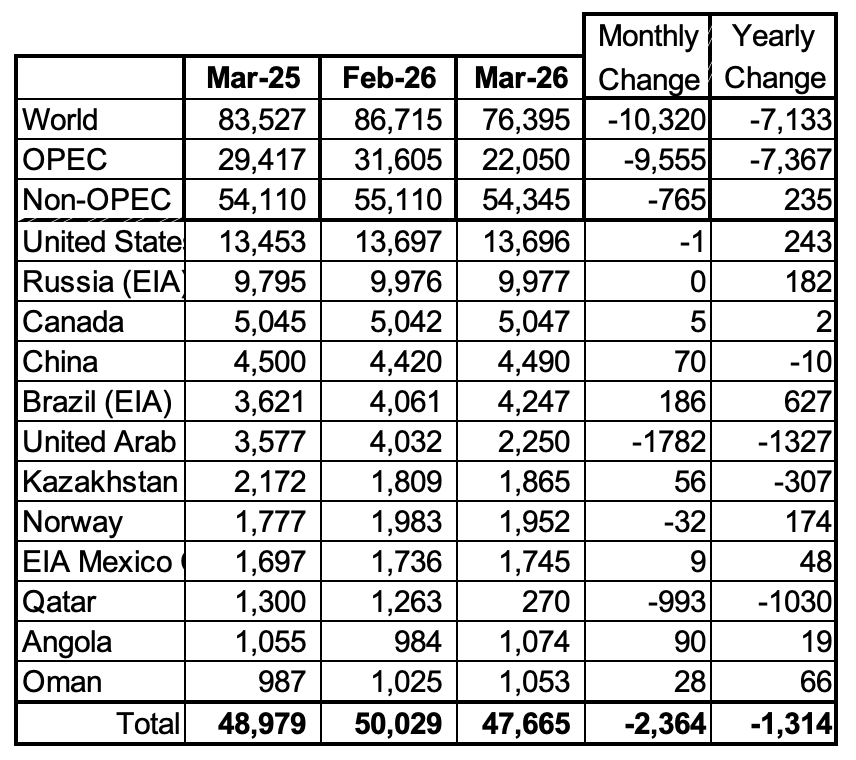
Listed above are the World’s 10 largest Non-OPEC producers. The original criteria for inclusion in the table was that all of the countries produced more than 1,000 kb/d. The UAE has been added since they have left OPEC.
March MoM production decreased by 2,364 kb/d to 47,665 kb/d for these 10 Non-OPEC countries while as a whole the Non-OPEC countries saw a yearly production increase of 235 kb/d to 54,345 kb/d. The large monthly drops for the UAE and Qatar are due to the Iran US war.
In March 2026, these 10 countries produced 87.7% of all Non-OPEC oil.
Non-OPEC Country Oil Production Charts
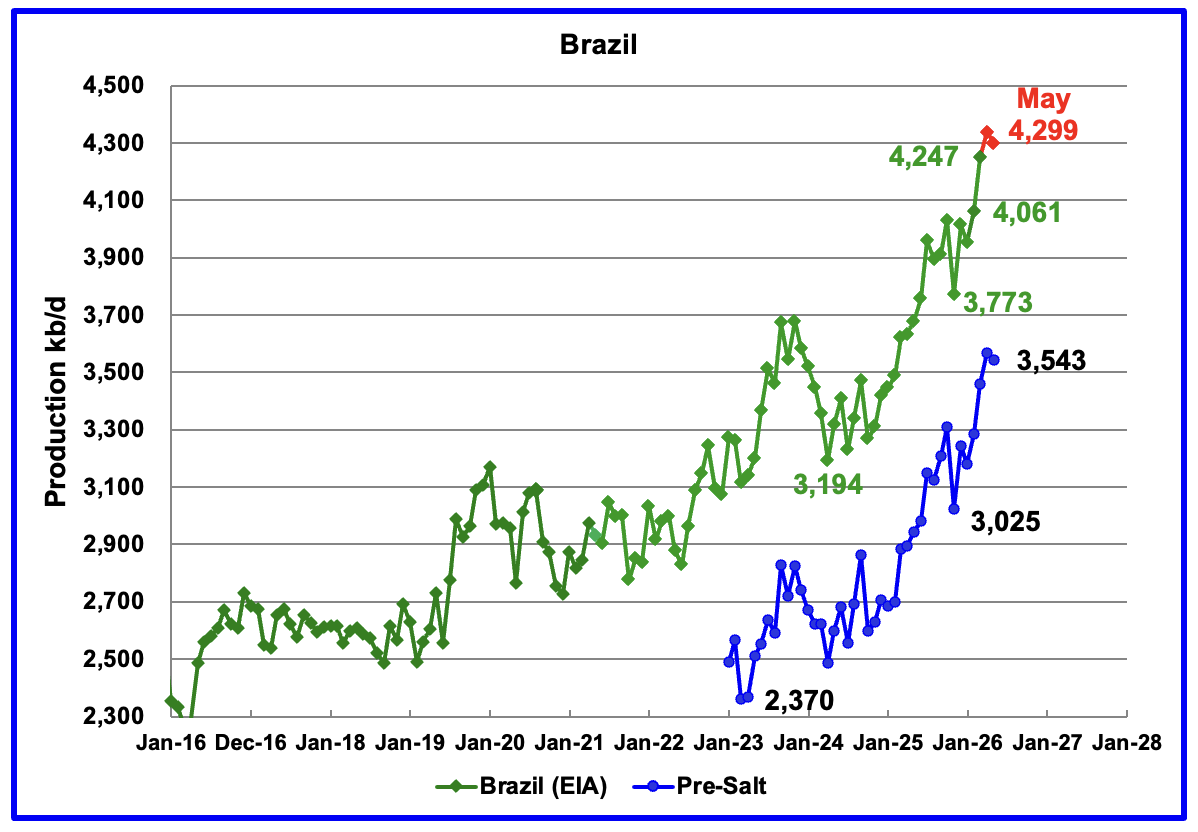
The EIA reported that Brazil’s March production rose by 186 kb/d to 4,247 kb/d, a new record high. According to this Article, the pre-salt reservoirs remained the backbone of national production, accounting for nearly 80 per cent of total oil and gas output.
Brazil’s National Petroleum Association (BNPA) reported that production rose in April to 4,337 kb/d, a new high, and then dropped in May to 4,299 kb/d.
Pre-Salt production was a major contributor to the March increase.
According to the July OPEC MOMR: “In 2027, Brazil’s liquids supply, including biofuels, is forecast to increase by about 110 tb/d, y-o-y, to average 4.8 mb/d.“
“Despite promising start-up plans in offshore Brazil, rising development costs and sustained inflation could tighten offshore project economics, leading to delays in final investment decisions and tempering near-term growth.“
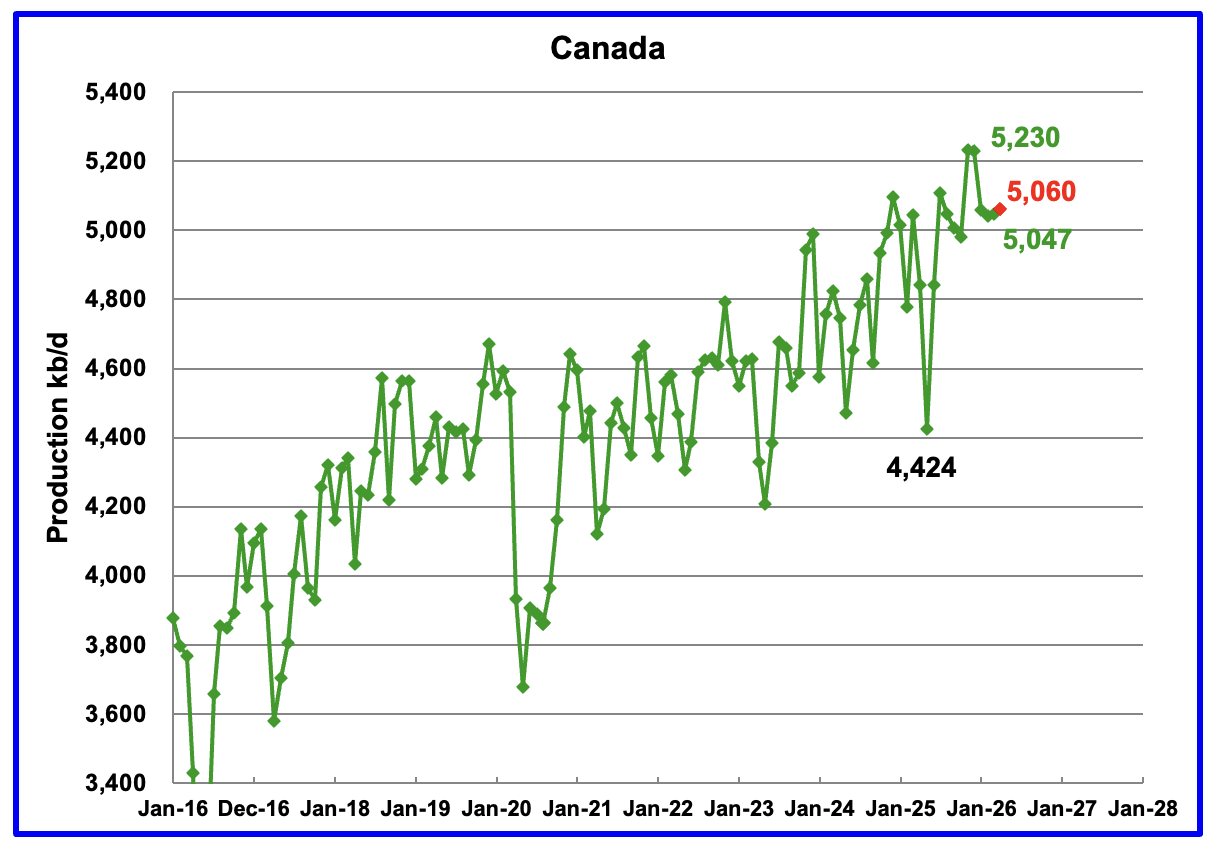
Canada’s oil production increased by 5 kb/d in March to 5,047 kb/d according to the EIA.
Canada’s January and February production was down due to unexpected downtime at a few oil sands companies. April production is expected to grow by 13 kb/d to 5,060 kb/d, red marker.
According to the IEA’s May OMR: “May is expected to see further losses as both the Syncrude and Suncor Base Plant upgraders have scheduled maintenance. Annual production is forecast to increase by 90 kb/d to 6.5 mb/d on average.”
According to this Article, President Trump signed an executive order to build a smaller version of the Keystone XL pipeline.
The pipeline, proposed by Canadian pipeline company South Bow (SOBO.TO) and its U.S. partner Bridger Pipeline, could increase Canada’s crude exports to the U.S. by more than 12% if it goes ahead. A presidential permit was required for the project to proceed.
According to this Article, Canada and Alberta have agreed to build a 1 Mb/d pipeline from Alberta to the BC coast.
“Prime Minister Mark Carney and Alberta Premier Danielle Smith have announced plans to build a new pipeline from Alberta to the British Columbia coast as a private public partnership.
The plan also calls for the new pipeline to be built following the corridor of the existing Trans Mountain pipeline, which is federally owned and runs from Edmonton to a terminal in Burnaby, B.C.”
While this pipeline will be welcomed by Alberta, it will not be clear sailing.
According to this Article: Environmental organizations are questioning why this pipeline should be built as the world is transitioning to renewable energy sources.
“Energy and environmental organizations are reacting with alarm to the recent Canada-Alberta deal to build a new oil pipeline to the West Coast, questioning whether overseas buyers can be found for the oil that may eventually flow through the pipeline.
The Alberta government’s proposal estimates the pipeline would cost $35.2 to $43.7 billion, with the federal and Alberta governments remaining majority owners in the project. That’s despite an earlier promise from Prime Minister Mark Carney — enshrined in his government’s memorandum of understanding with Alberta — that the pipeline would be privately financed.
“What we’re seeing here is that we’ve got a pipeline that is being built for political reasons rather than economic reasons. And that’s tremendously concerning,” said Chris Severson-Baker, executive director of Pembina Institute, the energy think-tank which has been working for decades on decarbonization in Canada’s oil industry.“
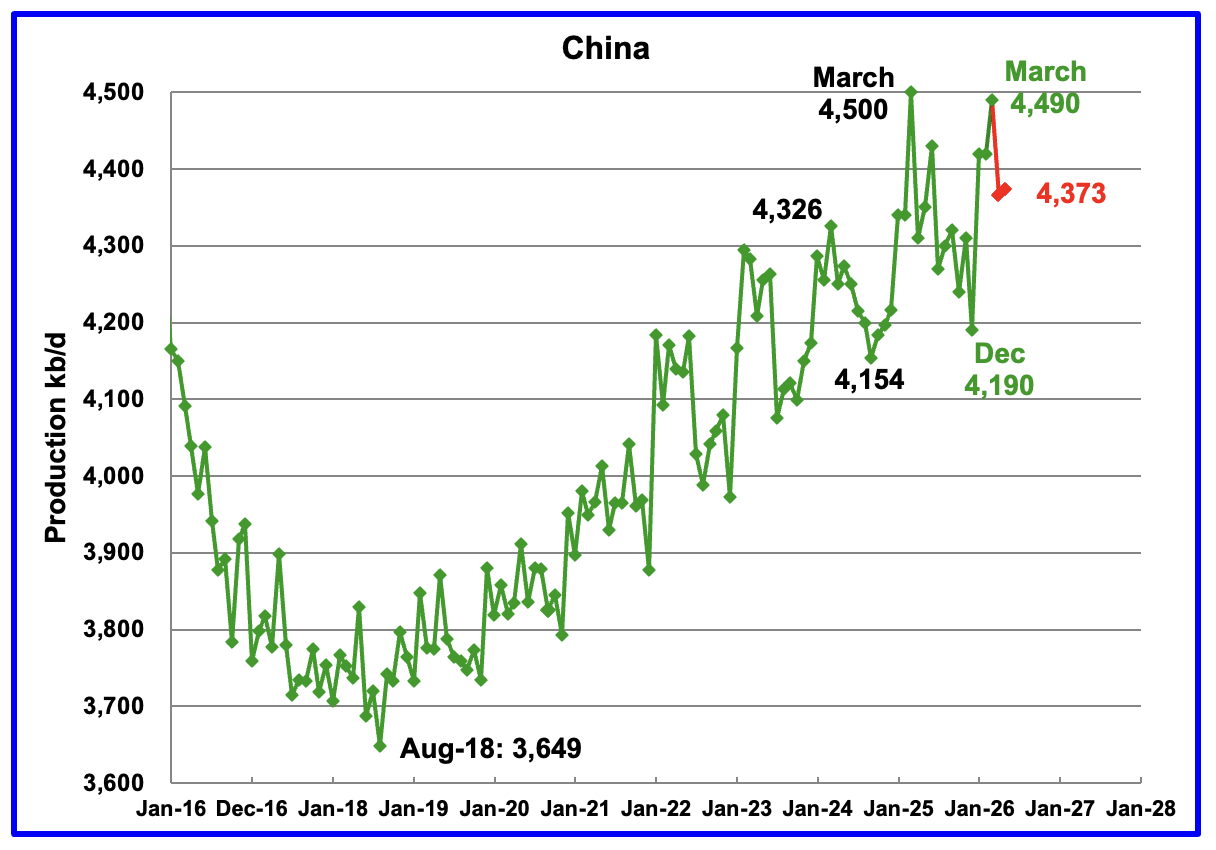
The EIA reported China’s March oil output rose by 70 kb/d to 4,490 kb/d. On a YoY basis, China’s March production down by 10 kb/d. For May, China reported average production of 4,373 kb/d, red markers.
For the last two years, March has proven to be a record production month. Again this year March showed a large gain but it did not exceed the March 2025 peak of 4,500 kb/d. Does this hint at an upcoming peak in China’s oil production?
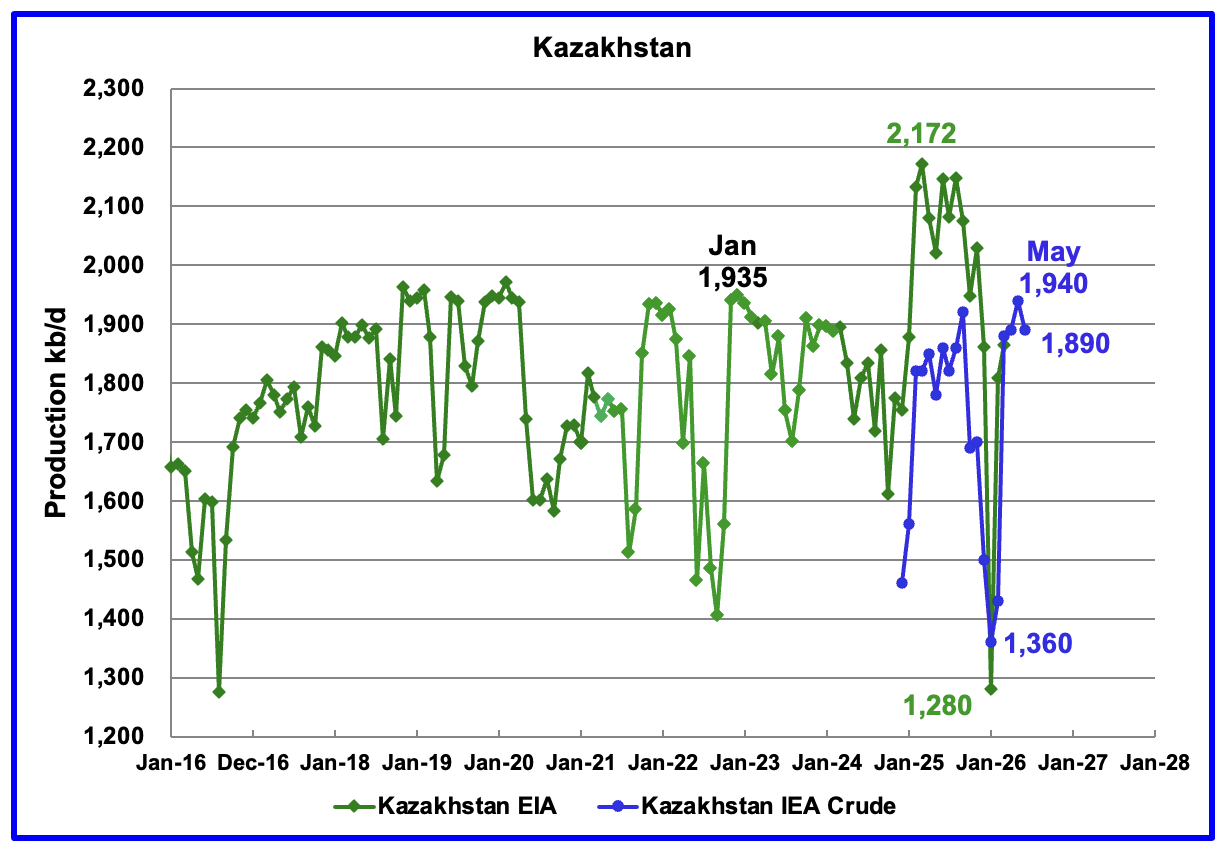
According to the EIA, Kazakhstan’s March oil output increased by 56 kb/d to 1,865 kb/d after the fire damage to the Tengiz oil field power generating plant was repaired. Production hit a low of 1,280 kb/d in January 2026.
Since Argus no longer reports OPEC + crude production, production data for Kazakhstan will now be taken from the monthly IEA reports. April production rose by 10 kb/d to 1,890 kb/d even though Kazakhstan was supposed to reduce production in April. The July IEA OMR reported that crude production in May rose to 1,940 kb/d and then dropped by 50 kb/d to 1,890 kb in June.
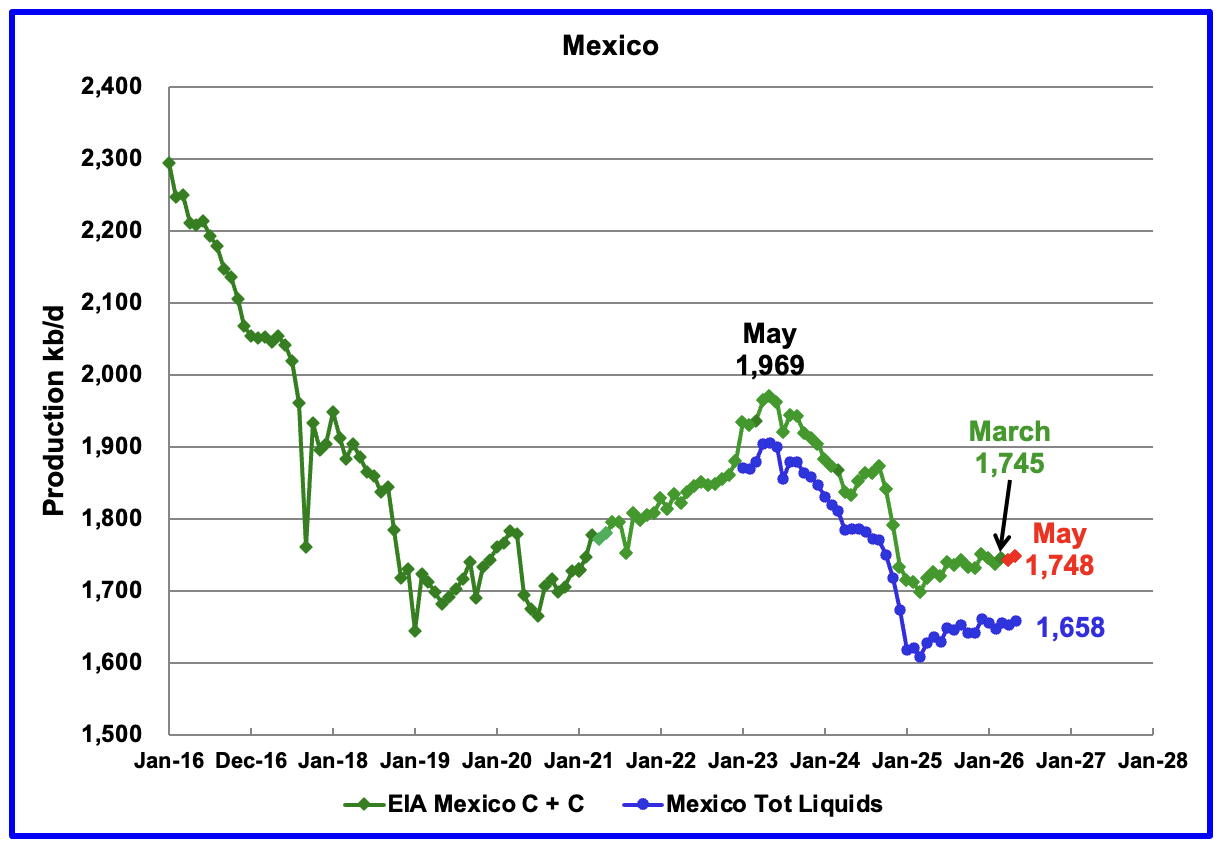
According to the EIA, Mexico’s March output rose by 9 kb/d to 1,745 kb/d.
In June 2024, Pemex issued a new and modified oil production report for Heavy, Light and Extra Light oil. It is shown in blue in the chart and it appears that Mexico is not reporting condensate production when compared to the EIA report.
In earlier EIA reports, they would add close to 55 kb/d of condensate to the Pemex’s “Total Liquids” report. More recently the EIA has been adding 90 kb/d of condensate to Mexican production. For April and May production, 90 kb/d have been added to the Pemex report. May production is estimated to be close to 1,748 kb/d, red markers. Note that Mexico’s production, as reported by Pemex for the last eight months has stabilized around 1,650 kb/d, blue graph.
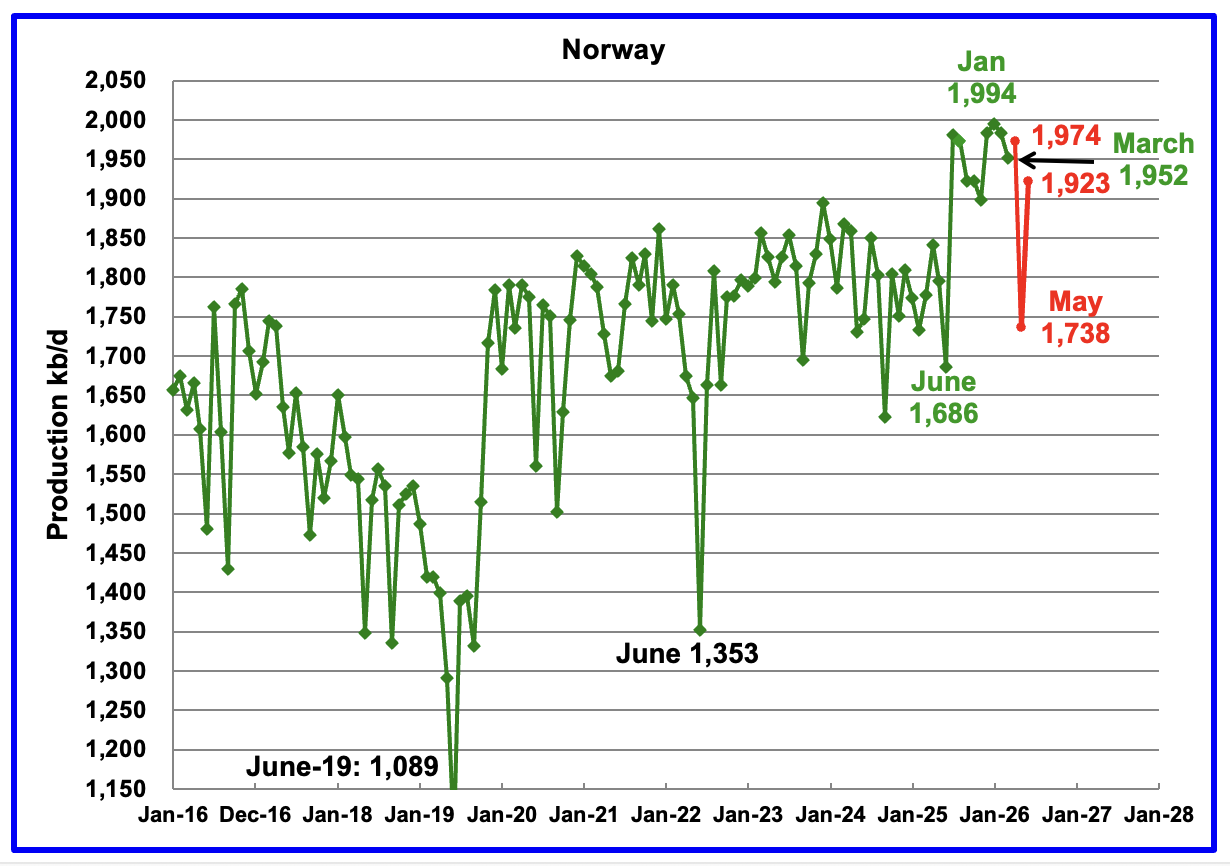
The EIA reported Norway’s March production dropped by 32 kb/d to 1,952 kb/d.
Separately, the Norway Petroleum Directorship projected that oil production in April will rise to 1,974 kb/d. It will then will drop to 1,738 kb/d in May before rebounding to 1,923 kb/d in June. The red markers are the NPD’s production forecast.
According to OPEC’s July MOMR: “In 2027, Norwegian liquids production is forecast to drop by around 70 tb/d to average 2.0 mb/d.”
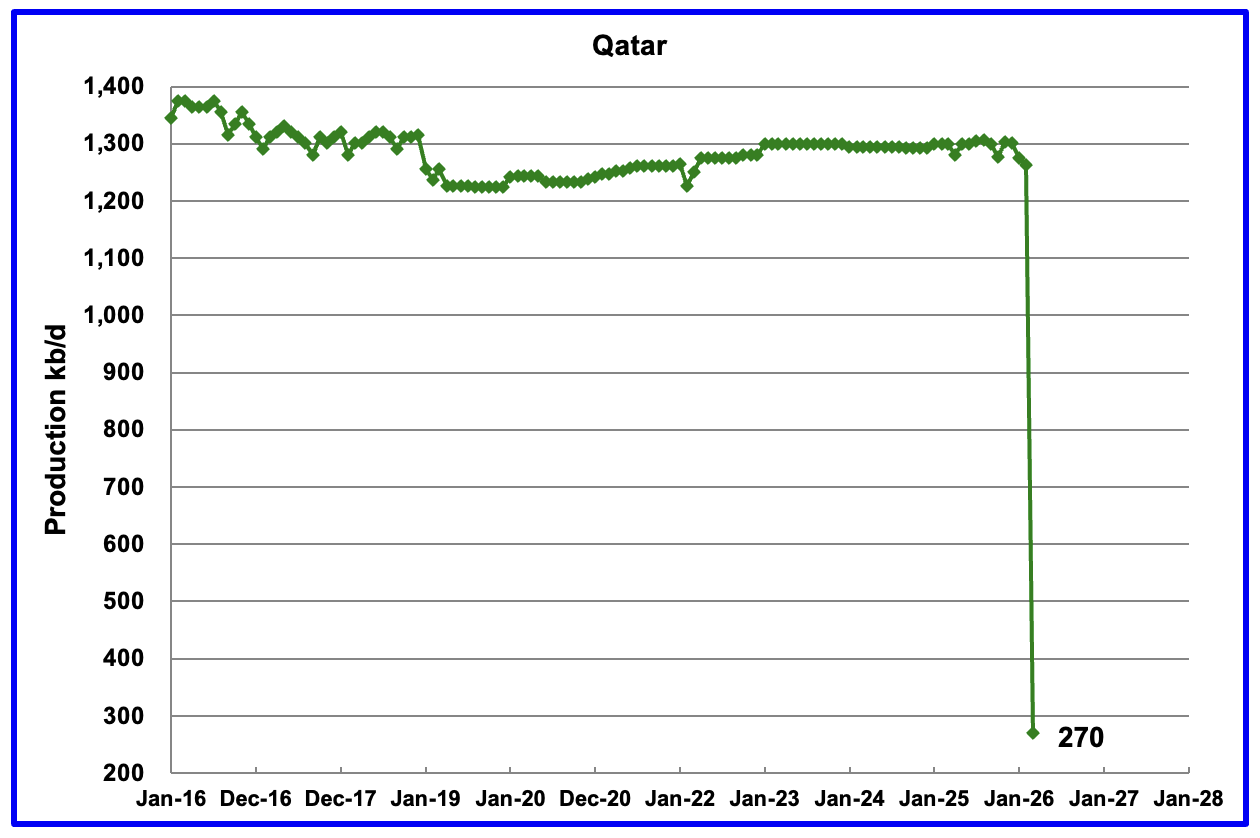
Qatar has restarted providing the EIA with monthly updated oil production. Qatar’s March output dropped to 270 kb/d due to the Iran/US war.
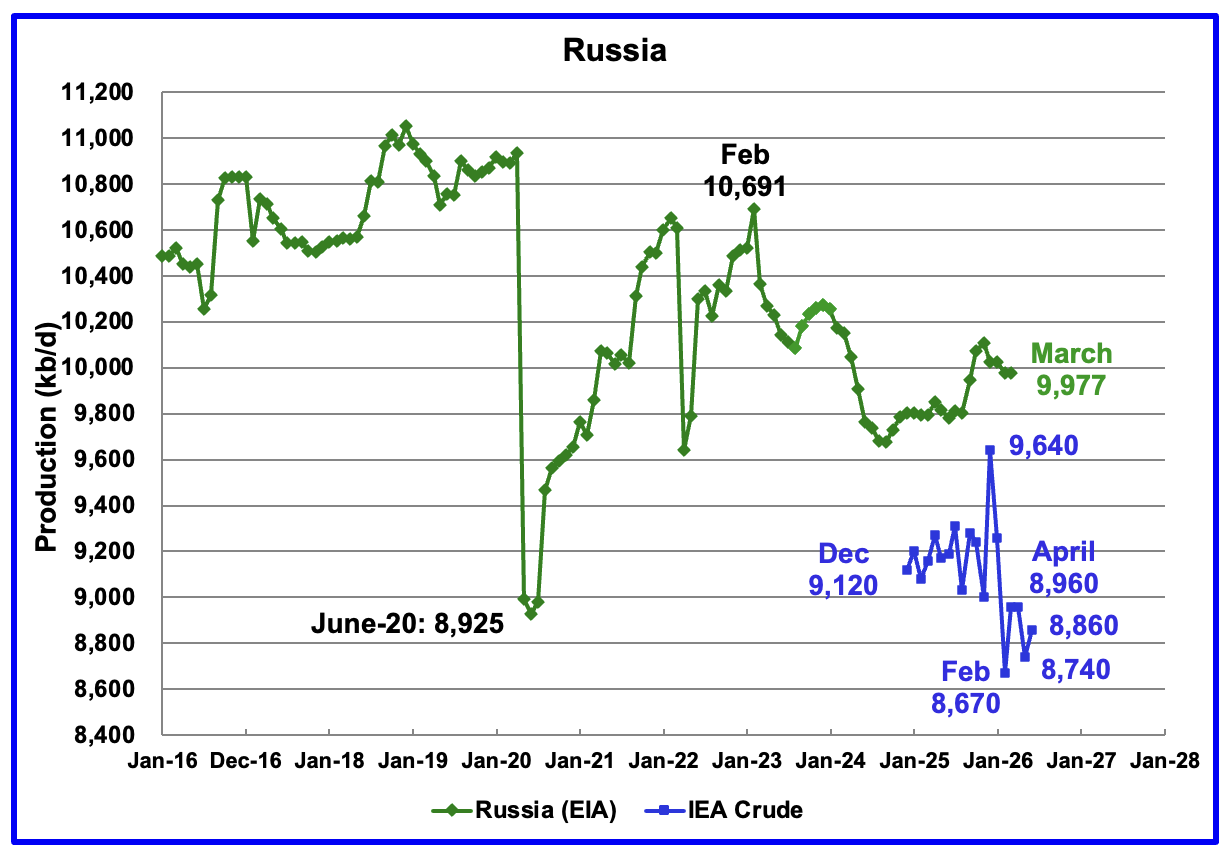
The EIA reported Russia’s March C + C production was unchanged at 9,977 kb/d and was up by 182 kb/d from March 2025.
The above chart also shows Russian production as reported by the IEA. It is difficult to assess the accuracy of the IEA report since in the past the IEA’s Russian production had been around 100 kb/d to 150 kb/d higher than Argus’ Media. The best that can be done at this time will be to compare the production trends between the EIA and the IEA. I think that Russian oil production continues to be a major state secret at this time because of the damage being caused by the heavy bombing to its related crude oil processing facilities.
The IEA’s July OMR reported that Russia’s May crude production was 8,740 kb/d and then rebounded in June to 8,860 kb/d. It is difficult to comprehend how Russian production is increasing in light of the reported intense bombing of Russian refineries.
The OPEC July MOMR is reporting Russian Crude production in May and June was 8,989 kb/d and 8,928 kb/d, respectively. For June, OPEC’s Russian crude production is 68 kb/d higher than reported in the IEA’s report. Clearly current crude production is down from the December 2025 high of 9,640 kb/d.
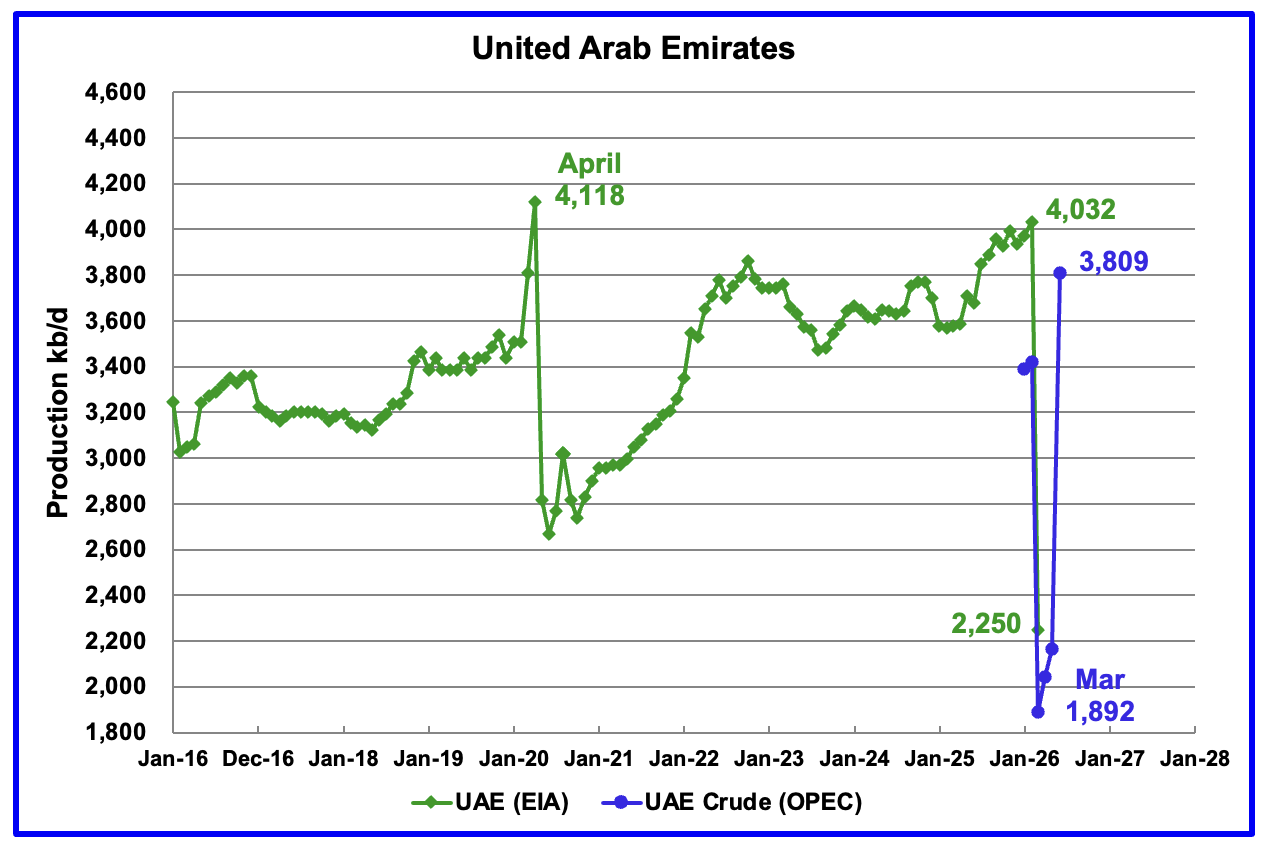
The above UAE chart is being added to the Non-OPEC charts since the UAE has left OPEC. The green graph is C + C production as reported by the EIA. The blue graph is crude production as estimated by OPEC.
The UAE left OPEC because it wanted to produce more oil now. It does raise the question of whether the UAE’s strategic thinkers are looking ahead to when oil demand will begin to fall and are concerned with being left with Stranded Oil Assets.
For March the EIA is reporting that production was 2,250 kb/d. OPEC reported that crude production bottomed in March at 1,892 kb/d. June crude production rebounded to 3,809 kb/d.
Comparing Crude production with C+C production for January and February, it appears that Condensate production is close to 600 kb/d. Potentially UAE C + C production could be in the neighbourhood of 4,400 kb/d in June, a new record.
This Article shows new pipelines being built to bypass the Straits of Hormuz.
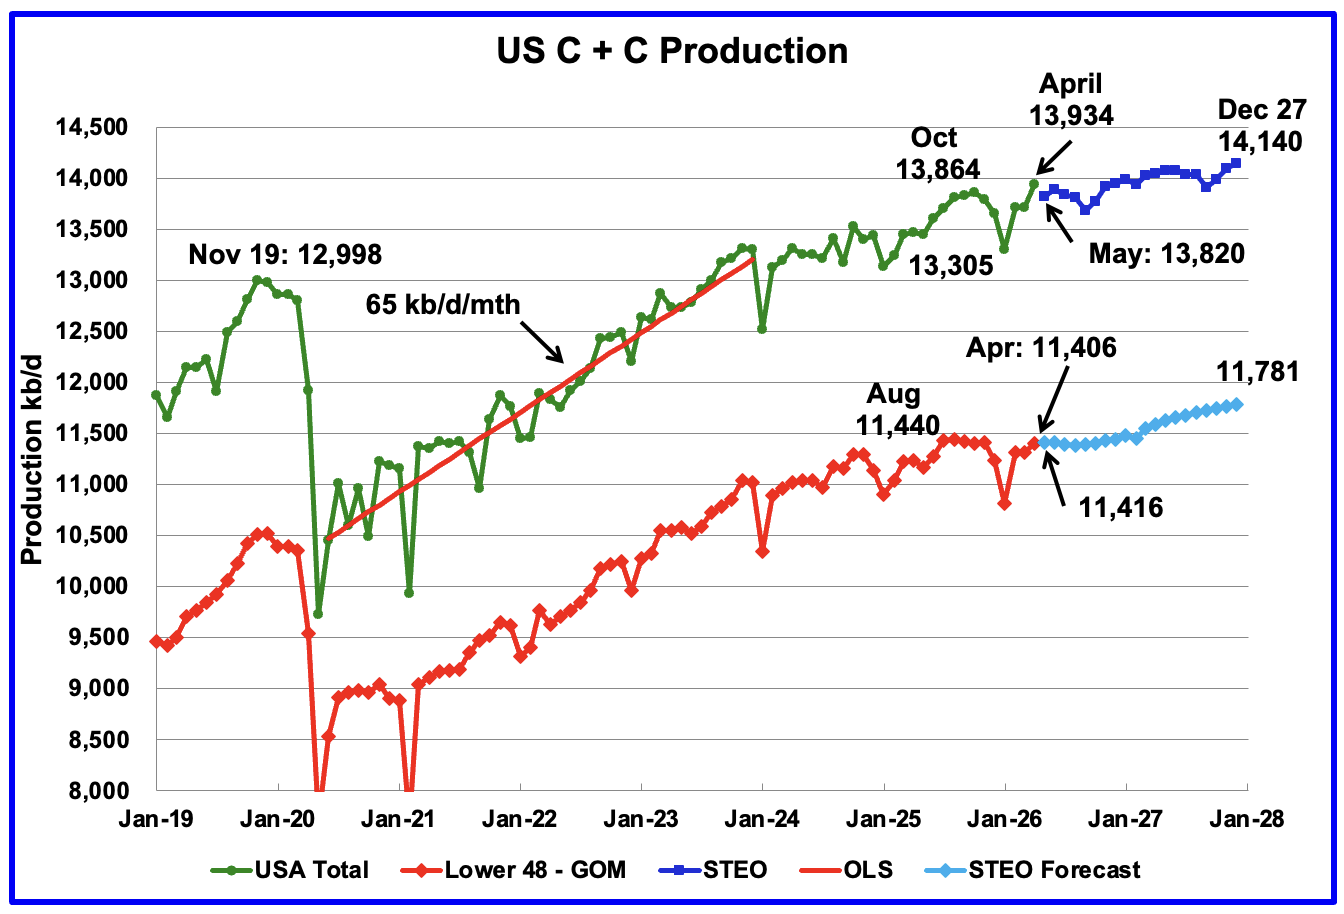
This US production chart showing output up to April 2026 is the same as the one published last week in the US Update.
95 responses to “March World Oil Production Collapses”
Have you heard the Good News?
=====
BREAKING: Trump Media to sell “faster millisecond access” to Trump’s Truth Social posts starting August 1, letting traders, hedge funds, and high-frequency trading firms pay for real-time millisecond access to Trump’s Truth Social posts.
10 Mb/day drop! WTI prices are a mystery to me.
The strategic reserves provide the difference. That’s why prices are still low. How long will that go well? I roughly estimate the strategic reserves of the world being 3 billion barrels. 1.7 billion of them are already compromised (compromised, because in the first weeks of the war, the oil that left Hormuz in time was still arriving at the ports and therefore no reserves had to be used – but they will be spent while waiting for the new deliveries, once transportation through Hormuz resumes). Anyway, we are already close to having USED UP half of the global strategic reserves. The second half will result much more complicated because reserves are not equally distributed: many storages will fall dry much earlier. So August could be the month when oil prices finally start to skyrocket.
the future will be certainly ”interesting”
Yes, so much comments on financial sites that living from reserves is the new drilling for oil – so nothing to see move on.
I think there is a lot of champagne on the oil paper markets to keep the prices down, from some buddies from Trump. Nothing worse for him than a real price blowout shaking up US pickup drivers. And in the countries where they drive pickups there is no alternative to cars. On the countryside even in my small Germany it’s almost the same – a bus 5 times a day or the car to get somewhere. And the bus does some expedition drive, connecting local schools.
So, this weekend and coming week it get’s interesting: Do they blow up the gulf? At some point even China needs to buy again, even when they lowered demand by a bit.
On another Location: Ukraine does a lot of target practice on the Russian shadow fleet. Round about 10 tankers get disabled or sunk every night now – even when most are small ones it adds up.
Really, a few Billionaires are going to control the world’s price of oil. That’s silly.
The Gulf diversion pipelines existing or planned are not immune to destruction, all well within Iranian or Houti missile and drone attack-
‘Middle East oil producers are building or contemplating seven pipeline projects that will bypass the Strait of Hormuz. Pipeline capacity in the Middle East could expand to cover more than 60% of the Gulf states’ pre-war oil export volume by the end of 2028, according to Goldman Sachs, pipelines are just as vulnerable to low-cost, asymmetric attacks by Iran as tankers transiting Hormuz, analysts said.’
https://www.cnbc.com/2026/07/16/oil-pipeline-iran-strait-hormuz-red-sea-iraq-uae-saudi.html
https://www.youtube.com/watch?v=lZt_B7aZ6hg
15 minutes
Iran provided JD Vance with evidence
That Kushner and Witkoff we’re placing bets on the Iran War.
550k right before the Ayotollah was assasinated.
And betting on oil industry
Must Watch!
https://www.youtube.com/watch?v=KKJjVHNIXPk
7 minutes
A Trump TACO is “buying the dip”.
Trumps recent stock purchases revealed.
This particular video doesn’t include anything related to OIL, but you can imagine the opportunities he sees.
Brent at $88/b on futures market, I imagine the spot price may be much higher, new data out from EIA next Wednesday on spot prices. Seems the MOU was a temporary respite as I expected.
I have seen comments from oil experts that suggest the oil price should be about $150/b.
These guys are seldom incorrect.
Dennis the big unknown is China,
I have seen reports where it is estimated that China has reduced purchases by 4 Mb/d. They are using their huge 1 B barrel SPR to control prices. Their only source of cheap oil now is Russia.
The contract they had with Venezuela is finished now that the US has taken that trade over.
I have to assume that very little oil is entering the market from Iran.
Things are starting to get spicy over there again.
Given how long Ukraine is dragging out, this could go on for years, with much of the world’s oil and gas breadbasket’s societal and industrial infrastructure in tatters.
Two digit oil prices are a gift, IMHO. Free lottery tickets, any takers?
Apparently not. People are busy buying AI tulip bulbs.
Hi Ovi & DC,
China will eventually buy again.
The oil loans from the US SPR will need to be repaid in kind plus interest.
Japan, Europe, and whoever else is still releasing oil from reserves will eventually stop and probably start refilling.
Things are going to get awfully interesting.
Once the ponzi (stock) market breaks down for good and the bear market grows claws, there will be less incentive to supress the oil price.
Buckle up, it’s going to be a wild ride.
there is rumor that Iran smuggled out 100s MBO to China thru Malaysia, and that’s why US bombed out the port outside SOH.
US bombed out the port outside SOH.->
Just for clarity are you referring to Jask Port?
News:
“Electrical facilities and desalination pumps at the jetty of Bonji village in Jask port, southern Iran, were subjected to missile attacks.”
Ovi,
Yes China is a bit of a black box. There are claims that they had petroleum stocks of 1 to 1.2 Gb prior to SOH shut down. If we assume a MOL for their stocks of 300 MMb, then they could potentially drain 700 to 900 Mb from stocks. If China has reduced their imports by 4 Mb/d or by as much as 11.5 Mb/d (crude import average level in 2025 for China) then over 150 days (March 1 to July 31) we might have seen a stock draw of 1.7 Gb with no imports of crude or 0.6 Gb if imports were reduced by 4 Mb/d. It is not clear that we know what China’s crude import level has been from March through July.
Found one piece suggesting about a 400 MMb stock draw for 1H2026. At some point China will increase its import of crude as the stocks won’t last indefinitely. In June the import of crude was around 4.5 Mb/d less than the 2025 average, so a crude stock draw of 135 MMb, if we assume about 400 MMb can be drained before reaching MOL (as about 400 MMb were drained in 1H2026) the 135 MMb per month drain would allow only 3 more months at the June rate of draw, so by September such a draw would need to stop. It is doubtful that China will choose to drain their stocks to MOL, so the June rate of draw is unlikely to continue.
THC,
it is the “Chabahar Port” very close to Pakistan, outside SOH, and built by India.
It is rumored that Iran already smuggled quite some oil tankers thru this port after Feb. 28th.
If China gets low on oil I suspect they will put massive pressure on Iran and US to back off on SOH disruption.
How would they pressure US? By restricting export of materials and products that the US is dependent on. Lots to choose from.
Chabahar Port news link
https://www.msn.com/en-in/news/world/us-targets-iran-s-chabahar-port-in-fresh-strikes-hegseth-shares-image-of-collapsing-watchtower/ar-AA286DAw
Not clear that much oil flows out of this port.
SW, DC,
Thanks for the info!
Looking at Chabahar on a map, it seems like a good location for ocean shipping to China and India, as well as providing a land route for India. According to this article, it also gave India a gateway to trade with Afghanistan (bypassing Pakistan) and central Asia.
https://www.newsdrum.in/analysis/indias-chabahar-bet-chinas-oil-play-face-the-cost-of-us-strikes-on-iran-12149975
Crazy how the tower looked crashing down.
It’s game ON over there.
All the retarted MSM guys selling the “all is fine” story…..I wonder how they will recalibrate with this epic fail.
Hi Hickory!
“If China gets low on oil I suspect they will put massive pressure on Iran and US to back off on SOH disruption”
~~~~~~
Here’s an interesting take on Iran’s strategic importance to China:
https://substack.com/home/post/p-207538058
“Beijing has no love for Tehran’s theocracy. It has something far more durable: a structural need for Iran to survive. That need is not sentimental. It is geometric.”
“Every barrel of Gulf oil China imports by sea, and it imports enormous volumes, transits chokepoints the US Navy can close at will: the Strait of Hormuz, the Strait of Malacca, the South China Sea passages. This is the Malacca Dilemma that Chinese leaders have named in their own strategic writing, the knowledge that America can strangle China’s energy supply without firing a shot at a Chinese target, simply by closing a strait six thousand miles from Beijing. That is the cage. Two walls of water and a hand on the valve. And Iran is the one key that opens it, not from the sea, where America is strongest, but from the land, where America cannot reach.”
“The July 2026 campaign has concentrated on Iran’s coastal and port infrastructure, and specifically on the nodes that face China. Bandar Abbas, Iran’s largest commercial port and the principal artery through which goods move between Iran and China, has been struck repeatedly. Kharg Island, the terminal that handles roughly 90 percent of Iran’s oil exports, the overwhelming majority of it China-bound, was hit, a tanker steaming toward it was disabled under the reinstated blockade this week, and the American president is now openly weighing seizing the island outright, remarking that “we have other people that will do the ground campaign for us.” **Chabahar**, the eastern port, was struck too. Read the target list and the pattern is unmistakable. The campaign is not only degrading Iran’s military. It is severing the physical infrastructure that connects Iran to China. The strikes are aimed at the key.”
***The Belt and Road is the tunnel out***
“This is the reason that outweighs all the others, and it is the one that turns Iran from a partner into a necessity. Iran is the land bridge across the Eurasian plain that lets China’s overland corridors bypass the island chains entirely.”
“Understand what that means physically. Rail and pipeline running through Iran allow Beijing to move energy and goods between China, Central Asia, the Gulf, and Europe without touching a single sea lane the US Navy patrols. The Belt and Road, in its deepest strategic logic, was never only an economic development scheme. It was a tunnel dug under the walls of water, an overland escape from the maritime cage, and Iran is the load-bearing segment of that tunnel, the hinge that connects the Chinese west to the Gulf and the Mediterranean beyond it. This is the Mackinder logic that Anglo-American strategy has organised around for a century: whoever controls the Eurasian heartland threatens the maritime power’s dominance, and Iran is the southern gate of that heartland.”
“A partitioned Iran shatters the corridor. Break Iran into successor states, wire its infrastructure to Western reconstruction contracts, and the tunnel collapses. The cage America spent three generations welding shut re-locks, and China is sealed back inside its littoral with the hand returned to the valve. Beijing will not fund its own re-imprisonment. No power that spent a decade and a trillion dollars digging an escape tunnel will stand by while the exit is filled with concrete. That single fact, more than oil, more than ideology, more than any deal, is why China cannot let Iran fall.”
Hi THC-
Yes those consideration are one piece of story, and conversely the US cannot let China fail due to maritime supply restrictions to the point where they see it as necessary to take retaliatory action against us for the disruption.
We are heavily dependent on their factories and various materials supplied for very important parts of our industry/military.
I am not at all confident that Trump is capable of operating in this sphere as a smart adult, even if he happened to have good intentions.
Hi Hickory,
Yes indeedy.
Everyone’s supply chains are heavily dependent on China. They can’t just be eliminated from the global economy………
Not sure where this all goes.
If this is really about the Great Game and global domination, the US will lose the waiting game. Which means roll the dice on a full-on escalation/conflict sooner rather than later? Added bonus of getting to reshuffle global society and likely achieve a radical drop in population.
Preparations already quietly underway?:
1. Section 535 of the FY2026 NDAA mandates that, effective December 18, 2026, the Selective Service System will automatically register every male resident of the United States aged 18 to 26. The registration mechanism uses existing federal databases at the Social Security Administration, the Internal Revenue Service, and the Department of Homeland Security to identify, locate, and register draft-eligible males without requiring any action on their part.
2. On April 20, 2026, the US Army raised its maximum enlistment age from 35 to 42 under Army Regulation 601-210. Perhaps the 18-to-35 cohort is no longer projected as sufficient for what is coming??
Rig Report for the Week Ending July 17
The dropping rig count that started in early April 2025 when 450 rigs were operating had another big increase this week. The rig count broke out from the previous steady rate of 367 ± 5 rigs per week since August 2025.
– Today WTI closed at $82.49/b, up from $70.24 last Friday. This higher price may be attracting more drilling.
– US Hz rigs + DRigs rose by 8 this week to 446.
– US Hz oil rigs rose by 7 to 415, down 35 since April 2025 when it was 450. It was also up 53 rigs from the low of 362 first reached in the week ending August 1, 2025. The rig count is down 9% since April 2025.
– The New Mexico Permian Hz rig count added 2 to 87. Eddy was unchanged at 54 while Lea added 2 to 33.
– Texas added 2 to 215. Midland was unchanged at 22 while Martin added 2 to 25. The biggest changes occurred in Reeves where 2 rigs were dropped to 22 and in Martin where 2 were added to 25.
– Eagle Ford was unchanged at 36.
– NG Hz rigs added 1 to 106.
– Directional rigs (Drigs) rose by 1 to 31. Both Eddy and Lea county were unchanged at 1 respectively. Texas Drigs added 1 to 4. Note that a few weeks back Directional rigs were reclassified to Hz rigs.
A Rig
Frac Spread Report for the Week Ending July 17
The frac spread count dropped by 4 to 196. From one year ago, they are up by 22 spreads but are still down by 19 since March 21, 2025.
A Frac
Futurewize? Market control? AI slop financed by who?
Predicting growth offshelf GOM/GOA and peak in top shale plays?
https://www.youtube.com/watch?v=w_mAqzrsvYI
The winter wheat harvest in the USA is the smallest since 1970 and the hard red winter wheat harvest in the USA is the smallest since 1957.
However, wheat prices haven’t went up all that much given the historically small harvest.
Kind of like crude oil.
Per Bloomberg the total crude stocks in the USA are down to 43 days coverage, the least days coverage for the USA since EIA began tracking this statistic in 1982.
Yet the crude oil market is meh.
Shallow Sand,
The Oil Market has its head in the sand it seems. Mike Shellman has said recently he is surprised oil isn’t at about $150/b. I am also surprised. I follow the wheat market less closely than oil, is the US exporting much less due to Trump’s tariffs?
2025-26 wheat marketing year ended 5/31/26. US wheat exports were 871 million bushels, up 15% from the prior year and the highest since 2020-21.
It does appear worldwide wheat production has been historically high, which is maybe why the price reaction to the poor US wheat crop has been muted.
Thanks Shallow Sand. Don’t we need to wait for the harvest to know the crop is poor? Or is the forecast low due to low levels of planted crop?
Here’s more info on winter wheat.
https://farmpolicynews.illinois.edu/2026/06/us-winter-wheat-crop-smallest-since-1965-usda-says/
The majority of USA wheat is winter wheat and has been harvested.
Thanks Shallow sand. Didn’t know that.
“July 20 (Reuters) – Yemen’s Iran-aligned Houthis said on Monday they were imposing a naval blockade on Saudi Arabia, a move that opens a new front against the United States in its war on Iran and widens the threat to global energy supplies and trade beyond the Gulf….
… The full closure of the Bab el-Mandeb strait would reduce global oil supply by 7% as it would leave most of Saudi oil exports unable to leave the region. The disruption would add to the huge cut to global oil flows from the war in the Gulf, which has already reduced shipments by 10% of global supply.”
https://www.reuters.com/world/middle-east/us-launches-iran-strikes-ninth-day-another-american-confirmed-killed-2026-07-20/
It is surprising how little the oil market has reacted to this news. Perhaps it is waiting for news of actual attacks on Saudi oil tankers?
The Saudi export hub at Yanbu on the Red Sea is only 1/2 as far as Israel from Yemen. Yemen has already shown they can strike that far with missiles.
Could get much hotter on the Chile scale, if they choose to escalate that far.
Hickory, that or they simply close the choke point direct before their homes. It should be enough when they drone a few tankers. Then the only escape route is the Suez Channel – not well suited for delivering Asia.
The oil prices are much too calm at the moment – lot’s of action on the paper market to keep it silent.
Sooner, rather than later, reality will set in and world oil markets will react to the lowest inventory levels in 40 years, a U.S. SPR that is worthless, 6-8 MM BOPD of ME supply off the market, an escalating war in Iran and a tight oil phenomena that is hanging on by an economic thread. Oil prices will rise. In the mean time we should all be deeply worried that a few people in the world can manipulate the price of oil in the face of such uncertainty. I have never seen anything like this in 60 years.
Dennis, please, what is your take of total UR to date for unconventional tight in the US since 2010 and the same question for Permian Basin tight oil, specifically. Thanks.
With this paper market manipulation I fear the next time I drive to the gas station I get a paper bill signed with “40 Liter high quality Diesel” for my money.
This way they don’t need any oil wells anymore – only wallstreet money.
Eulenspiegel,
Yes, no worries, you can just burn their colored paper slave money as fuel. Keep a shopping cart full of it in your trunk!
https://www.youtube.com/watch?v=H0OTg3aZc-Y
Thanks, Dennis.
Mike,
You’re welcome. The data on horizontal well output is based on Novilabs data from Enno Peters. The EIA data (for all tight oil) comes from spreadsheet at link below from the EIA.
https://www.eia.gov/outlooks/steo/xls/Fig42.xlsx
The crude market prices availability today, which includes 400 million or whatever number of barrels the various SPRs around the world pledged to release when trump blundered into this “situation”. So it isn’t pricing geology or infrastructure, it is pricing politics.
But the distillate market is pricing the deficit of sour crude coming from the gulf; the deficit of refined product from there, AND the increased demand from the US military, which together are driving up middle distillate prices and hence the record crack spread.
Crude price is the TACO bet, i.e.: reserve stocks will last longer than trumps courage. Problem is, just like in most things, it is now pretty much out of his hands. He was never “in control” except in as much as he could screw things up. Think about his health care plan or infrastructure week or White House remodel: he is extraordinarily good at tearing shit down.
That is the problem when you elect an idiot who thinks he’s a genius. The POTUS isn’t as powerful as he and his cult thought it was. It’s like Dunning/Kruger applied to government. He’s proving, day by day that a POTUS can do way more harm than good, irreversible harm.
Turns out it was complicated, who knew?
Sounds like a familiar theme-
“Nobody knew that health care could be so complicated,”
Trump announced this during a bipartisan White House meeting with the National Governors Association early in his tenure.
Who new that it would be useful to have trustworthy relations with allies?
A few thoughts:
I’m reading that Ukrainian attacks on Russian refineries are reducing the supply of oil products worldwide, and raising prices.
The destruction of competent government by this president isn’t a bug, it’s a feature. The oil industry knows that government, the science establishment and higher education are all sources of FF regulation and a push for a transition away from oil/FF. So…it’s pushing to suppress, intimidate and cripple all three things. Very bad for the US and the world, but it helps prevent oil from becoming a stranded asset, and maybe allows current investors to retire and diversify before the transition really takes place.
Now, the Iran war is indeed a good example of this president’s pure incompetence. He’d like to blame Israel, but I suspect that in addition to simple domestic politics his main M.E. client was KSA, which hates, fears, and hates Iran. Remember the $2B gift to his son-in-law? I also suspect that KSA was smart enough to know this war was too risky, but got on board when assured that it would work. This assurance came, of course, from a president and a SecDef who had no idea what they were doing. Now all are regretting it…
This is no longer the 20th century folks.
‘Chinese heavy equipment brand Tonly just signed a deal to deliver 800 autonomous, “New Energy” mining trucks to Xinjiang Hanxiang.
Tonly’s DTE145 is a massive, 90-tonne-class rigid haul truck fitted with a 770 kWh swappable battery pack (up to 1,200 kWh is available) from CATL that sends power to a 620 kW (~830 hp) electric drivetrain. The DTE145 is designed around a battery-swap system that can replace a depleted pack in about seven minutes, making it ideal for quick driver swaps between shifts.’
They are not messing around.
Definitely not.
China is planning to electrify just about all land transportation. Even aviation has potential: a company called Beta has reached a range of 500 km.
The funny story is that the mine is on top of a hill, and so the battery power truck does not need recharge, just converting gravity energy to electricity.
Thanks for sharing Hickory.
Interesting to see this after reading recent reporting an Australian direct diesel fuel subsidy worth >$600M/yr is slowing BHP fleet electrification in WA.
Yet another reminder of the power of vested interests when coupled with:
1. Their strategic dependence on something like 80 to 90% imports for diesel
2. Dramatic progress in PV and battery storage
I could see the advantage of EVs a few years ago on The Peak in Hong Kong. The taxis chugging up the hill in second gear and riding the brakes back down compared to the Teslas smoothly zipping up and recharging on the way back down.
May ND Oil Production down by 16 kb/d
A ND
It looks like my hypothesis about KSA is in the right area: apparently this president is proposing to give KSA nuclear power plants with enrichment and little inspection.
Insanity.
It’s far worse than the arrangement given to the Shah of Iran, which has led to our current predicament of an Iran with nuclear weapons potential. That was under very similar circumstances – the Shah was an ally….what could go wrong???
It’s also far worse than an arrangement considered by the Biden administration, which would have excluded enrichment, included tight inspections and moved the M.E. much close to peace by requiring KSA to recognize Israel.
MBS has stated that if Iran gets nuclear weapons that KSA will get weapons ASAP.
Insanity.
I’m not a fan, but the president had it on pretty good authority that the Iranians had purified Uranium to 60%, which is only a few weeks, apparently, from weapons grade, and the mullahs had been shouting “Death to Israel” for almost five decades. Nuclear annihilation of the seat of Christianity, as well as Islam, would be to tear out the heart of the world–no matter one’s religious views. What would you do if you were president? Just let the threat slide? That’s what every president has done for those five decades, and now the very finest intel available says the religious fanatics have almost enough purified uranium for a nuclear warhead.
Anyone who has ever done anything as a profession that is complex and requires a team knows that you have to trust your people. Mr. Trump is getting piss-poor intel from his Sec of Energy. The guy is purportedly a crackerjack engineer but not much of a geologist or reservoir engineer, as everyone who even dabbles in oil and gas is keenly aware of the drop in tight oil reservoir pressure, the rising GOR, producing so much of a NG glut that you have to either flare or pay someone to have it piped away, putting future oil production in a precarious position. Yet he is the person entrusted by the president. The president had to also trust his source that told him Iran is only a few weeks away from getting weapons grade nuclear. Not one of us knows whether or not that intel was solid.
In my 37 years in medicine, I recall only three times when someone I trusted let me down. I had to take it in stride and keep on trusting the “team” that I relied on. Frankly, I don’t think the president had much alternative but to act as he did. Like everyone here I am a Monday morning quarterback, but the Iran situation has its own dark twists and turns. Watching it is like trying to get Odysseus back home to Penelope. I am cheering him on, because this is America, and that’s what we do.
I’d really appreciate it if we could keep the forum focused on petroleum production and consumption, and avoid the side excursions examining the political history of the middle east and whether or not to trust the Trump team.
There are other forums around for commenting on politics.
Gerry,
Everyone agrees that Iran having nuclear weapons is a very, very bad idea. The problem is the extraordinary incompetence of everything this president has done in order to prevent this.
First, in his first term he killed an agreement with Iran that took years to develop, and that is far better than anything that is now being negotiated. It was a decent agreement – not perfect, but decent. It kept the genie in the bottle reasonably well. This president killed it with no consultation, no input from the real experts. That decision put us in our current situation.
2nd, the current war is incredibly badly planned and managed. Everyone has been aware of the danger of Iran closing Hormuz, back to Jimmy Carter. Perhaps you noticed my discussion with Mike just 2 weeks before the start of this attack – I pointed out that the Strait created a danger that should have pushed people to move to electric transportation long ago. Was I psychic? No, just aware of an obvious danger that every half-decent military strategist knew about, except…this president and his SecDef.
The last 2 months has been farcical – the president has declared victory dozens of times, threatened the end of civilization for Iran a number of times – he would be a laughingstock if he didn’t have the US military behind him. He’s like a toddler with a machine gun – no one has respect for him, but they’re afraid of the damage he’ll do.
Now the US is reduced to a Hail Mary – bombing Iran and hoping that for some reason they will surrender. They have no plan, no clear goal…clearly the president simply wants a fig leaf to allow him walk away with dignity – that was the purpose of the MOU – and sadly the Iranians simply are not willing to find a way to let him do that. That’s mostly because they know how untrustworthy he is. They know that what they want in the MOU would be politically toxic to the president’s followers, and he’ll try to weasel out of them. So they want them up front. And…we’re in another one of the forever wars he campaigned against.
Let’s be clear – this president likes to surrender. He surrendered in Afghanistan, though he timed the exit for Biden’s term. He surrendered (or tried to ) in Ukraine. He cares far more about domestic politics than he does about the threat of nuclear weapons proliferation – that is being demonstrated by the current proposal to give a path to nuclear weapons to Saudi Arabia!
————
Is this discussion directly related to oil? Yes, of course. The big question right now is how long the Strait will be closed, and the president’s actions and strategy directly control that.
So…what forecast comes from the analysis above? It suggests that this war, and the closure of the strait, will last a long time. What might convince the president to go home, despite the embarrassment? Maybe $150 oil…
Please. Speak for yourself gerry.
Many of us here saw the writing on the wall well before the big game. Friday morning forecasters rather than your Monday morning quarterback role. The actions of this administration pertaining to energy (and other areas) have all been well within what was to be expected.
Dr. Gerry, you and I have had our differences, sorry. I was in the oil and gas business for over 60 years.
For the record you must realize this forum has nothing whatsoever to do with domestic oil and gas matters in the US anymore, nor geopolitical matters across the world that would otherwise correlate to the forum’s title, Peak Oil Barrel. It is an outlet for progressive, anti-oil, anti-America, anti-God, liberal dung heap, little more. Dung heap means horse shit for all you urbanites from Portland, or Seattle.
Nick G has diligently tried to control the content of the blog for a decade. He is has been relentless. Dennis has now allowed it. None of these guys no shit about oil and gas in the world; nothing. Particularly you, T. Hill. Where in the world did your moral or intellectual high ground come from? Walmart? The self serving analysis of all of you having “predicted” the outcome of the ME conflict is a joke. I laughed at that.
Would you trust what you know about Nick G, or Hickory, to prevent Iran from having a nuclear weapon that would disrupt oil supply from the ME for the next 50 years? I would not trust anyone of those wanks to saddle a horse. Not one of them have the guts to even use their own name on a public forum.
This is just a great place to spew hate regarding Trump, and America, nothing more. Gerryf, whomever he, or she is, is correct.
Dennis & Ovi ( Ron? hope he is ok ).
Do this for free…
Dennis is more optimistic than me…But quite honestly has been more accurate than me…
Who gives a shit?
@gerrfyf – Bigly Trump is having a HUGE influence on oil prices…WTF?
Gerry M. as much as I’d enjoy jousting on the points you raise DC has removed the Non-petroleum forum where identity politics and caustic invective often set the tone.
note there is Gerry Maddox and gerryf in this thread. A comment referring to gerry might be to Gerry Maddox or gerryf it is unclear.
I guess FoxNews forgot to mention that 20 million barrels of oil and refined products use to travel though the Strait of Hormuz everyday. Before the want to be king became a war criminal.
The realization that Iran could disrupt or control the Strait of Hormuz has been a core pillar of military and geopolitical strategy for decades, dating back at least to the Iran-Iraq War in the 1980s, when both nations actively targeted oil tankers in what was known as the “Tanker War.
“Historical Context of the Threat:
1980s (The Tanker War): During the conflict with Iraq, Iran first demonstrated and utilized the capability to use small boats, missiles, and asymmetric tactics to threaten commercial shipping and oil transit in the Persian Gulf.
2011–2012 (Sanctions Standoff): Under President Mahmoud Ahmadinejad, Iran explicitly threatened to legally and militarily close the strait in response to Western nuclear sanctions, cementing global awareness of its geographic leverage.
2018 (US Withdrawal from Nuclear Deal): President Hassan Rouhani and military commanders renewed threats to block the waterway after the U.S. withdrew from the JCPOA and reimposed strict oil sanctions.
Strategic ShiftAsymmetric Power:
For years, military analysts viewed Iran’s capability as a theoretical threat of disruption via sea mines, anti-ship missiles, and fast-attack craft rather than permanent administration of the waterway.
2026 Conflict: Following direct military escalations in early 2026, Iran transitioned from merely threatening the choke point to actively enforcing selective passage, deploying sea mines, and setting up de facto transit rules through the Brookings analysis.
Who wouldn’t have guessed or known ? Hillary Clinton called them Deplorables
Brent futures up to $95/b as I write this (July 22 at 3 PM EDT). The Brent spot price is probably above $100/b.
@ SPR to 70 million barrels?! @
For the first time in this crisis I felt real fear for what is coming when I saw this news.
Any ideas where they are taking us?
~~~~~~~
The DOE says it can draw down the SPR to 70 million barrels (Mb). This comes from the DOE’s own documents that proposed leaving 10% in each cavern.
https://x.com/chrismartenson/status/2079922384723673490?s=46
“A DOE spokesperson tells MarketWatch the SPR’s true operational floor, set by “cavern mechanics,” is roughly 70 million barrels”
(I have not yet found this video clip, if anyone find it, please share it here)
https://x.com/MarioNawfal/status/2079699189014139343?s=20
Apparently folks who care about national security have designated 250 Mb as a floor with 150 the floor before damage. Maybe Mike Shellman has an opinion.
Hi Lee!
Yes, the numbers you quoted were what I thought were considered minimums for good reserve maintainance and military preparedness.
70 Mb seemed to just jump out of no where.
Recently the SPR draw rate has slowed (why borrow oil at $70 to pay it back over $100 with interest?) — it would take a long time to reach 70 mmbbl.
Perhaps this is a strong hint the US is prepared (planning?) to continue the war for a long time as well?
Just a guess.
THC, I wouldn’t interpret the DOE statement of 70 M barrels to mean the “US” was planning anything as much as the DOE being a tool for the administration’s gas lighting rhetoric. Don’t want people to panic, etc. Magic hand of the marketplace will fix that then the panic begins.
Robert Pape has been studying and modeling the dilemma with Iran and the Strait for years. Good long interview here: http://www.youtube.com/watch?v=cxJgLJGHsWc
TL; DW
Trump gave away the store via the MOU, he said explicitly because there was only 4 weeks oil reserves left (that was 4 weeks ago). But then immediately he started to renege because the memo gave control of the Strait to Iran and Oman. And since Iran would eventually control all access to the Mediterranean, Red Sea and the Gulf via the Houties and Hezbollah. So now he’s stuck: either escalate and gamble with the world economy or own the loss.
I think peak oil has been rendered irrelevant.
https://youtu.be/eF1GpPYE_OI
It’s been nice knowing you all. Your work is appreciated, but now it has been superseded.
MB
The guy says people have been desensitized to the risk. That is the biggest thing in my mind, people have no idea. Peak oil was a hoax, climate change is a scam. Once we got in our heads that we’re the largest producer, people just went right back to Happy Motoring like 1969!
Feels just like ’08 to me. People allocated their paychecks elsewhere and simply have little slack for what might be coming down the pike. Can’t blame them, all the talk about war and gas price has only gone up a buck.
But once all the SPRs of the world are drained to whatever level their owners deem bottom, these pump prices will be the good old days. And if the other actions the guy mentions take place expect rationing, by price for sure but by other means likely as well.
PO was always about politics and flow rate.
Was just looking at our two companies’s financials for the first six months of the year.
Our average price per barrel for oil sold December, 2025 through May, 2026 (paid January 2026 through June 2026) was $75.43.
Of course, it’s been a crazy ride since February 28, 2026.
My point is that for all of the disruption in the Strait of Hormuz, Russia and now the Red Sea, the average price our company has received the first 6 months of 2026 has been very average and similar to the price in 2023 and 2024.
It’s way below 2007-08 and 2011-14. Lots of inflation since then on other goods and services.
If these events are truly earth shattering, the oil markets sure aren’t reflecting it. As I type this WTI closed around $92. That is really not all that high.
Now, the crack spreads are out of sight. Therefore gasoline and diesel prices ARE high.
But $4 gasoline isn’t all that high IMO, especially with what is going on right now.
Shallow sand,
Yes in inflation adjusted dollars (2026 $) we have often seen gasoline in the $5/gallon to $6/gallon range, so current real gasoline prices are not very high in historical terms. This may change with less oil flowing from the Middle East. Interesting times.
Brent futures price now at $100/b. As World stocks continue to deplete and no solution is found for the Hormuz problem we may see a continuing rise in oil prices to perhaps $150/b or higher.
Difficult to foresee how this will play out.
Its hard to picture a scenario where most countries in the world don’t become more and more disillusioned with the US. We are costing most people in the world an awful lot of money. I don’t think anyone appreciates the erratic and intensely arrogant behavior.
Hi DC,
With Hormuz mostly resolved (closed) for now, we are moving on to the next major chokepoint, BAM.
“Agence France-Presse citing the International Chamber of Shipping: Ships are receiving Yemeni warnings that they will become targets if they do not comply with the armed forces’ decision.
At least 9 ships have turned back from crossing Bab al-Mandab after Saudi Arabia’s announcement of a blockade, including oil tankers from Yanbu.”
Oil glut shills who told the world all is well in energy supply land just because a few ships got through after the MOU should be publicly tarred and feathered.
Oil Glut Shills Gallery Candidate:
Doomberg/Green Chicken AI Voice Man
07:16 – Long-Term Outlook: Oil Price Collapse to $25–$30 After the War
https://www.youtube.com/watch?v=ouWPpSlCbdE
“Peak cheap oil is a myth”
“There is effectively an infinite supply of natural gas in the US”
https://www.youtube.com/watch?v=fh4NugAd4SI
Oil Glut Shills Gallery Candidate:
Javier Blas
https://x.com/JavierBlas/status/2067162216155992552?s=20
@IEA sees the return of an oil glut. The Paris-based agency warns of higher-than-normal uncertainty about its supply and demand forecasts, but with expected Hormuz reopening, by this time next year, it sees too much oil — again.
Has anyone come across a better, current review of BAM risks than the pieces below?
https://www.cfr.org/articles/another-hormuz-the-red-seas-threat-to-the-global-economy
https://www.lloydslistintelligence.com/resources/blog/red-sea-brief-23-july-2026
Also wondering if anyone has a good source for a risk evaluation of Fujairah to closure from Iranian strikes.
As best as I can tell from open source reporting, CPC tanker loadings are still suspended and Sheskharis is too now on the Black Sea. Perhaps 2mbpd between the two?
It is looking like the above-ground risks are continuing to rise.
Hi T. Hill,
BAM is definitely a key chokepoint.
Here is an interactive map of global chokepoints, there are other good ones easily available as well:
https://ryanshook.org/chokepoints/
Michael Yon has been talking about the issue of chokepoint closures for years now, although I only recently noticed his work (I came across it after Hormuz closure).
A couple of key points I just noticed:
1. As of July 2026, the top two exporters of oil via BAM are Saudi (4 ~ 6 million bpd) and surprisingly Russia (roughly 2 mmbbl/day from the Black Sea and Baltic ports through the Suez Canal and BAM to reach buyers in India and China).
2. Essentially ALL of the Saudi oil through BAM is loaded at Yanbu.
If Iran/Yemen decide to go full on against Saudi exports, it might be easier for them to simply destroy the facilities at Yanbu.
I’d be interested if anyone finds good analysis of the risks of Yanbu being taken out.
Yanbu/BAM:
Ruh-roh………..
July 24, 2026
A Houthi military official said earlier that Saudi forces had attacked the port of Hodeidah, warning the kingdom it would face retaliation.
He added, “they have opened the gates of divine hell upon themselves.”
https://www.thenationalnews.com/news/2026/07/24/houthi-official-says-saudi-strike-targets-hodeidah-port-after-attack-on-saudi-vessel/
At least five Yemeni ballistic missiles targeted ARAMCO oil facilities in the Jizan industrial zone, resulting in widespread fires and explosions within the Saudi energy hub — Multiple OSINT reports.
~~~~
Houthis make Saudi Arabia’s oil coast burn
Ansar Allah launched a new wave of missile strikes on Jizan, Saudi Arabia, with footage circulating online showing large fires raging in the city, Naya reported.
Power outages were reported in several areas, while Arab sources said more than five explosions shook Jizan, Fars News reported.
Other reports pointed to direct impacts at Aramco facilities, with the likely target identified as the company’s marine terminal near Jazan City for Primary and Downstream Industries.
Rig Report for the Week Ending July 24
The dropping rig count that started in early April 2025 when 450 rigs were operating had drop this week. The rig count broke out from the previous steady rate of 367 ± 5 rigs per week since August 2025 and may be creating a new steady state rate between 410 rigs/wk and 415 rigs/wk.
– Today WTI closed at $89.31/b, up from $82.49 last Friday.
– US Hz rigs + DRigs dropped by 2 this week from 446 to 444.
– US Hz oil rigs dropped by 1 to 414, down 36 since April 2025 when it was 450. It was also up 52 rigs from the low of 362 first reached in the week ending August 1, 2025. The rig count is down 9% since April 2025.
– The New Mexico Permian Hz rig count was unchanged at 87. Lea was unchanged at 33 while Eddy dropped 1 to 53.
– Texas dropped 2 to 213. Midland dropped 3 to 19 while Martin added 1 to 26. Other big changes occurred in Reeves where 3 rigs were dropped to 19 and Andrews added 3 to 11.
– Eagle Ford was unchanged at 36.
– NG Hz rigs added 1 to 107.
A Rig
Thanks Ovi. There may be a typo on your chart for the Permian where it shows -11 for most recent week. Maybe it should be -1 for horizontal Permian oil rigs. From 252 last week to 251 for w/e 7/24.
Dennis
Thanks. Yes it should be -1
Corrected Chart attached
A Rig
Frac Spread Report for the Week Ending July 24
The frac spread count rose by 2 to 198. From one year ago, they are up by 30 spreads but are still down by 17 since March 21, 2025.
A Frac
Chart with Permian Basin Directional plus Horizontal Oil Rigs from Baker Hughes spreadsheet at link below using a pivot table on weekly count
https://rigcount.bakerhughes.com/na-rig-count
Keep in mind that the increase in rig count that started in early May will only affect output starting in December 2026, assuming a 7 month delay between spud and first flow from a new well.
Chart at link below
permian rigs
Alternative chart for Permian horizontal plus directional rigs with zero scale (more similar to Ovi’s chart) at link below. count was at 236 at the end of April and rose to 256 last Friday (8 days ago, July 17).
permian rig2
These Are the 10 States With the Lowest Obesity Rates
State
Obesity Rate
Colorado
24.6%
Hawaii
26.8%
Massachusetts
27.1%
California
27.7%
New York
27.9%
New Jersey
28.5%
Vermont
29.0%
Connecticut
29.2%
Florida
29.7%
Montana
30.2%
essentially progressive
These Are the 10 States With the Highest Obesity Rates
State
Obesity Rate
West Virginia
41.7%
Arkansas
40.5%
Mississippi
40.4%
Louisiana
39.9%
Alabama
39.4%
Oklahoma
39.0%
Iowa
37.9%
Kentucky*
37.8%
Indiana
37.8%
Tennessee
37.8%
anyone see a trend?
Reuters is reporting Houthi claims that they successfully struck both Jizan and Yanbu.
Another completely unpredictable surprise.
Looks like TAME (Trump Always Manages Equities) is falling apart.
For those interested in reading the full flowery announcement from the Yemeni Armed Forces:
https://t.me/me_observer_TG/1054607
“In response to this heinous (Saudi) criminal aggression,
the Yemeni Armed Forces carried out two qualitative military operations; the first targeted sensitive targets of Aramco facilities in Jizan with dozens of ballistic missiles and drones, while the second operation targeted sensitive targets belonging to Aramco in Yanbu with a number of ballistic missiles, winged missiles, and drones.”
“We affirm that imposing a naval blockade on the Saudi enemy continues as a response to its reciprocal aggression and ongoing unjust siege for twelve years. ”
If we have the Hormuz + BAM closed for most of this year (= 10 mmbbl/d drop in global production) possibly overlapping with a flattening/peak of US shale, is it possible we are witnessing THE peak?
How long will the GCC nations survive in their current form?
If Iran is irritated sufficiently, and if closing the Hormuz/BAM to GCC transit is not enough to deter further attacks, I wonder if they might start going after the GCC infrastructure (electrical grids, desalination, ports, oil/gas production).
Given the GCC nations’ dependence on desalination, successful attacks could generate domestic crises and potentially lead to a paniced population seeking to escape the country and/or civil unrest.
Gulf Energy Pain Map: Above-Ground Chokepoints in the Iran Conflict
https://www.atlaspeakresearch.com/report/c2d6d6
A new post is up at link below
https://peakoilbarrel.com/opec-monthly-oil-market-report-july-2026/
https://www.dailymail.com/news/article-16006247/Oil-tanker-explodes-Strait-Hormuz.html
Oil tanker explodes after colliding with a mine in SOH