By Ovi
All of the Crude plus Condensate (C + C) production data for the US state charts comes from the EIAʼs Petroleum Supply monthly PSM which provides updated production up to April 2025.
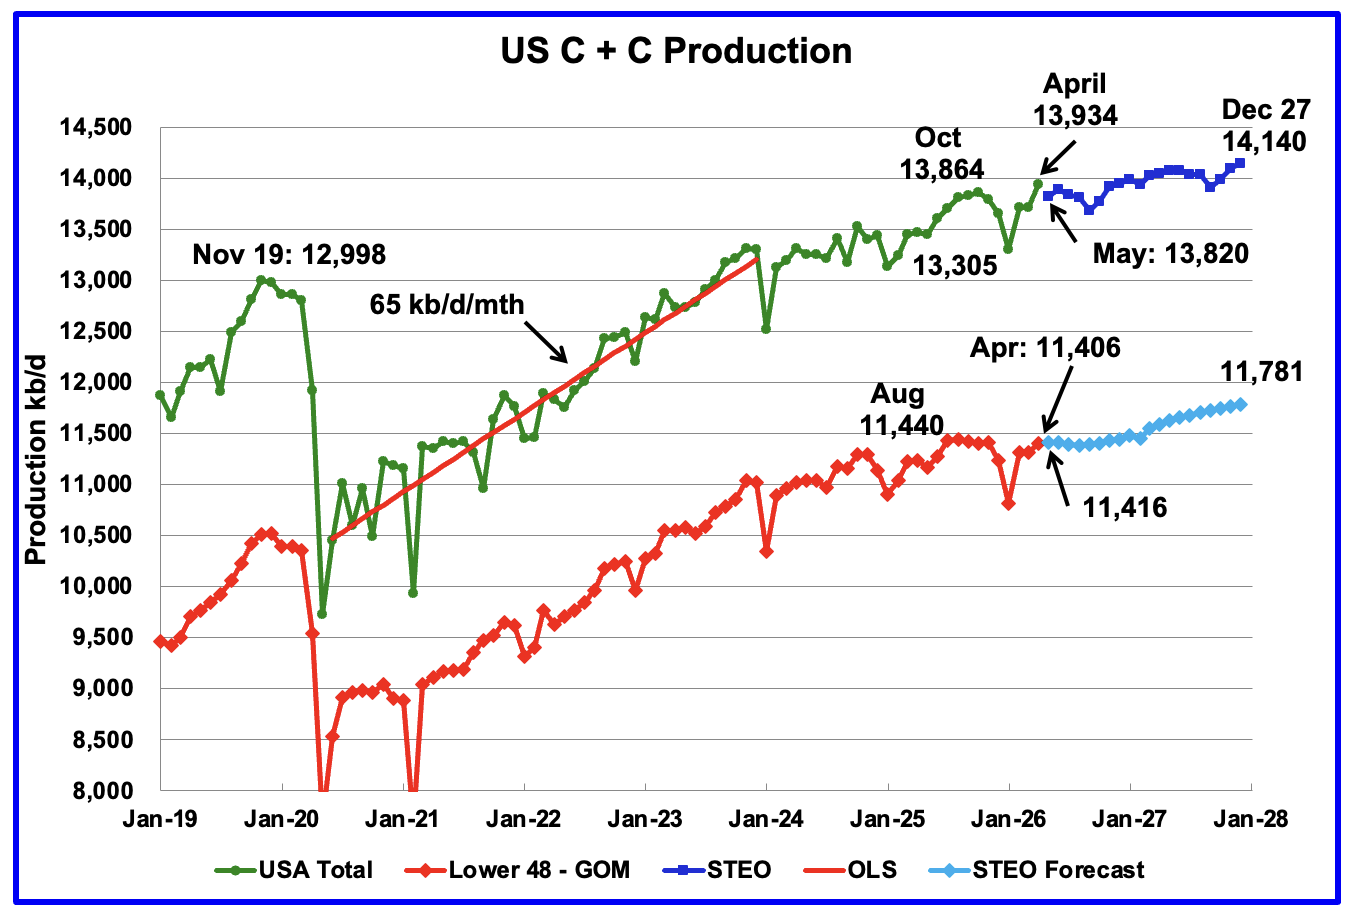
U.S. April oil production increased by 216 kb/d to 13,934 kb/d and is another record high. The largest increases came from TX and NM. May production is expected to drop by 114 kb/d to 13,820 kb/d according to the July STEO. The previous Peak US oil production occurred in October 2025 at 13,864 kb/d but now going forward will be in new high territory after January 2027 according to the STEO forecast.
The dark blue graph, taken from the June 2026 STEO, is the U.S. oil production forecast from May 2026 to December 2027. Output for December 2027 is expected to rise to 14,140 kb/d, downwardly revised by 270 kb/d from the US chart posted in the June World update. The new forecast may be reflecting lower WTI prices. From April 2026 to December 2027 U.S. oil production is expected to increase by 206 kb/d.
The light blue graph is the STEO’s forecast for the Onshore L48 output to December 2027. April Onshore L48 production increased by 93 kb/d to 11,406 kb/d. From April 2026 to December 2027 production is expected to increase by 375 kb/d to 11,781 kb/d. Note how production is essentially flat out to January 2027. The 2027 production increase may be due to the recent addition of 20 Hz rigs in Eddy county. Check Eddy county further down.
U.S. Oil Production Ranked by State
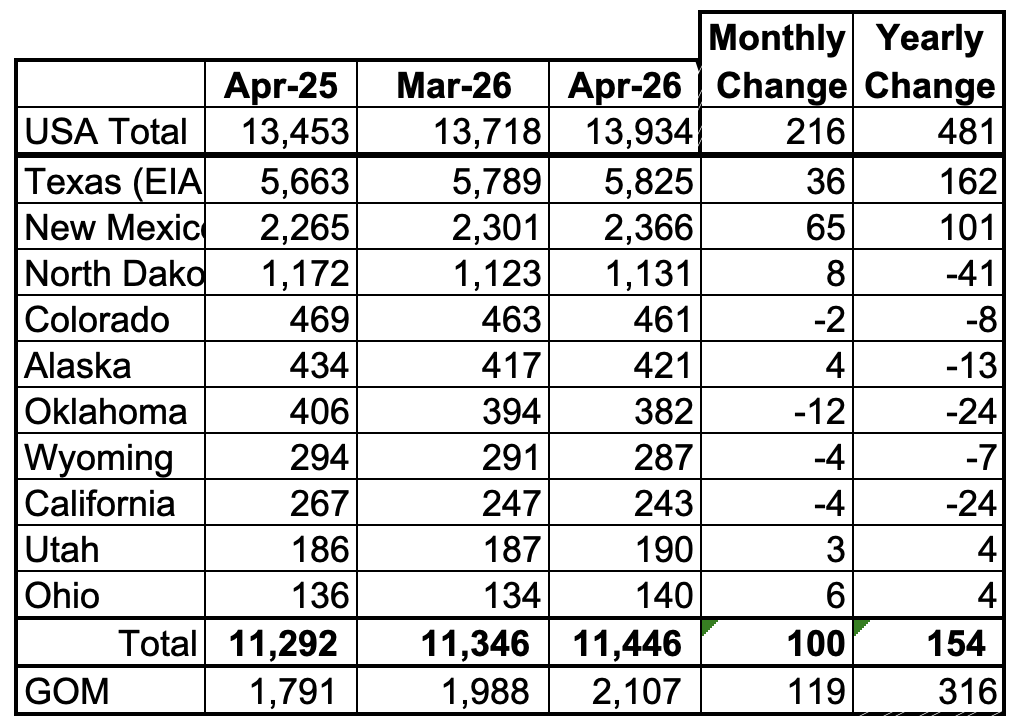
Listed above are the 10 US states with the largest oil production along with production from the Gulf of Mexico.
These 10 states accounted for 82.1% of all U.S. oil production out of a total production of 13,934 kb/d in April 2026. On a MoM basis, April oil production in these 10 states rose by 119 kb/d. On a YoY basis, US overall production increased by 481 kb/d with the largest contributors being Texas and New Mexico and the largest decliner being North Dakota.
State Oil Production Charts
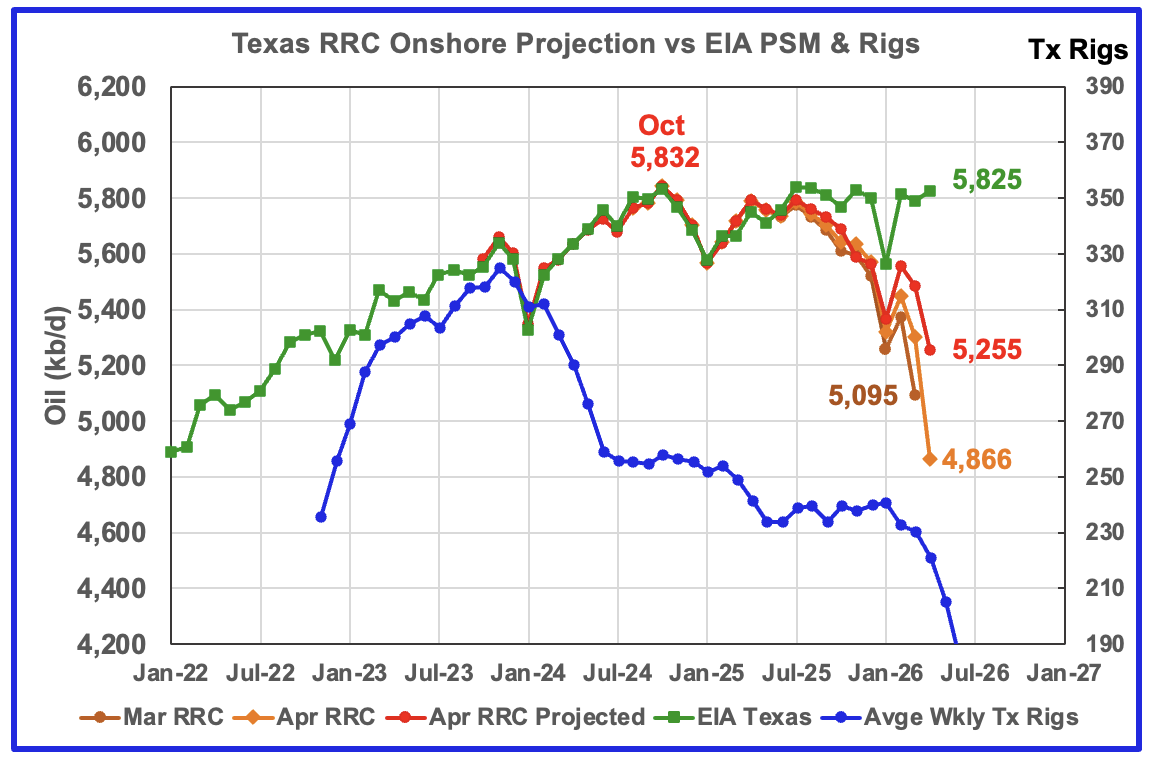
Texas’ April oil production increased by 66 kb/d to 5,825 kb/d according to the EIA. YoY production rose by 162 kb/d.
The Texas’ RRC initial production for April, orange graph, dropped by a significantly large 439 kb/d from March to 4,866 kb/d. The projection only added 514 kb/d to the April initial production to raise it 5,255 kb/d. The divergence between the EIA and the projection is due to much smaller upward revisions to March production in the April report, brown graph, which results in the very large discrepancy of 570 kb/d between the EIA and the projection
The red graph is a production projection using the preliminary March and April Texas RRC data.
The blue graph shows the average number of weekly rigs reported for each month shifted forward by 10 months. So the 276 rigs operating in July 2023 have been shifted forward to May 2024. From February 2024 to July 2024, the rig count dropped from 312 in time shifted February 2024 to 256 in July 2024. That drop of 56 rigs had little impact on production up to July 2025. August 2025 appears to be the first month when the impact of the start of the flat rig count results in essentially flat production. Will the dropping rig count starting in time shifted February/March 2026 result in dropping Texas production going forward?
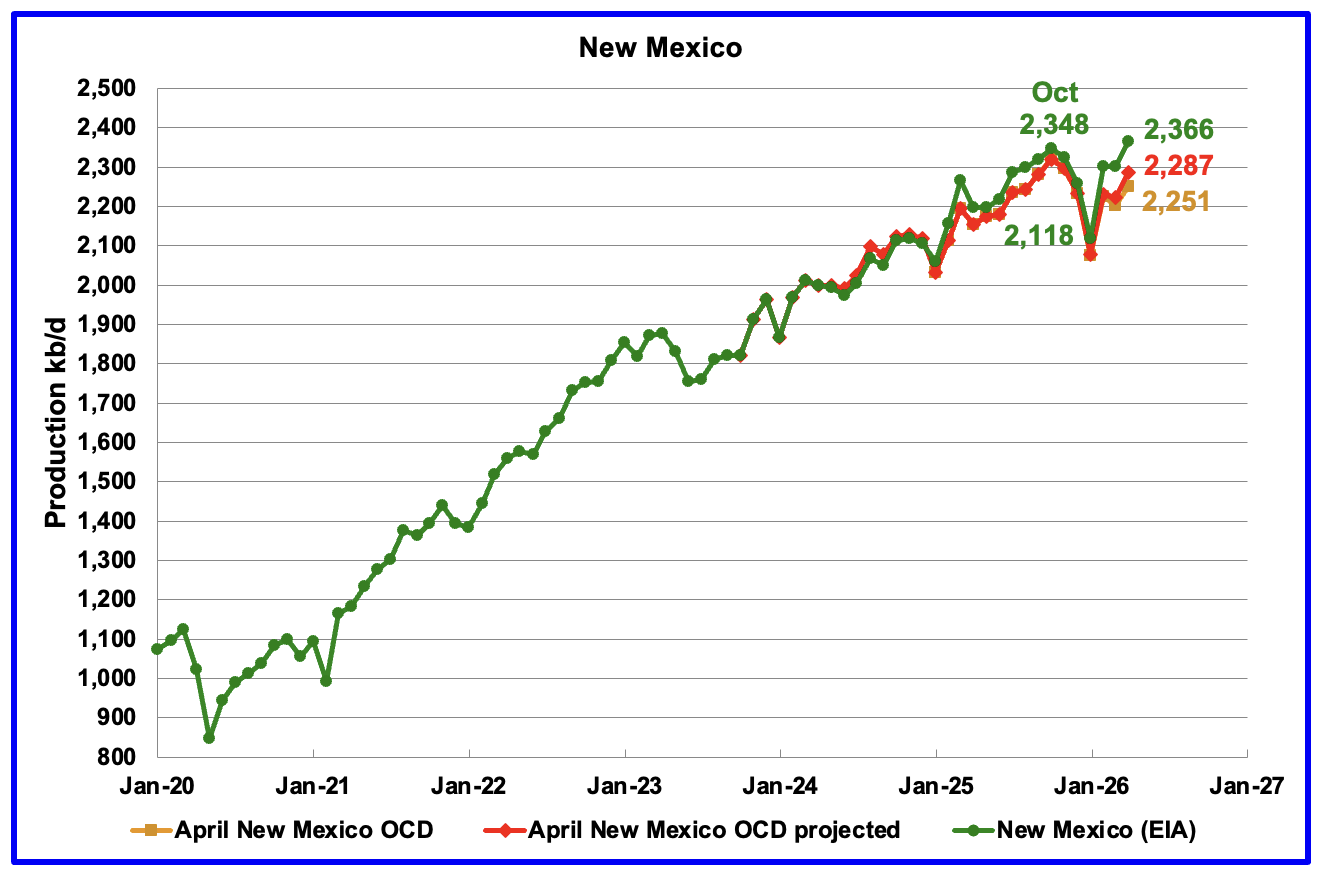
According to the EIA, New Mexico’s April production rose by 65 kb/d to 2,366 kb/d. YoY production rose by 101 kb/d, second only to Texas.
The red graph shows NM’s projected output up to April and is calculated using the preliminary March and April NM OCD data. April projected production increased by 48 kb/d from March to 2,287 kb/d and is 79 kb/d or 3.3 % lower than the EIA’s reported April production. While the EIA and projection numbers are slightly different, the trend is the same.
Production in both Lea County and Eddy County rose. See Permian section further down.
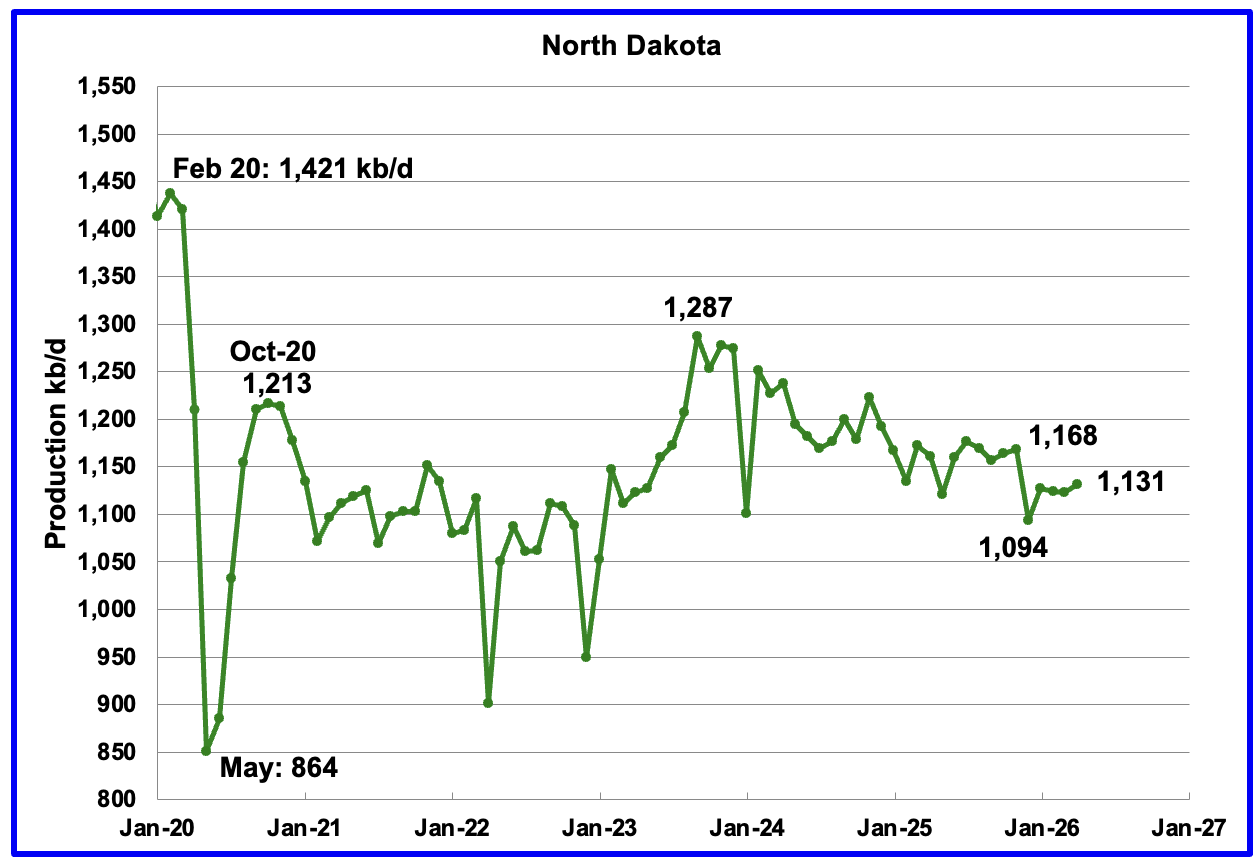
Production in North Dakota rose by 8 kb/d in April to 1,131 kb/d, according to the EIA. April 2026 production is 41 kb/d lower than last April..
The North Dakota Department of Mineral resources reported April production decreased by 6 kb/d to 1,137 kb/d, which is 6 kb/d higher than the EIA’s estimate.
According to this Article, North Dakota oil production came in below forecast.
“Nathan Anderson, director of the North Dakota Department of Mineral Resources, who released the most recent oil and natural gas production numbers Thursday, June 18, said the oil production number for April was 1.12% below the revenue forecast of 1.15 million barrels per day. He said it is a 0.48% decrease or 5,500 barrels per day from March to April.
Anderson said Bakken-Three Forks Formation production continues to dominate the production in North Dakota at about 97.4%, and 2.6% is from non-Bakken-Three Forks production.
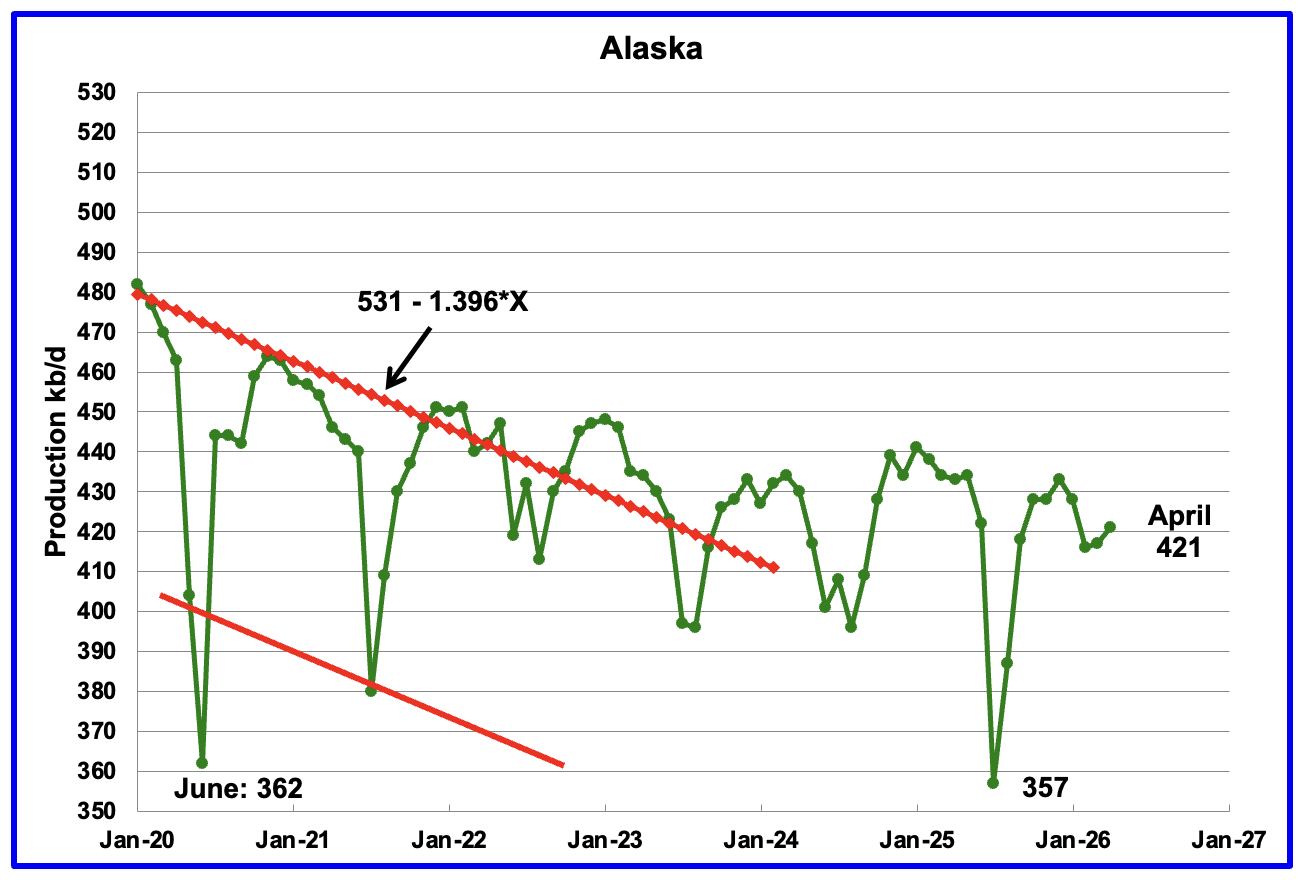
Alaskaʼs April output rose by 4 kb/d to 421 kb/d while YoY production decreased by 13 kb/d. The EIA’s weekly report for April indicated that April production would average close to 423 kb/d.
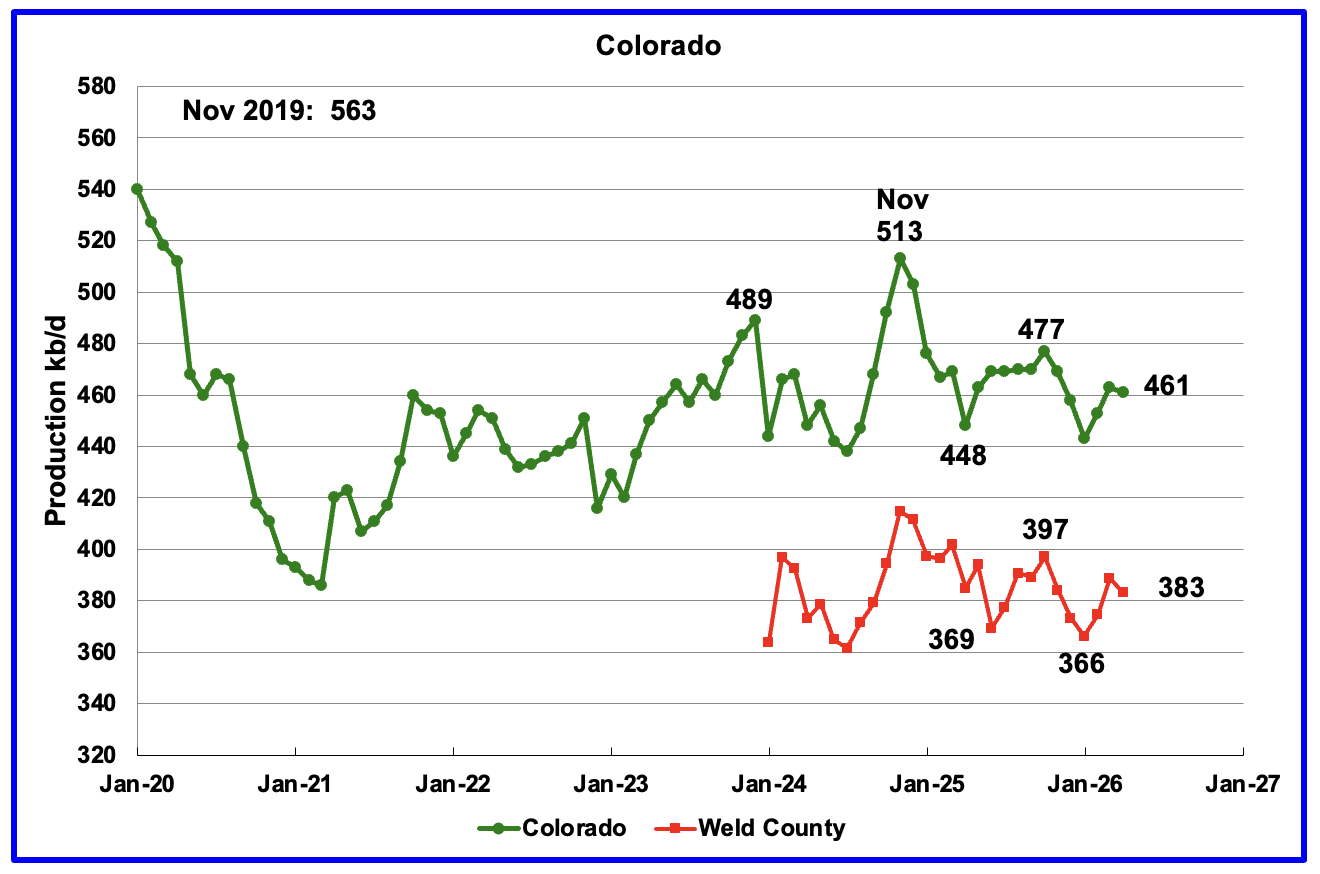
Coloradoʼs April oil production dropped by 2 kb/d to 461 kb/d.
The biggest oil producing county in Colorado is Weld County and its production has been added to the chart. The two graphs have almost been parallel over the last six months. Weld’s production dropped by 6 kb/d in April to 383 kb/d.
Colorado began 2026 with 7 rigs in January and they rose to 9 rigs in late June. Of the 9 rigs, 7 were stationed in Weld county.
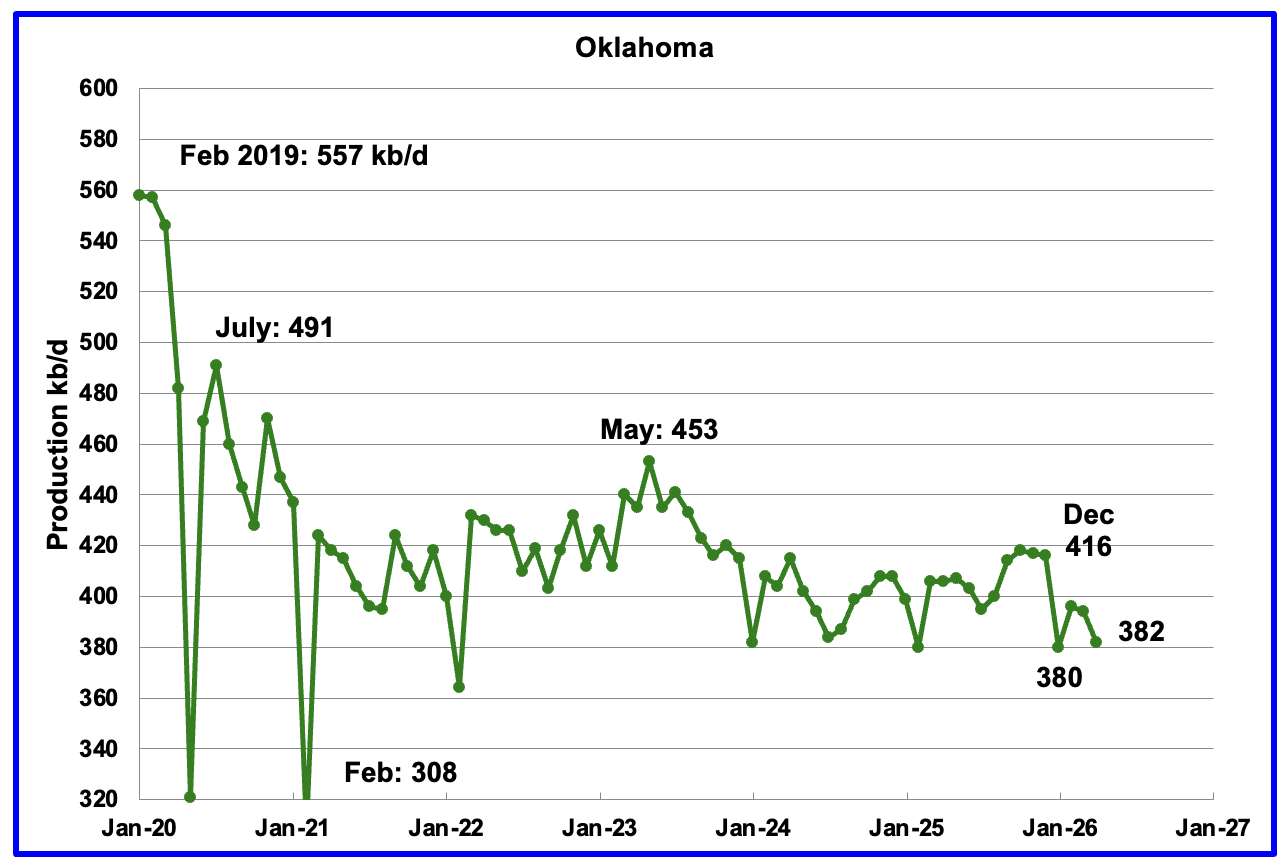
April oil production dropped by 12 kb/d from March to 382 kb/d.
Oklahoma’s January output dropped by 36 kb/d to 380 kb/d due to severe weather. Production remains below the post pandemic July 2020 high of 491 kb/d and is down by 71 kb/d since May 2023. Oklahoma’s production continues to stay within the 400 kb/d ± 20 kb/d range.
Oklahoma had 40 operational rigs in January 2026 and they have slowly increased to 45 in late June.
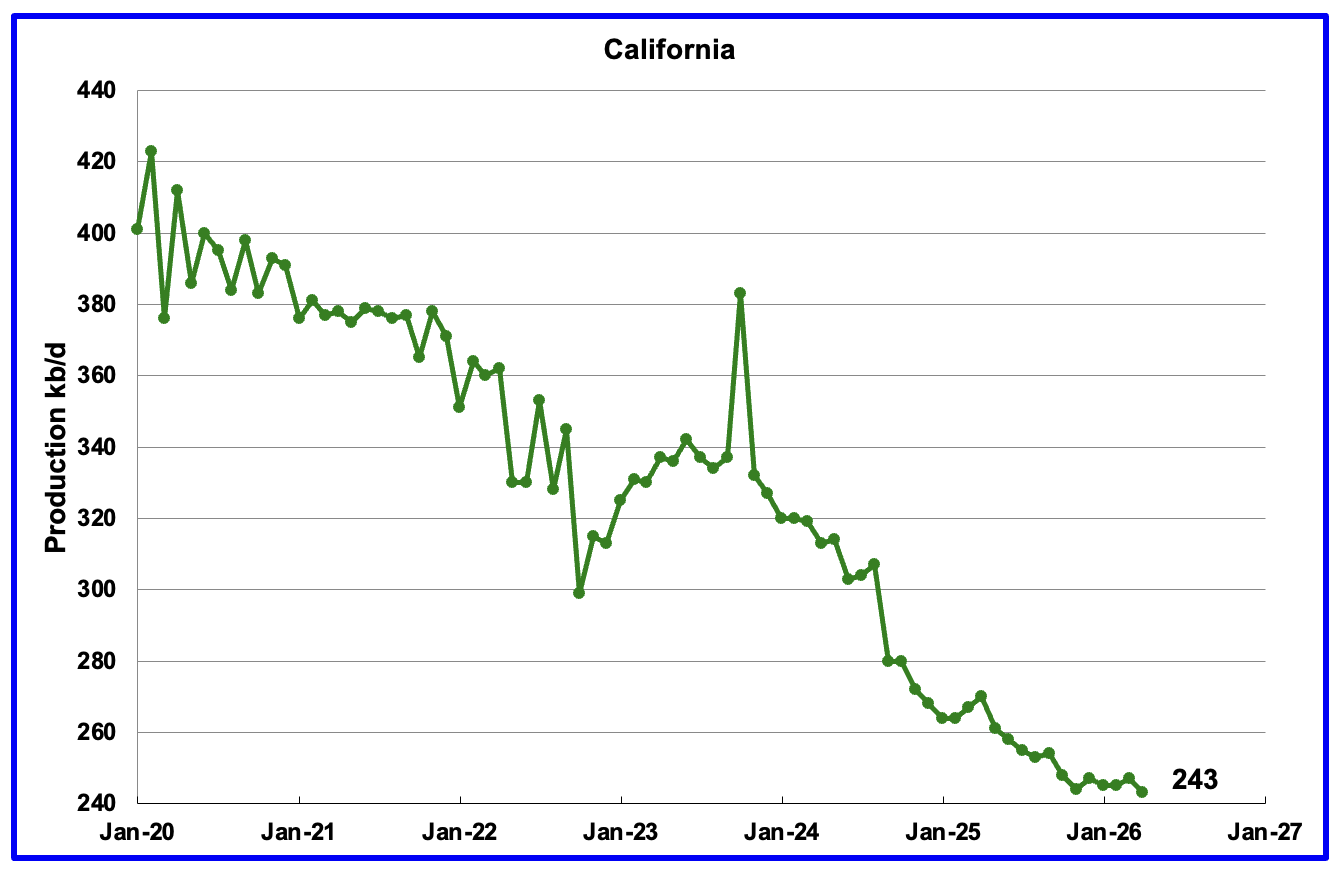
California’s overall declining production trend continues. April dropped by 4 kb/d to 243 kb/d. YoY production dropped by 24 kb/d.
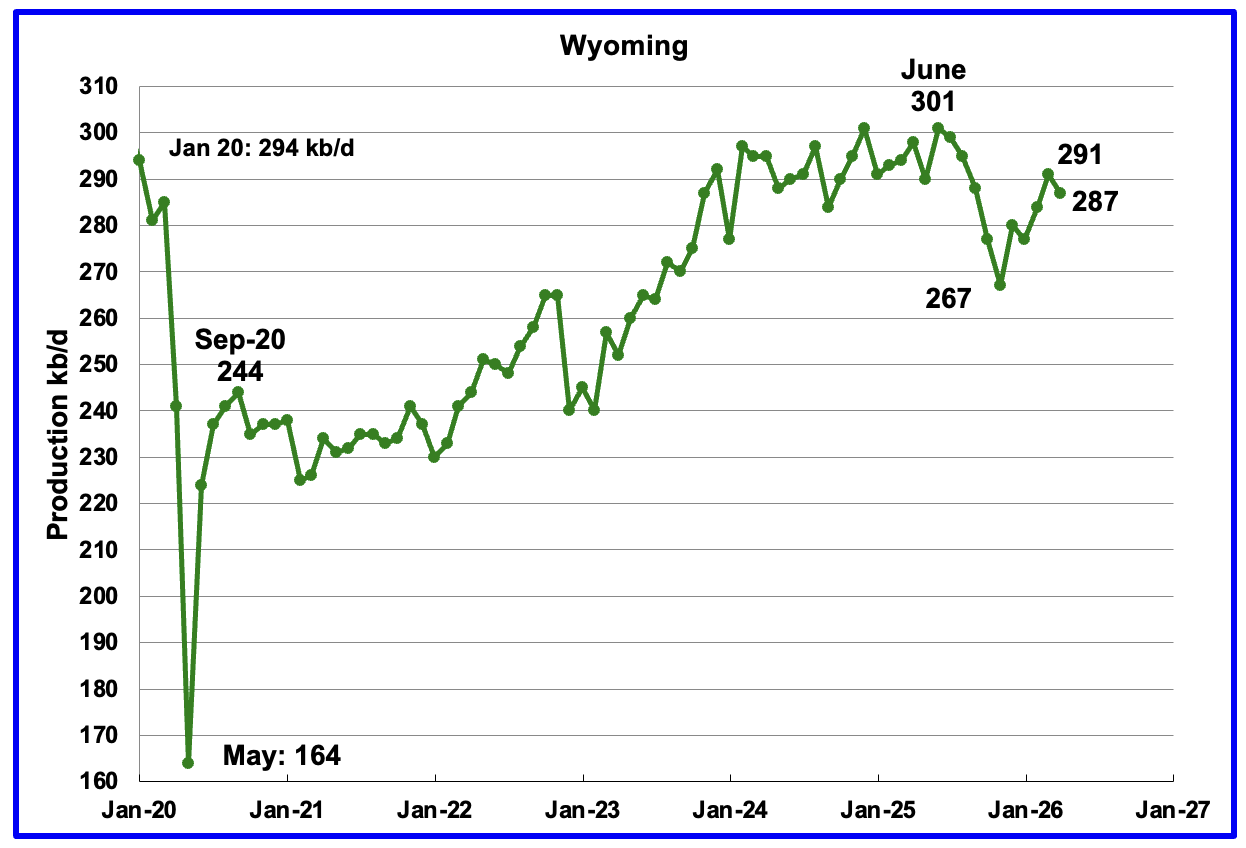
Wyoming’s oil production reached a post pandemic high in June 2025 of 301 kb/d. Production dropped in each of the subsequent 5 months before rebounding in December. April production dropped by 4 kb/d to 287 kb/d.
Wyoming started the year with 13 rigs and in late June added 1 to 14 operational rigs.
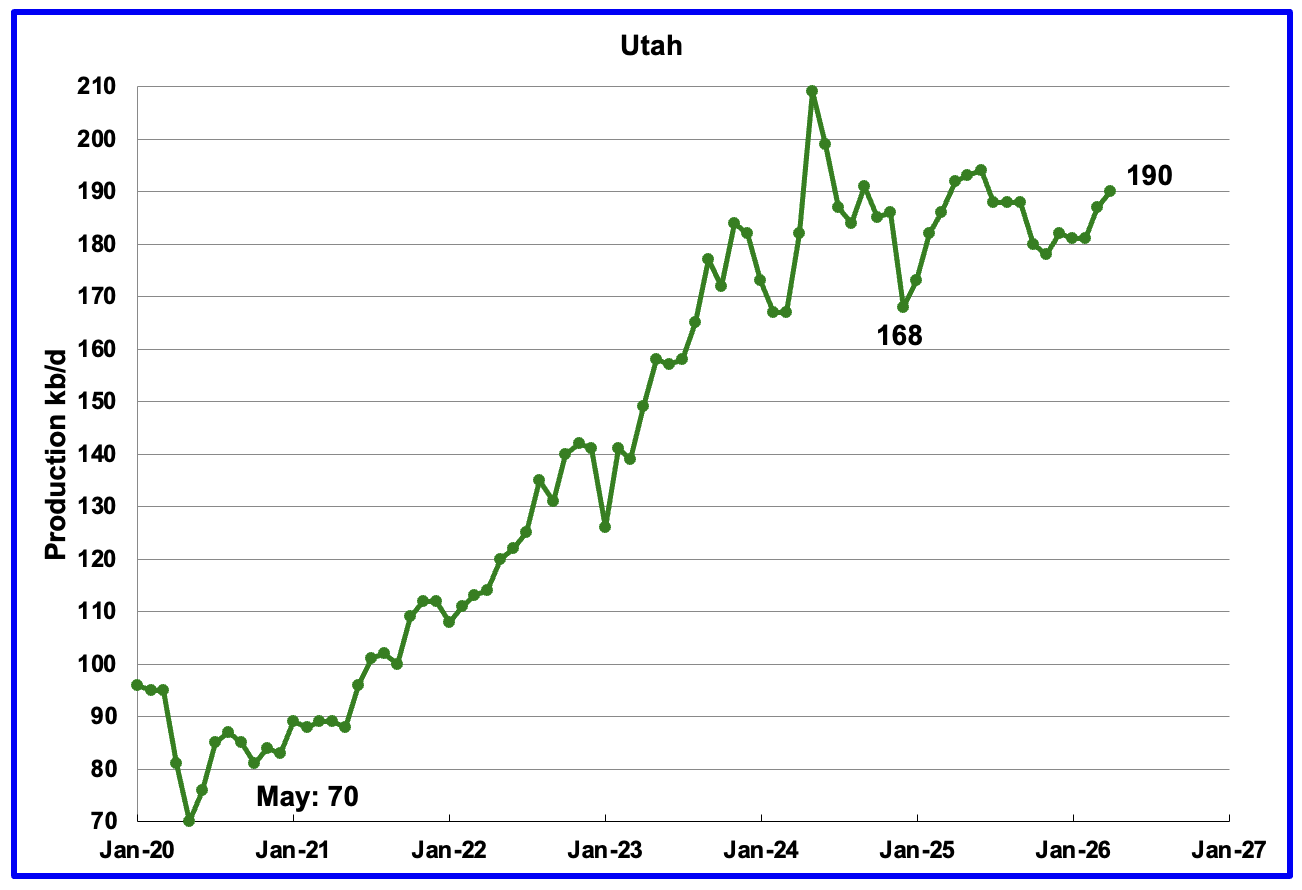
April production rose by 3 kb/d to 190 kb/d. Utah had 11 rigs operating in late January. In June, the number of operational rigs had dropped to 8.
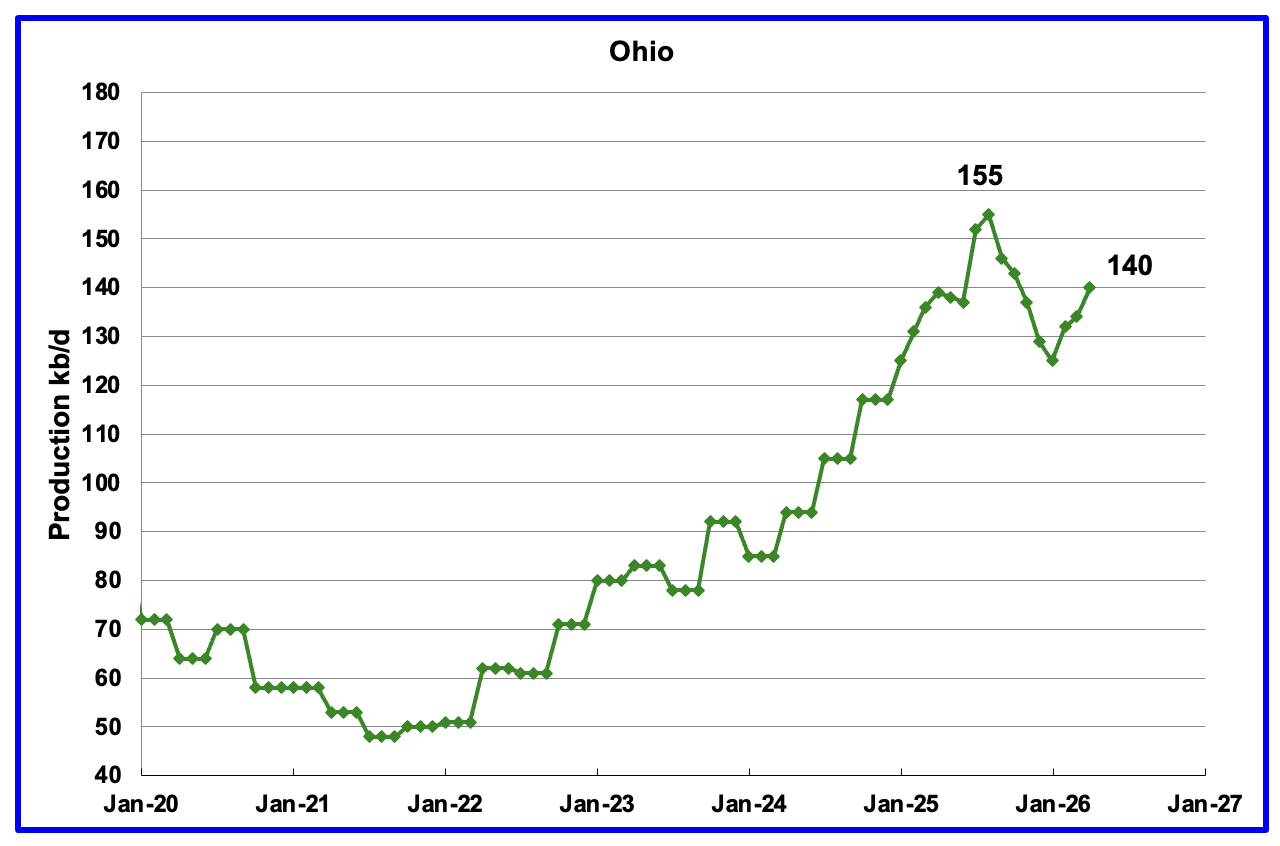
Ohio’s April oil production increased by 6 kb/d to 140 kb/d and was 15 kb/d lower than the August peak of 155 kb/d. In January 2026 Ohio had 12 NG rigs operating. At the end of June, nine NG rigs were operational along with one oil rig.
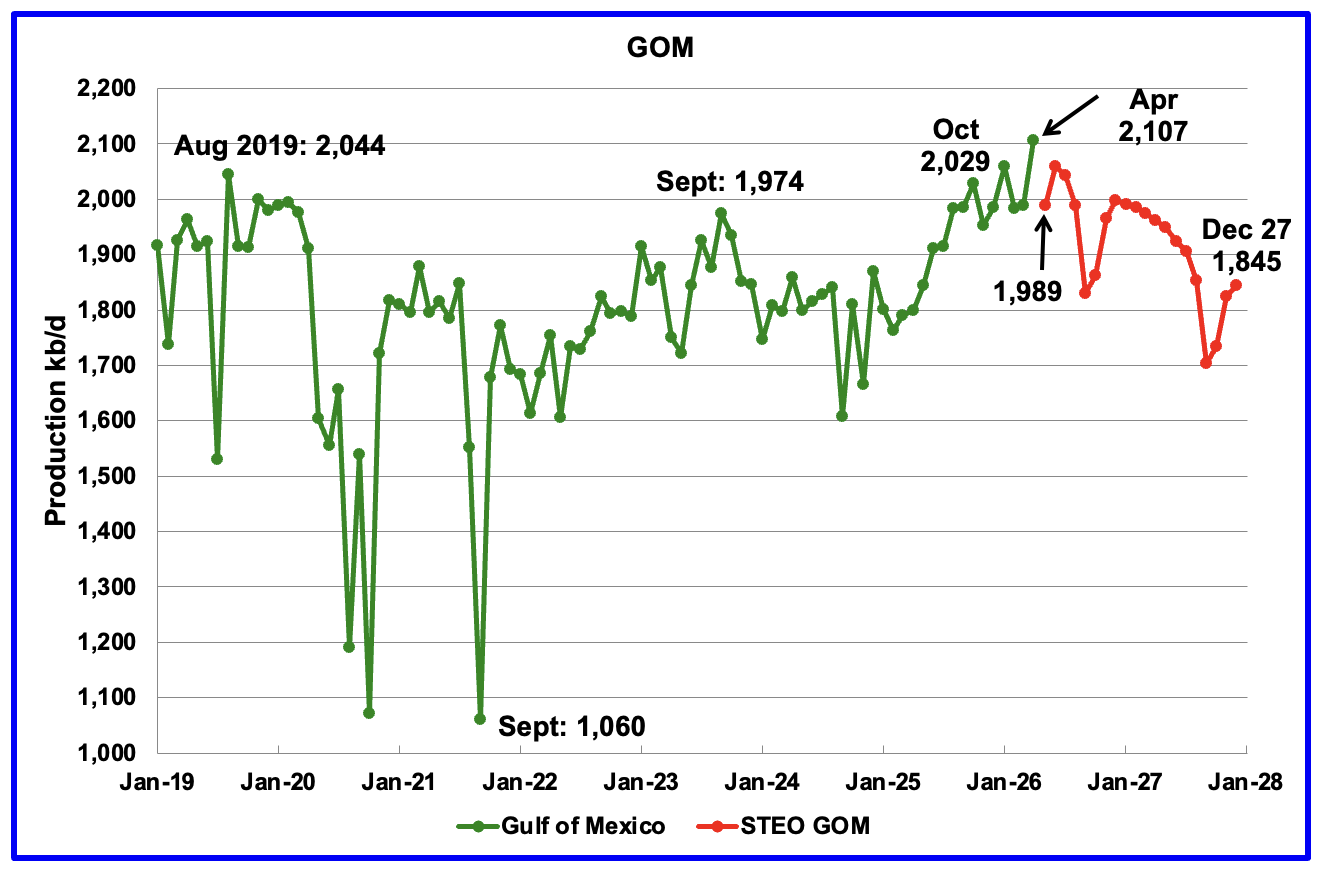
GOM production rose by 119 kb/d in April to 2,107 kb/d a new record high. It is up by 316 kb/d YoY.
The July 2026 STEO GOM projection has been added to this chart. For May production is projected to decrease by 118 kb/d to 1,989 kb/d. It also projects production in December 2027 will be lower at 1,8445 kb/d.
A Different Perspective on US Oil Production
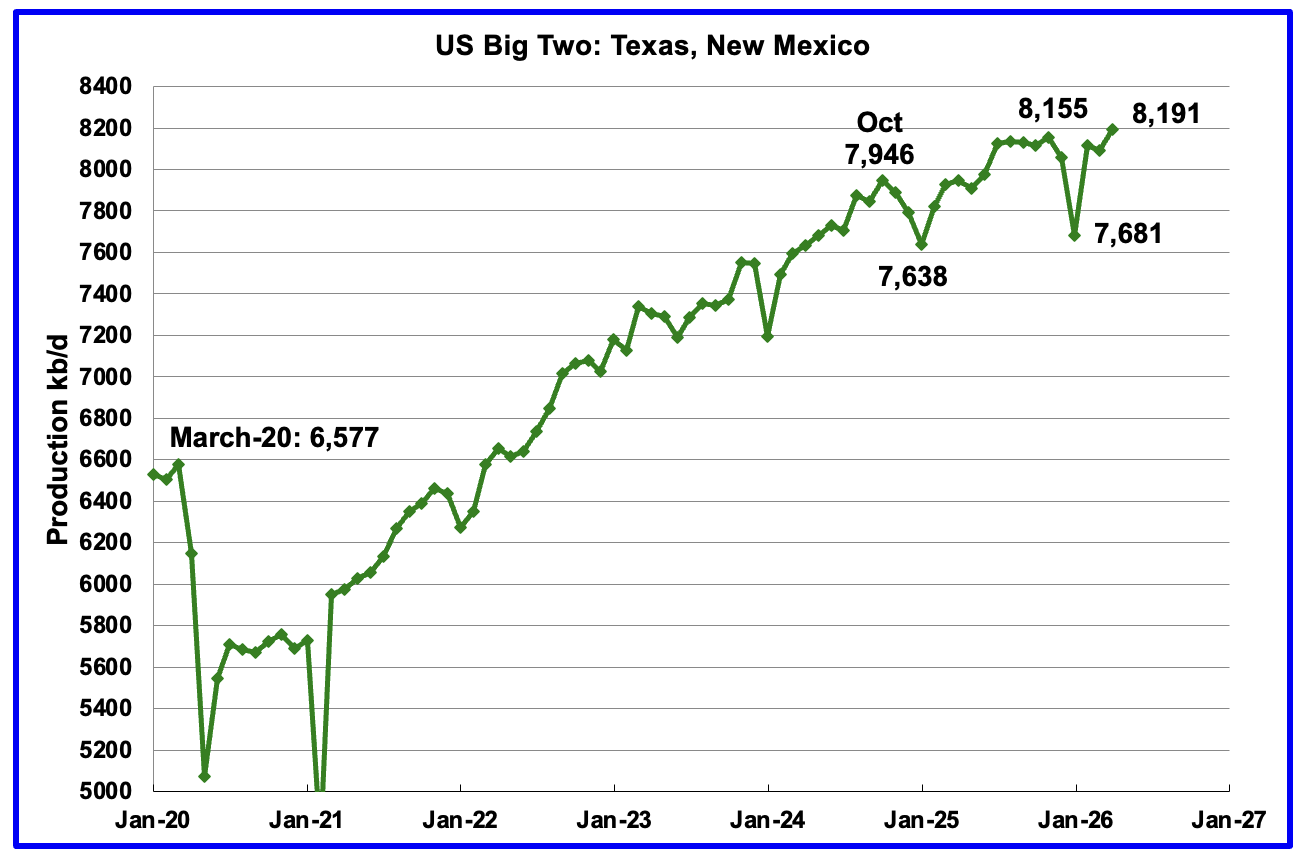
Combined Oil output for the Big Two states Texas and New Mexico.
April production in the Big Two states increased by a combined 101 kb/d to 8,191 kb/d, another new record high. The increase was due to a production rise in both Texas and NM, 36 kb/d and 65 kb/d, respectfully. Clearly these two states were the drivers of US oil production growth up to July 2025. The essentially flat production starting in August 2025 was the first sign that production in these two states was close to peaking. The next few months will determine whether these two states are in their plateau phase.
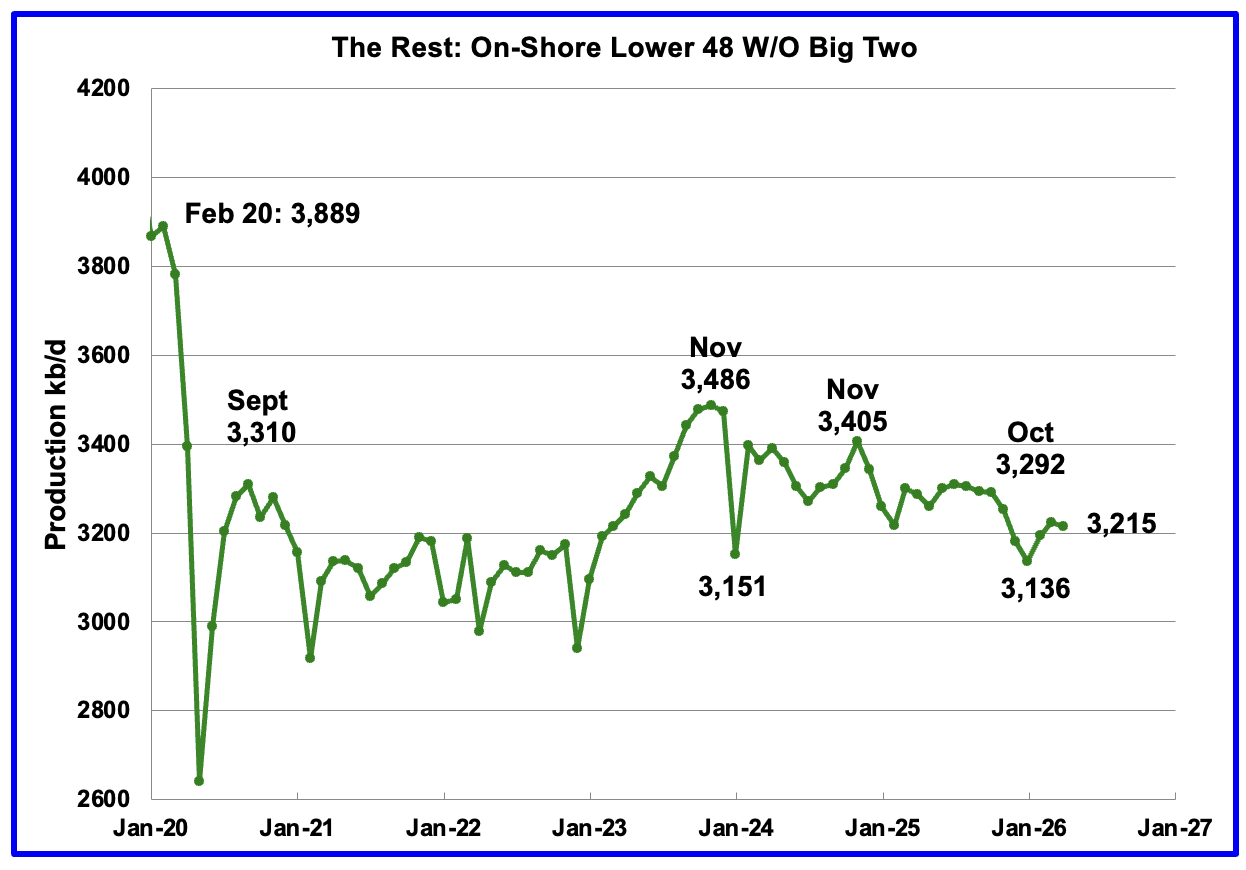
Oil Production by The Rest
April oil production by The Rest dropped by 8 kb/d to 3,215 kb/d and is 271 kb/d lower than November 2023. The remaining states may have entered a slowly declining phase.
Permian Basin Report for Main Counties and a District
This special monthly Permian section was added to the US report because of a range of views on whether Permian production will continue to grow or will peak over the next year or two. The issue was brought into focus many months back by two Goehring and Rozencwajg Reports and Report2 which indicated that a few of the biggest Permian oil producing counties were close to peaking or past peak.
A more recent report was issued and can be reviewed Here. In this report they state:
“For years now, we have outlined with what we hoped was clarity, and what we now submit was prescience, the view that U.S. shale oil, that great source of modern supply, could not grow forever. It would mature, crest, and begin its long descent. That moment, by our models and measures, has arrived: shale has plateaued, and 2024 appears to be its high-water mark. And yet, investor sentiment has scarcely been more downbeat.”
This section will focus on the four largest oil producing counties in the Permian, Lea, Eddy, Midland and Martin. It will track the oil production and the associated Gas Oil Ratio (GOR) on a monthly basis. The data is taken from the state’s government agencies for Texas and New Mexico. Typically the data for the latest two or three months is not complete and is revised upward as companies submit their updated information. Note the GOR shown in the charts uses the gas coming from both the gas and oil wells.
Of particular interest will be the charts which plot oil production vs GOR for a county to see if a particular characteristic develops that indicates the field is close to entering or in the bubble point phase. While the GOR metric is best suited for characterizing individual wells, counties with closely spaced horizontal wells may display a behaviour similar to individual wells due to pressure cross talking . For further information on the bubble point and GOR, there are a few good thoughts on the intricacies of the GOR in an earlier POB comment and here. Also check this EIA topic on GOR.
New Mexico Permian
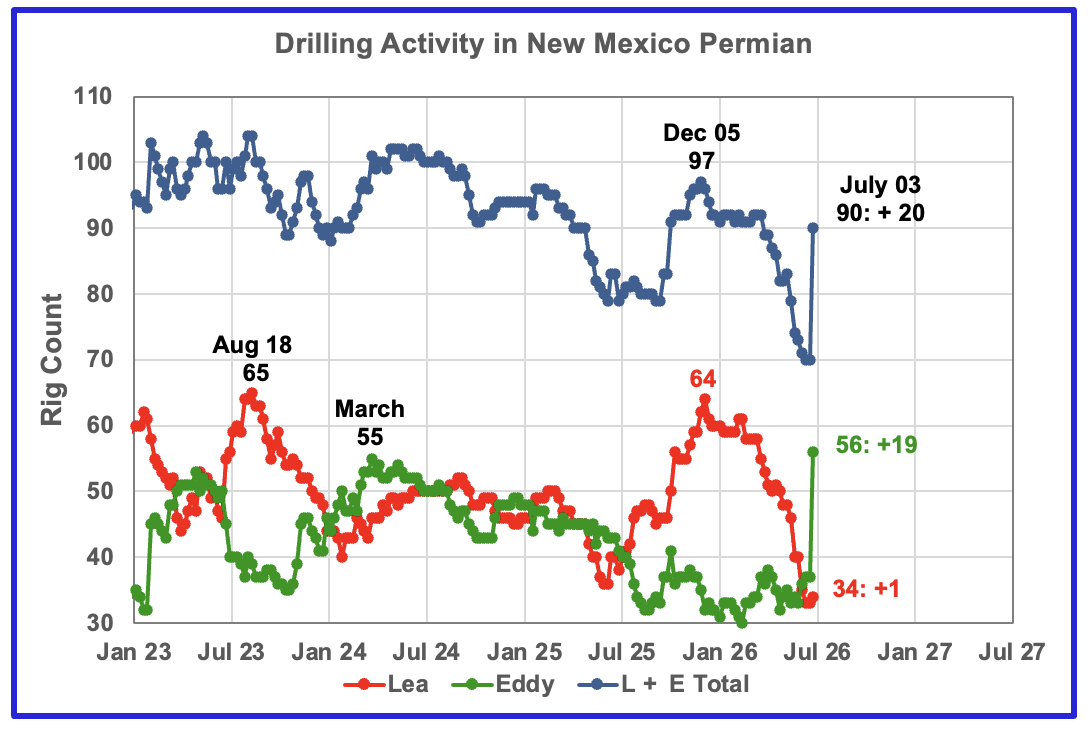
The rig count in Lea County has continued to decline over the last 8 weeks. Over the past six months Lea County dropped 30 rigs to 34 while Eddy added 19 Hz and Directional rigs last week. Actually the 19 Drigs operating in Eddy county were re-classified as Hz rig.
Eddy County added 14 Directional rigs between May 21, 2026 and June 11, 2025 for a total of 20. This is a significant addition to drilling capacity regardless of whether they were Hz or Drigs
Oil Production in New Mexico’s Primary Permian Counties
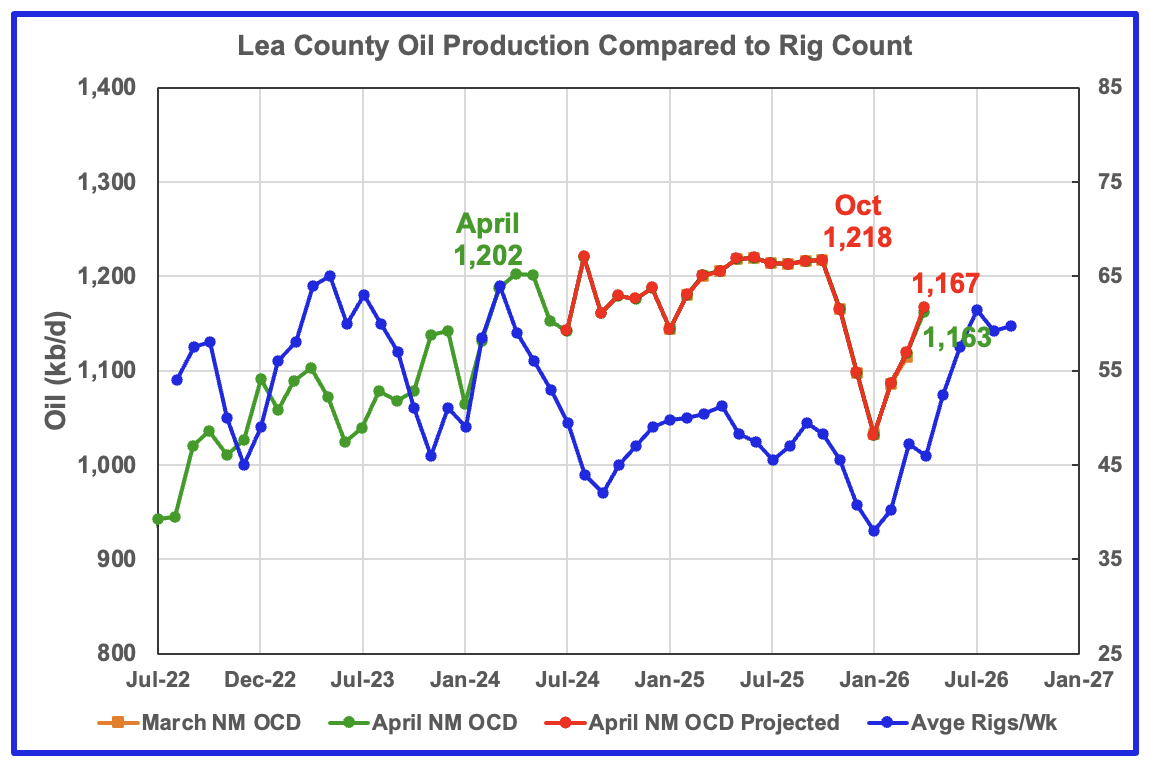
Lea County’s oil production started its plateau phase in April 2024 at 1,202 kb/d and it continued to October 2025. November 2025 to January 2026 has seen steady production drops in both the projected and NM OCD’s preliminary production. However the majority of January’s projected production drop of 66 kb/d was due to the severe January weather. February projected production rebounded and came in at 1,087 kb/d, revised down from 1,093 kb/d in the previous post.
April projected production increased by 48 kb/d to 1,167 kb/d. It now appears more likely that the projected production increases in March and April are related to the time shifted increasing rig count. The question/issue here is whether production will exceed the October 2025 peak of 1,218 kb/d or peak at a new lower level? Note that from time shifted April 2026 to July 2026 the rig count increases from 46 to 61.
Preliminary April data from New Mexico’s Oil Conservation Division (OCD) indicates Lea County’s April oil production rose by 44 kb/d to 1,163 kb/d, green graph.
The blue graph shows the average number of weekly rigs operating during a given month as taken from the weekly rig data. The rig graph has been time shifted forward by 7 months. So the 64 Rigs/wk operating in August 2023 have been time shifted forward to March 2024 to show the possible correlation and time delay between rig count, completion and oil production.
Note that rig counts are being used to project production as opposed to completions because state completion data is not available. Completion data from the Drilling Productivity report below indicates that the number of completed DUCs slightly exceeds newly drilled wells in the Permian basin.
According to this Article, Devon Energy has recently acquired land in Lea and Eddy counties. The acquisition cost $2.6B or $161,500 per net acre and adds approximately 400 net locations normalized to 2-mile laterals, with expected strong well economics and low breakevens.
According to this Article: Wolfcamp Y currently delivers the strongest overall performance among the primary target.
“Type curve analysis of nearby wells reveals that Wolfcamp Y currently delivers the strongest overall performance among the primary target benches in the area (Figure 2). Wells turned to production since 2024 average approximately 10,000-foot laterals, roughly 2,300 pounds of proppant per lateral foot, and the average Estimated Ultimate Recovery (EUR) is roughly 75 barrels of oil equivalent (BOE) per lateral foot. These are some of the strongest development metrics currently being observed in the northern Delaware Basin and help explain why operators are aggressively competing for undeveloped acreage capable of supporting similar future development programs.
This Article states there are 10 to 20 years of Tier 1 drilling inventory remaining in the Permian.
Prieto said the company has been watching the development of new zones, including the Woodford and Barnett, Avalon and Harkey Sand and Wolfcamp C and D benches. Technology is lowering drilling and completion costs, improving efficiency and lowering breakeven costs, making those new zones competitive, he said.
“The Permian Basin is evolving as the best play through technology and innovation,” he said.
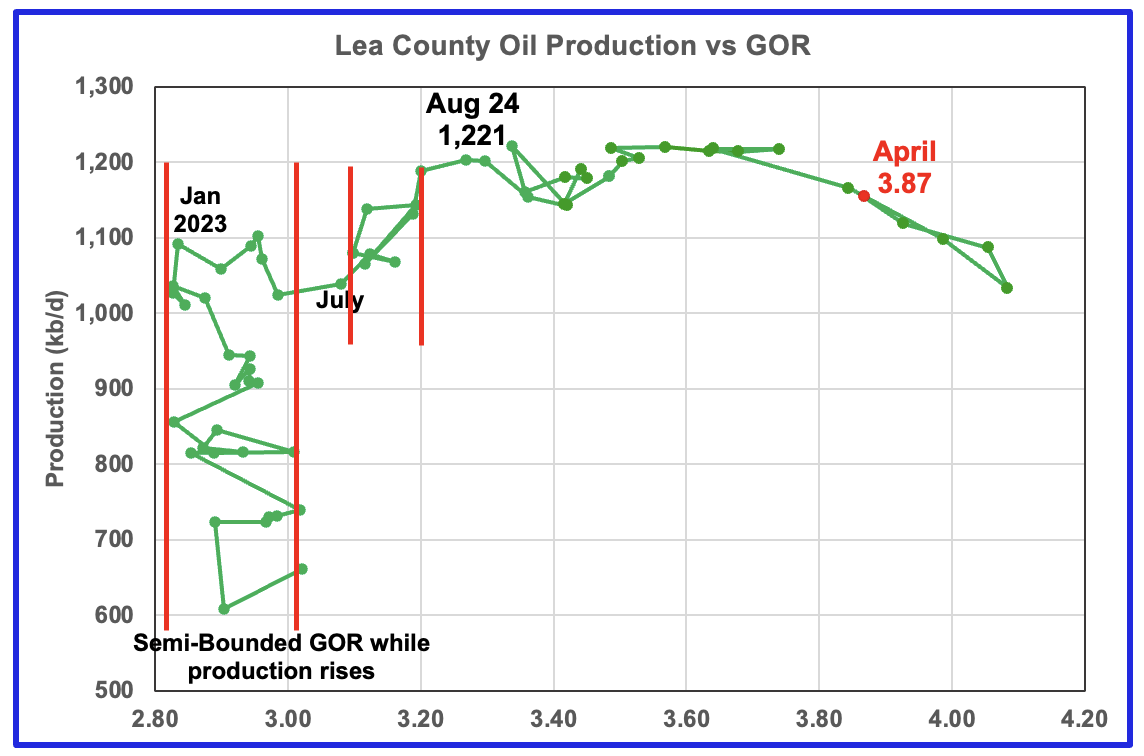
After much zigging and zagging, oil production in Lea county stabilized just below 1,100 kb/d in early 2023. Once production reached a new high in January 2023, production appeared to be on a plateau while the GOR started to increase rapidly to the right and first entered the bubble point phase in July 2023.
Since July 2023 Lea County’s production continued to increase as the GOR remained within a second semi-bounded region. This may indicate that additional production was coming from an oilier part of a layer since the GOR’s behaviour since August 2023 to March 2024 time frame appears once again to be in a second semi bounded GOR phase accompanied with rising production.
The GOR moved out of the second semi-bounded GOR region in April 2024 and production hit a new high of 1,221 kb/d in August 2024. From August 2024 to February 2025 the GOR was range bound between 3.34 and 3.53 but starting in June 2025 the GOR started to rise every month, except for one, to hit new highs. February through April saw a double change in direction, both a production increase and a GOR decrease to 3.87, which may be consistent with rising production.
This zigging and zagging GOR pattern within a semi-bounded GOR while oil production increases to some stable level and then moves out to a higher GOR to the right has shown up in a number of counties. See a few additional cases below.
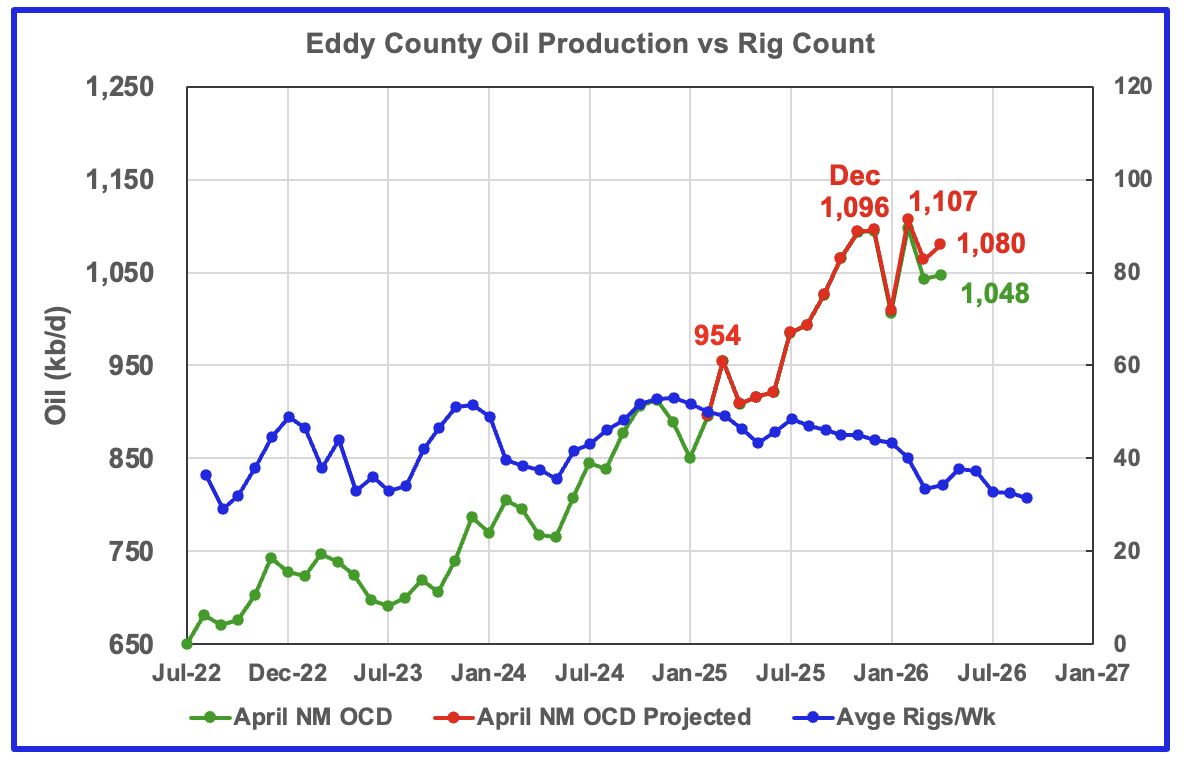
Eddy’s April projected oil production increased by 16 kb/d to 1,080 kb/d while preliminary production from the NM OCD increased by 5 kb/d to 1,048 kb/d. Most of the February production rise was due to a rebound from the severe January weather. If the storm had not occurred, January production would have been closer to 1,100 kb/d.
The dropping rig count starting in time shifted January 2026 may have finally shown up in falling production in real March followed by both a small production and rig count rise. November/December 2025 and February 2026 projected production formed a plateau. The April production rise of 16 kb/d may be the beginning of an upcoming small production increase.
The blue graph shows the average number of weekly rigs operating during a given month as taken from the above weekly drilling chart. The rig graph has been shifted forward by 7 months to roughly coincide with the increase in the production graph starting in September/October 2023.
Between May 21, 2026 and June 11, 2025, 14 Directional Rigs were added to Eddy County. This is a significant addition of drilling capacity.
Assuming, these rigs are being use for drilling Paper Clip or U wells, this will provide a significant boost to Eddy oil production by year end. According to AI, it generally takes about 15 to 25 days (from spud to rig release) to drill a U-shaped lateral (U-turn or horseshoe well) in the Delaware Basin of Eddy County, NM. This is slightly longer than the 10-15 days it takes for a standard extended-reach single-lateral well in the Permian, due to the complex geometry of the drill path.
Assuming an average of 20 days to drill these wells, that implies 28 new wells being drilled each month. Assuming an IP of 1,500 b/d, that translates into an additional 42 kb/d of oil production starting in late 2026 or early 2027. Need to reduce this increase due to depletion but this could result in a new peak for Eddy county.
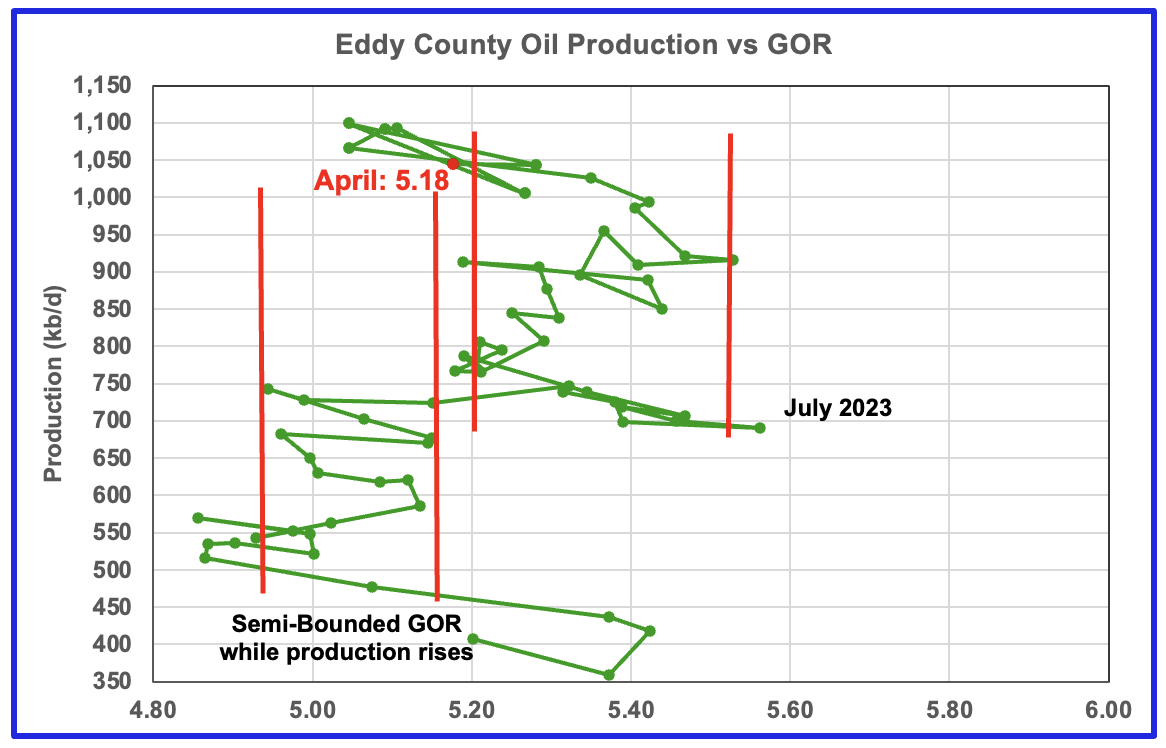
The Eddy county GOR pattern is similar to Lea county except that Eddy broke out from the first semi bounded range earlier and then added a second wider semi-bounded GOR phase.
For April New Mexico’s Oil Conservation Division (OCD) reported preliminary oil production increased by 1 kb/d to 1,044 kb/d while the GOR dropped to 5.18 and almost moved back into the first Semi-Bounded GOR range.
Texas Permian
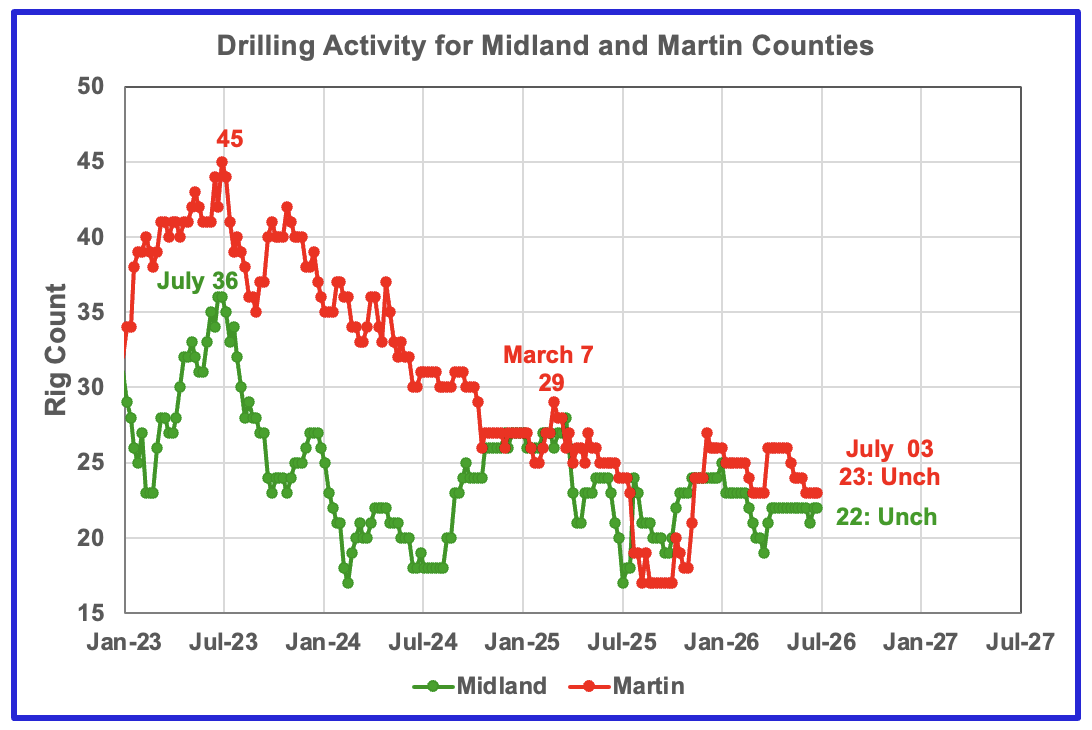
The rig count in Midland county has remained essentially unchanged for the last twelve weeks at 22 while Martin county reduced its rig count from 26 to 23 from May into early July..
Oil Production in the Two Primary Texas Permian Counties
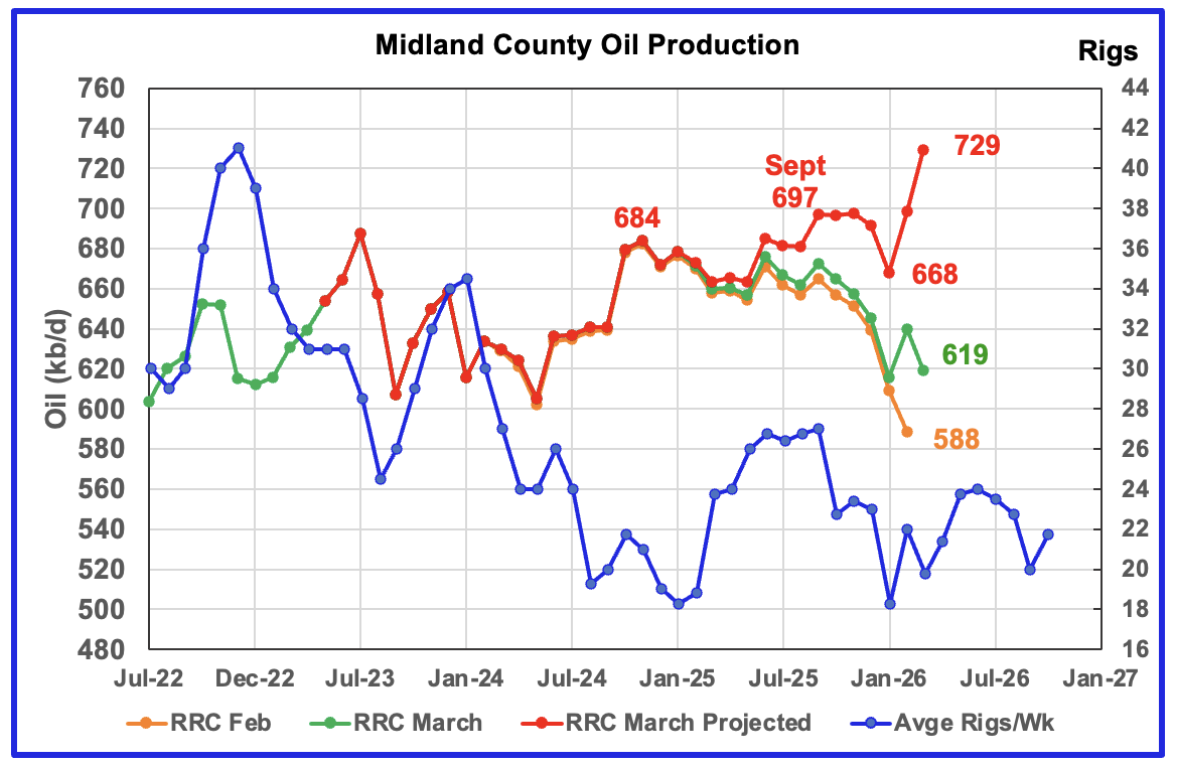
Comparison Chart from the previous post.
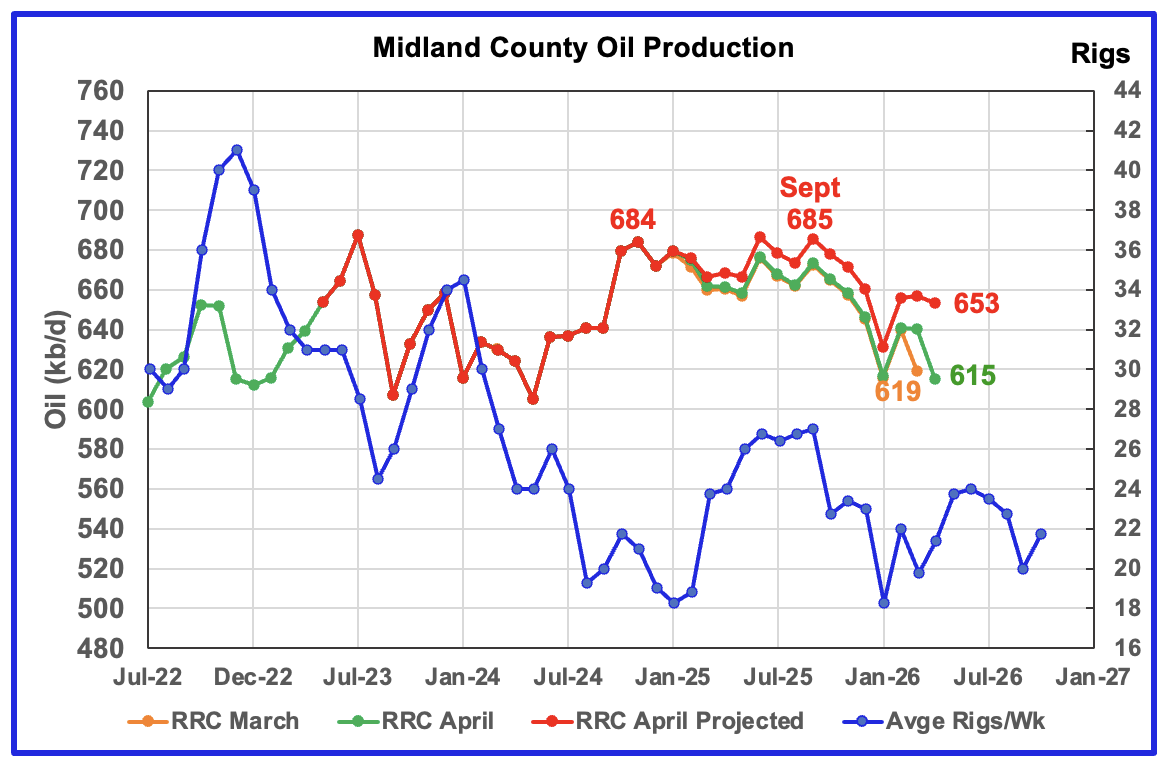
April projected production dropped by 4 kb/d to 653 b/d. The February rise is due to the production rebound from the severe Texas winter storm in late January. In the last report it was noted that “With the rig count rising in time shifted February and March from the January low, the February and March increases may be directionally correct”. It was also noted that the February and March Midland projection were too optimistic but directionally correct.
Compare the projected production for September 2025 in the preceding comparison chart with the current one. Production has dropped by 12 kb/d from 697 kb/d to 685 kb/d. The biggest change is for March. March projected production has dropped from 729 kb/d to 657 kb/d. The main reason for the large drop is the more up to date reporting of oil production for March and April.
The orange and green graphs show preliminary oil production for Midland County as reported by the Texas RRC for March and April, respectively. The red graph uses March and April data to project production as it would look after being updated over many months.
The blue graph shows the average number of weekly rigs operating during a given month as taken from the weekly drilling chart. The rig graph has been shifted forward by 6 months to better align with the latest production.
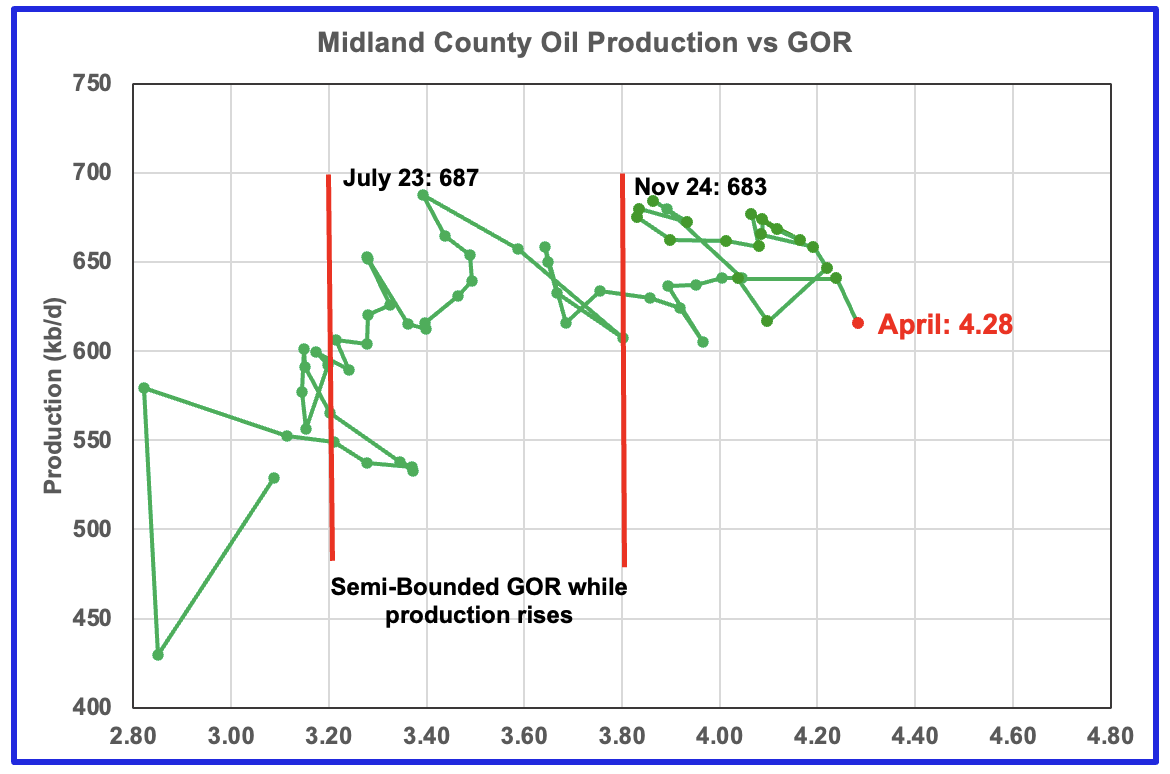
For April the Midland GOR ratio rose to a new high of 4.28 while the reported preliminary oil production dropped by 25 kb/d to 615 kb/d.
When the Midland county GOR initially moved into the bubble point phase, oil production and the GOR stayed within a narrow GOR range of 3.8 to 4.2 outside of the initial Semi-Bounded GOR region from March 2024 to November 2025. For April the GOR rose to a new high of 4.28, which is another indicator of dropping production.
The oil production and GOR shown in this chart are based on the RRC’s April preliminary production report.
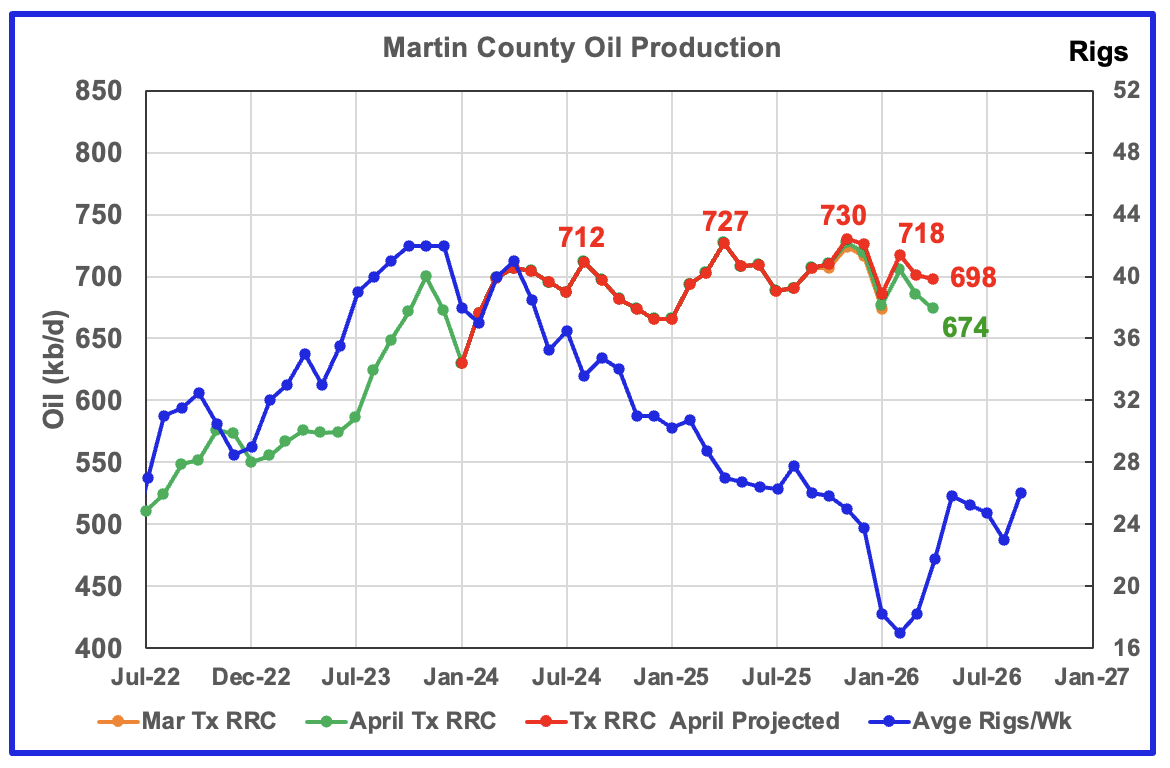
Martin’s projected April oil production dropped by 3 kb/d to 698 kb/d. Production has been essentially flat since August 2024 at close to 712 kb/d even though the rig count has been in a steady decline. Will the rising rig count starting in time shifted April 2026 affect production?
The red graph is a projection for oil production as it would look after being updated over many months. This projection is based on a methodology that uses preliminary March and April oil production data.
The orange and green graphs show production for Martin County as reported by the Texas RRC for March and April. The blue rig graph time shifts the rig count forward by 5 months.
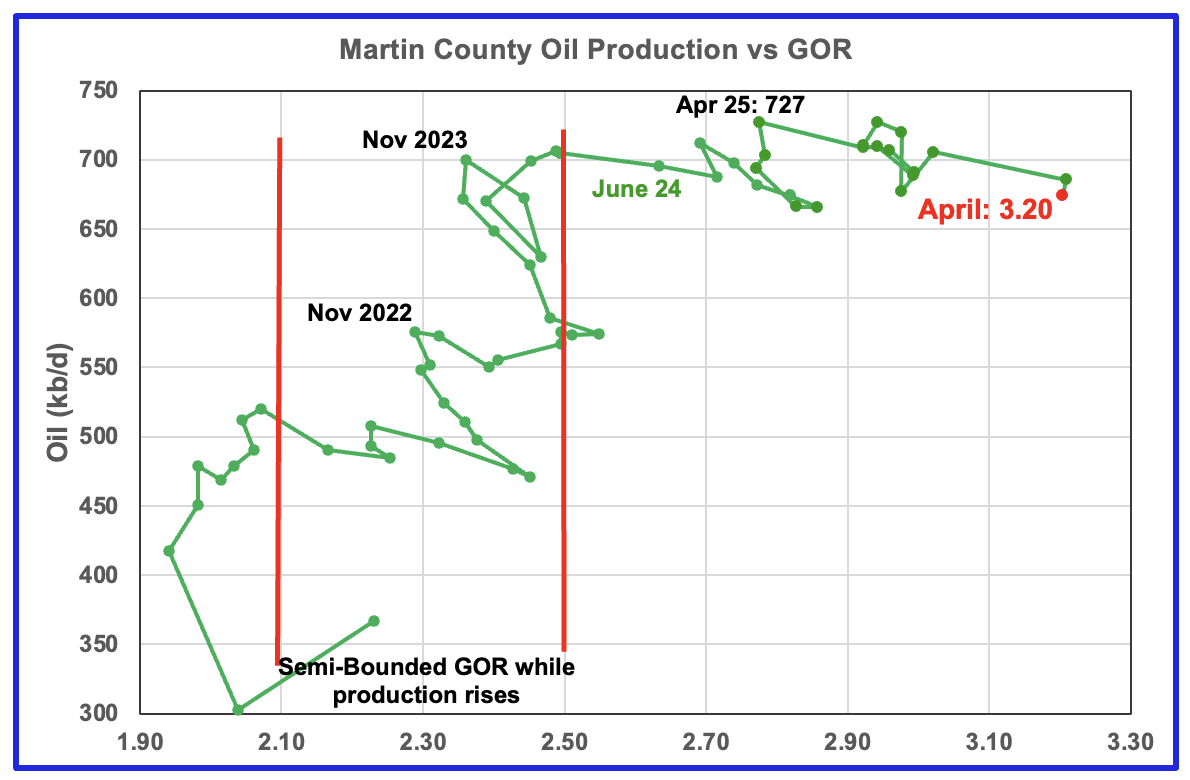
Martin county’s oil production after November 2022 increased and at the same time drifted to slightly higher GORs within the semi bounded range. However the June 2024 GOR saw its first move out of the semi bounded region.
The RRC’s preliminary April 2026 production for Martin County shows a 12 kb/d decrease to 674 kb/d accompanied by a very small decrease in the GOR to a record 3.20.
Martin county has the lowest semi-bounded GOR boundary of the four counties at a GOR of close to 2.50. The March GOR is now clearly out of the semi-bounded region. Martin County has now entered the bubble point phase that should result in a plateau phase that should shortly turn into a slowly dropping oil production phase.
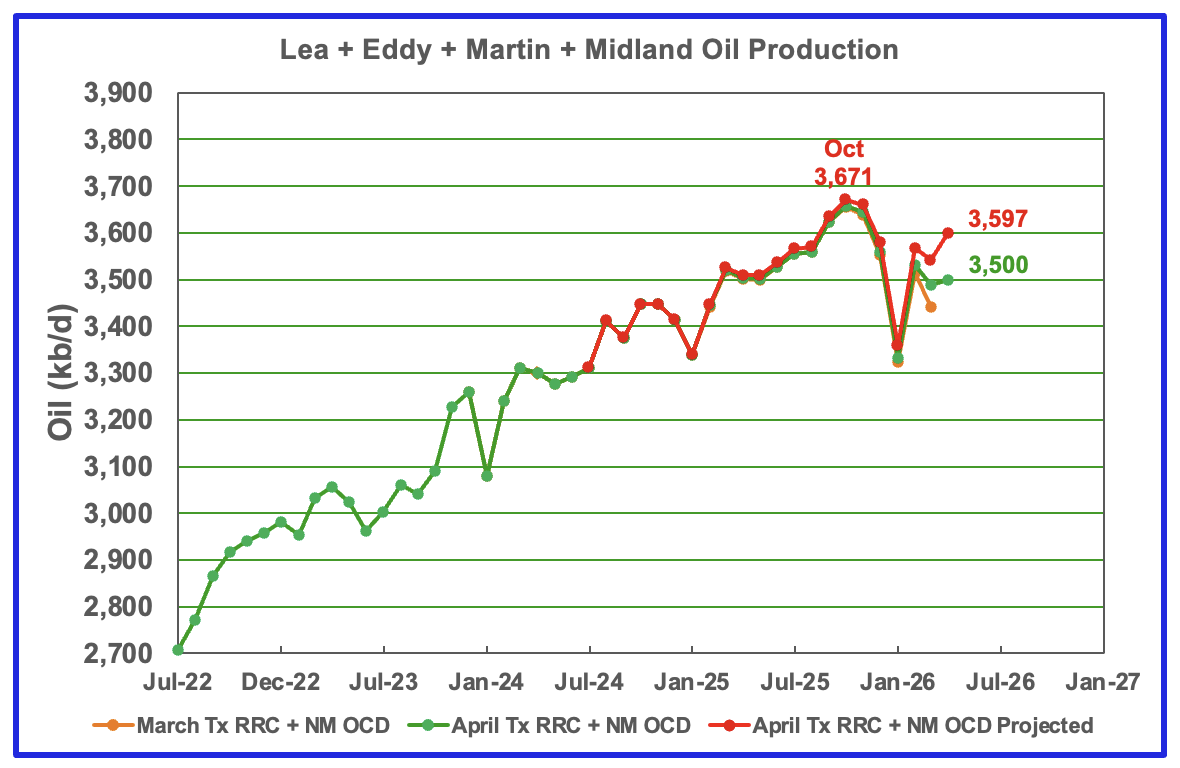
This chart shows the total oil production from the four largest Permian counties. Assuming the total current Permian production is close to 6,600 kb/d, these four counties account for 55% of the total.
April projected production increased by 58 kb/d to 3,597 kb/d. The combined increase in Lea and Eddy was 64 kb/d, offset by small drops in Midland and Martin.
The March and April initial production are shown in the orange and green graphs respectively. The red graph uses the March and April production to project a final updated production for April.
Findings
– In general the projected production charts for the Texas and New Mexico counties are very reasonable.
– Lea county entered its plateau phase in May 2024. While oil production is not following the rig count graph directly, the dropping rig count has resulted in Lea County production being in a steady flat plateau phase up to October 2025. However the November to January production drops appeared to indicate that Lea County had entered a declining phase. Rising production from February to April which is currently tracking the time shifted rig count has changed the outlook.. It is not clear whether the current rising production could enter a lower level plateau phase in 2026 as the time shifted post January rig count begins to increase.
– From July 2025 to December 2025 production in Eddy County saw a steady increase to 1,093 kb/d. February projected production rose to 1,103 kb/d. Between May 21, 2026 and June 11, 2025, 14 Directional Rigs were added to Eddy County. This is a significant addition to drilling capacity. If these rigs are used to drill Paper Clip or U wells they could add up to 42 kb/d of oil production in late 2026 early 2027.
– Midland’s April oil production indicates that Midland may have entered is declining phase as its production follows the time shifted rig count.
– Martin’s projected production has been essentially flat since August 2024. Martin’s April small projected production decrease indicates that its oil production is still in its plateau phase of approximately 715 kb/d and may be close to entering its declining phase. The next few months may show a production increase as the April and May time shifted rig count begins to rise.
Texas District 8
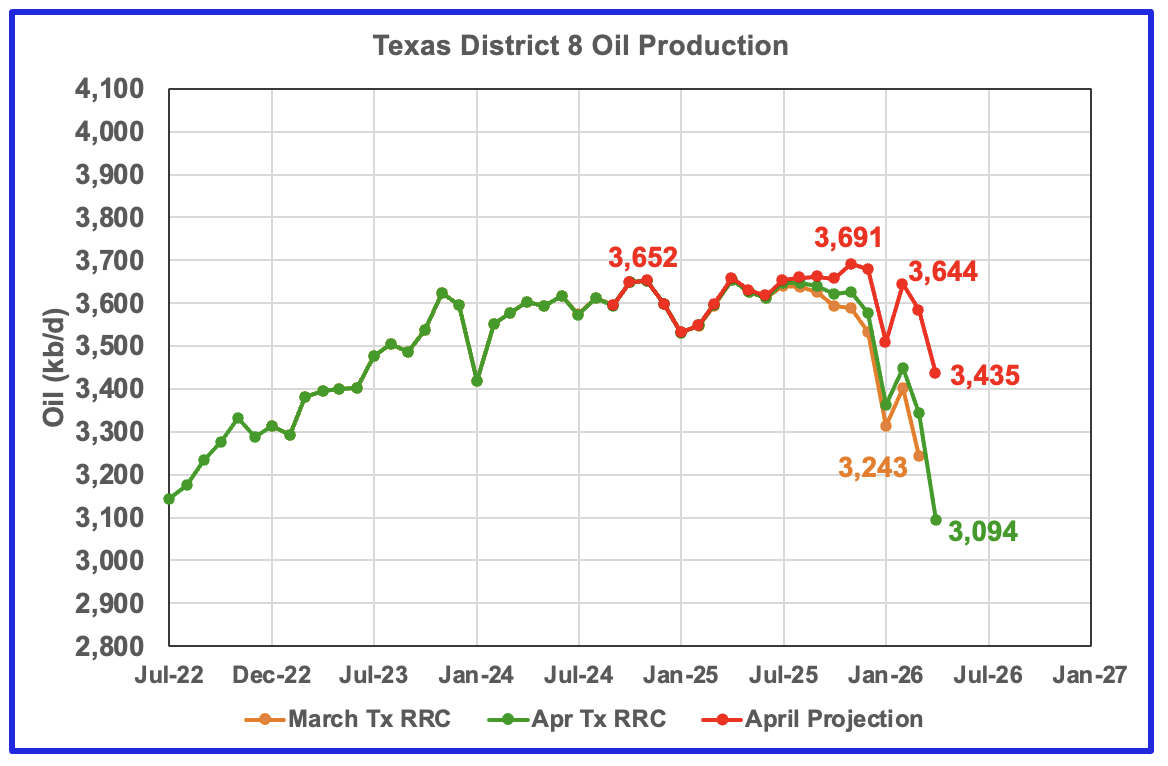
District 8’s projected production dropped by 149 Kb/d to 3,435 kb/d in April. District 8 appears to be entering its declining phase.
It was noted in the previous post that the District 8’s projected production was too optimistic due to an atypical number upward revisions to many counties in District 8. April data looks much better.
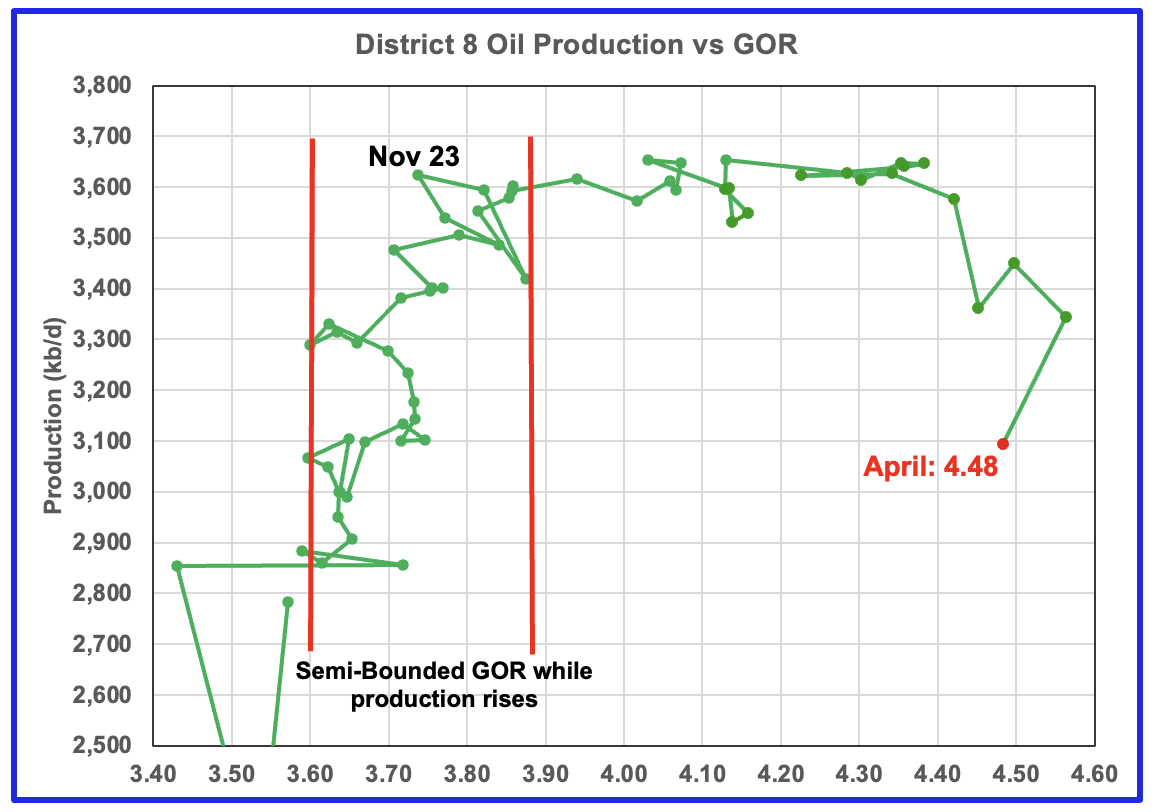
Plotting an oil production vs GOR graph for a district may be a bit of a stretch. Regardless here it is and it seems to indicate many District 8 counties may well be into the bubble point phase. The April GOR decreased to 4.48 as preliminary production continued to drop.
Oil Production and GOR Charts for Three of the Next Larger Texas Oil Producing Counties
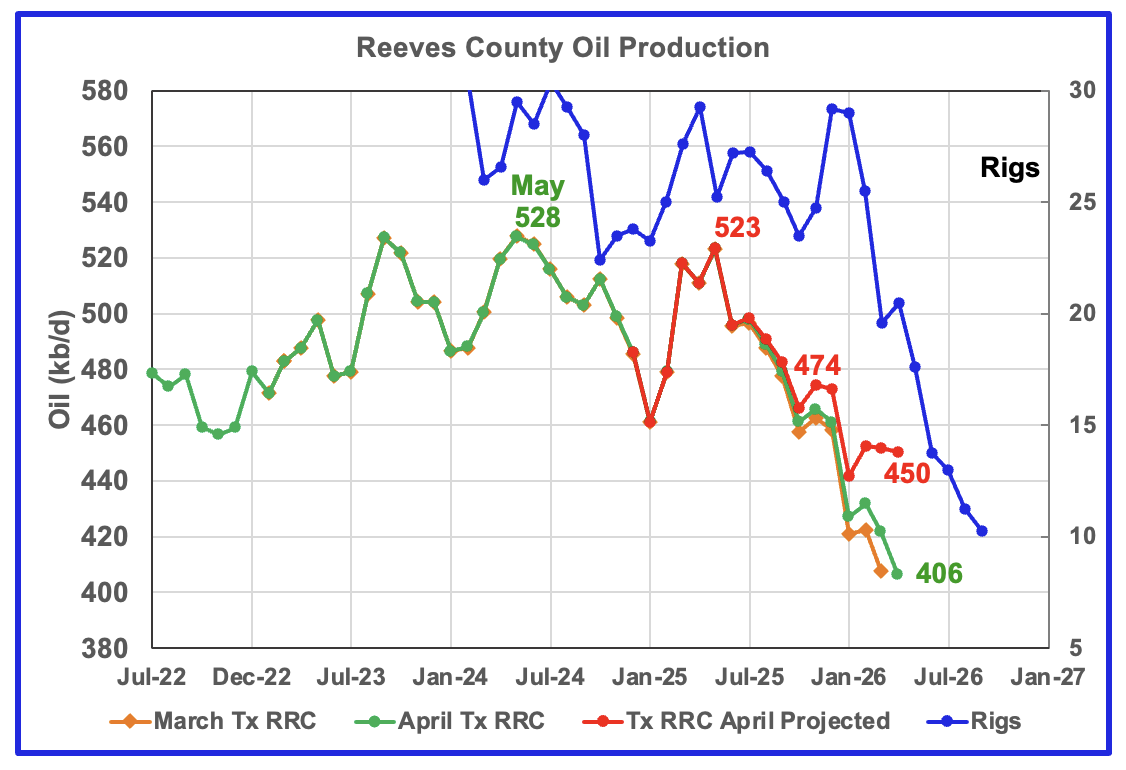
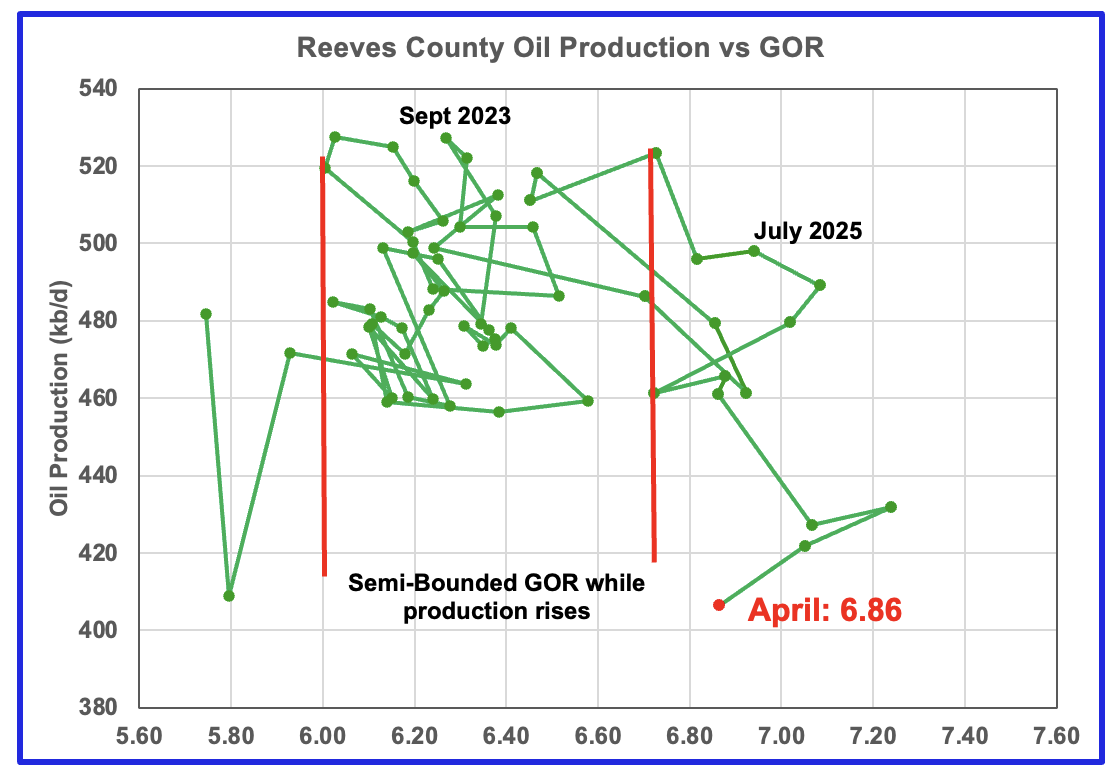
Reeves County GOR is high because it is the number one Texas county ranked by gas production. The current C + C production is almost evenly split between crude and condensate, with condensate compromising 54% of the total output.
Reeves County GOR first moved out of the Semi-Bounded region in June 2025 and in April 2026 fell to 6.86 while initial production dropped to a new low of 406 kb/d. Reeves county is in its declining phase.
The rig count is time shifted forward by 7 months.
In real June 2025, 29 rigs were operational in Reeves county. By late May 2026 the rig count had risen to 16 from a February low of 10. Regardless of the current increase, 29 rigs to 17 rigs is a large drop in 11 months. The large drop shows up starting in time shifted February 2026.
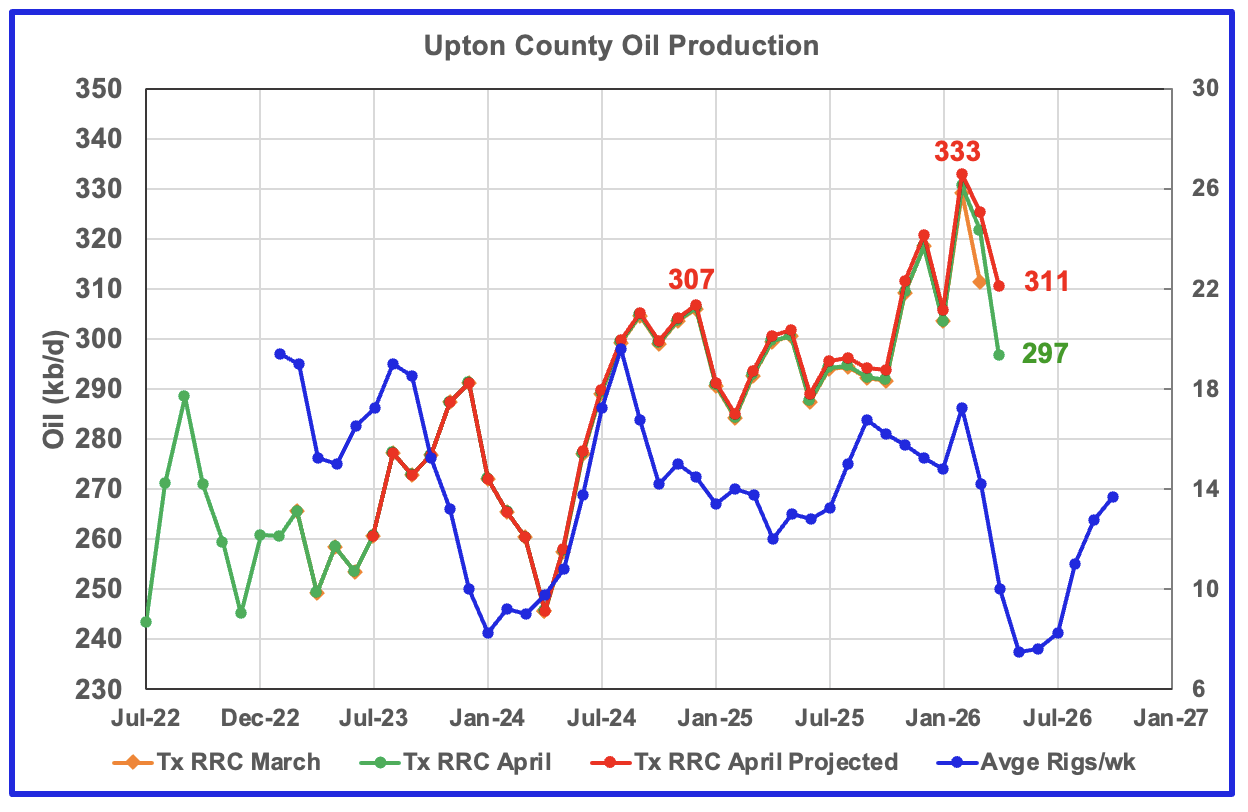
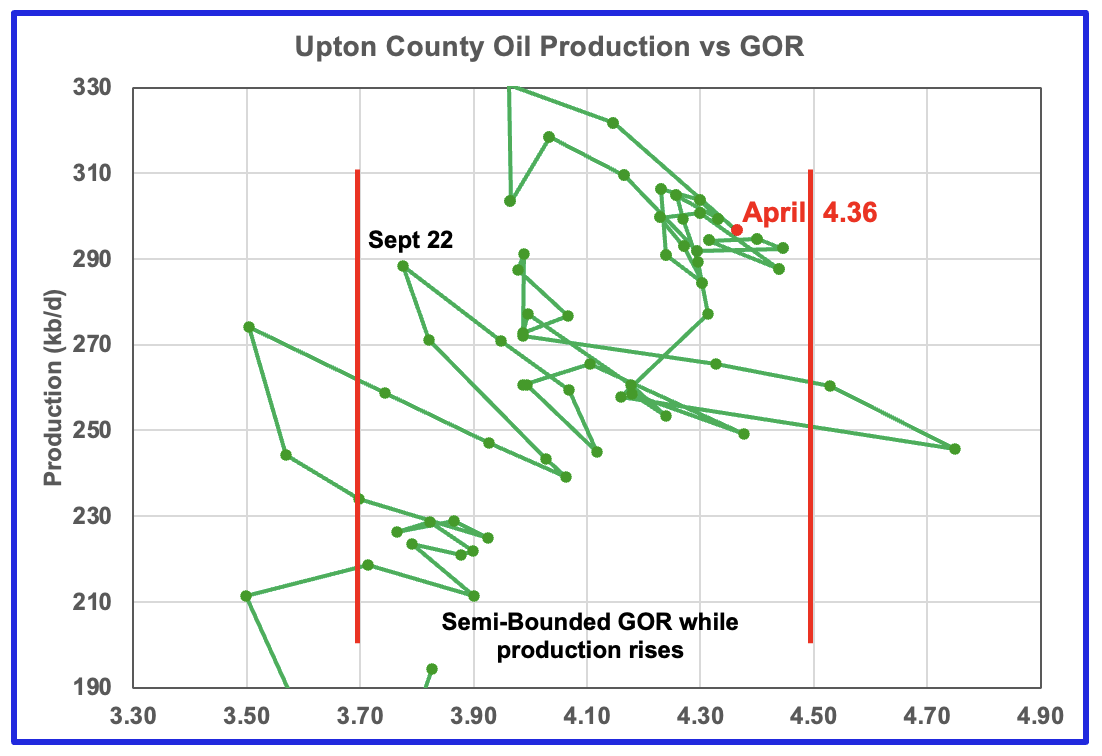
Upton’s projected April production dropped by 14 kb/d to 311 kb/d.
For the next few months Upton County may see a production decrease associated with the dropping rig count which started in time shifted March 2026.
Upton’s GOR continues to stay within the Semi-Bounded region but rose to 4.36 in April.
Upton’s rig chart has been time shifted forward by five months. Upton began 2026 with 7.6 rigs, time shifted to May 2026. In real May 2026, the rig count had risen to 14.
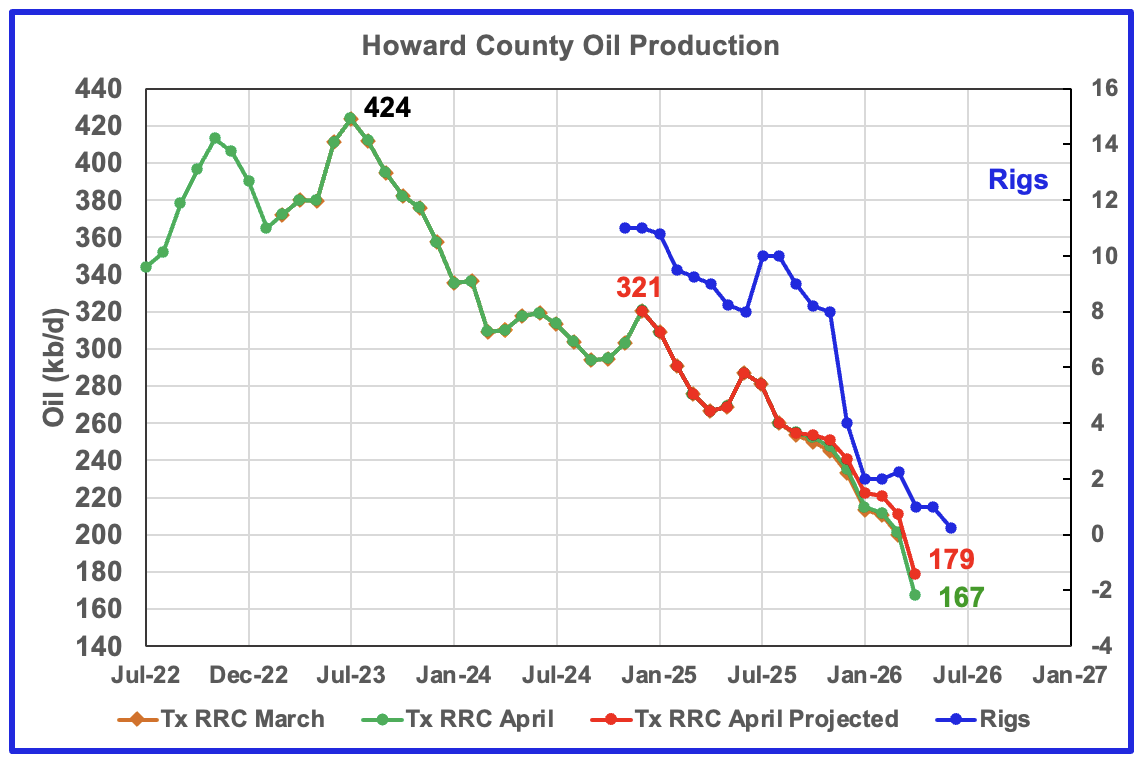
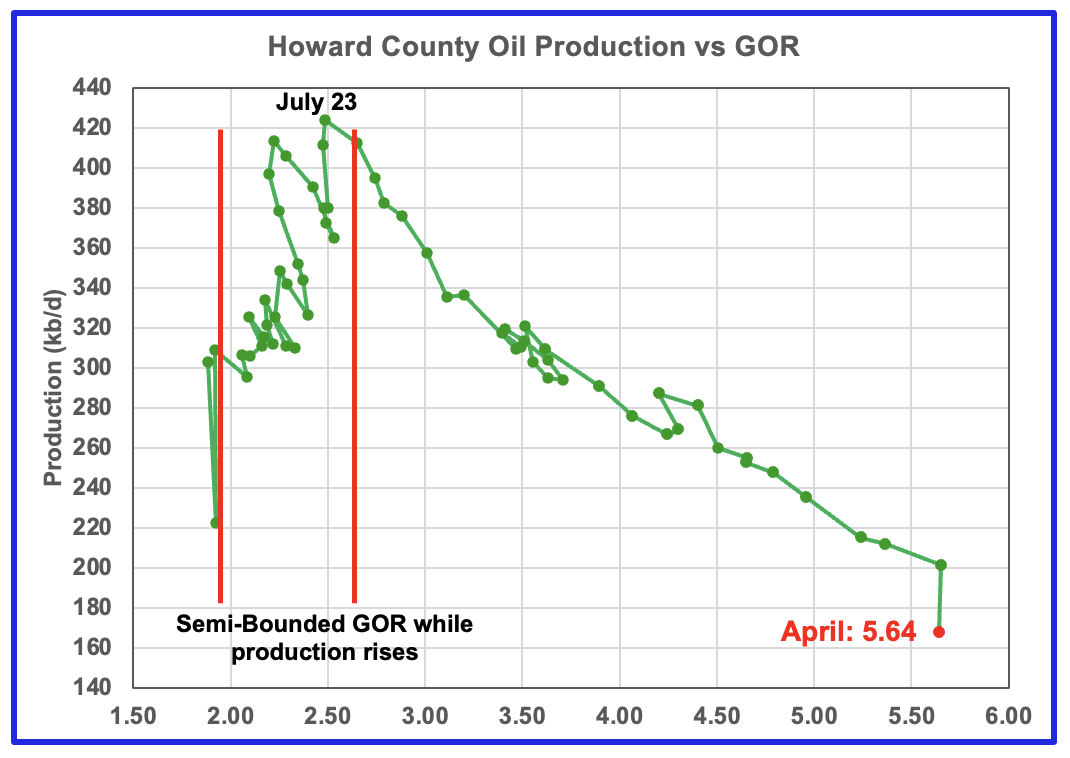
Howard County oil production peaked in July 2023 and has been in a slow decline ever since. April projected production dropped by 32 kb/d to 179 kb/d while preliminary production was 167 kb/d.
Note the rig count in time shifted June 2026 is 0.25, i.e. 1 rig for one week in real January 2026. The rig graph is time shifted forward by 5 months. In real April 2026, Howard added one rig for a total of one operational rig.
For April the GOR dropped slightly to 5.64 as the initial production dropped to 167 kb/d.
Drilling Productivity Report
The Drilling Productivity Report (DPR) uses recent data on the total number of drilling rigs in operation along with estimates of drilling productivity and estimated changes in production from existing oil wells to provide estimated changes in oil production for the principal tight oil regions. The new DPR report in the STEO provides production up to March 2026. The report also projects output to December 2027 for a number of basins. The DUC charts and Drilled Wells charts are also updated to April 2026.
The DPR has made been significant upward changes to the oil production forecasts for the three tight oil basins, Permian, Eagle Ford and Bakken reported here. It is not clear if the increases are related to the sudden rise in the WTI oil price from $65/barrel in February 2026 to over $100/b in March 2026. While production starts to rise in October 2026 all the way to December 2027, the price of WTI slowly drops back to $64/b in December 2027.
The forecast seems be model driven whereby increases in the oil price brings on new drilling and the associated increase in oil production. Also interestingly there appears to be the typical six to seven month delay from February 2026 before production begins to rise. The only flaw in this possibility is that oil prices fall steadily from March 2026 to December 2027. Also there has been no reported significant increase in drilling rigs in March and April 2026.
For the Permian, production was expected to increase in October 2026 because there was an expectation that new gas pipelines were being built that would permit more high GOR oil wells to be drilled. However the projected increase has been increased further.
So at this time, it is not clear if the sudden production increase starting in the September/October time frame is simply a partially driven model forecast or related to pure Hopium.
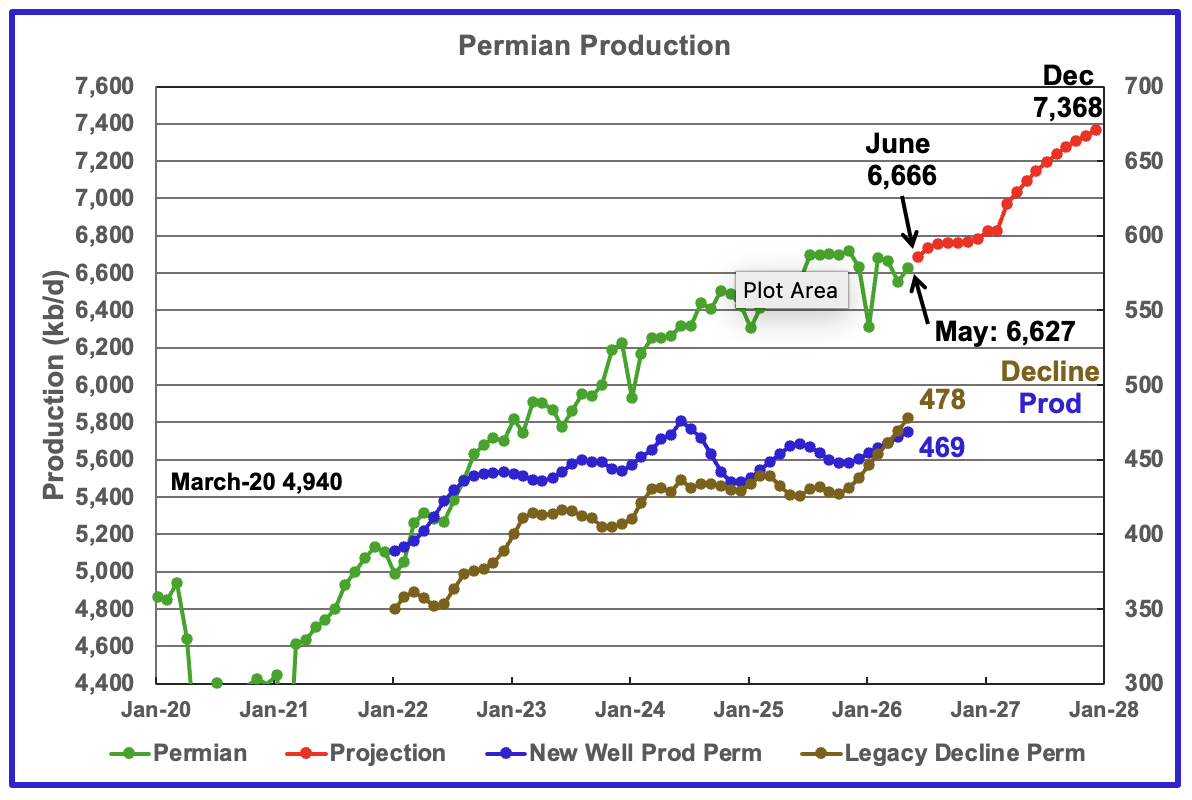
The EIA’s June STEO/DPR report shows Permian May output rose by 77 kb/d to 6,627 kb/d. June production is expected to increase by 39 kb/d to 6,666 kb/d. From June 2026 to December 2027 output is expected to increase by 702 kb/d to 7,368 kb/d. December 2027 production has been revised up by 178 kb/d from the previous report.
Note that production begins to rise steadily from March 2027 to December 2027. According to the EIA, this is due to higher prices for WTI and more NG pipelines being built. The gas pipelines are needed to capture the associated flared gas coming from new oil wells.
Production from new wells and legacy decline, right scale, have been added to this chart to show the difference between new production and legacy decline.
These numbers reflect a one year production trend and provide the production contribution from new wells over a rolling 12-month period to determine if the rate of new production is increasing or decreasing compared to previous periods. The averaging process approximately adds a six month delay.
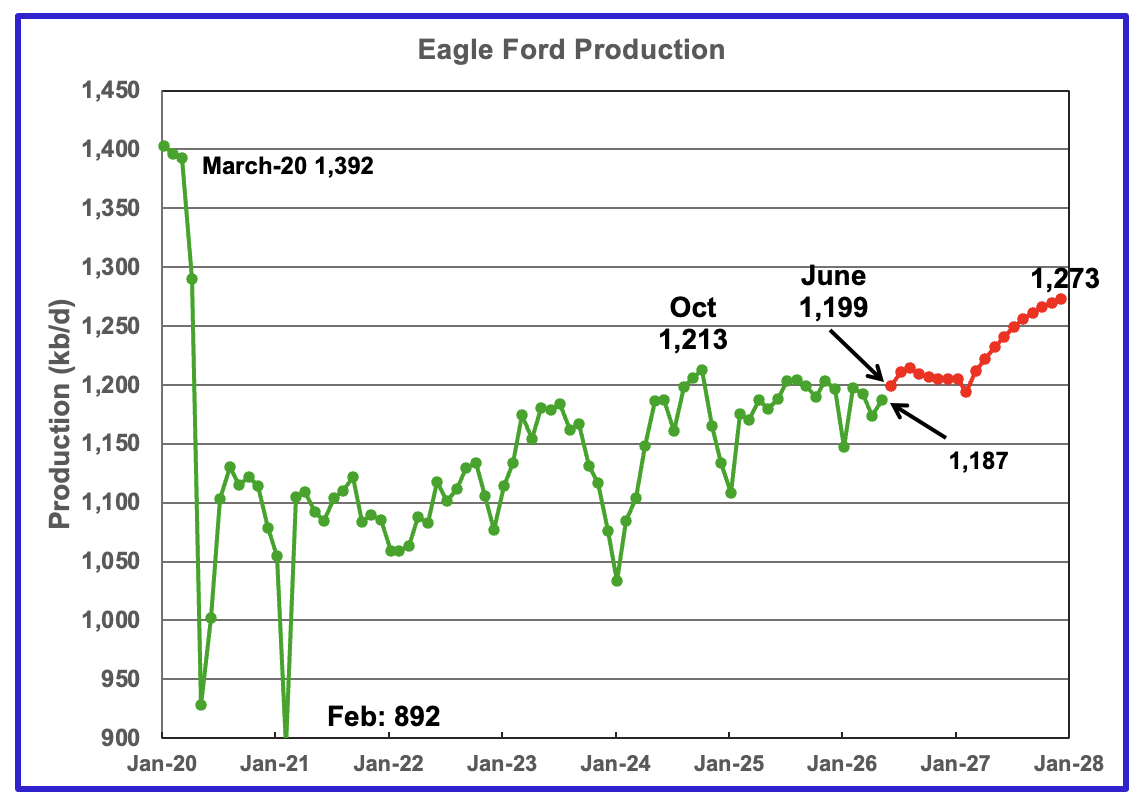
May output in the Eagle Ford basin increased by 13 kb/d to 1,187 kb/d. June 2026 production is forecast to rise by 12 kb/d to 1,199 kb/d.
Output in December 2027 is expected to be 1,273 kb/d, revised up by 23 kb/d from the previous report.
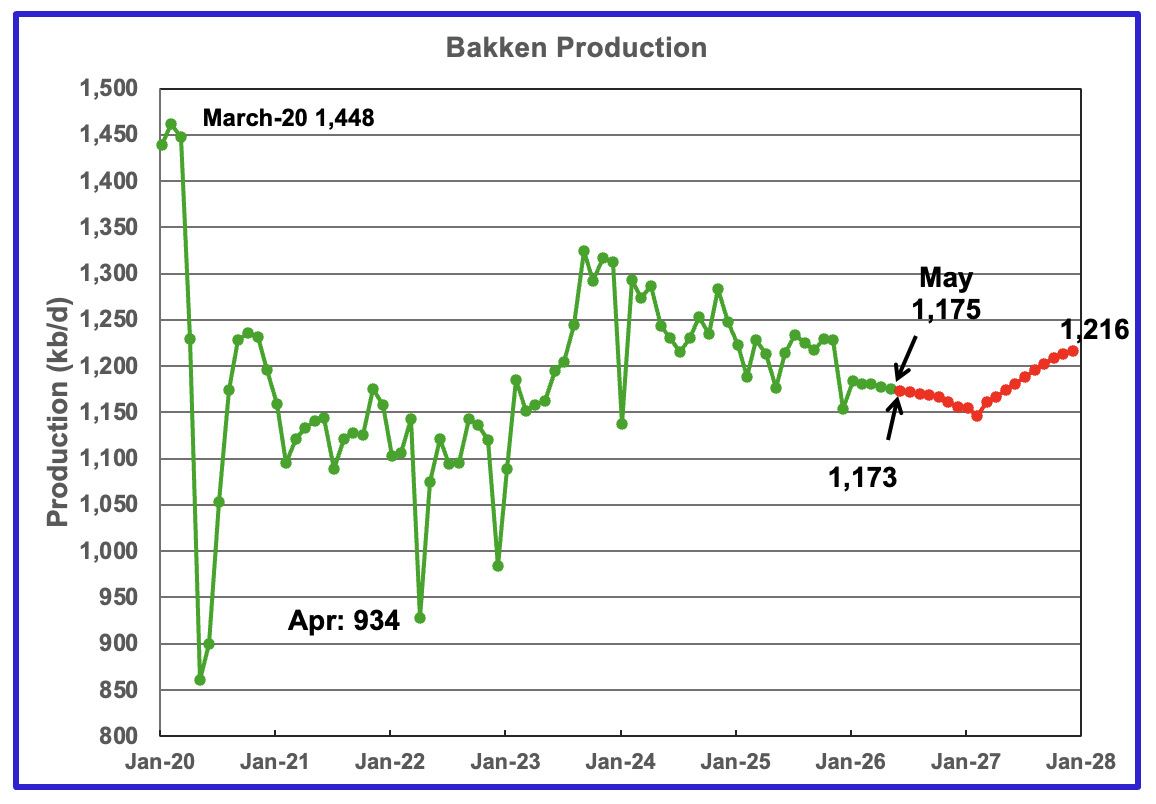
The DPR/STEO reported the Bakken’s May output dropped by 2 kb/d to 1,175 kb/d. June 2026 production is expected to decrease by 2 kb/d to 1,173 kb/d. The STEO/DPR projection, red markers, shows output rising to 1,216 kb/d in December 2027, revised down by 20 kb/d from the previous report.
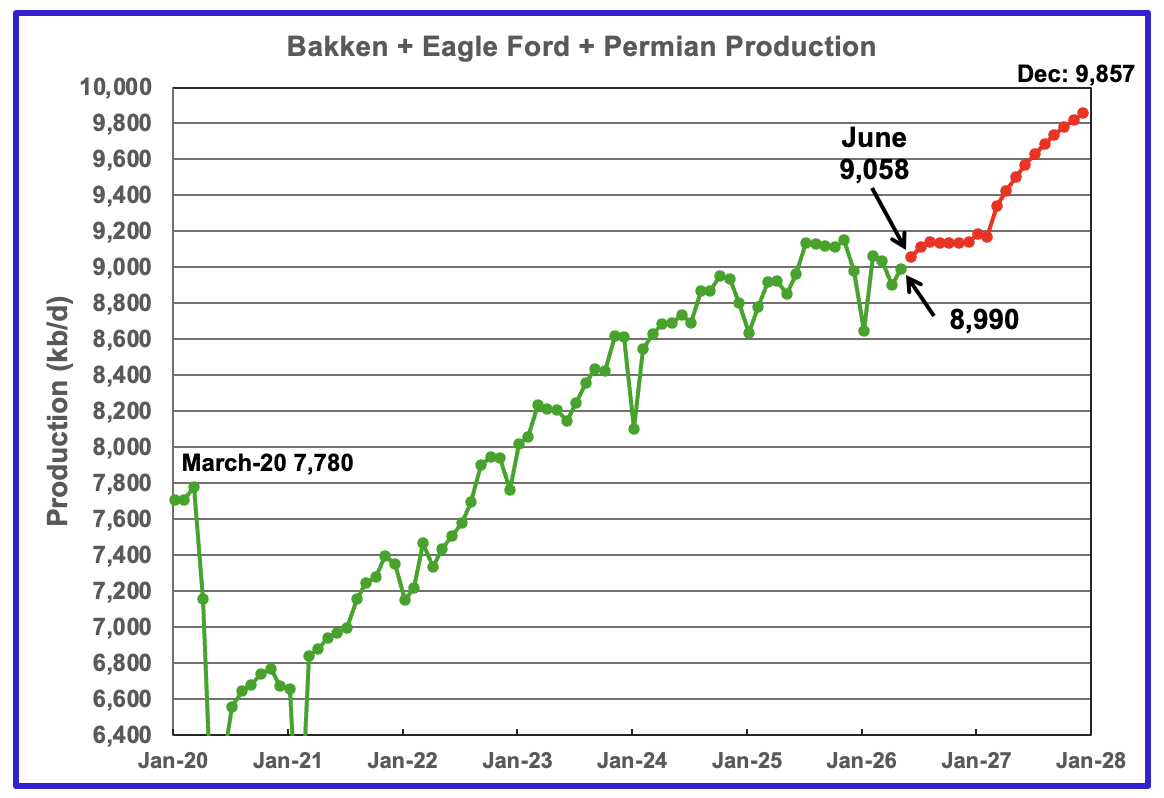
This chart plots the combined production from the three main LTO regions. May output increased by 88 kb/d to 8,990 kb/d. June is expected to add 68 kb/d to 9,058 kb/d. Production for December 2027 is forecast to be 9,857 kb/d, revised up by 181 kb/d from the previous report.
DUCs and Drilled Wells
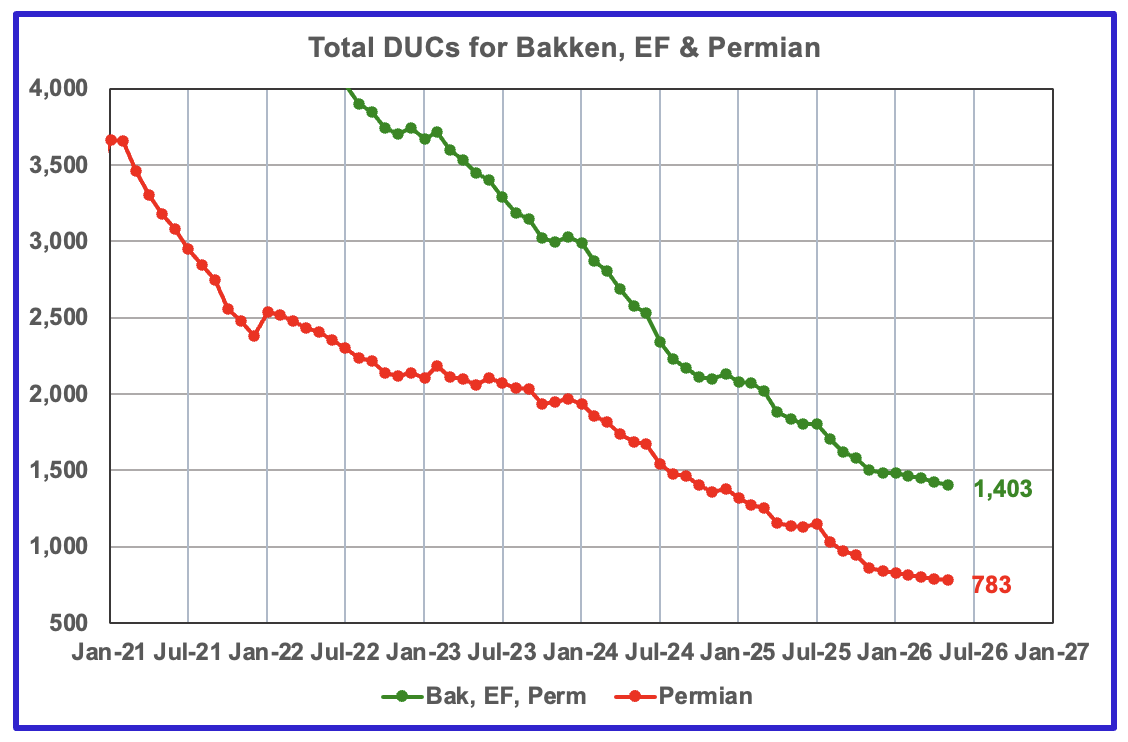
The number of DUCs available for completion in the Permian and the three major DPR regions continues its dropping trend. The May DUC count for the three basins dropped by 18 to 1,403. In the Permian the DUC count dropped by 5 to 783.
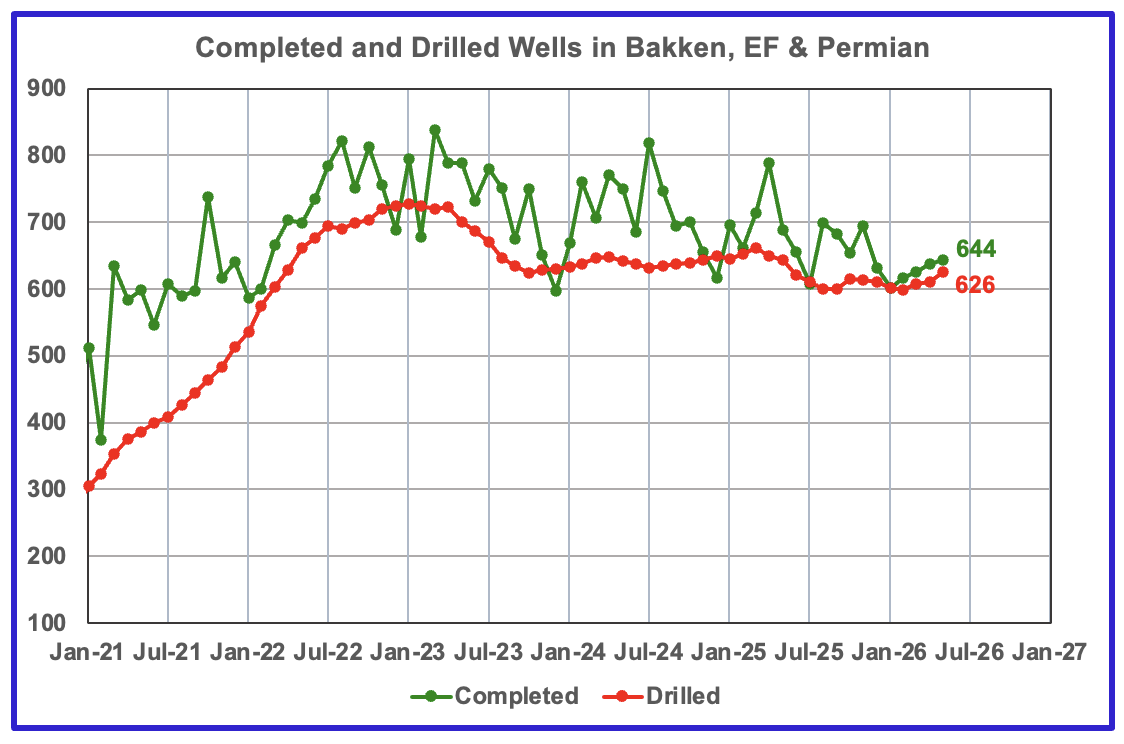
In the three primary regions, a total of 644 wells were completed in May, 6 more than in April. There were 626 wells drilled in May 2026, up 16 from April 2026.
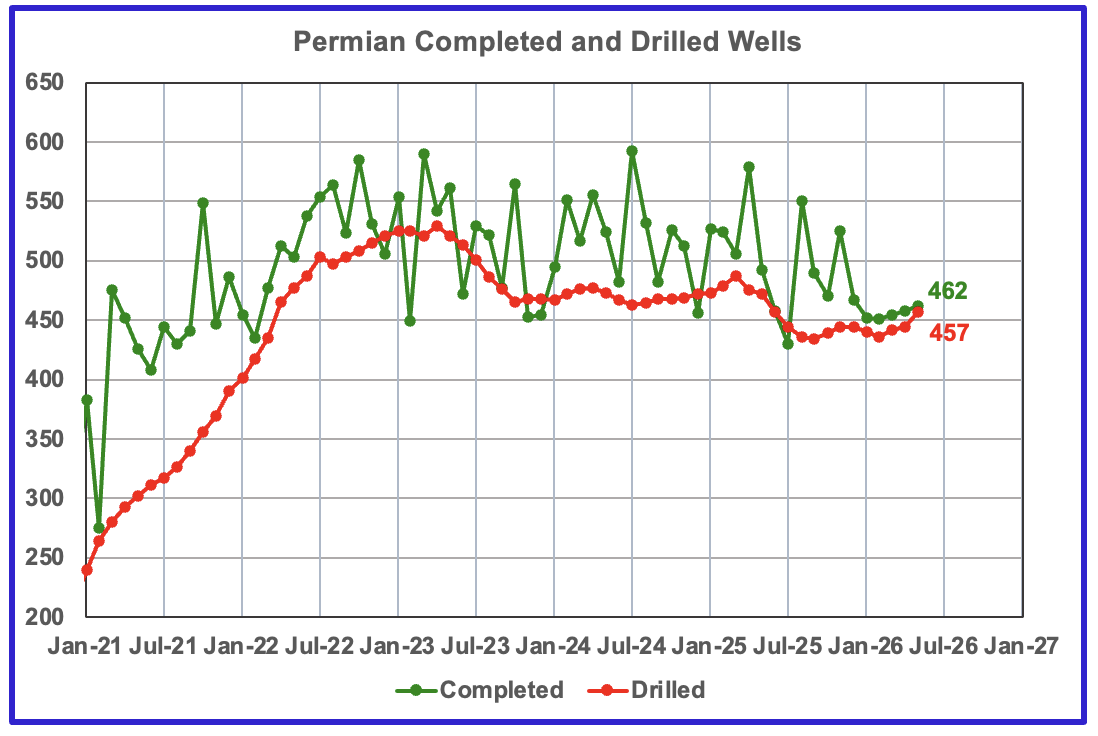
In the Permian, 462 wells were completed in May and 457 were drilled. Drilling and completions have been increasing since March.
173 responses to “US April Oil Production: Another Record High”
Ovi,
Thanks – as always – for the time and effort both you and Dennis put forth on this site.
Coffeeguyzz
Thanks. Much appreciated.
Trump renews Greenland threats at NATO summit, says U.S. could remove troops from Europe
https://finance.yahoo.com/energy/articles/oil-gains-us-revokes-license-192347677.html
thanks for the detailed and concise plots, Ovi!
GOM is amazing considering the production drilling activity has been lower than previous year, and yet it is passing a new record of 2.1MMBOPD!!! Just shows that the lower GOR & API oil could actually produce efficiently.
The decline curves probably got much less steep than previously predicted by BOEM using regular higher GOR&API decline curves.
Also makes one wonder if the heavy oil subsalt might be produced as well.
During drilling the ultra-deep 30Kft subsalt wells, heavy oils are frequently encountered and they automatically flood the hole, and prevent reaching the target, causing months of delay and significantly increased the price tag for each well.
We are probably seeing the oil production benefits from the slightly higher rig activity from last year. The attached chart shows the top 10 GOM producing fields, from Sept-2025 through April-2026. Note that 6 of these fields are subsalt and another 2 are partially subsalt. The most significant new fields to come on line in the Gulf in the last year+ are Anchor, Shenandoah, Salamanca and Whale. Whale and Shenandoah are in this top 10 list. Anchor and Shenandoah are also 20 K fields.
The Miocene fields are still doing very well – 6 of the top 10 fields are from Miocene reservoirs.
GOM_top_oil_producers
mistake on graphic,, Atlantis first oil was 2007,,
here is the link to the slowing GOA production, only 10 rigs supporting the 2MMBOPD production, and the number of wells drilled per rig per year probably is only 12!!!
whereas in Permian, as shown above by OVI, need almost 50~70 rigs in top 2~3 counties to support ~2 million BOPD production
https://budsoffshoreenergy.com/2025/09/03/only-10-active-rigs-in-the-gulf-of-america/
Horizontal plus Directional Oil Rigs in GOM have been between 5 and 20 since Jan 20, 2017, for most recent Baker Hughes report the count was 8. There have always been fewer rigs operating in the GOM than onshore US this is nothing new.
DC,
It is obvious for sure that offshore always has much fewer rig numbers than onshore.
I am suggesting the off-shore rigs in ultra-deep water GOA has been sinking in past year or so and yet the production holds up and even increase — a result of lower decline in ultra-deep presalt low GOR&API production?
Sheng Wu,
Rig count has been relatively constant in GOM since early 2017. There have been a number of newish fields or extensions to old fields that have occurred, output will vary from well to well and from field to field.
I’m a bit confused as to where these low deepwater GOM rig count numbers are coming from. I regularly go to BSEE’s Deepwater activity report, which is updated weekly, and I see GOM rig counts in the 20-30 range. I know some of these rigs are doing decommissioning/abandonment work, but I am quite sure most of them are engaged in active drilling, completion or workover activities.
https://www.bsee.gov/stats-facts/offshore-information/deepwater-activity
I’m becoming convinced that about half of the 20+ wells on the BSEE list are actually not drilling new wells but either doing completions, workovers or sidetracks. That would fit with the 8-10 drilling wells that others are talking about.
Bob,
My data is based on Baker Hughes data from link below
https://rigcount.bakerhughes.com/na-rig-count
Not clear why there is a difference.
Thanks Dennis,
The Baker rig count is the one most often quoted. BH must just include actively drilling new wells, while the BSEE data includes that plus rigs engaged in any other type of well activity.
I guess it’s all been said, but there are some of the best analysts around on this site, and I’m a little disappointed there’s not more conversation happening around what is going on. When Iran fired at 3 commercial ships in the last 24 hours, it didn’t show up in the New York Times app until this evening, when I first heard about it during a Mario Nawfal sometime in early afternoon. Have you all been listening to that podcast? He has some whackos and propagandists on for sure, but from all sides, and an equal number of really interesting and well-informed guest speakers. We are talking about an oil glut with a billion barrels missing from a market that started with a baseline at $65? China mysteriously cut off 3 million barrels a day instantly with no apparent impact? SPR still falling off a cliff? Cushing at operating level? What the actual bleep is going on ya’ll? The peak oil folks should be ON TOP of this. Really appreciate this site regardless, just don’t understand why it is not on fire right now.
Hey Nnoxks,
Thanks for sharing!
Yes, I’ve noticed Mario Nawfal’s podcast, and I agree he’s got a wide spectrum of guests. Many of whom appear to have been reasonably on point as well as heavily promoted in social media (youtube, substack, twitter, etc.) lately, so on some level I feel like his platform is informative, but also some sort of psyop/manipulation (no idea where they are trying to take us, just notice it happening).
“didn’t show up in the New York Times app until this evening”
Yep, HUGE time gaps between events as broadcast on realtive geopolitics telegram channels and mainstream media. Normally, this would be a faboulous arbitrage opportunity, but something else is afoot……
“What the actual bleep is going on ya’ll?”
100%!!!!
Weirdest conditions in a large commodity market I recall seeing.
Rumors/talk that China is likely to start normalizing crude imports — just as the war kicks off again.
Are they going to ramp up the pendulum the other way now?
Crazy times….
Nn, I’m nobody, but I have a comment box so:
Peak oil was about resource depletion to me. The big revelation was how much the government would print and get thrown at fracking. It is downhill production pulled forward (along with continuing depletion of conventionally produced oil) that makes the peak higher and the eventual decline steeper.
I get the feeling that everyone betting on the markets knows the economy is a house of cards and they are just afraid to breathe for fear of it coming down. We’ve been in a series of bubbles over the decades with the AI version being the latest. The AI market bubble I think directly feeds the “hold your breath and don’t rock the boat” sentiment in oil. Just hang on until ASI eliminates that pesky labor expense and it’ll be great, don’t crash everything over oil, after all ‘merica is the King!
Before this was the fracking bubble, housing bubble, dot com bubble, S&L crisis, etc. All the way back to the “Hey lets make money imaginary so we can print all we want!” idea—right there with the “Only tax labor and not capital” brainstorm.
2¢ worth..
the real low cost profitable oil left mostly untapped is Venezuela, China/Russia and even Iran spent a lot and saw it is picking up.
The mainstream like to talk about SPR depletion, China demand and 1BBO loss, and yet green washing Venezuela as “heavy, polluting, and require decades and 100s billions”.
There is a new AI computing achitecture coming, UMA, integrating 100s GB of ultra-high speed bandwidth memory + 100s of CPU , and with Chatbot OS, replacing current WINTEL CPU+ Windows/OS. Centralized data center will be obsolete as old mainframe supercomputers.
DeepSeek did pretty good using a fraction of the compute the leading US models use. The market blinked once then went right on dumping money into data centers. Maybe those centers will be like the fiber optics of the ’90s, eventually valuable, or maybe just a sink for excess dollars.
THC – Some of Nawfal’s guests are definitely propogandists, shills and conspiracy theorists, but he seems just to enjoy talking to an interesting array of folks, and he does it all day long while tracking the news from multiple sources in real time. He seems legitimately obsessed with the war and for anyone who wants those real-time updates, that is the place to check. His guests vary so greatly in political perspective it is hard to pin a particular agenda on him. I do see a lot of the same folks coming up elsewhere on my feed, but I suspect that’s because the algorithm notices my watch patterns. As of now, the war seems back on in full swing, Hormuz closed again, the SPR posted another big draw, and WTI jumped to a whopping $73. Crazy times indeed.
Pops – I think it still is about resource depletion, but the closing of Hormuz should be an absolutely fascinating case study for real-world reaction to sudden decreases in oil supply, even if it is geopolitical in this case rather than environmental. Where are the deep analyses of China’s oil situation? Or how much is actually coming out of the gulf? How much production is happening in the gulf, vs loading overflowing storage? Even if it’s a lot of speculation, that seems like it’s far more interesting right now than if the US managed to pump out a few hundred thousand extra barrels of production.
Sheng Wu – You are talking about Venezuela and AI computing architecture? I don’t understand the relevance. Venezuela is producing a bit more oil, but at 1.18 million barrels in May vs 1.14 million six months prior, this is a negligible impact vs Hormuz closure. Maybe ten years from now Venezuela will have a significant production. We are talking about right now, next few months.
Nnoxks,
We get a new OPEC MOMR in about a week, the June MOMR has 4Q2025 OPEC output at 28496 kb/d and May 2026 OPEC output at 18829 kb/d, some 9667 kb/d less due to the Hormuz closure. At some point the storage tanks reach minimum operating levels if the disruption continues. So far it has been about 120 days since the war started so roughly a billion fewer barrels have been reaching market from the Middle East over that period and it is likely that World crude stocks have been reduced by about a billion barrels. When the crisis hits and the World realizes that Trump has no clothes, things will get interesting.
Nn, back in the day I tried to understand the trend and the potential as a neophyte. But even in the macro scale the error bars are huge. Jean Laherrère used to say the implied precision of lots of digits was misleading as to their accuracy and I think that’s right. He preferred using Giga-Barrels: 1,800GBbl produced so far, maybe 2,200-2,500GBbls eventual.
Point being the tiny amounts we are talking about that can freeze up the economy if the pipes fall below minimum operating levels are just rounding errors—within the margin of error to all the (at least free) sources and so delayed as to be worthless.
Having said that, I think there is no other place left where “peak oil” isn’t seen as a punch line beside here. As they say in the Pinstripe Casino, “Being early is often indistinguishable from being wrong.”
Just how I see it anyway.
DC (and Pops) – To be clear, I am incredibly grateful that this site exists, and I do appreciate the effort and expertise that goes into it. I suppose I was just expressing frustration that this massive event is happening and all the best amateur analysts are, as far as I am concerned, here on this site, but it is quieter than I would have expected. A hundred or so comments per post is about average for the past few years. This is the biggest event in the world of oil at least since the wild times of 2007-2014, so I thought there would be a wild flurry of activity. Maybe that is yet to come, as you suggest Dennis. I definitely don’t want the folks here to stop doing what they are doing. I look forward to the next OPEC update.
Hey Nnoxks,
Thanks again for the convo!
Re Nawfal, I find this an interesting topic (psyops/media/algos manipulating public opinion).
During covid the manipulation of the public mindset (dancing nurses, nonsensical rules and coerction, etc.) by mainstream media was blatant. Those that ventured into alternative media, podasting platforms, etc. found a vastly different pool of info that was at least partially true, but also contained all sorts of new false narratives and manipulations.
Out of one frying pan and into another!
This also creates a highly effecitve “divide and conquer” situation where the public is divided into groups arguing with one another rather than trying to figure out what is really going on.
Ukraine felt somewhat similar (amazed that horror show is still ongoing).
And now, as I am actively involved with oil investing/trading, I have felt heavily manipulated during the Hormuz crisis. It’s been a wild ride.
What is the role of these platforms and the many pundits that cross promote during these various events (covid, Ukraine, Hormuz)? One can’t be sure, but just noticing that it is happening helps to keep an objective perspective.
One thing I hope to do going forward is look a bit more into the backgrounds of the people I listen to.
Part II
I did a basic web search on Mario’s personal history, and here is a brief summary of what I found.
He has a most colorful background, and clearly is motivated to “hustle” for success. Given his intelligence, good looks, and charisma, he seems like someone who might accept “support” in exchange for promoting specific narratives or personalities.
I only recently came into the idea of looking into the background of platforms at the center of “the latest thing” (in this case the Hormuz), so I don’t have many cases to compare him to, but I do recall that one of the right-wing alt-covid platform hosts (Stew Peters) was previously a “bounty hunter” youtuber, as well as a rapper with the stage name “Fokiss” (https://www.youtube.com/watch?v=rtSzWOG5oOw&list=RDrtSzWOG5oOw&start_radio=1).
Back to Nawfal…..
**Origins**
Born in Lebanon, holder of Australian and Lebanese citizenship -> nice foundation for commentary on Middle East conflicts, especially involving Lebanon.
**Professional history**
1. Started his entrepreneurial career selling blenders door-to-door. In 2013, he founded Froothie, a kitchen appliance and health/wellness brand.
2. 2017 ~ Founded the International Blockchain Consulting (IBC) Group.
3. NFT Tech (2020): Co-founded NFT Technologies.
**Fraud suspicions/incidents**
1. Crypto Pump/dump/rugs of tokens such as “ROSS” and “GAY.”
https://protos.com/mario-nawfal-cant-shake-doubts-over-shady-ross-token-promo/
2. FBI and SEC respond to complaints about Twitter audio star Mario Nawfal
https://www.nbcnews.com/tech/social-media/mario-nawfal-fbi-sec-twitter-rcna91412
3. Claims that “Nawfal’s meteoric rise from a little-known businessman to a seemingly omnipresent Twitter celebrity has been met by growing scrutiny from former colleagues who say Nawfal’s public persona of business and social media success has been built in part on broken promises and highly calculated and orchestrated growth hacking efforts”
https://www.aol.com/rising-twitter-star-boosted-elon-150323634.html
Part III (last one, I promise!)
I went back and picked up names of recent Mario Nawfal interviewees who I have heard of (been exposed to by social media alogos) and seem to be part of a Hormuz related narrative.
Having selected and listed these names from recent interviews, I now see that currently the podcast is oriented towards alt-geopolitics and oil-scarcity related content.
I can understand why he would pop up in my youtube and twitter feeds.
~~Brandon J. Weichert~~
*New to me (promoted on my feeds)
*Analysis of Hormuz sounds reasonable.
*Background with US House of Rep. and DoD (MIC?)
~~Larry Johnson~~
*”Retired” CIA analyst (do they really “retire”?)
*Prolific in alt-geopolitics Ukraine commentary (“Russia is winning” narrative)
*Apparently C1A agents sign NDAs that are binding for one’s lifetime (=unlikely he can speak freely in live interviews without clearance).
~~Col. Macgregor~~
*Prolific in alt-geopolitics Ukraine commentary (“Russia is winning” narrative)
*Long army career
*Appointed by Trump as Senior Advisor to the Acting Secretary of Defense (MIC?)
~~Robert Pape~~
*Long career as professor in international relations
*Suddently ALL OVER twitter, youtube, and substack since start of Hormuz
*Specialist in fields of terrorism, coercion, airpower (MIC?)
~~Pepe Escobar~~
*Long-history in alt-media geopolitics
*Pro-BRICs/Russia narrative
~~Chris Martenson~~
*Long history in alt-investing media relating to oil, gold, resources, peak-oil
~~Jeffery Currie~~
*Strong credentials in mainstream commodities/oil analysis
*Peak oil
At some point the US will be at post peak production phase. I was wondering how much domestic oil production the US would need at current use levels if the percent now used for light transport sector was no longer part of the demand pie (electrified).
“Light-duty vehicles (cars and SUVs) and light trucks account for roughly 53% to 55% of the total petroleum used for U.S. transportation. Since the transportation sector consumes about 66% of all petroleum in the country, domestic light transport utilizes approximately 35% of all U.S. petroleum production.”
So roughly 1/3rd of oil demand could be phased out fairly quickly (one decade) without an economic catastrophe, as things currently sit.
The breakdown of how the U.S. transportation sector allocates its petroleum demand breaks down as follows:
Light Vehicles (cars and motorcycles): ~19%
Light Trucks (including SUVs): ~33%
Heavy-Duty Trucks & Other Freight: ~23%
Aircraft: ~12%
Boats, Ships, Trains, Pipelines, and Military: ~13%
Hickory,
What’s your source? It looks a little low to me, for the US. The below suggests that light vehicles account for 42% of petroleum consumption (.46 x .91).
“In 2025, total gasoline consumption, based on energy content, accounted for about 56% of total energy consumption in the transportation sector and 16% of U.S. total energy consumption, and based on volume, 46% of total petroleum consumption.1
Light-duty vehicles (cars, sport utility vehicles, and small trucks) account for about 91% of all gasoline consumption in the United States.2”
https://www.eia.gov/energyexplained/gasoline/use-of-gasoline.php
https://understand-energy.stanford.edu/energy-services/energy-transportation
Regardless of the particular numbers, the reality based take home message is as it is.
“the reality based take home message is as it is.”
That’s very true. The reality is that projections of an imminent supply peak are speculative – we’ve seen similar projections of an immminent peak…forever. We can’t wait and hope that depletion takes care of our oil dependency and the problems it creates. We need to act to reduce FF consumption ASAP.
The striking thing here is that the solutions to PO and climate change are very similar: moving away from FF ASAP.
Ask yourself: if you were suddenly president, what energy policies would you implement?
this Green river shale could be next Vaca Muerta in US/North America
https://www.youtube.com/watch?v=khxsDAfSdV4
the problem with VM and Green River and CHina Hyper saline shale:
current mainstream, including professional geologists, all believe those shale oil with lower GOR (<350scf/bbl)and API (<35deg API) means lower maturity, and could not be produced.
So, in VM, EIA in 2013 gives reserve GOR at 3:1 and only 16GB oil, but past 6 years of production shows that the real reserve is probably GOR at 1:1 or even 1:2, with 50~100GB of oil — all backed up by production data and my isotope maturity model, but so far only me has publications and web posts about this, nobody else dare even to say such low GOR and API shale oil could be produced efficiently. Similar thing also happened in China, and even in Venezuela conventional heavy crude and GOA low GOR&API crude, all the professionals still use viscosity as the killer for low GOR&API production.
Sheng Wu,
You do realize that there is a difference between Kerogen and tight oil, I hope? The Green River shale is a kerogen deposit and will be an energy sink rather than an energy source if anyone is foolish enough to bother with it.
yes, DC
I do realize the difference between Kerogen and tight shale oil, basically they are different in maturity.
The main stream geologists have been totally dialed back to stone age with the current pyrolysis Tmax method, and violently lowered estimate the maturity, and further confused with the lower GOR and API. The previous technology was to read the vitrinite Reflection (vRo) which could also be confusing, i.e. in China Bohai bay, the vRo constantly read the deep shales to be immature, but turns out that the current temperature is the paleo-high (historic high) and kept on sinking deeper for the past 15~20 million years. From the current TVD temperature reading, there is no doubt it is already well cooked into oil and even condensate window (vRo=1.0~1.3%), but vRo reads immature (0.35~0.5%) . But I compare the isotope, the maturity in Bohai is same or higher than Permian in NM/TX.
The same method and logic that drive Shell’s heating experiment in Green River is that the maturity is too low. But 25 years ago, the modern fracking was not available, and the formation is deemed just too low maturity as well due to vRo and Tmax. In China, there is a similar formation (chang7-3) also deemed too low maturity with extra-high TOC and Tmax reads <0.5%, but the shallower formation (Chang7-1,2) read 0.7% and already producing shale oil. Now preliminary shale drilling also revealed this "low maturity" shale could produce better than upper shale. But, 20 years ago, CNPC initiated similar project in Chang7-3 like Shell did 20 years ago in Green River — all based on the same false stone-age Tmax logic, need higher maturity to get the oil flowing.
You are saying that ‘mainstream geologists’ are theoretically wrong about the Kerogen,
but practically right?
Hickory,
The mainstream geologists have already read the maturity close to the real values for the marine sourced basins in North America, and they all realize that the pyrolysis Tmax reading is not reliable at all, if totally confusing and lower the maturity significantly. Yet, this Tmax method is in the college petroleum textbook for maturity and easy to be used as multimeter in geochemistry, and every basin research will do the Tmax test and arrive at the wrong conclusion, yes, they could even classify many oil producing kerogens (e.g. Permian) as gas producing kerogens, besides significantly lower the maturity.
In hypersaline lacustrine sourced kerogen, which the Green River is the textbook type I oil producing source rock kerogen, Tmax constantly classify it as type II or even type III, similar to Permian. Of course, Tmax also significantly lower the maturity as well. So, the shallower GreenRiver at 2.5km might read 0.35~0.5% but actually already at 0.8~0.9% (peak oil maturity), and this already happened in many places, i.e. Vaca muerta and Bohai Bay.
In Vaca Muerta, geologists already knew Tmax give ~0.3% lower maturity than vRo (the old reflectance reading method but difficult to use and nowadays few operators could use/operate the reading machine), so they trust the vRo which is close to reality, and isotope is slightly higher by 0.05~0.2%. In the currently low GOR&API block, vRo gives 0.8%, and isotope is about 0.9~1.0%. But there is also the drastically lower GOR&API for the same maturity, i.e 0.9% permian will give 42deg oil and GOR about 600~900scf/bbl, but in Vaca Muerta 0.9% will give 25deg oil and GOR about 60~100scf/bbl. The misread lowered maturity coupled with the low GOR&API nature confuse mainstream geologist that blocks in Vaca Muerta or Bohai have too low maturity or even maturity is ok, the low GOR and API make them ~zero productivity. The fact, however, shows exactly opposite.
And therefore…?
In the USA, you would be “better” to go to CTL (coal) than the green river shale.
Australia needs to go to CTL and buy USA/UK submarines or will be working assembly lines 24/7 for the Chinese.
And for those billionaires that want to move to New Zealand to escape overshoot collapse, GOOGLE search where China parked its destroyer flotilla ( off the coast of New Zealand ).
You heard it hear first!
Andre,
Yes, CTL is better than kerogen, but that’s not saying much. Both are expensive and dirty.
Far, far cheaper, faster, cleaner to simply electrify transportation.
Let us know when this changes-
-“The Energy Return on Investment (EROEI) of Coal-to-Liquids (CTL) is famously low, typically estimated at around 0.9:1 to 1.2:1. This means the process actually consumes nearly as much (or more) raw energy to mine, process, and refine the coal into liquid fuel as the final liquid fuel delivers to society. ”
-“The EROEI (Energy Return on Energy Invested) for converting solid kerogen into synthetic liquid fuels (via oil shale extraction) is notoriously low, typically ranging between 1.4 and 1.5.”
-“The current Energy Return on Investment (EROI) for green hydrogen production methods remains significantly lower than that of conventional hydrogen production from fossil fuels. While traditional grey hydrogen from natural gas steam reforming typically achieves EROI values of 7-10, most green hydrogen pathways currently struggle to exceed EROI values of 2-3, with some analyses suggesting figures as low as 0.7-1.5 for certain electrolysis configurations.”
-“The Energy Return on Energy Invested (ERoEI or EROI) of solar photovoltaics (PV) typically ranges from 10:1 to 20:1. This means that for every 1 unit of energy invested in manufacturing, installation, and materials, the system generates 10 to 20 units of usable electricity over its 25 to 30-year lifespan”
To look for real-world evidence of this concept in practice just see what the global energy industry is deploying at scale- “Photovoltaic (PV) solar accounts for approximately 70% of all new electricity generation capacity added globally”, with accelerating pace.
Hickory,
The failed Green River in-situ conversion trial by Shell in 2006 was the post-child of two things,
1. misreading of maturity, and this is still the case, and made worse by the low GOR&APi natures of hypersaline lacustrine sourced shale oil
2. no other efficient viable extraction — at that time shale oil fracking was still considered impossible, see my posts that the industry still don’t believe there is real shale oil, and not to mentioned the low GOR&API shale oil.
It will take time before operators dare to try several impossible things which seems obvious to me,
1. Bakken high TOC shale — make real shale oil,
2. GreenRiver low GOR&API shale — like Vaca Muerta demonstrated, and Uinta preliminary results also confirms, but still majority mainstream dont believe
Hickory,
It helps if you provide the source for your quotes.
In particular, I’m curious about the calculations for E-ROI of hydrogen production:
From the text, the source of the EROI for hydrogen was
https://eureka.patsnap.com/report-energy-return-on-investment-of-green-hydrogen-production-methods
Thanks for all the info on this Sheng Wu. I’m interested to see how some of these attempts play out.
More optimistic on fracking enabled Geothermal (neoGeo) becoming cost competitive and widely deployed over the coming decade.
Nick- simple search will get you what you need, if you are interested.
Hickory,
I misspoke: it wasn’t really the calculations I was curious about, it’s the context. A little searching clarified that people who talk about “hydrogen EROEI” are very likely talking about a system in which hydrogen is the last step. And…that’s a different thing.
H2 electrolysis is really just a conversion from electricity to chemical energy, and the proper way to analyze it is as efficiency, not EROEI. Unfortunately that efficiency is currently pretty low, which is one of the reasons why a “hydrogen economy” doesn’t make sense. H2 does make sense for particular niches, like utility scale seasonal storage, or iron smelting.
Permian Directional plus Horizontal Oil Rigs from 2014 to 2026 in Chart below.
We can drill a lot more feet with fewer rigs today compared to 12 years ago, part of this is higher horsepower rigs today than a decade ago, also rig operations are more efficient when multiple wells are drilled from a single pad which was unusual 12 years ago and commonplace today. Recently there has been a move to electric frack fleets, not sure if this is also the case for drilling rigs.
Picture4
I saw and heard that Chinese e-frac companies already signed up fracing fleets here in US, and they even started OEM production of the turbines powered frac fleets in China for US companies.
Permian horizontal and directional oil rigs at chart linked below.
Picture5
Holy merde,
You guys notice the pump in gasoline and heating oil futures?
BIG move even compared with WTI/Brent.
Products must be TIGHT.
3-2-1 crack spread being reported as at “an all-time high”
https://sg.finance.yahoo.com/news/gas-and-diesel-prices-likely-to-stay-elevated-as-oil-refining-margins-hit-a-record-high-194000714.html
There is a massive volume of OOW at the present time, and China still isn’t buying, the U.S. is hitting new 14mbopd highs outlined nicely on these pages, and the Arab states bordering the Persian Gulf are all piping around the on-again-off-again chokepoint at the Strait of Hormuz. It would appear that the IRGC still thinks it is accepable to run a toll booth in an international waterway that was formed by natural foces. This would really hurt Qatar with its huge complex of LNG trains, and since the U.S. has a large military base there, the toll booth concept is so much rubbish.
So what happens when this current 1.2 billion barrels of OOW hits land and finds a market? Well, that’s a hella lot of oil. I personally think the price will plunge into the low sixtie’s again. There’s another problem: all the Persian Gulf states save KSA had pledged more production, well before the Iran conflict began. I think the IEA finally got it right: we are headed for a substantial surplus and the price could easily bottom out at $50.
If you’re Exxon or Chevron and have refineries and also a piece of Guyana, this price won’t ruin you; the crack spread has always widened during low crude prices. If you’re heavily indebted and have only middling tier 2 tight oil acreage left, you can endure $50 oil for about two drilling cycles, using IP flushes. Even small tight oil company CEO’s knock down a hefty salary, and it’s hard to quit using other people’s money. Additionally, if that’s what you do in life, it’s hard to stop, lay down rigs, lay off crews, and think you’re ever going to start such a company back up again. There may be a flurry of mergers and acquisitions, on the cheap for a change.
So the way I see it, the coming attraction is increased Middle East production, as well as pedal-to-the-metal U.S. tight oil production coupled with aggressive Venezuelan production. Canada also wants to take a piece of the Asian market and step up production (though possibly at the wrong time). Closure of the SOH was interesting but high-energy-cost NATO countries will not stand for a toll booth, and neither will the United States. So watch out below. If I’m reading this right we’re headed for very low oil prices due to supertankers by the score circling the oceans looking for a buyer. And I think that’s exactly what Mr. Trump wants.
Gerry,
Currently Strait of Hormuz is closed, eventually it may open. Also Middle East nations are producing about 10 Mb/d less than before the war, Venezuelan output has not increased by much and neither has US output, maybe combined about 1 Mb/d so for the World we are down a net of about 9 Mb/d as of May 2026. We will see what OPEC output is for June in a few days when the July MOMR is published. Note that the normal level for Oil on Water is between 1.3 and 1.5 Gb (that was the level for 2023 to 2025), for 1Q26 the level was about 1.3 Gb, so 1 Gb of oil on water is about 23% lower than normal.
Also if we consider World crude oil exports in 2025 the average level was 44.4 Mb/d. If we assume World Stocks at a level that can maintain imports at this level for 90 days it implies World Crude oil stocks of about 4 Gb. The deficit in World crude output of around 9 Mb/d for about 120 days would have reduced World Crude stocks by about 1.1 Gb, roughly a 27% deficit from normal level. At some point the market becomes short of oil if Hormuz remains closed.
The question is who opens the Strait of Hormuz? Trump seems uninterested and the EU is not willing to step up. Not sure how this happens without a lot of diplomatic effort. The US seems unwilling to put in the needed effort, maybe EU/NATO tries to accomplish something.
Colin Powell supposedly told Bush that if you break it (Iraq) you have to fix it. Nobody is telling Trump this so nothing gets done it seems.
When we speak of oil on the water aren’t we mostly talking about oil that is headed somewhere? Similar to pipelines.
Or are we talking about oil that has no buyers and is just sitting there in a tanker?
Shallow sand,
Much of the oil on water can be thought of like oil in a pipeline (oil in transit), but some portion of it may be oil stored on water in a tanker looking for a buyer. Some of the sanctioned oil may fall inn this category, though often China or India are wailing to buy this oil at a discount. Tracking this “dark fleet” oil is more of a challenge and the precise proportions are unknown.
Hickory
Energy return on Energy Invested is irrelevant.
If you need diesel to run a tractor and combine harvester to grow food to eat, what does it matter that the process is a net loss?
As long as you can feed more people than those involved in the production of the food, that is all that matters. If the miners, farmers, food processors etc have enough food to eat and some excess then you are onto a winner.
China has 150 billion tonnes of coal, if it uses 200 million tonnes per year to produce 250 million barrels of secure diesel then it’s worth doing.
There is vast amounts of coal, oil and gas. What we are running short of is clean water and clean soil.
TYS,
The question is whether CTL is cheaper than just buying oil from the Middle East, up until now the answer is no.
“If you need diesel to run a tractor”
Fortunately, you don’t need fossil fuel based diesel. You could electrify most tractors. Combines would be rather inconvenient to electrify, though it’s certainly possible, but liquid fuel doesn’t have to come from fossil fuels. FF is just another hydrocarbon. In the past it was helpful – it was convenient and scalable, though mostly not cheap – but now it’s clearly obsolete. FF is expensive, polluting, risky and depleting. Best to leave it behind ASAP.
DC
China is not just interested in cost, security of supply is critical to a country that imports 9 million barrels per day.
Production of their own fuel from coal means jobs at home. Which unfortunately most western politicians and economists don’t understand how important having manufacturing at home is.
Nick G
Have you ever used an electric tractor?
How did the cost and performance compare to a diesel one at less than half the cost, how long does a single charge last?
TYS,
Electric motors are more powerful than diesel for the same weight & volume. They’re far more efficient, so “fuel” is much cheaper. Maintenance is also cheaper.
Electric tractors are in their infancy, but the engineering possibilities are obvious. Most submarines are battery electric, with diesel generators. Trains are generally electric with onboard generators, because electric has much better torque at low speeds. Electric works very well. The likely configuration for farm equipment would be BEV with onboard generators, to allow maximum use of cheap power with a liquid fuel backup. Very cheap power is likely to be more and more available as rural wind and solar expand.
It’s also perfectly obvious that for many applications in many rural places, liquid fuel will be the better choice. There are several niche uses for petroleum that will take longer to replace: combines, aviation, very long distance water shipping are fairly obvious. When we decide to price in pollution, biofuel and synthetic fuel will very likely be cheaper than CTL.
It’s really a waste to burn FF – we should reserve it for petrochemicals. China, for example, is starting to use coal in that way.
“China is not just interested in cost, security of supply is critical to a country that imports 9 million barrels per day.”
I agree. That’s why they’re replacing oil with EVs powered by domestic renewable electricity. That’s for both light and heavy vehicles, and it’s for domestic transportation and export markets, which are booming.
TYS,
China has plenty of manufacturing and they probably like to focus on what makes sense, CTL is probably a misallocation of resources when oil can be purchased on world markets much more cheaply at present.
TYS- it does matter in food production.
To your point- “If you need diesel to run a tractor and combine harvester to grow food to eat, what does it matter that the process is a net loss?”
If energy costs are too high relative to the work output it provides farmers will not plant a crop, just to take a loss. Not for long away. And food consumers will struggle to come up with enough money to pay for food raised at scale with expensive energy. We have become accustomed to huge energy surplus, including in our farming systems and we now forget that it all used to be horses and humans (generally dirt poor peasants or slaves) providing the energy.
In the 1800s, American wage-earning families typically spent roughly 40% to over 50% of their personal income on food alone, now less than 10%.
I do not think these marginal (low EROEI) supplies of energy will keep a large number of humans in a prosperous and well fed condition.
Nick G
You said you can electrify most tractors.
A group of farmers tested electric tractors on their farms and found them to be extremely wanting.
They could not do the heavy work needed and even on lighter tasks had to be recharged before the work was done. Making then uneconomical.
You obviously have never used an electric tractor and don’t know what you are talking about. Hint don’t speak about things you know nothing about. You get found out.
Hickory
No it does not matter at all the energy return on investment.
Di you know that the EroEi for most food is 10:1?
So why is food so cheap when the return has been so poor for decades?
Do you know what the cost of producing liquids from coal in China is?
Kindly answer those questions.
TYS,
EROI is not as important as ultimate cost.
One has to include factors like availability of natural resources, and ease of transport of energy (i.e. diesel versus natural gas, H2 or electricity).
In China, CTL diesel has a break-even of $80~$100/bbl oil price, and it also consumes lots of water in the coal rich provinces where the rain fall or surface water are not that abundant.
But, the coal to urea (CTU) cost in China is comparable or even lower than natural gas to urea cost in China, at least for now. In China, most urea are CTU process, and China export urea in large volumes.
OTOH, China imports lots of soybeans, and the protein and oil are the product of urea produced from natural gas mostly outside China.
for FF, the EROI is more important than food and chemical products
“The Energy Return on Investment (EROI) of producing diesel from coal via the indirect method (also known as coal-to-liquids or CTL via Fischer-Tropsch) typically ranges from 0.50 to 0.90 units of energy returned for every 1.00 unit of energy invested. Because substantial energy is lost during gasification and synthesis, indirect CTL yields a net-negative to break-even energy return.”
2015
https://energyskeptic.com/2015/eroi-negative-for-coal-to-liquids-ctl-at-shenuha-direct-coal-liquefaction-plant/
Nonetheless, apparently China is able to pull this off at scale for a good price (although the data is hard to confirm with a quick search).
Interesting area to learn more about. Very high water consumption….?pollution outcome.
This is a more recent look at the coal to liquids China results-
https://www.researchgate.net/publication/281940959_EROI_Analysis_for_Direct_Coal_Liquefaction_without_and_with_CCS_The_Case_of_the_Shenhua_DCL_Project_in_China
TYS
Do you have a source for the EROI of 10 that you cite for ‘most food’?
That is actually a good deal higher than many studies I’ve seen, particularly for FF dependent, large scale ag. Closer to the mark for small scale ag though.
I don’t understand why you say that EROI is irrelevant. This seems akin to saying that physical laws aren’t real or are irrelevant.
To reduce imports, China is running down its oil reserves, switching to EVs and squeezing production of plastic. The first can’t last forever, the second is relatively slow, and the third only makes sense if demand can be reduced, which is realistic but probably a slow process as well.
In fact the whole planet is running down its reserves fairly quickly. The market isn’t pricing that in. It’s optimistic (or ideological) to expect it will.
At some stage, reserves will run out, unless Hormuz reopens. Then there will be be a hard break.
The diamond market is an interesting object lesson. Jewel quality diamonds have fallen in price by 90% since 2018, thanks to synthetic diamonds. Now prices are recovering, because they are cheap enough to put into chips. NVidia is talking about putting diamond in their Vera Rubin AI chips.
Oil is used for various things, mostly storing energy in moving vehicles. As batteries push it out of this market, new markets may emerge.
TYS, et al- I am willing to enjoy eating some humble pie when I get things incorrect, and perhaps that is the case with coal to diesel. If indeed China has come up with a technical method to make this work at competitive (or at least affordable) cost then it is a big game changer for heavy transport/work equipment. I say big since, yes, there is a lot of coal here and there and can be a cheap feedstock.
EROEI is a useful theoretical factor to consider, but the ultimate judge of viability is the price of the end energy product . There are a small number of ways I can see to get a good price when EROEI is said to be poor. One is simply inaccurate EROEI- its only as accurate as the assumptions and calculations that go into the analysis. Secondly, newer technology and methods can make a better result. That is what has happened in many aspects of energy- fracking, photovoltaics, batteries, nuclear fission, etc. Perhaps China has hit the nail on the head when it comes to the process of coal to diesel. Another way to get a better price outcome is subsidies, such as US had done with corn ethanol for a long time, which otherwise would not have been commercially viable.
I would like to know what the cost of production is in China (unsubsidized).
Also from Reuters
-Production Economics: CTL production is generally only profitable when global crude oil prices are high (roughly above $70 to $94 per barrel) combined with low domestic coal prices.
-Market Status: China operates several large-scale CTL facilities (notably in regions like Inner Mongolia and Ningxia) operated by state-owned enterprises like Shenhua. These facilities are primarily maintained for national energy security rather than pure commercial profit.
T Hill
The ratio of 10:1 was something I picked up some years ago.
The AI view says 10.1 for countries such as I.K and U.S. that are highly mechanised use fertiliser and pesticides and transport food to factory processing plants. Then trucks take food all over the country. Potatoes and wheat have a lower ratio of 1:3 beef has the highest of 25:1.
Anyway we do use lots of energy to produce food and that is unsustainable.
The worst limit humans are facing is lack of water.
In many areas which supply large amounts of food for the global market, water is running out.
Once the aquifers with the free water are gone, what will the farmers do?
We will be facing the cost of having to replace billions of litres of water every day.
As far as I have read, not a single government has started to build the reservoirs to store this water. Not a single government has started to build the additional desalination plants needed for irrigation.
https://www.reuters.com/business/environment/wilting-french-maize-shrink-europes-harvest-farmers-fear-repeat-1976-2026-07-10/
This is not a future problem, in Europe, America and Asia crops are dying today for lack of water.
https://www.agweb.com/news/crops/crop-production/ive-never-seen-anything-devastating-toll-drought-grips-western-plains
Hickory pointed out that families used to spend 40% of their income on food. Well we are already started to head back in that direction.
TYS
Hickory provides a useful reminder of the importance of reliable data & analysis regarding EROI. Very important considering the detailed accounting and analysis boundary issues. With this in mind, I’ll say that I am skeptical about vague claims about ‘AI search’ results and your renewed suggestion about high EROI levels for industrial ag. That is not consistent with many/most analyses.
For an example of a more recent source:
Rasul, K, Bruckner, M., Mempel, F., Trsek, S. Hertwich, E. (2024) Energy input and food output: The energy imbalance across regional agrifood systems
They show EROI for industrial ag below 1. They include food processing but exclude distribution, wholesale, retail, storage and food prep. Mechanization and FFs made significant contributions to the green revolution. They did not make it efficient.
Hickory
Some good information here regarding China coal production.
https://itkservices3.com/background/china_coal
The quality of the coal is declining and the costs rising.
T Hill
There is no way EROEI for food is less than one.
It is absolutely essential that every single energy cost is entered from start to finish.
The energy required to manufacture all the tractors combine harvester, the silos cow sheds.
The energy to produce the fertiliser and pesticides and the global transport of all these things.
The diesel and electricity used on the farms, by the trucks taking food to factories. The energy to build and maintain all the equipment.
The energy used to refrigerate and freeze the food so it gets to the shops in good condition. The refrigerators in the supermarket.
All of it is part of the process from start to finish.
Several studies put average at 7.
TYS and T Hill,
EROEI for food production is widely variable . Best of course is just to graze livestock on good rangeland with zero external inputs for things like fencing, irrigation, transportation, etc. Just a shepherd and his banjo. Or simply harvesting of wild plants.
But on a practical level you can more simply look at price of the product, since that has the energy input costs embedded within it. What is best price/lb of protein? For most places various beans/peas are the best deal. Backyard chickens and goats are the best deal for many places in the world.
For those who would like to delve into this point more you can see what the various price/gm protein is in the article (for the US currently)- https://nutrola.app/en/blog/cost-per-gram-of-protein-100-foods-ranked-by-value-2026
I think it is inevitable for most of humanity to shift back toward lower energy input food production for the staples providing protein, oils and carbohydrates. Note- I’m a frequent black-eyed pea eater (high digestibility, short time of cooking, good protein/fiber).
Hopefully there will still be some forests left intact.
TYS
Are we talking about the same math for EROI for food?
EROI = (Energy from food) / (Energy inputs to grow, process, etc food)
T Hill,
Yeah, it looks like TYS is reversing the usual ratio. The studies I’ve seen suggest that the average American’s diet involves energy inputs that are about 10x as large as the kilocalories they actually eat.
Of course, a very large part of those energy inputs are optional. For instance, a large component is home refrigeration. Well, I suspect a large fraction of the population would want a fridge/freezer just for ice cream, frozen pizza and beer. That means that having the appliance available for the rest of their food can be considered a freebie.
Seriously, this goes to the heart of the problem with E-ROI: it’s modestly useful, but it has a LOT of limitations.
One is the question here of subsidies: the US’ industrial supply of extrasomatic energy makes a very inefficient production of somatic energy possible.
Another is the fact that the ratio should be reversed: net energy is the important thing, not E-ROI. That’s why an E-ROI of 50:1 is only trivially different from 100:1 – the net energy only changes by 1% (2 units of energy input for 100 output, vs 1 unit). MPG, by the way, has the same problem: 100MPG is only trivially different from 50MPG if you’re concerned with reducing system consumption rather than just how far you can go before you have to stop at a gas station…
Another is the question of energy quality. Liquid fuels are more useful than gas or solids. Electricity is roughly 3x as useful as chemical/heat energy, which is why we burn hydrocarbons like FF to produce electricity. After all, coal generation is only about 33% efficient, which would be an enormous waste if we didn’t value electricity far more. And, of course, this is illustrated by the fact that the process is reversible: a heat pump can turn one unit of electricity into 3 or more units of heat. And, an EV can provide propulsion for less than 1/3 of the usual liquid fuel energy.
E-ROI is modestly useful, but cost is usually far more useful as a comparative metric. That’s why E-ROI is rarely used for any kind of real world planning.
Hey Nick,
Completely agree with your argument regarding the importance of net energy. Also agree on the utility of electricity and inefficiency of FF combustion. Heat pumps are great too. We’ve had a ground source heat pump for close to 30 years now.
Cost certainly matters when I open my wallet, but EROI remains more important for fundamental analysis. Subsidies are very significant for food around the world. Think about a country like Egypt and their subsidies for flour and bread. Or the US, where at least a third of the corn crop is turned into ethanol for essentially zero net energy through the politics of a group of midwest senators.
Also, If you want to talk cost you need to add a layer of currency valuations onto your analysis. The hyperinflation of Weimar Germany certainly changed commodity costs, but didn’t change the underlying energy equation.
EROI remains a better tool for many of these comparisons.
T Hill,
Hmm. I’m not sure what question you would try to answer about food, with E-ROI analysis. There’s a great deal more to food than calories: there’s micronutrients, but more importantly there’s culture, community, convenience.
Ethanol is a good example of the difficulty of applying a simple measure of joules: sure, it started as a way for farmers and food processors to sell corn, but there’s a real value to liquid fuel. Probably a better measure is liquid fuel input: liquid fuel output, which is about 1:5, which is high enough.
As far as currency goes – I agree you need to adjust for purchasing power parity. Heck, I have a wad of 100,000 papiermark bills printed during the Weimar attempt to get out of their obligations to pay reparations. OTOH, their inflation didn’t really change costs, though it did give some people back aches when they had to lug bags of money to buy stuff.
T Hill
So you don’t think you need to include the energy to produce nitrogen fertiliser from gas?
And the energy to transport it from a plant in China or wherever to the farmer in Europe or the U.S?
How about the refrigerator truck whose only function is to take vegetables from the farm to the industrial plant for packing?
How about the energy required to build the plant and run it?
You obviously don’t understand EroEi.
Nick G,
EROI of food informs sustainability.
TYS,
Yes, at least one of us definitely has a math or communication problem here.
“EROI of food informs sustainability.” T Hill
Very true, and in the real world that we are in
the human population levels are not sustainable without high level fossil fuel input.
The population levels will fall along with fossil fuel production. Likely not one to one ratio, but highly correlated.
“ the human population levels are not sustainable without high level fossil fuel input.
The population levels will fall along with fossil fuel production. Likely not one to one ratio, but highly correlated.”
Fortunately, that’s completely unrealistic.
Seriously, do you really believe Germany, a country with world competitive engineering & tech, has a plan to go to net-zero that has no basis in reality???
We can ask the same question for China. There are many other countries and organizations in a similar place, but the others might be distracting. I think we can stick with Germany and China for discussion – they’re really good representatives of countries that are clearly very sharp with both planning and tech.
https://oilprice.com/Latest-Energy-News/World-News/Goldman-Sachs-Sounds-Alarm-Over-Fresh-Threat-to-Global-Oil-Supplies.html
Excerpt:
A week after it warned that an oil glut is coming, Goldman Sachs has done a U-turn, warning that the renewed hostilities in the Persian Gulf threaten an extended supply disruption.
I have been skeptical that the MOU would result in an end to hostilities. Things will change day by day.
Middle east output remains about 10.5 Mb/d below pre-war level.
US to restrict oil export?
https://www.youtube.com/watch?v=rIf5WuqhuFw
Sheng Wu,
The US refineries cannot use more than about 5 Mb/d of tight oil. If exports were not allowed, tight oil output would need to be reduced by about 4 Mb/d. Eventually this may happen, but probably not for another 10 years or so as sweet spots in tight oil plays run out of room for new wells.
Short answer, the US will not restrict crude oil exports.
MOmU- Memo of misUnderstanding
I wouldn’t surprised if the US imposes an Iranian oil export blockade if they don’t agree to an open and untolled Hormuz strait. If I was playing hardball to win that is what I would do, now that we let the genie out of bottle
DC,
You are right, Peter is playing dumb just to bash Trump.
Hickory,
Yes a blockade of Hormuz is the logical next step, when (or if) that occurs it will drive oil prices higher. The blockade didn’t change much last time so not clear it will be effective if tried again.
Oil can also be exported via the Red Sea or the the south coast of the Arabian peninsula. But this could be disrupted too.
The problem is that Iran doesn’t much of an incentive to play ball with erratic American/Israeli policy, especially given the murder of its leadership just before that last set of agreements were made. Whatever comes next in the region, it won’t be Pax Americana, any more than it is in Afghanistan or Iraq.
DC – for Hormuz blockade to be effective the admin would need to have determination, balls, and strong will so that it would be complete and long lasting.
That is not in the cards. Rest of the world (Europe, China, Gulf nations) would revolt since the consequences for them would be severe.
Well, I hope you’re right about a coming shortage of global crude oil. The oil on the open seas is indeed about the average amount, but according to Vortexa there are many tankers looking for buyers. And at a time when oil supply was restricted for quite some time and there is still trouble at the SOH, this is a large amount of oil to be actually looking for bids (a certain segment of the shadow fleet always looks for bids). Again, China has quit buying; they went into this w a large reserve and are probably waiting for lower prices. With the sanctions back on Iran, they’ll have to sell at a lower price (and presumably China is their buyer). I tend to be a little on the pessimistic side of the market on futures, because even at an advanced age I have virtually all my skin in the game, and I try to plan my involvement around $50 oil. I appreciate your thorough analysis.
I have been following EIA total petroleum stocks. If the draws continue they are set to fall below 1.5 billion for the first time since 2003.
During the 2008 spike this number was 1.6 billion. During the midst of the pandemic this number surpassed 2.1 billion.
AI tells me 160-180 million of these barrels are pipeline fill. I suspect this number is quite a bit higher than it was in 2003.
Of course, the primary reason this number is historically low is that the crude oil SPR is also historically low.
Refining is minting money like never before. A lot of maintenance is being deferred in order to capture these historic crack spreads. US refining is running at over 96%.
US commercial crude stocks at link below
https://www.eia.gov/dnav/pet/hist/LeafHandler.ashx?n=PET&s=WCESTUS1&f=W
Chart below has trailing 52 week average for weekly US commercial crude oil stocks
US commercial stocks
The thing about the oil in working storage in the US is that back when exports opened up in 2015 they necessarily started to add more export facilities. So from then working storage increased from maybe 350mm/bbl to maybe 425. Yeah, it is sitting on US soil but it isn’t FOR us.
Another thing I’ve often wondered about when it comes to commercial inventories in the US, is what does that actually include?
For example, I’ve read that includes pipeline fill, which I referred to above.
Does it also include oil in upstream production tanks?
Our little operation produces and sells around 5,000 barrels per month.
During any particular time we have around 5,000 barrels of oil on hand.
As far as tank bottoms are concerned, our tank bottoms are 1’ to 1’ 3”. We have 3 sizes of tank circumference, one holds .75 BO per inch, one .83 BO per inch and one 1.16 BO per inch.
I don’t know that one can extrapolate from our little operation, because if all US producers held as much oil on hand as we do that would translate to the entire amount of crude oil commercial stocks, and surely a large part of those are actually in pipelines and midstream and downstream tanks.
However, it would seem to me if commercial crude inventories were around 300 million when US produced 5 million BOPD, and now they are around 400 million despite now producing 14 million BOPD, commercial inventories have necessarily gotten much tighter. Am I making any sense?
I sure wish there was more transparency.
As an aside, I know some higher ups in refining and they say the weekly commercial stocks by EIA are WAGS. They also don’t seem to be at all worried about their refineries getting feedstocks, and they work for the largest refiner in the US.
I will also say during the pandemic they also didn’t seem worried about hitting “tank tops” and were running their refineries as they always had.
I sure wish I knew more than I do.
My final comment.
When there is a tech boom, oil doesn’t do well. Same can happen with grain absent weather events.
The late 1990’s were very rough.
I remember in 2012 golfing at a class reunion. One of the guys was a NY investment banker. All he could talk to me about was crude oil and grain.
So much of these prices have little to do with fundamentals and more to do with money flows. I seem to see this daily.
I own some tech stocks and index funds. When they are up, oil is down, and vice versa, it seems. Admittedly I’m not keeping track, maybe this observation isn’t accurate?
Just think about all of the shale IPO’s during the shale boom. A lot of managed money pumped into that.
Shallow Sand,
Even though US is producing more oil, we are also importing less, the crucial number for commercial crude stocks is refinery throughput see chart at link below.
https://www.eia.gov/dnav/pet/hist/LeafHandler.ashx?n=PET&s=MCRRIUS2&f=M
In 2000 the US crude input to refineries averaged about 15 Mb/d, in 2025 it was about 16.4 Mb/d, about 9% higher over a 25 year interval, the peak was 2018 at about 17 Mb/d. Annual rate of increase in crude input to US refineries of about 0.36% per year over the past 25 years.
Thanks for this info DC.
Yes, a major refinery hasn’t been constructed in the USA since 1976-77, at Garyville, LA.
There has been a new refinery planned for over a decade, that President Trump somehow was able to name America First. It seems to be having a lot of trouble. I read that construction start has again been delayed until at least October, 2027.
The pandemic resulted in some US refining shut downs. This lack of refining capacity has caused the crack spreads to surge to record levels.
As I’ve stated many times, I live in an area with an oil refinery. The company has been making record profits and some of this trickles down through the local economy. Just finished a huge turnaround in May. Over 2,500 construction workers were here for that.
US refineries do things to increase capacity. But it’s incredibly difficult to build a new one.
Decommissioning old ones is incredibly expensive. An 80k BOPD refinery shut down in 1995 near us. My wife was hired there out of college, although she had gotten a different job by the time it closed. It’s too bad that one closed, in retrospect I bet the major that had originally owned it wishes it had spent money to keep it up, they’d be making bank off it now.
Instead, it was on the hook for dismantling it and cleaning it up when the company it was sold to went BK. That clean up continues today. It took from 1998-2004 to dismantle the refinery alone. Superfund site, as every oil refinery in the USA will be some day.
DC.
I went back and looked at the financials for MPC, VLO and PSX, the major stand alone refiners in the US (no upstream).
Since 2021 the earnings have been tremendous and Q2 2026 is shaping up to be a record quarter for each.
Pretty easy to see why. $70 oil, $3:80 gasoline and $5 diesel. Incredible crack spreads because US refining capacity (and worldwide for that matter) has been so tight.
mainstream agree that the refineries along the Gulf were built for Venezuela heavy crude, along with the Citgo now taken away from PDv the national oil company of Venezuela.
They never operate fully to maximize the profit margin with other heavy sources, and now with the bottleneck partially open, they could maximize the profit.
Part of the reason that China stops/slows buying crude is the loss of the low cost high refinery margin Venezuela crude.
https://oilprice.com/Latest-Energy-News/World-News/UAE-Oil-Output-Hits-All-Time-High-Doubling-Pre-Crisis-Levels.html
Saw this and noticed they are comparing June output with March output which is NOT pre-crisis. It is an all-time high by about 2.5% (4.1 Mb/d vs 4 Mb/d in early 2020). UAE output was about 3419 kb/d in Feb 2026, so the June level is roughly 700 kb/d more than February 2026, in April 2020 the EIA has UAE C+C output at 4118 kb/d, OPEC has crude only output by UAE at 3841 kb/d in April 2020, if June crude output by UAE was 4100 kb/d, this would represent a 6.7% increase over the April 2020 level and a 20% increase over the Feb 2026 level (3419 kb/d).
“Trump is a carnival barker. He knows how to have the cameras look at him, so he knows this looks terrible. He knows the cameras are on him, and he still can’t help it and he falls asleep.”
Carnival barker meets dishonest used car salesman…to put it kindly.
Rig Report for the Week Ending July 10
– US Hz rigs + DRigs dropped by 2 this week from 440 to 438.
– US Hz oil rigs dropped by 5 to 408, down 32 since April 2025 when it was 450. It was also up by 46 to 408 rigs from the low of 362 first reached in the week ending August 1, 2025.
– The New Mexico Permian Hz rig count dropped by 5 to 85. Eddy dropped 2 Hz rigs to 54 while Lea dropped 3 to 31.
– Texas added 1 to 213. Midland and Martin were unchanged at 22 and 23 respectively..
– Eagle Ford added 2 to 36.
– NG Hz rigs added 1 to 106.
A Rig
Frac Spread Report for the Week Ending July 10
The frac spread count dropped by 5 to 200. From one year ago, it is up by 20 spreads but is still down by 15 since the previous high of 215 on March 21, 2025.
A Frac
Thanks Ovi.
The Coming Great AI-Tech Market Depression…
Yeah… someone had to be the party-pooper, why not me?
With SAAS – Software As A Service profits peaking from years of the Biggest Tech Companies devouring the smaller, the only thing that was left for growth… was the AI Data Center Magic.
Unfortunately, the Massive AI Data Center Industry has failed to live up to its promises, and now companies that laid off workers because AI or Lame LLMs were going to be more efficient are beginning to realize their error and are rehiring these people.
More and more companies that laid off software engineers because Claude Code was the new miracle are finding out it’s a Disaster, especially when they see their AI Token Rates go through the roof. AI Billings are heading towards the moon, while the supposed efficiencies are heading into the toilet.
The continued high demand for Nvidia GPUs to build even more useless AI data centers has driven Memory Chip demand to nosebleed levels and the costs. We are now seeing massive price inflation for memory chips.
What does this have to do with Energy? A lot.
When the AI Bubble pops, and with it, the Tech Industry, there isn’t any new tech that can pull the industry out of the AI Bubble Ashes. Thus, demand for Energy, Resources, and Metals will also decline significantly.
The GOOD NEWS in all of this is that future demand for Electricity in the United States won’t be as high or as drastic as the forecasts due to the collapse of the AI Data Center Industry.
The coming Tech Depression will be much worse than the 2000 Dot.com Bust.
GOD HATH A SENSE OF HUMOR….
steve
“Hallucinations” are an embedded feature of LLMs. They are unavoidable.
“Self-Breeding” is now a problem as LLMs are ingesting the “Hallucinations” of other LLMs and training on them.
China created a rival to LLM that perform as well as Data Centre LLM but no need for a massive data centre.
The idiocy of building these data centres, by suppossed tech geniuses ( Musk wants to build his in outer space??) is breath taking.
If I was head of one of these companies, I would sit on the sidelines, save up my capital and wait till a profitable, sustainable model developed and then copy it (second mover’s advantage)
Someone once explained to me the advantage of the second mover.
One example was the Iridium Satellite Phone. The company started, and built up this network of satellites, and got customers, but was still not making enough to ever pay off their debts.
Eventually, they went bankrupt and were purchased for $25 million. The second mover here obtained a satellite network for pennies on the dollar. It also helped that the new Iridium immediately announced an agreement with the US Military to provide services, and it was valued at $25 million/year. A good deal.
Now, I see that Iridium was recently sold again, this time for $8 billion.
I wonder if something similar will happen to all the Data Centers, etc., that can’t pay their debts. Will they eventually get sold for pennies on the dollar, and is that how the new AI-LLM network will be established?
I didn’t catch who it was, but i heard part of an interview where that was the expected end. All these high-priced GPUs and RAM will eventually be purchased at deep discounts, and the second wave of LLM’s will have a chance to be profitable.
I have no first hand knowledge of AI tech (tho I do use generative AI) but a couple of points.
First, I don’t believe all the AI layoff headlines—it is a great way to look forward thinking and get a share price bump.
Second, Senior IT people ARE in demand for their knowledge and direction and ability to incorporate AI into existing systems. BUT, entry and mid level “coders” are not, you can guess why. It makes perfect sense. You need people with “taste” (AI jargon, LOL) to direct what the AI needs to accomplish, and what would be more “normal” for an entry level AI to be doing than entry level coding at the direction of an experienced supervisor? Upshot is Comp Sci grads have higher unemployment @ 6% than art majors @ 3% and at the same time the openings for experienced people exceed the supply. That is big time devastation for people who took “learn to code” to heart.
The other thing about AI is that it is good at things testable. If code satisfies the assignment without bugs it IS good. Ditto spreadsheets and numbers if they can be verified. Ditto things like customer service where I told a bot who said I needed a reason to cancel. I told it I wasn’t going to give a reason I was canceling my service and shouldn’t have to …. it replied “You are right, your subscription is canceled.”
Third, Googles own CEO said AI does 25%, other estimates are that near 50% of new code is AI generated.
Finally that MIT study that said AI is a flop used projects mainly aimed at sales and marketing while AI’s strengths are really back office. And it is just like the previous desktop personal computer uptake: “While only 40% of companies have official LLM subscriptions, 90% of workers surveyed reported daily use of personal AI tools like ChatGPT or Claude for job tasks.” This is what Amodi of Anthropic said, diffusion would be the snag that could hang them up. The models were advancing fast now but getting the execs to utilize it would be slow, perhaps too slow to pay for the compute cost.
I think the reality is AI is not going away. “Claude Code’s run-rate went from $500 million in September 2025 to $2.5 billion in February 2026 — five times in five months.” not nothing.
I lived through the end of the manual era in offset color printing in the 1990s. I did my part to put any of at least a dozen skilled manual job categories in the bin just using a mouse and Mac. I fully expect my intellectual job of graphic design to be ready for the bin soon. We’re at church bazaar flier stage now, pretty much general release soon.
There is little I can do at my age that I haven’t already (I lean, of course, toward Armageddon, and stick to the Arch Druid Framework). But one thing PO taught me was it doesn’t pay to be too convinced: totally early can be as bad as totally wrong. LOL
Sorry if I’m off topic.
Links by Claude:
https://finance.yahoo.com/economy/articles/u-layoffs-drop-40-2026-090807535.html
https://hyperallergic.com/are-art-history-majors-more-in-demand-than-computer-scientists/
https://sqmagazine.co.uk/software-engineer-layoff-statistics/
https://uvik.net/blog/ai-coding-assistant-statistics/
Neural Networks are directed stochastic graphs. Been around for decades.
What is new is:
1) Moore’s law
2) Big Data Architectures (64-bit addressable memory which is orders of magnitude faster than a hard disk)
3) The internet full of “Free” training data”
4) The LLM Transformer models which is based on PROBABILITY and not 100%
5) Back propagation that uses calculus derivatives to minimise the error rate….but not to 0% other than trivial cases.
You can watch about 5 videos on Youtube and realize that AGENTIC AI is nowhere near close to being real.
These tech behemoths are committing suicide….but the leaders will probably walk away billionaires…
They will lie about something a junior software engineer can see obvioiusly.
Why do we think they are all going to IPO this year? Privatise the profits and publicise the losses.
They know they are cooked.
@gerryf
Warren Buffet (who is mid-nineties) and Berkeshire Hathaway are all in ~390 billion on cash.
The second mover gets to learn from others expensive mistakes and doesn’t have APPALLING debt.
“Pennies on the dollars” – key to generational wealth
EBITA
The entire US economy is essentially a bet on AI now.
Andre, I’d just say fracking had been around for decades before horizontal slickwater fracking of shale took off in the oughts, that didn’t make it any less revolutionary.
What’s new isn’t Moore’s law, it’s GPUs and TPUs and high-bandwidth interlinks and yes, scaling.
But the part where AI isn’t 100% infallible so cannot replace a human? If 100% were the criteria then AI is a dead end, but in my experience humans are far from error-free, yet are suitable for most jobs.
Which brings me back to the point from before, entry level IT folks are suffering while experienced hands are in demand. Until AI can oversee AI then humans get to stay in the loop.
On my Timeline of Doom, the AI bubble leading to the crash and recession is a feature not a bug, it is the perfect excuse corporations will use to fire those pesky, expensive humans and replace them with cheaper, always on, mostly competent AI.
But I’m just guessing
Alim- “The entire US economy is essentially a bet on AI now.”
US is spending its collective capital in attempt to swing for a grand slam, which is a very risky strategy. In the meantime China AI industry is accumulating dozens of base hits at a rapid pace.
“For every week since February 8, 2026, Chinese-origin AI models have accounted for at least 30% of the [ US purchased] enterprise token volume on OpenRouter. By mid-2026, that share reached a weekly peak of 46%, according to a CNBC investigation published July 7. That figure stood at 11% averaged over the prior twelve months — and just 4.5% in the first half of 2025.”
“Open-source Chinese models are consistently 60% to 90% cheaper than the leading offerings from Anthropic and OpenAI, according to Justin Summerville of OpenRouter.”
China is achieving practical capability in AI with dramatically lower capital investment, and with very low cost electricity as well.
@pops
The exponential nature of Moore’s law…it keeps growing. That is new.
That will end at some point as well.
You are correct about GPUs, I bundled that in to “Moore’s law”. Specialize in Vector/Matrix linear algebra which is what Neural networks do.
Again, the “experts” …. Altman, Musk, etc are IPO’ing.
Privatise the profits and publicise the losses.
Got a pension fund or a 401(k)?..Mr. Doge Musk forced it to invest in SpaceX.
RAISE YOUR HAND IF YOU THINK MUSK WILL BE SUCCESSFULL COLONIZING MARS!!!
All so this piece of shit who has more money than he can ever spend, wants to be the only Trillionaire on the planet …. Guy is an a^^hole
they know their f**ked.
Andre, yeah, they were “researchers” and now they have a product, so time to cash in. Private gain and public risk/cost is just the modern capitalist model.
Per Claude: ” investors in Anthropic or OpenAI aren’t underwriting today’s margin on a ChatGPT query, they’re buying a lottery ticket on the scenario where being two years ahead in capability compounds into an unassailable moat”
That makes as much sense as anything, once you are in a system it is hard to root you out, although it didn’t stop trump and Kegsbreath from 86ing Claude from the Dept of WAR.
The open China models have 90% the capacity @ 5% of the cost (or something like that). I just think that companies don’t quite know what to do with it yet. Again, just like desktop computers, right up until they became ubiquitous. Could be in many cases they are doing both, keeping the human and paying for their replacement AI too. Kind of a layoff Sharkfin in waiting.
I think the biggest danger for the AO Cos is charging too much, rather than over-invest in compute. A few stories out there about companies going overboard and blowing their whole budget. Uber used the entire 2026 budget by march or something. Question is, did they get value or were they just playing video games? Apparently they did real work so you’d think that they will adjust their carbon/silicon balance accordingly.
It is interesting. All the fiber laid during the dot.com era was eventually used, just not by the people that laid it.
another rare gas shortage rarely mentioned could cripple global economy,
After Qatar’s gas plant got bombed, 30% of global Helium supply is gone.
Right now, the largest Helium source/factory is located in Amur,Russia, next to the Siberia I pipeline to China. Russia supplies ~50% of global Helium already after this plant started full operation in late 2023, and now supplies roughly 70~80% of Helium to major semiconductor/IC foundries in Asia reexport thru China. China and Russia both announced a control/restriction on Helium export.
Meanwhile, US found pure He pockets again, and He3 as well and alone worth 30Billion.
https://www.youtube.com/watch?v=NoxHubOdxIk
here is the link to a re-export company in China, this company and others in the same city in Shandong produces over 50% of the semicon gases (HCl, HF, SiH4, InH3, PH3..) for Asia (China Mainland, Taiwan, Korea and Japan), and one factory equipped with a dozen state of the art ppm water level spectrometers for each gases they produce, very large operation.
https://www.dijiagases.com/news/news/6N_Helium_2025_Chinese_Supplier_s_Guide_to_RCEP_Exports_Quantum_Computing_Purity__F_Gas_Compliance.html
I made a post with a data plot to show the dramatic Helium Shortage
https://www.linkedin.com/pulse/helium-shortage-explained-sheng-wu-lrxtc
From the fringes of the Internet…….
After watching all of the absurd “peace negotiations,” bizarre tweets from Trump, the Axios leaks, and the conflicting reports from various Iran related news outlets, the Hormuz crisis has been surreal from the beginning.
To what extent are the various parties (US, Iran, Israel, GCC) colluding and putting on an act?
How much of the war damage and impairments to shipping volumes are real?
As distant observers without insider connections, we have no way of knowing.
Here is an article that goes to the ultimate extreme: “it’s all fake.”
I would like to believe it is not all fake (simply because that level of global deception would indicate we are under a degree of mind control that most, including me, choose not to imagine), but it is worth considering, “how much of this is real, and how much is kayfabe?”
Starting at “it’s all fake” and working backwards is an interesting change of pace from assuming the news and statistics we receive from the MSM and alt-media are reasonably accurate/sincere.
FWIW
https://mileswmathis.com/fakephoto.pdf
“You do realize this is exactly like Orwell’s 1984, with fake foreign wars being used to divert attention
and sell various storylines, moving you on from the vaccine genocide and the current rape of
worldwide treasuries, justifying rising military budgets, and explaining gas and food price gouging.
And the way the “leaders” in Iran are playing along is a delight to watch in itself. They should get
award nominations from the Academy. Claiming they will continue to control the Strait of Hormuz. . .
though Iran never did control it.”
“Like North Korea, they keep up the pretense it is independent and dangerous, to justify all the “defense” spending, but it is all a vaudeville, a Punch and Judy pantomime. The Ayatollahs have always been our puppets, just like the Shah before them. “
I don’t buy it. The authors of this supposition should spend a month living under conditions of duress in the affected zones of various countries in the middle east, or Ukraine.
Then they will have a better idea of what is real.
People are very willing to kill on large scale for various things such as
Islamic republic of Iran in order exert sovereignty and to spread fundamentalist Islamic government throughout the region
Palestinians in order reclaim lost sovereignty, territorial status, security
Israelis in order to keep their country safe from attempts at eradication and new episode of ‘ethnic cleansing’.
Hezbollah in order to erase Israel, and dominate Lebanon with their fundamentalism
Not to mention many others throughout the world simply for economic advantage or access to the world market.
Hi Hickory,
I generally agree that “it’s all fake and gay” is way too far, and that it is likely no fun to be in Iran, Israel, Lebanon, Ukraine, Dubai etc. right now (hope all the billionares got out of Dubai by now!).
This is just a few pieces of anecdotal info, but 2 days ago I sat down for a meal with a couple of Israelis who live in my neighborhood in Japan and attend the local Synaogue (where I assume they have access to word-of-mouth info from other communitiy members). Israeli friend #1 is descended from grandparents who immigrated to Palestine in the 1920’s. He grew up in a Kibbutz and is not religious.
Israeli #2 is highly religious/observant and will not eat any non-Kosher animal sources of protein. He had the soy-vegitarian curry that night. Also highly right-leaning politically (some things he says scare me a bit).
Anyway, quick findings after telling them I’m having a really difficult time finding out what is happening in the ME right now, and that I have been tired and confused from the conflicting info from US, Iranian, and social media sources. I am not looking for “right or wrong,” just an idea of what is really happening.
1. Israeli #1 spontaneously said that “the Israeli gov’t seems to be hiding the truth/facts from us and we are not sure what is going on either.”
2. Israeli #1 expressed an interest in the Iranian sources I look at, and I told him about the Telegram geopolitics channels (he hadn’t looked there yet).
3. Israeli #1 wanted to return to Israel this summer to visit family, but gave up on the idea as it is too chaotic (=yes, *something* is going on there).
4. Israeli #2 did actually return to Israel on a 1-week trip this summer, but left within 24 hours due the level of chaos .
5. Israeli #2 said “things are not going to get better until we get rid of both Trump and Netanyahu.” This surprised me as I gather he is highly right-leaning. I didn’t have the courage to ask who he hoped would replace those two.
Anyway, based on these anecdotes, there is enough real stuff going on in and around Israel to substantially impact daily life there, in spite of their well known defensive weapons capabilities.
(=yes, *something* is going on there).
Regarding the fake part, apparently these are among the celebrities who were flown into Ukraine to promote the financial support (grift?) for Ukraine in the conflict with Russia:
Sean Penn
Angelina Jolie
Bono
The Edge
Ben Stiller
Liev Schreiber
Richard Branson
If anyone was fighting a serious war, would they really fly in BONO, Sean Penn (?!?) or Angenlia Jolie and do a photo shoot/schmoozefest?
U2’s Bono and The Edge playing STAND BY ME (!?) in a Kiev bomb shelter? Really?
https://www.youtube.com/watch?v=GG3gBqND-us
Assuming people in Kiev were there hiding from REAL bombs that were REALLY falling on them, I can’t father how/why they would take the risk of reeling out these super stars and film them singing a cheesy feel-good song (it would have to be an absurd logistics and security headache if bombs were truly falling there).
Don’t the Ukrainan leaders and security services have more important things to do?
Wheeling the ACTORS out on the war stage is a large hint that at least some aspects are a SHOW for the manipulation of public opinion/mood/flow of funds.
I can understand the desperation (rage) and motivation of both the Palestinians and Israelis…simply fighting to have a secure sovereign place to go about life with a sense of community/shared culture. And we should realize that getting rid of any particular leadership (Netanyahu for example) doesn’t change that basic reality for either.
I have a much harder time digesting the motivation of other parties to this long conflict.
-Iran, and by extension Hezbollah, are on a fundamentalist ‘crusade’ to control the wide region, with Israel being the dominant thorn, and with secular modern leaning governments in the region being a smaller but deeper thorn.
-The US…it is hard to see the actions other than under the lens of empire protection- Allies, maritime cargo flow, chessboard actions against adversaries, multinational corporate profits, weapons sales, and such.
China displays wisdom by having not much to say, or much to do on it. Other than make long term plans for their stability and negotiating strength.
DC, you’re right on exports. US refinery sector input is API 33, while export volumes are probably way over API 40 (I bet they are over-diluted with condensate. US condy is very cheap relative to world prices, so blending it with crude is a logical arbitrage…)
However, US Govt. can restrict exports of refined products, that should help the consumer.
I was caught by surprise how the refining cracks have exploded during this crisis. You would think that with less crude available refineries will be fighting for feedstock and getting their margin squished. The opposite has happened.
Looks like the product export volumes lost from Saudia Arabia, Kuwait and Russia are the key determinant….
In any case US ban on product export should squish the US cracks and help with prices at the pump…
mainstream now play another story contradicting the old model that US refineries can only take Venezuela,
https://oilprice.com/Energy/Crude-Oil/Venezuelan-Oil-and-the-Limits-of-US-Refining-Capacity.html
Sheng Wu,
That piece is from Jan 16, 2026, so pretty old news.
Sometimes people bring up the difference between TX RRC data for C+C and the EIA estimates. The Chart below compares the data from October 2025 and recent data from June 2026. The RRC data is not very good for the most recent 14 months reported, prior to that it is the gold standard and is used for the EIA final estimates for Texas C+C.
rrc and 914
AP is reporting that US will now charge 20% of cargo value to escort shipping through SOH (!)
So now the US is charging tolls! What a shit show.
Also seeing Brent is up by 5% to about $80/b. It will be interesting to see what spot prices are.
Also DOC output is up by about 3 Mb/d in June 2026, but remains about 6.7 Mb/d below 4Q2025 output level. The ongoing hostilities between US and Iran are likely to reduce this level in July. There seems to be no end in sight and the market may soon realize this fact.
AP is reporting Donald’s social media gas lighting gish gallop.
Whats the plan?
Will the US commandeer ships that decline to pay?, from India or China or Japan.
Do fertilizer dry bulk cargo ships have to pay coming and going?
Is it unpatriotic (communist?) to ask these questions?
By pronouncing this plan he legitimizes the Iranian concept of charging a toll.
Halfwit.
Anybody else starting to feel like we are watching a political reality TV show scripted by Hunter S. Thompson’s ghost?
We might encounter short term pain but that will only accelerate the electric transformation. Countries that are dependent on oil are changing laws to ban ice imports.
$.02 this transformation of wasteful energy use with ICE vehicles to wasteful energy use with EVs will be marginal compared to using energy primarily for productive purposes.
Leeg,
On the contrqry, the most important thing is to get the transition done. Every driver that’s not using FF is an accomplishment, regardless of how they do it.
Sure, bicycles are elegant and efficient. Electric-assisted bikes are great – they make bikes useful to many more people. Mass transit is great, especially electric trains: quiet, fast, chauffeured – what’ s not to like? Working from home – magnificent!
But the important thing is to get the transition done, not how elegantly or efficiently we do it. Very often the fastest, simplest, easiest change is the best, and EVs are a simple “drop-in” replacement for ICE vehicles.
The perfect is the enemy of the good!
Now Brent is up over 9% to over $83/b.
Does anyone care to comment on :
*Odds of Trump restricting crude oil from the continental US in the coming 6 months?
*What will happen to the Brent/WTI spread if US restricts or bans exports?
I would guess there would be a crash in the value of WTI vs. Brent.
This would clearly be painful for US producers…….
Surely some here have skin in that game?
Given all of the surreal nonsense that has occurred this year, banning crude oil exports is fully within the realm of probability, if not at least on all of the bingo cards…….
Coinbase prediction market:
Will the US ban crude oil exports?
https://www.coinbase.com/predictions/event/KXCRUDEEXPORTBAN-27
If anyone happens to have a coinbase account, please post the most recent odds.
A US oil export ban could raise pump prices
https://www.atlanticcouncil.org/blogs/energysource/a-us-oil-export-ban-could-raise-pump-prices/
U.S. Oil Export Restrictions Coming Soon
https://zeihan.com/u-s-oil-export-restrictions-coming-soon/
U.S. Code § 6212a – Oil exports, safety valve, and maritime security
https://www.law.cornell.edu/uscode/text/42/6212a
“The President may impose export licensing requirements or other restrictions on the export of crude oil from the United States for a period of not more than 1 year”
“Any requirement or restriction imposed pursuant to subparagraph (A) of paragraph (1) may be renewed for 1 or more additional periods of not more than 1 year each.”
THC,
It is doubtful that US will ban crude oil exports in my view.
Thank you DC!
It does seem like an unlikely scenario.
BUT it would cause some serious chaos.
And since Trump has proven himself to be an incarnation of Loki, God of Chaos, I’m going to keep my mind flexible enough to imagine it happening.
Just to be safe I’ve also switched most of my oil positions from WTI to Brent.
Assuming the US has been exporting 5 mmbbls/day of crude and products since the Hormuz broke out, export bans and restrictions would throw a whole new level of chaos on market supplies/logistics/pricing.
Russia is getting pounded by Ukraine and has banned diesel exports.
If the USA banned exports
with the chaos in the Gulf.
Things could get real ugly, with other exporters hoarding.
Not saying that is going to happen, but it is a > 0% RISK.
Hey Andre,
Yes indeedy.
If one compares the charts of diesel/HO, gasoline, and crude, the diesel appears to have the strongest uptrend.
Smells like trouble is on the way.
Any idea of how much spare refining capacity is available globally?
AI is a guaranteed collapse.
Either it takes peoples jobs or the Data Centre monsters collapse.
Healthcare costs in the USA are growing 9% per year. 2.8 trillion per year!!!
Interest rates which have been in a secular decline for decades, have started the secular increase that was inevitable.
It’s gonna get ugly.
Hey Andre!
“AI is a guaranteed collapse”
It sure looks that way to me. Feels like a bubble of historic propotions. And unlike the railroads and internet infrastructure (undersea fiber optic cables etc), the AI computer chips only have a useful life of a few years. A few years from now most of them will only be worth a tiny fraction of the amount they are being bought at right now.
For now, the insanity continues, but it will probably not last forever.
~~~~~~~~~~
Extraordinary Popular Delusions and the Madness of Crowds
https://en.wikipedia.org/wiki/Extraordinary_Popular_Delusions_and_the_Madness_of_Crowds
Permian scenario to match STEO for tight oil. Note that I think this is very optimistic, especially if the STEO oil price forecast is correct. Completion rate increases from about 500 wells per month in May 2026 to 526 wells per month in Dec 2026 for this scenario. Peak is in June 2028 at 6475 kb/d from a level of 6133 kb/d in May 2026. Chart at link below.
permian2607steo
Alternative Permian scenario based on rig counts where I assume wells completed are equal to wells drilled from 7 months prior and about 2 wells per month are drilled per operating rig. After January 2027 I assume rig count remains constant and completion rate is also constant up to Dec 2027, then I assume completion rate starts to fall. Scenario peaks in November 2028 as shown on chart at link below.
permian2607b
As usual I wonder who else sees estimates like this and decides to act?
If fossils are so abundant, why “drill, Baby, Drill”? Why open wilderness and arctic preserves? Why bother with “climate hoax” if it has zero merit?
Why the hostility to renewables if not to prop the price of oil and preserve the last fleeting BTUs of petroleum? If oil is abundant then renewables are no threat.
Why annex Canada, Greenland, Venezuela, and Iran if not for their reserves?
Everything about trump reeks of last ditch panic. Barely concealed capitulation to doom. Extract now, postpone payment to some later sucker. Like a banker drunk on other peoples’ money. He is the epitome of terminal-phase fatalism and bravado.
Of course it is easier to explain trump than other presidents, he is a lifelong grifter so no insight and coherent strategy around depletion needed, just appetite and greed and patter.
Another Permian scenario where wells drilled per rig is more in line with the Feb 2025 to Jan 2026 average, recently completions per rig has been high, but an expert has suggested this may simply be due to a draw on DUC inventory while oil prices were high. This scenario assumes this gradually diminishes between June 2026 and December 2026 and that rig count remains similar to recent weeks and wells drilled per rig remains at near the 2025 average. The scenario is much less optimistic than the STEO and may be more realistic than the previous two scenarios I recently posted. Chart at link below (Peak is May 2026 at 6133 kb/d.)
permian2607c
A final scenario, a bit more optimistic than the last, the possibilities are endless. This peaks in Sept 2027 at 6296 kb/d. Chart at link below
permian2607d
DC,
the number of rigs and production rampup in Venezuela does not make much sense, see figure 2 in the link below.
https://oilprice.com/Energy/Energy-General/Venezuelas-Oil-Revival-Faces-a-Critical-Services-Bottleneck.html
Sheng Wu,
The oil futures curve has Brent falling to $72/b by end of 2028 and to $66/b by the end of 2035. The 40 missing rigs by the end of 2028 is due to international service companies believing the risk return ratio is unacceptable in Venezuela according to the Rystad analysis. This looks roughly correct to me.
DC,
If the current rig number is close to zero and able to support the current production ~1 MBOPD, then that means the decline is negligible?
Sheng Wu,
The active rig count in Venezuela has been about 2 rigs for most of 2025 and 2026 according to Baker Hughes.
Probably this is enough to keep production constant. So probably the decline rate is relatively low for the extra heavy oil. This seems consistent with extra heavy oil resources in Canada.
DC,
The Canadian oil sand (CS) production is totally different from the Orinoco Heavy (OH).
Most OH could be pumped or flow like a regular conventional oil well, just need diluents when coming into pipeline or on ship, this requires minimal upfront investment; while CS need heating or excavation and processing, which require huge upfront cost.
I have a habit of bringing up neoGeo (next generation Geothermal).
This headline sums up what I think is quietly happening in the US.
‘Two Geothermal Bets Are Starting to Undercut Nuclear on Cost’
https://oilprice.com/Alternative-Energy/Geothermal-Energy/Two-Geothermal-Bets-Are-Starting-to-Undercut-Nuclear-on-Cost.html
I think there is a pretty big chance that this emerging sector will give nuclear energy ‘a run for its money’ literally, and be quicker to deploy considering much lower engineering complexity overall and at each site. By 2030 I think we have much greater clarity on the cost prospects, and comparisons with the ever more expensive nuclear trajectory.
The interviews with the Fervo founder Tim Latimer are very interesting for those interested.
for example- https://www.volts.wtf/p/catching-up-with-enhanced-geothermal
I like geothermal. It appears to be low-emissions, and every new source is good.
OTOH…
Nuclear isn’t a good benchmark. Nuclear is dramatically uncompetitive – it’s either a red herring or a way of giving subsidies away to crony capitalists.
Renewables with storage (mainly batteries) are the obvious choice – much cheaper and faster.
This article takes at face value the silly justifications that this presidential administration is giving for it’s obvious preference for FF – they argue that renewables are unreliable, with not even the slightest attempt to defend this obviously silly idea.
So, that’s not really a good justification for geothermal – it will have to compete with the lower cost alternatives…
Some things are changing quickly
“While coal still accounts for ~70% of India’s electricity production, its share is projected to drop below 50% by 2035 as new coal plant planning winds down with cheap solar alternatives taking over. The International Energy Agency (IEA) now projects that solar will meet roughly half of India’s massive electricity demand growth through 2030.”
“Driven by massive utility-scale projects and aggressive government subsidies, India added a record-breaking 44 GW of solar power in the 2025/2026 financial year alone, taking its installed solar capacity to 154 gigawatts (GW), third globally behind China and the U.S. India’s solar sector is growing at a scorching clip with annual capacity additions clocking in at 40% CAGR, and installed capacity set to double again by 2030.”
“Transmission bottlenecks and curtailment are stranding solar output, so India is investing roughly $100 billion in new transmission lines, battery storage, and pumped hydro projects.”
India GDP has more than quadrupled over the past 20 years, despite huge hurdles.
I wonder which companies serve the India air conditioning market?
This says that the advantages of renewables are overwhelming. It is remarkable when you consider the political power of the Indian coal industry:
“ the reliance on coal in Eastern India for jobs, and the presence of local vested interests, are major barriers to a transformation away from coal…pollution regulations that would limit coal use are ineffective because of the strong political influence of coal-proponents.”
https://www.sciencedirect.com/science/article/abs/pii/S0973082621000223
The National Stripper Well Association recently reported there are 886,435 stripper wells in the USA which produce a little more than 2.1 million BOEPD.
Texas leads with over 280k of these wells producing over 760k BOEPD.
Unfortunately the report doesn’t break down production into oil and gas. I suspect well more than half is natural gas, but that is a guess on my part.
It does appear more and more shale wells are becoming stripper wells each year.
Interesting. Those numbers indicate an average well output of 2-3 barrels/day.
Adds up.
EIA also has data on the distribution of US oil and gas production at link below
https://www.eia.gov/petroleum/wells/
If one were to look at the financial markets, including crude oil futures, one would never guess there is a widespread and growing war in the Middle East
They seem to be committed to the idea of TACO. Trouble is, the president has tried to chicken out and Iran wouldn’t let him. They refuse to give him the slightest fig leaf that would allow him to claim victory and walk away.
That’s what the MOU was all about. The problem is that the Iranians want real concrete stuff to happen up front, like getting billions in reparations. They know from bitter experience that agreements with this president aren’t worth the paper they’re written on, so they’re holding his feet to the fire. And…stuff like reparation payments would be poison to his base.
Hi Nick,
Yes, the cognitive dissonace is way off of the charts.
It’s like the financial markets are in a parallel universe.
Amazingly, people are still going to vacation in Dubai. Daughter’s classmate is there with fam right now. It’s like they have no idea it is a war zone!
This may be temporarily sustainable, I guess, until they hit an immovable physical reality.
“Rendezvous with Destiny” later this year perhaps?
IRGC wipes out US logistics hub in Kuwait in Operation Nasr 2
The Islamic Revolutionary Guard Corps said it carried out new waves of retaliatory strikes against US military assets in Kuwait, Bahrain, and Jordan, IRNA reported.
The IRGC said its forces hit:
🔸 Kuwait: the KJL main US Army logistics and support center at Mina Abdullah, along with satellite communications infrastructure, radar systems, a Patriot air defense complex, a logistics depot, and HIMARS launch platforms.
🔸 Bahrain: US Fifth Fleet facilities, including command-and-control infrastructure, equipment warehouses and fuel tanks.
🔸 Jordan: hangars for F-15, F-16 and F-35 fighter jets, as well as several US MQ-9 drones at Al-Azraq base.
https://t.me/SputnikInt/107014
BREAKING: The US has struck a wheat storage silo in Hoveizeh County and a silo location in Dasht Azadegan County, southwestern Iran, an hour ago, per the Deputy Governor of Khuzestan Province.
This is the first US strike on Iranian food supply infrastructure of the war.
https://x.com/HormuzLetter/status/2077232923200155895?s=20
I really don’t trust news from Iran government sources any more than I trust news from US government sources.
Ok, maybe a little bit more.
Hickory,
That sounds about right!!!
https://www.eia.gov/todayinenergy/detail.php?id=67866
EIA piece on tank bottoms.
An Update to March World Oil Production has been posted
https://peakoilbarrel.com/march-world-oil-production-collapses/