The EIA’s Short Term Energy Outlook (STEO) was published in early July. The chart below estimates World C+C by using the STEO forecast combined with past data from the EIA on World Output.
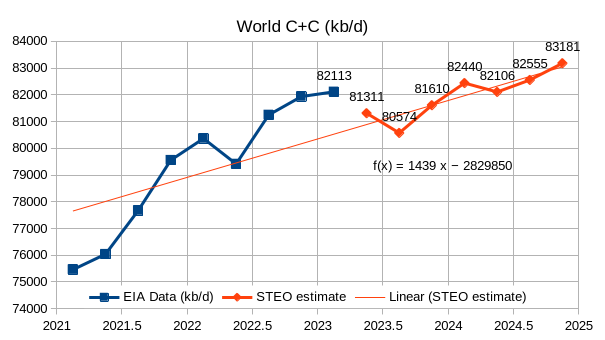
This month we have actual EIA data for 2023Q1 which increases the annual rate of increase for the forecast period compared to last month by 600 kb/d, part of the reason is an 800 kb/d forecasted drop in output from Q1 to Q2 of 2023. If we use the 2023Q1 to 2024Q4 trend the annual rate of increase is 911 kb/d, about a 100 kb/d increase from last month’s estimate. The trend from 2022Q1 to 2024Q4 is similar at about 916 kb/d. If this forecast through 2024Q4 is roughly correct, I expect increases in output after 2024 will be considerably lower, I also think this STEO forecast is optimistic. Annual average output in 2022 was 80.74 Mb/d and increases to 81.4 Mb/d in 2023 and to 82.6 Mb/d in 2024. These annual averages are 0.25 Mb/d less in 2023 and similar for 2024 as last month’s estimates.
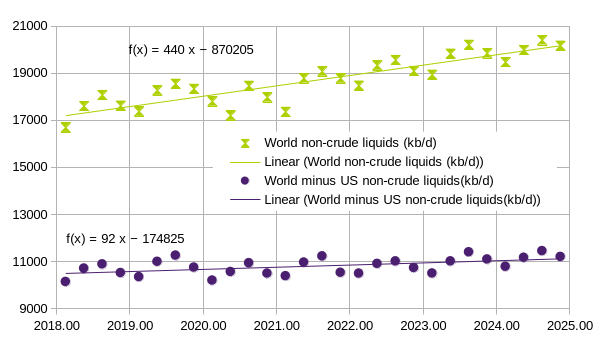
The chart above considers World liquids output that is not C + C output, mostly NGL and biofuels as well as refinery gain and compares the World total with the World minus the US. About 79% of the annual increase in liquids that are not C plus C comes from increases in the US.
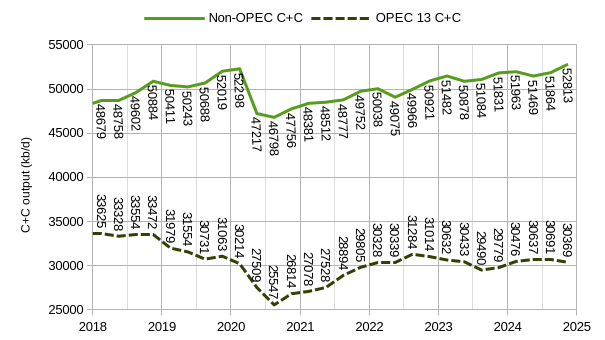
The chart above compares OPEC 13 output with non-OPEC output with the last 7 points of each series being from the STEO forecast. OPEC output increased quickly to about 30 Mb/d from about 25.5 Mb/d over the July 2020 to Jan 2022 period and has since stalled at about 30 Mb/d with a decrease from the post-pandemic peak of 31.3 Mb/d in 2022Q3 and is expected to fall to 29.5 Mb/d by 2023Q3 and then recovering to 30.7 Mb/d in 2024Q3. This is different from the announced quotas plus recent output from Iran, Libya, and Venezuela, so the EIA must believe the quotas will be changed. Most of the expected increase in World output in the STEO forecast comes from Non-OPEC producers. About 1900 kb/d from 2022Q4 to 2024Q4 or roughly 950 kb/d each year.
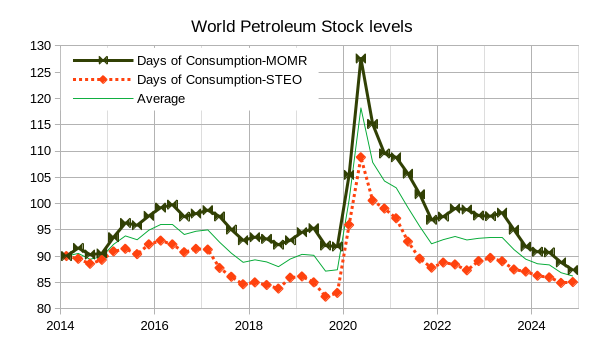
The chart above considers World petroleum stocks using data from both the EIA’s STEO and OPEC’s MOMR. I assume the stock level at the end of the first quarter of 2014 is equal to 90 days of that quarter’s consumption of total liquids for the World. This choice is arbitrary, but typically nations try to maintain about 90 days of stocks and at this time World prices were high so stocks were likely at at least this low a level. Using this assumption and the STEO supply and demand data results in very low stock levels at the end of 2019 (about 83 days of consumption), where the MOMR estimates result in a higher stock level of about 92 days of consumption at the end of 2019. The green line is the average of the two estimates. The expectation is that World stock levels below 90 days should lead to increasing oil prices and stock levels above 90 days should lead to falling oil prices. Sometimes market fear of a supply disruption (such as a War near Russia or in the middle east) can lead to price spikes unrelated to stock levels.
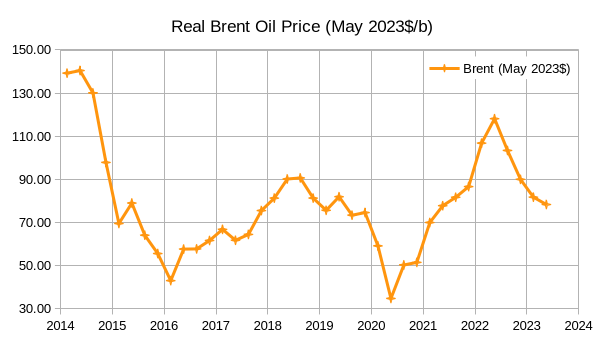
Considering the real oil price chart above for Brent Crude in May 2023 $/bo, the green average stock level line gives a fairly good indication of rising or falling oil prices with the exception of 2022 when fears over Russia’s invasion into Ukraine created a price spike. On the basis of the green stock level line falling below 90 days in late 2023, we might see rising oil prices at that point. Note that for the OPEC stock level forecast after 2023Q2 I assumed Iran, Libya, and Venezuela continue to produce at their June 2023 level over the ensuing 18 months and that the other ten OPEC members produce at the announced levels as of the most recent OPEC announcements (this includes the announced voluntary cuts) through 2024Q4. Obviously the forecasts won’t be correct, but if they were, the stock levels would be as shown and oil prices might rise in 2024.
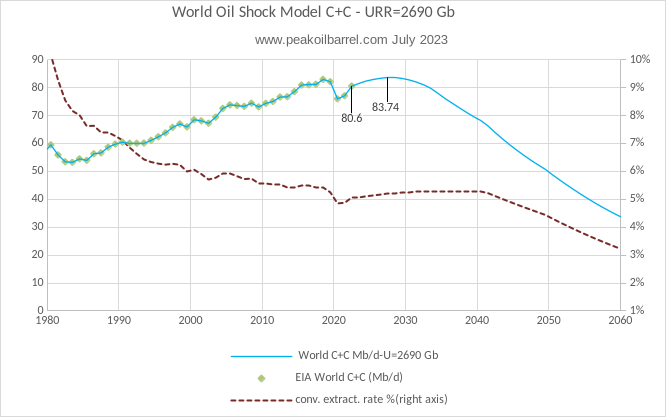
The chart above uses Paul Pukite’s Oil Shock Model to estimate future output with the assumption that a transition to electric transport reduces oil demand to less than supply by 2033 (+/- 2 years). The extraction rate shown on the right axis is for conventional oil only, a separate model is used for both tight oil and extra heavy oil. Output peaks in 2027 at 740 kb/d above the 2018 peak of about 83 Mb/d.
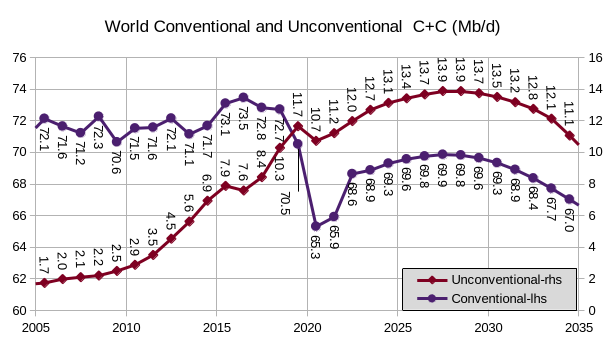
The shock model can be divided into conventional and unconventional oil scenarios where unconventional oil consists of tight oil and extra heavy oil with API Gravity less than 10 degrees. The conventional scenario peaked in 2016 at cumulative output of 1273 Gb and has a URR of 2520 Gb. The unconventional scenario peaks in 2028 at cumulative output of 77 Gb and the URR is 170 Gb. The combined model peaks in 2027 at a cumulative output of 1624 Gb.
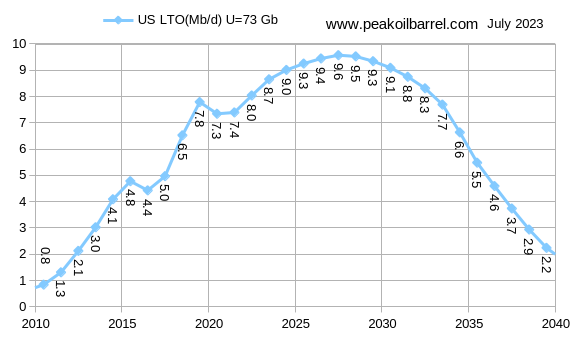
The US tight oil scenario above is a slight revision to the scenario presented last month. It peaks in 2027 at 9.6 Mb/d and has a URR of 73 Gb, slightly bigger than last month’s scenario (72 Gb last month).
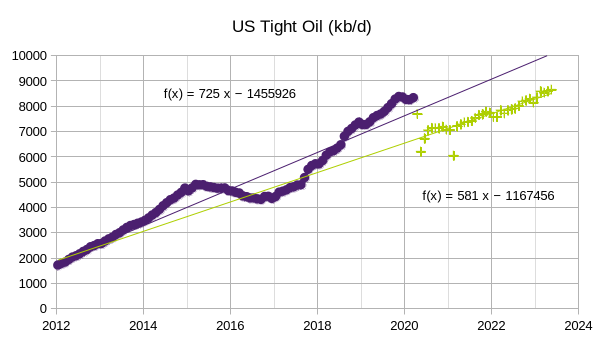
The chart above shows the most recent EIA tight oil estimate (spreadsheet at this link) with data from Jan 2012 to May 2023. Two trend lines are presented with April 2020 to May 2023 having an annual rate of increase of 581 kb/d and the earlier Jan 2012 to March 2020 period having an annual rate of increase at 725 kb/d on average.
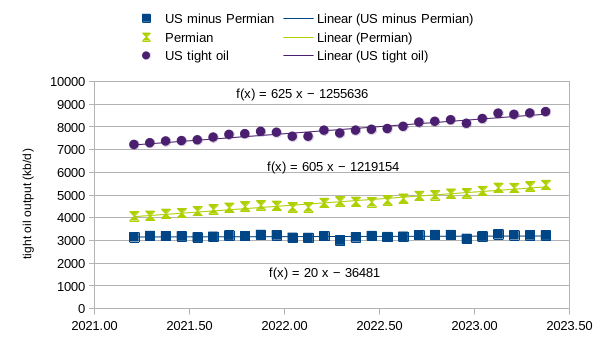
For the more recent March 2021 to May 2023 period the US tight oil trend has an annual increase of 625 kb/d, the Permian has an annual rate of increase of 605 kb/d and the rest of US tight oil (everything except the Permian basin) increased at an annual rate of 20 kb/d over the past 27 months. In the future I expect Permian output will increase more slowly and expect the rest of US tight oil to be relatively flat over the next 5 to 7 years.
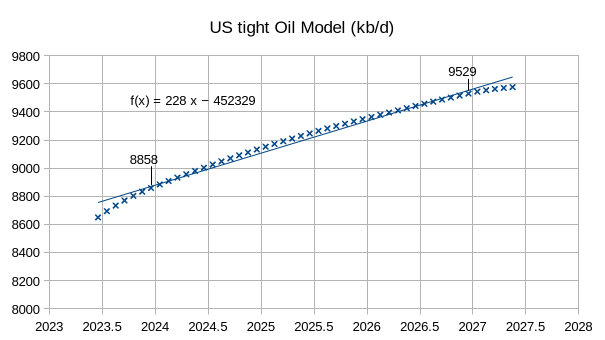
The chart above presents my tight oil scenario with monthly data from June 2023 to May 2027 with a trendline. The annual rate of increase is 228 kb/d over this period, quite a bit slower than the rate of increase over the previous 27 months (or the previous 37 months). The output levels for December 2023 and December 2026 are shown on the chart.
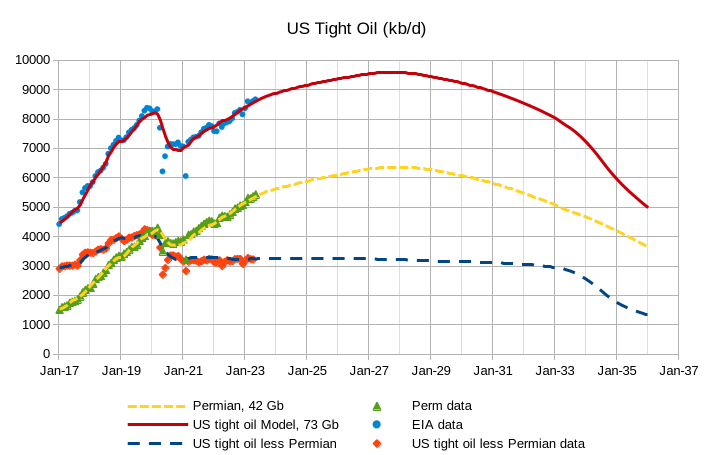
The chart above presents the revised US tight oil and Permian tight oil scenarios, the US tight oil less Permian scenario is unchanged from last month. The US tight oil model peaks in September 2027 at a centered 12 month average of 9578 kb/d and the Permian model peaks in December 2027 at a centered 12 month average peak of 6358 kb/d.
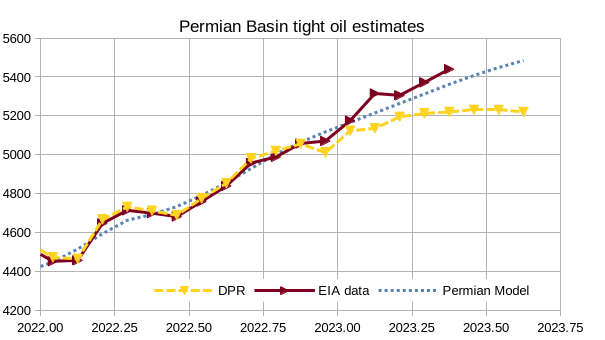
The chart above compares the EIA’s official tight oil estimate (labelled EIA data) with the recent DPR estimate for the Permian basin and my Permian Model. To compare the DPR with the tight oil estimate I found the average of the difference between the two for the June 2020 to October 2022 period which was 545 kb/d. I had checked the DPR against state data from Texas and New Mexico and the match was good over this period, after that incomplete state data led to the DPR being higher than the state estimates after October 2022. The DPR estimate shown on the chart subtracts 545 kb/d from the DPR estimate to remove the conventional oil from the Permian region that is included in the DPR estimate. The match between the DPR estimate and the EIA data is quite good through November 2022, by May 2023 the DPR estimate falls to 220 kb/d below the EIA’s tight oil estimate. My model also falls below the EIA estimate in May by 83 kb/d. For August 2022 the DPR estimate is 265 kb/d below my Permian model (which was too low in May), it seems possible that the DPR estimate for the Permian basin is too low from Feb 2023 to August 2023.
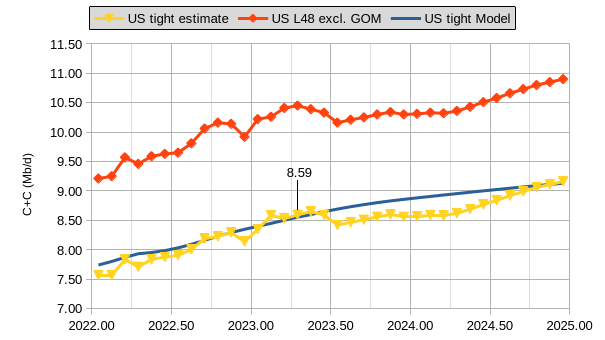
The chart above uses a similar methodology to what was used previously for the Permian Basin with the DPR and EIA estimate, but uses the US tight oil estimate and the US lower 48 output excluding the Gulf of Mexico (US L48 excl GOM) estimate from the EIA’s STEO. The difference between these is about 1.73 Mb/d on average from August 2021 to July 2022 and this was subtracted from the US L48 excl GOM estimate to arrive at a US tight oil estimate from May 2023 to December 2024. The data on the chart from Jan 2022 to April 2023 is the official EIA tight oil estimate up to the 8.59 Mb/d called out on the chart, after this the data is the estimate I have outlined with each US tight estimate data point 1.73 Mb/d less than the corresponding US L48 excl GOM data point. My model does not match this estimate very well from July 2023 to August 2024 with the model being as much as 350 kb/d too high in March 2024. In August 2023, the model is 262 kb/d higher than the tight oil estimate which might be coincidence, but the Permian model was about 265 kb/d higher than the DPR estimate for August 2022. It could be that the STEO is using the DPR for part of its modelling for US output. I will fix my models as presented this month for 6 months to see how they play out over time. We might find that the EIA estimates will be adjusted over time and it would be interesting to see how well the models do.
228 responses to “STEO and Tight Oil Update, July 2023”
Thanks Dennis – I appreciate your continued analysis and unwavering model. I believe over time it will get further and further off course, as mentioned in the last thread, 1P and 2P would have to grow by very high amounts to reach the 2PC estimate that you are using (2783 Gb). 2PC includes noncommercial volumes and undiscovered oil…clearly it includes estimates for oil that will never be found!
There is a more simple way to look at this, 3 categories of oil:
300 Gb – Conservative estimate in existing fields (P10), this is likely a low estimate (90% it will be higher)
400 Gb – Average of conservative and most likely estimate in existing fields (P30), this is a slightly low estimate, (70% chance actual URR will be higher).
500 Gb – Most likely estimate in existing fields (P50), this is the best available number we have with 50% chance of being higher or lower than actual URR…
So why not model 1800 (1P), 2000 (2P), and 2500? I think 2500 is still too high, it’s likely only a 10% prob. of being higher than that. Thanks for all your work!
Kengeo,
Thanks. We will see how things play out.
Geologists at the USGS say there are about 3000 Gb of conventional resources, I am using 2500 Gb which is conservative. 2PC does not include undiscovered resources (which are called prospective resources), it includes the mean estimate of contingent resources which have been discovered, but have no current plans for development. Lots of uncommercial resources become commercial at higher prices and as technology develops.
You can do your own models, even 2500 Gb is likely too low an estimate, that would be my P90 estimate. As I have mentioned, Jean Laherrere’s estimates tend to be conservative and in 2022 he estimated 3500 Gb for World C plus C URR. I would put the P50 estimate at 3000 Gb, and P10 at 3500 Gb. My 2700 Gb model is on the conservative side of reasonable estimates.
Contingent Resources are those quantities of petroleum which are estimated, on a given date, to be potentially recoverable from known accumulations, but which are not currently considered to be commercially recoverable.
It is recognized that some ambiguity may exist between the definitions of contingent resources and unproved reserves. This is a reflection of variations in current industry practice. It is recommended that if the degree of commitment is not such that the accumulation is expected to be developed and placed on production within a reasonable timeframe, the estimated recoverable volumes for the accumulation be classified as contingent resources.
Contingent Resources may include, for example, accumulations for which there is currently no viable market, or where commercial recovery is dependent on the development of new technology, or where evaluation of the accumulation is still at an early stage.
For a better understanding of contingent resources see
https://www.spe.org/en/industry/petroleum-resources-classification-system-definitions/
When I do an HL on World C plus C data from 2000-2019, I get a URR of 3030 and a peak in 2024, decline rates are under 1% per year from 2025 to 2037 and increase gradually from 1% in 2038 to 2% by 2053 and to 3% by 2077 for a Hubbert Model.
Looks like a 20 year peak plateau phase 2014-2034.
Global population increases 1.5 billion during that timeframe.
That equates to a big drop in oil/capita, accelerating post plateau.
Plan for less oil.
Hickory,
Oil use per capita was pretty steady from 1983 to 2019, it has yet to return to the 2019 level (data through 2022).
The nice straight line is about to trend on down as 7.3 B in 2014 becomes 8.8 B people in 2034,
during this high plateau phase.
Hickory,
I expect that will happen as well, note that there was little change from 2014 to 2019, though I imagine population was still growing, but oil output must have grown at a similar rate. This will change and gradually we will see oil consumption per capita decrease, the rate of decrease will be the population growth rate plus the rate of decline in oil output. Recently World population has been growing at about 0.8% per year, oil output will decline at about 1.7% per year from 2028 to 2038, so if population growth rate is unchanged (it will likely decrease) this implies a 2.5% decrease in oil consumption per capita over that decade.
The same in barrels per year
the great reset?
Dennis – Seems pretty straightforward to me:
Minimum estimate (90% actual is higher): 285 Gb
Medium estimate (50% actual is higher/lower*): 505 Gb
*this means there’s an equal chance of it being higher or lower than this value.
Maximum estimate (10% actual is higher): 1300 Gb
Another way to look at it is the most likely value is the mean of the minimum and maximum:
~800 Gb, which works out to 2,300 Gb. Therefore a conservative range for 2P is 500-800 Gb.
I believe this also matches HL methods better than any methods that estimate >2,500 Gb.
Question, what happens if you remove the ~300 Gb of overstated Middle East reserves? I imagine the maximum estimate drops to 2,500 Gb?
Kengeo,
A Hubbert linearization is pretty straightforward for the World, it does not depend on stated reserves simply on historical output, using data from 2000 to 2019 I get a URR of 3030 Gb. Note that my model is about 2700 Gb, 3030 minus 300 would be about 2730, but that is not how I arrive at my scenario. I assume demand drops after 2035 and leads to a fall in supply that matches the fall in demand as the World uses less oil for land transport. Working to reduce climate change damage will eventually see us reduce almost all fossil fuel use for combustion and transport, though some will be used for chemicals, fertilizers and other material inputs, very little will be burned as cheaper sources of energy become more widespread.
You should try doing an HL analysis. You have to do some pretty funky stuff (such as not focusing on straight line portion of chart) in order to come up with a URR that matches your expectation. Anything under 2700 Gb is not a good analysis and my judgement is that at least 3000 Gb is a best guess estimate for World C plus C URR using the HL method.
Dennis , ” as cheaper sources of energy become more widespread. ” You wrote that ??? Unbelievable . Seems like you are not sleeping proper . Get some sleep . Serious .
Hole in head,
As fossil fuels deplete they will become relatively expensive compared to other types of energy such as nuclear, solar, wind, hydro and biofuels which may become relatively less expensive than fossil fuel and more widely used over time. That’s my expectation.
Why, Dennis? Because windmills, solar panels, and nuclear power stations shoot out of the ground under tremendous pressures?
Please forgive the snark.
MikeB,
It simply is. Costs of wind and solar in particular are cheap, thought there are challenges to intermittency as they become more widely dispersed at adequate levels ( a capacity in total of roughly 3 times average electric power load) and interconnected with a high voltage grid with adequate capacity, the intermittency becomes less of a problem.
I would note that producing, refining and distributing oil, natural gas and coal is not a trivial matter, it requires lots of effort and does great environmental damage, producing wind turbines, solar panels and the grid needed to connect them also does environmental damage, but less so than fossil fuel. Alternatively we could use no energy at all, but it is a relatively unrealistic option. The best policy is to reduce energy use as much as possible while replacing fossil fuels with alternatives. It won’t be any more difficult than farming, possibly less so.
Just for information purposes . Announcement from EIA .
Joe DeCarolis
@EIA_One
·
10h
Replying to
@EIA_One
I have decided that we must forge ahead with critical NEMS enhancements to keep pace with the changing dynamics of the energy sector.
In order to accommodate this effort, EIA will not publish an Annual Energy Outlook in 2024.
Recession indicator . Diesel consumption down . Oh ,by the way a large transport company also filed for bankruptcy .
“U.S. diesel consumption fell below the 5-year average in early June 2023
That’s a bad signal for the economy ” —- Art Berman
and here is another view art did not mention
Javier Blas
@JavierBlas
·
3h
COLUMN: In this age of climate crisis, the world is consuming more oil than ever. Peak demand? Not yet.
On my calculations, global oil demand has surpassed in the past few weeks the peak set in 2019 before the covid pandemic | #OOTT via
@Opinion
bloomberg.com
The Harsh Truth: We’re Using More Oil Than Ever
The planet is getting hotter by the day, but we can’t slake our thirst for crude.
“HFI Research
@HFI_Research
·
18h
US oil demand is not great. Overall is up, but gasoline/distillate/jet fuel now matching 2022 due to weak distillate demand.
Gasoline and distillate need to pick up going forward.”
of course that is hindsight…prior to recent and ongoing price increases.
“US oil demand is not great.”
That is a Hilarious statement. Others would say US consumption is gargantuan.
Thats how I see it.
I guess it all depends on what ones goals are.
more context
Javier Blas
@JavierBlas
·
53m
Important comments on global (and US) oil demand:
“Global demand for transportation fuels as recovered substantially with gasoline and diesel demand now comparable to pre pandemic levels” — Lane Riggs, Valero CEO | #OOTT 1/2
Javier Blas
@JavierBlas
·
52m
And another key one from Valero (this time from CFO Gary Simmons): “We do believe that the DOE is understanding gasoline demand […] We’re seeing gasoline sales in our system, up 14% year-over-year, up 20% from pre pandemic levels” | #OOTT 2/2
Javier Blas
@JavierBlas
·
33m
*understating
7
5,944
Best case scenario-
The global demand for oil declines slightly faster than supply,
all the way down.
Hole in head,
I don’t put a lot of stock in EIA weekly numbers which are often off by kilometers rather than millimeters, monthly data is ok and worth paying attention to, charts based on the weekly data are garbage, its a gigo thing.
Lea and Eddy counties account for 29% of Permian production .
https://www.eia.gov/todayinenergy/detail.php?id=57020#
I think the focus is too much on the global production peak. I would like to get feed back
from this group which evidence there is that global oil markets start to disintegrate with more focus on regional oil demand like in Asia as highlighted in my post
17/7/2023
Peak Oil in South East Asia and India – Part 1 Production and
Consumption – Update 2022
http://crudeoilpeak.info/peak-oil-in-south-east-asia-and-india-part-1-production-and-consumption-update-2022
Agree wholeheartedly Matt.
I’ll add that within many countries a big dynamic going forward will be the disparity between those who can afford and procure adequate energy supplies vs those who can’t.
Matt you are noticed . Yes, you are correct in your observation above .
“2 billion people represented by these 7 countries, all on the right part of S-curve and all with significant growth in petroleum consumption.
At the same time, their combined crude oil production remains in terminal decline = growing import requirements for years to come ” — Shubham Garg
When I read the graph above from Matt and combine it with the Eurodollar issue as discussed by HHH , I see a toxic brew . Go back to the dollar crisis way back in the 90;s in SE Asia . Are they are stronger now on the dollar front than before ? Yes . How strong ? I don’t know .
When oil is put on a boat for export it’s paid for with a credit from a bank to another bank. Literally most of the “money” that exists are credit entries on bank balance sheets. Nothing physical be it cash or gold is leaving one bank and going to another.
It’s not practical to put pallets of cash or gold on a boat or plane every time there is a transaction done between two entities in two different countries.
I think most people understand this to be true but don’t understand how little physical cash there is compared to credits on the balance sheets of banks.
Credits on the balance sheets of bank determine the value and price of absolutely everything. Be it oil, be it gold, be it currencies.
Eurodollar system determines the value and price of everything.
Eurodollar system determines the value and price of everything.
HHH I think we all realize that physical cash is just not used for anything anymore. Hell, I don’t even use it anymore, even to buy a hamburger. But I was totally unaware that the Eurodollar had taken over as the world’s primary reserve currency. I totally missed that news flash. When did that happen?
” I totally missed that news flash. When did that happen?”
I think it just happened without anyone noticing.
It wasn’t designed.
It emerged out of buying behaviour,
A reserve currency is a function of math. nothing else.
People like to hold things denominated in dollars cause they are stable and reliable.
People like to hold things denominated in dollars cause they are stable and reliable.
I agree. Oil is still traded, in the vast majority of cases, in dollars. And that is what the emergent buying… and selling behavior… is doing… in spades.
No, the eurodollar has not, very silently, become the world’s primary reserve currency. But if you have data to dispute that claim, I would gladly look at it and admit my error if I find your data convincing.
I am a newbie to the whole Eurodollar thing.
Yeah, some data supporting the claim is in order.
HHH, got any?
Yeah, some data supporting the claim is in order.
HHH, got any?
Thanks, Andre; I couldn’t have said it better. 🤣🤣🤣🤣🤣🤣
Eurodollars ( the word Euro is misleading….it has nothing to do with the EURO or Europe)
Are US dollar ledger entries that are overseas and they are still valid and used in transactions.
But, Ron is correct….HHH please support your claims with evidence?
Eurodollar became global reserve currency in the 1950’s. The majority of Eurodollars are dollars that are created. Loaned into existence, in offshore markets around the world.
Yes it perfectly legal for banks outside the US to create money or bank ledger entries denominated in US dollars. Which are used as money by global monetary system.
Global banking cartel is a very good way of looking at it. These bank ledger entries require zero bank reserves denominated in US dollars that the FED creates out of thin air.
One is the global reserve currency the other is not. One is used in 70% of global transactions the other is used in 0% of global transactions.
There wouldn’t be nearly enough dollars outside US for global economy to transact in without these banks creating the credit needed to conduct business transactions. Global trade would be a small fraction of what it is today without these Eurodollars.
Why can’t we all just transact in each other’s currencies. There are only so many Chinese yuan or Indian rupees that Russia can use. Americans don’t use British pounds to pay for anything. We trade with them but can’t use or have no need for their currency. Eurodollars are excepted pretty much everywhere.
Eurodollars are ledger credits. Nothing physical ever leaves one bank and goes to another. Banks are basically book keepers that just keep track of the credits.
When there is a let’s call it a hiccup in the Eurodollar market where these Eurodollar banks decide not to extend credit or make it expensive to extend credit because of counterparty risk or lack of collateral or even lack of energy in real economy. Whatever the case. These credits determine how many dollars are in the monetary system. And ultimately the value or price of all currencies and commodities. 2008 was a global dollar shortage. That actually started in France of all places. Most people have no clue to that fact.
Yes it was a bank in France that kicked off 2008 monetary crises.
But no data?
@andre – you notice that too? you beat me to it, but my comments get put into a special holding pen for Ron to hold a little sword of damocles over. 😉
TwoCats, I am sorry about that. I would fix it if I could. Also, Dennis and Ovi could approve your post if they ever checked the pending file, but obviously, they don’t.
I check it frequently because that is where I check for new posts. I only go to the main post if I need to reply.
But I am getting old and won’t be around much longer. 😫 No one will approve your post then when I am gone. 😫😫😫
I have a probable solution. If you create a new email address, then that might fix the problem. I would have to approve your first post, but your approval should be automatic after that.
SOFR which replaced LiBOR this year is deeply inverted. The banks that create all the money in the Eurodollar market are telling you through all the yield curves that the worst of what is coming down the pipe hasn’t hit yet.
You can’t view exactly what Eurodollar banks have on their loan books. Central banks don’t even have that information. You have to look at other stuff like Japanese bond yields. They are already low. But when you see them going lower when they are the only major central bank not raising interest rates it tells you there is huge demand for safe an liquid assets above and beyond the central bank buying.
Why is that? Because opportunities in real economy to make money aren’t good so people buy government’s bonds instead. Buying government bonds instead of lending money into China. When you see USD/CNY go up meaning dollar is gaining value against the Chinese yuan it means less Eurodollars are flowing into China.
You have to look at what currency swaps are costing people. Again, you have to post some form of collateral to get a currency swap at a bank. If collateral becomes impaired for any reason. Which can happen for a variety of reasons. You have post more collateral to borrow or swap for the same amount of dollars.
Eurodollar market can become collateral constrained. Where entities within the economy don’t have the collateral needed to create Eurodollars.
2008 was or started as a collateral shortage or banks unable to properly value the collateral they had on the books in France.
Over the next 12 months or so. We will see a whole lot of collateral on the banks of the small and mid sized banks get repriced as CRE loans are walked away from in mass.
That doesn’t mean oil can’t get a short term bid. It just means in the longer term oil is going lower much lower in price. We have to get to the other side of the incoming recession before oil becomes an attractive buy again.
“… It’s not practical to put pallets of cash or gold on a boat or plane…”
A better way of putting this, for me anyway, would be this- that a real world transfer of anything results in a discount or tax on the energy available in the purchased oil. The margin is too low already.
Jeff Snyder has a series of videos on the Eurodollar and currency wars . Here is one .
https://www.youtube.com/watch?v=wRsopaUFjgI
fantastic post HiH, thank you. I just finished the intro/overview (about 25mins) and it seemed like a great summary. At least I can say that it was presented in a way that is pretty easy to understand.
luckily we’ve had HHH on the thread to signal to this issue. I would like to see HHH start posting actual data to show how the Eurodollar system is under strain. if such data exists publicly. hopefully the video addresses this as well.
I just finished Edward Chancellor’s book The Price of Time, and curiously he did not mention the Eurodollar system separately. I have watched many of Jeff Snider’s videos and my understanding of the creation of this system stems from the fact that the world industrial center moved from Great Britain in the 1880’s to USA with its high point in 1945. This made the USD the most stable currency and businesses outside the US saw it prudent to borrow in dollars in order to limit the currency risk.
What Would Happen to Russia’s Oil and Gas Industry if the Government Fell?
If Russia’s government were to collapse, we would likely see substantial upstream declines.
That’s what Joseph Gatdula, the Head of Oil and Gas at BMI, a Fitch Solutions company, told Rigzone, adding that the reformation of a new government, whether peaceful or violent, would influence the extent of those declines.
“When the Soviet Union dissolved relatively peacefully in 1991, crude production fell by 10 percent that year and 13 percent in the year after, with declines peaking five years later at 40 percent below 1990 levels,” Gatdula said.
“State control of the oil and gas industry was much higher during Soviet times, so these declines are not likely to be repeated if the transition is orderly,” he added.
There is much more to this article. Click on headline link to read it.
They can see this in Russia, but somehow they cannot see this ever possible in US? Why?
Though CIA models predict “civil war” or similar unrest for a while now:
https://www.washingtonpost.com/outlook/2022/01/06/civil-war-books/
https://www.washingtonpost.com/magazine/2022/03/08/they-are-preparing-war-an-expert-civil-wars-discusses-where-political-extremists-are-taking-this-country/
It’s Trumpism all the way down
WTI just punched a $80/b ticket
Caught my eye also—
Dennis
Nice Job. A lot of good projections. I note that your tight oil model is slowly rolling over. The Permian will be the interesting basin to watch for the next while.
Attached is supply/demand chart created using the STEO supply/consumption data (all liquids) in the July STEO.
It is showing that over the next 17 months, only four months show a significant surplus. I think what this is saying that demand will begin to stress the supply side and force some of those OPEC plus cuts to be reinstated. It will be the beginning of the trek to the next post covid high. The effect of the July SA 1 Mb/d cut is starting to be felt as WTI settled over $80/b today.
The PDF in the STEO report shows a daily decline in inventory of 60 kb/d for 2023 and 230 kb/d for 2024. The STEO shows the July 1 Mb/d drop in OPEC crude and then a slow rise.
It will be interesting to hear what comes out of the OPEC meeting in early August. Will SA extend their 1 Mb/d cut into September?
Thanks Ovi,
There was a very big surplus of oil stocks built up during the Pandemic (about 464 Mb excess supply during first 6 months of 2020, on your chart this would be 6 months with an average surplus of 5.83 Mb/d), your chart does not show that. I think days of consumption is the more important metric as consumption increases it takes a larger total stock level to meet the 90 days of supply that is aimed for. The idea is straightforward in my mind, if average consumption is 100 Mb/d for the World, then 90 days of supply would be 9 billion barrels of oil in World stocks. If only 50 Mb/d of oil was consumed the stock level would only need to be 4.5 Biliion barrels. OPEC has different supply and demand estimates than the EIA. OPEC believes World Stock levels are much higher than the EIA does so they may not act to increase output unless they revise their estimates.
Yes my tight oil estimate has always rolled over, but the peak has been moved forward a bit to 2027. I will try to leave it alone for a while so we can see how badly I do.
Dennis
My earlier charts used to start in 2020 but for this one I removed it to more clearly show that 2022 was in surplus and that 2023 and 2024 were going to be draw years.
Attached is the same chart starting in 2020 and the surplus production was huge in 2020
WTI Chart. Looks bullish. How long before it challenges the previous high at $83/b.
with a weekly close above $80 that resistance becomes a floor that I think OPEC intends to defend. I think the ceiling will be the mid $90’s. I don’t know if they will announce It but that is were I would expect to see some of the Saudi BBls to begin to come back into the market. To late for any SPR refill. now that we have shot up all our ammo, for the first time is 10-15 years we are not in control of our own destiny (USA). Great for oil and gas producers but the consumers will be strained and continued inflationary pressures will persist in both food and fuel. 1970’s redo in my opinion.
Texasteatwo
I agree with you that the 90s are SA’s new 80s after accounting for inflation over the last two years.
How is this for a crazy idea. I think Biden should send someone over to SA to talk to the Prince and make a fixed price deal for 100 M barrels of oil at $85/b delivered over a year. That would give the Prince more sales without affecting the market surplus condition. Could also help repair the current rift between B and MBS.
At some point reality has to set in for these two.
I was re-reading the most recent Permian post at Novi labs and found this chart, which I hadn’t noticed earlier because it was small. I blew it up and thought I should share it.
This chart suggests for the Permian as a whole the newer wells have a lower GOR for any given cumulative output. This is the opposite that I would have expected.
See https://novilabs.com/blog/permian-update-through-april-2023/
The chart below takes the lower right panel of the last chart in the post and enlarges the chart so it is readable.
The chart is for the entire Permian basin and the wells are not normalized for lateral length.
Notice how the 2016, 2017, 2018, and 2019 GOR vs Cumulative output lines are right on top of each other with 2020 and 2021 having lower GOR at any given cumulative output level. Too early to make a judgement on 2022 wells, but they seem to be following the 2021 wells so far.
Dennis
Attached are two charts using daily production vs GOR for two counties. I think that cumulative output is the wrong parameter.
The Lea chart is hinting at the beginning of a straight line decline .
Howard, next chart is interesting. Is the straight line the clue that it is gassing out. I am wondering if the monthly update will change much in the chart since these are based on ratios
Ovi,
That was the chart given, too much work to reproduce GOR vs time. I like the idea of looking at how wells have changed over time, but separating out over years we can see of older wells have lower GOR than newer wells, that gives more information than looking at all well vintages mingled together as is the case with the state data by month.
Oh, Lord, Ovi, please don’t listen to this dribble above. THAT dribble is the EXACT opposite of what you should be looking for in issues of GOR to liquids production profiles, all leading to indications of eventual depletion. You are on the right track. Of course sweet spots, large operators in those sweet spots, and core counties matter in the big picture. Howard is one of the six core counties in the Midland Basin! How can anybody ignore THAT. Good grief.
And you would do well to listen to Gerry. He understands. A fella named John has posted some time-framed Novi charts at OSBFS that are very relevant to this subject. GOR goes up, bubble point occurs, liquids go down, then eventually GOR goes down. The Permian HZ play is now 9 years old; this tight oil stuff is in Hospice Care by year 12.
You seem genuinely interested in learning about real oil and gas to be a better analyst; I applaud that.
Mike,
Dribble is what basketball players do. Drivel is nonsense that is spoken.
Mike,
So we are looking for GOR to be decreasing with time when we have reached bubble point, are we seeing that on a countywide basis? Or perhaps for specific operators in specific counties?
For the average 2007 Permian well at 180 months of output tha GOR is about 25 MCF/bo. For the average 2008 Permian well at 168 months the GOR is about 8.3 MCF/bo and for the average 2009 Permian well at 156 months the GOR is about 6.1 MCF/bo.
If we look at Howard county for 2013 (4 wells) it looks like bubble point might have been reached around month 108 from what has been described. GOR goes from about 2 up to 12 in a short period and then drops back to about 3 roughly 4 months later.
See link below from Novilabs
https://public.tableau.com/shared/6Y5C8CPHW?:toolbar=n&:display_count=n&:origin=viz_share_link&:embed=y
Gerry Maddoux,
Could you take a look at chart linked below, please?
https://public.tableau.com/app/profile/peters6703/viz/shared/6Y5C8CPHW
You can toggle between oil and gas on upper right of chart under product, At month 106 there is a spike in oil output and for month 108 there is a large spike in gas output. There are only 4 wells on this chart of 2013 horizontal wells competed in Howard county, does this look like the wells are reaching bubble point around months 105 to 109? It seems to match with what has been described.
Thanks.
Dennis, first…I am not an engineer. I find them confusing, mostly driven by egos and degrees and hard to listen to. They typically think they know more and always have to have the last word. Admittedly, I am biased because I was in well control for a long time. They didn’t know shit about that stuff. So, often NOT being an engineer helps explains things so that people can actually understand issues better. That is my goal. And to increase awareness of depletion, that nothing lasts forever, not even the Permian, to stop exports and keep American resources IN America.
Gas to oil ratios are typically an individual well metric, like cholesterol levels in blood work for your annual checkup. GOR statewide is totally meaningless and most of the time, meaningless for an entire county, and certainly for a basin like the Midland or Delaware. EXCEPT in the unconventional HZ play where entire counties are packed full of wells on close spacing. Then county wide GOR’s can become very relevant. In core areas, in sweet spots that are stuffed with wells, GOR is very important.
If you wish to use GOR as a means of predicting the future you can’t make generalized statements about it, you must work from the bottom up, too much time or not.
When I see well productivity, or liquids well productivity decline by big operators in a county, I see rising GOR in the same sweet spots… 100% of the time. Its depletion. EOG, for instance in Lea County. Or Pioneer in Midland County. Ultimately what I see with densely populated sweet spots will happen county wide, like Howard County in the Midland Basin. How quickly depletion occurs in sweet spots is an indication of how MUCH quicker the same thing will happen on the flanks.
GOR is generally only relevant to certain (tight) oil reservoirs with solution gas/oil expansion as its primary drive mechanism, ‘drive’ meaning the energy that moves hydrocarbons to the wellbore. Induced energy from a frac first creates conductivity to the well bore, then that poops out and Mother Nature takes over.
“Gassing out,” by the way, is an old oilfield term used to describe bubble point in tight, depletion gas reservoirs. Most tight oil kids these days would not even know what gassing out means. Old farts do. I heard somebody I respect a great deal say today he thought the entire Permian Basin was gassing out. He was old too.
In densely populated sweet spots, or counties, initial reported GOR’s are important. To me they are an indication of trouble.
GOR goes up as tight liquids are produced from dense shale, or shaley carbonates. Bubble point occurs and oil rates roll over and start downhill. But GOR does not immediately follow that liquids decline and GOR can keep going up as liquids decline. Then, after some period of time, gas begins depleting, GOR goes down and the well has entered Stage 4 depletion, the last of its days. I’ve seen data sets of early Permian wells drilled that have already reached Stage 4 depletion, LOTS of them. I am amazed at how dumb people are about infrastructure build-outs and LNG terminals to handle Permian associated gas. That associated gas in boundary defined shale containers (SRV’s) won’t last long either. I don’t get it, then again, I always used my own money.
So GOR is all over the map for a county, at first; newer wells have rising GOR, older legacy wells have declining GOR. Individual well GOR is often misreported. Averages, extrapolating past trends into the future is fruitless. Nothing is certain, things change down there in the dark all the time. The GOR metric matters only in areas stuffed with laterals, in primary benches getting drained, and then to sort it out you must work from the bottom up, from the inside out.
That’s my story and I’m stickin’ to it.
Thanks Mike.
Did that chart look like wells reaching stage 4?
Howard County 2013 Oil, note month 105 to 108 change in output
More detail can be found at link for GOR by toggling between gas and oil, this chart represents only 4 horizontal wells that were completed in Howard county in 2013.
Howard counts 2013 Permian wells gas output, notice month 108. Oil output was 27 b/d for Month 108, GOR=12. For month 106 oil output was 93 b/d and gas was 148, GOR=1.6.
Ovi,
Here is GOR for average 2015 and average 2018 Permian basin wells, using GOR on x axis and Output in barrels per day on y axis. The output has been normalized for lateral length(output per 10 thousand feet of lateral which is close to the average lateral length in the Permian in 2022), with 2015 wells averaging 6322 foot lateral lengths and 2018 wells having average lateral lengths of 8006 feet. I used number of wells in midland basin and delaware basin in 2015 and in 2018 from Novi labs and used Novi labs data from April 2023 report and page linked below for lateral length estimate (I do not have access to Novi lab data for lateral length).
https://www.eia.gov/todayinenergy/detail.php?id=50016
I wonder if frictional losses in the longer laterals result in an increase in GOR as I expect the losses for natural gas might be lower than for crude, there are many who know more about this than me, but I have read online that frictional losses along the length of the lateral can lead to lower productivity per foot of lateral.
Note that the data is for the average well from 2015 and from 2018 and the data is from month 2 (lowest GOR) to month 48 (highest GOR).
Ovi,
We might have newer wells will lower GOR values not being reported yet, perhaps it takes some time for them to be set up in the RRC database, in any case this is speculation, I think the last 3 to 6 months of data May not be very good. New Mexico has a regulation that data must be reported within 45 days to the stae agency, but I have no idea if there is any enforcement, it might be any fines are very low so the data may not be timely in New Mexico. They probably have a much smaller database of wells than Texas so the job may be easier in New Mexico of getting all the data in the database and accessible online. What does the Lea county chart look like for GOR vs time?
Also, the biggest county as far as Permian output in the Delaware basin is Lea county, it might make sense to look at the corresponding largest producing county in the Midland Basin which is Midland county, this is the core of the core for Midland basin.
Texas RRC data for Pioneer Natural Resources wells in Midland County Texas GOR in MCF/bo.
Pioneer Midland county GOR vs oil output (kb per month) Jan 2018 to May 2023, same data set as previous chart but different format preferred by Ovi.
Note that I mislabelled the vertical axis it should be kilobarrels per month, my apologies.
Dennis
I think we are onto something new, definitely for me, and we need to be following this new may to chart production from counties/companies. This is the first month of data and it will be kept separately each month so that the change over the next three to six months can be compared.
Attached are two charts. Midland GOR which is vaguely similar to the PNR chart posted. They both bottom close to January 2022 before the GOR starts to rise.
Ovi notice how much Midland increased in 2020, it could be that completion rate is slowing. which would increase GOR.
This is the GOR vs Production chart for Midland county. The first part is similar to the one for PNR in that it wanders all over the place. However both show a similar trend for the last six to 7 months in that they are moving horizontally and slightly down.
As for how much those last six months will change going forward, I think very little because it is a ratio.
Let’s follow and see what happens.
Ovi,
I’m assuming the interval between the data points is monthly?
Yes
Howard
Note the straight line. Is that the clue to gassing out?
Ovi,
When the data is not complete we could see GOR decrease if the newer wells (with lower GOR) have not been reported, but the older wells that have already been set up for reporting and have on average higher GOR are being reported. The Texas RRC data takes some time to become complete, they have about 400,000 wells (maybe more) to keep track of so it is no easy task to get this data together in a timely way. The last 5 data points on your chart will likely change over time.
Also if you look back at 2020 you will see that as completion rate falls the GOR will increase.
Ovi,
I have some old RRC data saved on my computer, here is the most recent RRC statewide estimate compared with two earlier dates for GOR.
Howard GOR vs time
You have it right, Ovi.
From a simplistic standpoint, if you take a shale oil well past the IP90 (comfortably settled into gradual decline) and just plot oil production and GOR, the two curves will run parallel for X number of months. Then, in a month, the GOR moves up briskly while the oil production curve falls just as dramatically. Applying armchair gas physics, you are looking at the bubble point, and oil production driven by solution gas is almost at an end. This is called by a variety of equally ominous terms: accelerated decline, terminal decline, end of life. Said well can limp along producing 25-50 barrels a day for quite a few months, but the big money is done.
If a person were so inclined, he or she could generate a whole family of curves for a county. That’s where we are in Howard County illustrated above. Enough wells have reached the bubble point to paint a composite picture of decline.
Parenthetically, I believe such a graph is true for every single shale oil well ever produced. It’s the gas physics speaking from a well-contained single-hole reservoir. And if you produce frack crosstalk or fugitive bench-to-bench fractures, you usually shorten the time to bubble point (except for the rare “halo” effect).
One other point, with time past the bubble point, the monthly gas production will eventually fall, but by that time the oil production has fallen by a corresponding amount, so the GOR will continue to splay out from the oil curve. These curves are being drawn by hundreds of thousands of shale oil wells.
Permian Basin Average 2015 and Average 2018 wells normalized for lateral length GOR vs cumulative output per 10 thousand feet of lateral.
Russian Crude Oil Exports Continue To Plunge Bold theirs.
Russia’s crude oil exports by sea continued to slump last week.
Russia’s crude shipments plunged by 311,000 bpd to 2.73 million bpd in the week to July 23.
Russia’s crude oil exports by sea continued to slump last week and are now well below the February levels and nearly 1.5 million barrels per day (bpd) lower than the recent peak at the end of April, tanker-tracking data monitored by Bloomberg showed on Tuesday.
Russia’s crude shipments plunged by 311,000 bpd to 2.73 million bpd in the week to July 23, as exports out of the Western ports on the Baltic Sea and the Black Sea crashed to 1.17 million bpd, down by 625,000 bpd from the previous week, according to the data reported by Bloomberg’s Julian Lee.
Crude shipments from the Kozmino port in Russia’s Far East, from where the voyage to top customers China and India is much shorter, rose in the week to July 23, but couldn’t offset the plummeting crude export volumes from Novorossiysk on the Black Sea and Primorsk and Ust-Luga on the Baltic Sea.
So in the week to July 23, nationwide Russian crude exports by sea, at 2.73 million bpd, were 1.48 million bpd lower than the peak seen in the final week of April, according to Bloomberg’s data.
Tanker-tracking data have already started to show in recent weeks that Russia’s seaborne crude oil exports were declining from the highs seen in April and May.
Last week, Russian crude oil shipments plunged to a six-month low in the four weeks to July 16.
This week’s data compiled by Bloomberg suggests shipments plummeted further in the following week to July 23.
In early July, Russia said that it would cut its crude oil exports by 500,000 bpd in August in a bid to ensure a balanced market, and the reduction in exports would come from a further 500,000-bpd cut in oil production.
Vessel-monitoring data suggest that Russia has started to reduce supply to the market, which, combined with the Saudi production cut of 1 million bpd in July and August, would tighten market balances.
By Tom Kool for Oilprice.com
Dennis – Re: URR above. Best I can manage is ~2,400 Gb or 2,340 Gb excluding tight oil. I believe the most likely URR to fall at 2,000 Gb plus or minus 10%. Can you point to the exact values that allow you to plot HL of 3,000 Gb? Below are the values I used for 2016 thru 2024:
0.058783587 1288.625
0.057148282 1316.75
0.056508517 1344.93
0.053896184 1373.01
0.052477884 1400.59
0.051168105 1426.67
0.049905352 1452.75
0.048687138 1478.83
0.046508229 1505.11
You may also notice that URR from 2012 USGS data is equal to 2,400 Gb if you include cumulative production of 1,200 Gb plus their F5 estimate (95% actual reserves being lower) of 1,200 Gb. They also provide a mean of 565 Gb, implying 1,765 Gb.
With that, it appears there’s a very low (5%) probability that URR would be greater than 2,400 Gb.
What’s interesting is that if you back out the mistated middle east reserves (almost 400 Gb), your URR of 2,700 Gb drops to ~2,300 Gb…
Kengeo,
742.16 0.030726175349455
765.47 0.0304512068787004
789.50 0.0304434209379239
813.99 0.0300791375783232
838.08 0.0287501102493823
863.11 0.0289989717905777
888.00 0.028023940941725
912.57 0.0269322938088177
937.95 0.0270488642811685
964.46 0.0274931690712702
991.44 0.0272142158292159
1018.34 0.0264081799810003
1045.12 0.0256253480366469
1072.32 0.0253656808403798
1099.03 0.0243090729587277
1126.21 0.0241317614101455
1153.64 0.0237722740635703
1181.64 0.023703116832658
1209.68 0.0231791604640464
1238.40 0.023185631988023
1267.97 0.0233228314623485
1297.57 0.0228117214001823
1327.25 0.0223598643150042
1357.56 0.0223310359604216
1387.57 0.0216286516140875
Data above is cumulative production and annual production divided by cumulative production from 1995 to 2019.
The USGS estimate for conventional oil is 3000 Gb, you are leaving out reserve growth which is a real thing, my model looks at World discovery data from Laherrere and models future discoveries and reserve growth with a model that uses 2800 Gb of discoveries plus reserve growth from 1870 to 2294. The OPEC reserve estimates are not part of my model.
See
https://pubs.usgs.gov/sir/2015/5091/sir20155091.pdf
Along with the 565 Gb of undiscovered resources in the 2012 report you need to add the 665 Gb of reserve growth in the paper linked above (note that this does not include reserve growth in the US.
See also
https://pubs.usgs.gov/fs/2012/3052/fs2012-3052.pdf
For US see
https://www.doi.gov/news/pressreleases/USGS-Releases-US-Oil-and-Gas-Reserve-Growth-Estimates
Reserve growth for US was estimated at 32 Gb in 2012 for conventional resources only.
Output in 2019 was about 30 Gb, cumulative production was about 1388 Gb, 30/1388=0.0216. You might have used Mb/d, you want to convert to Gb/year, so 80 Mb/d is 80*365.25/1000=29.22 Gb per year, then divide the output in Gb for the year by cumulative production for that date.
For the data presented above(1995-2019) the URR is 2857 Gb, if we use 2001 to 2019 data the URR is 3098 Gb. I omit the 2020 to 2022 data because the pandemic and recovery from the pandemic in 2021 and 2022 was an anomoly. If we use all data from 1993 to 2022 the URR is 2786 Gb. I don’t use future data (from 2023 and 2024) to do these estimates.
Kengeo,
The 565 Gb mean estimate is for undiscovered conventional oil resources outside the US. You have to add 2P reserves to cumulative production along with reserve growth. So 1200 Gb cumulative output plus 565 undiscovered conventional resources is 1765 Gb, then add reserve growth of 665 Gb and we get to 2430 Gb of cumulative production, undiscovered conventional oil resources, and reserve growth. At the end of 2012 World conventional reserves were about 1296 Gb, if we subtract 400 Gb to occunt for middle east reserves possibly being inflated we get 896 Gb of 2P reserves, when we add this to the 2430 Gb estimate to include all oil resources we get 3326 Gb for World conventional resources. If we add my guess of 170 Gb for unconventional resources we get 3496 Gb for Total World C plus C URR, very similar to the Laherrere et al 2022 estimate of 3500 Gb.
Dennis –
Best I can tell the data support an estimated URR of ~2 Tb, we’ve produced 1.5 Tb and we have just under 2P of 0.5 Tb. While there may be future discoveries and reserve growth, so far it doesn’t appear they are significant. An additional 1 Tb of growth/discoveries would be welcome as it would buy ~35 years. With that in mind, we need to be finding/growing reserves at ~30 Gb per year, that’s not happening. It’s not clear if you are counting US tight oil in your URR data, but if using >2010 values then you should remove tight oil to see what conventional is doing, taking ~2005-2010 data sets result in URR of ~2.2 Tb…maybe instead of ~800 Gb of discoveries/growth there are only 200 Gb? Once again, I get URR of 2 TB plus/minus 10 percent…either way we have produced ~80% of all oil that’s there for the (easy) taking and a bit of the oil that was not that easy (tight/deepwater)…I’m sure we will squeeze every last drop even if doing so causes the worst climate the earth has seen in millions of years…
This is moment we realize the damn fuel gage is broken and we thought we had half a tank but we’re running on fumes (it’s ironic since half the comments are discussing the “big gas-out”).
You should reevaluate the myriad assumptions you have to support an analysis that there will be a plateau or even future growth.
Kengeo,
The URR for all C plus C using Hubbert Linearization is about 3000 Gb.
Using 2P reserves is silly, the 2PC number is the best estimate for reserves plus contingent resources.
The contingent resources have been discovered and simply have no current plans for development within the next 5 years, as 2P reserves deplete, mor of the contingent resources are developed and become a part of 2P reserves. Also reserves grow over time, so assuming the 2P estimate at the end of 2022 will not increase over time is simply wrong. Also more oil will be discovered.
Laherrere’s estimate for World C plus C URR is 3500 Gb and for conventional oil (excludes extra heavy oil and tight oil) the URR is about 2500 Gb.
See link below for US crude reserves
https://www.eia.gov/dnav/pet/hist/LeafHandler.ashx?n=PET&s=RCRR01NUS_1&f=A
and link below for US annual C plus C output
https://www.eia.gov/dnav/pet/hist/LeafHandler.ashx?n=PET&s=MCRFPUS1&f=A
In 1970 US crude proved reserves were about 39 Gb, 2P reserves were about 66 Gb.
From 1971 to 2021 the US produced 143 Gb of C plus C and at the end of 2021 2P reserves were about 70 Gb. If there had been no increase in 2P reserves after 1970, the US would have been able to produce no more than 66 Gb and current 2P reserves would be zero. What actually happened is that cumulative 2P reserves increased by 143 Gb plus 4 Gb or 147 Gb in total.
It is utter nonsense to think that World cumulative C plus C production plus current World 2P C plus C reserves will be equal to World C plus C URR.
Conventional C plus C alone will have a URR of about 2520 Gb and unconventional oil URR will be at least 170 Gb, for a total World C plus C URR of about 2700 Gb, at minimum. If the transition to electric transport is slow, the URR may be higher in line with Hubbert models (3000 to 3500 Gb).
Can you point to the 5 year average reserve growth and discoveries then? Is it in line with a URR of 2.5-3.0 Tb? I get the impression that at best it is only about 5-10 Gb each year. That means that next 20 years would only provide an additional 0.2 Tb meaning a URR of 2.2 Tb, maybe you see the data differently? I see no reason to look at 1970s and think that 2020s would see similar level of reserve growth and discovery…that seems silly.
Dennis – My review shows world reserves have been shrinking 5% annually for at least past 5-10 years. 1P in 2016 was 381 Gb, 2023 it’s 285 Gb. For 2P, 2016 was 655 Gb, now it’s 505 Gb. For 2P, about 140 Gb were produced during that timeframe meaning that there should be 515 Gb 2P leftover. This implies 2P shrank by 2%, maybe oil price or tech plays into the equation…regardless something doesn’t seem right…
Kengeo,
Let’s assume as you do that 2016 2P reserves were 655 Gb and further that there is never any addition to these reserves from contingent resources. From the end of 2016 to the end of 2022 there were 175 Gb of C plus C produced in the World, so we would expect, if your analysis is correct, that at the end of 2022 2P reserves would be 480 Gb.
For the World we don’t have very good reserve data, difficult to find your 2016 estimate.
Laherrere has World 2P at about 1100 Gb in 1985 and cumulative production was about 524 Gb. By your account URR= cumulative production plus 2P reserves so in 1985 this would suggest a URR of 1624 Gb. At the end of 2022 cumulative production was 1473 Gb, which suggests 2P reserves of 150 Gb, if the URR estimate from 1985 were correct, the 1985 estimate was too low by at least 350 Gb (if your method is correct, which it is not). Using 2020 data for 2P reserves from Laherrere (700 Gb) and cumulative production (1415 Gb) in 2020, cumulative production plus 2 P reserves were 2115 Gb in 2020. Where did the increase in reserves come from? A combination of discoveries, development of contingent resources and reserve growth equal to about 490 Gb from 1985 to 2020. I do not assume the increases in reserves will continue at the same rate as before, likewise in the absence of any evidence I do not expect there will be no increases in the future. In fact there are at least 700 Gb of contingent resources that have already been discovered, possibly as much as 1500 Gb of contingent resources, future reserve growth and new field discoveries.
See https://www.sciencedirect.com/science/article/pii/S2666049022000524?via=ihub
Figure 5 in Section 4.4 of paper linked above has the chart with 2 P reserves.
The numbers are directly from Rystad…not sure why you increased the interval to almost 40 years…these are just estimates, everyone understands they can change yearly for at least 3 reasons, technical, economic, discoveries. The data is trending opposite as you suggest, so usually that’s a red flag for assuming growth of 700 plus Gb. It’s clear you turn a blind eye when data don’t support your argument, that’s too bad as you are doing yourself a disservice.
Kengeo,
I think Jean Laherrere likely knows much more than you or me. His estimate is 2500 Gb for conventional URR and 3500 Gb for World C plus C.
Can you explain what a contingent resource is? Try
https://en.wikipedia.org/wiki/Oil_and_gas_reserves_and_resource_quantification#Resources
The Rystad 2PC estimate is 1283 Gb, this includes the 780 Gb of contingent resources which have already been discovered. 2C=2PC-2P=1783-505=778 Gb at the end of 2022 according to Rystad. There a multiple lines of evidence which suggest a 2000 Gb estimate is too low, the contingent resources along with continued reserve growth and discoveries over time will likely lead to a minimum World URR of about 2700 Gb, or perhaps Jean Laherrere’s more optimistic 3500 Gb estimate will be correct. This is the realistic range in my view, 2700 to 3500 Gb for World URR, though my guess is that it will be towards the low end of this range.
Dennis –
Lots of governing bodies on oil classification (USGS, SEC being the oldest – developed in 70s/80s).
Contingent Resources per USGS are essentially “Marginal Reserves” aka Discovered Sub-commercial. These are only 1 step up from “Demonstrated Subeconomic Resources”. Below that there is only Undiscovered Resources.
It’s common sense/knowledge that the “Commercial Best Estimate” is made up of both Proved and Probable reserves (2P). 2P is ~500 Gb, with cumulative production nearing 1,500 Gb. The best estimate available for URR is therefore 2,000 Gb.
World conventional production peaked somewhere around ~1,000 Gb cumulative production give or take 10 percent. URR is then ~2,000 Gb plus or minus 10%.
1P reserves are nearly 300 Gb, so we can say with a high level of technical certainty that URR is at least 1800 Gb (there is still a 10% chance this number is too high). But it’s difficult to estimate a URR beyond 2,000 Gb as those estimates likely contain a large amount of marginal reserves and subeconomic/unrecoverable resources.
Ultimately, we are looking at ~10 year supply of oil, not 50 years…that’s for sure…and I think you realize that is inherently true.
Kengeo,
No conventional oil as defined by Laherrere (exludes tight oil and extra heavy oil), peaked in 2016 at 1273 Gb. aaaaai gave you the most widely used definition of contingent resources, the 2C estimate is the P50 estimate for these resources which have been discovered and are not considered to be commercial in the next 5 years at current prices. A change in the price of oil, natural gas and NGL can change this estimate, as can new technology and technological, commercial and political developments. Over time contingent resources get developed and become a part of 2P reserves, this is the way the oil industry works. It is the reason the US has produced 150 Gb of oil since 1970 while 2P reserves have increased.
I won’t try to explain this any further, I would consider estimates of World URR by Laherrere over time, in 1998 URR=1800 Gb, in 2022 URR=3500 Gb.
Common sense says the looking at only 2P reserves and cumulative production will lead to a severe underestimate of URR.
In fact, in the past even HL has led to underestimates of URR, but now this seems to no longer be the case.
Dennis –
Would you agree with these values for URR estimate of ~2,500 Gb? It sounds like it all comes down to future growth and discovery…
Cumulative 1,500
Proven 270
Probable 215
Growth 150
Discovery 360
Ken geo,
You do understand that the roughly 800 Gb of contingent resources have already been discovered right?
So even if discoveries in the future are zero, all that is needed is for contingent resources to be developed and they will become reserves. It is likely that 2P reserves will grow by about 778 Gb. We are getting closer, but I am including unconventional oil, maybe you aren’t.
Oil companies discovered 12 billion barrels last year
That was boe, i.e. oil and gas, representing only about a fifth of that used. Also last year was the lowest leasing sales on record and this year through June only 2.6 billion boe had been discovered, 42% down from 2022. Guyana and Namibia may not have much left, Suriname, Sierra Leone and Senegal have so far been disappointing. Current trends indicate discoveries are going to tail off to zero in the early 30s, which means there might only be a year’s worth of production yet to be discovered.
George
No it was not.
BOE was 20 billion
Ofshore west Africa has vast number of blocks still to go to auction
https://africa-oilweek.com/articles/qa-the-gambia-looks-to-oil-for-economic-growt
Just one of the countries with oil
https://oilprice.com/Energy/Oil-Prices/Clean-Energy-Investor-OPEC-Breakup-Could-Send-Oil-Down-To-35.html
I post this for two reasons. For most of you it will be a good laugh, for some of you it will lead to continue confirmation bias. Choose your path carefully grasshoppers!
Javier Blas
@JavierBlas
·
12h
And another hash truth:
Total CEO Patrick Pouyanné, asked today about high electricity prices in Europe:
“The world has changed. […] The energy transition has an impact on the energy prices, and there is no way to make the transition in Europe without an even higher price.”
surprise surprise surprise
Want to see extraordinary high prices…attempt no transition to other sources of energy.
Clearly, some people love that idea.
https://oilprice.com/Energy/Crude-Oil/Tightening-Fundamentals-Have-Given-Oil-Prices-Significant-Upside.html
“The analysts have also projected that global inventories will fall by 310mb by end-2023 and another 94mb in the first quarter of 2024 thus keeping oil markets backwardated and pushing oil prices higher. According to the experts, Brent price will remain unchanged at USD 88/bbl for Q3 2024 but will climb to $93/bbl for Q4. Demand will hit an all-time high in August and then set fresh highs in December 2023 and again in February, March, June and August 2024. However, they have forecast that global oil demand will fall to a seasonal low of 99.33mb/d in January 2024, the only month in the current decade when demand is expected to plunge below 100mb/d.”
yippie -ki -ye back in business boys😎
Ron is right to repeat warnings about Russian oil production. There is usually a feed-back loop between government instability and oil production. The Soviet Union collapsed because the peaking of West-Siberian oil production at the time did not allow Russia to export more oil to Eastern Europe which did not have foreign exchange to buy oil on the world market. And then Chernobyl.
4/10/2010
Russia’s oil peak and the German reunification
http://crudeoilpeak.info/russia%E2%80%99s-oil-peak-and-the-german-reunification
I know someone who met Gorbachev personally at a climate change conference. He confirmed he knew about the oil shortages BEFORE the collapse of the SU, as was mentioned in the book quoted in the above post.
Updated graph
http://crudeoilpeak.info/wp-content/uploads/Russia_oil_production_vs_consumption_1965-2022.jpg
Thanks for posting this, Matt. As your charts show, 50% of Russian production comes from Western Siberia and another 10% from the Urals. These fields are in steep decline. What is happening right now in Russia is a combination of sanctions and natural decline. Some people see Russian production recovering to 10 to 11 million barrels per day after sanctions are lifted. Or perhaps producing that much today by ignoring sanctions and shipping to China and India. That is total nonsense. The decline that you will see by the end of 2023 will be permanent. There will be no recovery of the decline in Western Siberia and the Urals.
Write it off. It’s gone.
I read a few months ago one of Russia’s oil officials said they expected 2023 to be the peak year of production for Russia.
And one of the reason for the Russian invasion of the Ukraine to get at its undeveloped oil and gas reserves?
SHALE GAS…. FEAST or FAMINE FOR DUMMES…
EQT just released its Q2 2023 Results, and we shouldn’t be surprised that it lost money. I don’t see this changing in Q3 2023 unless there is some major Geopolitical event as U.S. & European Natgas Inventories continue to be well above 5-year averages.
Indeed… the Natgas Glut continues. This is due to STAGE 2 of the ENERGY CLIFF… Surpluses & Low Prices.
Interestingly, Europe’s natgas Inventories are now even higher at this point, compared to the 2020 pandemic shutdown.
However, as low Natgas prices begins to GUT the Shale Gas Industry, we will likely see a decline in more Gas Rigs. Thus, in time, falling Gas supply and rising demand during the winter will push the world back into STAGE 1: of the ENERGY CLIFF: Shortages & High Prices.
Rinse and Repeat.
steve
Exxon and Chevron Stalk More Shale Deals as Profits Dip — WSJ
11:11 am ET July 28, 2023 (Dow Jones) Print
By Collin Eaton
Exxon Mobil and Chevron collectively banked nearly $14 billion in second-quarter profits Friday, down from last year’s record-breaking levels but adding to their war chests as they eye acquisitions in the oil patch.
Exxon scooped up pipeline operator and oil producer Denbury for $4.9 billion in July and Chevron agreed in May to buy shale driller PDC Energy for $6.3 billion. Both transactions were all-stock, low-premium deals that showed the companies could still make big bets despite a push by Wall Street for austerity.
Exxon CEO Darren Woods said the company is actively on the hunt for acquisition targets that are a good match.
Conditions are ripe for a deal frenzy in the oil patch this year. The shale industry has shifted from the rapid growth it pursued for more than a decade to a mature business underpinned by fiscal restraint and hefty shareholder payouts. The continued run of profitable quarters has helped Exxon and Chevron improve their balance sheets while increasing dividends and buybacks, potentially giving them more leeway with shareholders to pursue deals.
Exxon said it had $29.6 billion in cash at the end of the three-month period, compared with its record high of $32.7 billion at the end of March. The company expects a recent series of cost cuts will add up to $9 billion in savings by the end of this year, compared with spending in 2019. Both companies also showered investors in cash. Exxon spent $8 billion on shareholder distributions via dividends and share buybacks in the quarter; Chevron spent a company record of $7.2 billion.
Woods, Exxon’s CEO, has told investors the company is working on technology that will boost the amount of oil it can wring from a well in the Permian, as it seeks to grow production there to 1 million barrels a day by 2027.
Exxon also recently purchased drilling rights in a lithium-rich part of South Arkansas, seeking to extract the mineral, and has plans to build one of the world’s largest lithium processing facilities nearby, the Journal reported.
On Friday, Woods said Exxon could use skills the company has developed over decades of drilling and refining to produce lithium from brine water, at a lower cost and with a smaller environmental impact than lithium mining.
Valero Energy Tops Q2 Estimates
10:15 am ET July 27, 2023 (Benzinga) Print
Operating income at the Renewable Diesel segment came in at $440 million, higher than $152 million in the prior year, with sales volumes averaging 4.4 million gallons per day (up +2.2 million Y/Y) on volume addition from the startup of the DGD Port Arthur plant in Q4 2022.
The Ethanol segment’s operating income was $127 million (vs. $101 million a year ago), with production volumes averaging 4.4 million gallons per day in Q2.
Adjusted EPS of $5.40 came above the consensus of $5.08.
In Q2, Valero repurchased shares worth $951 million and paid dividends worth $367 million.
Operating cash flow stood at $1.5 billion in Q2 2023. Capital investment was $458 million in Q2 compared to $653 million a year ago.
Valero’s cash and equivalents stood at $5.1 billion at the end-Q2. It held a debt of $9.1 billion as of quarter-end.
Dividend: Last week, the company declared a quarterly cash dividend of $1.02 per share, payable on September 5, 2023, to stockholders of record as on August 3, 2023.
Is OPEC about to collapse?
OPEC: is the end (finally) nigh?
Historically, forecasts of OPEC’s imminent demise have proved well off the mark. However, what the cartel faces now is not just a dispute between members but a permanently inhospitable environment. Keeping the group together as demand declines for good may prove an impossible task.
OPEC energy and oil ministers attending the 8th OPEC International Seminar in Vienna earlier this month were, on the face of things, surprisingly upbeat. The organization’s Secretary-General, Haitham al-Ghais, expressed confidence that new members would be joining in the foreseeable future; he declined to name any of the candidates, although it is known that Ecuador, which quit in 2020, is considering rejoining. He also claimed that OPEC members would account for 40% of the world’s total oil production by 2040–45.
Meanwhile, the cartel collectively stuck to its guns on its above-consensus forecast that demand would increase this year with what is an abnormally high—by historical standards—2.35 million barrels per day (bpd), and it hinted that its forecast for demand growth in 2024 would be around double the International Energy Agency’s (IEA) forecast of 860,000 bpd. Indeed, the only negative note among OPEC member country delegates was concern over what some see as underinvestment in new output.
Yet all is not well, as the following two, in my view related, points should make clear.
Oil demand will not support prices
First, between October and June, the thirteen-member cartel, in conjunction with the 11 non-members that are also in the OPEC+ group, agreed to cut output in three instances, for a total of over 4 million bpd. At the start of last week, Saudi Arabia announced that it would extend through August the voluntary cut of one million bpd it announced in early June; this was quickly followed by Russia’s announcement that it would trim its output too, by 500,000 bpd next month. In principle, at least, this means that total OPEC+ output next month will stand over five million bpd below its output this time last year, i.e. around five percent of total world consumption.
However, the headline consequence of these cuts is that Brent crude sat at $78.47 per barrel when markets closed for the weekend on 7 July, as against $91.80 per barrel immediately before OPEC+ announced its first cut on 5 October (and $107 per barrel a year ago!). As things stand, both Russia and Saudi Arabia could decide not to persist with these latest cuts beyond August. But further extensions currently look, to me, to be much more likely. Besides, the remaining four million bpd reduction is due to remain in place until 2024 in any case.
The above is only about one-third of this article. A lot or really interesting stuff is in the rest. I had no idea that OPEC was having that much trouble. But I should have, noticing that the UAE, and others have declared that they will cut no more.
More about a potential OPEC Collapse. Again, the below is only about half the article, which also contains a link to a 5 minute video explaining why this may happen.
Portfolio manager says OPEC+ alliance could break — sending oil prices down to $35 a barrel
An influential oil producers’ alliance could collapse if unity dissolves around output policy, according to the managing partner of investing group Clean Energy Transition.
Speaking to CNBC’s “Street Signs Europe” on Thursday, Per Lekander said waning oil demand growth and a lack of cooperation may facilitate the demise of OPEC+ — a group of 23 nations that produces roughly 40% of the world’s crude oil.
The breakup of OPEC+, Lekander said, could send oil prices careening to as low as $35 per barrel.
“In a growing market, time is your friend. You just need to wait a bit and things tighten up and improve,” Lekander said. “In a declining market, time is your enemy. You have to keep cutting, keep cutting, keep cutting.”
He added, “The more negative growth [there] is, and the less cooperation you have — and remember the last OPEC decision, it was really the Saudis doing it on their own … so I would say, if my forecast is correct, and I’m very sure it is … it is going to break.”
A spokesperson for OPEC was not immediately available to comment.
OPEC+ has been trimming oil production since November. Oil prices, which are down sharply year-to-date, were trading slightly higher on Thursday afternoon.
Brent crude futures with September expiry were up around 0.8% at $83.53 a barrel at around midday London time, while U.S. West Texas Intermediate crude futures
with September delivery rose 1% to trade at $79.56 a barrel. Both contracts are up over 12% so far this month.
“There was a period in the 1990s and the 2000s where supply was so much, they couldn’t jack up the price, but for most of the time, the oil price since 1974 has been artificially too high,” Lekander said.
“If the cartel can’t operate, I would say short-term you go to $35 and mid-term probably $45,” he added.
The OPEC+ group has sought to distance itself from accusations of cartel behavior, saying its policies target global supply inventories, rather than specific fixed prices. Nevertheless, some Middle East nations in the coalition, which heavily depend on fossil fuel revenues, list oil price assumptions and forecasts in their national budget plans.
Ron,
I doubt this happens, but if it does it will be the end of new tight oil wells being completed. It is not clear how the OPEC nations survive with $35/bo as their budgets require about $75/bo prices minimum. I think they figure out a way to hold it together.
Dennis, it is not just OPEC; every oil-producing nation needs more than $35 a barrel to survive. That being said, I think this portfolio manager is simply incorrect. An OPEC collapse would not cause such a collapse in prices. After all, the sudden covid caused drop in demand did not cause such a price collapse.
Nothing happens that suddenly. A drop in demand would cause a corresponding drop in production, just as it did in 2020. If OPEC collapses, production will increase, and prices will drop, causing a slowdown in production, not just among OPEC nations but every other oil-producing nation.
The price of oil has a floor. That is a point where lower prices would cause lower production among enough nations that the price drop would stop. I don’t know what that floor is, but I would guess somewhere around $60 a barrel.
Ron,
I also don’t know what the floor for oil price is, if all OPEC nations decided to fight for market share rather than cooperate we might see oil prices drop, they might settle at 40 to 50 per barrel, but even that price would be the end of tight oil development which requires about $70/bo and $3/MCF natural gas with NGL at about $21/b in order for any profits to be earned, even this price level might not be high enough, but certainly $50/bo would be too low, and probably $60/bo as well unless natural gas and NGL prices were very high.
How many overseas Permian tight oil scenarios exist? How many are politically accessible?
From Wiki under “Tight Oil”
Tight oil formations exist, other than just in the United States, in:
R’Mah Formation in Syria, Sargelu Formation in the northern Persian Gulf region, Athel Formation in Oman, Bazhenov Formation and Achimov Formation of West Siberia in Russia, Arckaringa Basin in Australia, Chicontepec Formation in Mexico,[1] and the Vaca Muerta oil field in Argentina.[7] In June 2013 the U.S. Energy Information Administration published a global inventory of estimated recoverable tight oil and tight gas resources in shale formations, “Technically Recoverable Shale Oil and Shale Gas Resources: An Assessment of 137 Shale Formations in 41 Countries Outside the United States.”
It is not just politics that prevent most of this tight oil from being recovered, it is mostly economics. That is especially true for Russia. If demand drops, as almost everyone expects, then this tight oil will remain forever uneconomical.
CC , shale oil is an entirely US phenomenon because there was an existing legacy non shale infra in place . Bazhenov shale will never come on line . Alexander Opritiv ( Russia based ) enumerated the problems with the developments . Vaca Muerta is working because the Argentina govt promised to buy for $ 70 when price of WTI was $50-60 . Problem , the payment is in worthless Arg Peso’s . The driller takes the FX risk . End of story . Google for the shale debacle in the UK . ” Unsafe at any speed ” –Ralph Nader . ” Loss making at any price ” — coming shortly to a theatre near you .
Hole in head,
At high prices tight oil may work elsewhere, I think the Chinese are working on it.
https://www.reuters.com/world/china/petrochina-taps-shale-oil-ageing-western-china-field-2022-03-29/
The amounts so far are tiny, about 35 kb/d. You may be right that outside of the US, Canada, and Argentina, there may not be any significant tight oil output in the future. I would have said the same of the US in 2008. Canada produced about 335 kb/d of tight oil in 2018, this is not expected to increase much according to Canadian Energy Regulator.
Dennis , are the Chinese immune from the laws of Physics ? Anyway this article is 18 months old so ” irrelevant and immaterial ” as Mr Perry Mason would say or maybe as Mr Shellman would say , you sir are ” gassing out ” . 🙂
Hole in head,
I agree it does not look like much tight oil will be produced in China, that is what I found with a quick search, 35 kb/d is essentially zero. The laws of physics work the same in China as in the US and here we produce about 8500 kb/d, perhaps the Chinese will develop their tight oil resources at some point, or not.
Vaca Muerta will be huge, but very very gradual.
They don’t have the concentrated and well developed infrastructure as does the US,
they are not the reserve currency (cheap credit) like the US,
they manage their national financial situation even more poorly than the US.
Nonetheless, its a massive 50 year story.
Posters here have recently called for the banning of US fossil fuel exports, and for oil rationing.
Its easy to discard these ideas out of hand for various reasons,
including simply the base policy of free market capitalism.
Yet if you are one who really does take oil depletion as a serious problem and likes to think of yourself as being a person who has concerns that extend beyond just a few months,
then it may in fact make sense to take these policy positions seriously.
The longer the country strings along fossil fuel supplies the more stable it will be.
There is a big value in stability, and in conservation of scarce resources
for time beyond our personal time frames and personal interests.
Hickory,
I agree, I just am not sure I see it happening politically in the US. There are many ideas that I think are good policy ideas that are not popular in the US ( such as a national healthcare system or at least government sponsored health insurance for all, along the lines of what is provided to government employees, but opened to all US citizens.)
There is also the very good argument that a ban on crude oil exports was US policy from December 1975 to December 2015 for national security reasons, those reasons remain valid today. We could extend the boundry to North America and include our major trading partners in Mexico and Canada so that the ban is on crude oil exports outside of North America.
True. It would take a catastrophic shortfall of energy to have these policies enacted, like rationing in WW2.
Perhaps we’ll get there, not via geology but via (mis)management unforced errors of global human decision making.
Hickory,
Price acts as a pretty good rationing tool. If there is an energy shortfall prices will rise and less energy will be utilized. An emergency could lead to rationing, but the gas rationing in the 70s was stupid, they should have just let prices rise.
I wasn’t around to experience WW2, so I don’t know what it was like then, except by reading about it and hearing stories from grandparents and parents.
There is a downside to price as the arbiter of scarcity.
The average person could get priced out of a portion, while the wealthiest could [do] squander the resource with little regard.
Hickory,
Goods could be rationed, but this tends to lead to black markets where price decides in any case, these can be dicey, I prefer free markets, they tend to be more efficient at allocating resources.
Those with wealth an/or power will always tend to use more resources than they need, this is not likely to change in my view. Rationing won’t really change that, it will just reduce people’s ability to choose what they think is best for them.
As of Friday the Barnett Shale, where it all started, had no rigs running.
George
The rig count fell to zero in the last week in May.
Rig and Frac Report for week ending July 28.2023
– US rig count was down by 5 to 478, 94 fewer than on November 25, 2022
– Permian down 1: Down 2 in NM and up 1 in Texas
– Texas flat
– NG down 4
US oilfield service providers expect rig count recovery later this year on high prices
HOUSTON, July 27 (Reuters) – Oilfield service providers on Thursday signaled a recovery in rig count, an indicator of future production, later this year, citing an uptick in oil and gas prices.
U.S. shale producers slashed drilling and well completions in the second quarter, cutting demand for equipment and services. However, with U.S. crude prices climbing back to $80 per barrel, service companies are betting on a recovery in demand.
“We believe the industry rig count is near a bottom,” said Andy Hendricks, CEO of Patterson-UTI Energy, adding that the company expects additional rig releases in the next few weeks before drilling activity recovers later in the year.
https://www.reuters.com/markets/commodities/us-oilfield-service-providers-expect-rig-count-recovery-later-this-year-high-2023-07-27/
Frac count was down 6 to 268.
In the above article, a pumper stated that the current frac count is near a low and should recover next year.
“On the pressure pumping side, Hendricks said activity has already reached a trough in July.
While pressure pumping prices for spot work fell about 30% in recent months, it should reverse those losses as activity picks up, Hendricks added.
Nextier Oilfield Solutions (NEX.N) on Wednesday had also forecast a recovery in fracking demand next year, adding that a shortage of equipment could hinder growth in U.S. oil and gas production.”
WTI settled at $80.58 on July 28, 2023.
On June 27, WTI settled at $67.70/b. It has risen just under $13 in one month and shows the effectiveness of Saudi Arabia’s 1 Mb/d production cut that was implemented on July 1.
The June OPEC meting was very tough because Saudi Arabia wanted to make the 1 Mb/d cut. There was opposition from Kuwait and the UAE and possibly others because they were being asked to cover Iran’s unreported/secret exports/production of close to 500 kb/d. To keep OPEC + together, Saudi Arabia decided it was best if they took the hit themselves to prevent further disagreement within OPEC. Clearly it was the right decision. A 10% cut results in a 19.2% increase in revenue.
Ovi,
Saudi’s may get tired of doing this by themselves, they take the hit while everyone else in OPEC benefits. The argument that Iran has secret exports of 500 kb/d is specious. Iran is still taking a hit of 1000 kb/d or more dure to US sanctions, so complaints from UAE, Kuwait or Iraq that they are cutting too much sound kind of silly from this perspective. Saudi Arabia will not stand for this for long, they will eventually say, are you in or out?
Perhaps OPEC will fall apart, if members are not willing to compromise, in a group effort, everyone does not get what they want.
I would think that Russia should not be required to have a production quota for the same reason that Iran and Venezuela don’t have one as they are subject to sanctions at present.
Dennis
There are many articles reporting on how Iran gets around oil sanctions.
Seems they shut off their transponders and do ship to ship transfers mid ocean.
https://www.reuters.com/world/indonesia-seizes-iranian-flagged-tanker-suspected-illegal-transshipment-oil-2023-07-11/
As for Saudi Arabia, I also think that giving a few months rest to some of their fields played a part in their decision to cut 1 Mb/d. Fields that pump 30 to 40% water benefit from a rest.
Ovi,
I imagine the secondary sources can watch ships that leave Iranian ports and it is pretty clear whether the oil tanker ships are filled or empty. Are you suggesting there has been no cut in Iranian output? Let’s say Iranian output was 3250 kb/d in June (adding 500 kb/d extra to reported June output), that remains 650 kb/d less than Iranian capacity before sanctions. Iraq has cut about 400 kb/d of 4500 kb/d capacity, so even with the extra 500 kb/d Iran’s output has been cut by 15%, while Iraq’s output has been cut by about 9%. UAE also has seen about a 9% cut from 12 month capacity.
I doubt the reason for the Saudi cuts is to rest their fields. I think they are trying to boost oil prices, but they will not be willing to go it alone for long imho.
Dennis
My point was, not well expressed, that with oil hovering around $70/b and not showing any tendency to recover towards $80/b, this to me implied that the market was oversupplied, Also the futures market was in contango, which also implied over supply.
I think that Iran was shipping an extra 500 kb/d, your 3,250, and that Saudi Arabia needed to find a way to reduce the oversupply.
The OPEC MOMR is showing June production of 28,200 kb/d. It is also showing demand of 30,100 kb/d in Q3. That is a shortfall gap of 1,900 kb/d. Something is wrong with these numbers since this would indicate that SA didn’t have to do anything with Q3 being undersupplied.
My assumption was that OPEC production is higher than shown in the MOMR and I think it is Iran that is hiding its real production, which secondary sources can’t identify.
Ovi,
I agree the market is oversupplied and OPEC believes this too which is why they are cutting their output.
Quarter 3 data is not out yet, OPEC believes the data they publish, or so I assume. As I showed in the post, the OPEC estimates suggest that World stocks are quite high, if we assume the World had 90 days of supply at the end of 2014Q1 and then carry the OPEC estimates forward, OPEC estimates suggest World stocks at about 98 days of supply at the end of 2023Q2. They are trying to reduce World stock levels by producing less, if their future demand estimates and non-OPEC supply estimates are correct and OPEC follows the quotas as most recently announced through the end of 2024, then by OPEC’s estimate the World stock levels don’t fall to less than 90 days supply until 2024Q3.
OPEC is looking to draw down World Stocks in hopes that oil prices can be solidly maintained above $80/bo.
Dennis
I think the recent price trend in WTI indicates that the Saudi cut is working and they are making more revenue to boot and everybody in OPEC + is 😁😁😁😁😁
Ovi,
The thing is that everybody in OPEC is helped, but the Saudis are making the biggest cuts in percentage terms, eventually the Saudis will say enough. Everyone must contribute equally and maybe even a bit mor than the Saudis to pay them back for th July and August 2023 cuts.
Dennis, from the link I posted a few days ago: OPEC+ alliance could break
“In a growing market, time is your friend. You just need to wait a bit and things tighten up and improve,” Lekander said. “In a declining market, time is your enemy. You have to keep cutting, keep cutting, keep cutting.”
He added, “The more negative growth [there] is, and the less cooperation you have — and remember the last OPEC decision, it was really the Saudis doing it on their own … so I would say, if my forecast is correct, and I’m very sure it is … it is going to break.”
OPEC members have been squabbling among themselves for years, and it’s getting worse. Saudi makes demands on the rest that they don’t like. The plus members have even less reason to follow Saudi’s lead. It is every other member that is saying “enough”, not Saudi.
Ron,
For a catel to work there needs to be compromise, if every nation simply does what it wants, there is no effective cartel. Perhaps we are close to that point, when that point is reached it is a race to the bottom for oil producers and they all lose. Output of World oil was contrlled by the Texas TTC from 1935 to 1970 and by OPEC from 1985 to 2023, with first Texas, and then Saudi Arabia acting as the swing producer. When this ends, it is difficult to predict what happens, but basically oil prices crater and marginal producers (the most expensive oil) stop producing.
One does not “rest” oilfields. That’s a new internet term I never heard of before. To rest an oilfield relying on solution gas for energy, you have to rest them for thousands of years. For mature water floods like those in the KSA, disturbing the frontal movement of oil to the well bore changes fluids wettability, disbursement of oil ahead of water, everything. Ain’t gonna happen.
People must think these KSA dudes are stupid. They are not. A lot of them were educated in petroleum engineering at Tech, A&M and UT. They are very smart, so smart they understand the US tight oil thing better than the US does, I think. They are watching gleefully, I fear.
What they are doing, the KSA, is propping up oil prices so the US will continue to drain itself dry, on debt. In the mean times its saving its natural resources for the future, so it can sell those resources to the US in the future for 3 times what we are exporting our oil for now. They manipulate the market to their benefit, will soon make way more money than they did before voluntary production cuts, just wait. The KSA can actually do that very thing for a long time and they have the full support of other countries in the region with the same long term goals. Its only Americans that can’ think that way, sadly.
Mike
Sometime in 2005, I read the book Twilight in the Desert by Mathew Simmons. In the book he discusses the development of intelligent horizontal Maximum Reservoir Contact wells equipped with automatic water shut off wells. This type of well was designed to counter the ever increasing water cut ratio in Ghawar. These wells had many lateral wells off the mother bore.
In Chapter 7, page 163, Simmons writes “As the worlds thirst for more oil dissipated in 1982, Saudi Aramco quickly throttled back Ghawar’s output to let this great field “rest” (his quotes, not mine) in the hope of bringing the rising water cuts back under control.”
My thought at the time was that by shutting down these wells the water would sink and the oil would rise to re-establish a more even horizontal oil/water interface over a period of 3 to 6 months. The wells would then be restarted, possibly at a lower rate, to slow the movement of water toward the lateral wells.
Ovi,
I also read that. One thing to consider is that Matthew Simmons was an investment banker and Mr. Shellman is an oil man, my guess is that Mr. Shellman may be right, he certainly knows more than me in any case.
Dennis
Yes he was a banker, an oil banker and one who read and studied a lot of SPE papers, then wrote a book and scared the Saudi’s enough to come to Washington and opened up a bit.
The physics, that you and I studied, tells me that Simmons must be right. With the specific gravity of crude oil around 0.8, it makes sense that under static conditions, water would sink and oil would rise.
Subsequent to that quote on page 163, Simmons writes that production did increase again but that the water cut reared its head again.
Clearly resting Ghawar is different than resting LTO wells.
Ovi, Simmons may have been referring to Water Coning…. I am not a Petroleum Engineer, but my understanding is that on vertical wells with an oil/water contact near the perforations, the water sitting below the oil is “passing” the oil near the wellbore due to producing/drawing at too high of a pressure for too long.
See the link below for a very basic primer on it…. note the blue water “coning” higher and pushing the oil out and away from the perforations in the wellbore in the image.
Coning can also occur when gas is drawn down towards the perforations under similar conditions.
By shutting in or resting the well…. sometimes the displaced oil water contact level can stabilize, and a slow restart can allow the well to produce again.
https://glossary.slb.com/en/Terms/w/water_coning.aspx
Ovi,
I just wonder if an investment banker in the oil industry really understands the SPE papers that he reads, maybe Simmons had an engineering or science background.
I stand by the statement the Mr. Shellman knows more than me.
It only make’s sense to rest heavy oil fields, at least I’ve never heard of anything else. In fact long term shut-in on water flood horizontal wells in medium API oil fields can sometimes mess things up. For heavy oil the viscosity and small density difference between the two phases mean that water can be drawn to the producing well bore (called coning) and has to be given plenty of time to settle back so that the producing water cut can be controlled. But I think KSA has enough fields and wells to keep them continually cycle through production and resting, it is part of normal operations to maximise recovery – the resting fields should not be counted as spare, but who knows.
Thanks George.
Ooops, sorry George, didn’t see you beat me to it. Thanks
Oil/Water contacts in porous/permeable (both horizontal and vertical permeability) Arab zones in the KSA do not move uniformly up-structure until high structural wells water completely out. Those formations are not bathtubs that if left alone the oil will float to the top in a few months and “skimming” procedures resumed.
Bottom connate water moves up-structure in very irregular fractal patterns and conning typically leaves interstitial oil stuck in pore spaces. The heavier the oil the more likely it is to become stuck and unmoveable. “Connate” water often has hydraulic characteristics and once conning occurs its near impossible to “fix.”
Besides, most of everything in the KSA is under very mature water flood, which is more or less a process of “rinsing” interstitial oil out of pores. Polymers, surfactants, etc, in the injected water can decrease surface tension between oil and water and increase oil mobility. Wettability is a big thing in mature water floods and generally speaking if one has increased oil conductivity to a well bore, even if OWR’s are only 15-20%, one does not stop to take a breather. I’ve never heard of, worked on, or seen in 60 years, a mature miscible or water flood, like those in Ghawar or much of the other Arab zone fields stopped or shut-in intentionally.
That’s right, water flooding mature conventional oil fields with sometimes thousands of millidarcies of vertical permeability have nothing to do with LTO.
But y’all believe what you want to believe for whatever reason you need. Whatever the KSA says about it’s oil biz can always be banked on, right?
Mike
I feel like I am the meat in a sandwich. I am not an expert.
I am quoting Simmons, “Saudi Aramco quickly throttled back Ghawar’s output to let this great field “rest” (his quotes, not mine) in the hope of bringing the rising water cuts back under control.”
You say, “I’ve never heard of, worked on, or seen in 60 years, a mature miscible or water flood, like those in Ghawar stopped or shut-in intentionally.”
Unfortunately Simmons is not here to defend himself.
The more important thing is that we are having a civilized discussion to try to better understand a complicated phenomena.
I am quite certain Matt Simmons would say, today, that everything is different about the KSA, today, than it was, then. Seventeen years ago. When he wrote his book. You might wish he was here to “defend” himself, Ovi, not I. I would not require it. I respected him; he offered insights into the future that clearly people STILL can’t fully grasp.
Having listened to Simmons speak and meeting him several times I am quite sure he would not consider me “uncivil” for disagreeing with him on operational issues. He would enjoy the banter and, I suspect, would put field knowledge and first hand experience before googling shit on the internet.
A problem, that, around these parts.
Mike
Not clear where the uncivil came from.
The question being addressed in this civil discussion is whether over the last 60 years a mature miscible or water flood, like those in Ghawar was ever stopped or shut-in intentionally.
The attached chart should answer that question.
Ovi,
It may be that Saudi Arabia reduced output because demand for OPEC crude fell rather than resting their fields. During the 80s OPEC was in termoil and many OPEC nations were cheating on their quotas. On a couple of occasions the Saudis increased their output temporarily to get other OPEC members in line, those are the spikes in OPEC output you see in the 1980s. I can remember buying a locking gas cap for my car in college because people were siphoning gasoline from tanks in remote student parking lots. Smaller vehicles with better fuel efficiency gained a lot of traction in the US during this second oil shock and lots of homes switched to natural gas for heat. World demand for oil fell by 16% from July 1979 to June 1982 from 63 Mb/d to 53 Mb/d. World demand did not recover to above 63 Mb/d until December 1995 (more than 15 years later).
Dennis
In that same paragraph, Simmons says, “This badly needed “resting”, (his quotes, not mine) no doubt worked to push back the declines the 1979 Senate staff reported.
Also note Mike says, “I respected him; he offered insights into the future that clearly people STILL can’t fully grasp.”
Also note in the discussion above, there is a difference of opinion between the two oil experts on the benefits/effectiveness of letting an oil field rest.
Maybe Gerry might provide some updated thoughts on “resting”.
Ovi,
It seems to me that both George Kaplan and Mr Shellman agree resting of a mature water flood won’t do much unless the field is a heavy oil field (Mr. Kaplan says this, not sure if Mre Shellman agrees on this point), most of the large onshore Saudi oil fields may be medium weight fields, I think, and they seem to both agree for medium weight oil or lighter, “resting” of the field does not help matters and Mr. Kaplan says it would mess things up.
In short they seem to think Mr. Simmons is wrong on his “resting” theory. That is not to say that there might not have been operational issues which the Saudis worked on while they were producing at a slower rate during the 1983 to1990 period, I wouldn’t know all the details but Simmons discussed many of them. Much of it he may have gotten right, just not everything based on comments by two people who know far more than me.
Clearly Saudi Arabia reduced output, the question is why this choice was made. I would suggest it was because World demand decreased and they did not want oil prices to crash any further.
“Clearly Saudi Arabia reduced output, the question is why this choice was made. I would suggest it was because World demand decreased and they did not want oil prices to crash any further.”
Oil price has not crashed. Otherwise I agree.
Interesting to see ‘soft’ demand when the world is not in recession.
‘Soft demand’ meaning we are not in shortage at the moment.
Dennis
You seem to have missed this part of George’s comment.
“But I think KSA has enough fields and wells to keep them continually cycle through production and resting, it is part of normal operations to maximise recovery – the resting fields should not be counted as spare, but who knows.”
Ovi,
Are most of Saudi fields heavy oil, George’s meaning only is clear if we know the proportion of output of various grades. If most of it is heavy oil, then you are correct that Mr Shellman and Mr Kaplan do not seem to agree, I was thinking the majority of the oil from onshore Saudi fields is medium weight oil with API gravity between 22.3 and 31.1 degrees. I may be wrong about that.
Some info on crude weight at link below
https://www.eia.gov/international/content/analysis/countries_long/Saudi_Arabia/saudi_arabia_background.pdf
Hickory,
I was referring to the decrease in Saudi output from 1981 to 1983. I was wrong about a crash in oil prices, but there was a crash in demand for oil from 1980 to 1982 from 59.6 Mb/d to 53.4 in 1982, this was the World’s response to an oil price increase from about $4/bo in 1973 to $37/bo in 1981(nominal prices), an increase of more than a factor of 9 in 8 years. In real 1981 $ the oil price increased from $8.40/b to $37/b, just a little over a factor of 4, inflation was high during this period due to the oil shock. Prices fell a little from 1981 to 1983 (in 1981 $ to about $27/b), a decrease in price not a crash).
Or maybe dollars have become a little more easier to get as the narrative of soft landing runs and no more US banks have failed. Well no more up until yesterday when another one did.
But regardless money isn’t as tight as it was just a few months ago. Labor market is holding in steady. Banks are lending a bit more. Fear has dissipated somewhat.
As long as nothing breaks oil price has the opportunity to rise a bit. Oil is never going to go to $25 in a straight line.
But the overall macro picture is so bad globally not just here in US or one or two countries. Everywhere. it will go to $25 you just got to let the recession play out.
Dennis – Missing the point here, Saudi Arabia had to cut production anyhow. They can’t sustain production above 9.5-10 for very long. So in theory they only gained from this strategy (9m X 80 = 720m vs 10m X 70 = 700m), technically they are making 15% more than a month ago…more importantly they are producing at a more stable volume. OPEC falling apart sounds like a distraction to take the focus off the bigger issue, World no 1 producer USA just entered terminal decline. Once the shale oil peters out (very quickly), we will find that conventional production is only 3 mb/d…Russia, US, and Saudi Arabia are now locked in a race to the bottom, with each likely to cut 1 mb/d annually.
Using your values above for Hubbert Linearization, from 2017-2019 the result is URR of 2,100 Gb. Using some older data points yields 1,800 Gb. This range better matches existing estimates of 1P (285 Gb, now ~270 Gb) and 2P (505 Gb, now 485 Gb). I do not think we will find 700 Gb more oil anywhere (discoveries or growth).
Kengeo,
On Saudi output, they had centered average 12 month crude only output above 9.5 Mb/d from April 2013 to Jan 2020, just under 7 years.
They have also maintained centered 12 month average output above 10 Mb/d (crude only) for long periods (25 months from May 2015 to May 2017 and then 15 months in 2018 and early 2019).
As I have pointed out before, you are ignoring contigent resources, these resources have already been discovered, as 2P reserves deplete contingent resources will be developed and move to the reserve category, the 2PC category (1283 Gb) plus cumulative production(1473 Gb) best represents a minimum for World URR (2756 Gb), reserves have always grown on average, to think this will suddenly stop is a big leap, which is why URR is likely to be higher than 2756 Gb.
Also Hubbert linearization tends to give low estimates historically, that’s why Campbell and Laherrere came up with 1800 Gb in 1998.
What older data do you mean, be specific? Do you mean if we use data from 1990 to 1997 and ignore data after that? That is a silly way to do an analysis. It would suggest there are only 327 Gb of World C plus C resources remaining. Is that your claim?
I could take data from 1982 to 1993 and get a URR of 1492 Gb for the World, suggesting only 19 Gb of remaining resources, but it is obviously not a good estimate for World URR and I would expect anybody of intelligence to ignore such an estimate.
Using any fewer than 15 years of data is not a credible analysis.
Using 2017 to 2019 the result is a URR of 3184 Gb. If we use 15 years of data from 2008 to 2022 we get a URR of 3031 Gb.
This is not really hard. Copy and past the data into a spreadsheet, do a liner trend on data display the equation of the form y=mx b.
URR=-b/m. Data below from 1993 to 2022, cumulative output and annual production divided by cumulative production:
697.01 0.0315334693564743
719.36 0.0310609261722968
742.16 0.030726175349455
765.47 0.0304512068787004
789.50 0.0304434209379239
813.99 0.0300791375783232
838.08 0.0287501102493823
863.11 0.0289989717905777
888.00 0.028023940941725
912.57 0.0269322938088177
937.95 0.0270488642811685
964.46 0.0274931690712702
991.44 0.0272142158292159
1018.34 0.0264081799810003
1045.12 0.0256253480366469
1072.32 0.0253656808403798
1099.03 0.0243090729587277
1126.21 0.0241317614101455
1153.64 0.0237722740635703
1181.64 0.023703116832658
1209.68 0.0231791604640464
1238.40 0.023185631988023
1267.97 0.0233228314623485
1297.57 0.0228117214001823
1327.25 0.0223598643150042
1357.56 0.0223310359604216
1387.57 0.0216286516140875
1415.34 0.0196214204834936
1443.52 0.0195160595299378
1472.96 0.0199896926985938
Kengeo,
If we use 1985 to 1998 data, we get a URR of 1765 Gb. A Hubbert Model using that URR is shown below and compared with actual World output.
Perhaps this looks like a good model to you? It looks pretty far from the mark to me.
I also wonder about statements such as peak occurs at half of URR, which given that cumulative output at 2018 peak was about 1273 Gb, implies a URR of about 2546 Gb. Why then are you claiming a World C plus C URR of 1800 Gb or 2100 Gb rather than 2546 Gb? Note that you could certainly choose a specific set of years for a Hubbert Linearization to get roughly 2550 Gb. If you then produced a Hubbert model and compared it with actual World output you would find it lacking.
All, Peak in a 1P world (Campbell, vertical wells) is a bell curve. Peak at 2P (horizontal, CO2) is more a run up and a sudden failure. They are not comparable.
CC,
Probably not as we would need to see all wells reach peak at the nearly the same time for the shark fin scenario that many concern themselves with to become a reality. Statistically the odds are infinitesimally small that this would be the case. So I would disagree, unless the law of large numbers is violated.
It has been recently said on this forum that wind and solar will never amount to much.
I suppose for some people that could be categorized as ‘wishful’ thinking.
” As temperatures soared into the triple-digits on Wednesday, renewable energy was providing 30 to 40% of the power the state needed, according to analysis of state data from Texas energy expert Doug Lewin.
And as the state struggled through an early heatwave in June, non-fossil fuel power including renewables and nuclear made up 55% of total generation on June 28 and 29..”
Just imagine if the state was actually trying to produce energy not called oil or gas. It is currently tapping into far less than 1% of the solar energy reserve.
It will become a big electricity exporter, even despite a huge tide of vested and partisan reluctance/disdain.
Hickory
By 2010 we needed to reduce co2 emissions by about 1% per year, instead we are producing more than ever.
https://ourworldindata.org/energy-production-consumption
Wild fires are already raging out of control around the world. Humans are extracting too much water from rivers and ground water leaving vegetation dry and ready to burn.
Global soil erosion is beyond comprehension and every tonne of soil lost deprives the world of a carbon store and food production.
https://www.globalagriculture.org/report-topics/soil-fertility-and-erosion.html#:~:text=Each%20year%2C%20an%20estimated%2024,every%20person%20on%20the%20planet.&text=Soils%20store%20more%20than%204000%20billion%20tonnes%20of%20carbon.
Globally we needed to increase forest cover by 1 million hectares per year since the turn of the century to have any chance of stopping ran away warming.
https://research.wri.org/gfr/latest-analysis-deforestation-trends?utm_source=google&utm_medium=paid-search&utm_campaign=treecoverloss2022&gclid=EAIaIQobChMIgee959u7gAMVDrztCh1CewSfEAAYASAAEgInNvD_BwE
On all counts we are headed for runaway warming.
https://www.proactiveinvestors.com.au/companies/news/1021421/tamboran-resources-mobilises-h-p-rig-to-beetaloo-basin-for-drilling-of-shenandoah-south-1h-well-1021421.html
US Technology in Australia’s Beetaloo Basin
“Their rig brings modern US drilling technology to the Beetaloo Basin, a key first step to achieving material reduction in drilling costs and efficiencies.
“We are excited to be working alongside H&P in delivering their first well in Australia.
This is a great exposition by Gerry Maddoux– the only part left out is the diffusional mechanism that explains the dynamics of the shale oil production profile, i.e. sharp decline and tail. Really the oil is just moving erratically through open channels once fracked and all that’s happening is a cross-section of the flow is captured. In a sense, it’s like someone cracked open a perfume bottle from across the room and all you can capture is the smell as it diffuses around. The mathematical dynamics are EXACTLY as in diffusion. Old oil hands can argue over what’s actually happening underground, but the flows are the same as diffusion would predict it to be.
“Gentlemen, for a cogent explanation of why the shale basins are in trouble, go up and read Mike Shellman’s explanation, which is better than anything I can do. He knows this stuff from the ground up. The only thing I can offer that he can’t is a distinction that I formulated as a working tool for an uneducated brain. So here goes.
Put this in perspective. Shale is not the usual way that oil is exploited. Under normal operating procedures, there is a source rock (usually shale or a carbonate rock), and a reservoir rock (commonly broken up rock called sand). Organic material put under the right temperature and pressure will produce first kerogen (which remains in place) and, as time goes on, mature oil of a gravity and composition that reflects the milieu in which it was made. Mature oil typically migrates from the source rock to some kind of reservoir. And that reservoir is typically formed by a barrier that configures an oil trap. So conventionally, when you drilled for oil, you were headed for a migration zone where conditions construed to collect oil in a trap of some kind.
When most of the conventional oil reservoirs in America had been tapped, and anxiety was building, the concept of attacking the source rock–shale–was proposed. That was oil-in-place, if you will, still hidden within the source rock. To do that you had to fracture the rock to release the oil, which created a little reservoir all its own. That reservoir was tight, and the oil was light, and the whole damn thing was held hostage by gas physics–mainly because the lighter oil is, the more gas it will hold in dissolved form. One-stop shop: source, reservoir.
So yes, oil is produced through solution gas driving the oil to the wellbore. When the solution gas is expended the bubble point is reached and remaining gas within the rock starts escaping into this artificially created tiny reservoir. After the rock gas is expended, it’s over. The bubble point is like the last fart of the day.
This is so very much different from conventional oil dynamics that I can’t begin to make a comparison. In shale, you’re basically taking source rock and converting it to reservoir rock, but because it’s a microcosm, you can’t really release more than is willing to yield to the gas dynamics and oil volume. So when the Top Guns say they’re going to coax each individual reservoir (wellbore) into giving up more oil, I’m on the edge of my chair. How? More fractures? More water and pressure? More pink drilling mud? About the only thing that has pushed out the bubble point has been injection of ethane gas, which is more a diluent to chase out the naphthalenes and asphaltenes than a pressure stimulant, but we’re not talking a massive bang for the buck.
Okay, there you have my best shot at explaining this from a self-taught guy who has loved this stuff since I was knee high to a grasshopper. Picture it. With a conventional migration reservoir you typically have water at the bottom, somewhere, and then oil with a variable amount of gas dissolved in it. On top you have a gas cap. Rock or salt or something forms a barrier. Oil was formed somewhere else and seeped into this place by gravity. It’s a substantial space that has its own rules. With shale, you’re going at the source rock, blasting it to smithereens, converting it for a brief time to a small oil trap subjected to the limits of oil that was released from the source rock and the solution gas that came out with it–a different set of rules. And when that solution gas is gone, that’s the bubble point where gas comes right out of the rock in gaseous form. And that, my friend, is Revelations for that well.
We are in the Book of Revelations.There is a lot of smoke and mirrors. The Denbury acquisition by Exxon was for the 1300 miles of carbon dioxide carrying pipeline–for carbon capture. The PDC acquisition by Chevron was as much for the DJ Basin (Niobrara) as for the Delaware acreage. This thing is going like maize through a goose. I have no idea how much longer it can go, but I do know that with $13M AFE’s and massive charges for transporting New Mexico water back to Texas for injection into disposal wells with pressure limits near the top, a lot of these new wells likely won’t pencil out at these prices.
I will say no more on this matter. I get the idea that these various and sundry explanations are interpreted as coming from vested interests. They’re not. I make a fair share of my income from shale, but that simply means that I have put in the hours to try to understand the physics. For some unknown reason (call it pride, though it’s more likely lunacy), I feel a compulsion to share that knowledge with the lot of you. After all, the title of this place is peak oil and we are doggone close to that in America. At times, after a glass of Whistlepig, I marvel at the audacity of attacking the source rock with the Guns of Navarone. But I am dismayed at the lack of transparency. Why not just say, guys, we had this weird technology, and it worked for two decades, and now it’s drying up? Because it has turned into a frenzy akin to copulating while punching a time clock. It’s the Color of Money.”
Thanks Paul. Just need to find more rock
Paul,
I agree, a very nice explantion by Mr. Maddoux.
Just stop oil . Two videos by Nate Hagens .
https://www.youtube.com/watch?v=H-zYjcsLE_E&t=21s
https://www.youtube.com/watch?v=-585aVUNz68&t=4s
New Paper by Jean Laherrere. Many great charts. He shows WoodMac data with offshore peaking in 2030 at 17 Mboe/d, not Mbo/d. He uses data from several sources, but most of it is from WoodMac.
Offshore oil production Bold mine. And this one bolded line is something I have been screaming about for years.
As I say often: in the world, for football game there are rules, umpires and red cards, but for
oil production there is no rule, no umpire, no red card: most of the oil data is political because
many countries lie on oil data, especially on reserves.
There is no consensus on rules for oil definitions and in particular for water depths
-water depth definition
The definition of deepwater depth varies between 125 m and 500 m:
-Uppsala >500 m
-WoodMac >500 m or 400 m
-IEA >400 m
-GOM BOEM >1000 ft = 305 m
-GOM BOEM 2019 >200 m
-Schlumberger >600 ft = 183 m
-EIA >125 m
-Rystad >125 m
-ASPO >125 m
-deepwater papers
The last paper on deepwater oil production is: Offshore magazine Dec 1, 2022: “Deepwater
production set for steady growth, report finds. Global deepwater production should climb to
17 MMboe/d by 2030, according to Wood Mackenzie” = WoodMac
Great graph inserted here.
WoodMac defines deepwater as >400 m and forecasts deepwater peak in 2030 at 17 Mb/d.
It is not clear if these data are real crude oil production as the unit is Mboe/d and not Mb/d.
I have converted the above graph in digital data (2 significant digits).
Ron Jean’s extrapolation is based on 2013-2020 data. It could well turn down in the future to give a lower URR than 250 Gb. But no matter the peak for Deep Water is close at hand.
Seppo,
I think oil price will be a factor, high prices might delay the peak and low prices might move it to an earlier date. At current oil prices, I agree the peak may be soon, I don’t know what future oil prices will be.
Ron
Attached are two articles on what is happening in Saudi Arabia with regard to onshore and offshore developments.
The first one relates to how a leading Chinese engineering, procurement, construction and installation contractor has landed a key offshore contract from Saudi Aramco for the further expansion of its giant Safaniyah oilfield.
Safaniyah holds 37 billion barrels of oil in place and currently produces 1.3 million bpd of oil, according to Aramco. The expansion plan aims for a significant increase in this output, although Aramco has not said how much. (Next article says how much).
As you are aware, the off shore Safaniyah oil field is the largest in the world and is in very shallow water.
https://ocean-energyresources.com/2023/04/14/chinese-giant-lands-latest-aramco-contract-on-oilfield/
The second article lays out Aramco’s plan to add significant output capacity from 2025 as global spare oil gets thinner.
In a press conference after reporting a record rise in second-quarter profit on Sunday, Nasser said that the rise in output will be limited in 2024, but this will be followed by huge output hikes beginning from 2025.
“We are progressing very well in our increase of capacity from 12 to 13 million barrels per day. This is going to come gradually in 2024 which will be a limited increase. But in 2025, we should go to 12.3 bpd. In 2026, we should go to 12.7 before reaching 13 million barrels per day by 2027,” Nasser responded to an Arab News query.
Aramco’s maximum sustainable production capacity came into light recently as the Kingdom’s Crown Prince Mohammed bin Salman made it clear in his address during the regional summit this month that was attended by US President Joe Biden that the 13 million bpd level will be the highest the country can reach.
Marjan will add 300,000 bpd, while Berri is adding another 250,000 bpd.
Zuluf, with its heavy crude, is contributing another 600,000 bpd, he added.
Safaniya, the world’s largest offshore oil field, is another huge increment that it’s coming up after 2027 with 700,000 bpd, Nasser said.]
Note that in this article, Nasser says Safaniya will add 700 kb/d, after 2027.
I agree some of the earlier numbers may be polical, but I think these two articles do present some real facts. The tricky part is knowing how much of this new capacity is replacing declining output in SA. Assuming that Saudi output is declining at 2%/yr, that is close to 200 kb/d/yr. So five years from now they will have lost 1,000 kb/d of capacity. So maybe they are running to stay in place. A slightly slower version of LTO basins.
https://www.arabnews.com/node/2142426/business-economy
Ovi, I am very familiar with Safaniya, pronounced (Saf-a-nee-ah). I worked in Saudi for almost five years. For two of those years, I worked on a computer project monitoring wells in Safaniya. I can tell you with absolute certainty that there are nowhere near 37 billion barrels of oil left in that field. No, not even close.
Safaniya came online in 1957 and has been drilled like a pincushion ever since. Now they are going to increase production by 700,000 barrels per day? All that crap spouted by Nasser is nonsense. And we are getting the same thing out of Kuwait, UAE, and Iraq. They are all going to increase production massively. I just don’t believe it is going to happen. But something is going on to make them all make these boastful claims. They are all lying. The only question is, just how big are their lies?
One more interesting point about Safaniya. The water, for much of the field, is very shallow and very clear. Flying over it in a helicopter, you can actually see the oil pipelines snaked over the seafloor.
Ron
I knew from earlier posts that you had worked there and noted that in my comment.
What surprised me in the China article was the cost. I would have thought that raising production by 700 kb/d would have cost closer to $1B. Maybe they are just doing a work over or maintenance that tends to restore production somewhat.
Safaniya
Inbox
From Jean Laherrere
dear Ron
you mention Safaniya
my last paper was showing a decline of 4%/a
Thanks Jean, Iwill post it on the blog.
According to this graph, current production, 2023, is close to 300 kb/d. That is a long way from 1.3 Mb/d
Ron,
It looks like we don’t have data after 2010.
Ron
There is something that doesn’t make sense here. According to the chart below, (Taken from the Saudi-Aramco-prospectus-en.pdf), the MSC of Safaniyah is 1.3 Mb/d and the total is 12.0 Mb/d. Assuming Laherrere is correct and that current production is 0.3 Mb/d, that means that the current total MRC for Armco would be 11.0 Mb/d, assuming the other MRC numbers are correct.
Considering that SA has pumped at 11.0 Mb/d twice recently for 1 month, maybe 11.0 Mb/d is correct. Note this does not mean that 11.0 is sustainable for many months, since a number of wells are shut down at various times for maintenance or a work over.
Safaniyah (Taken from the Saudi-Aramco-prospectus-en.pdf)
Note that this prospectus was rejected by the NYSE and that Aramco had to list on the Saudi exchange.
The Company believes that the Safaniyah field is the world’s largest conventional offshore oil field in terms of proved reserves. It is located approximately 260 kilometres north of Dhahran. Most of the field lies offshore in the Arabian Gulf. Within the Concession Area, the Safaniyah field is approximately 50 kilometres long and 15 kilometres wide. A small portion of the field, known as the Khafji field, lies in the offshore partitioned territory as set forth in the agreements between the Kingdom and the State of Kuwait and is jointly operated by AGOC and the national oil company of the State of Kuwait.
As at 31 December 2018G, the MSC at Safaniyah was 1.300 million barrels of crude oil per day and proved reserves were 34.03 billion barrels of oil equivalent for the Concession term, including 33.66 billion barrels of liquids reserves.
Ovi, it was not my chart or my data. That belonged to Jean Laherrere. Saudi has never produced 12 million barrels per day, Not even for a single month. And their production one-month spikes must be understood that they can easily empth their storage tanks and produce at least one million bp/d more for that month. That is what most OPEC nations do when they are prepping for a high quota during a proposed production cut.
I have emailed Jean Laherrere and asked for clarification on those Safaniya production numbers.
Ovi, no one in the oil business pays any attention to those reserve numbers posted by OPEC. They are laughable. And everyone knows that. Their actual reserves are actually less than one-third of those claimed. Since they are wildly exaggerating their reserve numbers, their production numbers should be taken with a grain of salt also.
Second graph from Jean Laherrere
Third graph from Jean Laherrere.
I think it should be abundantly clear that Safaniya is in decline. Any talk about increasing production by 700,000 barrels per day is just blowing smoke.
Would someone please help me understand. I know a little about coning in conventional wells. But these giant, complex reservoirs in Saudi Arabia, that have been water flooded using millions of gallons of seawater each day have to be a very different thing than simply pulling too hard and coning a naturally-occurring water reservoir.
Okay, to totally expose my ignorance, I visualize that seawater is pumped into the very bottom of the oil reservoir for pressure displacement, acting as a driving force. This has been going on for over fifty years. At first, with a very thick layer of oil of medium to light gravity, this seawater injection could be performed without disturbing near wellbore oil flow dynamics.
Naively, there would seem to be a point at which the oil layer in the mudstones becomes so thinned out that no matter how gently they pull, seawater coning would increase almost logarithmically. Because, from what little I understand of fluid mechanics, the shear forces of immiscible seawater would finally break down the oil column and the water cut would increase drastically.
Is this what’s happening? If so, this is a very big deal.
And this concept of resting makes little sense to me. If you have water and oil in a clear container, you can easily see separation of layers with time. However, we’re not talking about a “holding tank” reservoir, but rather oil in a stroma that is, as I read it, exceptionally variable in permeability from one zone to another. It would seem that once coning had broken through the oil layer it would act almost like a geyser, pushing more and more into the near wellbore milieu.
Thanks to anyone who can shed light on this. I suspect whatever difficulties the Ghawar Field is experiencing have to do with a thinning oil layer and a disruptive seawater breakthrough cone that might herald the end. And that their “voluntary cut” might not be voluntary at all.
Gerry
The issue is what happens when a number of wells or fields are shut down and the situation becomes static. Will that uneven oil/water contact change and try to return to a more horizontal condition. Permeability and porosity are two critical factors.
The column of “water” more than likely is an amorphous mixture of water and oil, with water dominating. So locally small volumes would settle out because the specific gravity of the crude is close to 0.8. What happens after these small volumes settle out and are in contact with an adjacent volume. Depending on the permeability and porosity would these small volumes start affecting the volumes above and below it. How long would it take.
If you check the discussion above, there is a difference of opinion on the benefits of letting an oil field rest.
In the attached chart, SA shut down many fields for eight years. Were the output spikes between 1982 and 1991 attempts to restart fields that didn’t fix the water issue and Aramco had to go back in to improve their attempted fix. It seems that production after 1991 was stable at 8 Mb/d.
Bad energy policies have consequences.
European industry is in a doom spiral.
Many energy-intensive industries reduced or ceased
production in 2022:
Aluminum (-12%)
Steel (-10%)
Paper (-6%)
Chemicals (-5%)
Nuclear plant construction globally out to 2030
Which countries are missing from this list? (hint: the Western ones) This is a problem.
Information purposes .
The output data is weekly data from the EIA, that data is garbage, GIGO. Frack spreads include those for oil and natural gas, so that number does not tell us much.
Russia
Russia’s oil firms are setting a record pace in their drilling this year, even as the country has agreed with OPEC+ to make longer production cuts.
Rigs drilled 14.7 thousand kilometers of production wells in Russia from January to June, 6.6% more than planned and 8.6% more than the same period in 2022, according to data seen by Bloomberg.
Behind a paywalk but if they are drilling at this rate with production still in decline then they have peaked.
Graph
The Russian Minister of Energy, back in late 2021, as much as admitted that Russia had peaked. He said they hoped to return to within 200,000 barrels per day of their previous peak. They never made it.
The chart below is from the EIA’s data. The data is through March 2023.
US May Production Essentially Flat
US May production was down by 15 kb/d. Texas was up and NM was down for a flat total.
Check for full report on Wednesday August 2.
Note that the May 2023 output is about 100 kb/d higher than the July STEO estimate for May 2023.
Dennis
I will note that on Wednesday. The other interesting thing is the discrepancy between the weekly data for May. It is about 400 kb/d too low.
Makes one wonder about their data source.
Ovi,
The strange thin is that id the EIA’s documentation it claims L48 and GOM production is based on the STEO, but both the April and May reports had May output at 12.51 Mb/d, it seems unlikely that the Alaska estimate would be that far off (250 kb/d) when the STEO has May 2023 Output in Alaska at only 370 kb/d for both the April and May reports. Sometimes the EIA just seems to take its eye off the ball.
Link below explains methodology for weekly data exceprt is from page 38.
https://www.eia.gov/petroleum/supply/weekly/pdf/appendixb.pdf
EIA estimates weekly domestic crude oil production using a
combination of short-term forecasts and the latest available production
estimates from Alaska. The four data elements contributing to the
estimate are:
• the most recent Short-Term Energy Outlook (STEO)
model estimate (including interim estimates) for average
daily production for the lower 48 States and the Federal
Gulf of Mexico (GOM) (STEO Table 4a: http://www.eia.
gov/forecasts/steo/data.cfm?type=tables);
• daily production volumes delivered from the North
Slope of Alaska to the Trans-Alaska Pipeline System
(TAPS) (reported to EIA by the Alyeska Pipeline Service
Company);
It is a mystery that the weekly data is so bad, because the STEO is usually not all that far off.
OPEC oil output falls on Saudi cut and Nigerian outage, Reuters survey finds
LONDON, July 31 (Reuters) – OPEC oil output has fallen in July after Saudi Arabia made an additional voluntary cut as part of the OPEC producer group’s latest agreement to support the market and an outage curbed Nigerian supply, a Reuters survey found on Monday.
The Organization of the Petroleum Exporting Countries has pumped 27.34 million barrels per day (bpd) this month, the survey found, down 840,000 bpd from June. That’s the lowest since September 2021 according to Reuters surveys.
Increases in Angola and Iraq due to higher exports limited the decline in OPEC output in July, the survey found.
OPEC’s output is still undershooting the targeted amount by almost 1 million bpd partly because Nigeria and Angola lack the capacity to pump as much as their agreed level.
Saudi Arabia lowered output by 860,000 bpd month-on-month, the survey found. Figures from Kpler show crude exports down over 600,000 bpd month-on-month, although another tanker tracker found a smaller export decline.
https://www.reuters.com/markets/commodities/opec-oil-output-falls-saudi-cut-nigerian-outage-reuters-survey-finds-2023-07-31/
ALBERTA OIL SANDS PRODUCTION… PLUMMETS
Alberta oil sands production plummeted in June amid maintenance… or so they say. Typically, maintenance during spring has accounted for about a 5% decline in oil sands production, but this year… 30% or 1 mbd??
Alberta In-Situ Oil Sands Production = -14%
Alberta Mined Oil Sands Production = -48%
Good Grief.
steve
More on Alberta Oil Sands:
Alberta Oil Production Drops to Seven-Month Low
Crude oil production in Alberta, Canada, reached a seven-year low in June due to maintenance at oil sands projects and the exclusion of Suncor’s production data. The Alberta Energy Regulator reported a daily production of 2.71 million barrels in June, representing a 21% decline compared to the previous year and the lowest production level since June 2016. The exclusion of Suncor’s data, one of the largest oil sands operators in Canada, came as a surprise, but no explanation was provided. It’s worth noting that Suncor reported a 34.4% increase in daily output for June compared to May, reaching 293,000 barrels.
Oil sands mines production in Alberta declined by 48% to 712,000 barrels per day in June, while overall oil sands production decreased by 25% to 2.15 million barrels per day. Earlier this year, wildfires in Alberta temporarily disrupted oil production, resulting in a shutdown of over 140,000 barrels per day. However, despite these setbacks, the province’s oil industry is performing well, with Alberta projected to have a budget surplus of around $1.8 billion for the fiscal year, thanks to higher oil prices.
The Canadian oil industry continues to face pressure from environmental activist groups and the federal government’s efforts to transition away from fossil fuels. The Trudeau government’s Just Transition bill aims to re-employ oil industry workers in other sectors as the country seeks to reduce its reliance on oil and gas. Despite these challenges, companies are still producing oil and gas to support provincial and federal budgets.
I thought the wildfires in Canada were still going, perhaps not in Alberta? Unclear from news stories.
This is just temporary drop. I expect that production will begin to rise again by September. Canada is not a declining production country geologically. It could be a declining production country politically.
From the comment above: “The Canadian oil industry continues to face pressure from environmental activist groups and the federal government’s efforts to transition away from fossil fuels”
The Canadian Prime Minister and the Environmental Minister have both stated that the oil sands have to be shut down. The governments 2030 CO2 targets may force the companies to reduce production if the companies CCS plans are not up and running by then.
However we may be in a new environment by 2028 when Peak Oil may be a bigger news item than Climate Change.
Ovi,
I think these are both going to be very big stories, It will be interesting no doubt to watch the twin troubles on this. Certainly people will prioritize their immediate energy and food supply over any distant or longer term issues. So in that sense, yes oil shortage could become the biggest issue at some point. Far from a simple one however.
On Canada, I suspect they will find a path to continue with growing oil production for a long time. It helps to be in a geographic sweet spot where the only climate migrants they have on the border will those from a country that will probably deal with most of their own from within.
In MEG’s conference call, they said they were having supply chain issues that were prolonging the turn-around. Presumably, there are supply chain issues for all the oil sands producers.
The Imminent Peak In Permian Oil: What Does it Mean For Investors? By David Messler Bold Theirs.
The Permian Basin’s oil production is set to hit “Hubbert’s Peak” late next year, indicating a turning point after which the production will start to decline.
Much of the high-quality acreage in the Permian Basin has already been drilled, contributing to the basin’s declining potential and an increasing reliance on less prolific “child” wells.
In this article, I will update the general trends now being observed with daily production out of the Permian basin. In past articles, I’ve discussed the fact that it was clear that the quality of Permian acreage remaining to drill was on the decline. As this basin is the only major oil producer continuing to add barrels of daily output, this has broad implications for supply and prices. In the June 2023 edition of the EIA-914, the monthly forecast on oil and gas output, the Permian is shown with a slight decline for the July/August time period. This is the first time since Feb of 2021 this has occurred during the Snowmageddon of 2021.
Whatever you think about the longevity of this basin, one thing is absolutely undeniable. We are currently extracting nearly 2 bn BOE annually from it. Over the last five years we’ve withdrawn more than 6 bn BOE. Since we began fracking about 15 years ago, we’ve pumped out ~14 bn BOE. We’ve been climbing the hill in Hubbert’s Peak, and soon the descent will begin.
We will also discuss one way to play the information I will present here. In the coming quarters, we believe there will be an increasingly sharp demarcation between winners and losers. Already there are companies exhibiting signs of landing in the former category. Please read on for a top pick in the shale category.
This is only a tiny portion of this article. It is far too long to post all of it. Just click on the blue headline to read it all.
Ron
This article is just a repeat of the Goerhring & Rosenscwajg report. He has also added in that the DPR is showing the Permian rolling over.
From Bloomberg
https://www.bloomberg.com/news/articles/2023-08-01/opec-output-plunges-by-most-since-2020-as-saudis-deepen-cuts
OPEC Output Plunges by Most Since 2020 as Saudis Deepen Cuts
Production tumbles by 900,000 barrels a day in July: survey
Saudis implement extra cut, pushing prices to $85 a barrel
Biggest Inventory Draw
WTI up 80¢ after hours to $82.17/b/
API Report
Crude -15.4mm (-1.3mm exp) – biggest weekly draw on record
Cushing -1.76mm
Gasoline -1.68mm (-1.3mm exp)
Distillates -512k (-100k exp)
There is much more in this article than the draw numbers.
https://www.zerohedge.com/energy/wti-soars-near-ytd-highs-after-api-reports-biggest-weekly-crude-draw-least-40-years
Net exports from Africa and South/Central America:
Currently, since peaking in 2006, combined net exports from these regions has been declining at 7% each year.
The export peak in 2006 was ~9.3 mb/d and currently they are 3.1 mb/d, the 20 year period prior to 2006 they had been growing at 4.5% per year.
Net Exports from Middle East peaked in 2016 at 22.5 mb/d, in 2022 they were only 21.3 mb/d.
Net Exports from CIS peaked in 2019 at 10.3 mb/d, in 2022 they were only 9.4 mb/d.
Compared to 2016 (when exports peaked for these combined regions at ~37.6 mb/d), net exports from these net oil exporters has dropped at a rate of ~2% per year. In 2022, exports were ~33.8 mb/d.
Prior to the peak and decline, net exports for these regions grew at ~3.25% between early 1980s and 2008.
The largest beneficiary of the peak in world oil exports was Asia, where between 1986 and 2019 oil imports grew at 5% annually, from 4.7 mb/d in 1986 to 28.4 mb/d in 2019.
As oil exporting countries continue to lose spare export capacity Asia will likely see it’s share of oil imports decline, most likely at ~5% each year (~1 mb/d).
For the US, oil imports hit a peak in 2005 at ~10 mb/d. A low point was reached in 2020 at 5.3 mb/d and is ~6.5 mb/d in 2023.
It seems we are at a cross-roads, we need either high oil prices or recessions (demand destruction) to rebalance world supplies.
Something tells me we will get both…
Kengeo,
The World oil market has been oversupplied for most of 2020 to 2022, OPEC is cutting output to try to balance the World market. Eventually peak oil supply may be a problem, but currently it is lack of demand at the world level relative to supply that is the problem for oil producers.
If it was oversupplied shouldn’t our spr be at all time highs.
Raul,
Only if th US government decides to refill the SPR.
Wow – such a bold statement considering oil prices last year, and as Raul points out the SPR is at 40 year low. While it’s possible that high prices last year led to a slight oversupply, that came and went, now we are significantly undersupplied (the Saudi Lollipop!)…just take a look at the headlines in past 24 hours:
“Oil prices hit multi-month highs on tightening supply”
“The Commodities Feed: Tight supplies lift oil prices”
Kengeo,
At the World level according to OPEC estimates stock levels are high. That is why they have cut output. Eventually the market will tighten if OPEC continues current output level.
Dennis , world levels ?? BS . What matters is where the stocks are located . Will Beijing sell from it’s SPR to bailout Washington ? There is a reason they are called ” Strategic ” and not clubbed with ” commercial ” .
The SPR will NEVER be replenished . The USG is broke . Anyway first must channel money to the MIC , Rest is secondary . Debt tsunami .
https://www.bloomberg.com/news/articles/2023-06-04/biden-debt-bill-signing-set-to-unleash-tsunami-of-us-debt-sales#xj4y7vzkg
Where do you think I can invest my money at the moment. I can always add solar panels to my Mexican home.
Raul , not investment advice but buy a truckload of tequila and share it with your friends . Maybe they will help you when TSHTF as a token of thanks . 🙂 . Pemex is down to junk and then so is Mexico .
https://www.fitchratings.com/research/corporate-finance/fitch-downgrades-pemex-idrs-to-b-on-rating-watch-negative-14-07-2023
Take home from the above export decline rate is that by 2025 there will be a deficit of >5 mb/d compared with 2022, annual loss of ~1.5 mb/d.
2018 – 37.5 mb/d
2022 – 33.8 mb/d
2025/2026 – ~29 mb/d
The transition to EVs will likely accelerate, we certainly aren’t going to find 5 mb/d of oil exports available on the market…
Also, high oil price and inflation will likely be here to stay…until recession hits.
We’ll be very lucky if world production is >70 mb/d by 2030…
Oil Exploration Grows But Discovered Volumes Fall To New Lows
Spending on conventional oil and gas exploration is rebounding and expected to top $50 billion this year, the highest since 2019, but operators are still waiting for the results they had hoped for. Rystad Energy research shows that despite the rising investments, discovered volumes are falling to new lows.
Our estimates show that in the first half of 2023, explorers found 2.6 billion barrels of oil equivalent (boe), 42% lower than the first half of 2022 total of 4.5 billion boe. Fifty-five discoveries have been made, compared to 80 in the first six months of last year. This means discoveries in 2023 have averaged 47 million boe, lower than the 56 million boe per discovery for the same period in 2022.
Where is the energy space do you get return on investment for new projects with some reasonable degree of certainty?
Below is the link for the original report.
Failed high-impact wells
Our research shows that 31 high-impact wells – designated using our tiering system based on the project’s significance and production potential – are expected to be drilled this year. So far, 13 have been completed, six are ongoing and 12 remain in the pipeline. Only four of the 13 completed wells encountered hydrocarbons, a measly 31% success rate. The results of three wells are not yet disclosed, while the remaining six failed to find any reserves. These failures significantly impact the total discovered resources and greatly contribute to the falling discoveries.
https://www.rystadenergy.com/news/conventional-oil-and-gas-exploration-low-discovered-volumes#
Watching EROEI drop in real time…Not so probable reserves after all.
Expect continued poor performance on the discovery and implementation side.
Long term average annual discoveries are only 25% of annual production. The last time annual production was equal to discoveries was 1983. The last time it was 50% of production was 1991…
This year so far is only ~15% of anticipated production.
US post will be out sometime after 6:00 PM EST.
A new post updating US May Oil production has bee posted.
https://peakoilbarrel.com/us-may-oil-production-little-changed/
A new Open Thread Non-Petroleum has been posted.
https://peakoilbarrel.com/open-thread-non-petroleum-august-2-2023/