By Ovi
All of the Crude plus Condensate (C + C) production data for the US state charts comes from the EIAʼs Petroleum Supply monthly PSM which provides updated information up to May 2023.
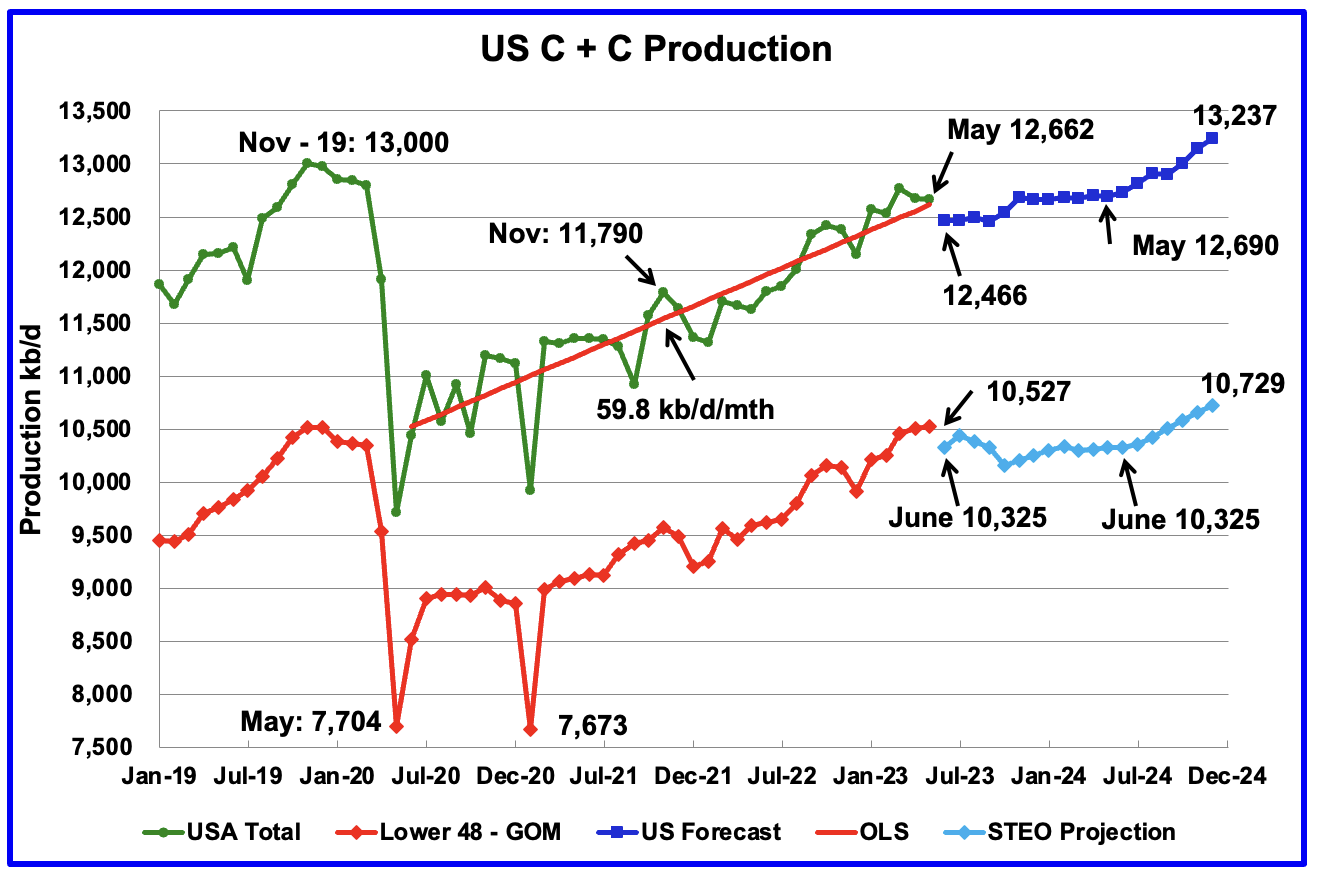
U.S. May oil production decreased by 15 kb/d to 12,662 kb/d, an atypical small change. The small change is primarily due to the upward revision of April output from 12,615 kb/d to 12,677 kb/d, an increase of 62 kb/d.
Most of the states had small production changes except for New Mexico and Texas.
The dark blue graph, taken from the July 2023 STEO, is the forecast for U.S. oil production from June 2023 to December 2024. Output for December 2024 is expected to be 13,237 kb/d which is 237 kb/d higher than the November 2019 peak of 13,000 kb/d. From May 2023 to May 2024, production is forecast to increase by 28 kb/d.
The July STEO forecast for May production was 12,561 kb/d, low by 101 kb/d.
The red OLS line from June 2020 to May 2023 indicates a monthly production growth rate of 59.8 kb/d/mth. Clearly the growth rate going forward into the rest of 2023 and 2024, shown in the dark blue graph, is projected to be lower than the 59.8 kb/d/mth seen in the previous July 2020 to May 2023 period.
While overall US oil production decreased by 15 kb/d, the Onshore L48 had a production increase of 19 kb/d to 10,527 kb/d in May. The light blue graph is the STEO projection for output to December 2024 for the Onshore L48. From June 2023, to June 2024, little change in output is expected.
Oil Production Ranked by State
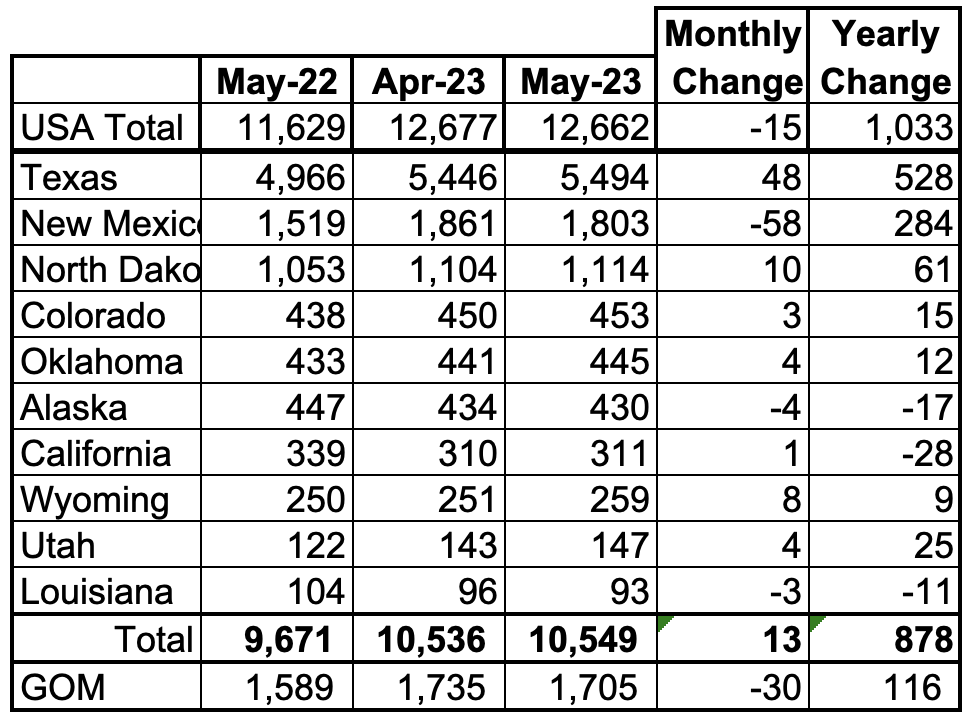
Listed above are the 10 states with the largest US oil production along with the Gulf of Mexico. These 10 states accounted for 83.3% of all U.S. oil production out of a total production of 12,662 kb/d in May 2023. Note that GOM MoM production is down more than overall U.S. production.
New Mexico’s oil production for the second month has passed the GOM’s production.
On a YoY basis, US production increased by 1,033 kb/d with the majority, 812 kb/d coming from Texas and New Mexico.
State Oil Production Charts
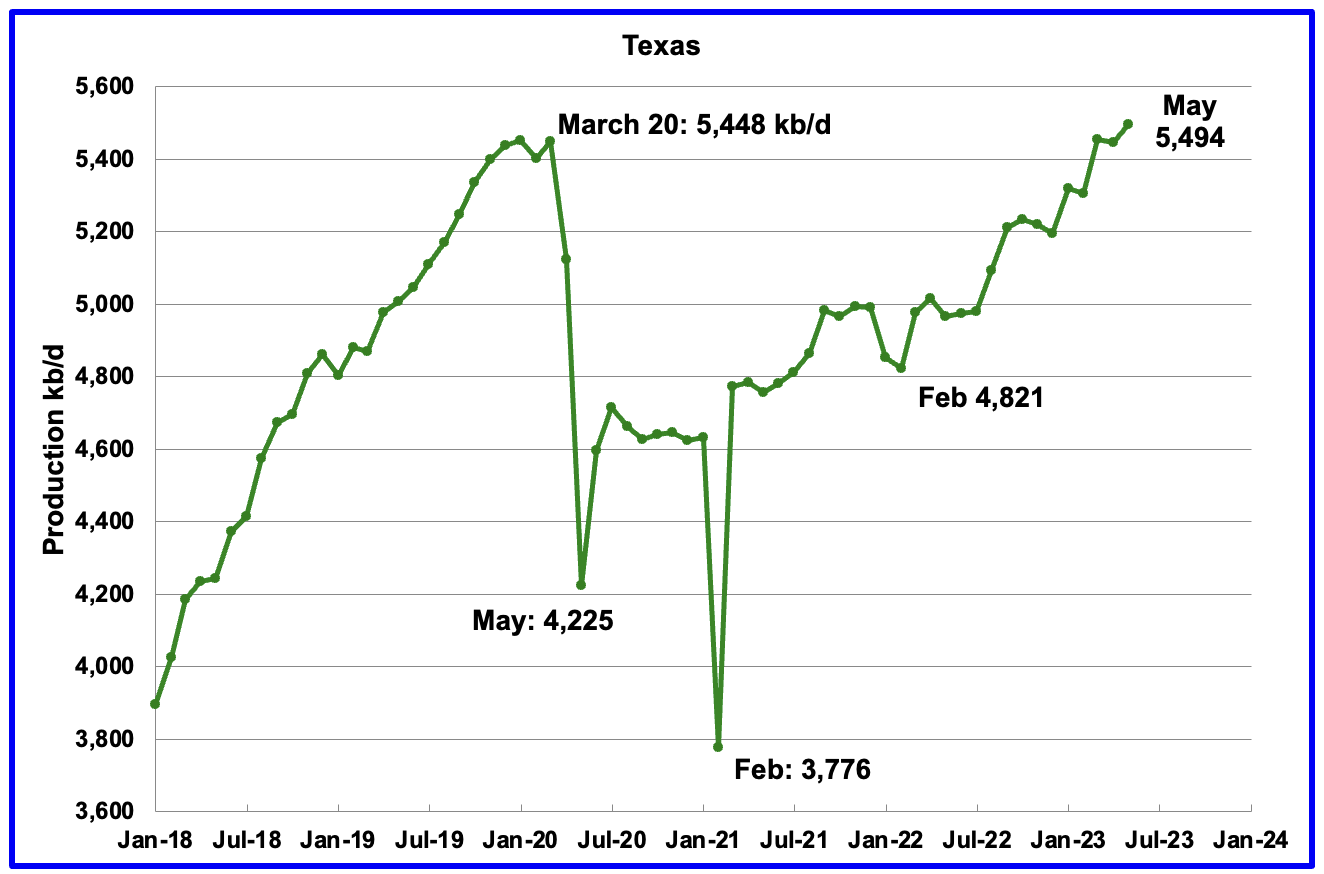
Texas production increased by 48 kb/d in May to 5,494 kb/d. May’s output is 46 kb/d higher than the March 2020 high of 5,448 kb/d.
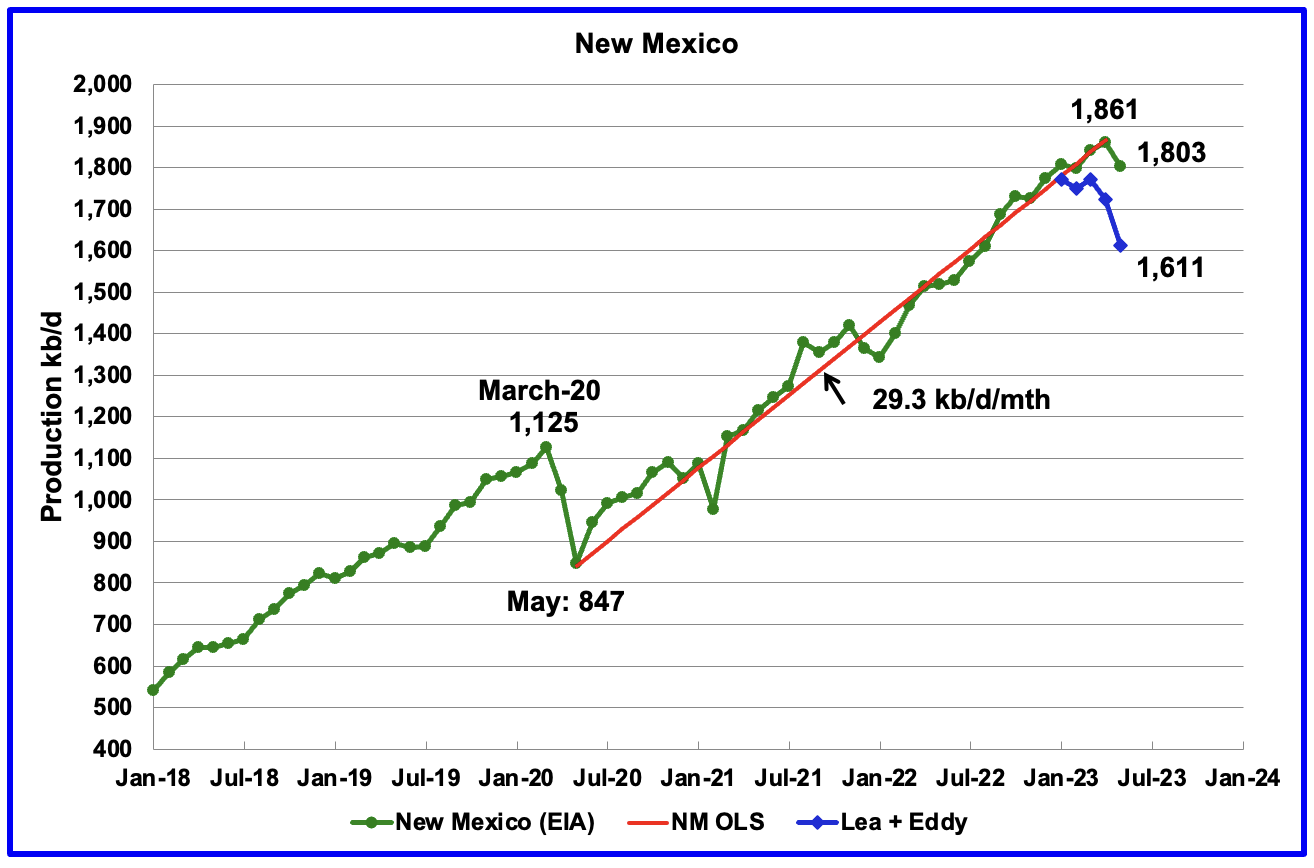
New Mexico’s May production is the first significant decline since January 2022. May’s production decreased by 58 kb/d to 1,803 kb/d.
Of the 1,803 kb/d, 1,611 kb/d came from the Lea and Eddy counties. The Lea and Eddy county production data for May is not complete and will be updated over the next three months. The first blue marker is January’s total production from NM’s Lea and Eddy counties. Their combined output was 1,772 kb/d compared with 1,808 kb/d for all of New Mexico, a difference 36 kb/d.
More production information from these two counties is reviewed in the new Permian section further down.
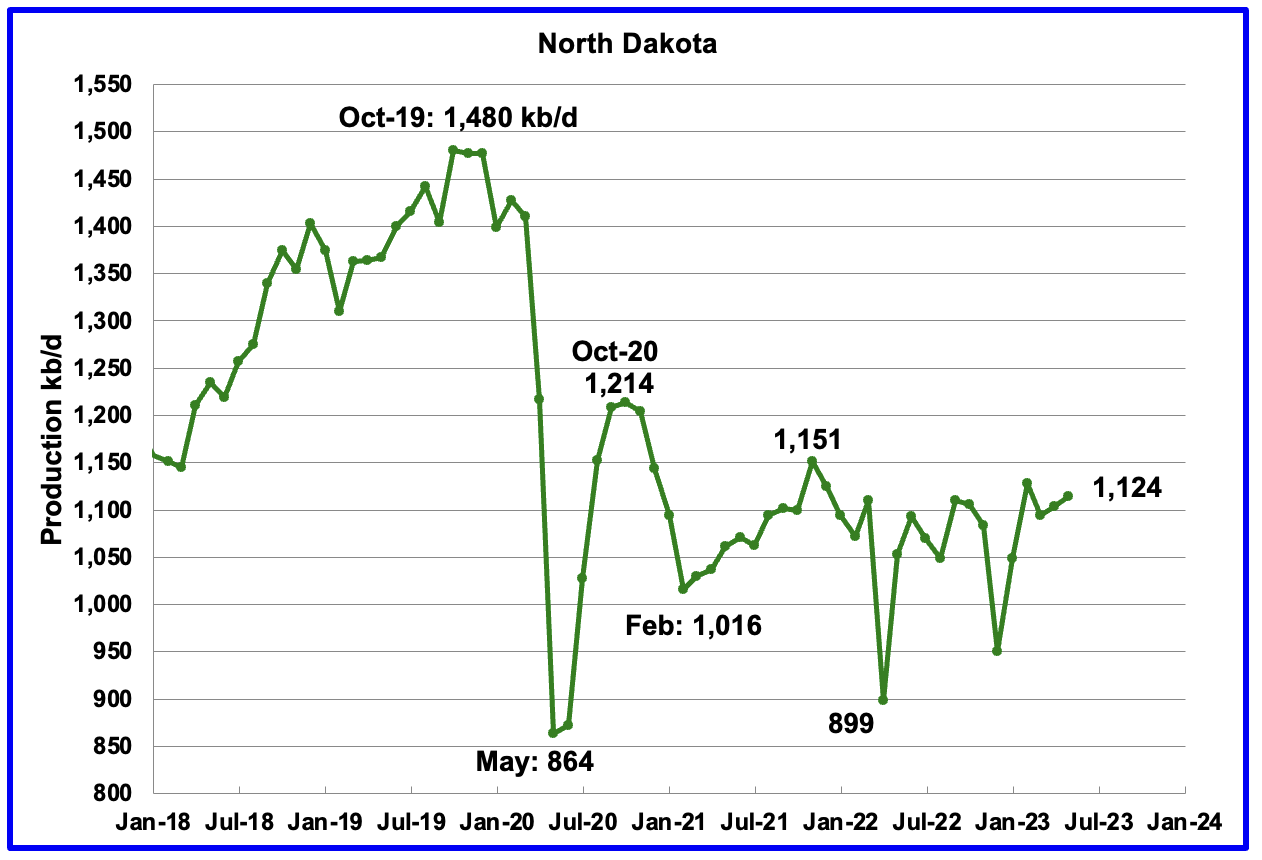
North Dakota’s May oil production has begun to stabilize after being impacted by extreme cold weather in December. However May’s increase was essentially flat. Output increased by 10 kb/d to 1,124 kb/d. Current production is little changed from January’s 2021 production of 1,094 kb/d, a minimal increase of 30 kb/d. Production over the past two years has been on a plateau.
In 2019, ND was averaging 93 b/d from each well. For May 2023, production has fallen to a low of 65 b/d/well.
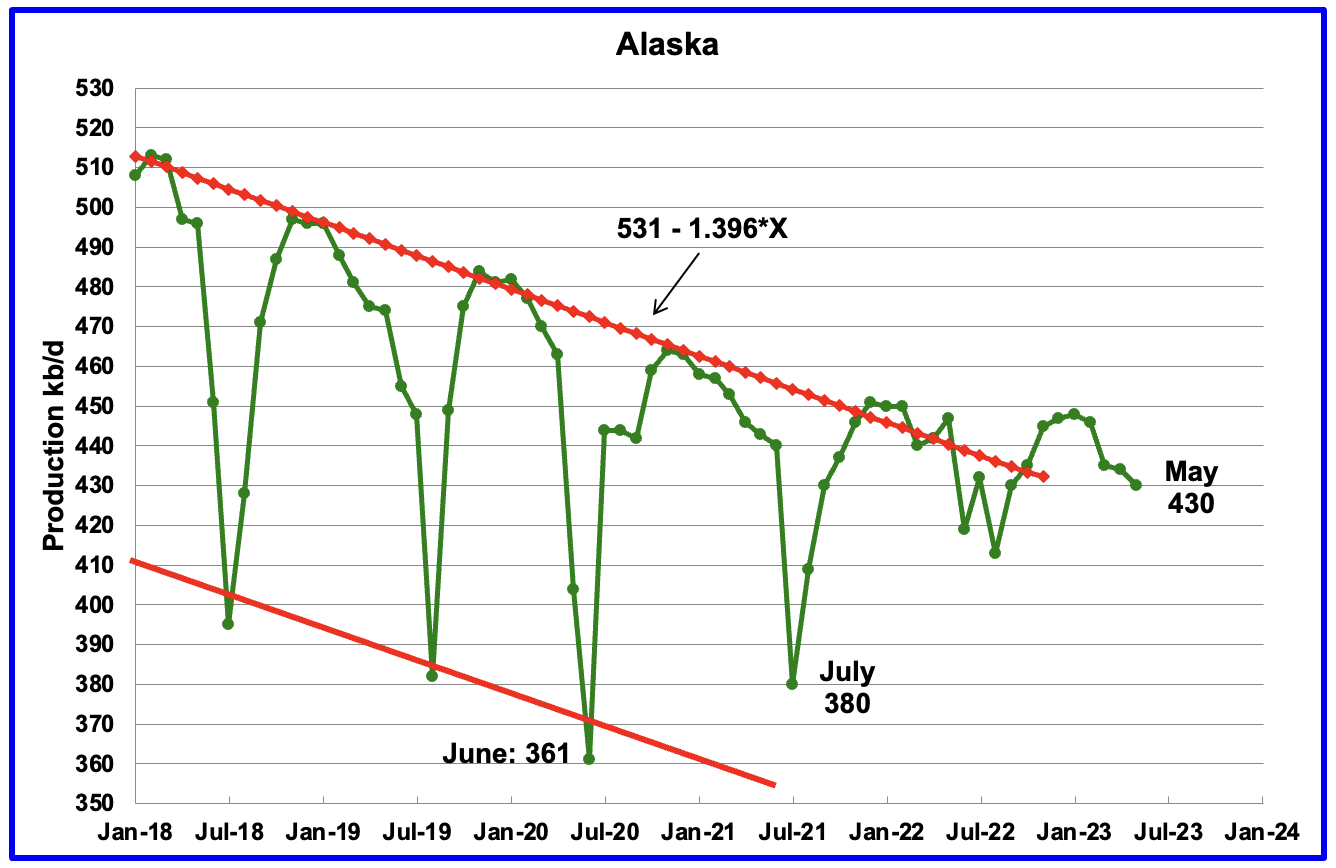
Alaskaʼs May output decreased by 4 kb/d to 430 kb/d. Production in 2023 is deviating from the down trend line of previous years possibly due to the addition of a new oil field. Production YoY is down by 17 kb/d.
Two new projects which were scheduled for 2020 and 2021 which would add 20 kb/d and 40 kb/d respectively according to the Frontiersman, may have been delayed due to Covid.
“A final investment decision in Pikka is expected in late 2020, which means spending for this project will be in the $3.38 billion estimate, but most will come in following years. Pikka will see initial production beginning in 2022 and full production at 120,000 b/d in 2024. Willow’s investment decision will come later, with production beginning in 2025 or 2026, ConocoPhillips has said.” First production at Pikka has been delayed to 2026
“Phase one is now expected to come onstream in 2026 and produce up to 80,000 barrels of oil a day. The project is expected to create more than 2,600 jobs during the construction phase and more than 500 jobs during operation.”
An article in the Alaskabeacon states that increased development spending will add significantly to Alaska’s output in the late 2020s.
“North Slope production is expected to hover around 500,000 barrels a day through 2027 and then rise a bit after then as new fields start up, Alaska Department of Natural Resources officials told the Senate Finance Committee in a hearing Wednesday morning.
That is a far cry from the more than 2 million-barrel-per-day peak achieved in 1988, but there is “good news” in the recent trend to flat production, John Boyle, the commissioner-designee for the department said as the beginning of the hearing.
Stability achieved to date on the North Slope is a major accomplishment “when you consider that these are legacy fields that are pushing 50 years old,” Boyle said. Production has declined steadily since the peak.”
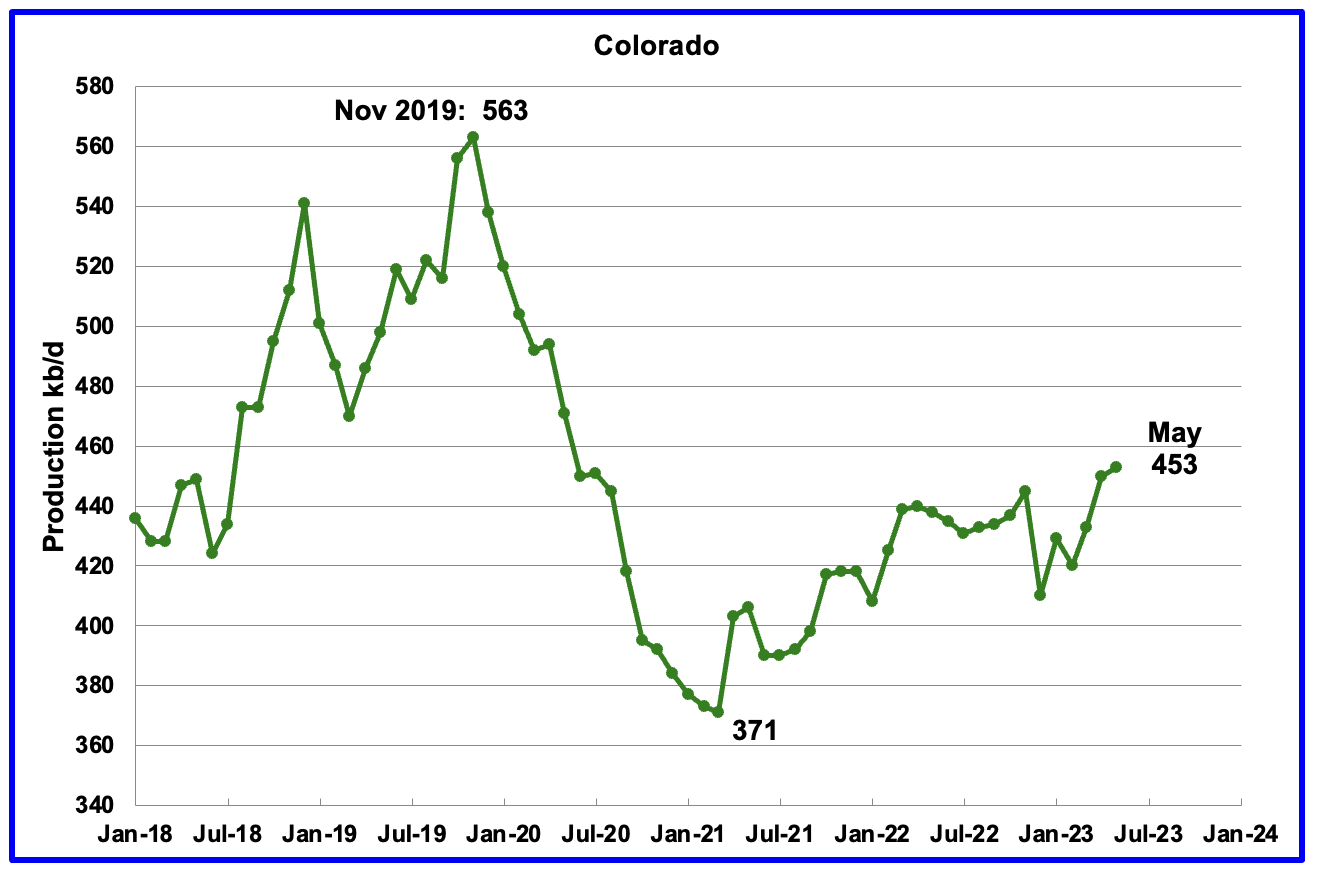
Coloradoʼs May production increased by 3 kb/d to 453 kb/d, a new post pandemic high.
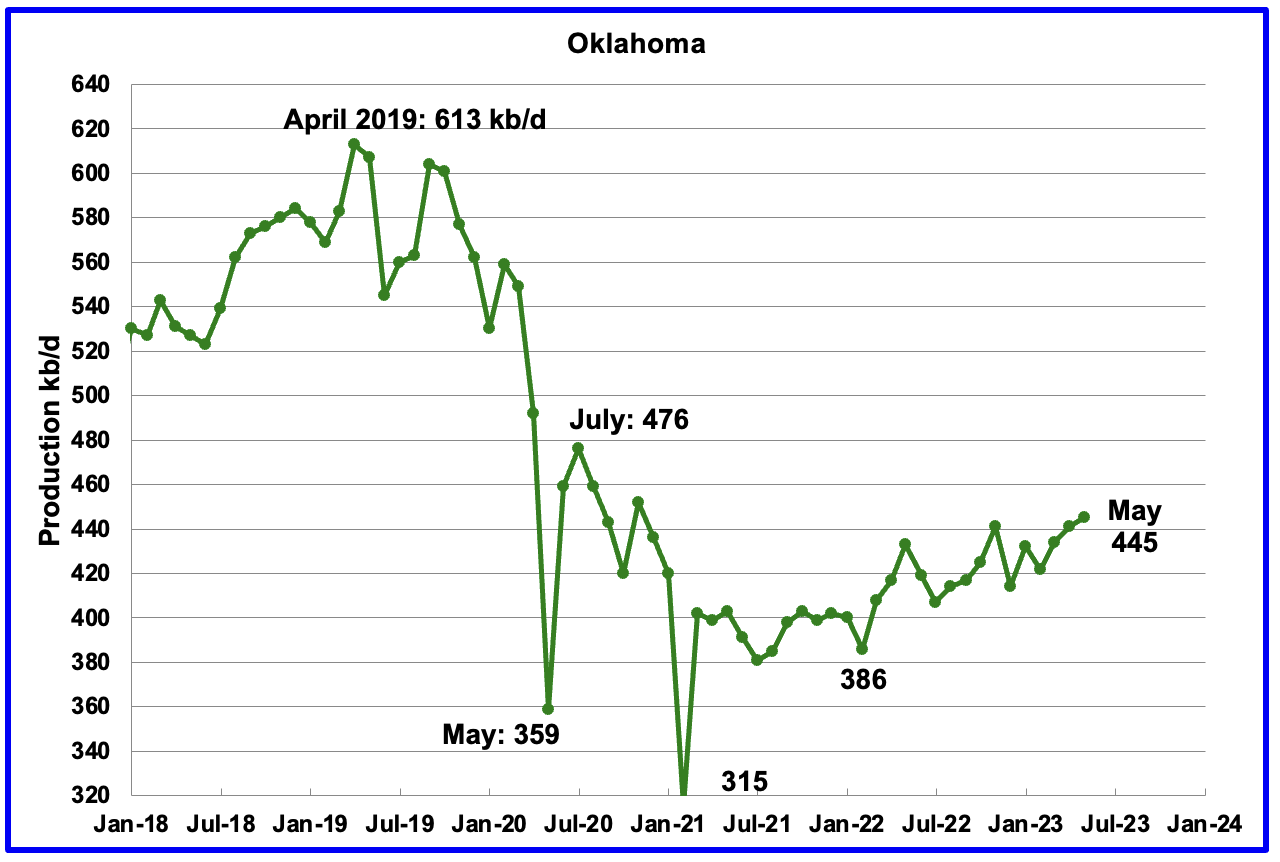
Oklahoma’s output in May rose by 4 kb/d to 445 kb/d. Production remains 31 kb/d below the post pandemic July 2020 high of 476 kb/d.
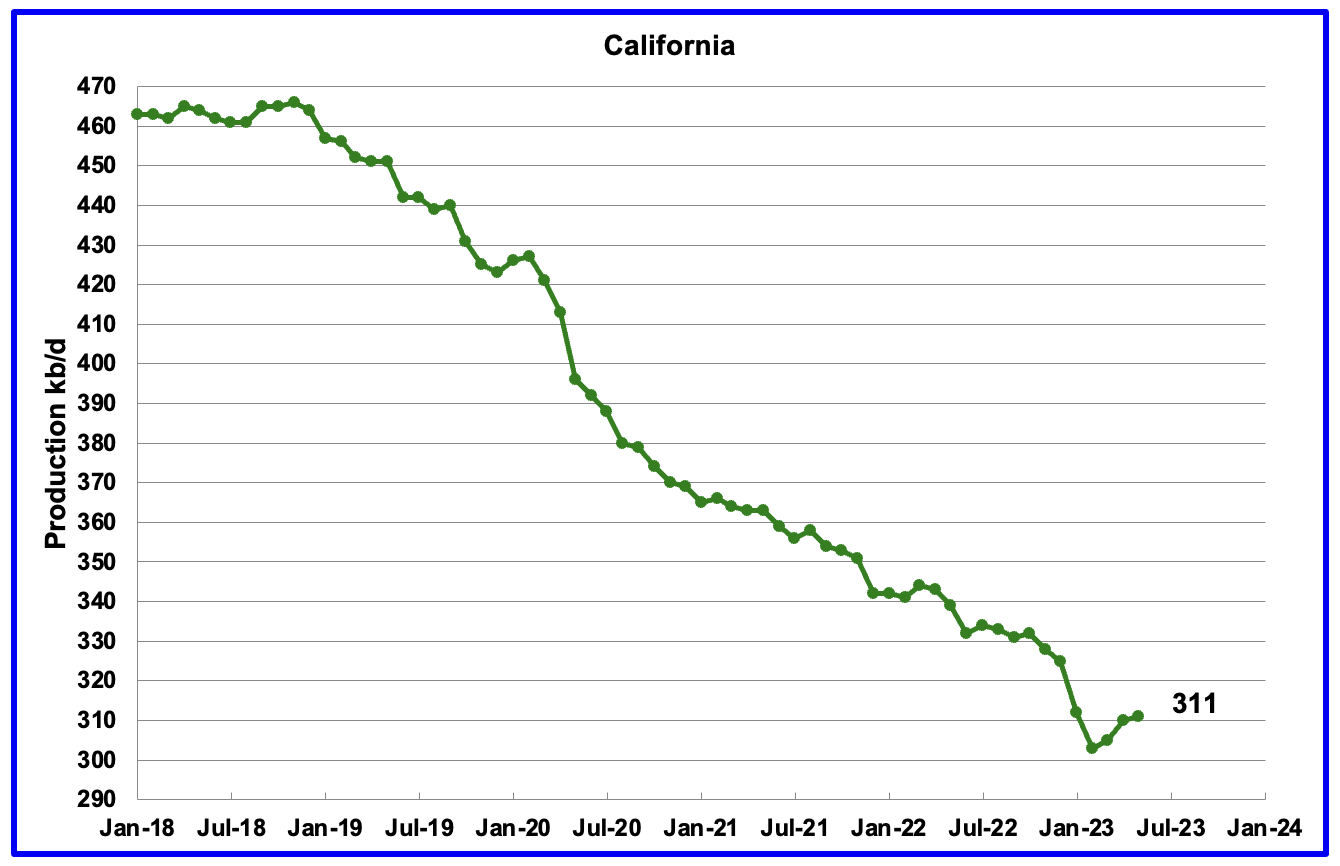
Californiaʼs overall slow output decline trend accelerated in January and February. However for March, April and May production rose. May output increased by 1 kb/d to 311 kb/d.
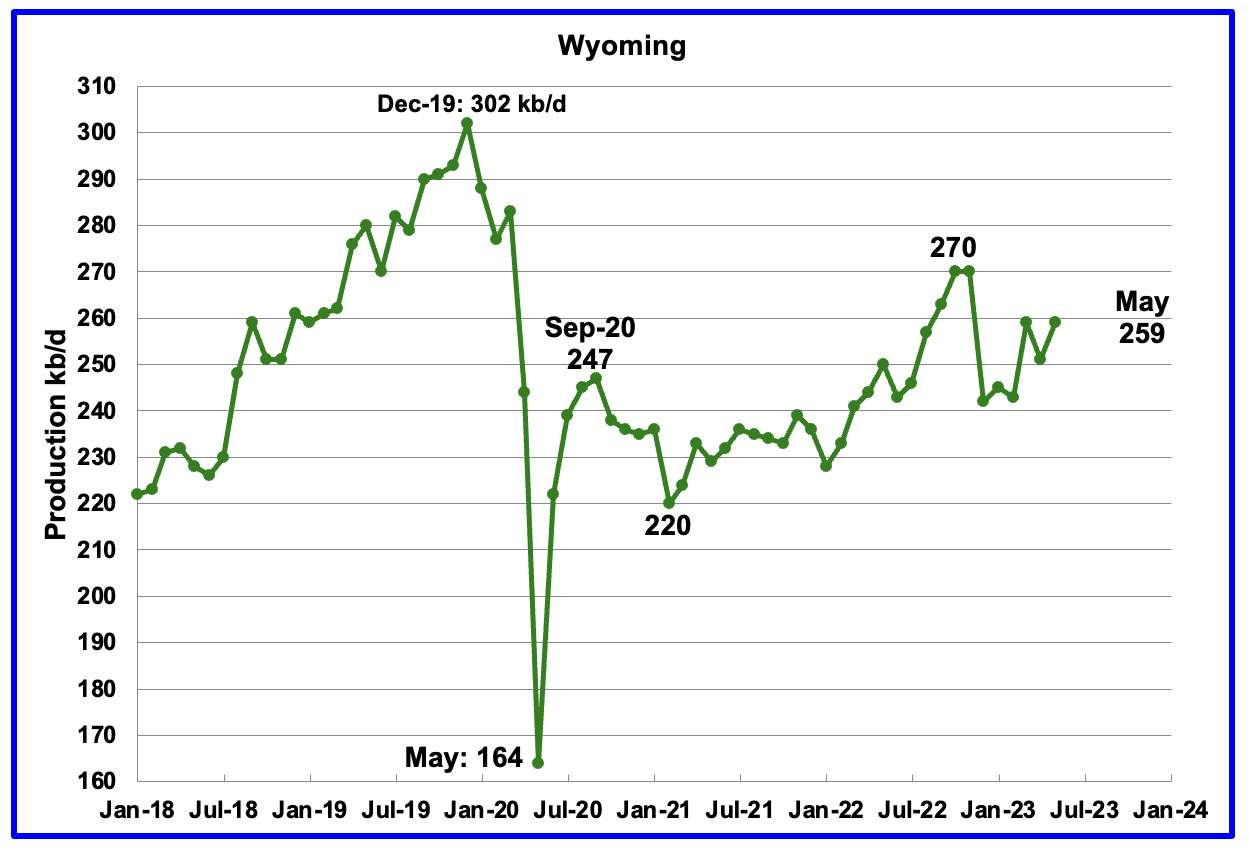
Wyoming’s oil production in October and November 2022 reached a post pandemic high of 270 kb/d. May’s oil production increased by 8 kb/d to 259 kb/d, 11 kb/d lower than November 2022.
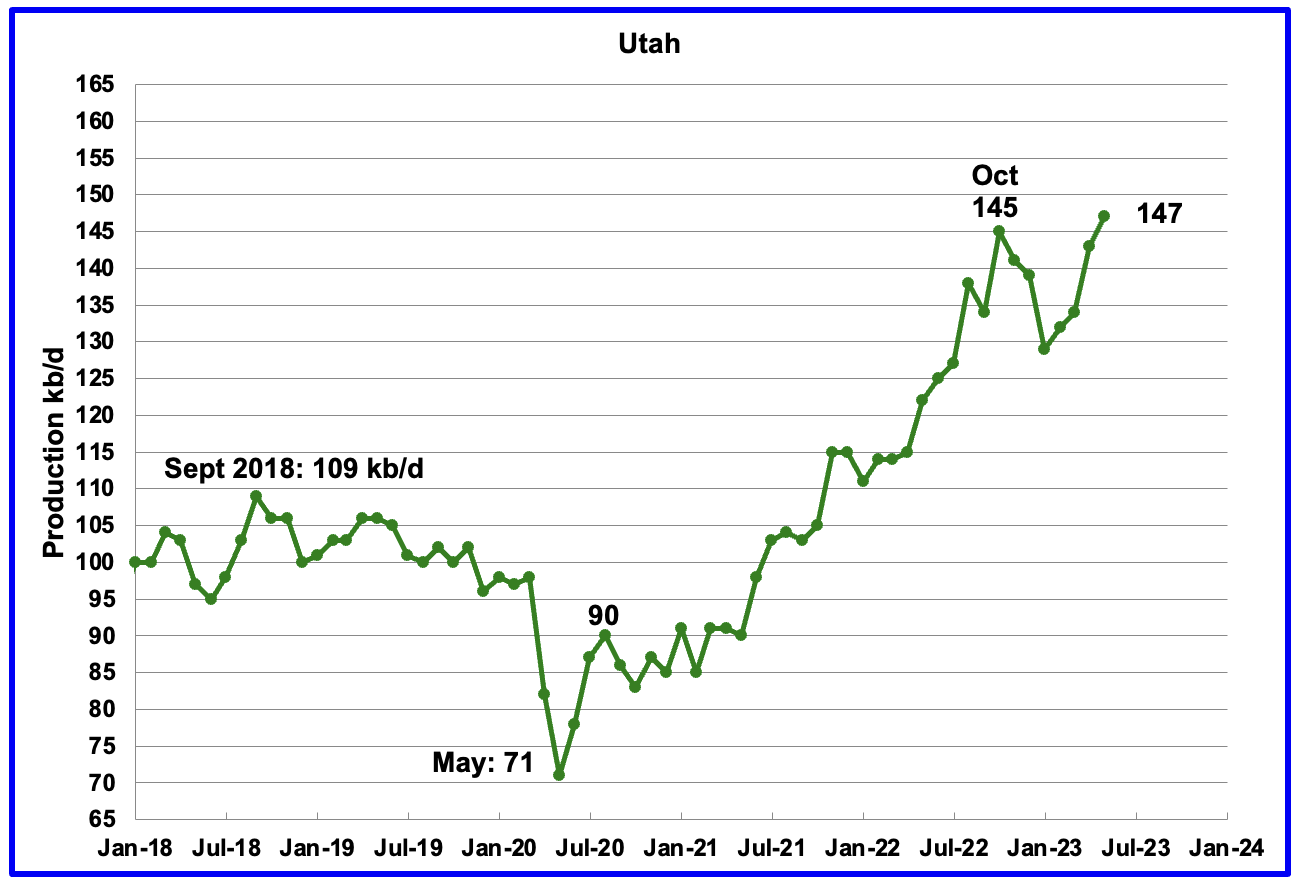
Utah’s oil production reversed its declining trend in February 2023. May’s production reached a new high of 147 kb/d. For the first 4 months of 2023, Utah had 7 rigs operating. Since May the number of operational rigs has bounced between 8 and 9, which may account for the increased production.
The increased production is coming from the Unita basin.
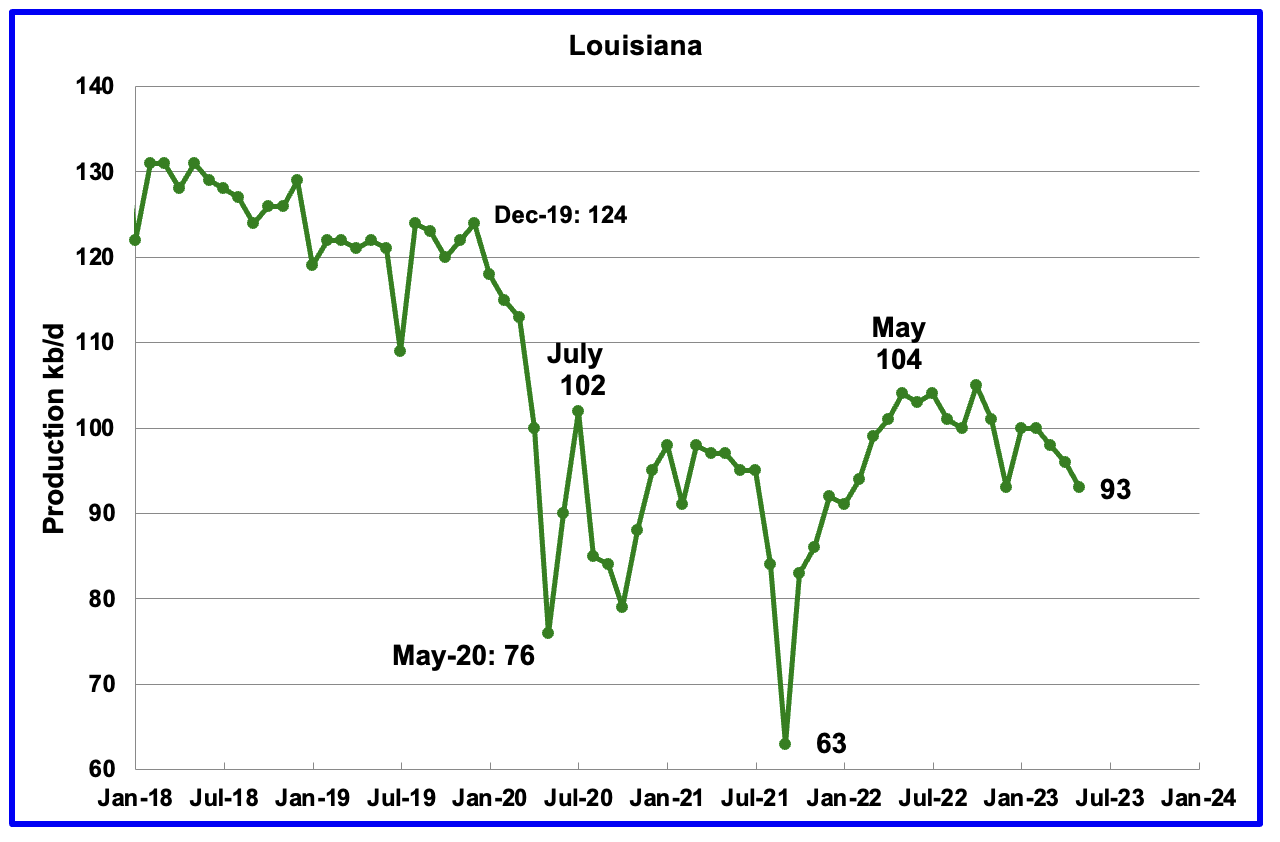
Louisiana’s output rose from the low of 63 kb/d in September 2021 to 104 kb/d in May 2022. Since then output has entered a slow declining phase. May’s production dropped by 3 kb/d to 93 kb/d and is 11 kb/d lower than May 2022.
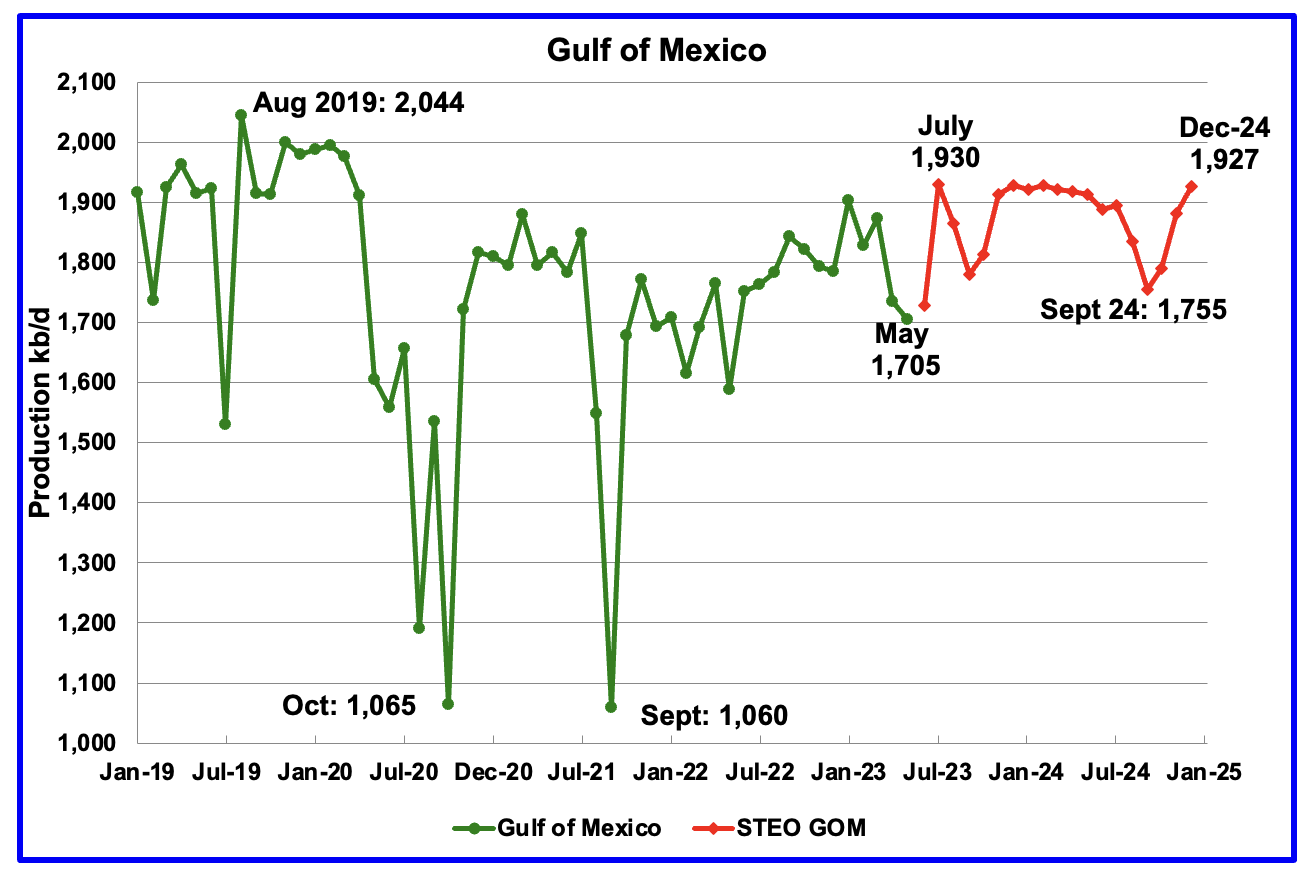
GOM production dropped by 30 kb/d in May to 1,705 kb/d.
The July 2023 STEO projection for the GOM output has been added to this chart and it projects that output in June 2023 will rise to 1,728 kb/d, up by 23 kb/d.
The July spike to 1,930 kb/d could be a reasonable estimate since Shell announced that the Vito platform had begun production on February 15, 2023. However no increase in production has been seen since then. Have there been problems with the Vito startup?
It is not known if the GOM decline shown after July 2023 is related to extensive maintenance.
A Different Perspective on US Oil Production
In this section US production is broken down into two parts, the Big Two, Texas and New Mexico, and the remaining states, The Rest.
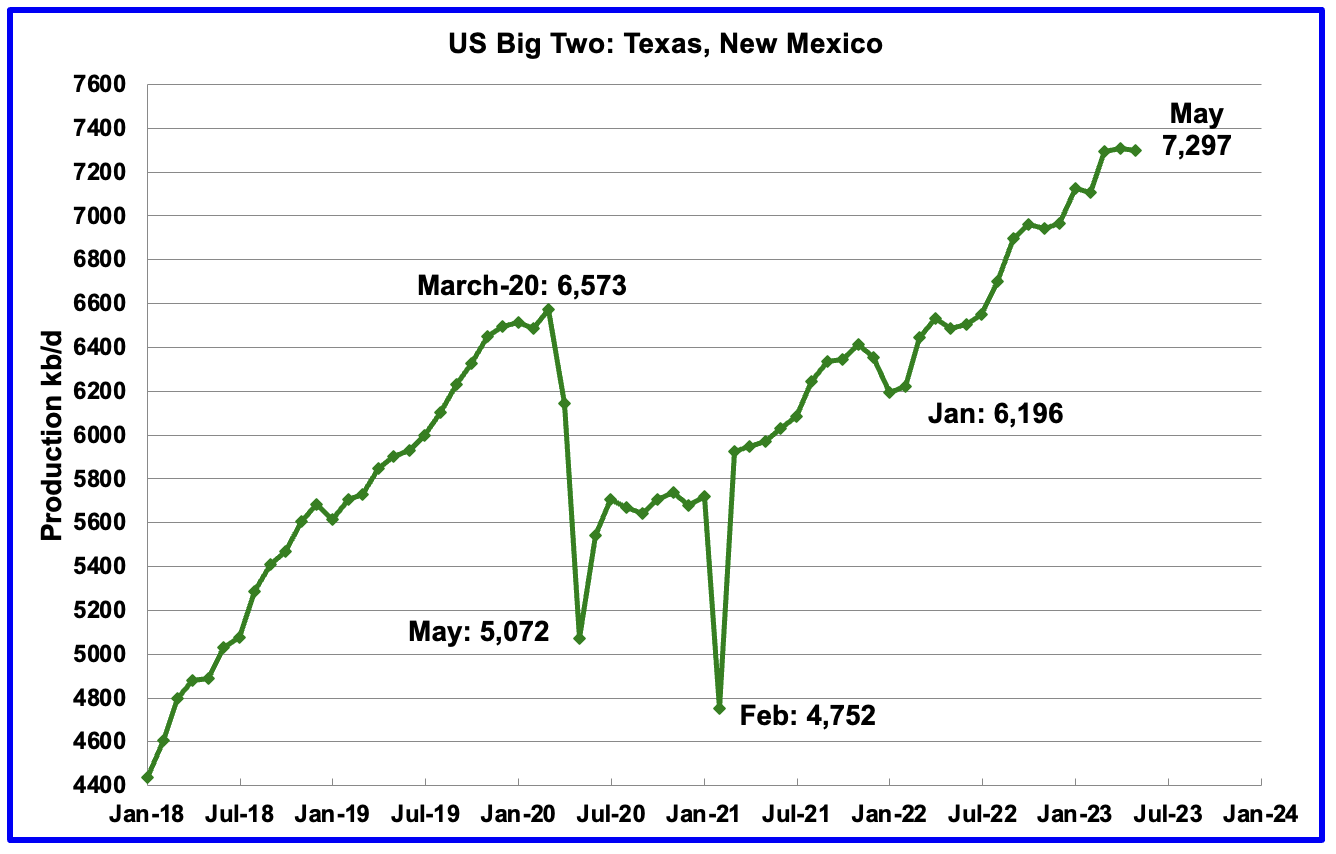
The Big Two states’ combined oil output for Texas and New Mexico.
May’s production in the Big Two states decreased by a combined 10 kb/d to 7,297 kb/d with Texas adding 48 kb/d while New Mexico dropped by 58 kb/d.
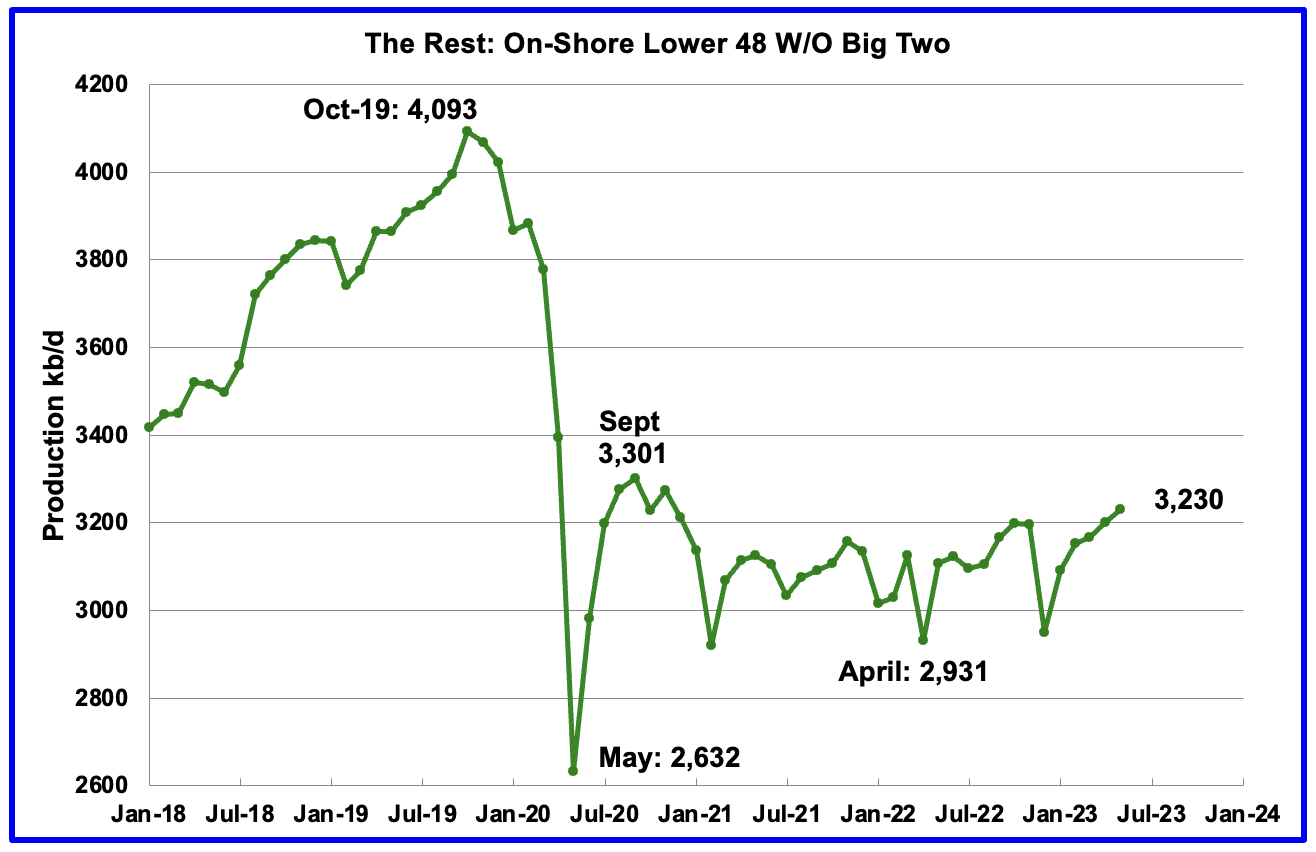
Oil production by The Rest
May’s production in The Rest rose by 29 kb/d to 3,230 kb/d. From May 2021 to April 2023, oil production in The Rest has been range bound between 3,000 kb/d and 3,200 kb/d. However May is the first month in which output broke above 3,200 kb/d primarily due to small YoY increases in Utah, Colorado and Oklahoma.
The main takeaway from The Rest chart is that current production is 863 kb/d below the high of October 2019. The question that needs answering is “Is this a permanent loss that will never be recovered?” All indications continue to be that this is a permanent loss.
Weekly Rig and Frac Spread Count
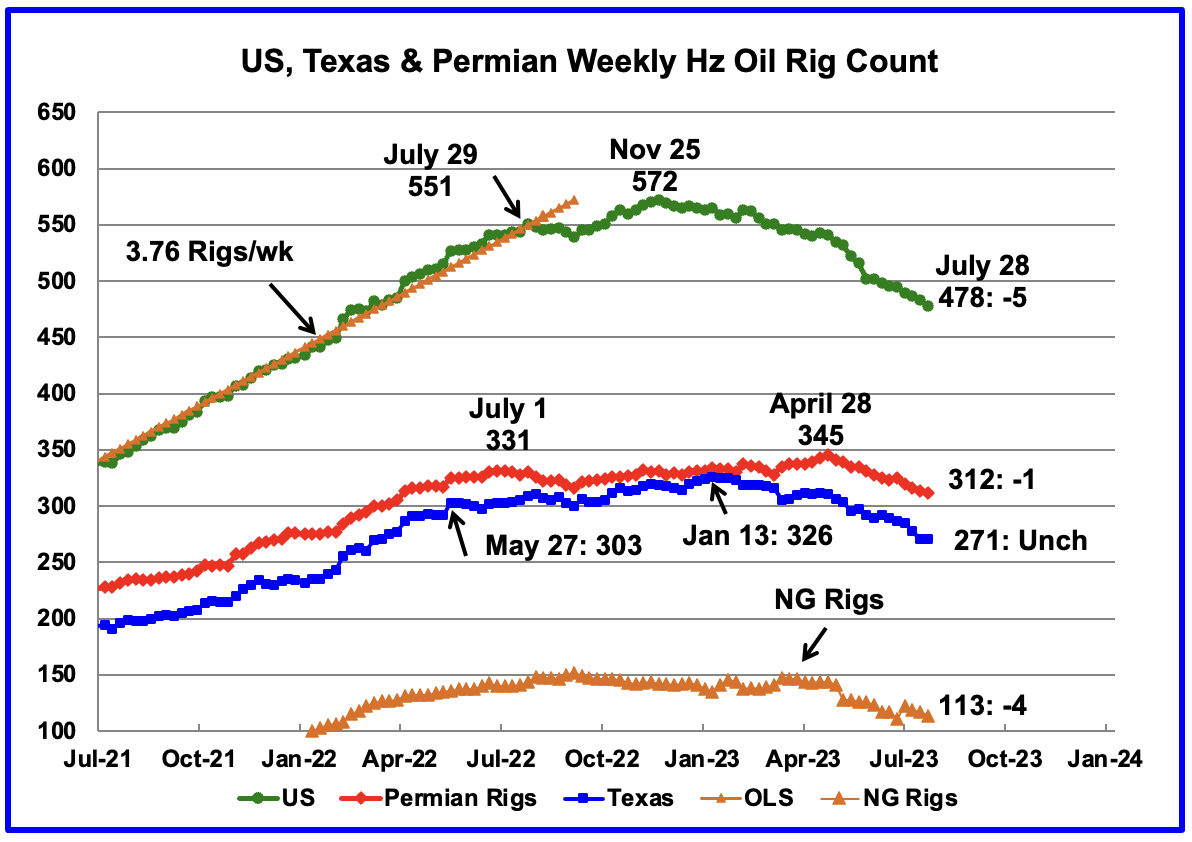
A high of 572 Hz oil rigs was reached in the week ending November 25, 2022. In the week ending July 28, 2023 the number of rigs decreased by 5 to 478 and are down 94 from the recent high of 572.
In the week ending July 28, Permian rigs decreased by 1 to 312 and Texas rigs were unchanged at 271. Specifically for the Permian, down 2 in NM and up 1 in Texas. Note that the general trend for rigs in the Permian is a slow decrease since April and is currently 32 fewer than the 345 rigs on April 28, 2023. In April 2023, WTI was over $80/b. Now that WTI is back over $80/b, will the decreasing trend reverse?
According to this Source: US oilfield service providers expect rig count recovery later this year on high prices
HOUSTON, July 27 (Reuters) – Oilfield service providers on Thursday signaled a recovery in rig count, an indicator of future production, later this year, citing an uptick in oil and gas prices.
U.S. shale producers slashed drilling and well completions in the second quarter, cutting demand for equipment and services. However, with U.S. crude prices climbing back to $80 per barrel, service companies are betting on a recovery in demand.
“We believe the industry rig count is near a bottom,” said Andy Hendricks, CEO of Patterson-UTI Energy, adding that the company expects additional rig releases in the next few weeks before drilling activity recovers later in the year.
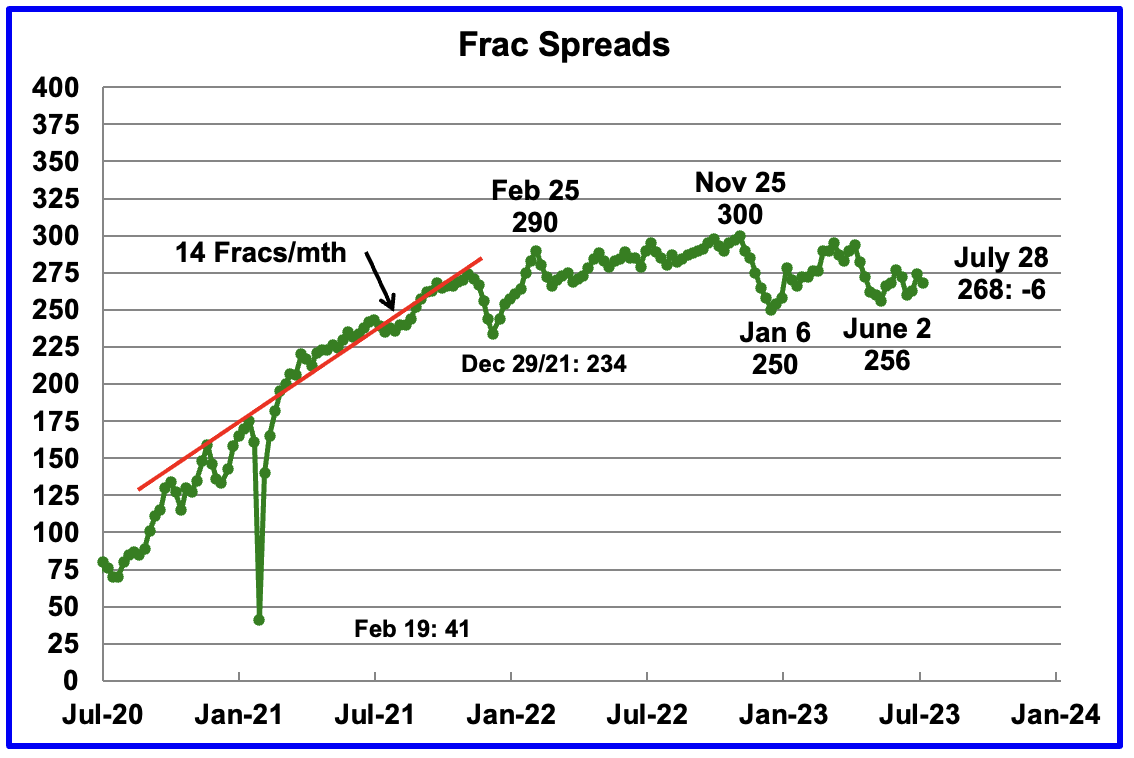
Since January 2022, the frac spread count has wandered between 250 and 300 fracs per week. For all of 2022 the average weekly frac count was 280.
Frac spreads have been rising from the low of 256 in the week ending June 2. For the week ending July 28, the frac count dropped by 6 to 268 and is down 32 from the high of 300 in November 2022. The current count is slightly lower than the 2022 average of 280 frac spreads per week.
The rig article above indicates that the rig count should increase as WTI increases. If correct, fracs should follow.
Note that these 268 frac spreads include both gas and oil spreads.
Scott Sheffield, the chief executive officer of large shale firm Pioneer Natural Resources said: “Recent weak oil prices have hit drilling, completion of new oil wells as US shale producers curb spending” and “is forecasting crude between $80 – $100 for the balance of this year.“
Permian Basin
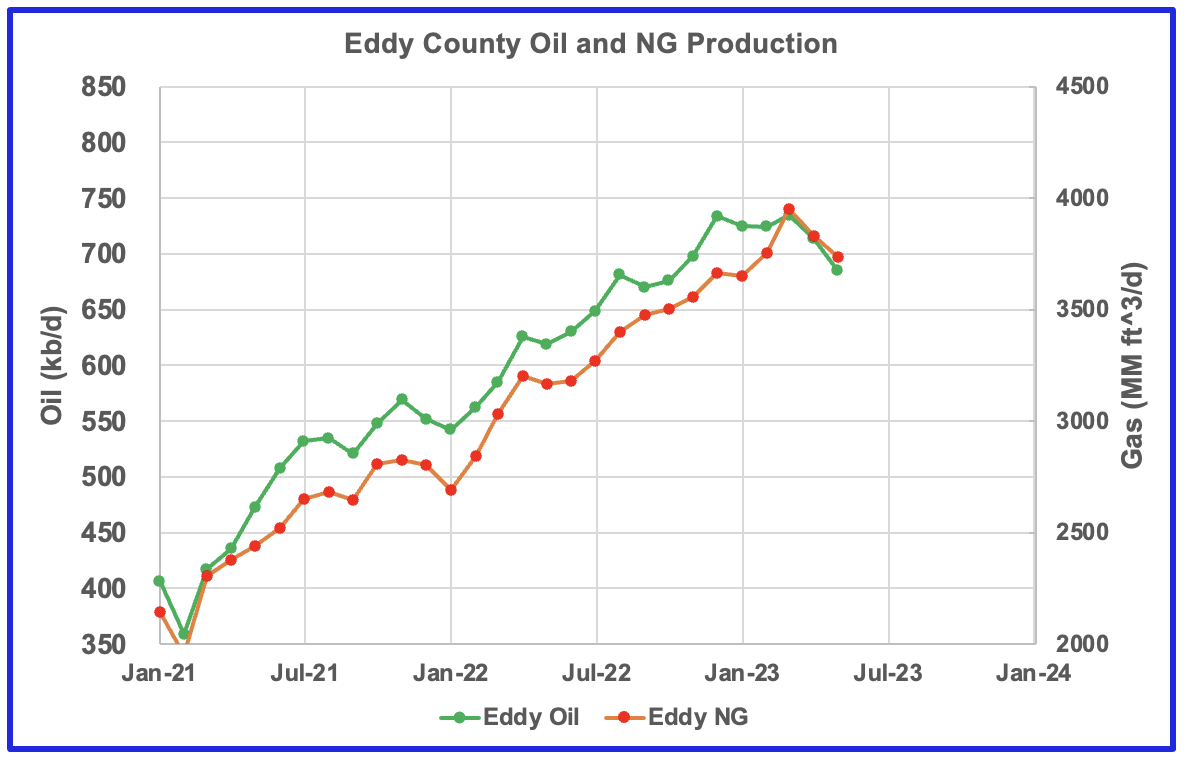
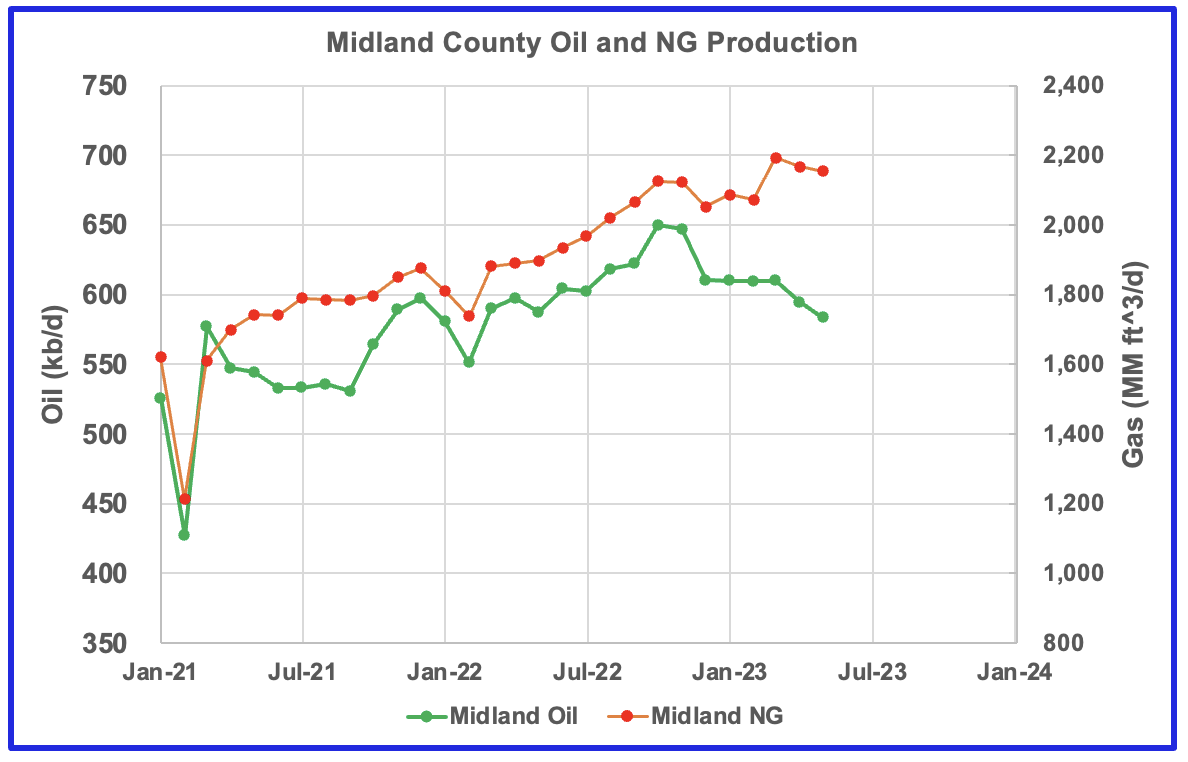
This new monthly section will focus on the four largest counties in the Permian, Lea, Eddy, Midland and Martin. It will track the oil and natural gas production and the associated Gas Oil Ratio (GOR) on a monthly basis. The data is taken from the state’s government agencies for Texas and New Mexico. Typically the data for the latest two months is not complete and is revised upward as companies submit their updated information.
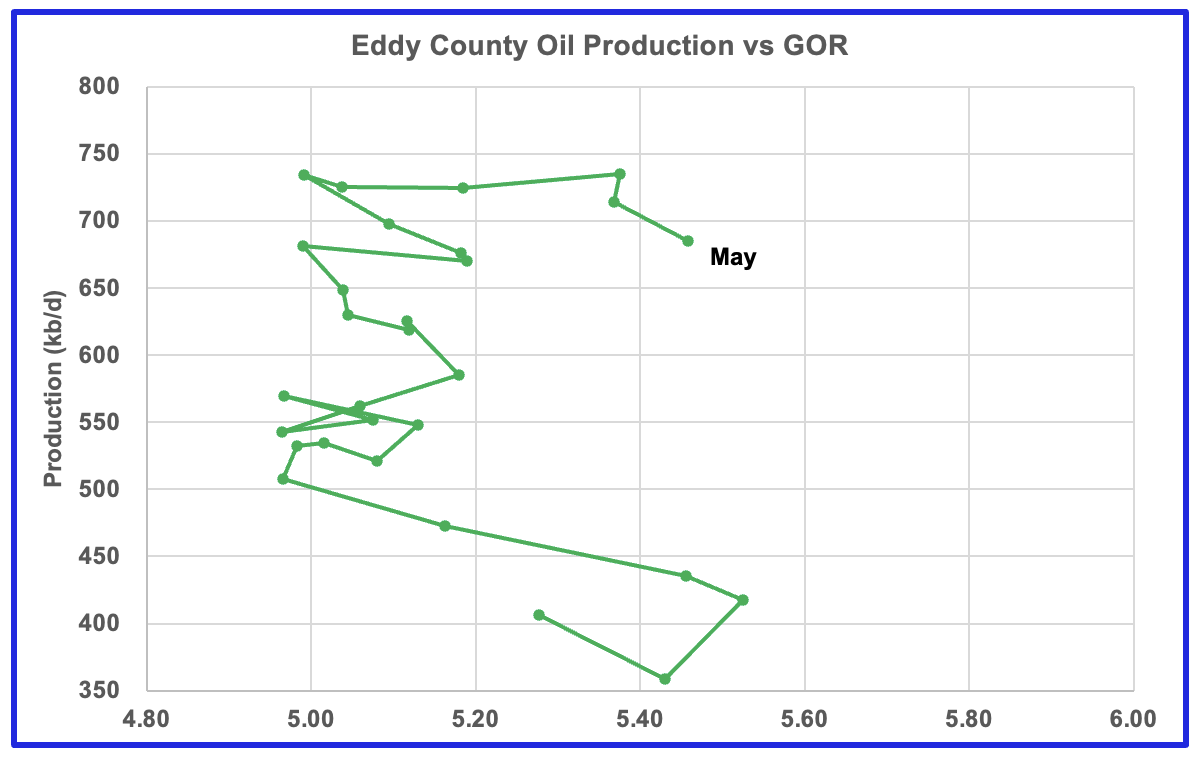
Of particular interest will be the charts which plot oil production vs GOR for a county to see if a particular characteristic develops that indicates the field is close to entering the bubble point. While the GOR metric is best suited for characterizing individual wells, counties with closely spaced horizontal wells may display a behaviour similar to individual wells. For further information on the bubble point and GOR, there are a few good thoughts on the intricacies of the GOR in an earlier POB comment.
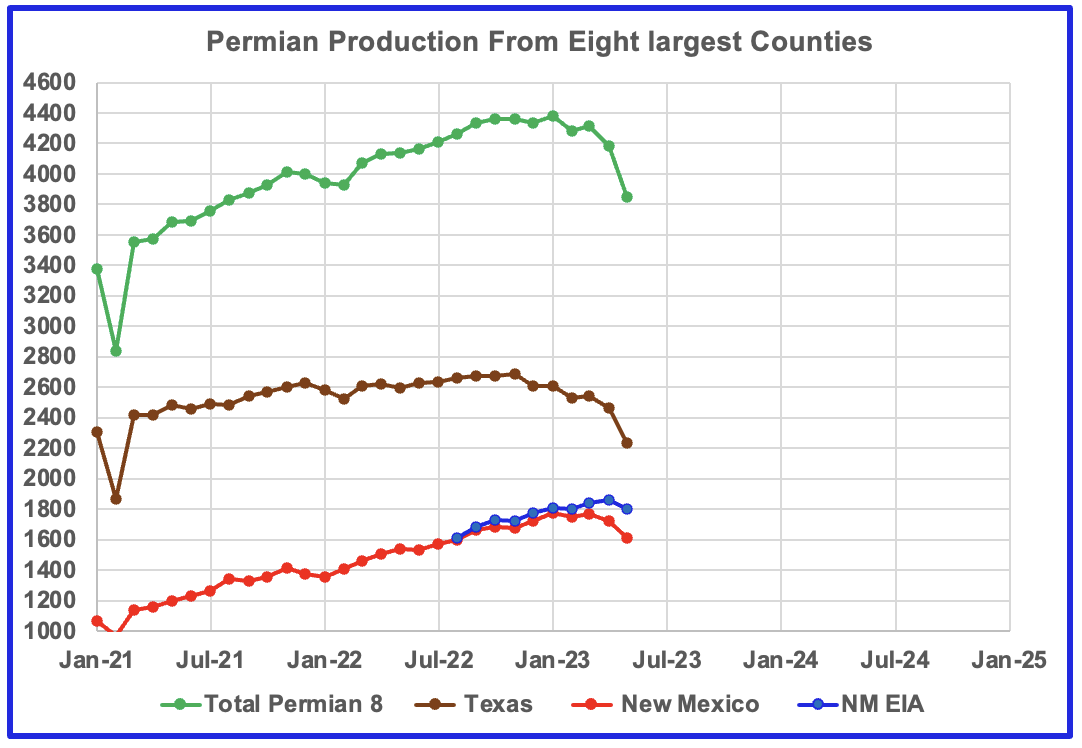
This chart shows the oil production from the eight largest counties in the Permian. In the New Mexico Permian, there are two counties Lea and Eddy. The remaining six are in Texas; Midland, Martin, Reeves, Loving, Howard and Kernes.
The red markers show production from the two NM counties while the blue markers show total production for NM from the EIA monthly production report. The EIA must have some correction factors to increased NM’s output from NM’s official site. The brown markers show output from the six biggest Permian counties in Texas.
For January 2023, Novi Labs is reporting Permian tight oil production of 5,180 kb/d compared with 4,381 kb/d from the eight counties shown in the above chart, which is 84.6% of total Permian output.
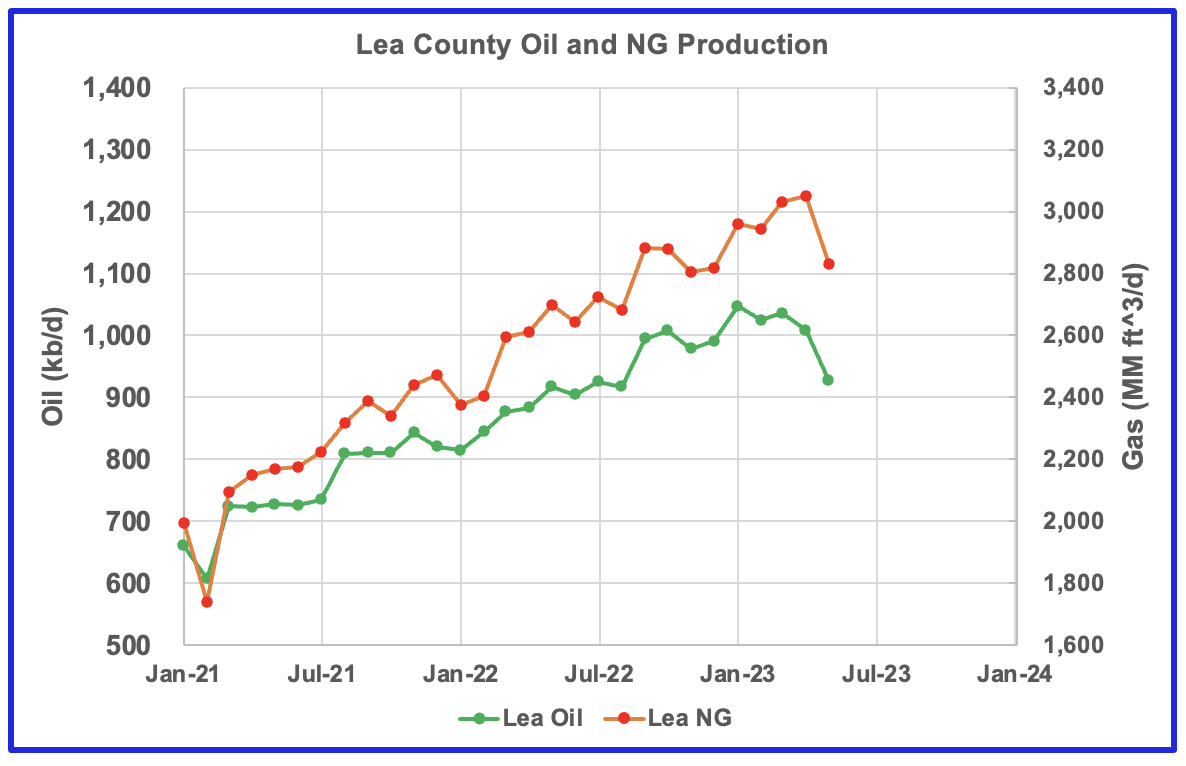
Over the last three months, it appears that oil production is falling faster than NG production.
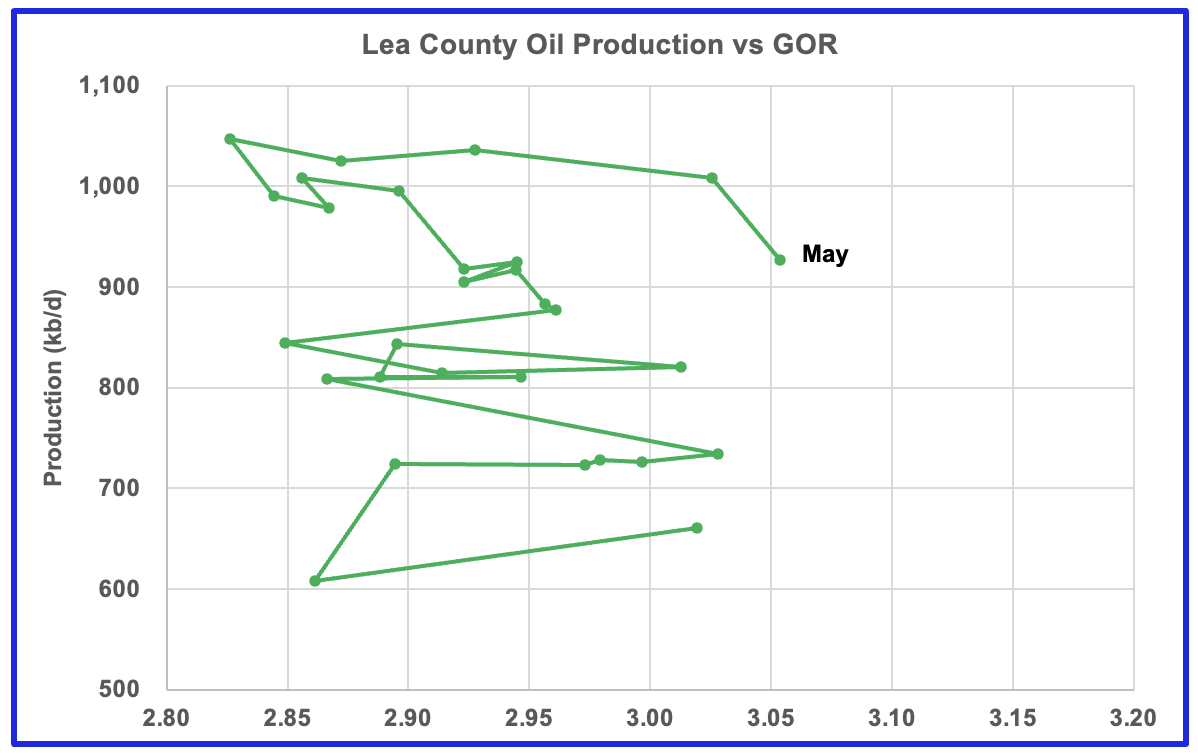
After much zig zagging, production stabilizes above 1,000 kb/d and the GOR hints at an increasing trend.
Similar production flattening to Lea county above 700 kb/d and an increasing GOR.
Oil production dropping faster than NG over last 5 months.
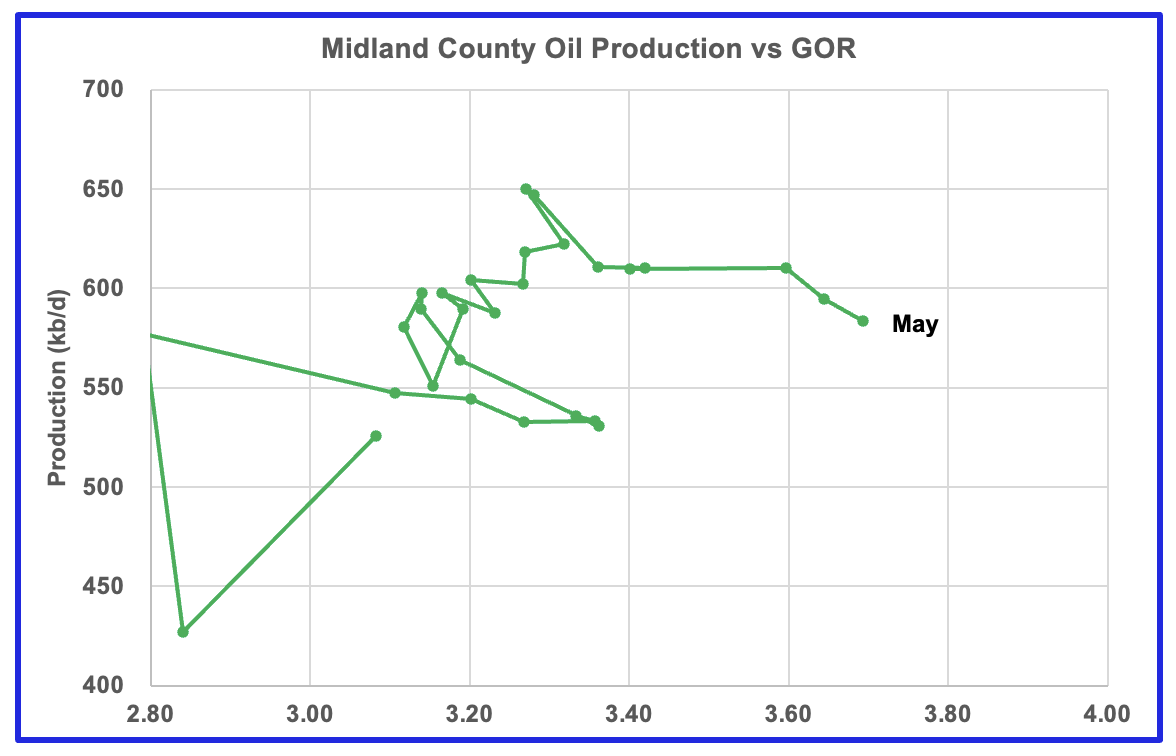
Similar flattening above 600 kb/d and increasing GOR.
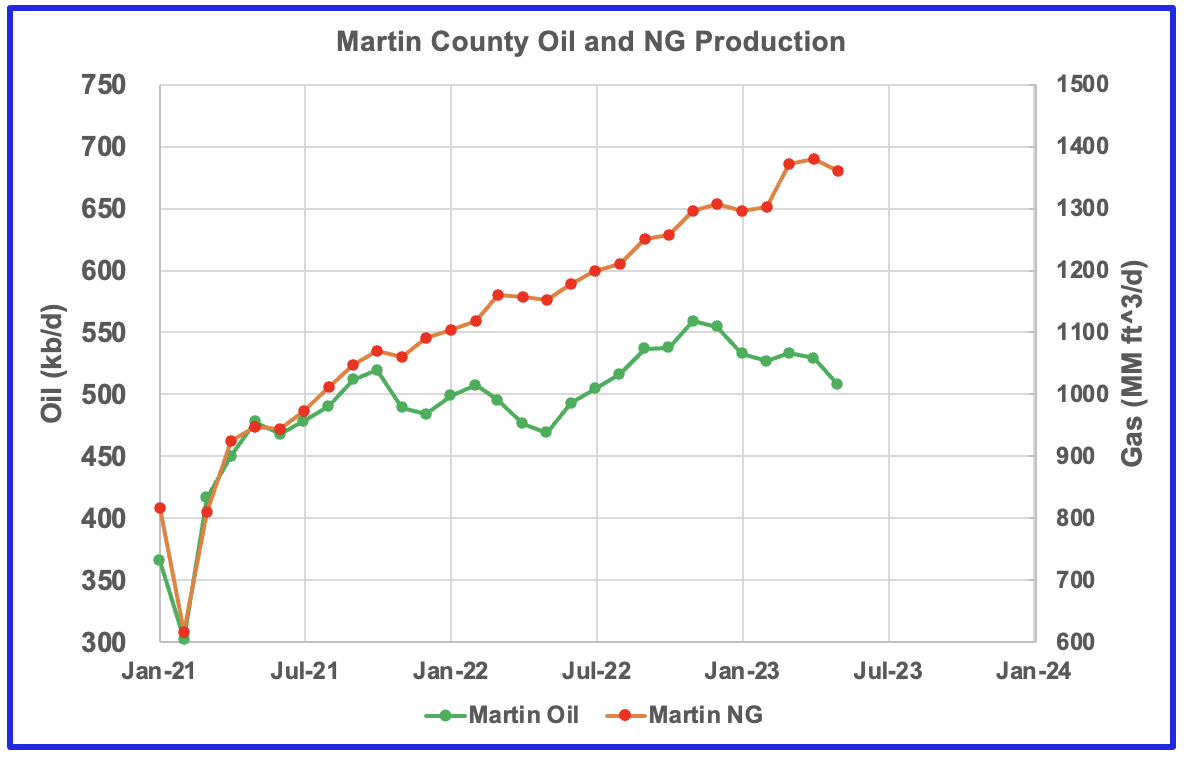
Oil production plateauing while NG production continues to rise.
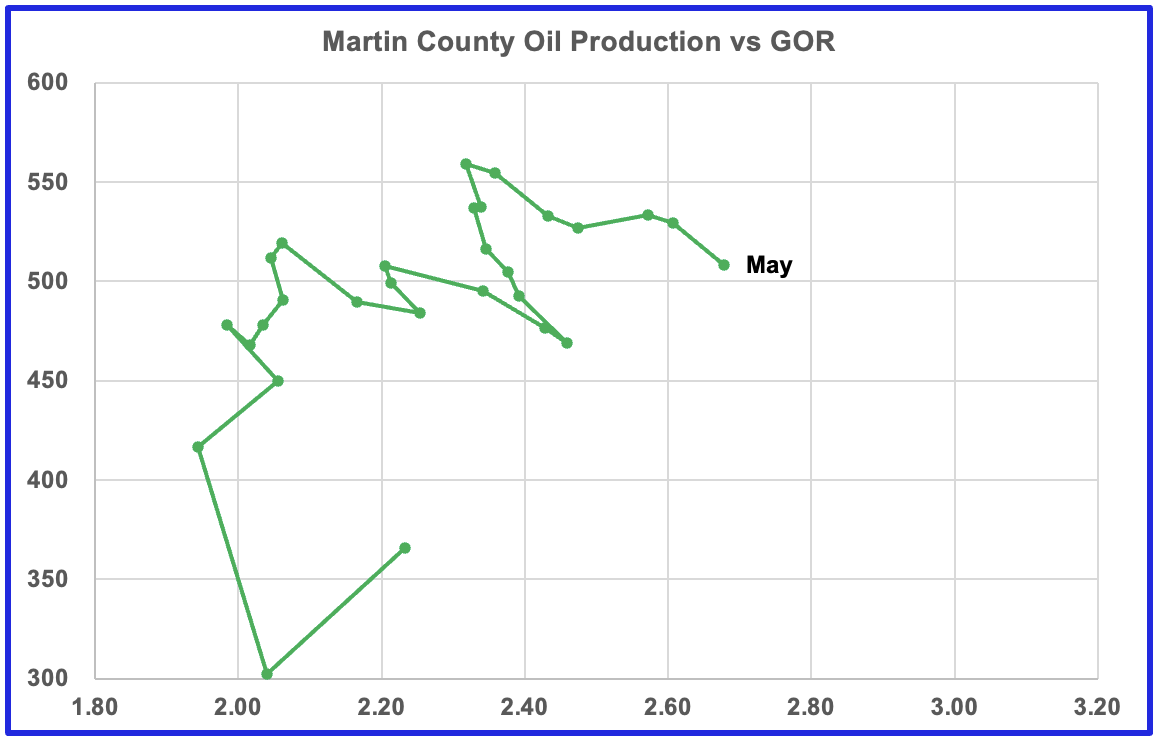
After peaking above 550 kb/d, production drops as GOR increases. Martin county appears to have peaked since production is falling as the GOR continues to rise.
Are the production vs GOR charts above exhibiting characteristics indicating that these four counties are near the bubble point and are close to peaking?
Drilling Productivity Report
The Drilling Productivity Report (DPR) uses recent data on the total number of drilling rigs in operation along with estimates of drilling productivity and estimated changes in production from existing oil wells to provide estimated changes in oil production for the principal tight oil regions. The July DPR report forecasts production to August 2023 and the following charts are updated to August 2023. The DUC charts and Drilled Wells charts are updated to June 2023.
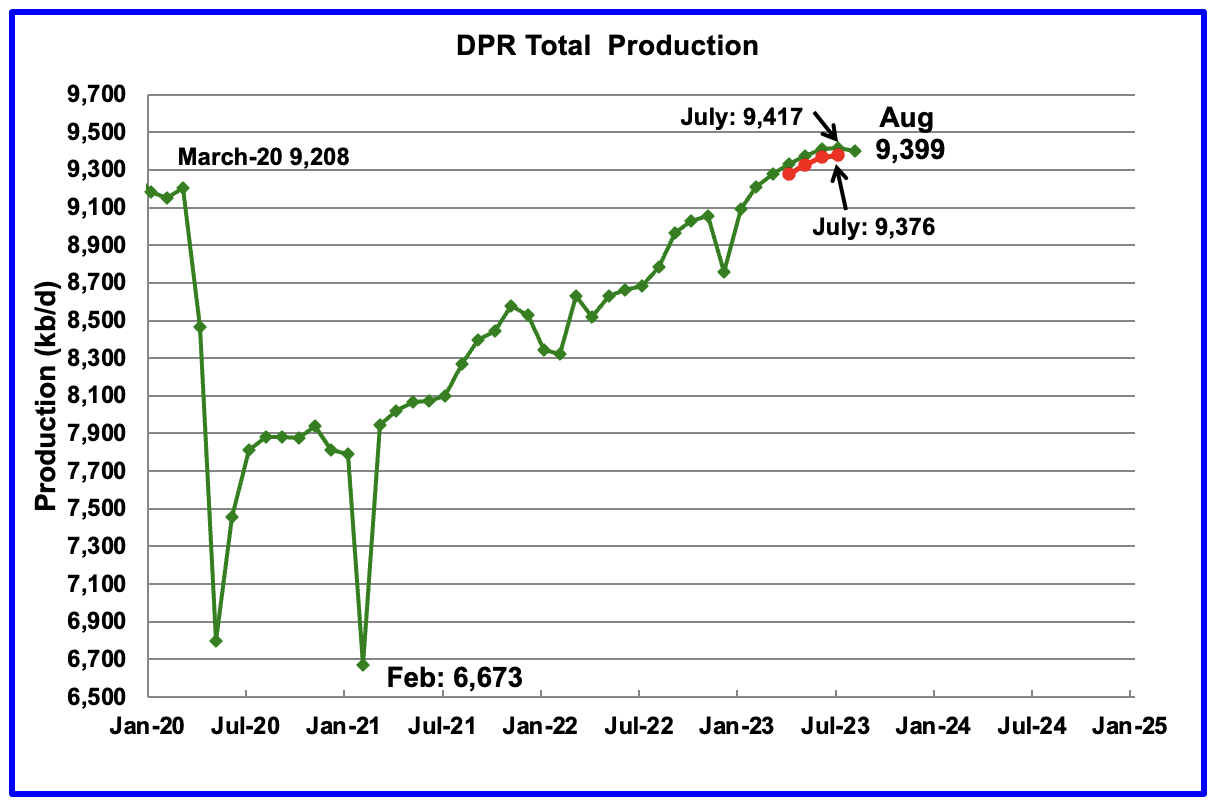
Above is the total oil production projected to August 2023 for the 7 DPR basins that the EIA tracks. Note that DPR production includes both LTO oil and oil from conventional wells.
The DPR is projecting that oil output for August 2023 will decrease by 18 kb/d to 9,399 kb/d, the first drop in production in over a year, excluding the December 2022 weather related drop. The drop is the culmination of the slowly reducing monthly rolling over/plateauing production trend that began seven months ago due to reduced drilling and completions. Also see next chart.
The July DPR production report increased/revised production over the last few months by roughly 40 kb/d to 50 kb/d over the June report. For instance, July output in the June report, red markers, was revised up by 41 kb/d from 9,376 kb/d to 9,417 kb/d.
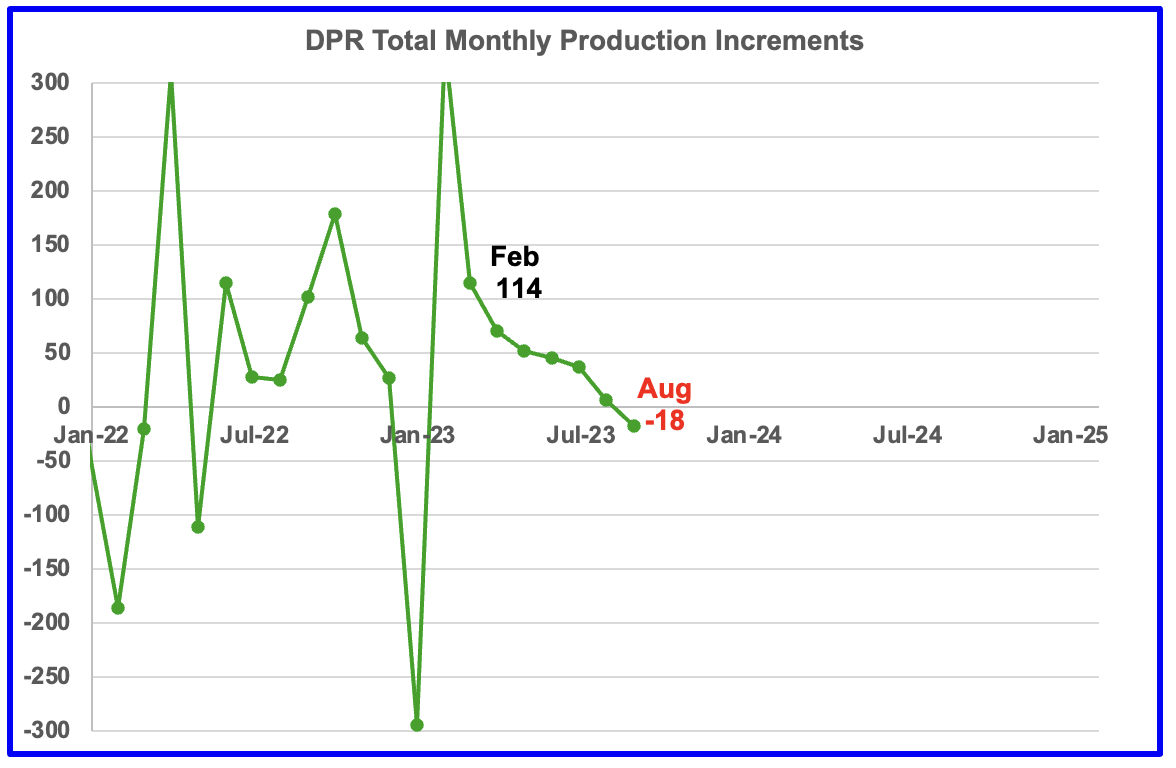
This chart shows the DPR production increments tracked on a monthly basis. What is notable is the dropping monthly increments and the reduced month to month volatility since February 2023. The January 2023 spike is due to the weather related December oil production drop.
The more interesting trend to notice is the declining monthly changes in the production rate. August’s production decrease was 18 kb/d while February’s was an increase of 114 kb/d. This short term production rate trend is hinting at an upcoming plateau or possible peaking in Permian production, since it is the dominant producer.
The issue is whether this slowing trend is the result of management’s decision on how to deploy its revenue, investors vs production increase, or is it related to geology, fewer Tier 1 locations along with the Permian gassing out and last but not least the current price of WTI, bouncing between $70/b and $75/b
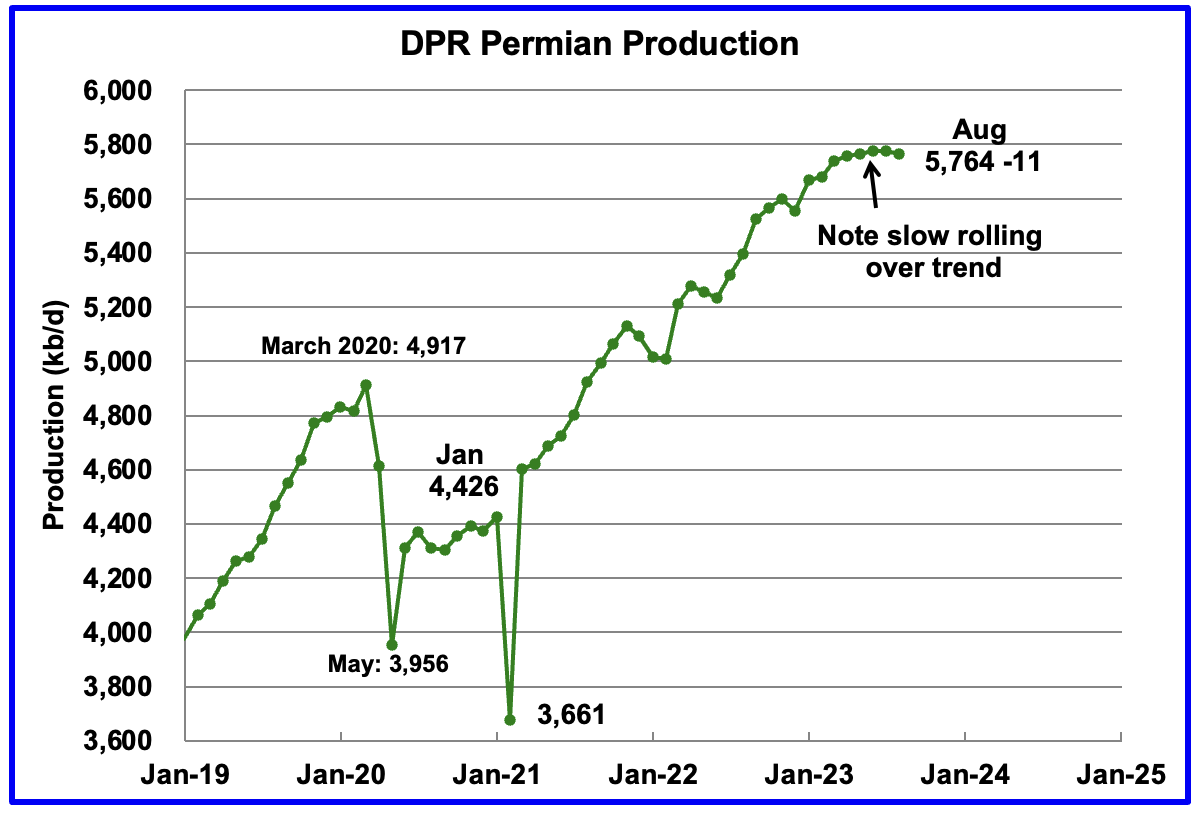
Permian output rolled over in August. It is expected to decrease by 11 kb/d to 5,764 kb/d. The last six months of production data clearly shows a slowing in monthly production increases, similar to the trend noted above for the total production for the DPR regions.
August’s output is 847 kb/d higher than the pre-pandemic high 4,917 kb/d.
During June, 460 wells were drilled and 480 were completed in the Permian. (Note that June is the latest month for DUC information). The completed wells added 376 kb/d to June’s output for an average of 782 b/d/well. The overall decline was 365 kb/d which resulted in a net increase for Permian output of 11 kb/d. Of the 480 completed wells in June, 466 were required to offset the decline.
Note: The additional 14 wells over those required to offset decline only added 11 kb/d to overall production in June, less than 1 kb/d per well.
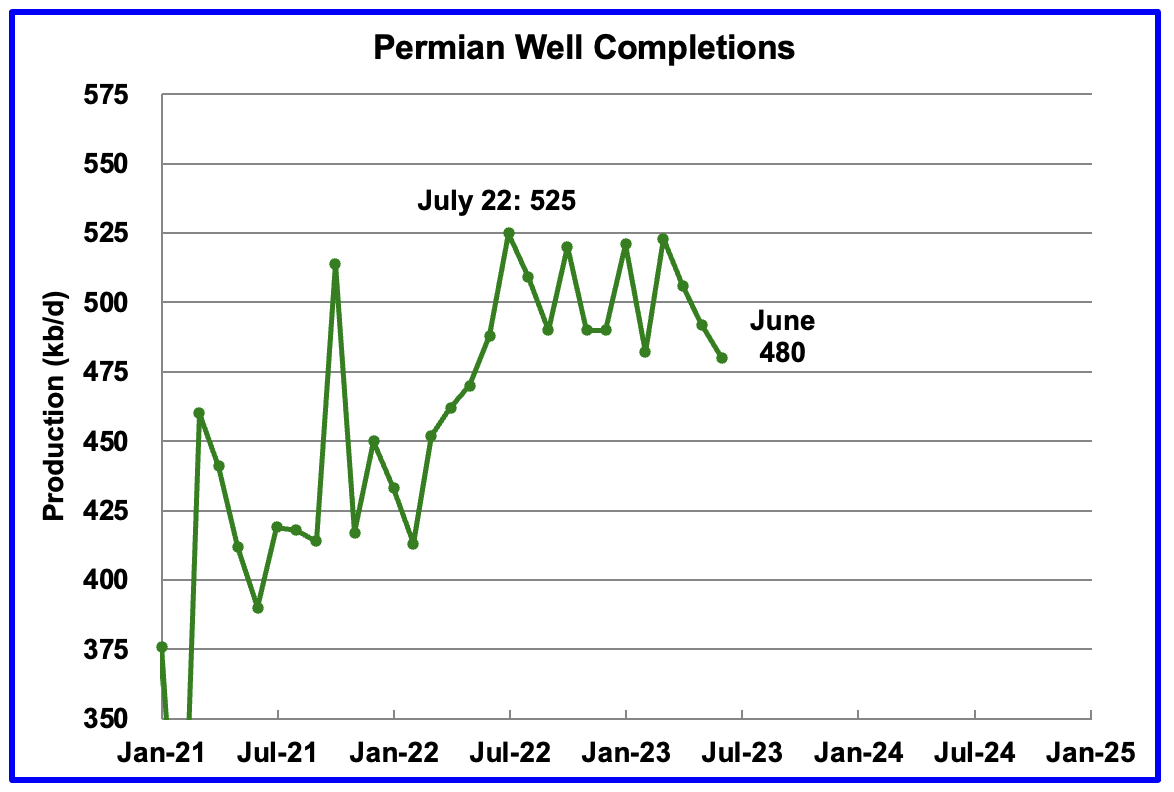
June completions are at a new recent low in the Permian.
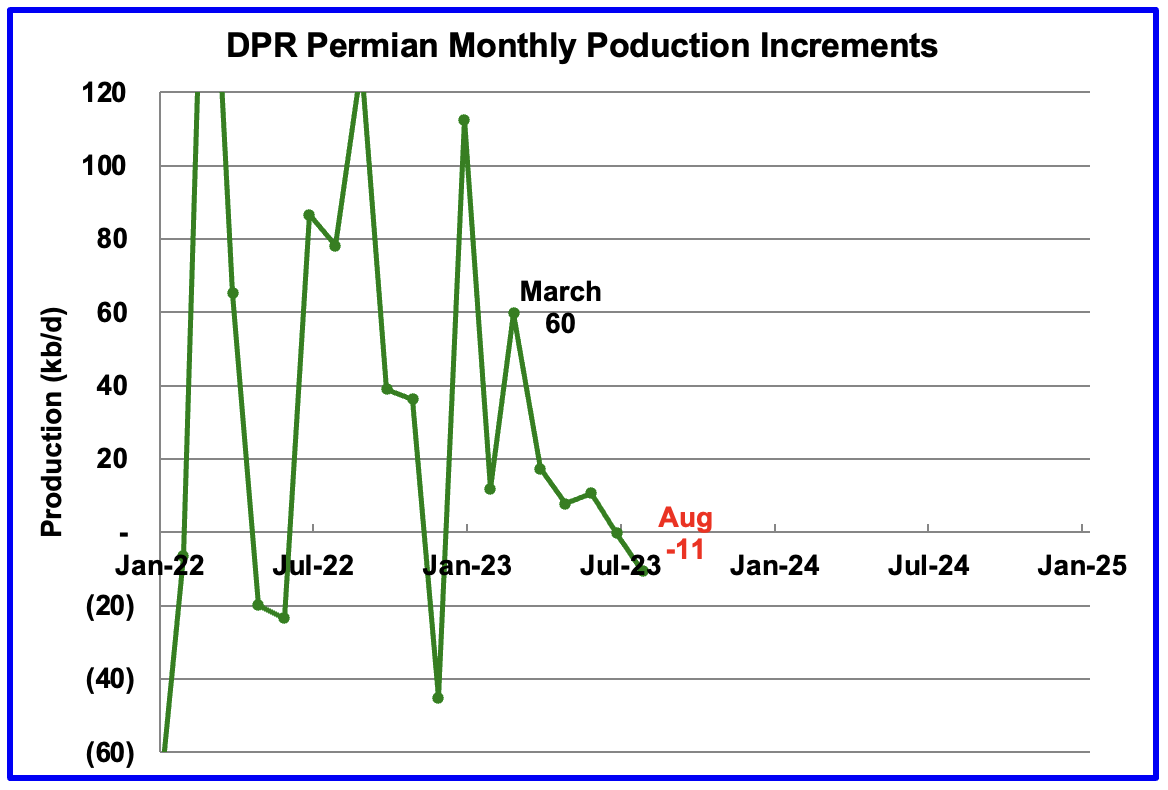
Permian monthly production increments have been falling since March. They are following the same trend as shown in the completions chart above.
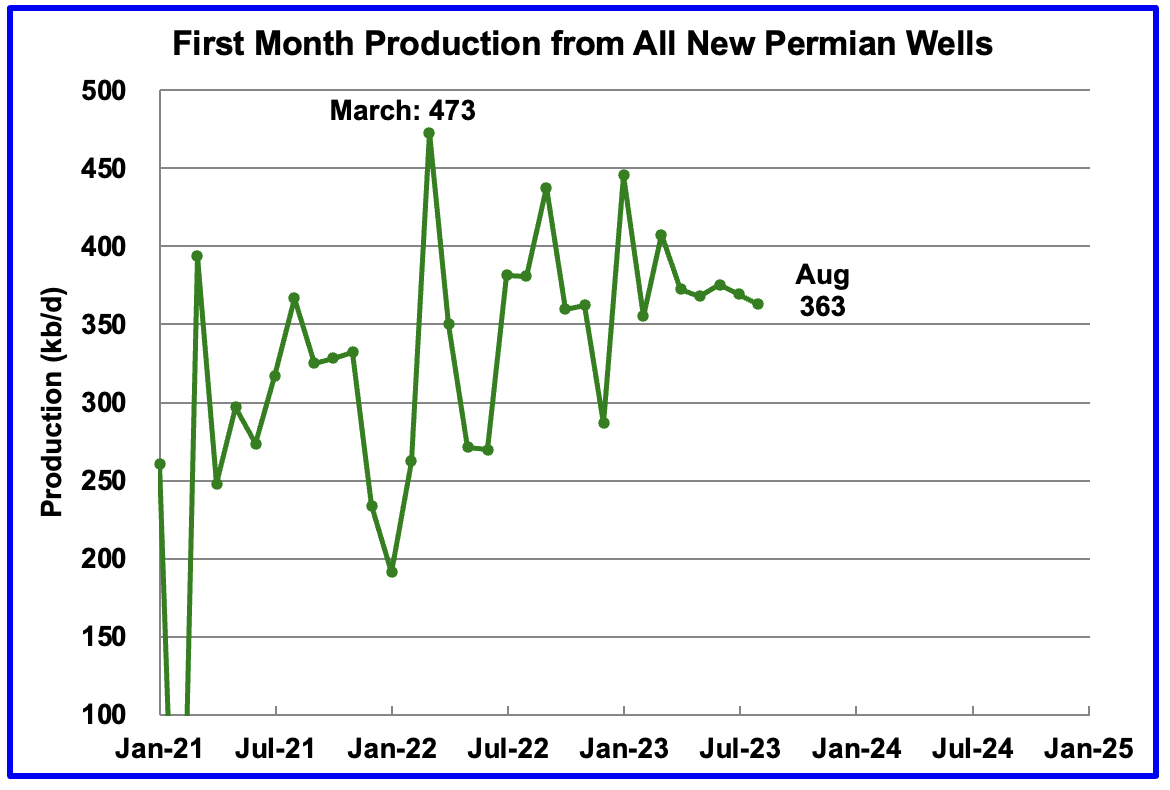
This chart shows the average first month total production from Permian wells tracked on a monthly basis. The total monthly production from the newest Permian wells in August continues to be at the 370 kb/d level but hinting at a dropping trend. Production has bounced around 370 kb/d for the last five months.
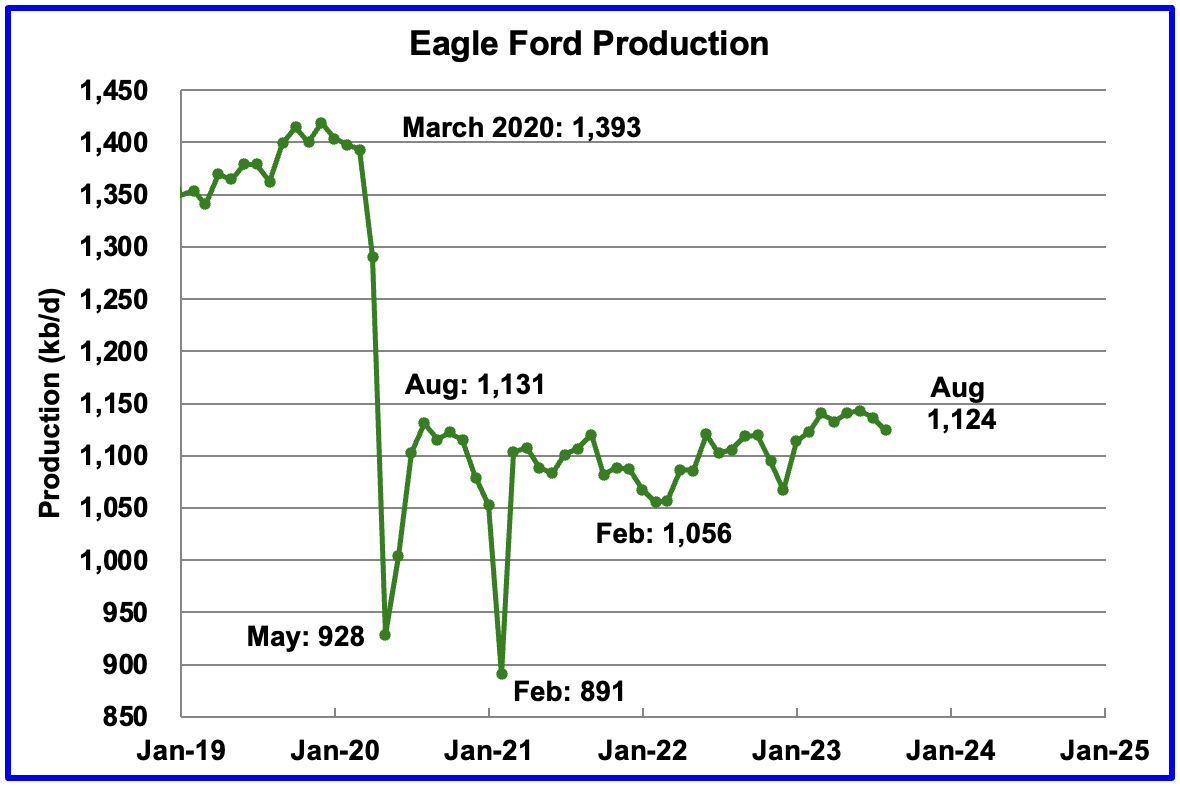
Output in the Eagle Ford basin has been in a generally flat trend since March 2021, fluctuating over a range of between 1,050 kb/d to 1,150 kb/d. August’s forecast projects output is expected to decrease by 12 kb/d to 1,124 kb/d.
At the beginning of the year 2023, 68 rigs were operating in the Eagle Ford basin. The rig count began to drop in mid March to 60 and dropped further to 58 in June.
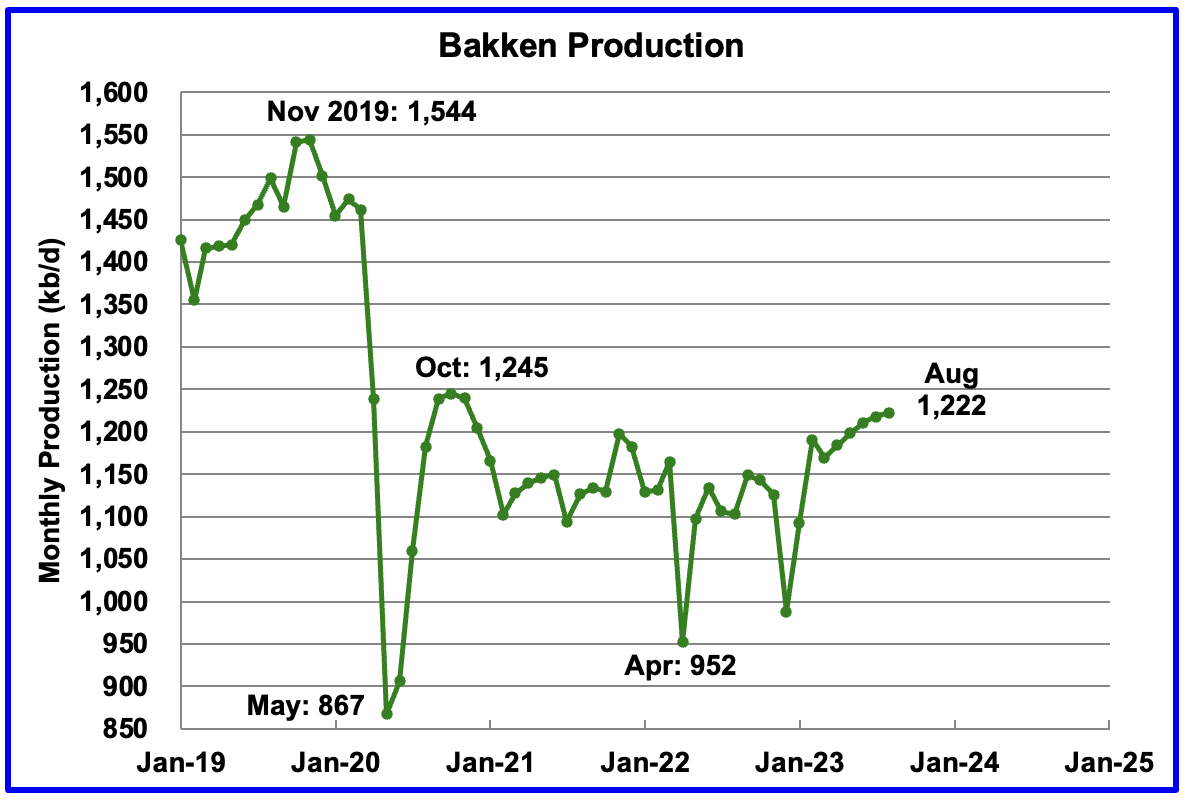
The DPR forecasts Bakken output in August will be 1,222 kb/d an increase of 4 kb/d over July.
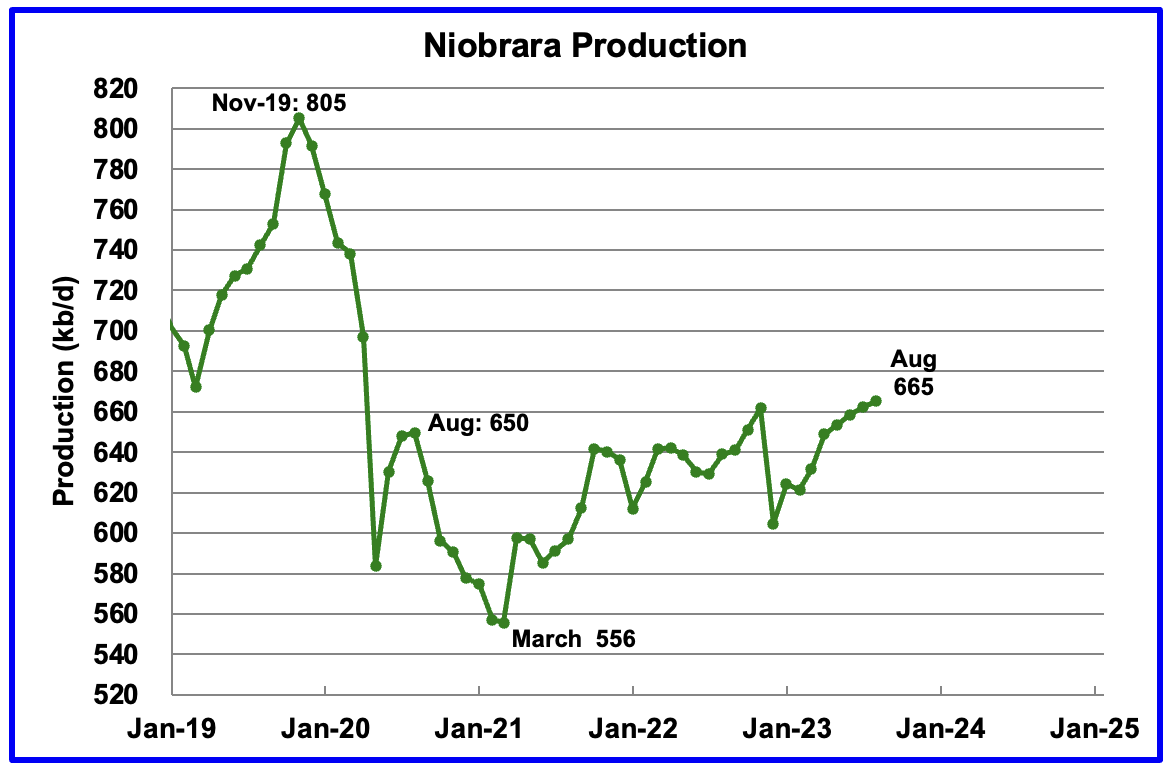
Output in the Niobrara continues to increase slowly. August’s output increased by 3 kb/d to 665 kb/d.
Production increased due to the addition of rigs into the basin but stabilized at 16 ± 1 rigs in March and April. However in June and July the rig count dropped to 14.
DUCs and Drilled Wells
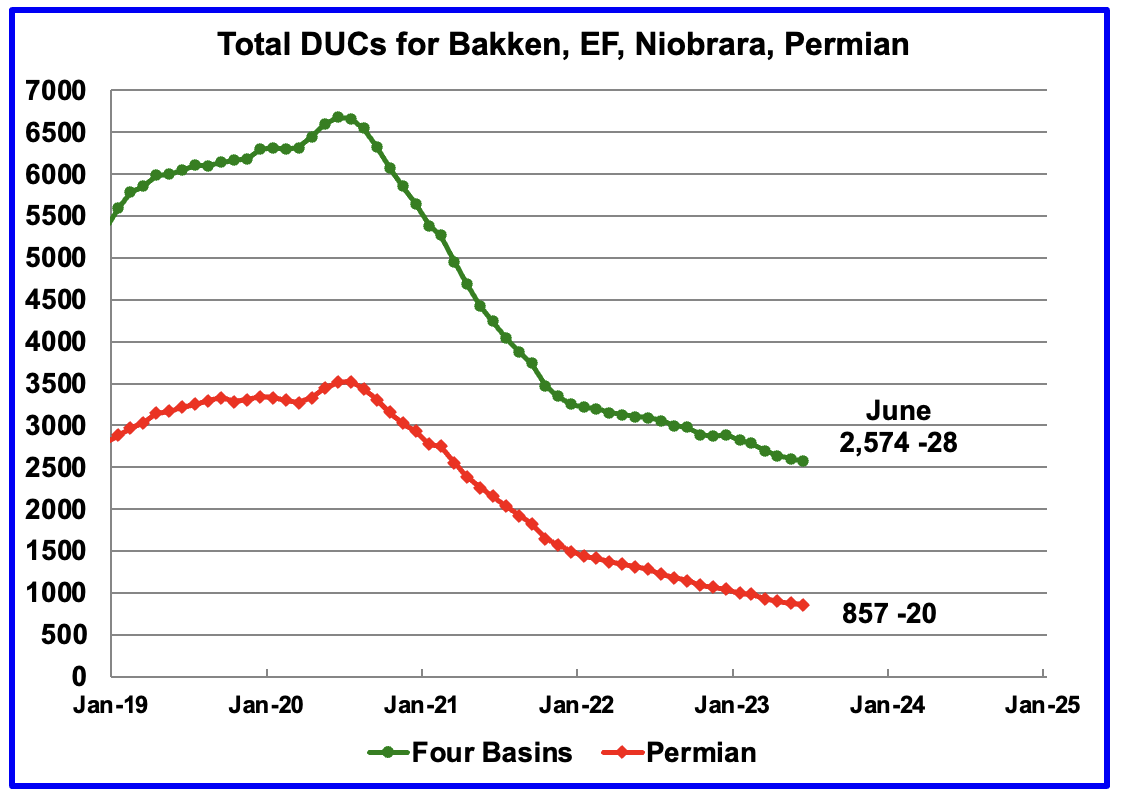
The number of DUCs available for completion in the Permian and the four major DPR oil basins has fallen every month since July 2020 and continued to decrease in June. June DUCs decreased by 28 to 2,574. The biggest decrease came from the Permian where DUCs decreased by 20 while Bakken DUCs dropped by 10, Eagle Ford by 4 and the Niobrara added 6.
June Permian DUCs decreased by 20 to 857 because 460 wells were drilled and 480 were completed.
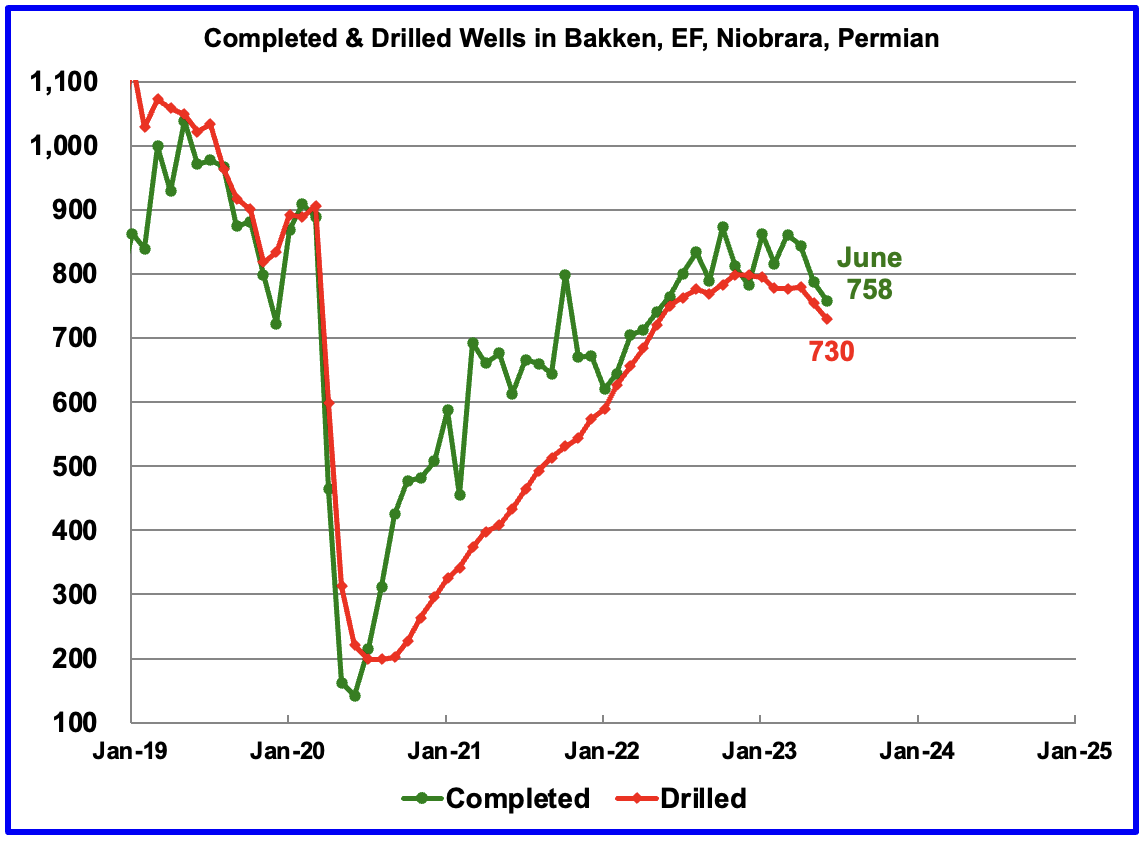
In these 4 basins, 730 wells were drilled while 758 were completed for a net decrease of 28 DUCs in June. Both drilled wells and completions are down from higher levels in late 2022.
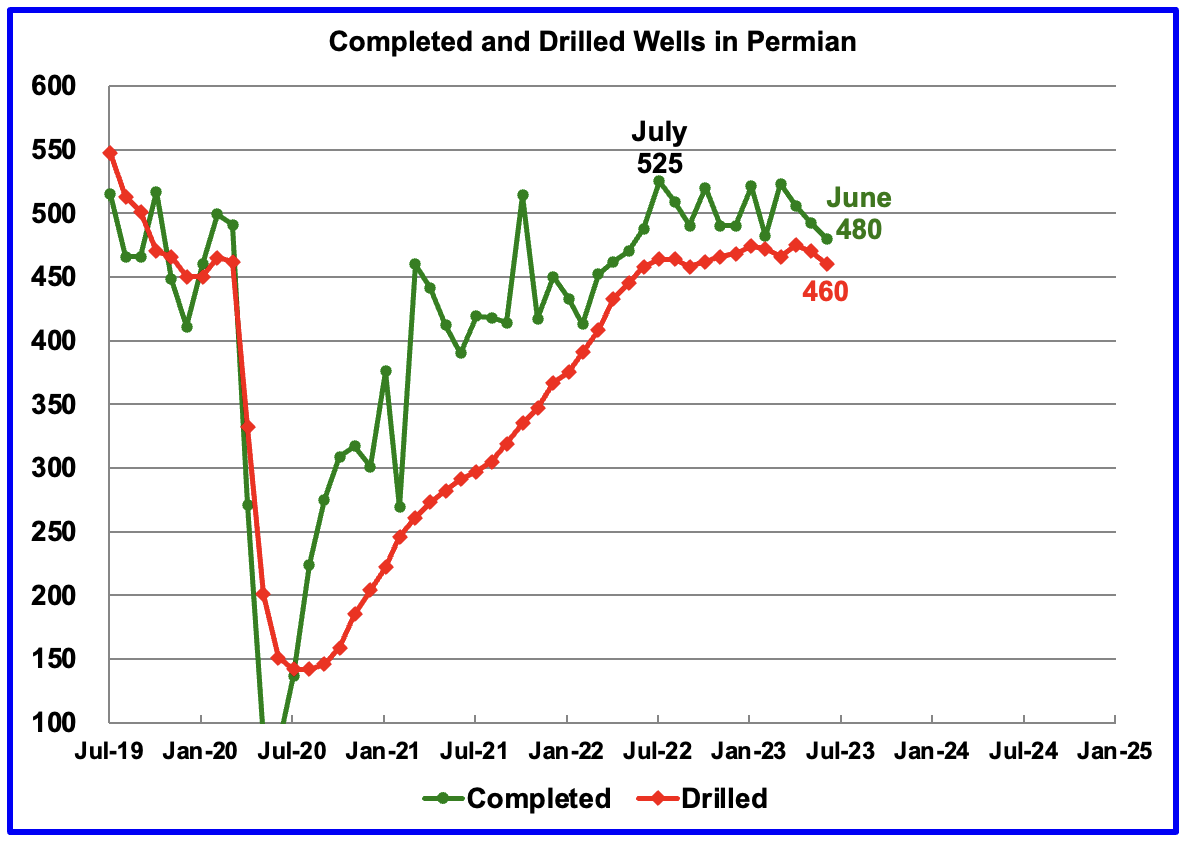
In the Permian, the monthly completion rate has been showing signs of slowing since the July 2022 high of 525. June hit a new recent low of 480 completions.
In June 480 wells were completed while 460 new wells were drilled. The gap between completed and drilled wells in the Permian has now been reduced to 20.
The Permian, as of May, had 857 DUCs remaining and the completion rate was 480 wells/mth. This means that the current cycle time between drilling and completions is 1.79 months or 54 days.
153 responses to “US May Oil Production Little Changed”
Great post Ovi; thanks. Below is the Hubbert Linearization of Ghawar by Jean Laherrere. Ghawar has produced two thirds of its URR and are, quite obviously in steep decline.
Ghawar barrels per day by Jean Laherrere. They peaked at 5.5 barrels per day and are now at about 3.5 pbp/d.
Even though KSA is moving away from burning crude oil for electricity production by turning to natural gas, their oil consumption will probably still soon increase towards 4 Mb/d. Along with declining oil fields, their ability to supply the world with ample crude, especially when there’s high prices or supply constraints due to conflicts in the region or elsewhere, is getting more doubtful.
Eventually, Europe will have to either compete with Asia for OPEC oil or go back to Russia, both painful options. Norway will decline soon as they have two large oil and gas fields that produce about 1/3 of each product (Johan Sverdrup for oil and Troll for gas). I doubt that North America will be able to export enough oil and gas to Europe and without nuclear, it won’t be possible to replace oil and gas with renewables in Europe without a major financial crisis and reduced economic output. BEVs (battery electric vehicles) will help reduce demand for crude oil in Europe, but will not necessarily be a savior and will take time to adapt.
So we still have a peak oil issue, even though the media is more willing to talk about peak demand, by pointing towards renewables and BEVs removing demand for crude.
Which of the big petrol importing countries will run low on purchasing power earliest?
In Europe France, they already just in last 12 months have lost 48% of their foreign currency reserves. We are talking mainly dollars here.
Even though they are under a shared currency they still have to have dollars to operate on a global scale. And they have lost almost half their dollars in just 12 months. So don’t let the value of EUR/USD fool you. France is running out of dollars fast.
Running out of purchasing power fast.
France is paying for some gas in Chinese yuan because they don’t have a choice because they don’t have and can’t get the dollars needed to pay for it in dollars.
Saudi Arabis has always burned every bit of natural gas they have to generate power and desalinate their water. The problem is they don’t have enough natural gas. That was the only reason they ever burned crude oil. And for years, they refused to buy it from Qatar because they were always feuding with them. Now I hear they have kissed and made up, so I guess they are getting more gas from them.
Their power plants and desalination plants will burn either oil or gas or any other type of liquid fuel. They often burn naphtha from their refineries. I guess they cannot find a market for it.
Note: Naphtha and condensate are chemically identical (C5), but they usually call it condensate when they get it at the well or GOSP and naphtha when it is separated at the refinery. However, that is not a rule.
Saudi Arabis are narrow minded and without imagination. They have a lot of sun, waste lands an sea water. With that, they could produce a lot of microalgae biomass with open ponds or semi open ponds in order to methanize it and produce methane. We know now how to convert microalgae biomass into methane with a yield of 87%. https://biotechnologyforbiofuels.biomedcentral.com/articles/10.1186/s13068-017-0871-4
So far, all attempts at commercializing this algae to fuel attempt at scale have been far too expensive. Despite reports of high efficiency.
Noncompetitive with other sources of energy.
It would be nice if it was viable economically, but $8/g minimum is far too high.
I would be interested to know from where you get that price from. Indeed, in France, the price of the cubic meter of biogaz is 1,36 euros and it is considered expensive. With this price, the farmers who produce it earn money. If we consider the natural gas as an ideal gas, the volume occupied by one mole of methane is 24 L at 20°C. Which means that there are about 41,5 moles of methane in one cubic meter of natural gas. As the methane has a molecular mass of 14g/mole, one cubic meter of natural gas therefore weighs 581 g. If one cubic meter costs 1,36 euros, then one gramme of natural gas costs 0,2 cents of euros and not 8$/g. Between a microalgae farm with open ponds of 1 ha and 1 ha of cultivated land, I wonder about the consumption of energy to produce 50 t of biomass in the case of the microalgae farm with open ponds (several crops during the year are necessary to yield the usual 50t of biomass per year) and the cultivation of, for example, miscanthus which produces 10t/ha of biomass per year at max. I am very skeptical about your figure of 8$/g. PS : when I am speaking of Saudi Arabiis, I am speaking of the engineers, the managers and the policy makers. The rest of the population is not allowed to say much.
Read this short article on the industry, and the two comments following to get a good idea of the challenges and state of the prototype industry.
https://www.canarymedia.com/articles/climatetech-finance/stop-trying-to-make-algae-biofuels-happen
and this one-
https://www.greentechmedia.com/articles/read/lessons-from-the-great-algae-biofuel-bubble
“Physics and thermodynamics are fairly important in energy applications.”
I’ll add chemistry and economics to that importance list.
I do think it would be great if algae biofuels were a good alternative to fossil oil fuels, and maybe they will be some time later on.
Both links are about the production of liquid fuels from microalgae. They are not speaking of the methanation of microalgae biomass, which is by far an easier and less complicated way to produce fuel (in this case, methane) than extracting oil from microalgae producing these oils or producing ethanol from cyanobacteria. When I am speaking of the methanation of microalgae biomass, the process in itself is no more a problem and the main issue is to increase the production of microalgae as much as possible.
I like how that fat dashed line from 2023 to 2100 is symetric with the other side… oh wait
Russia to Reduce Oil Production by One Million Barrels a Day By Alan Caldwell at EnergyPortal.eu
Russia will be reducing its oil production by one million barrels a day, according to an expert interviewed by the Rossiskaya Gazeta newspaper. In addition to a previously announced reduction of 500,000 barrels per day in March, this further cut will take effect soon.
The expert noted that the reduction in oil exports from Russia had already begun, even before the official announcement, as a voluntary measure by Russian energy authorities. This move is aimed at balancing the global oil market and stabilizing oil prices.
The Finnish Center for Studies on Energy and Clean Air reported that Russian oil exports totaled more than 2.5 million euros in just one week in July. This increase in exports was driven by a surge in crude oil prices resulting from a decrease in global oil supplies.
With this additional reduction in oil production, Russia is demonstrating its commitment to supporting the stability of the oil market. The impact of these actions will be closely watched by experts and analysts to assess their effectiveness in addressing the current challenges in the global oil industry.
I don’t believe a damn word of it. Oh, I believe their production will drop by another one million barrels per day. I just don’t believe they are doing it to support the stability of the market. They are doing it because their production has finally started to drop due to sanctions and natural decline.
Dwindling Rig Count May Finally Lead To Lower Shale Oil Output By Felicity Bradstock
Following record levels in 2021, U.S. oil production is anticipated to drop in 2023, partly due to strategic changes among producers favoring returns to shareholders over operational expenditure.
Declining oil prices and rising break-even costs are leading some oil companies to put drilling operations on hold, waiting for optimal conditions to resume production.
In addition to strategic changes, the reduction in oil rig count has been attributed to private companies downsizing their rig fleets, contributing to an anticipated decrease in U.S. shale production.
Despite record U.S. oil production last year, output this year is set to decline, with the oil rig count dropping over the last three months. The U.S. saw increased activity in its oil and gas fields last year following the Russian invasion of Ukraine and low OPEC oil output, which led President Biden to plead with domestic producers to boost their output, to tackle shortages and rising prices. However, many private companies could not maintain this level of output, and others are now biding their time until oil prices rise again, driving down U.S. production in shale regions.
Biden urged oil and gas producers in the U.S. to boost production levels last year following the Russian invasion of Ukraine and subsequent energy shortages, which drove the price of energy sky-high. This was essentially to counter the OPEC decision to limit global oil production, with quotas still in place from the pandemic, pushing prices up even further. Thanks to efforts to increase U.S. oil output over the last year, production levels are expected to hit 12.61 million bpd, compared to the previous record of 12.32 million bpd in 2019, and much higher than last year’s 11.89 million bpd. U.S. crude output has increased 9 percent year on year, countering OPEC’s efforts to drive oil prices up.
There is a lot more to this article. Click on blue link to get it.
Top shale producers Devon and PXD profits fall . Cut dividends by 45% . Gas hissing out ??
https://www.oilystuffblog.com/forumstuff/forum-stuff/it-s-probably-nothing?origin=notification
90 second video from a Ford dealer regarding why he will not be selling EV’s .
https://twitter.com/GuyDealership/status/1686704550126686209
That ranks up there with the video of the 1886 horse dealer who refused to sell motor cars…
But it’s truly amazing to look back at history and 100 years ago the oil industry in its infancy
I feel you imply that EVs are the logical next step but thats not true at all. You had EVs when black and white photography was still a mainstream thing. Burning fossil was just way more convenient.
“Burning fossil was just way more convenient.”
Until it is no longer affordable or available.
I guess if you don’t like electric vehicles
that you could just switch to gravity vehicles, after petrol.
Just vested interest in the oil industry, EVs predate the gasoline cars, first ones were in 1800’s:
https://iowahistoryjournal.com/an-electrifying-iowan/
Battery tech was the key, and that didn’t happen until Tesla came to be…laptops paved the way for the energy density requirements in the 1990s and it’s still evolving today, solid state may be the key to lower weight/higher energy needs.
Range and time needed to charge continues to be an issue for some drivers…
Soon enough when lines at gas stations become too long (most Costco stations are already on par with Tesla supercharging – can take 20-30 minutes to wait and fill during bad times).
My 2018 Model 3 has ~170k with no issues or maintenance needed (just tire change outs). Battery still charges to ~290 miles vs 310 miles when it was new (<10% battery degradation after ~600 charge cycles).
> Until it is no longer affordable or available.
Then why not turning back to being a horsedealer
“Then why not turning back to being a horsedealer”
Happened in Cuba.
The shale oil saga will go down in history books as both a blessing and a curse…the mayhem that will soon ensue due to losing 2-3 md/d each year will be a tough pill to swallow.
Worse yet the lack of eager exporters (Middle East) to send us 10 mb/d by 2028 will create a massive oil shock and disrupt goods and services.
I would not want to be in the oil tanker business, future is looking very bleak…there will be so many stranded assets it’s not funny.
Thank you Ovi (Dennis too) for the thought provoking posts.
Kengeo,
Stranded assets will be the least of our problems with declining production.
Kangeo
Thanks
Could you explain where/how you get your 2 to 3 Mb/d decline. Is it net or gross.
Using historical data the best estimate I get for net decline is between 500 kb/d/yr and 750 kb/yr. What is happening post Covid to that trend is not clear because of all of the OPEC cutbacks.
Ivi – just throwing out an average decline rate of 30%, decline should be steep initially then taper off…either way 1 or 3 mb/d annual decline will be bad…
Kangeo
Not clear for the 30% source. For Ghawar, Aramco states the decline rate is 8% but the infill drilling drops it to 2%. Deep water fields were reported to drop by 10% per annum. Now that they inject water it could be lower.
Attached are two charts. The first one tracks 52 mostly small countries and it is showing a net decline rate of 529 kb/d. I have not updated the OLS line since August, intentionally, to see what happens. Note that the OLS includes the covid drop and splits it almost perfectly.
The second chart shows the rest of the world. Production has been flat since August 2022. Opec cuts are contributing to the flatness,
Permian is not Ghawar
+1
> 8% but the infill drilling drops it to 2%
and by the way has anyone modelled when the infill might not work anymore and what happens then
if Ghawar infill fails at the same time with the permian decline we are in for some energy wars out there
Svaya,
You really need a model for a Seneca cliff?
The Rest
Yes, and if you exclude the US tight oil component then you can see that 58 mb/d is dropping by ~2% annually while 13 mb/d dropping by 4.5% annually. The question is how fast will the 9 mb/d tight oil decline? Sometime soon the 58 mb/d group is going to join the 5% annual decline group.
Funny thing is that BP and others have been modelling this exact decline for a long time, calling it zero net emissions or similar…
Ironically, the climate issue will likely work itself out as we simply don’t have enough oil to keep emitting CO2 in the volumes needed to pass climate tipping levels…
Kangeo
Just realized your 3 Mb/d decline is 3%. For a gross decline, that could be in the right range.
Ovi,
If we focus on C plus C and assume 83 Mb/d is the peak output level, then 3 Mb/d is about 3.6% per year from the peak year. It is doubtful that 3 Mb/d will be the annual decline rate in my opinion. For a Hubbert Model with roughly a 2970 Gb URR the chart below has annual decline rates, peak is 2023 at about 80 Mb/d, cumulative production for model through 2022 is about 1472 Gb vs 1473 Gb according to data.
Permian frac operations continue to fall as inventory concerns and productivity degradation issues are becoming more and more obvious!
Last 10 weeks have seen all 6 of the lowest 6 readings over the last year (excluding Christmas 2022) indicating a sustained slowdown ahead. 🛢💰 .—-Shubham Garg
Dennis , I know this is weekly but weeks will become months and months into years . Little acorns in trees do grow .
Permian production is now flat over the last 10 months as lack of quality acreage and continued productivity degradation majorly impact the basin’s capacity to grow!
DUC’s are fully depleted, most PE-backed growth E&P’s have been acquired, and decline rates never sleep. 😈🛢💰—Shubham Garg
Peak oil USA 2019 . No more growth .
HIH
It looks like the purple 2023 graph is confirming the Permian chart in the DPR section.
The data appears to be daily. Wonder how they get it?
Ovi, no idea . The source is JPM . Maybe they are privy to insider info we folks don’t have . Jamie Dimon has a direct line to Yellen and Powell and the chief at EIA comes much lower in the pecking order . Don’t sweat the small stuff . This makes it clear that there is no more growth in the Permian , now we will wait for the start of the decline . The problem is that what is reported is BOE which is smoke and mirrors . See post on Devon and PXD by Mike S .Also an earlier post by me . Great work on the post . You sir are a gem .
https://peakoilbarrel.com/opec-update-july-2023/#comment-760802
HIH
Thanks. I’m hoping the Permian section will give us more insight into what is happening there.
Ovi , this is what I mean with the BOE smoke and mirrors . How much oil or how much gas ?
“Pioneer Natural Resources reported 2Q production of 711 Mboe/d, rising from first quarter volumes of 680 Mboe/d and beating their given guidance.
Notably, crude as a percentage of total production slid from 53% to 51% over the last two quarters. Pioneer’s gas production totaled 963 Mmcf/d, rising substantially from prior-quarter rates of 909 Mmcf/d.
The firm’s gas growth has outpaced crude Y/Y, with gas output up +19% Y/Y versus a crude growth of +6% Y/Y. “— Criterion Research
By the way also confirms increase in GOR .
The sorry saga of the SPR refilling continues .
https://abcnews.go.com/US/wireStory/biden-delays-plans-restock-nations-emergency-oil-reserve-101964483
World April C plus C production has been posted
Production is down by 433 kb/d to 81,784 kb/d. Another drop is expected in May. Biggest drop was in Iraq 230 kb/d. Saudi added 350 kb/d and Russia dropped 100 kb/d.
See updated Russia cutback in next comment.
Full report should be posted on Thursday August 10.
Saudi Arabia to keep 1 mil b/d output cut through September
Saudi Arabia, Russia extend oil cuts ahead of OPEC+ committee meeting.
Saudi Arabia will continue the 1 million b/d cut that is holding crude production at a two-year low of 9 million b/d, while Russia is tapering its 500,000 b/d export cut for August to 300,000 b/d for September.
https://www.spglobal.com/commodityinsights/en/market-insights/latest-news/oil/080323-saudi-arabia-russia-extend-oil-cuts-ahead-of-opec-committee-meeting
Open question, isn’t the vast majority of remaining oil reserves/future discoveries assumed to be offshore? Aren’t there numerous hurdles for developing offshore reserves especially at high production rates? It would make sense since infrastructure is extremely limited at sea that production from deep offshore areas will always be a niche low-production game? Thinking about this aspect leads me to believe a sharper and more significant drop in oil production is inevitable and coming soon…anyone know what % of 1P and 2P reserves fit this offshore category? Something tells me at least half and maybe even three quarters? Added a bigger drop scenario to graphic: Thanks all
TRANSOCEAN LTD. AND SUBSIDIARIES
INDEX TO QUARTERLY REPORT ON FORM 10-Q
QUARTER ENDED JUNE 30, 2023
OUTLOOK
Drilling market—Our industry outlook is positive based upon underlying economic factors, including the short-term increase in global demand for hydrocarbons and long-term forecasts that indicate hydrocarbons will continue to be a critical source of energy for the foreseeable future, even with significant relative growth in alternative energy technologies. Economic forecasts indicate that countries that are not members of the Organization for Economic Co-operation and Development will continue to experience population growth and improvement in living standards, which will compound the increase in energy demand for the foreseeable future. We believe that these factors will contribute to robust demand for oil and gas.
The existing supply of oil and gas is depleting and requires replenishment. The replacement of reserves remains critically important given the significant underinvestment during the last several years and the challenges made to new exploration and production investments imposed on many industry participants by investors and the governments of oil and gas producing nations. Additionally, energy security will remain an important geopolitical factor across Europe, the U.S. and elsewhere with the growing understanding that hydrocarbons are not easily displaced by alternatives for much of the world’s energy needs.
With deepwater and harsh environment fields generating robust economic returns versus other hydrocarbon sources, combined with their comparably low carbon intensity, we expect a significant portion of the required spending in fossil fuel development will be allocated to deepwater and harsh environment projects. Although the price for oil may continue to exhibit volatility in response to, e.g., uncertainty about future output from the major oil and gas producing countries, interest rate changes, geopolitical events and global economic growth, we expect prices to remain at levels that are robustly supportive of investment in deepwater and harsh environment exploration and development projects.
Significantly reduced offshore contracting activity during the previous downcycle has also resulted in a much smaller marketable global fleet of floating rigs available to meet the current upcycle expected customer demands, specifically with respect to the highest specification drilling units preferred by many of our customers for their projects. In recent quarters, marketable supply and demand for deepwater and harsh environment rigs has become more balanced. Customers are now planning further into the future to ensure availability of rigs for their drilling programs and signing contracts with longer lead times and durations, as well as higher dayrates. Our customers continue to pursue offshore projects in deepwater and harsh environments where rates of return and production volumes are anticipated to be very attractive, which is reflected in the resumption of postponed projects, commencement of new drilling and exploration campaigns and extensions of current drilling campaigns.
Offshore drilling activity is increasingly robust in every major ultra-deepwater geographic sector. Several new exploration and development programs have commenced as our customers return their focus to reserve replacement. Consequently, tendering activity has improved meaningfully during 2023. Several multi-year tenders and direct negotiations for work in Brazil, West Africa, North America and Australia have already been awarded this year and many tenders still remain active and yet to be awarded as we enter the second half of 2023.
South America, the Gulf of Mexico and, increasingly, Africa remain key ultra-deepwater market sectors. In the last 18 months, we observed significant increases in dayrates for projects in the U.S. Gulf of Mexico and Brazil. These trends are expected to continue and expand to other deepwater sectors. In Norway, the largest market for harsh environment rigs, we forecast that only a limited number of new projects will commence before the end of 2023 but anticipate demand for rigs in this market sector will accelerate
Kengeo,
Laherrere estimates about 315 Gb of future offshore output (both shelf and deepwater). Let’s take a conservative estimate of 3000 Gb of URR for C plus C with roughly half already produced, that suggests 315/1500=21% of future resources will come from off shore output and only about 43% of the future offshore output will be deep or ultra deep water output (135 of 315 Gb). So only about 9% of future World output comes from deep water offshore (water depth greater than 125 meters). Much of future oil output has already been discovered and is either 2P reserves or contingent resources, offshore C plus C output is about 17 Mb/d, about 21% of World C plus C output with deepwater ( more than 125 meters depth) about 9 Mb/d or about 11% of World C plus C output.
My guess is that deepwater 2P reserves are roughly 10% of the total World 2P reserves.
Death by EUR and why long laterals are useless . Mike S .
https://www.oilystuffblog.com/single-post/death-by-eur?postId=9eb2e536-4ec6-4616-8d3b-b9b805a2e3fa&utm_campaign=717438fd-cc1c-41f9-a0ae-f65085213ad1&utm_source=so&utm_medium=mail&utm_content=1ffab35a-6f10-4b7d-ae2a-8221579c65d0&cid=fa335351-37bb-44a6-9899-f8c34b4a0f81
Great post by Mr Shellman. I have been saying for a while that EUR per foot of lateral should decrease as lateral length increases beyond some optimum length of perhaps 9 to 10k.
For oil producers they may consider profits first and recovery factors second. So if CAPEX per foot of lateral drops by 15% for a 15k lateral well compared to a 10k lateral well and EUR for oil, gas, and NGL and the revenue associated with that volume of output drops by less than 15% then profits increase.
A problem with this type of analysis is that it depends on future prices which are not known. In general rising prices over time would make it less likely that the longer lateral well will be more profitable than a shorter lateral well. I expect this may be true for the next 7 years or so and agree with Mr Shellman that the longer lateral horizontal tight oil wells are a bad idea both froma profit perspective and conservation of resources perspective.
Dennis
Shouldn’t economics be the consideration as to whether to drill a 10k lateral or a 15 k lateral. One needs to know the marginal cost of drilling the next 5k ft and the extra barrels of oil it produces.
Considering the growth in 15k laterals across the Permian, my guess is that the marginal costs and barrels oil must be making the case to drill the the next 5k ft.
Just saying.
Ovi,
The oil companies seem to believe tat to be true. Whether they are correct depends on future oil, NGL, and gas prices. Those are not known. The guesses of oil companies may or may not be correct.
I wish someone would take Mike’s column and run it through the Expert–>Dumbass translator so that we all can appreciate it. It get it–I think. Maybe 50%.
Why shorter is better . Mike S .
https://www.oilystuffblog.com/forumstuff/forum-stuff/shorter-can-be-better?origin=notification
One Vito lease was reported as starting on 14th February with production for that month of 25000 barrels from 13 days on-line. 2 kbpd is disappointing production for the first well in a new greenfield development (usually the most prospective location is brought on first). It showed a very low GOR of 208 (most GoM wells are around 900 to 1200), but a single reading is not enough to make any inferences yet. Later months and the other two leases have no reported data yet.
George
Thanks for the update. I have been searching for Vito news, but no luck. The STEO is showing a big spike for July. Could that be a second well in Vito or something else.
I’ve seen no evidence that the STEO has any predictive skill for the GoM so I don’t give it much credence. A couple of months ago it had May above 1900 and July low. It seems to take a fixed pattern and move it along each month, except for the hurricane dip, which it holds static. It is not a bottom up analysis.
If the Vito well did have problems they will have been doing everything to fix it but it usually takes a few months, which might coincide with July. Another well was started in a second lease mid-March, which will add 15 kbpd at a guess, if it performs properly, and there could be others (a third lease, or another well in one of the other drill centres). But I think a larger increment is likely to come from additions at Mad Dog II (Argos) Two wells were added in April and seemed to be going OK, with more to come. Against that there is natural decline that takes out about 12 to 15000 a month, maintenance scheduling is unknown and opportunistic, and Kings Quay, which has been performing well above name plate, is cutting water quite quickly and could easily drop 25 to 40000 over a few months (and, for the future, hurricane season really gets going in the second half of August – the waters are so warm that any storm in the central and western areas will be pretty large and intense with a good chance of impacting a large portion of offshore production and drilling, and possibly a significant portion of refining or gas plant capacity on shore).
Hubbert sometimes gets a lot of stick and sometimes a lot of praise, mostly based on the preset notions of whoever’s opinion is getting stated, rather than from reading Hubbert’s work. Given the prevailing expectations at the time of his original paper he was very prescient in many ways concerning coal, oil and gas. Why his ideas were so revolutionary is strange, it seems pretty obvious that a finite resource has to follow some sort of bell curve for discovery and production, with zero at either end and a maximum somewhere in between. However he was miles off in his predictions about nuclear power, which was really the main subject of the paper: Nuclear Energy and the Fossil Fuels; Drilling and Production Practice, Vol. 95, 1956.
Hubbert was an extreme (read borderline nutjob) technocopian; at the time of writing the paper there were no full scale commercial fission reactors (Calder Hall started in October that year) but he confidently predicted nuclear power quickly rendering all other sources uneconomic.
He was aware of tar sands and shale oils (though the way I read things he lumped tight oil and kerogen together in this category) but excluded them from analysis because he considered that they would always be too expensive to develop compared with nuclear. His estimates for ultimate recoveries proved to be low, probably partly because he didn’t think we’d bother to go looking for much of it.
http://www.energycrisis.com/Hubbert/1956/1956.pdf
Peak oil so what?
15 years ago when Theoildrum was going strong Peak Oil was a serious issue. How could the global economy grow if oil production would start to fall?
Today however one of the main users of oil, has a viable alternative and is already making a difference to oil consumption in many countries.
https://insideevs.com/news/670599/uk-plugin-car-sales-may2023/
In the UK over 170,000 electric cars have been sold so far this year. Many driven by high mileage company executives, therefore having a disproportionately positive effect on petrol consumption. Already second hand electric cars with less than 30 thousand on the clock can be bought for under £20,000.
Next year, total plug-in sales will be over a quarter of all cars sold.
With consumption falling in Europe and other countries peak oil could well not matter.
It all comes down to EV sold and timing.
Charles,
Simon Michaux.
Electrification of light transport is an obvious response to oil depletion,
but it only one part of the oil depletion problem.
Adapting to a world with less oil derived products is going to be a very difficult and disruptive task.
So I guess Charles is planning to eat batteries? Farm with batteries? Make fertilizers with batteries? Push container ships around the world with batteries? Fly planes with batteries? Push 300 million commercial vehicles around the world with batteries? Lubricate engines with batteries? Mine and haul heavy loads of key minerals with batteries? Make plastics with batteries? Make pharmaceuticals with batteries?
While there are some things you can do with an EV (move people around), most of the critical economic activities require high energy consumption of diesel/jet fuels.
While a small group might use a little less oil, there are billions upon billions (China and India) using more oil everyday…26% of global consumption in 2022 vs. 13% in 2008.
Actually agriculture is on the cusp of abandoning the tractor for drones for many applications as possible, especially precision fertilizer and herbicide/pesticide applications. In some cases reductions in input use are up to 95%. From what I can tell. Most of these drones are electric.
https://www.techopedia.com/precision-farming-how-ai-and-drones-are-reshaping-agriculture
Kengeo
Your response shows how little you know of the subject. Firstly fertiliser is made with gas and so are plastics.
Secondly road transportation including hgvs use half of all oil consumption. Rail electrification could haul the long distances and electric hgvs can do the final short hops.
Farming uses less than 1% of oil consumption and governments will ensure farmers get the small amount they use.
Mining only uses about 2% of oil consumption so it Would be a long time before there is no oil for those two uses. Do you know how long the production tail is?
Small nuclear reactors have been used on subs and ships for decades
https://www.forbes.com/sites/jamesconca/2020/11/09/international-marine-shipping-industry-considers-nuclear-propulsion/
Also with good tram and train systems cars are simply not needed. I know several people who have never owned a car.
https://www.railway-technology.com/features/six-of-the-best-tram-systems-around-the-world/
https://heatmap.news/economy/tokyo-anti-car-pedestrian-paradise
The very long tail of oil production will be enough for aviation, agricultural and mining for a very long time.
Charles,
Your 1% figure for agriculture gives me a feeling of relief/optimism and makes me think the oil declines probably won’t be that bad. However, that figure looks too low. According to the link below, developed countries spend 3-4% of total oil consumption on agriculture.
Even at 1% declines a year this will be devastating to the economy if agriculture uses 3-4%. The US uses up to 6% for agriculture. Agriculture will rapidly crowd out almost all other consumption.
We’re going to have rationing and mass unemployment. Cue CBDCs & UBI.
https://www.climate-policy-watcher.org/plant-physiology/fossil-fuel-use-in-agriculture.html
If you add food processing to the equation, the ag sector uses much more of a percentage of the oil derivatives consumed.
And that is exactly of of the sector that will be a priority for continued ICE use.
It will help if we shift much of the light transport sector to electric, saving residual oil production for more important uses that are harder to replace.
ANON
It really depends on how quickly electric vehicles are rolled out.
In the U.K. the sale of new petrol and diesel cars and vans will be banned from 2030. There are interim targets for each year up TIL then. U.K. oil consumption should fall by about 3 or 4% each year.
Lorries can run on LNG and electric models are starting to come on the market.
https://www.volvotrucks.co.uk/en-gb/trucks/trucks/volvo-fh/volvo-fh-gas-powered.html
Much of the 3% you quote is transporting food in trucks and not used on farms.
Even in 30 years time the world could easily produce 10 million barrels per day. That would be plenty for agriculture and aviation.
However a ban on the sale of all new petrol and diesel cars need to be in place by 2030 to ensure sufficient time to electrify everything possible.
I am more concerned with soil erosion, deforestation and China and India burning 5,000 million tonnes of coal. All three of which has pushed global warming into the danger zone.
Charles , ” 10 million barrels per day ” . Society as we know it will dismantle long before we decline to 10 million barrels per day . EROEI is a bitch .
”International marine shipping industry considers nuclear propulsion.” Then, with lead cooled fast reactor with a pool configuration, pending the implementation of MSFR. https://www.gen-4.org/gif/jcms/c_42149/lead-cooled-fast-reactor-lfr
Here is the Achilles heel of the green energy revolution, as it currently stands: “Cobalt mining in Congo,” says journalist Siddharth Kara,”drags humanity back to a time when the people of Africa were valued only for their replacement cost.” Ponder that for a minute while you charge your Tesla.
Until the peoples of the world can, as a world community, condemn putting a ten-year-old kid down a rathole to scavenge for chunks of cobalt for a dollar a day–as long as some billionaire executive can sit in an air-conditioned office in the U.S. and pretend this isn’t happening–civilization is pretty well screwed no matter what the weather. This same thing is happening in a different way in China, where hundreds of shitty little coal-fired utility plants are producing electricity to charge electric cars. And by the way, don’t spare the UK and Germany. Both are burning poor quality coal while lecturing like a banshee to the rest of the world about searing the planet. The nickel smelters for the conversion of laterite to pure form spoil the air for miles around, including the air of nearby schools–to use less cobalt you have to use more nickel, at least with current battery technology.
Or on another note, this segue is to bring the effete Governor Gavin Newsom into sharper focus: The carbon pollution produced by a year’s worth of California wildfires neutralizes the effects of EV’s. And yes, the world is aware that you’ve been buying your “rescue electricity” from the Jim Bridger coal utility plant in Wyoming.
Mr. Hubbert may have been a borderline nut job, but he was right on the money with the salvation of the planet through nuclear, though maybe just not in the form he had in mind. Kenneth Deffeyes was about the most brilliant geologist of his time (basically discovered the utility of zeolites), and he confirmed Mr. Hubbert’s curves and enlarged on them. Matt Simmons was a bird of a different feather, but he too ran the numbers, took a look at what was happening to Ghawar, and made a very astute assessment: it was over.
And it would have been, were it not for shale oil and gas. It’s a damn shame we’ve run through the shale oil so carelessly, and it’s even a greater shame that if you didn’t have a volumetric reservation in a pipeline to take away your gas the Texas Railroad Commission allowed the venting and flaring of un-frigging-believable metric tons of pure methane gas right into the troposphere–the United States no longer has the moral high ground to lecture anyone, about anything. The bitter truth is we have no energy policy, and no one in control who knows light from tight or sweet from sour. There is no one smart in energy looking at what works, what the cost of an alternative might be, and how to go about it. Nobody in power has a clue what will happen. No one!
But hey, we’re going to get to find out, simply by running this giant rushed experiment. If what I have read here for the last several months is correct, we are running out of hydrocarbon sources faster than we’re generating new ideas about how to create electricity. And electricity shortages are surely coming. To the UK. To Germany. And even to the USA.
To wit: 1) The shale oils are peaking. 2) Connate water from 5 decades of seawater flooding the basement of Ghawar is now lapping seriously at the oil layer near the wellbore, meaning that depletion is in danger of assuming a logarithmic curve. 3) Russian Far East oil production is likely going to falter because of inadequate maintenance and replace of sophisticated equipment (except maybe Sakhalin II, which is more or less run by the Japanese). 4) We’re down to the pre-salts on the continental shelves of Africa and Brazil (which used to be under the same salt bridge before the supercontinent rifted), so there’s that.
On this site I see a lot of thoughtful pieces, but also a lot of arrogance and look at me bullshit, and a lot of cocky predictions about EV’s and renewables. Somehow I guess it has been lost in translation that thousands of poor people are being more or less enslaved by the cobalt trade–which was first overlooked conveniently by a few very wealthy people, whose souls must surely be endangered by the hypocrisy. The drilling for oil and gas is a dangerous situation but at least safety meetings are mandated and the workers are paid well.
In the race to out-self-righteous the next guy, perhaps we should first have a damn safety meeting. Hint: The cobalt would flunk, as would the laterite smelters and all of China, busily collecting environmental attaboys from John Kerry and the like. In point of fact, the UK would have flunked badly when Boris Johnson prepared his speech to the climate conference in Scotland by using lamplight generated by a coal plant.
Man, you can’t make this stuff up!
Thanks for shining a light on that problem (minus the political opinionations).
I suppose you are aware that there is a big shift underway towards EV batteries that don’t use cobalt-
LiFePo4. Lithium Iron Phosphate. Gaining market penetration quickly. Probably it will reach over 50% global market share later this year or next.
It is less energy dense (less range/weight), but cheaper and has much improved charge cycle lifespan.
For example-
https://www.caranddriver.com/news/a42860946/ford-plant-lithium-iron-phosphate-batteries-ev/
You and Mike S are neck-and-neck for “my favorite Jeremiah” here on POB.
Thanks for the cold slap across the face!
(We live not far from a high school and have to put up with the traffic when school is in session. The fact that in the US people think nothing of putting adolescent boys behind the steering wheels of 5,000-lb pickup trucks means that change, if/when it comes, is going to come the hard way.)
Gerry,
Anybody with illusions that the world is perfect, is simply not paying attention.
Lots of inequality in the World for as long as humans have been part of the story.
Gerry, point taken. However, if you think massive amounts of child slave labor is not also used in oil and gas mining worldwide, you are quite mistaken.
Large scale electricity storage will not be from lithium ion batteries over the long term. These are great for compact applications but grid storage has plenty of space to expand and use less energy dense batteries that use more common materials such as zinc, sodium, etc. the first utility scale flow battery is being installed in Georgia.
https://cleantechnica.com/2023/08/04/the-flow-battery-code-is-starting-to-crack-red-state-edition/
Dennis
You buying your electric car reinforced the horrific exploitation of children
That’s why I will stick with public transport
Charles,
Do you have a cellphone or laptop computer, perhaps both? If so you are part of the problem.
I agree with Gerry. If child labor laws were enforced in the USA …
Elon Musk would be in prison.
And to be clear I am pulling for renewable energy, but more humanitarian obviously.
https://www.mining-technology.com/features/australia-cashes-in-on-cobalt/
“Australia is already the third biggest cobalt miner, and with the world’s second biggest reserves the country is well equipped to sustain growth”
Australia has a COBALT industry. But I suspect the workers are making six figures not essentially working for free using the kids they have kidnapped.
thanks Gerry! your posts make this site more valuable
And remember this wisdom from THE GIANT:
If you think your life is tough, imagine being kidnapped as a kid and forced to work all day long every day for nothing in conditions that are torture.
Run and tell that!
Andre , ”
If you think your life is tough, imagine being kidnapped as a kid and forced to work all day long every day for nothing in conditions that are torture.
Run and tell that! ”
Thanks for rattling the cage . Sorely needed .
+1
Another line of evidence for ~2016 Peak in Global Oil Production:
Trade Movements, taking the export land model aspects into consideration, it’s possible that trade movements decline at much higher rates (5-10%).
Sorry about the busy figure, lots to look at though…
Kengeo,
Conventional oil output peaked in 2016 not 2007.
That’s a great forward looking indicator. Obviously depleting production will hit export first. Combined with ever increasing domestic consumption, export declines would be an amplification of production declines. Probably the overall effect would be net exports of all products declining as countries are forced to address domestic needs and can no longer afford trade. Of course that will mean collapse of infrastructure which is completely dependent on global trade movements.
Hello JT, I have recently written a free e-book titled “The end of global net oil exports. What really matters in the Peak Oil debate”. It might interest you, I namely come to similar conclusions as you. The timeline can always be debated, though, and I’m not dogmatic. Here is a link to my book on Internet Archive:
https://archive.org/details/oil-exports.-34odt-1
When we get to a time where oil products such as diesel are not available to importing countries at adequate levels we will first see prices rise steeply.
Bidding wars for deliveries will become commonplace.
It is easy to then see the development of ‘favored nation’ importers who will fall into line on the geopolitical framework of the exporters,including countries such as Iran or Russia.
Seems like a setup for rapid rearrangement of the tables, considering how important diesel is.
Mr Larsen , downloaded the book and skimmed some pages . Interesting work . Going to go thru it during the weekend . Tks .
Broken down by region, 2005-2022:
Aug 4 Rig and Frac Report
Rigs are moving out of the Texas Permian and into the NM Permian. Is this saying something about Midland and Martin vs Lea and Eddy. Note the steady decline in Texas rigs while NM has held steady.
– US rigs down 7
– Texas down 10, Tx Permian down 7, EF down 2
– NM up 3
– Total Permian, down 4
Frac Count Down 11
This will start to show up as a drop in production in about 3 to 6 months.
Frac count is now up 1 from two months ago and up 7 from 7 months ago and down 43 from November 25, 2022.
Opec+ Production Falls Sharply in July
London, 4 August (Argus) — Opec+ production dropped by more than 1mn b/d in July, according to Argus’ assessment, as Russia finally delivered on its promised cuts while Saudi Arabia came close to fully implementing its additional output reduction.
OPEC was down by 820 kb/d while Non-OPEC was down by 290 kb/d, for a total of 1,110 kb/d. Note how Iran is now producing 3,040 kb/d. Also note the discrepancy for Iran between the MOMR and Argus.
June MOMR for Iran: 2,754 kb/d. Argus 2,950 kb/d, 196 kb/d higher.
Russian output dropped by 200 kb/d and this is why their cutback has been reduced from 500 kb/d to 300 kb/d.
https://www.argusmedia.com/pages/NewsBody.aspx?frame=yes&id=2476506&menu=yes
Latest from Germany .
CEO of Lanxess, a large German M-Dax listed chemicals company, warns “the de-industrialization is beginning. The federal government must wake up” in Germany.
Any answers ?
EnergyCynic
@EnergyCynic
So explain to me.
If shale era has peaked.
And rig counts are aggressively falling in North America as WTI is >$80.
How is this bullish for North America oilfield services?
Aren’t we massively overbuilt for a market that is now shrinking?
8:50 PM · Aug 4, 2023
·
Seems so…
“Coterra made $209 million in profit for 2Q23, versus $1.2 billion in 2Q22. Why the drop in profit? The crashing price of natural gas over the past eight months or so. Coterra received an average of $5.54/Mcf (before hedges) for its Marcellus gas in 2Q22, and $1.78/Mcf in 2Q23, a drop of 68%. Ouch. During a conference call with analysts, company management floated a potential plan to free up around $200 million from Marcellus operations in 2024 and reallocate it to other plays (the Permian or the Anadarko) by continuing to run just two rigs and one frac crew in the Marcellus.”
Since Rig Count peaked in 2018 at 1,083 rigs it’s been a steady loss of rigs.
A big drop of 25% occurred between 2018-2019 (813 rigs in 2019).
More recently, since May 2023, rigs dropped from 784 to 659 (19% over 3 months).
If that extreme trend were to continue then we’d be at ~400 rigs by next year…
Part 3 of Nate Hagens “Just stop oil ” You can also watch Part 1 and 2 . 30 minutes each .
https://www.youtube.com/watch?v=EhOhfRrvYI0&t=3s
From Part 2;
We humans have outsourced our decision-making processes to The Market.
That is a frigging brilliant summary of our predicament.
Mike B,
Can you suggest an alternative.
Not outsourcing our decision-making process to the Market, in the same way that I prefer not to leave things to natural selection. The The Market sits cheek-by-jowl with social Darwinism.
But Nate would say that the point is moot. That horse is long out of the barn.
Mike B,
Be specific, are you suggesting a feudal social system, a slave system, or a socialist system as existed in the Soviet Union. Those are the systems that have existed to date. We are a little beyond the small hunter gatherer type system as it is not likely to work well with a planet filled with 8 billion humans. So your alternative to well regulated market capitalism is …?
why would “systems that have existed to date” – which is not even exhaustive and mainly limited by market capitalism itself – be any sort of litmus for a decision of how humanity in 2023 should be organized. at the time of the Russian Revolution peasants were using tools and farming techniques laid out in the Bible. to believe that would be the foundation from which you could establish a new economic system is so thoroughly dumb it must obviously be made credulously.
Twocats,
Then present an alternative. Yes the list is not exhaustive, it is very general and focused on European social systems for the past 2000 years or so. I am not suggesting there isn’t something better, simply that social systems from science fiction often don’t work well in the real world. A well regulated representative democracy with highly progressive income taxation and provision of services with positive externalities by governments and regulation of negative externalities by governments with scarce resources allocated by markets is about as good as the World has done so far.
If you have ideas for a better system, present it. Claiming you know what it is, or that it is obvious what it would be, is rather unconvincing.
“often don’t work well in the real world” – no kidding, ask guatemala, iran, vietnam, north korea, el salvador, chile, brazil, drcongo, phillipines, greece, italy, indonesia to name just a few countries for whom “alternatives” didn’t “work so well”. you are the one living in a fiction – not me.
my alternative? massive climate change catastrophe and severe energy shortages.
One of the biggest issues with the idea of a Socialist economy was the fact that there was too much data that would need to be collected fairly close to In Real Time to feedback properly up and down the materials, manufacturing, et al chains. Allende wanted to try it – Alternative Destroyed with Extreme Prejudice. But it’s no longer theoretical. As just two examples Walmart and Amazon have solved many of these issues a while ago. Which, just a reminder, was THE PRIMARY argument against Socialism 100 years ago.
https://www.versobooks.com/products/636-the-people-s-republic-of-walmart
I’m not offering a full solution with a short post on an oil blog – I’m just saying the “roadblocks” to socialism have *mostly* been removed and in many areas – staples retail, medicine – a socialist economy could be erected fairly easily. And for more luxury items or procedures (e.g. cosmetic plastic surgery; “cut the line” services) those could easily be allowed to co-exist and would spur needed innovation (e.g. medical devices, pharmaceuticals).
Two cats,
The main problem is deciding how to allocate resources and who decides. A market system allows individuals to communicate their needs by means of the market, I have never heard of a better system. Socialist nations have government bureaucrats deciding how to allocate resources and generally does not produce the things that people want in adequate quantities. Walmart and Amazon both respond to market signals indicted by prevailing market prices and both essentially operate in a fashion that maximizes their long term profits. This tends to lead to optimum outcomes, particularly in well regulated democratic capitalist societies.
“We’ll regulated democratic societies”
The allocation of resources will go to whoever has the largest lobby. Basically whoever can pay off the political system. Which is what is happening now. My bet is the last drop of distillate goes to the air industry not the farmer.
“My bet is the last drop of distillate goes to the air industry not the farmer.”
That would be an example of very poorly regulated capitalism,
which is generally what we have had in the USA.
The biggest failures of regulation have been-
failure to reign in political lobbying
failure to limit to the extreme accumulation of wealth among the very few
The so called “market” is highly dependent on how money is created and destroyed. We can change the way money values things by changing the way money is created. That’s why I no longer believe in floating exchange rates.
I liked the image and comment by Art on the above video of Nate .
“Watch
@njhagens
most compelling “Frankly” so far
Just Stop Oil !!?? Part 3
10 Pathways to Post-Growth
Our energy future & the Four Horsemen of the coming decade
I still have a lot of empathy with the old horsemen image. Number two above still translates directly into war, the others are a reflection of our present society, when they start to fray and decay, the traditional horsemen will emerge to do the dirty work.
Consider HIV/AIDS – 100% mortality, no cure available despite billions of dollars of investment. Present strategy is to hold it at bay with a complex cocktail of antiviral drugs ( reasonably successfully ). What happens when that supply chain fails? You can attribute it to a failure of complexity, but it is that old horse pestilence who will do the dirty work.
What if I told you that the world could erase 1% of its electricity needs in one fell swoop? That’s a lotta kilowatts, baby! Can you imagine how much cooler the world would become?
I keep handwritten notes on energy statistics. I check those notes from time to time; it’s like smelling an aged cigar to have with my bourbon on a down day. At the end of 2020, Bloomberg figured out that cloud computing utilized, at that point in history, at least one-percent of world’s electricity–and it’s gone up a lot from there. At that time something like a quarter of a trillion dollars a year went to just a few entities: Google, Amazon, Microsoft, Apple, Facebook.
And since data storage (of some important stuff, granted, but mostly junk) grows exponentially, Bloomberg made the estimate (again about 3 years ago) that the world would exit this decade with a whopping 8% of electricity going to out-of-the-way data storage centers hidden, as it were, behind a cloud of deception.
And yet Bill Gates has the audacity to fly over to China on his private jet and sit down and praise President Xi while lecturing to the rest of us that we are immorally frying the planet with our Ford pickups? And Tim Cook still has the iPhones put together by Uyghurs under the bondage of slavery, despite all the outrage here at home over the last clever experiment with slavery?
I submit to you, folks, that we’re looking under the wrong tree for Newton’s apple. We have some of the richest people in America selling their souls–using ours as collateral–to the Chinese Communist Party. And oh, by the way, the IEA just released its figures. The world burned a new record 8.3 BILLION metric tons of coal last year. China burned 53% of this. But if you dare mention anything provocative or counter to established parley on this goody-two-shoes site, someone like Hickory will reprimand you for expressing a political opinion. It’s not an opinion on politics, Mr. Hickory, but on sanity.
Peak sanity, perhaps. Make a damn nice blog for a discussion had by xenophobic old fools.
Hickory has his beliefs and they are not to be questioned.
Ervin,
Maybe we let the market decide what is important. Often we hear reports of how bad things are for workers in less developed nations. When interviewed these workers often say they are happy for the opportunity to make a living at whatever terrible task they are perfoming for a wage. If the situation is unhealthy or unsafe, it is either up to individuals to decide not to do it, or to elected officials (in democratic nations) to enforce laws to keep workers safe.
Inequality exists in the World, this is a fact that is not likely to change in the near or perhaps even the long term. Hoping it will change, but not optimistic it will.
Ervin, yes I have opinions/beliefs and by all means feel free to question them. Completely free.
And I will feel free to return the ‘favor’.
More importantly, I relish the chance to learn new perspectives, especially when the are heavy with factual information. I work in a field where only hard factual analysis matters. I would be worthless without being excellent at it. Rather, I have more work than I could do 24/7/365 if I wanted to, from any location in the country that had broadband and electricity.
I really think the energy, hardware and labour that the cloud is using, and the centralization of cloud works against itself medium and long term…
https://www.linkedin.com/posts/eduardflorinescu_i-really-hope-that-this-is-not-really-the-activity-7093938683879333889-lZKe
Permian basin well profiles normalized for lateral length Output per 10000 feet of lateral length. Using data at page below for average lateral lengths and Novilabs data for average well output per year.
https://www.eia.gov/todayinenergy/detail.php?id=54079
Not much change from 2016 to 2020.
Chart above is tight oil output only in barrels of oil (I mislabelled chart as kbo, it should be barrels of oil per 10 thousand feet of horizontal lateral), natural gas and NGL output is not included.
FRANKFURT, Aug 2 (Reuters) – Germany’s energy use dropped 7.1% in the first half of 2023, as high prices and difficult economic conditions more than offset the effect of refugees boosting population numbers, industry statistics group AGEB said on Wednesday.
Usage in Europe’s biggest economy fell to 189.7 million tonnes of coal equivalent, an industry standard measure, compared with 204.3 million recorded in the first six months of 2022, AGEB’s January-June report showed.
UNNKN , thanks for this update . I have been chronicling about the deindustrialization of Germany for about 2 years . This only confirms my observations . RIGOR MORTIS has now set in for the German economy and ” as goes Germany. so goes the EU ” . In 2022 the EU spent Euro 700 billion in subsidies for energy . This will be repeated in 2023 ( maybe a warmer winter due to El Nino will mean lower figure ) however ” you can run but you can’t hide ” . There will be 2024 and 2025 . In my homeland we have a saying roughly translated ” How long can the lamb pray before it is sacrificed ? ” Tragic .
Germany again .
” OUCH! German industrial woes endure as output drops to 6mth low. Industrial output plunged 1.5% in June MoM on the back of weak manufacturing & even weaker construction. In Q2, output almost completely gave back the gains seen in Q1. Rock-bottom corp sentiment in manufacturing & construction give little reason for optimism.
https://bloomberg.com/news/articles/2023-08-07/german-industrial-woes-endure-as-output-drops-to-six-month-low?utm_source=website&utm_medium=share&utm_campaign=twitter?sref=R17xFhjo
11
Well I have not missed much, still a lot quoting and highlighting those with a long history of failed analysis and projections. Several names come to mind but no need to single them out. Worth noting, feeling good about ones ideas are not the same as being right, as in accurate. Many here put being accurate near the bottom of their goals.
Claiming a victory with my price projection, we currently are bumping up against the reaction high of the first OPEC cut announcement last April. Seems the market was not taking the announced cuts seriously. I will go on record…. we are going to $90 for WTI. The drop in rig count and the heat wave in the south is slowing whittling away nat gas injections as we remove the market imbalance brought about by the Freeport LNG plant shutdown. We may go into a cold winter (by early forecasters) with a modest storage surplus over the 5 year average. I anticipate higher prices over $3 perhaps $3.5. Once we get back over $4. I think we will start to see rigs coming back on line.
I think many here may be missing a key element in the dropping rig count. Some suggested above that is was lack of locations, it is not. It is economics. Coming out of covid many large operators had favorable contacts for drilling and completion cost as well as an inventory of supplies from the shut down time. When those materials were used up or those contracts had expired the economics of $70 oil had changed, it was no longer profitable for new drilled wells with the huge increase in materials price and labor, hence the drop in rig count. As these rigs are stacked and as the price of pipe and materials dropped materially ,new contracts will be made new supplies will be purchased and the industry will get back to normal. At $85-90 most of the operators will make a great deal of money.
I have mentioned this before, many here, if they care about being accurate rather than just spreading feel good BS, watch the midstream guys, listen to the company conference calls expand your data base. You will end up with a better understanding of what is actually going on. I am going dark, things to do.
OiI and gas business are in a golden age golden age and with the help (some many say Corrupt) policies of the Biden administration we will be for several years.
CTA’s are max long positioned. They getting ready to sell and lock in profits. Oil prices are going lower.
This move will coincide with a move lower in the stock market and lower bond yields which the machines are max long stocks and max short bonds and will be covering shorts and taking profits.
Going to see liquidity dry up some and lower oil prices.
This article post dates my post from yesterday but makes a number of the same points. But per usual you got it from me first 😎
https://oilprice.com/Energy/Crude-Oil/New-Research-Could-Make-Shale-Oil-Production-Cheaper.html
second a great article on Harold Hamm. I post it because of the contrast of those sitting around waiting for the world to end like an old bar at midnight seaking the companionship of like minded souls downing their misery and those who see opportunity around every corner. The artificial could have been about Elon Musk, Steve Jobs or any one of the many folks who contributions make the rest of our live so much better, the point would be the same.
https://www.worldoil.com/news/2023/7/31/u-s-shale-pioneer-optimistic-despite-declining-production-forecasts-in-prolific-basins/
The oil and gas industry does not sit on its back side rather we are ever evolving with new ideas new methods. The future is bright. Just wish I was younger. Of course you can follow the ones that said it can’t be done like our local oil expert here… but then what does that say about your collective reasoning abilities?
HHH one day you may be right just like a broken clock. BUT not this day.
SPR Today
Mr B is at it again . The mirage of abundance . 9 minutes read .
https://thehonestsorcerer.medium.com/a-mirage-of-abundance-de45805fa65a
In the same vein . The mirage . Prof Michael Hudson calls it the “Potemkin economy ” .
Winning ’23 style:
Credit card debt at a record $1 trillion w/ the highest interest rates ever.
Car affordability at all time lows.
Housing affordability at 37 year lows.
But no recession cause the government is blowing a massive deficit.
The future is bright cause it’s on fire. — Sven Henrich ( Northman trader )
Credit card debt at a record $1 trillion w/ the highest interest rates ever.
Car affordability at all time lows.
Housing affordability at 37 year lows.
But no recession cause the government is blowing a massive deficit.
This pretty much sums up most of the world. Not sure what the future holds, but so far its continuing towards this direction. Something needs to break for it to change direction.
Item:
Ukraine oil consumption Dec 2022 200K bpd. 50% reduction from 2011. Most of decline pre 2014. No clear reason.
2021 pop 44M so per capita consumption 0.0045 barrels/day. Compared to similar pop Poland 578K bpd. Or Canada 10X more.
The oil numbers are after a year of war. The consumption decline was already in place pre 2014.
Puzzling. War isn’t burning oil.
Watcher
Their refineries are probably not working as hard due to natural reasons, but product imports are probably sky high. And, the front line is fluid. Who is measuring what? Just some thoughts.
WSJ , behind paywall so an excerpt copy/paste .
Energy companies scramble to attract engineers as young workers fret over climate and job security
At U.S. colleges, the pool of new entrants for petroleum-engineering programs has shrunk to its smallest size since before the fracking boom began more than a decade ago. European universities, which have historically provided many of the engineers for companies with operations across the Middle East and Asia, are seeing similar trends .The number of undergraduates pursuing petroleum engineering has dropped 75% since 2014: Texas Tech. It’s a trend that has continued even as other recent studies have shown that the average graduate earns 40% more than a peer with a computer science degree ”
yeah , better to color your hair, pierce your face and be an influencer .
“yeah , better to color your hair, pierce your face and be an influencer”
It’s the only thing they can afford to do. With the exception of questioning your self identity in someway.
What is going on here?
The EIA’s August STEO is just out.
They have revised everything way up. The data through May is correct, exactly what the Petroleum Supply Monthly has. But they seem to think US C+C production is about to take off.
I think the messege here is:
– Remain calm, all is well, ALL IS WELL, courtesy Animal House:
https://www.youtube.com/watch?v=zDAmPIq29ro
So don´t disturb the stock/bond/treasury markets please.
Ron, it is time for EIA to put a damper on oil prices. Cant have everyone expecting shortages. Biden needs lower prices until November 2024. That is all. Falling rig numbers and fewer frack crews dont matter.
Good theory C185, but I am not a conspiracy theorist. I don’t believe for one minute that Biden told the EIA to fudge the numbers.
EIA sees OPEC-13 crude oil production down by 645kbpd m/m to 27.62mbpd in July. M/M changes: Saudi Arabia -750kbpd, Nigeria -60kbpd, Iraq +70kbpd. EIA forecasts OPEC-13 production averaging 28.06mbpd (was 28.03) in 2023 and 28.50mbpd (was 28.49) in 2024. ……. From Giovanni Stauvono
Vis a vis above, the EIA mostly listens to the biggest energy company CEO’s, and they’ve been saying at every opportunity that their production is increasing. So it very likely will.
Occidental has shown us better than anyone that it’s possible to front-load these new Delaware wells and increase production throughout the first year. Prices are rising, unless something unexpected occurs. At say $90 crude and $3.50 gas, quite a few of these hyper-stimulated wells would pay out in the first year.
After that, the decline curve may be sharper and the ultimate recovery may drop, but this has become a short-term game: make hay while the sun shines. Part of that is due to the administration’s acknowledgement that they’d gleefully whack domestic oil and gas at the earliest opportunity.
It has been said that the Permian has nowhere to drill and is in its death throes. That’s not totally the case, but what most certainly is the case is that when they drill a Delaware well with a WOR of 8:1, an awful lot of produced water has to be toted to Texas, which gives the term interstate commerce a bad name. It’s amazing that, after a hundred years of Texas and New Mexico fighting over water, Texas has settled for the brine.
But oh well, that’s beside the point. For now, hell or high water, production is going for broke.
https://oilprice.com/Energy/Crude-Oil/The-Imminent-Peak-In-Permian-Oil-What-Does-it-Mean-For-Investors.html
Tight oil production set to decline.
Conventional Discovered Oil and Gas Volumes Falling to New Lows
Despite rising investments in conventional oil and gas exploration, discovered volumes are falling to new lows.
That’s what Rystad Energy research shows, the company highlighted in a new release sent to Rigzone, adding that its estimates show that in the first half of 2023, explorers found 2.6 billion barrels of oil equivalent (boe), which the company said was 42 percent lower than the first half of 2022 total of 4.5 billion boe.
Rystad revealed in the release that 55 discoveries have been made from January to June this year, “compared to 80 in the first six months of last year”. The company noted in the release that this means discoveries in 2023 have averaged 47 million boe, which it said is lower than the 56 million boe per discovery for the same period in 2022.
In the release, Rystad stated that, “in the hunt for new resources”, exploration companies are prioritizing the offshore sector. The offshore industry accounted for about 95 percent of exploration spending this year to date, but only about two-thirds of discovered volumes, the company highlighted in the release.
Very long article. Click on blue headline to read it.
Oil output inches up at top US shale firms, with faster growth elusive
HOUSTON (Reuters) – Top U.S. shale oil producers are raising output by pulling more from each well but lack the level of activity to add significant new volumes, a Reuters analysis of investor forecasts showed.
The companies that a decade ago upended global oil and gas markets and turned the U.S. into an oil-export powerhouse in recent years have been less of a factor because of a shift to maintain, but not significantly expand, their production.
Mike Pence’s Energy Policy for the US
President Pence will set a clear goal of overtaking China as the world’s number one energy producer. By 2040, the United States can meet the energy demands of our own country while becoming the world’s top supplier of energy.
I wonder if the intent really is “energy” or “oil and NG” since his efforts are aimed at more drilling on govt lands.
“The very first thing that President Pence will take on to spur domestic energy production is to order agencies to unwind the myriad of regulatory and legal roadblocks created by President Biden. This Administration has systematically slow-walked oil and gas leases around the country while simply canceling other lease sales. In addition to withdrawing more areas in Alaska from oil and gas development, Biden has repeatedly delayed required federal plans for offshore oil and gas leases and halted construction of pipelines.”
https://mikepence2024.com/the-pence-plan/energy-expansion/
Ovi , one word ” nonsense ” . My dog has a better chance at getting elected . 🙂
Disclaimer : I don’t have a dog or cat .
US could drill faster and farther if funding was directed to the E&P industry
with the effect of running out of domestic oil and gas more quickly.
If that is the goal.
Preserving these resources should be the objective, not squandering them.
We agree.
Tell that to those who want to drill drill drill.
2018-2021: Longer laterals in the Permian = ⬆️ peak production rate, but at the cost of ⬆️ decline rates.
2021-2023: Lateral length still ⬆️ yet rapidly degrading acreage = ⬇️ peak production rate + alarming mid-life declines (month 8 to 14) + highest ever 1-year decline! 🛢💰— Shubham Garg
HIH
Attached is a similar chart.
Peak 2 month production for 2021 wells 903 b/d (Same as chart)
Current 2023 wells 800 b/d. Down 11.5%
Not investment advice but olive oil is the new gold .
My very personal oil shock — olive oil, that is.
How bad is it? Last week, the benchmark wholesale price of extra virgin olive oil surged to an all-time high of $8,500 per metric ton, more than double a year ago.—- Javier bias
Now that is serious!!!!!
India has banned the export of commercial quality rice , only exports of luxury Basmati rice . Price has shot up by 50% since 2022 . India was the largest exporter at 40% followed by Thailand and Vietnam at 15/16% each share of the world market . Watch this space .
US oil production remains on a flatline trajectory over the last 10 months and is now back to levels first hit in 2019!
Oil rig counts are ⬇️ 16% + frac spreads are ⬇️ 14% from their late 2022 peak, further impacting production decline mitigation and growth going forward. 😈🛢️💰—- Shubham Garg
HIH
Not clear from where this person gets his info.
US July 2022: 11,844 kb/d
US May 2023: 12,662 kb/d
Increase of 818 kb/d over 10 months. Not what I would call flat. Check the first chart in this post
April Non-OPEC and World Oil Production post will be out close to 5:00 PM EST.
A new Non-OPEC and World Oil Production update has been posted.
https://peakoilbarrel.com/april-non-opec-and-world-oil-production-drops/
A new Open Thread Non-Petroleum has been posted.
https://peakoilbarrel.com/open-thread-non-petroleum-august-10-2023/