By Ovi
Below are a number of Crude plus Condensate (C + C) production charts, usually shortened to “oil”, for Non-OPEC countries. The charts are created from data provided by the EIA’s International Energy Statistics and are updated to April 2023. This is the latest and most detailed world oil production information available. Information from other sources such as OPEC, the STEO and country specific sites such as Russia, Brazil, Norway and China is used to provide a short term outlook for future output and direction for a few of these countries and the world. The US report has an expanded view beyond production by adding rig and frac spread charts.
Where STEO data was used, the ratio of C + C to All Liquids was calculated. The average for the last six months was used to project the May and June production numbers in a few cases.
World oil production and projection charts are presented at the end of this post.
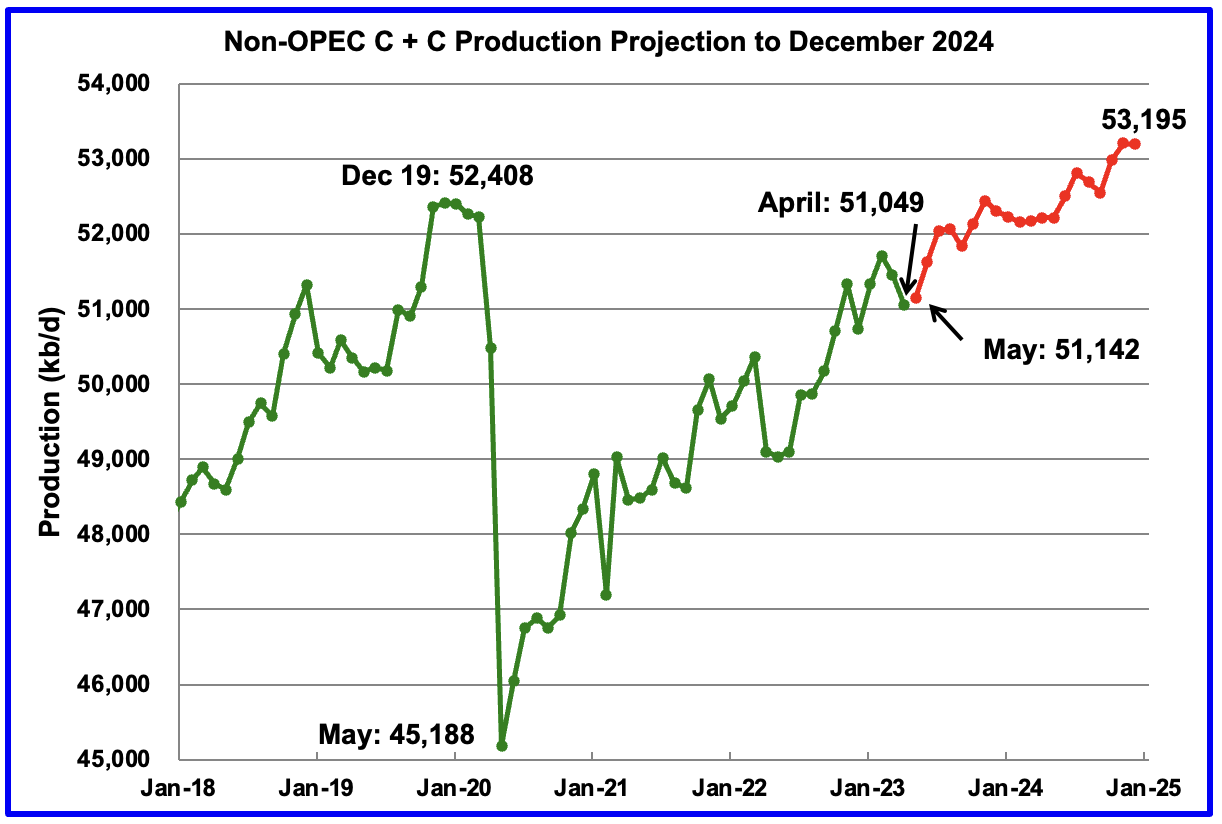
April Non-OPEC oil production dropped by 407 kb/d to 51,049 kb/d. The largest decreases came from Canada, US and Russia.
Using data from the August 2023 STEO, a projection for Non-OPEC oil output was made for the period May 2023 to December 2024. (Red graph). Output is expected to reach 53,195 kb/d in December 2024, which is 787 kb/d higher than the December 2019 peak of 52,408 kb/d.
From May 2023 to December 2024, oil production in Non-OPEC countries is expected to increase by 2,053 kb/d, a seemingly unrealistic forecast. According to the STEO, the major contributors to the increase are expected to be the US, close to 600 kb/d and Canada close to 700 kb/d, both estimates considered to be on the high side.
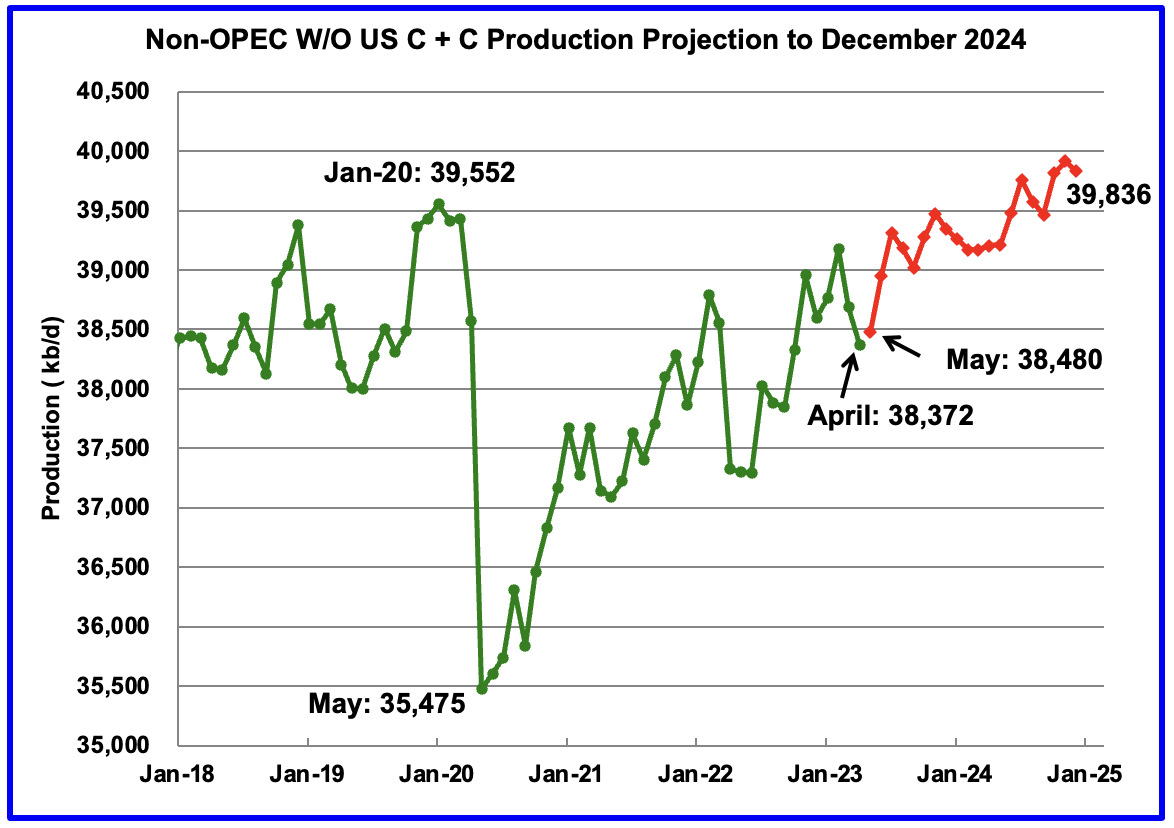
April Non-OPEC W/O US production dropped by 314 kb/d to 38,372 kb/d. May production is projected to increase by 108 kb/d.
From May 2023 to December 2024, production in Non-OPEC countries W/O the US is expected to increase by 1,356 kb/d.
Note that December 2024 output exceeds the pre-covid high of 39,552 kb/d in January 2020 by 284 kb/d.
Non-OPEC Oil Production Ranked by Country
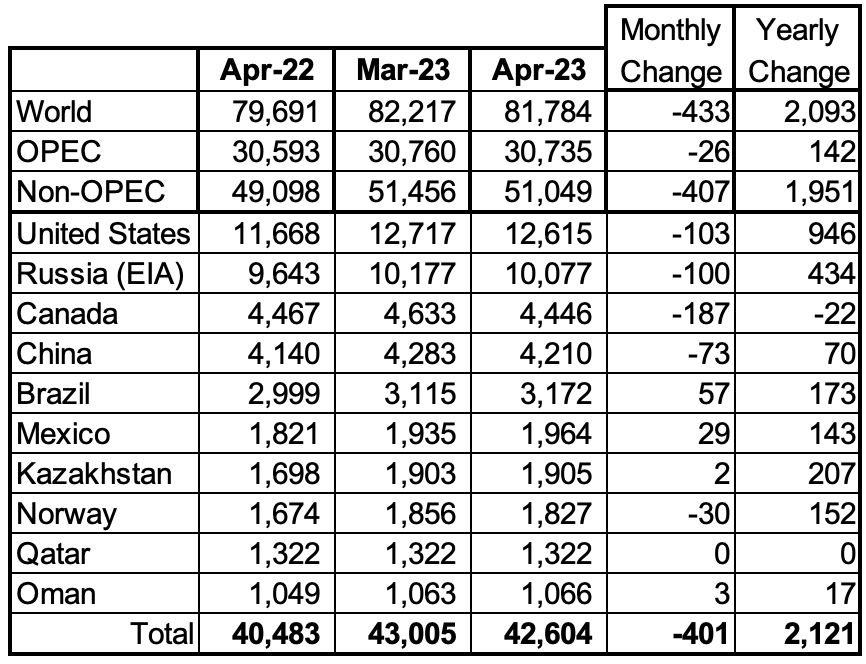
Listed above are the World’s 10 largest Non-OPEC producers. The criteria for inclusion in the table is that all of the countries produce more than 1,000 kb/d.
April’s production drop for these ten Non-OPEC countries was 401 kb/d while as a whole the Non-OPEC countries saw a production decrease of 407 kb/d. The top 4 producers had a combined output drop of 463 kb/d.
In April 2023, these 10 countries produced 83.5% of Non-OPEC oil production.
OPEC’s C + C production decreased by 26 kb/d in April while YoY it increased by 142 kb/d. World MoM production decreased by 433 kb/d while YoY output increased by 2,093 kb/d.
Non-OPEC Oil Production Charts

The EIA reported that Brazil’s production increased by 57 kb/d in April to 3,172 kb/d.
Brazil’s National Petroleum Association (BNPA) reported that output in May and June increased and that June increased by 166 kb/d to 3,367 kb/d mainly due to new project start-ups, a new record high, red markers.
Much of Brazil’s upcoming 2023 production growth of close to 100 kb/d will come from the highly productive pre-salt fields. From April 2022 to April 2023, production from the pre-salt fields increased by 173 kb/d.
According to the April 2023 IEA Oil Market Report: “We forecast supply to reach a new record high of 3.42 mb/d this year, up 300 kb/d y-o-y, as platform maintenance returns to normal scheduling and five additional FPSOs come online.“
According to the August OPEC MOMR: “Two new FPSOs started production during May, with Petrobras pumping the first oil from the FPSO Anna Nery installed at the Marlim complex in the offshore Campos Basin. According to Petrobras, the Buzios subsalt fields also received its fifth production unit, with the FPSO Almirante Barroso. Petrobras’ oil output fell by around 0.6% in the 2Q23 y-o-y due to losses from maintenance, in addition to the natural decline of mature oil fields and some asset sales. However, the crude oil output is expected to be supported by offshore start-ups announced at the beginning of the year.”
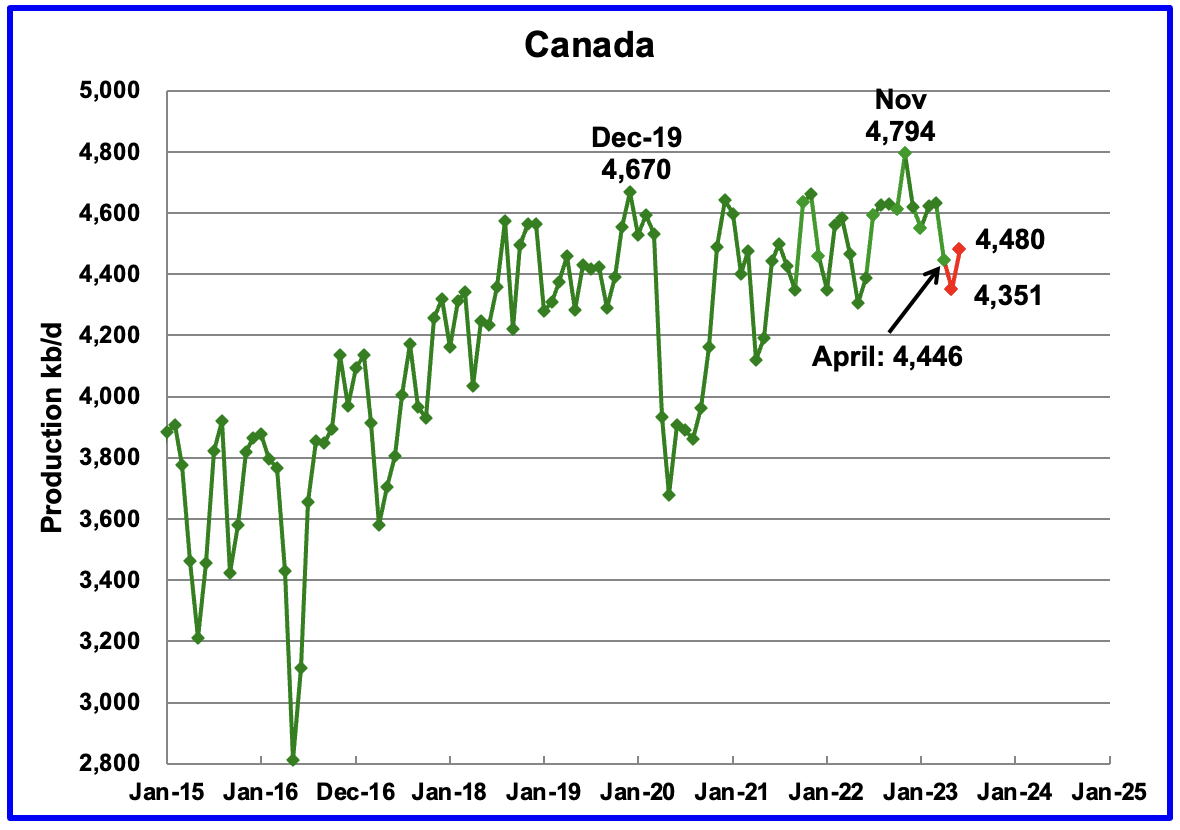
According to the EIA, Canada’s production declined by 187 kb/d in April to 4,446 kb/d. The May drop to 4,351 kb/d, along with April’s was due to significant maintenance at the oil sands mines and upgraders. The STEO is forecasting a production rebound in June to 4,480 kb/d.
According to the OPEC July MOMR : “Scheduled maintenance programmes during 2Q23 and 3Q23 are expected to soften output. It is the oil sands that are projected to be the main driver of Canada’s production through to the end of the year, driven by Kearl debottlenecking and CNRL (Canadian Natural Resources) Horizon optimization. Additionally, the Terra Nova Floating Production Storage and Offloading unit (FPSO) is expected to restart production in mid-2023.
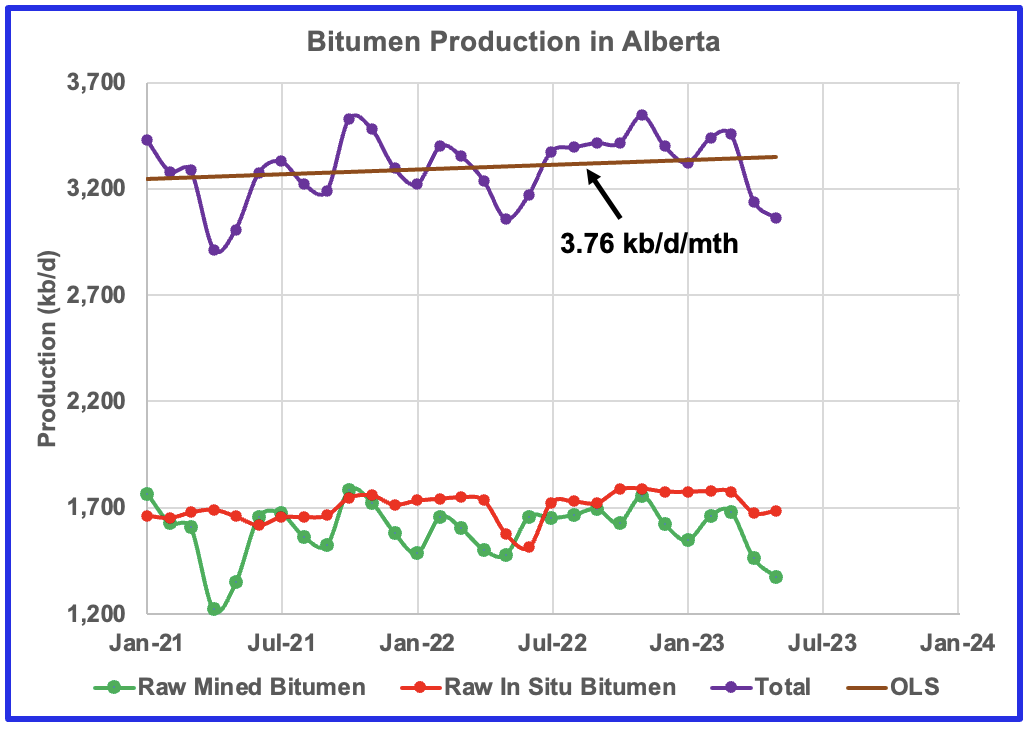
This chart shows the post pandemic trend in bitumen production in Alberta and the data is provided by the Canada Energy Regulator. Production in April and May 2023 was affected by severe weather and plant maintenance. On average, total production has been increasing at a rate of 3.76 kb/d/mth, brown OLS. Looking at the two different extraction methods, it appears that In Situ is slowly increasing while mined bitumen is holding steady.
According to the OPEC August MOMR report: Crude bitumen production output fell m-o-m by 259 tb/d, and synthetic crude declined m-o-m by 125 tb/d. Taken together, crude bitumen and synthetic crude production dropped by 384 tb/d to 2.5 mb/d.
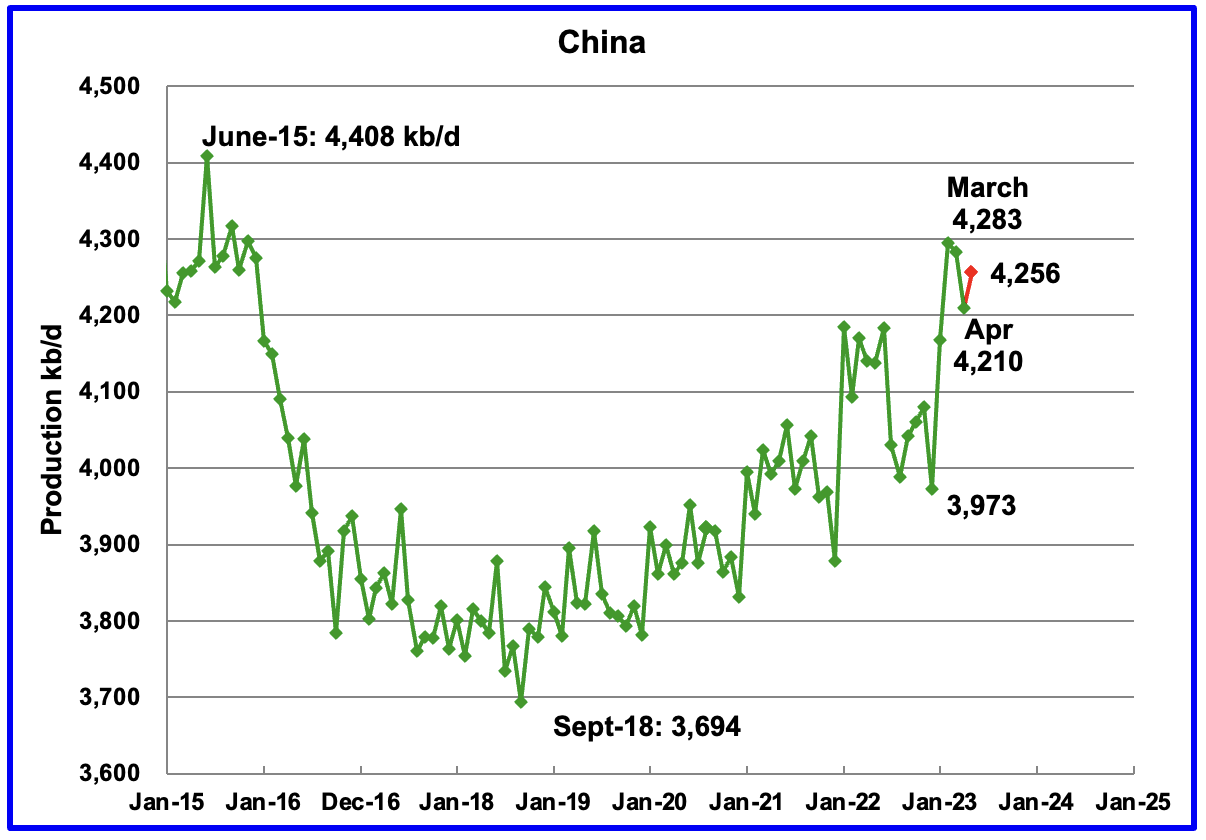
The EIA reported China oil output in April dropped by 73 kb/d to 4,210 kb/d.
The China National Bureau of Statistics reported that production during May increased to 4,256 kb/d.
While China’s production growth has risen steady since 2018, it may be approaching its post pandemic high.
According to the OPEC July MOMR: “Natural decline rates are expected to be offset by additional growth through more infill wells and EOR projects amid efforts by state-owned oil companies to safeguard energy supplies.
For 2024, Chinese liquid production is expected to remain steady y-o-y and is forecast to average 4.6 m/d. For next year, Liuhua 11-1, Shayan and Liuhua 4-1 (redevelopment) are planned to come on stream under CNOOC and PetroChina. At the same time, the main ramp-ups are expected from the Changqing, Kenli 10-2, Wushi 17-2 and Kenli 6-4.”
According to this source: From the low point in 2018 to the peak in 2023, China has added more than 600,000 barrels a day of extra production – more crude than some OPEC+ nations generate daily. Pumping about 4.3 million barrels a day now, China is again the world’s fifth-largest oil producer, only behind the US, Saudi Arabia, Russia and Canada, and ahead of Iraq.
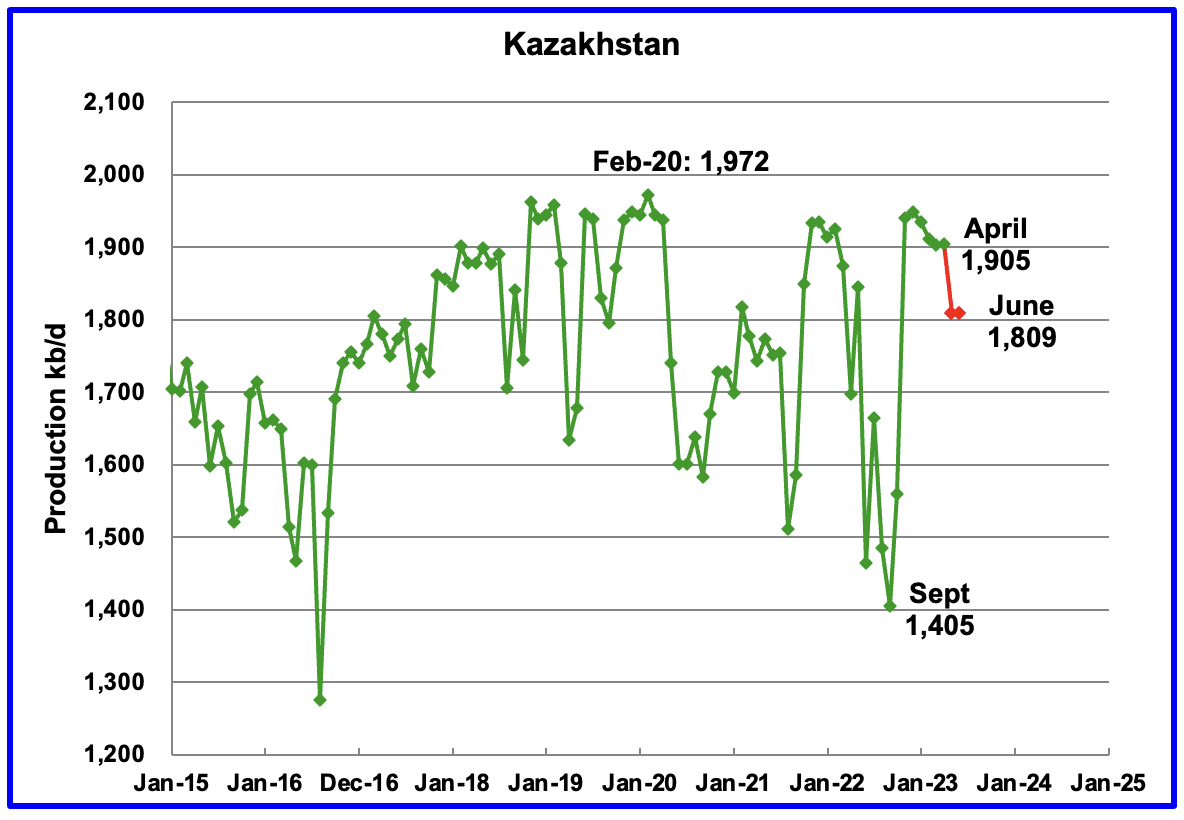
According to the EIA, Kazakhstan’s output increased by 2 kb/d in April to 1,905 kb/d. The STEO is forecasting a production drop to 1,809 kb/d in May and holding steady in June at 1,809 kb/d.
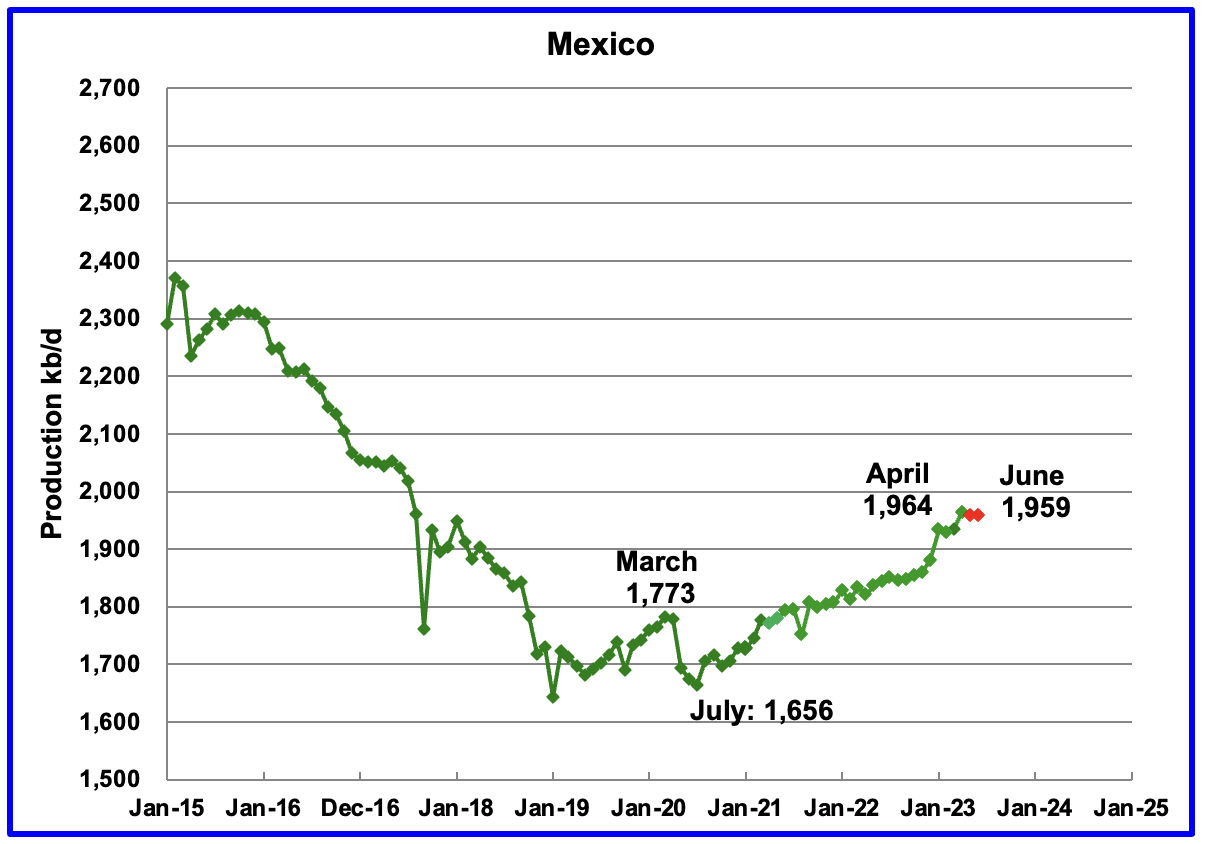
Mexico’s production in April was 1,964 kb/d an increase of 29 kb/d over March. Output dropped to 1,959 kb/d in May and June, according to Pemex.
Mexico has recently revised its definition of condensate. This has resulted in the EIA adding an extra 60 kb/d, on average, to the Pemex report. The red markers include the additional 60 kb/d.
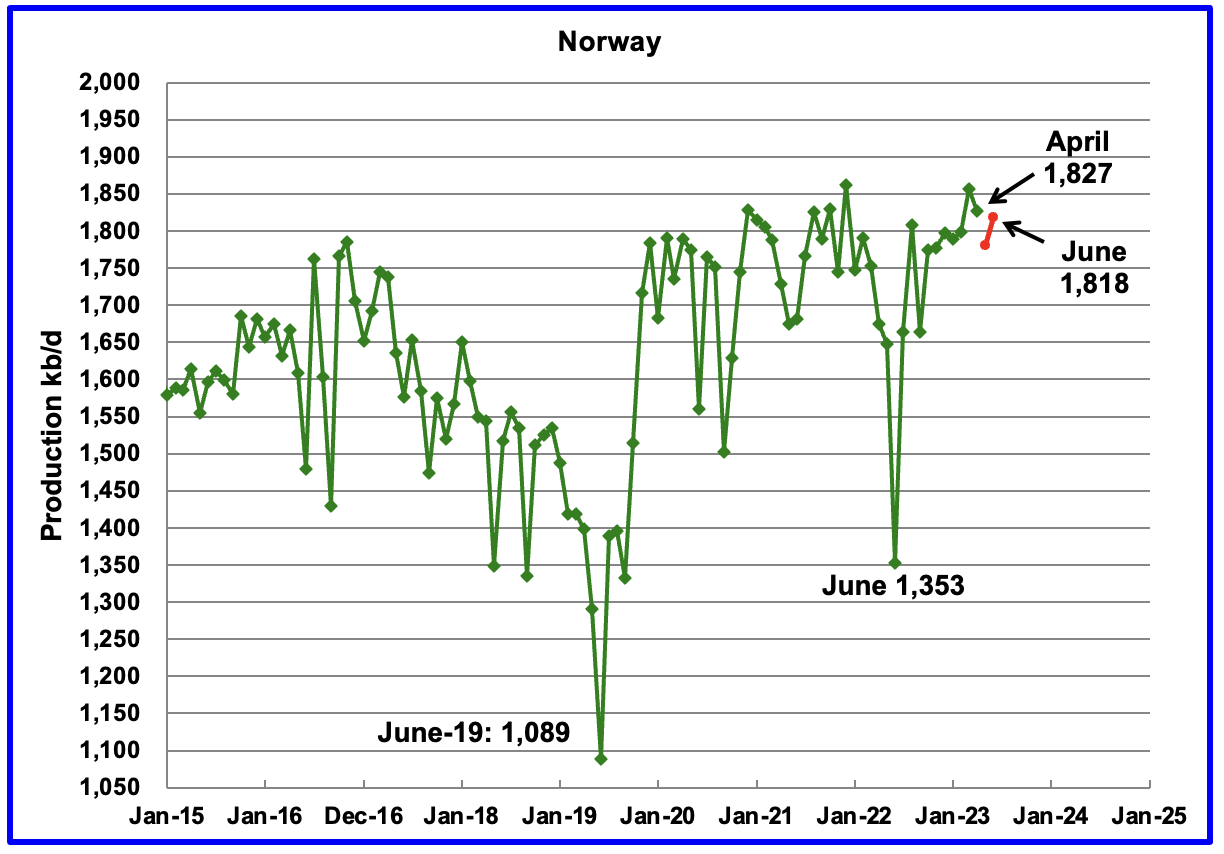
The EIA reported Norway’s April’s production to be 1,827 kb/d. The Norway Petroleum Directorate (NPD) reported that May’s production dropped to 1,781 kb/d and then rebounded to 1,818 kb/d in June. (Red markers).
According to the NPD : “Oil production in June was 0.6 percent more than the NPD’s forecast and 0.5 percent lower than the forecast so far this year.”
According to this source: “The North Sea’s biggest oil field Johan Sverdrup now has the capacity to produce as much as 755,000 b/d of crude.”
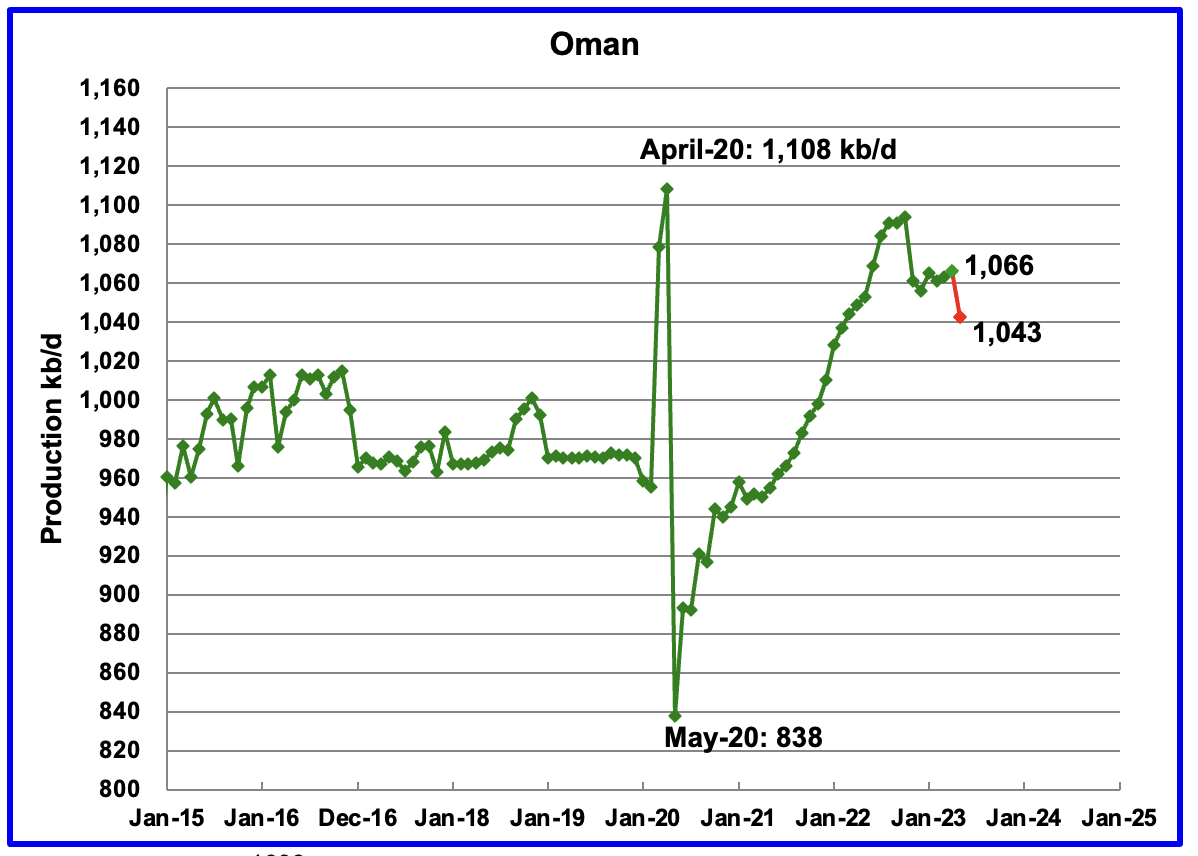
Oman’s production has risen very consistently since the low of May 2020. Oman’s April output was essentially flat but dropped to 1,043 kb/d in May.
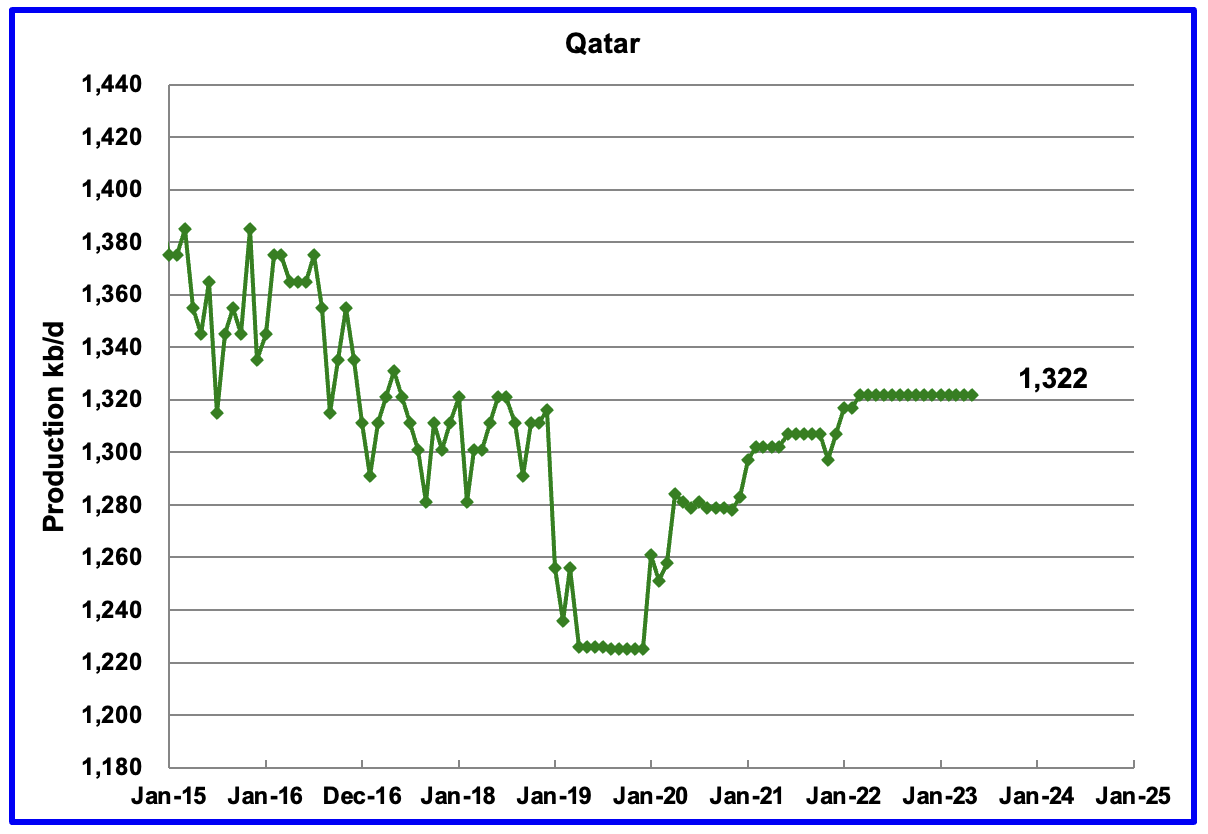
Qatar’s April’s output was unchanged at 1,322 kb/d, possibly due to lack of updated information.
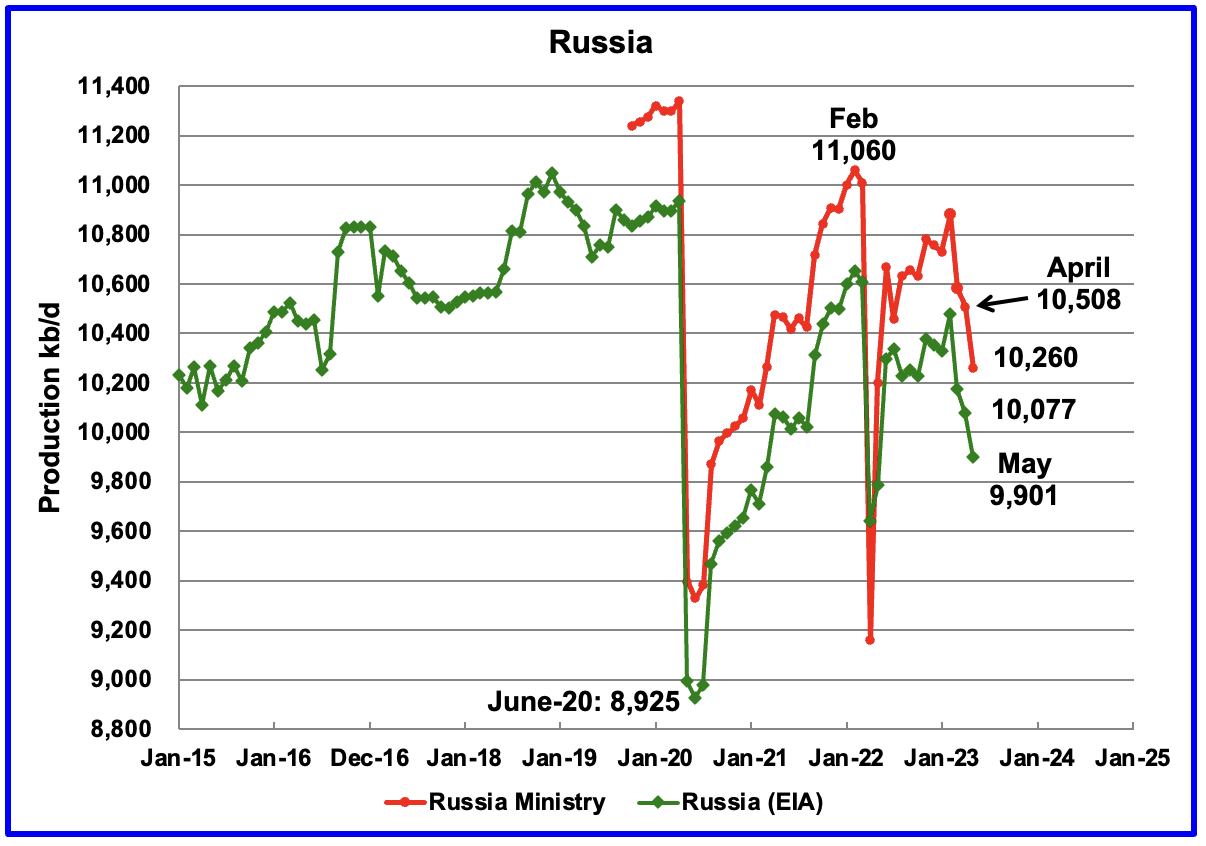
The EIA reported Russia’s April production was 10,077 kb/d. Using data from the August STEO report, Russian output is expected to drop to 9,901 kb/d in May 2023.
Using data from Argus Media, Russian production, as previously reported by the Energy Ministry, was estimated for April and May. For April and May, Argus reported that Russian production of crude was 9,730 kb/d and 9,500 kb/d, respectively. May production is available here. Using information from this S & P Global article, Russian condensate production is close to 8% of crude production. Adding the 8% to the crude production for April and May results in C + C production of 10,508 kb/d and 10,260 kb/d, respectively.
“Vienna — Russia’s condensate production averaged 833,000 b/d in November, energy minister Alexander Novak said Friday.
Stripping the November figure out from Russia’s previously reported oil output data shows that crude production was 10.41 million b/d in the month.
Russia is seeking to exclude its condensate volumes from its production quota under a supply cut agreement with OPEC and nine other allies, which the coalition will attempt to finalize Friday in Vienna.”
In the past when information was directly available from the Russian Ministry of Energy, the difference between the Russian Ministry and EIA was 404 kb/d higher. Comparing the two independent estimates above, Russian April output is 431 kb/d higher while May is 359 kb/d higher. Use of the Argus data provides production rates reasonably consistent with the EIA estimates.
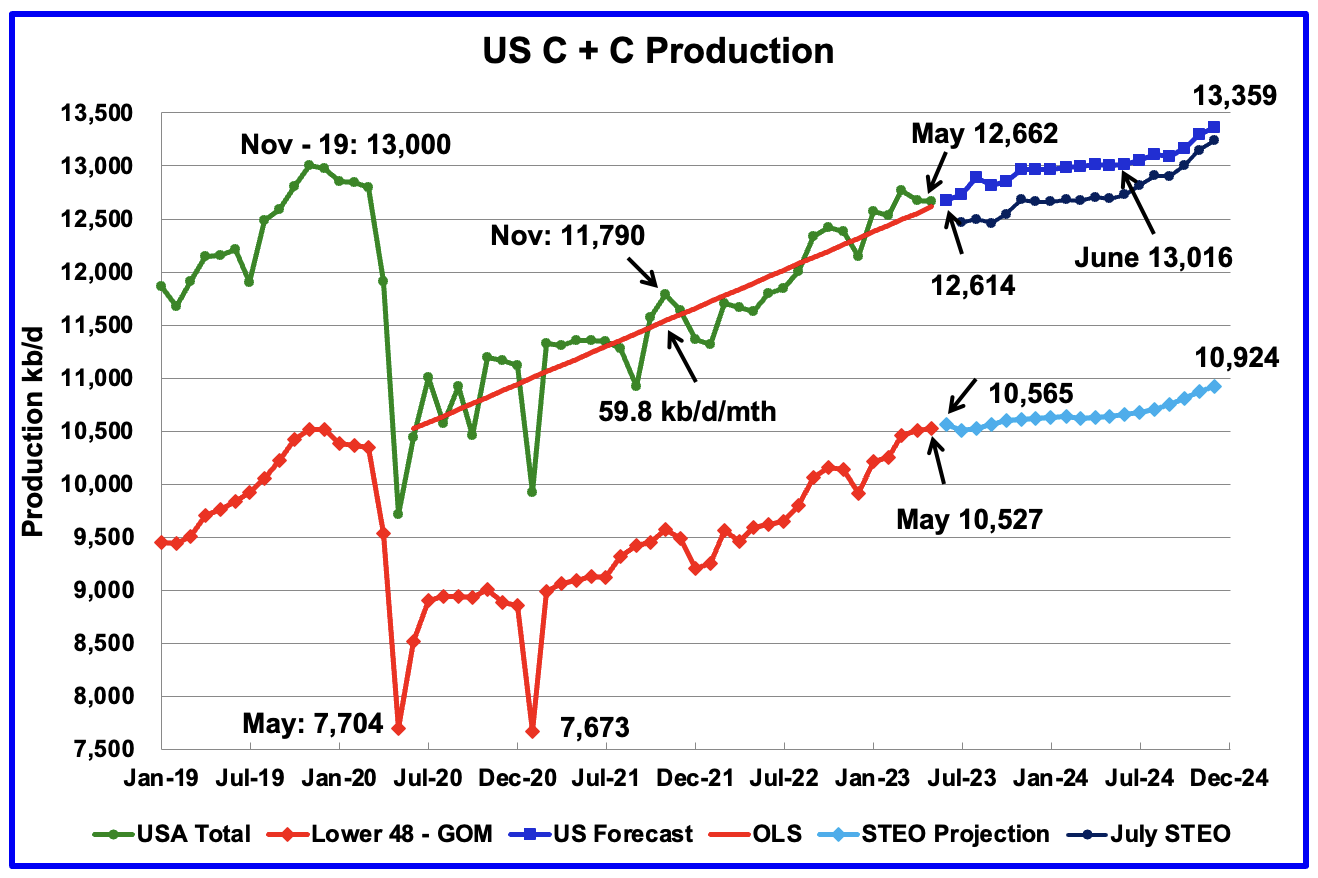
U.S. May oil production decreased by 15 kb/d to 12,662 kb/d, a small change, primarily due to the upward revision of April output from 12,615 kb/d to 12,677 kb/d.
The dark blue graph, taken from the August 2023 STEO, is the forecast for U.S. oil production from June 2023 to December 2024. Output for December 2024 is expected to be 13,359 kb/d which is 359 kb/d higher than the November 2019 peak of 13,000 kb/d. Note the difference between the August and July STEO forecasts for US oil production. The August forecast is between 125 kb/d and 350 kb/d higher than reported in the July STEO forecast.
While overall US oil production decreased by 15 kb/d in May, the Onshore L48 had a production increase of 19 kb/d to 10,527 kb/d. The light blue graph is the STEO projection for output to December 2024 for the Onshore L48.
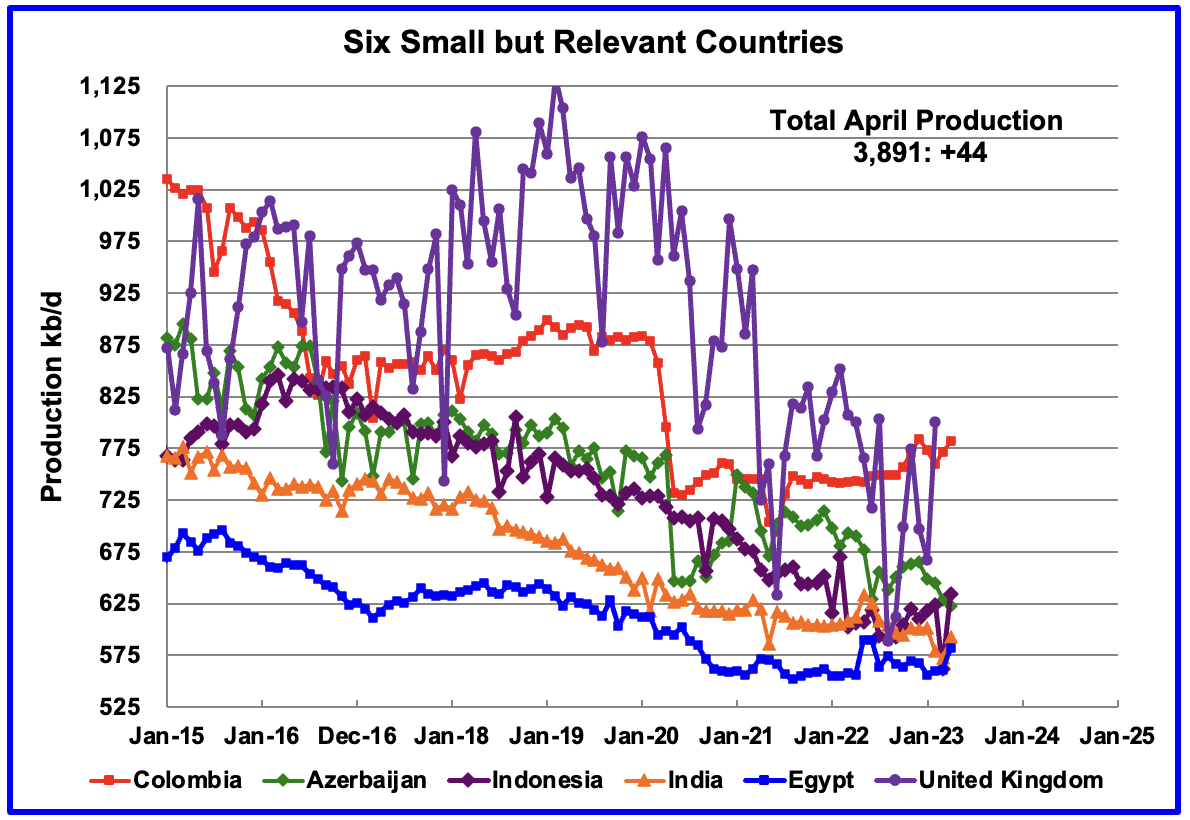
These six countries complete the list of Non-OPEC countries with annual production between 500 kb/d and 1,000 kb/d. Note that the UK has been added to this list since its production has been below 1,000 kb/d since 2020.
Their combined April production was 3,891 kb/d, up 44 kb/d from March.
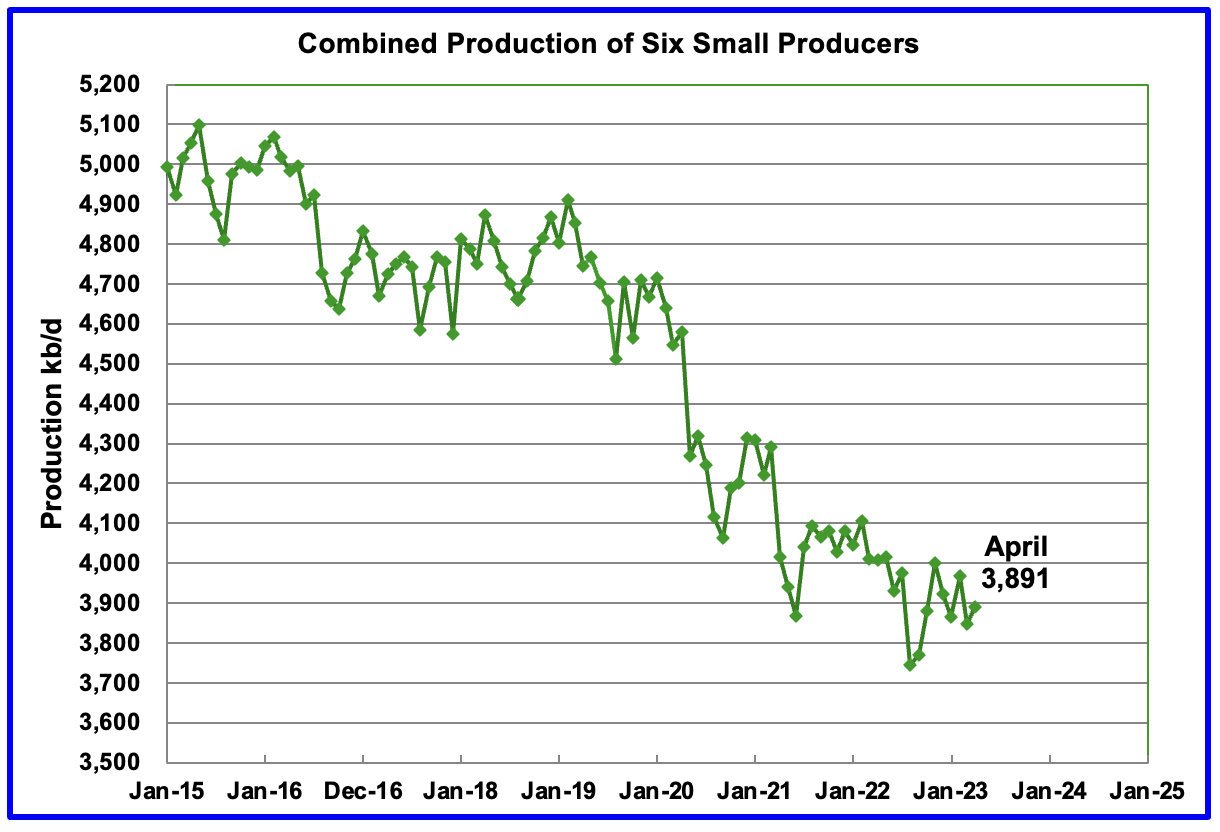
The overall output from the above six countries has been in a slow steady decline since 2014 and appears to have accelerated after 2019.
World Oil Production Ranked by Country
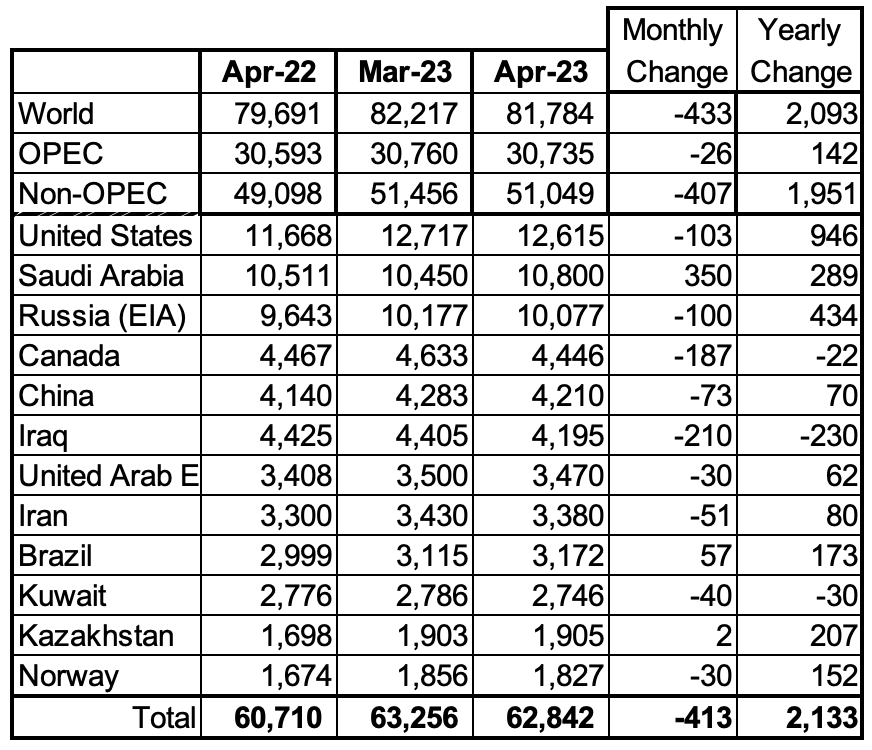
Above are listed the World’s 12th largest oil producers. In January 2022, these 12 countries produced 76.8% of the world’s oil. On a MoM basis, production decreased by 413 kb/d while on a YoY basis, production increased by 2,133 kb/d.
World oil production decreased by 433 kb/d in April. The largest decreases came from Iraq, 210 kb/d and Canada, 187 kb/d while Saudi Arabia added 350 kb/d.
World Oil Production Projection
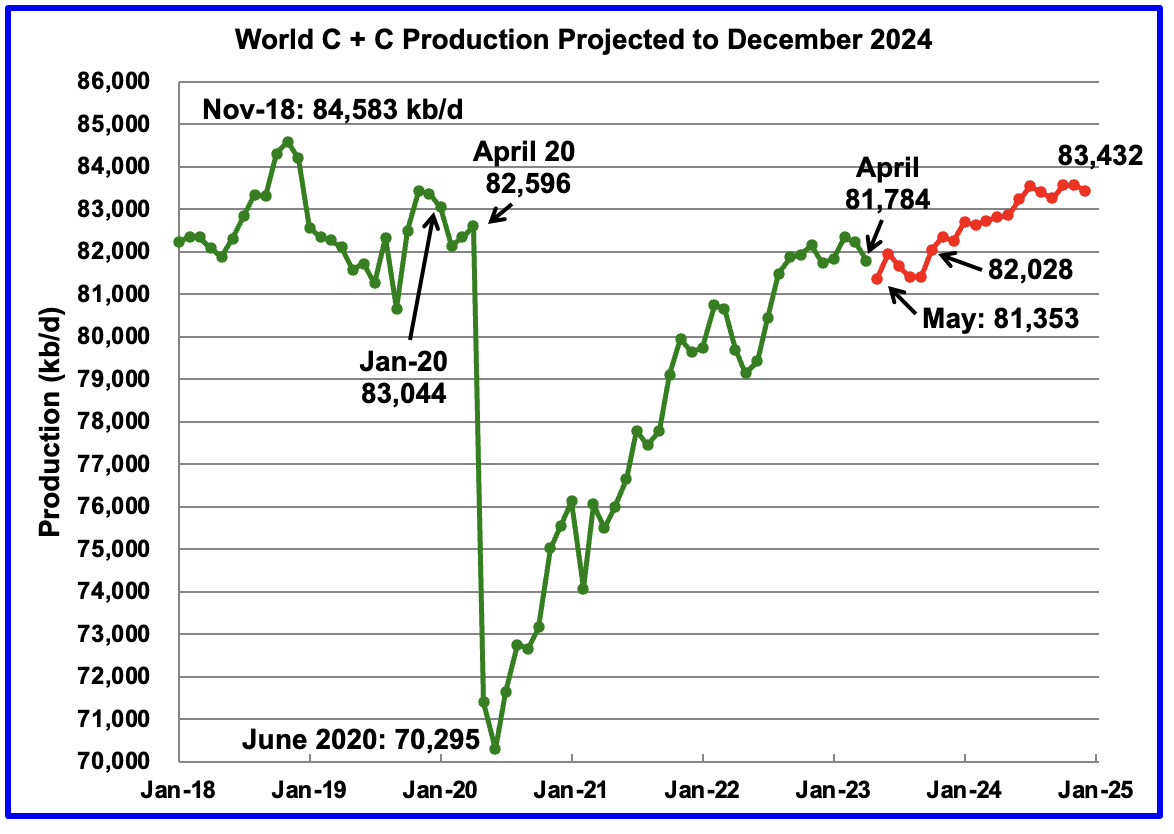
World oil production in April decreased by 433 kb/d to 81,784 kb/d.(Green graph).
This chart also projects World C + C production out to December 2024. It uses the August 2023 STEO report along with the International Energy Statistics to make the projection. (Red markers).
The red graph forecasts that World crude production in December 2024 will be 83,432 kb/d and is 1,151 kb/d lower than the November 2018 peak. Note the large increase to 82,028 kb/d in October 2023. This could be due to Saudi Arabia reversing part of its September 2023 1,000 kb/d cut.
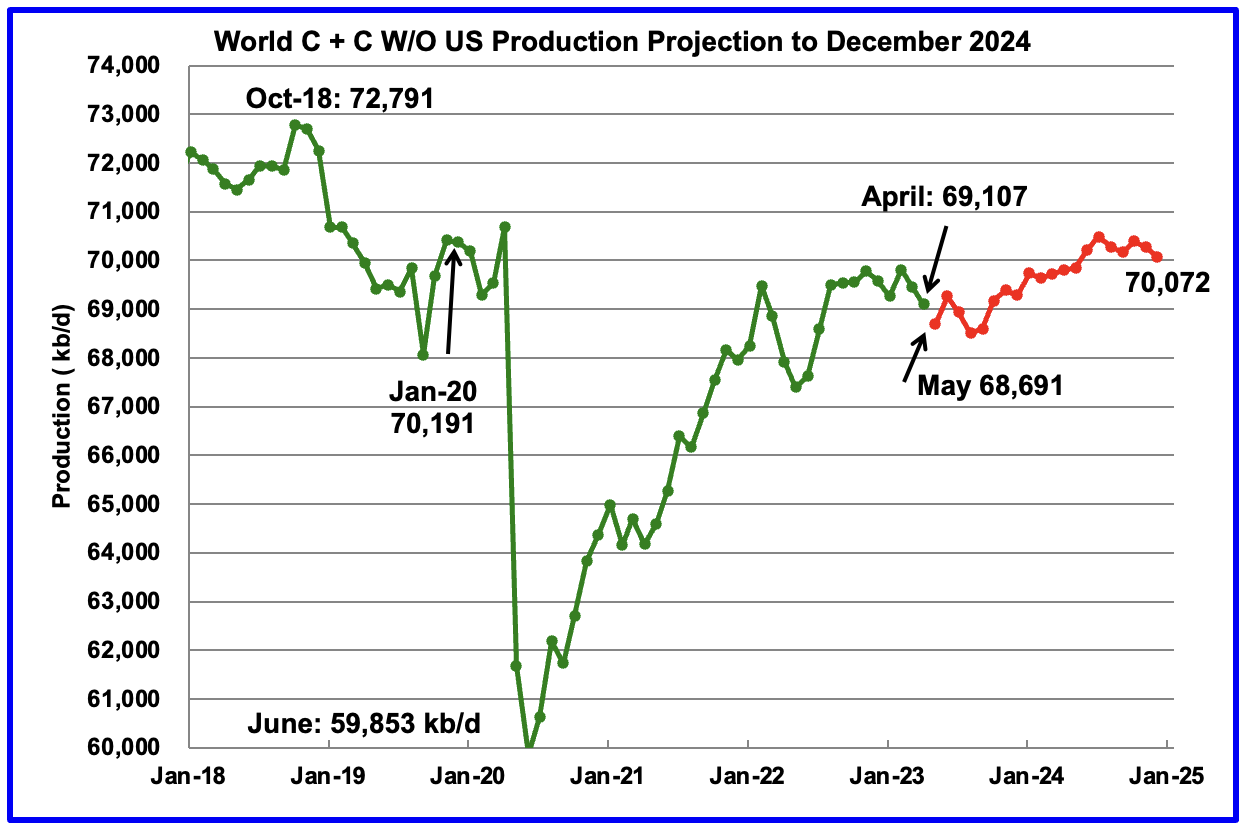
World without the US oil output in April decreased by 340 kb/d to 69,107 kb/d. May’s output is expected to decrease by close to another 416 kb/d to 68,691 kb/d. December 2024 output of 70,072 kb/d is 2,719 kb/d lower than October 2018 output of 72,791 kb/d.
World oil production W/O the U.S. from April 2022 to December 2024 is forecast to increase by a total of 965 kb/d.
278 responses to “April Non-OPEC and World Oil Production Drops”
I don’t understand how production continues to slide and the pundits say demand is up? Why isn’t the market tighter. I have come to the conclusion that the market information is a best guess and no one really has a handle on the real supply and demand numbers except in the rear view mirror after the official production numbers are reported usually 3 months later than the production month.
I would expect the market to tighten if demand is up as claimed and Saudi and Russia have cut back 1.5 million barrels a day.
I am concerned about the underlying debt bubble in commercial and residential real estate. When that bubble bursts, and now also one trillion dollars of high interest credit card debt goes unpaid, I think this fall may be very difficult and if WTI oil prices do not stay up above $80 WTI for a lengthy period, oil production in the United States will continue to fall.
I am long term bullish on oil prices and now mostly natural gas but the short term looks a little scary.
LTO Survivor
I think when people say demand is up, I think that they are referring to US Supply and Demand. Below is a table that compares the average product supplied, a proxy for demand, over the past 4 weeks compared to last year. As you can see, the YoY demand for the main products gasoline, jet fuel and distillate are up.
Note that total demand is close to 20,700 kb/d. Not shown in the table is input to refineries, which is close to 16,600 kb/d. That gap is made up by exporting and importing product and crude, primarily from Europe and Canada.
On a world basis, I agree OPEC and the EIA are guesstimating with respect to supply and demand. I think Iran is supplying more than OPEC is reporting. It was not until SA cut production by 1 Mb/d in July that WTI firmed up in late June from $68/b to $83/b today. I think that is sufficient evidence that up to end June supply was greater than demand. The smart money got in early at the end of June in anticipation of the SA cut.
The full EIA table can be obtained here: https://ir.eia.gov/wpsr/overview.pdf
See WTI Chart below.
WTI Chart
Why is there a need for a 50 days and 200 day MA, I think a 5 day MA would make sense to smoothen a bit the graph but 50 and 200 days MA,?
Svaya
While the 50 and 200 day MAs are smoothing processes, their intent is to get a better idea of the underlying trend in a particular product. These averages are primarily used by stock traders to look at the medium and longer term price trend of a stock. They are also used by commodity traders.
With the 50 and 200 day MA, traders look for two particular events, The death cross and the golden cross. When the 50 day MA crosses the 200 day MA on the down side, it is known as the death cross and is a signal to sell. On the other hand when the 50 day MA crosses the 200 day moving average on the upside, it is known as the golden cross, a signal to buy.
The current price trend of WTI indicates that the golden cross event could occur in the week of August 21 to 25.
For better info try Google.
https://www.investors.com/how-to-invest/investors-corner/moving-averages-provide-effective-tool-for-your-trading/
Oh, I see, I don’t believe in trading and speculation…
Svaya,
You may not believe in trading and speculation and I also do not participate in this as it seems like gambling. Nonetheless trading and speculation does seem to effect prices in the short term, in the long term only actual supply and demand matter. The visibility of both supply and demand are not very good in the present, only looking back several months can these be judged, to look at the present one looks at trading and speculation on paper markets to get an idea what those traders think is happening with the knowledge that they are often incorrect so it is a very rough guide to where future prices might go.
China’s total imports from Russia fell 8%. Trade data out of China has be beyond ugly. China and India have both been refining a lot of Russian oil and exporting those refined products. Mainly to Europe. So at least part of Chinese and India demand is actually just European demand.
Money supply growth in US has shrunk 8 months in a row. -10% growth for the last 3 months in a row. Only other time this has happened was in The Great Depression.
Rising oil prices in an economy with a contracting money supply. Something is going to break.
Money can be cheap but hard to get when banks become unwilling to lend. We can have interest rates at zero but banks can still be unwilling to lend.
Have to watch bank credit. Loans and leases. Which currently aren’t really growing but also not really contracting yet either. So I’d say you have to look at both bank credit and the M2 money supply.
My whole $25 oil is based on the credit spigots being turned off for a period of time.
Based on Eurodollar credit being turned off for a period of time.
“My whole $25 oil is based on the credit spigots being turned off for a period of time.”
Put your right arm in, take your right arm out. Put your right arm in, and you shake it all about. Do the Hokey Pokey and you turn yourself around, that’s what it’s all about!
HHH, what is your take on deflation scenario in China in the long term, say the next 5 years?
I don’t see it getting any better. I don’t think investment led stimulus like what they did in the wake of 2008 is going to bring back their internal demand because in large part their internal demand depends on demographics. Which they can’t change. We are 40 years from the adoption of one child policy. They can’t undo the demographic damage that has been done.
So China is very dependent, more so now than ever on external demand. Which imports from both the US and Europe are down over 20% which has the knock on effect of less China imports of raw materials.
So unless demand is fixed in the US and Europe. China is facing decades of deflation much like what Japan has gone through.
Or China massively reArms. Vast military spending might do the trick to stimulate domestic demand. Not a good outcome for the US or Taiwan.
External demand would go to zero if they attempted an invasion of Taiwan. Not saying it won’t happen. Because as their economic situation continues to deteriorate with no end in sight. They might just consider an invasion.
Use to land 182’s with balloon tires and stall kits on the Chandeliers in Louisiana. Fish all day, clean fish to ten, then take off the beach in the dark back to Houston.
The US has drained its SPR to half, much of that went to China, as does way too damn much of the 1.5 G BO of Permian exports every year. Our inventories in the US are at an all time low; China, on the other hand, has nearly 950MM BO in its SPR’s and enough JP4 to fly its military jets for a year, full out. In the US we are relying on 10 months of lag time from a Wolfcamp spud in Martin County to JP4. We can fly for four months with fuel on hand. Anybody can Google all this, by the way, easily.
US tight oil exports are smart, uh? Good for our nation’s energy security. Our country is governed by imbeciles, blue, red alike.
Thanks HHH for you thoughts on China’s economy.
perhaps we live in alternate universes.
Production is down because of the joint Saudi production cuts.
Demand: “The IEA estimated that global oil demand hit a record 103 million barrels per day in June and could scale another peak this month. Meanwhile, output cuts from Saudi Arabia and Russia set the stage for a sharp decline in inventories over the rest of 2023, which IEA said could drive oil prices even higher.”
As inventories drop to an 8 year low the only thing that will drop oil prices is a repeat of the great financial crises. Possible yes, probable not so sure. Gonna keep dancing with the one I brought… WTI oil to $90.
https://www.rigzone.com/news/wire/iea_says_global_oil_demand_hits_record_and_prices_may_climb-11-aug-2023-173640-article/
https://ia902602.us.archive.org/2/items/oil-exports.-34odt-1/Oil%20exports.75odt%20%281%29.pdf
SECTION 1: The material in the original edition ……. 10
A simple explanation of oil geologist Jeffrey J. Brown’s “Export Land Model”……………………………………………..11
Sweden may be without diesel to import as early as during 2025-2026, or 2027 at the latest, according to my numerous
calculations. In 2027 the world has only an estimated 380 000 barrels of diesel exports to share, which China and India very quickly will consume, while the world had over 6,4 million barrels of diesel exports to share in 2005, when oil exports and diesel exports peaked.
*********
Is this possible?
I can’t see it since rationing would be in full force.
Do you or anyone else know why Brown has dropped out of sight and doesn’t comment anymore?
(I know a retired Professor of Geology who wrote papers on PO in the nineties who now refuses to talk because “it is too late.”)
Perfectly credible especially as Sweden is shuttering refining capacity. The EU is especially exposed because they have effectively shut of Russian crude and have only partially replaced the 3 million b/d. Meanwhile China and India have bought Russian crude at deep discounts and sold finished products (jet and diesel ) back to the EU. Worse still the EU is squeezing refineries over carbon emissions. This is not a new story. By the end of this decade there will be no spare crude capacity anywhere. Demand is growing in India and Asia and this will consume the entire export quantity , especially when you look at the Chinese petchem build out, which is colossal. Forget KSA. They have been quitely entering into jv’s, especially in Asia, that will consume KSA exports. In effect it is captive leaving very little for other destinations. When US LTO declines, which will be sooner rather than later, that will have a huge iimpact. China and the EU will lose some of their crude supply and there will be a stampede which the Chinese will win. Even the US could be grubbing about to find suitable barrels. Happy days.
Carnot, you wrote an exceptionally good summary of the world crude oil situation in about one-tenth the words that I would have used.
To emphasize a massive sea change, it would appear that the Saudi-U.S. relationship has been more or less severed, and they have partnered up with China to become the petrochemical purveyor to the world.
The U.S. LTO boom will devolve into a natural gas and condensates story. In truth, the Delaware part of the Permian–the main growth part–is already more condensates, as the API frequently floats above 50.
The recent work of Lars, posted on reddit, had only one response at r/peakoil to anyone wanting to make something of Lars the forest man.
This was it:
“It took a little bit to get to the text of the work, and I was able to read some of it. However, early on it became obvious that it might suffer from a very serious flaw. I wonder if the author did due diligence on his supposedly famous source of the math he then applied to create his idea?”
I think the comment was aimed at anyone using the ELM, not just forest people who might not be familiar with the difference between world famous and just peak oil infamous.
Reservegrowthrulz,
I have read that longer horizontal laterals for tight oil wells will tend to have lower EUR when normalized for lateral length. Is this correct as far as you know when all else is held equal (two wells drilled nearby in a core area of the same formation, one with a 5000 foot lateral and the other with a 10,000 foot lateral)? In the example given we would expect the shorter horizontal would have a higher EUR per foot of lateral assuming similar frack stages per foot and proppant per foot etc.
Some of the possible reasons fro reduced EUR with increased lateral length are covered in post below.
https://www.oilystuffblog.com/single-post/death-by-eur
Excerpt from Mr. Shellman’s post linked above:
And one more thing from an old operator of a half century, please…longer laterals seem great at first, then they are not so great.
Once induced frac energy poops out and those longer lateral have to go on artificial lift, like gas lift, ESP, or even rod lift, things change drastically. It is impossible to create enough pressure drop (delta) at a cluster of perforations 2.5 miles away with artificial lift. Back perforations toward the toe of a long lateral stop contributing to the well after induced energy poops out; those propped up fractures then close and in the end offer very little in the EUR of things. 15,000 foot laterals create monster IP 6 and 12 month production stats, then start dropping like a rock and end up being 8,000 foot laterals before you know it.
A tight oil operator gets a bigger bang for his buck with a longer lateral, cash flow is quicker and maybe, but not for sure, the well gets to pay out faster. All good for a company, maybe not so good for our country.
Longer laterals probably reduce recovery rates of OIP. Perforated stages at the heel of lateral may recover 10% of oil in place in the SRV (stimulated container) but those stages toward the toe will struggle to have 5% RR of OIP. Will those back stages in a long lateral ever be re-drilled to recover that oil left behind? Hell no. Its lost forever.
When studying the Barnett some decade and a half ago, what was noticeable about longer lateral lengths was production per foot of lateral length decreased, all other factors being equal. Never looked for oil. However, as I discovered later on, it was that number of stages mattered far more in terms of performance than lateral length. And industry response was then to increase frac stage density, and interestingly to overdo it. Per cluster performance declined, even as initial production continued to increase. To run that one to ground required some specific information, it was on the Bakken, and I haven’t been able to get that quality of information since 2012. When I boiled it down to a nice chart and sent it off to the head of reservoir engineering, they admitted that there was a limit to decreasing frac cluster spacing. My question had been why, in light of what could be found in their data, didn’t they optimize around the cluster spacing that was obvious, save some money. The answer revealed that there was more to it than a decision from the head of reservoir engineering. I found out why later.
So my answer is there is more to it than just lateral length, and the information to prove it again is beyond my ability to get without a large company providing it in order to learn things.
I find it interesting that in your quote propped fractures are closing for some reason, per. Mr Shellman. Because only increased reservoir pressure from a frack job moves it? Hardly. His reasoning doesn’t work in terms of differential pressure as it still the prime mover, toe or heel, pre and post fracture treatment. Create the differential in only the heel, or all along the well bore, and unless something has blocked the wellbore proper, sooner or later that differential will be pulling on every open perforation. Might the toe always be operating with a larger pressure differential at the sand face? Sure. So what. Might there ultimately be more oil left in the pore volume closer to the toe? Sure. So what. None of this by itself does anything to crush proppant anywhere, unless someone wants to argue that when reservoir pressure is reduced far enough below initial reservoir pressure that something happens related to the rock matrix itself, or proppant suddenly can’t prop. But that wasn’t the claim, reservoir pressure reducing below original reservoir pressure was. So when reservoir pressure of 5000# is in the rock (down from 6000# post frac), and the wellbore pressure at the toe is 3000#….proppant decides to stop…propping? Really?
So no, I’ve never heard this idea before. I haven’t ever seen his claim in a journal anywhere either. To be honest I am not as interested in the single well performance issues bandied about by the folks doing the work nowadays, there is more interesting tidbits in the application of statistics to a plethora of data compared to the bad old days. Ask him if he has any references, it would interesting to see any data about folks studying this or science articles, or really even claiming it and explain how they deduced it. If someone has the physics explanation I can build a routine to search every well in the Permian looking for it to see if it matters.
to RGRZ:
The fact is that no one cares about incremental engineering improvements. All that’s important is order of magnitude estimates of what the expectation is. An interesting recent tweet by a chemical engineering professor who does fundamental research in catalysis:
So to someone like RGRZ, wondering about fundamental limitations and proposing the why and how some behavior comes about through a hypothesis is not their agenda. They just want to squeeze the last bit of efficiency they can out of the situation they are dealt with.
Paul’s quote:
“They just want to squeeze the last bit of efficiency they can out of the situation they are dealt with.”
Those of us not retired have every interest in doing what we enjoy doing until it is time to retire. Efficiency doesn’t have anything to do with it from my perspective.
RGRZ said:
“Efficiency doesn’t have anything to do with it from my perspective.”
Missed completely my point. Plus efficiency is in terms of business/economic efficiency, as engineering as a job is typically part of a business.
Ask us if we care whether a 2% improvement in recovery of a typical Permian well is going to matter in the long-term estimate of peak oil? But it may be important for a business willing to pay for an engineer to devise such a strategy. Or they may not care either and save the engineering money and tap it out as a matter of convenience, not caring about extra return. Because that is always happening as well,
I never used the term proppant crushing to describe fracture closure at toes. Perforated stages toward a toe close, or partially close for a number of reasons, most of which have to do with eventual reduced liquids conductivity to the well bore. Half the time they sand-up and are not washed out.
No way is pressure differential great enough from AF to “pull equally on all stages,” or at all stages 3 miles away toward the toe.
Using liquids as the flow regime, not gas (?!) longer laterals is a grossly inefficient way of recovering oil in place. If tight oil were profitable to extract >3:1 ROI, that sector would not use longer laterals, or frac designs for front loading cash flow.
Longer laterals is about money and “efficiency” of money spent v. money returned, not maximizing recovery of our country’s remaining hydrocarbon resources.
So what, he says? Well, another mile of rock as been exposed, poorly treated, and recovery rates are way less than 10% of OOIP. The oil in that rock is stranded, locked up. No longer available. Gone. That’s what. Take all that out of the USGS TRR resource estimates and chunk it in the dumpster.
Mike,
Is AF Artificial Lift?
From:
No way is pressure differential great enough from AF to “pull equally on all stages,” or at all stages 3 miles away toward the toe.
If AF means artificial lift from a pump of some sort, then this statement above seems reasonable based on my understanding of fluid mechanics. Just making sure I am getting it correctly, thanks.
Thanks for the information.
AI, yes; not AF. Because toe stages in ultra long wells rarely get stimulated to their potential, IMO they are the first to begin pressure depletion, which then in turn requires those back stages to require higher delta p than front ones when induced and natural energy is depleted.
Walk out the front door of your house, take a 3 mile walk down a straight street and think of homes on both sides of the street as frac stages. You have to manage those homes at the END of the street from YOUR home. It cannot effectively be done.
I have no idea where the proppant crushing issue came up, not me. BTW, 2022 had the highest percentage of 15K ft. laterals in the Permian but that was still <14% of total (Enverus).
Thanks to everyone downhole who said nice things.
Thanks Mike.
I always appreciate learnibg from a pro.
I am not a pro, Dennis; just somebody in a good position in life to want to help and make people understand, and trust in, my industry more. Thanks.
“Take all that out of the USGS TRR resource estimates and chunk it in the dumpster.”
Resource estimates of the USGS don’t ever include economics. They once told an AAPG conference in Long Beach that their reserve growth estimates for the LA Basin presumed that a tsunami comes in, wipes out LA, the land is sold to oil companies, and they can do anything they want with it to increase oil production for whatever price it takes.
The USGS also understands, and I’m paraphrasing one of their quite smart scientists here, that all known or even supposed and undiscovered oil and gas accumulations are 100% technical recoverable. And they are quite correct, even if normal folk or good ol’ boys can’t for a second understand the economics of why.
Mike S,
In my opinion you are the definition of an oil industry professional.
Thank you for all the knowledge you have shared at Peak Oil Barrel and Your Oily Stuff Blog.
It is appreciated more than you know.
Thank you, Dennis, that is a very kind thing to say to me. I am grateful.
I am also relieved beyond words that according to the growth guy the 85 plus % of oil in place in tight oil basins that we are stranding, because of pressure depletion, is still “technically recoverable.” We can keep drilling the Permian forever; we don’t need CAPEX, or normal people, or good ‘ol boys, we just need more engineers. I feel lots better.
Thanks again, Dennis.
Reservegrowthrulz,
Data from the Bakken would be more useful especially if it is oil focused.
My understanding is that fluid flow along a pipe will be affected by a pressure drop along the length of the pipe. Eventually these wells are placed on artificial lift and we would expect based on fluid mechanics that a longer lateral would have lower flow near the toe of the lateral due to frictional losses along the pipe and a lower pressure differential when on artificial lift due to these frictional losses. There is likely a limit to the size of the pumps providing the artificial lift and even if we are not near those limits (I am not familiar with the technology or costs) there is no doubt an optimum pressure target at the heel of the lateral which cannot be maintained along the length of the lateral due to physical principles.
In any case my expectation is that even for wells with similar frac cluster spacing along the lateral in similar quality rock (in terms of barrels of oil per cubic meter of rock, porosity, and ability to fracture the rock properly) that a 5000 foot lateral well will have higher EUR per 1000 feet of lateral than a 10 thousand or 15 thousand foot lateral well. Thus the move to longer lateral lengths designed using optimal industry practice will tend to reduce EUR per well when normalized for a 10 thousand foot well.
Thus we would expect normalized EUR should be falling and it should not be a surprise given that average lateral lengths have been increasing. To me it is surprising that the drop in EUR per foot of lateral has been relatively small from 2016 to 2020 in the Permian basin, only about 1.2% per year.
Most Bakken wells go on lift equipment within months. You can usually see the profile in the production data when the equipment goes in. Hell, any shale well I ever did in vertical wells received equipment early and then went on some form of backside pressure control.
In either case, I can pretty easily carve up lateral lengths and productivity metrics across the Bakken, at the well level in one form or fashion, I’ll check sometime just to see which way things lean. But that isn’t where the real questions reside, that is just interesting data tidbits along the way.
Reservegrowthrulz,
Yes there are many metrics that are important such as the mass of proppant used per foot of lateral, the number of frack stages per 1000 feet of lateral, and lateral length. I have some data on average annual lateral length in the Permian Basin and average annual EUR for the Permian, but I do not have the other data. Since 2016 EUR normalized to 10 thousand feet in the Permian basin has been decreasing as lateral length has been increasing (data from 2016 to 2021, too early for a good EUR estimate after 2021). For every 1000 foot increase in lateral length normalized EUR has decreased at about 1.6% on average over this period. Changes in frack stages per lateral foot and amount of proppant used per foot may confound this result, but I do not have that data.
If lateral length, proppant use, and frack stage density stabilize at some optimum level we might see EUR stabilize as has been roughly the case in the Bakken/Three Forks.
Lots of interesting questions but I do not have access to the data needed for more detailed analysis.
@Mike
Just buy some excavators and dig it out in south african diamond pit mine style – you’ll get every barrel.
Technical recoverable…
Not economic at oil prices under 2000$ or so….
Or frac with nitro glycerine instead of water and lift the surrounding up and down by a few 100 feet at every “boom”. I think some russians even thought of fracking with nuclear bombs in the 70s.
Just kidding.
Ovi, stellar job as always on this.
Before too long Argentina will warrant being included on the list of small but relevant countries as it gradually builds up the infrastructure to increase Vaca Muerta production.
Here is one take on that- https://oilprice.com/Energy/Crude-Oil/Will-Argentina-Reach-Its-1-Million-Bpd-Oil-Production-Goal.html
Hickory
Thanks
Attached is a chart for Argentina and you can see the effects of Vaca Muerta coming on line. I think it will be a while before it gets to 1 Mb/d, 7 to 10 years. From the info below it looks like a growth rate of between 50kb/d/yr to 75 kb/d/yr is a reasonable expectation.
This company states: “Pampa Energía, the fifth-biggest natural gas producer in Argentina, plans to invest $200 million in an oil pilot project in the Vaca Muerta shale play with a goal of reaching 200,000 b/d in production in the next few years, helping to diversify its gas-strong upstream business, company executives said Aug. 10.”
https://www.spglobal.com/commodityinsights/en/market-insights/latest-news/natural-gas/081023-argentinas-pampa-to-invest-200-mil-in-vaca-muerta-shale-oil-pilot
Here is another link: https://www.reuters.com/business/energy/argentinas-neuquen-hits-oil-export-record-with-vaca-muerta-boost-2023-08-10/
Russia’s currency collapse is a cause of concern. Could potentially have a Soviet Union like collapse. Which in theory could take most or all of their oil exports offline.
You would think Russia learned something from 1991, but did the US learned something?
HHH you are now is fantasy land. Russia is not going to collapse. So which horse are you riding now? Oil to $25 or Russian production going to go off line(not going to happen)
You sure about that? It did happen before. Their currency has lost what 62% ish of its value against pretty much every currency that matters. This is over about the last 12 months.
What exactly is going to stop their currency from crashing further. Last week it was falling 2-3% a day.
If your a business in Russia how do you cope with that?
Russia ran out of dollars to defend the value of their currency.
They even dipped into their sovereign wealth fund to get dollars previously to defend their currency shortly after invading Ukraine.
It wouldn’t surprise me at all if they experience a degree of hyperinflation that brings down the government.
Heck go look at the value of the Ruble against the Chinese yuan and India Rupee. Selling oil to them in their currencies isn’t helping matters.
“What exactly is going to stop their currency from crashing further”?
The elimination of Putin, the end of Russian aggression on Ukraine and Russian reformations for all the loss and damage to Ukraine. Than Russia can return to the International economic system. Russia can pay for the reformations from their wealth of natural resources.
That’s what it’s all about !
*****
OTHER WORDS FOR HOKEY
1 corny, maudlin, melodramatic, cloying, goopy, mushy
2 fake, false, artificial, counterfeit, sham, spurious
Does pokey mean slow?
adjective,pok·i·er, pok·i·est. Informal. moving or acting slowly or ineffectively; slow; dull: poky drivers.
https://www.youtube.com/watch?v=Zh2PalZFs0g
And by the way, just admit you were wrong about $25 (in March), because it’s making you look Hokey.
Ruble is down another 2 almost 3% today and it’s still early.
HHH , disagree with your assessment of Russia . This is 2023 and not 1993 . A lot has changed .
I follow Alexander Mercurius on Russian matters since late 90’s . This is his view .
It now suits Russia that the Ruble is falling against USD and EURO. Russia is doing a ‘dirty float’ to manipulate its value. Russia was not importing last year, oil prices were high, Russia was in recession and was recovering from sanctions, so a strong Ruble made sense to lower inflation and the Ruble became very strong which stabilised the financial system and did not affect the budget.
Russian economy is now surging, there are signs of overheating, imports are risings, export revenues are falling, as oil prices fell, as Russia had been pumping with discounts to secure share of the market. Now, fall in energy revenues mean a sharp fall in trade surplus and the current account in Q2 2023, and Russia will not allow the current account to go into deficit.
So, Russia is now cutting oil production, with Saudis that is raising oil prices, and grain deal is gone which places Russia in a strong position for grain exports, so more Rubles will be got from oil by allowing value of Ruble to fall and food exports are more competitive, produced cheaply in Rubles and sold abroad in other currencies.
So, trade surplus will strengthen and current account will rebound in Q3/ 4, imports will be choked off which will lower heat in the economy (interest rates are also raised) and the budget is strengthened as more receipts are got from oil and food exports. The budget is likely to return to balance or a small surplus in Q4.
So, it suits Russia to allow the Ruble to temporarily fall, will not much harm domestic economy, small rise in inflation, which is very low now and Russia has room to let it happen. Russia has done this before, and will do it again. It has handled the situation with exports and with oil revenues, with grain, and with Ruble with accustomed skill.
See the full video . Starts to explain the Ruble devaluation at 9 min ,
https://www.youtube.com/watch?v=JLCKMmxSRTs
Agree. Russia is uniquely able to be self reliant – not by choice, of course! But it runs a highly fiscally conservative domestic economy, the envy of all conservative economists.
Capital exports are tightly controlled, the domestic ruble is doing fine but as wages have increased and domestic manufacture is still catching up there are a lot of imports, causing ruble outflow to ‘friendly countries’ (prob. mainly China). So the Central bank – Govt owned – raises interest rates to such a level that some of the exuberant consumer spending is sucked out of the domestic economy. The governor has a predisposition to do it in one blow, and to overshoot.
Oil ad gas exports are carefully managed to try to adequately meet global demand, but at a price that both suits all OPEC, and doesn’t dampening the global economy.
And Russia relies far, far, less on forex markets, all of which is invisible to the west. It does over the counter govt to govt forex deals with China and India, increasingly uses bilateral trade.
The west scrapes data from SWIFT, and, guess what – Russia has been blocked from SWIFT…so some of Russia’s foreign exchange arrangements are now a black box to the west.
https://www.lauriemeadows.info/conflict_security/Beware-the-Ides-of-March.html#Bilateral_trade_using_domestic_and_friendly_nation_currencies
Thanks Laurie . I have bookmarked your blog for further reading .
Laurie,
That is an excellent perspective.
Thanks for posting.
Wow. Laurie’s blog has a very extended discussion of US & European sanctions on Russia, and not one mention of Ukraine!
Nick G , ” and not one mention of Ukraine! ” . Yeah , because Ukraine is a patsy . The golden rule ” If on the poker table you don’t know who is the patsy , then you are it ” . However there is no solution for some since
” not one mention of Ukraine! ” . Yeah , because Ukraine is a patsy .”
But she doesn’t say that. She doesn’t mention it at all. I’d argue that it is a highly unrealistic argument, that is impossible to defend. Which is why she doesn’t even try.
I don’t mind if someone wants to present the Russian point of view. I don’t mind if they agree with Russia, though I don’t think that’s realistic. But not even mentioning the primary claim of “the West” is a very strong sign of propaganda and misinformation.
HHH
IGNORED
08/03/2023 at 6:57 am
In Europe France, they already just in last 12 months have lost 48% of their foreign currency reserves. We are talking mainly dollars here.
Even though they are under a shared currency they still have to have dollars to operate on a global scale. And they have lost almost half their dollars in just 12 months. So don’t let the value of EUR/USD fool you. France is running out of dollars fast.
Running out of purchasing power fast.
France is paying for some gas in Chinese yuan because they don’t have a choice because they don’t have and can’t get the dollars needed to pay for it in dollars. ”
Now read this and understand the problem of collateral that HHH talks about . Connect the dots . Geo politics will define 2023 .
https://tomluongo.me/2023/08/07/france-niger-five-basis-points-continue-change-world/
Ron discovered this site in June/July this year when they came out with a worldwide reserves in 1P ,2 P form by Rystad . This is the latest submitting on the site . Mind blowing . Had to pour an extra shot to balance myself . Don’t forget the comments section .
https://futurocienciaficcionymatrix.blogspot.com/2023/08/sensaciones-en-la-evolucion-del.html
Is there an english version of the page ?
Mike , when I visit the site , Google translate window pops up and it translates from Spanish to English effortlessly .
It seem we have some problem 😉 by the way, i have data about oil production for each major saudi arabia oil fields but i don’t know how to put many graphics in a comment (and even one since it just fail every time i try) so if someone can help it could be greatly appreciated.
Convert them to gif or jpeg less than 60k (or maybe 50).
I use a cutoff of 55 kB, typically jpg works. I copy and paste into a spreadsheet and then use the save function which allows me to reduce image size and type (gif, jpg, or png) when I save the image. There are other ways to do this, but basically you need to reduce image resolution to get the filesize under 55 kB.
thank you very much
Also post one picture per comment.
Ovi,
Thanks for the report and data. I find it incredible that the top 3 oil producers account for ~ 41% of the worlds C+C production. It’s probably been like this for a while but god damn thats pretty centralised.
Iron Mike
Excellent observation. It deserves its own graph.
Thanks Ovi for the chart. One of the 3 falling over will cause a significant decline in production, which will cause prices to shoot up.
Iron Mike
Attached are the rest. Difficult to believe that April 2023 is almost 4,000 kb/d lower than November 2016.
Ovi,
And ~ 5000kb/d from the 2020 slump. I think its statistically okay to say that the plateau (if we are in one) is between the 43000 and 52000 for world – top 3 producers.
Iron Mike
Agreed
Iron Mike,
I would put the plateau at 48 to 51 kb/d for World less Big 3. I would call the 2020 to 2023 period a pandemic anomoly. I focus on the 12 month average, single month peaks are not important by themselves imho.
Dennis,
I disagree. Firstly in my opinion that’s not a plateau. It’s far too narrow and can just be considered as noise as far as the data goes. Plateau should be much more wider to account for noise, seasonalities (if any exist) and also error margin.
I agree the pandemic is an anamoly, but we live in a world in which anamolies do occur. So ignoring them is at ones peril. Geological peak oil and subsequent declines will be considered as anamolies since it occurs only once, but that anamoly will change the trajectory of everything after the fact.
Essentially you and I have different perspectives on the future. You see the world as BAU, I see the world in a transition period where BAU is getting rockier and eventually in the near future it will be disrupted more often than it did in the past.
Iron Mike,
I guess we define plateau differently.
https://www.merriam-webster.com/dictionary/plateau
If we look at 12 month averages and use plus or minus 1 standard deviation away from median (49.5 Mb/d) we get 47.4 to 51.6 Mb/d for 12 month average of World less big 3 from 2015 to most recent 12 month average.
I agree anomolies will occur, but the pandemic was quite unusual in its severity. Doubtful we will see something like that in the next 50 years. As to geologic decline, that is expected and will define the down slope beyond any plateau that might occur.
For World output the plateau is about 78.7 Mb/d to 83.7 Mb/d when we throw out outliers from April 2020 to Sept 2021. The plateau starts around Aug 2014 for centered 12 month average World C plus C output and my expectation is that aside for the pandemic period, the plateau for the centered 12 month average of World C plus C will continue until August of 2033, about 19 years (roughly 17.5 years excluding pandemic period).
Dennis,
So according to your definition, if world – big 3 goes above or below your plateau, what is that data defined as, a new high which means the previous data points was not a plateau, or a new low which gives the impression of terminal decline ?
The band is way too narrow in my opinion. Oil is a geopolicitical commodity which deserve a much wider plateau. We can agree to disagree.
Iron Mike,
To me it makes more sense to look at the World as a whole, historical data, plus my scenario of future output suggests the plateau I have suggested, hey we can make it 10 standard deviations if that makes you happy, but I think 1 to two does the job just fine.
For World ouput we could take a longer period such as Jan 2004 to April 2023 and use that data and two times the interquartile range to define a plateau at the median of 76523 kb/d with a lower bound of 62526 kb/d and an upper bound of 90521 kb/d, this would cover the period from August 1995 to December 2042 for my Shock Model, a period of about 47 years, quite a long plateau. This is about /-18% of the median. We could define a narrower range of median plus or minus the interquartile range which would be 69.5 to 83.5 Mb/d with median at 76.5 Mb/d and would cover March 2003 to August 2039 for data up to April 2023 and my model after 2022, so a shorter 36 year plateau in that case.
There are an infinite number of ways the plateau might be defined, Hickory’s plateau looks reasonable to me, or we could make it plus or minus 5, 10, 15, or whatever percent some one wishes. I doubt output rises much above 85 Mb/d.
Isn’t the first peak in oil prices an indicator of when global production hit the plateau? In 2008 oil hit ~$100 and in 90s it was about $17 on average…
Also, the global rig count hit a similar peak beginning in ~2007 of more than 3,000 rigs. The last time rig count was above 3,000 was in 2014. In 2022, rigs were only ~1,750…
Production peaked in 2018…I would call that a ~10 year plateau, but if you remove US tight oil it’s an even shorter plateau…
The reason we are all talking about this is the plateau phase ended in ~2020 and we have clearly entered the decline phase…
See OPEC+ trend:
Plateau, +/- 4%, starting in 2014
Thats what I see.
Hickory,
Thats a pretty good assessment.
Seneca cliff soon.
My guess
I have no idea about decline rates or cliffs, although I share Iron M’s and others concerns that instability in global relations and nations internal machinations will interfere with global oil production and exports.
Hickory,
I share that concern, though I expect the transition to electric transport might help reduce demand for oil enough to alleviate the situation. Likewise the transition to wind, solar, hydro and other non fossil fuel sources of electricity and to heat pumps for space and water heating will reduce the need for natural gas and coal.
For me climate change is a bigger concern, but reduction of fossil fuel use will help reduce carbon emissions and developing processes to remove carbon from the atmosphere in the production of cement and perhaps utilizing excess power in the future in synthetic fuel processes to remove some carbon and perhaps capture of carbon when utilizing those fuels might help. Reforestation projects might also help to reduce atmospheric carbon. All of this will be a struggle and success is far from assured, the best we can do is try harder to accomplish the feat of reducing environmental destruction as much as possible. Reduced human population will also help.
Now that promoted Victoria “F the EU” Nuland has been traveling to Africa to deal with the Niger disturbance, how will that affect extraction in Nigeria et al? Inquiring minds would like to know…
Edit: ELM is a most important issue, I surely hope Norway isn´t draining Johan S and Troll too fast, would like some hydrocarbons from there, for my kids at least.
Laplander , the Niger issue . ECOWAS ( NATO in Africa ) was Nigeria , Chad , Mali and Niger . Chad and Mali have declared they will not attack Niger . The Nigerian President asked the parliament to send troops across the border . The parliament refused . After the Russia – Africa summit this has now become a ” white imperialist ” issue . No African politician will risk being seen as a tool of the countries that had enslaved them . Geopolitics will be the theme of 2023 . As to Norway , sorry to disappoint they will pump all they can and as fast as they can . If they curtail supply then the EU collapses . Norway is the only dependable source of energy now since the Russian sanctions .
Aug 11 Rig and Frac Report
Rigs continue to move out of the Texas Permian and into the NM Permian.
– Overall US rigs down 1
– Texas down 4, Tx Permian down 3, EF down 2
– NM up 3 to 105 to where it was in July 2022
– Total Permian is unchanged at 308.
NG was down 5 to 108.
Frac Count Up 5
Some Assistance Here… Locating Jeffery Brown
Anyhow know of how to contact Jeffery Brown of the Land Export Model. I read Lars Larsen’s new 102 Page PDF on the subject, but I would like to make my own calculations and charts.
Does anyone have any contact info for Jeffery Brown?
Thanks… steve
Bring ROCKMAN back too!! (From the Oil Drum)
His MADOR speculation ( Mutually Assured Distribution of Resources ) is my vote for where things are heading.
USA and China form a symbiotic relationship where energy and supply chains are guaranteed,
to avoid blowing each other up.
Is exactly where I think things are going.
This shows STEO estimates from January and August for GoM together with BOEM reported production. I don’t think I have ever seen an STEO number that has underestimated actual production over the last five years. For this year overestimation has so far been about 100 to 150kbpd each month. The more the under production is the more the estimates in subsequent months seem to be increased, as if the main ting is to match a preset running average. The STEO is not a continually adjusted bottom up analysis. It seems to use a set annual pattern, with a dip for hurricane season as the most noticeable feature, which is moved up and down each month and with minor adjustments made (maybe quarterly but I’m not sure).
Just in .
Lot’s of Zombie companies anyway, they lived only on cheap energy and even more cheap credit.
Having to roll a bond or getting a new credit frame is the end then for companies earning litterally nothing even in good times. The 0 interrest years from QE breeded them in mass.
Banks in Europe have a lot of negative yielding bonds on their balance sheet from years of negative interest rates.
All the issues banks are facing in the US are bigger in Europe. It’s just not talked about as much.
It’s a matter of time not if banks go bust and interest rates are back negative in Europe and at zero in US. None of which will be positive for demand in general and oil prices in particular.
And no the FEDS idea of a bailout isn’t fixing the problem in the US. These banks can’t pay the FED back. There is no exit.
Banks instead of lending into the economy are going to buy government bonds. Which you’ll see a bunch of hedge funds go bust on their treasury shorts.
Volatility is going to pickup in a big way and it won’t be good for risky assets or oil prices.
HHH , is correct . Watch the step down . As far as Europe is concerned all the banks are ” dead man walking ” . How many UBS can be bailed out ?
https://mishtalk.com/economics/moodys-downgrades-10-small-to-mid-size-banks-6-more-under-review/
Deposits are going to continue flowing out of the small and mid sized banks into money market funds or even government bonds now as banks can’t compete with the higher rate of interest.
And you know in theory they should be able to borrow back the funds that are leaving in wholesale lending markets. But they don’t have good enough collateral. Or collateral that the big banks will accept. Or it’s so costly for them in wholesale lending markets it’s not worth it.
It’s literally going to be thousands of banks that shut their doors.
Now the problem that creates for the economy is new loan origination goes to next to nothing. I think CRE will likely take a 50% haircut in value over next few years. And pension funds are highly invested in CRE because it never goes down in value. Well until it does.
When property values fall what does that do to local government tax receipts?
If your long oil right now you’re basically picking up dimes and nickels in front of a steamroller. Better have a good exit plan because CTA positioning is near max long. And when the algorithms start taking profits. Prices head down again.
HHH” If your long oil right now you’re basically picking up dimes and nickels in front of a steamroller.” this from someone who has been short oil for a year now! its getting clearer by the day you do not pay any attention to the market fundamentals at all, but only to the select macro issues which support your previous positions. BROKEN CLOCK at best. WORLD WIDE RECORD OIL DEMDAND I guess you did not see that coming😎
Well both China’s and India’s imports from Russia are down big. China was down 8%. Maybe you should re-examine demand being an all time highs and going higher.
And Russia energy is selling at a discount and still imports from China fell 8%
HokeyHokeyHokey check this out:
ECONOMY Visualizing the $105 Trillion World Economy in One Chart Published 3 days ago on August 9, 2023
By Pallavi R
Visualizing the $105 Trillion World Economy in One Chart
By the end of 2023, the world economy is expected to have a gross domestic product (GDP) of $105 trillion, or $5 trillion higher than the year before, according to the latest International Monetary Fund (IMF) projections from its 2023 World Economic Outlook report.
In nominal terms, that’s a 5.3% increase in global GDP. In inflation-adjusted terms, that would be a 2.8% increase.
https://www.visualcapitalist.com/visualizing-the-105-trillion-world-economy-in-one-chart/
Turn yourself around, that’s what it’s all about!
Netherlands is now officially in recession .
https://www.reuters.com/markets/europe/dutch-economy-enters-recession-inflation-bites-2023-08-16/
Mike S is not taking any prisoners . Cutting thru the BS >
https://www.oilystuffblog.com/forumstuff/forum-stuff/everybody-s-pants-are-on-fire-now?origin=notification
Permian Basin well profiles from 2016 to 2020 normalized to 10 thousand foot lateral length. Cumulative output in barrels from month of first flow.
501,647 489,667 484,951 484,243 484,319
above is EUR in barrels of oil (natural gas and NGL output is not included in these EUR estimates, they are C plus C only) at 161 months for 2016, 2017, 2018, 2019, and 2020 average Permian basin well normalized to 10 thousand feet. Over the 2016 to 2019 period average well productivity per 10k feet of lateral decreased at an average rate of 1.2% per year.
The increased average lateral length may be causing this drop in EUR, average lateral lenght for Permian basin wells increased from about 6900 feet in 2016 to 9000 feet in 2020, by 2022 the average lateral length was about 10 thousand feet (Jan through September data only) see link below for lateral lengths.
https://www.eia.gov/todayinenergy/detail.php?id=54079
In my view it is a bit too soon to make a good estimate for EUR for 2021 or 2022 average wells as we do not have a long enough period of data to make a decent estimate.
MIKE S the very definition of BS. How anyone pays attention to someone who missed the biggest oil and gas development story of the late 50 years is beyond me. I suppose being wrong all the time is like a badge of honor here at POB. That being the case we can make Mike honorary general of the BOP.
Mike was right about a few thing the SPR, decrease of productivity, among others things, what about you what have you been able to achieve besides projecting?
Svaya,
I agree, Mike Shellman is great, I have learned much from him. He is a straight shooter and calls it as he sees it.
Mr Shellman does not fell the need to brag if he makes a correct prediction. Some might say that predicting higher oil prices when they are low is a pretty safe bet and is what most at POB have been predicting, including Ovi, Ron, me and many others.
There are those who toot their own horn for no apparent reason, Mr Shellman is not in that group.
+1
2% higher and +850,000 bpd are not even close to the same. Can’t TT2 see that incongruity?
Dennis
Above there was this tantilzing comment.
FRENCHFRIES
08/11/2023 at 5:52 pm
It seem we have some problem 😉 by the way, i have data about oil production for each major saudi arabia oil fields but i don’t know how to put many graphics in.
Could you email him to see what SA graphs he has.
He can email peakoilbarrel at gmail, if he wants.
Dennis
The IEA agrees with Argus that Iran was producing 3,040 kb/d of crude in July. The OPEC MOMR has Iran July output at 2,828 kb/d, up +68 kb/d from June, up 130 kb/d from May and up 260 kb/d from Q4-22. Sounds like the MOMR is trying to slow walk the steady increasing Iranian production up to 3,000 kb/d. The current gap between OPEC and Argus/IEA is 212 kb/d.
I heard a reporter saying that the US is turning a blind eye to the increasing Iranian production
Ovi,
EIA STEO has Iran’s output similar to the OPEC secondary sources estimate. In the grand scheme, 200 kb/d is not a huge difference. Also the IEA has other OPEC nations with higher output with the total estimate for July OPEC 13 crude output about 550 kb/d higher than the OPEC MOMR estimate. As to which is correct, unknown, the estimates are preliminary and often revised. Probably a best guess would be the average of the two estimates (IEA OMR and OPEC MOMR) which for July OPEC13 crude is about 27585 kb/d, this is about 275 kb/d higher than the OPEC MOMR estimate.
Dennis
Quite a big discrepancy with UAE. They were one of the big objectors to cutting in July and that is what made SA go at it alone.
Now it makes more sense for the price weakness from late April to late June. While I believed there was a 500 kb/d oversupply, I was thinking it was due to Iran. Now it is clear that it was a combination of Iran and UAE.
It will be interesting to see if SA keeps it cut into October and whether the exit will be in two 500 kb/d increases spread over few months.
I don’t post in this thread very often, but I usually read it.
It’s looking to me as if there’s a real if only minor possibility that the electric vehicles industries and renewable energy industries may actually continue to grow fast enough that when oil and gas production do peak ( anytime from now to maybe another four or five years) that a lack of oil won’t crash the world economy.
I’m interested in hearing what the guys over here who seldom if ever post in the other thread have to say about this possibility.
You can read this avoiding the pay wall by logging into your google account.
It’s amazing how fast renewables and electric vehicles production are growing , with the potential for accelerating growth for years to come.
https://www.nytimes.com/interactive/2023/08/12/climate/clean-energy-us-fossil-fuels.html?utm_source=newsshowcase&utm_medium=gnews&utm_campaign=CDAQtIThq4Cetut1GLzV17HCvY6onQEqDwgAKgcICjCO64oDMJavPA&utm_content=rundown&gaa_at=g&gaa_n=AfHvTEsE2eLUUYg3C17e92eXRz96iGSZqD8BNTSPxrnh6YEPktb4ZSUQ7Lw49CqCS2BFax13TD5H4VxJB7AnLf7xuaG3&gaa_ts=64d91535&gaa_sig=I516GbJ5kW29_esElKusgrWzWaK_N1nNj0oaCv7B7GauuqegEWN9QmbvMwlb951L8qklAQEhSBqLEDt0zSma6w%3D%3D
Looking at growth rates can be misleading, one has to look at absolute numbers, which may not be as impressive.
Iron Mike,
Oil output grew at about 7% annually from 1933 to 1973, growth was limited by demand. For renewable energy the demand already exists, there are not any demand constraints only the limits on how fast capacity can be expanded to replace coal and natural gas so growth might continue at 25% per year which can add up fast. Let’s say growth averages 15% for 20 years for Wind and solar power output. In 2022 Wind and solar consumption were about 32 EJ (Stat Review of World Energy), if average growth for the next 20 years is 15% per year for combined wind and solar consumption, then 2042 output from wind and solar would be 524 EJ. This is more than fossil fuel consumption in 2022 (494 EJ). As prices for EVs continue to fall (as is likely with inventory piling up on dealer lots) and people become more familiar with EVs and the expanding charging network making EVs more and more convenient, EVs may quickly replace ICEVs just as the ICEV replaced the horse 100 years ago.
There are ~4 million EVs in US to date. Even with considerable growth thru 2030, that’s still only around 15% drop in fuel demand…maybe if people drive/fly less we can get a more significant drop in demand…
Kengeo,
Worldwide plugin sales(EVs and plugin hybrids) have been growing at about 42% per year from 2012 to 2021 on average, if sales continue to grow at 35% per year for 9 years, then all new car sales will be plugins by 2031 and the light duty ICEV fleet will be half the current size by 2036, if heavy duty vehicles follow the light duty vehicle trend and electrify 10 years later oil demand for land transport falls by 20 Mb/d by 2037 and by 40 Mb/d by 2049.
Dennis –
Not sure how well that lines up with mines/mineral availability.
How long do you think EV sales could continue 35% annual growth rate?
Already seems like it’s slowing down? If 2022 total car sales were ~13 million and EVs were ~7% of that, EV sales growth will have to slow down soon if it’s going to be 100% of total sales in 2030 (which it likely will not). Cybertruck and Rivian will likely make a major impact and could become ~4-5 million/year in time…prob. take 10-15 years for that to happen…
But the take home is that we are not talking about a significant change in oil demand any time soon, maybe by 2035 if growth went perfectly?
A catalyst moment is likely coming very soon, economy is on a slow path to recession and is going to get a huge kick in the rear from oil price spike coming soon. Oil prices likely to increase by 5% per month for next year or so, peaking in second half of 2024 above $200 per barrel.
Kengeo….look outside the US to get a clearer view of EV sales and trajectory. Its a global industry with rapid change still in early stages.
And it will really ramp up if we get into a clearly visible and significant oil supply/demand imbalance on the shortage side of the equation.
Kengeo,
If sales growth for plugins is 35% per year for 9 years, then 100% of new light duty vehicle sales would be plugin vehicles, after that growth would proceed at whatever rate new vehicle sales grow over time. If self driving cars get widespread approval in the interrim, new vehicle sales might crash as only on fourth as many light duty vehicles will be needed and nearly all light duty vehicle travel miles will be in self driving EV robotaxis. Most consumers will no longer choose to own their on vehicle. This will rapidly accelerate the transition to electricly powered transport.
Hello Dennis, I know we have debated this before, so I won’t repeat the detail… have you found any new data or surveys to support the notion that self-driving vehicles will displace private vehicle ownership? I still do not see it as a trend for the reasonably foreseeable future. Self-driving will likely mostly just erode the human driving Uber/Lyft ride-share fleet in my opinion.
Evidence is seen in the continued trend of increasing private vehicle ownership data in the US even while Uber and Lyft thrived:
https://www.forbes.com/advisor/car-insurance/car-ownership-statistics/
Will try to find better data than Forbes, but their source appears to be DOT, etc…
If humans wanted to drop their private owned vehicle, they would have already started to do so with Rideshare having been around for almost 15 years. Whether it’s a human driving Uber or a robo Uber car, they both provide the same service. So, if human driving Ubers have not been able to erode private vehicle ownership, why would the self-driving vehicle make a difference?
I still believe strongly that humans will continue to follow the same lifestyle pattern that owning your own vehicle is vitally important and a strong priority for a broad spectrum of reasons.
AV’s will certainly have their place and contribute, but private vehicles will remain much as it is today. Of course, this is coming from a guy with a five car household! It may be six soon if I can find a vintage 87 suburban in good shape.
Gungalonga
Uber and Lyft are modestly improved versions of an existing thing: taxis. They’re slightly cheaper, and perhaps more importantly they circumvent local limitations on the number of drivers.
Autonomous driving offers the possibility of dramatically lower costs. That’s the difference.
Robo taxis . 10 robotaxis paralyze the highway system . ROFL .
https://www.theverge.com/2023/8/15/23831170/robotaxi-cpuc-sf-waymo-cruise-traffic-halt
To build out on Dennis’s comment: There are several factors affecting the car market. We are already seeing falling ICE sales in China, and in the US used market: we are probably reaching the point where people want BEV’s and are unwilling to tie themselves to an ICE car for 10 years (or facing the drastic reduction in resale value when the market for them has died). This is my position, actually: I’m trying to eke 2 or 3 more years out of a 2007 Yaris to be in a position buy the promised small Tesla.
The other factor is Full Self Driving, or autonomous, vehicles. I’ve seen videos of the current version of Tesla FSD (11.4.6) in action, and I think that it is far closer (within 2 years) than I thought a year ago (when I didn’t believe it was close at all).
I think these two developments will upend the car market and probably the global economy. If our society has FSD, and/or Robotaxis, we will need fewer cars and fewer parking spots. A car that drives itself, and is safer than when a human drives it, is an entirely new value proposition, especially for an aging population. It will become impossible to sell cars that don’t have it. Tesla is already in discussion to license FSD to one of the big legacy auto makers; my guess is that by 2032, most new cars will be BEV’s with Tesla FSD.
Nick,
On the relative cost savings between human driven ride share and autonomous… I don’t think it will be significant enough to make much of a difference on the decision to also own a private car or not.
Maybe you have better hard numbers, but to me, the cost of owning your own car is significantly higher than the cost to only use the current options of taxi/Uber/Lyft/mass transit. Yet, these significantly cheaper options have not slowed down the growing ownership of private cars. Why, because humans often do things inspired by emotion, passion, vanity and desire regardless of the financial logic.
When we use Uber in our family, it generally averages around $6-$15 a ride. Often, we split that cost with friends. While this isn’t everyone’s experience and style of use, it is already a cheap and smart option, yet we all still own private cars. Autonomous ride share would almost have to be free to start people thinking of ditching their personal vehicle and that’s a stretch. Personally, I don’t think AV vehicles will be much cheaper to use than current human driven ride share. Yes, you drop the human driver cost which is big, but that human driver also generally paid out of their own pocket to maintain and manage their own ride share vehicle… the AV vehicle company would need to charge enough to cover humans managing them and all the infrastructure and maintenance. So, I think the expectation that AV vehicle ride share cost would be dramatically lower than human driven is a stretch. Even if it is, it isn’t likely to be an influence on mass abandonment of private owned vehicles.
Owning private vehicles is a very personal experience… emotion, desire and individual necessity has much to with it. A person’s unique expression, need of style, color, requirements and performance all go into the experience of owning a big machine that you control and that is waiting for you with all your gear, settings, equipment, kids, dogs, etc.
No tradesman, hunter, car enthusiast, fisherman, person with kids, person with kids that play sports, etc, etc, etc. would likely ditch their private car/truck just to gain the slight possible cost savings of human ride share over autonomous… the AV vehicle would also not fit many of their daily life requirements.
Continued growth in privately owned vehicles despite many existing cheaper daily transportation options has proven this. AV’s will be used, but will make little to no difference with human desire and necessity to also own private vehicles in my expectation. They will coexist.
Gungalonga,
AVs may reduce the need for families to need two cars. Also kids older than 14 or 15 could go to sports etc using AVs, younger children might still ride in parents car. For sportsmen, they could request specific AVs if needed. The costs will be far cheaper than you imagine, when total cost of ownership is compared with use of AVs. The very wealthy will still own private vehicles, just as the very wealthy still ride horses in some cases.
For 99% of the human population private car ownership will become a thing of the past, kind of like the horse and buggy.
I think Nick is right that the difference is far lower costs for AVs vs Uber/Lyft operated by humans. The cost of a service matters. Why do you think ICEVs replaced horses, it was faster and cheaper. For AVs the main thing is that they will be cheaper, but they will also be safer.
To GUNGAGALONGA at08/17/2023 at 11:38 am:
Whether it’s a human driving Uber or a robo Uber car, they both provide the same service.
It’s not the same thing. Because you are not paying a human’s salary to drive, the cost to run a Robotaxi, and in turn the cost to the passenger, will be much lower than an Uber or a conventional taxi. There are a variety of other costs-cleaning, for instance- but if you have FSD, your total costs will be dramatically lower.
Hello Dennis,
On kids 14-15 riding robo AV, maybe some… but I like to participate in practices, etc with my boys and like to drive us with all their various gear. Also, those same kids will be chomping at the bit for their own car when they turn 16! It’s a huge independent moment and expression of style for a 16 year old to get a car and be free. My first car which was an old 1976 Pontiac with vinyl seats and no AC… tough to peel your skin off in the summer… but I loved it, it was mine to use when and how I wanted and had my cool bumper stickers and fuzzy dice hanging large.
For our events, and most people I know, we also bring lots of gear and big coolers to our sports, camping hunting/fishing events. Much of this gear usually stays in the car to save time loading and unloading. Not really convenient to load and unload an AV robo taxi multiple times every time I want to go somewhere. Also, we are usually tight on time in my family, so waiting for a human Uber or AV is never really a convenient option when time is tight and even unscheduled. I certainly wouldn’t ever give up my independence, freedom and convenience to move through the universe… I would look for other areas of life to save money.
On sportsmen, tradesmen, outdoor folks or really anyone with big gear, supplies, deliveries, etc… Loading and unloading hundreds of pounds of tools and equipment multiple times every workday would also never happen. Completely unrealistic. These folks, and many other types, need all their gear to get the job or event done, especially in unforeseen situations. Further, many of these folks go offroad for work and also pleasure and enjoy it. Jeeps, big 1-ton duallies, trucks, Broncos and many other offroad vehicles dominate in many parts of the country because owners have to have them and love to own them. Same with sports cars or even remodeled old Delta 88s from the 70s that someone restored as a hobby. Owning your own car is a lifestyle necessity and pleasure that won’t go away for most of the wealth spectrum, not just rich. Humans love cars and the small financial gain (relative to human ride share) gained for dedicating their life to an AV robo taxi is not compelling in my opinion, life is too dynamic and the sacrifice too great..
The individually owned horse and buggy didn’t necessarily go away, it evolved into the ICE vehicle which is now evolving into the EV. All of these were and are owned by individual humans over the past century, even in the face of rapidly expanding public transport options. Someday it might be a hover car, but independent, convenient and flexible personal transportation that matches your lifestyle and style needs will still be integrated into the human experience.
On the cost difference between human or robo AV ride share…. do you have that quantified? Is it $0.25 less per mile or more? Would be interesting to quantify the following with standardized variables:
-Annual cost of owning a private car
-Annual cost of human ride share
-Annual cost of AV ride share
My sense is that you would likely see that the greatest cost savings would be for a rider dropping from owning a private car to the existing human ride share option. Yet, after 10-15 years of Uber and Lyft having massive ride share growth, private car ownership is still growing. So, why do you think the introduction of a slight additional financial gain when moving from human ride share to robo AV ride share will change this trend? Uber couldn’t erode private car ownership, so why would robo taxis have a better chance?
I do agree that AV’s will be safer, they will just be AV’s owned by humans.
I think this (EV debate) is a more complex topic than many of us realize.
There are several key factors that impact whether or not EVs will have a major impact:
– Diesel fuel – So far, EVs have not been able to impact diesel fuel demand. Tesla and Rivian appear to be in a position to change that but at what cost? Tesla’s semi costs $250k and likely will only save ~$20k per year on fuel compared to a standard truck at ~$150k. That’s 5 years for the owner just to break even and figure out charging it. Rivian’s vans are ~$70k and only go 150 miles. Rivian has >5,000 delivery vans on the road, so it seems that light transport may be possible to save some diesel fuel.
– Another key factor is adoption rate, and it seems like most of the people interested in EVs have gotten them (at least at $30-40k price point). EVs don’t perform well in cold environments either, likely a very tough sell to a distance trucker. While there are plenty of people willing to get an EV as a second car, most people are ready to be EV-exclusive. 60% of oil is used for transportation and 1/4 of that is diesel fuel.
-Ultimately EVs, batteries, and renewables in general are just oil derivatives – they don’t exist without the global free economy which doesn’t exist without large amounts of cheap oil (something that’s been missing since ~2005).
Likely many other factors in the EV debate, but ultimately humanity will rely on oil to move things and be a primary source of energy and materials for a long time to come.
Likely more important than EVs will be the roll natural gas plays in offsetting oil, larger vehicles should focus on natural gas as a fuel source rather than batteries…
Natural gas is the cleanest option currently at hand and likely 100+ years of the resource…
” the global free economy…doesn’t exist without large amounts of cheap oil (something that’s been missing since ~2005).”
That’s a bit of a circular argument – transportation can be powered 85% by electricity and 15% by synthetic fuels (aviation, long distance water),
Trucking can certainly by electrified: The official estimate for a fully loaded (41 tons) Tesla Semi appears to be 1.7 kWh per mile. I’d estimate industrial pricing for power at fleet depots – around 6 cents per kWh. That’s about 10 cents per mile.
If diesel is $3,50, and mileage is 7 MPG, then the conventional cost is 50 cents per mile.
If you drive 100,000 miles per year, that’s savings of $40k per year, not including lower maintenance costs (which would be significant). If you keep your vehicle 10 years, that’s $400k in savings.
That’s conservative – a long-haul truck for 150k miles per year would save $60k per year.
A lot of “can’s ” and ” if’s” in your post , Nick G .
And yet your comment has nothing at all in it.
It’s much more interesting and productive if you present actual information: numbers, ideas, and so on.
Got an idea for solving the heavy battery wearing tyres on EVs: we make the wheels out of metal. And instead of waiting on FSD, we put the vehicle on self-guiding tracks. We can even get rid of the battery entirely and use some kind of cable assembly to run along the track and power the vehicle, perhaps even daisy chain multiples of these chassis together for more people running along any one route at a time.
I wish a billionaire philanthropist would look into developing this idea. Seems kinda neat, like something from The Jetsons.
Man, imagine taking Tesla at their word on anything.
Any day now, the Tesla Semi will be a thing. Any day… just like FSD and landing Starship on Mars.
Just gonna check on the timelines ol’ Musky gave them and…
Oh.
Ford Pinto has killed less people than Tesla.
OFM
The US EV market may be different than other places. The early adopters and opinion leaders have done their thing. Now the EV sellers have to convince the average American car buyer to switch. That will not be an easy task even thought the EPA has put car manufacturers on a march.
EVs Are Piling Up on Dealer Lots as Supply Outpaces Demand
A new study by Cox Automotive shows that dealerships across the U.S. are sitting on a significant number of brand-new electric cars. As it turns out, automakers are really good at building new cars at volume—who could have guessed? They’re so good, in fact, that the supply of new EVs has outpaced the current demand way ahead of schedule.
https://www.thedrive.com/news/evs-are-piling-up-on-dealer-lots-as-supply-outpaces-demand
Would you pay attention to an article on oil output & sales that leaves out OPEC, Russia and the US?
This article doesn’t cover Tesla or hybrids, both of which have very low inventory levels.
The vehicles that are unsold (Volkswagon, Ford, GM, etc.) are overpriced old technology produced on inefficient assembly lines. As Nick says, Tesla can sell everything they build. They are producing cars that are 5 years ahead of legacy OEM’s: you get more car for less money. The Cybertruck and their upcoming small car will cement their lead.
lol
Oh, you’re serious?
LMAO
It’s a lot worse than that OFM.
https://va.media.tumblr.com/tumblr_rwg9hqtzvV1zlxqpx.mp4
Lightsout, thanks for posting this link. Foregive me but I must post it again. It is that important.
Chinese Electric Cars, Rotting Away
I couldn’t find the official title for the video, so I just made one up. Anyway this video shocked me. Millions of bicycles are just rotting away, and thousands of cars are doing the same. Only in China could this happen. China, the country where dozens of ghost cities exist. That is cities where dozens, even hundreds, of empty skyscrapers exist, totally empty. Now we see the same thing with bicycles and electric cars. A country where this can happen has very serious problems. I am not sure what those problems are, but they are unbelievably serious. No. China has very serious problems, I am just not sure what those problems are. But this is just not normal.
Ron
The problems have been hidden for many years but are now becoming too large to hide. Simply stopping the collection of data you don’t like is not an economic or political solution.
Top 3 REGIONS NET OIL EXPORTS FOR DUMMIES….
The 3 Largest Regions for Net Oil Exports are the Middle East, Russia-CIS & Africa. From 2000 to 2022, while total oil production from these Top 3 Regions increased 12.8 M/bd, Net Oil Exports only increased 5.3 M/bd.
This will likely continue to decline as domestic consumption increases while production peaks and declines.
steve
TexasTea, I don’t have a clue who you are but I know what you are: a bullshitter. I don’t always agree with Mike Shellman but he’s not a bullshitter. He has real knowledge and he is willing to share it. And to listen.
If you really want to impress us with your knowledge, come up with something that isn’t full of braggadocio and self-promotion. And by the way, you might try using your name. I have found that people who hide behind some sort of cutesy alias like to hit and run, make snide remarks and run and giggle and pick their nose. Are you picking your nose?
I’m not from Texas, but our west place is a stone’s throw from Texas. Growing up there, I knew guys like you, and also like Mike Shellman. Give me Shellman any day. And stop picking your nose!
Gerry,
+100
fair point Gerry, If you listen to guys who are routinely wrong on both the big and small points of our business that’s your choice. I have learned nothing from MIKE in the 10 years I have read this blog, you on the other hand do make point worthy of reading from time to time. I brag because of all the BULLSHIT that was thrown at me over the years. There were several oil and gas professionals that used to post here, most have left. Those that are remaining namely Coffee and myself got it right. We were right on the technology, the implications, and the direction of our business. We said it loud and proud and argued those points time and time again and by god time has proved us right. Tuff nuts if I point that out while at the same time wonder in amazement why any one listens to those who got it so wrong. If one wants to be wrong, stay wrong and then tell the rest of our just how smart they are I kinda take offense to that.
BY the way I am career oil and gas professional, exploration geologist, self employed business owner, with production in 5 states. I currently have a number of wells being drilled in both texas and oklahoma. I have Working interest, mineral interest and yes overriding royalty interest. We primarily drill wells and purchase minerals now as exploration geologists have gone the way of the horse and buggy in the lower 48.
Now on with my day…
I want to add, there is one long standing person here, that was like most, was wrong all the damn time about things relating to the oil and gas business. This person has grown, expanded his understanding, follows the data and by dong so his conclusions have changed and he is now is worth reading and even from time to time being worthy of being taken seriously. That person is Dennis Coyne. For most others they were wrong, they stay wrong and I have concluded they enjoy being wrong, but saying the PC thing perhaps to fit into some cyber club for company, who knows? AS a business owner, who being right more often than wrong and self correcting all the times a requirement …its a bit of a puzzlement to me.
TTT, ” I have learned nothing from MIKE in the 10 years I have read this blog, ” . Yeah , because you are so in filled with your own superiority and self . Learn from the Zen Masters .
Once upon a time, a university professor visited a meditation master to learn about Zen.
The master served tea. He filled his guest’s cup to the brim and then continued to pour.
The professor kept an eye on the overflow until he couldn’t contain himself any longer.
“It is full already. No more can go in!”
“Much like this cup,” the master said, “you are filled with your own beliefs and opinions. If you don’t empty your cup first, how can I teach you about Zen?”
NO HiH, you are wrong, for several years I politely debated Mike Dennis and others regarding the tight oil development as it rolled out. I was on the ground, I was writing checks, I was measuring and following production I knew what the cost were, I understood the technology. It is what I have done for a living for years. For saying that, I was routinely attacked, ridiculed and berating. Mike far and way was the worst offender. Most here like shallow sand disagreed with me, but politely so. He told the forum that OLKA was not producing any oil from tight oil, despite the fact I had drilled and completed and sold oil from horizontal wells in OKLA. HE was wrong but he was not an ass, so I did not treat him like one.
Now for the record I do not feel superior, the oil business is what I know, I understand. I am wrong about things all the time, big things. I was wrong about TSLA, I stated I though they would go the way of the Delorean car https://en.wikipedia.org/wiki/DMC_DeLorean
I Was wrong. I still think it is at best at fad but I can and do acknowledge I was wrong. Have you ever once seen anyone else here admit to being wrong(other than Dennis) because I have not. I was wrong, least so far about my prediction regarding a Government acknowledge recession by now. It has not happened. I never in my wildest dreams expected the economy to be able to withstand the higher interest rates. But so far it has. Now comes the learning part. First you admit your error and then you try to learn from it. To wit. Under normal circumstances (business cycle) we would be in a recession, but consumer behavior was altered by the long world wide shutdown. They continue to spend because they had been held up for so long. Add in the trillions in government spending and money velocity continued, I did not expect that. How long will it last I do not know. This is what i know, regarding energy. If the OPEC cuts remain in place until the end of the year, world wide inventories will be a decade lows. Outside of another great financial crises or worldwide shut down those low inventories will put a floor under oil prices for years. My base case is reliving the 1970’s. Stagflation, high energy cost, social unrest and political turmoil. There will be a storm, no question, all we can do is prepare the best we can for our families and communities. IN my case energy plays a big roll in that preparation.
With respect to Mike, if you have learned for him it is only because your cup for empty when you met him.
I will add, there are several people here that have filled my cup. Coffee first and foremost, his knowledge and big picture energy understanding is off the charts. When he speaks I listen, just so you know.
Another possibility for why the US is not in a recession yet, IS due the tremendous amount of income that is currently and will be transferred from baby boomers to younger generations. This is happening more as the leading edge of baby boomers reachES the average of death (leading edge is ’77, average age of death for men in the US, 82, Woman 85).
“Men die younger than women in the United States, on average. American women had a life expectancy of 79 years in 2021, compared with men’s, which was only about 73, according to CDC data.”
Note that ReserveGrowthRulzzzz not mentioned as a source of knowledge. Why is that? No give and take in discussions? Everything is an engineering optimization with no big picture insights?
Gerry, I will return the compliment that you gave me. Well done for standing up for Mike Shellman. I would rather listen to his opinion than the Texas Two Twit.
I have been in this business for 45 years and have come across some great guys and some total numpties. Mike Shellman is not a numpty.
I do not post under my real name, because as a scientist by training, I am not in greement with the polemic views of the Cilimate Crisis mobsters. If those on this blog think that wind and PV are the answer I think it might be a good idea to do some homework. Start with the stress cycles on wind turbines. I will leave it at that.
Carnot, I can’t recall any specific post from you that I took any issues with one way or the other, perhaps you are new the board and I have been traveling extensively over the last few months. But I am not here to persuade, that is a waist of my time. I could care less what you or anyone thinks of me. There are two reason I read and post here. I read this blog, as from time to time I do find some useful information. More importably I find information that may challenge my current idea and conclusions. That is important to me. I post for enjoyment and to hopefully set an example for the type of information I find useful as a full time energy investor and market watcher. Lastly and perhaps sadly, I occasionally post because I get enjoyment for picking at those who 1) pretend they and they alone know all and 2)use this forum to rhetorically beat at those who disagree with them. Mike has been one of the worst offenders over the years. just a fact.
Now you must have something going for you as your conclusions regarding wind and PV are correct and will of course stand the test of time. With that I hope you continue to post, and you can just ignore me.
you might enjoy
https://www.breitbart.com/politics/2023/08/14/breitbart-business-digest-climate-researchers-say-bidens-green-growth-agenda-isnt-realistic/
I’m watching government bond yields closely, globally. Particularly all the 10 year bonds. On the charts yields look like they are going higher.
I have to ask myself if say the 10 year steepens out to 6% owning stocks would be pointless at that point. 6% risk free returns on government bonds or own stocks in a world where collateral is getting repriced.
Stocks get sold and bonds bought. But what does that mean for commodities. Oil in particular. Oil futures are bought using a lot of leverage and collateral. Just like anything else.
Well banks can’t compete with bonds yielding 6%. Banks would lose all their deposits as their current assets don’t yield anywhere near 6% so they can’t match 6% to hold onto their deposits. Lending would effectively be shut off.
We are a lot closer to thing’s breaking than people realize.
At 6% yields all the corporate buybacks stop an they increase massively the amount of government bonds they own. If they become net sellers of their own stock. Look out below.
Stock shares are also used as collateral to borrow money. Leverage is great on the way up but a total bitch on the way down.
“I have to ask myself if say the 10 year steepens out to 6% owning stocks would be pointless at that point”
HokeyHokeyHokey, every time you post here “I have to ask myself” are you a Russian troll ? and/or one of Hole in Head other screen names. You seldom make an sense, wrong most of the time, like to talk about Russia, oil and forecast gloom. You don’t understand how the market or money is traded and think of yourself as some wise financial technician. Can’t admit when your wrong. You don’t even understand why the 10 year is currently inverted or recognize the FED has been very successful curbing inflation over the last 16 months. When the FED declares victory, the stock market is going to rally and short term interest rates are going to plummet. I put you in the same category as lower case steve and invest against everything you say. Thanks for all the money you have made me.
“Inside The ‘Propaganda Kitchen’ — A Former Russian ‘Troll Factory’ Employee Speaks Out
“The money wasn’t bad, but the work was demanding: posting up to 120 comments a day, over an 11-hour shift — in chat rooms, on websites, and in social-media profiles belonging to specific Russian-language news outlets such as the independent newspaper Novaya Gazeta and RFE/RL’s Russian Service.
There were people who really flew at [the work] with enthusiasm, and then some who came to work just realizing that all they were doing was nonsense,” Sergei K., a former employee of a Russian company that became known as the “Russian troll factory,” told RFE/RL in an interview.
Such was life at the St. Petersburg firm whose registered name used to be the Internet Research Agency and which earned its moniker by pumping out conspiracy theories, half-truths, trolling social-media posts, and other misinformation.”
https://www.rferl.org/a/russian-troll-factory-hacking/31076160.html
WHO HOLDS THE NATGAS ENERGY CARDS FOR DUMMIES…
First… it’s hilarious watching the TIT for TAT on Russian Trolls & Propaganda. It’s a complete waste of time, but feel free to continue.
Secondly… if we remove ourselves from the WHITE NOISE on who is the Biggest Piece of SHITE in the world, and focus on the Data… that is, if FACTS & DATA still matter to people, we see who really holds the ENERGY CARDS.
When it comes to Natgas, Russia-CIS holds the largest number of ENERGY CARDS followed by the Middle East, then North America…
In the future… those who hold the ENERGY CARDS will control more of the Global Financial System.
Steve
Uppercase, let’s talk about the facts. “if FACTS & DATA still matter to” you. A few years ago you kicked Exxon to the curb because of debt and dividend payouts. Last year Exxon reported record profits, dividends and cash flow. Speaking of “hilarious”, you couldn’t have been more wrong. I was laughing all the way to the bank. Thanks
You should get your act together with your bud triple Hokey. A few days ago he was projecting Russia for financial collapse. You know, your country with all the “ENERGY CARDS”.
What next, are you going back to promoting gold ? Looking forward to shorting your next rant adventure “for dummies”.
BTW, camels don’t run on oil. The Middle East needs the West. No one wants to be caught driving a Russian manufactured vehicle.
Enjoy
WHO HOLDS THE OIL ENERGY CARDS FOR DUMMIES…
When it comes to Oil, the Middle East holds the largest number of ENERGY CARDS followed by Russia-CIS, and Africa…
In the future… those who hold the ENERGY CARDS will control more of the Global Financial System.
Steve
Unlearning economics . Nate Hagens with the not MSM economists including Steve Keen .
https://www.youtube.com/watch?v=EC11UQD9q3w
HOLE IN HEAD,
Great 4-way Video Chat. ENERGY = GDP.
If Economists or people disagree… you know what they say…
CAN’T FIX STUPID…
steve
Ron, Dennis,
Any insights on how the IEA estimates demand for oil? I can guess where they derive supply from but wonder about demand. Is that supply + stock drawdown?
“The International Energy Agency, which compiles benchmark supply and demand statistics, has anticipated it for months”
https://www.washingtonpost.com/business/energy/2023/07/27/the-harsh-truth-is-we-ve-never-consumed-this-much-oil/0fb450ca-2c37-11ee-a948-a5b8a9b62d84_story.html
SKEBOO,
I believe they look at the historical relationship between oil consumption and real GDP and assume that relationship does not change significantly in the short term, then they use a macroeconomic model to forecast future real GDP and then use the GDP forecast to estimate future oil demand. Historical demand is based on output of petroleum products and stock draws/builds. Both the IEA and EIA (and likely OPEC as well) use the same basic methods, but may have different sources for their economic models and other data.
Eric Nuttall
@ericnuttall
Amazing contrast: while China continues to build their Strategic Petroleum Reserve, the United States largely depleted their Strategic Political Reserve, all while global oil inventories plummet and are set to make multi-year lows. Energy ignorance has consequences…
https://twitter.com/ericnuttall/status/1688926827698589696/photo/1
Worthy read with link to the CNBC video.
https://oilprice.com/Energy/Oil-Prices/Analyst-Oil-Is-Heading-Well-Into-The-90-Range.html
“There are good reasons to be skeptical. But fundamentals are fundamentals. OPEC+ is going to put a huge deficit into the market into the second half,” he added.
The Saudis are unlikely to reverse the cuts at $90 or $92 oil, McNally said. The Kingdom is more likely looking to be sure that “the deficits they are creating are materializing before our eyes, before they decide to put the brake there.”
The U.S. Administration doesn’t have any good options for bringing the price of gasoline down. Should national average prices hit $4 per gallon again, there could be more draws from the Strategic PB etroleum Reserve (SPR), but this isn’t a very good option after last year’s releases from the SPR, McNally told CNBC.
let the good time roll in the domestic energy patch….told ya its was coming.
There are a number of geopolitical implications being played out here but I don’t have time to school you. Dennis got it right when he said taking inventory out to the US SPR was stupid, but that is just the tip of the iceberg.
You will know the Powers that Be are getting desperate to keep the wheels on the wagon when they open up coastal California and coastal Florida to ‘new, safe development’.
Interesting and I believe most likely correct OC. But, vehicle optimization enforced road speed control should come first and believe it will. Also known as 55mph. It wouldn’t be the first time that it’s been enacted and could save a mbd in the US alone. In America we have to be forced to do the right thing. Maybe prolonged $8 to $10 a gallon might be enough to be a wake up call.
some good oil market commentary
“We see that catalyst occurring or beginning to occur now with very, very sharp draws. And so we have inventories falling by about 276 million barrels in the second half of this year. Massive. It will take inventory levels globally. So that’s oil and water plus global onshore inventories as measured by Kepler data to the lowest levels in about 8 to 10 years.”
https://www.ninepoint.com/commentary/commentaries/2023/072023-market-review-and-outlook/eric-nuttall-h1-2023-market-review-and-outlook/
if this happens, again is a IF, the world oil markets will stay tight despite any recessionary demand change and at the same time be on edge for any geopolitical or terrorist activity. makes your bets ladies and gentlemen.
https://www.sciencedirect.com/science/article/pii/S0920410521010536
The paradox of increasing initial oil production but faster decline rates in fracking the Bakken Shale: Implications for long term productivity of tight oil plays
Author links open overlay panelFrank Male a, Ian J. Duncan b
Highlights
•
Well production shows increased early production associated with sharper decline as play matures.
•
Increased initial production of Bakken wells does not reflect higher lifetime recovery.
•
Intense fracking results in higher initial production and more rapid terminal decline.
5. Conclusions
The contribution that tight oil will make to future US oil production is a controversial subject, with vigorous arguments being made by proponents of two views. This study has demonstrated that the assertions of both sides of the argument are inconsistent with rigorous, physics-based analysis of the well production data. Over the last 16 years, the initial production of Bakken wells has increased, as reported by industry and modeled by Covert (2013) and Smith (2018). The increase in early production has resulted from operators increasing the fracture intensity of completions. This is consistent with the assertions of operators in the Bakken play. At the same time as the median initial production of Bakken wells increased (by as much as 100% from 2014 to 2018), their estimated ultimate production (EUR) remained broadly constant.
The results of this study provide a framework for understanding the mechanisms controlling both initial and long-term production from horizontal, hydrofractured wells. The analysis presented in this paper demonstrated that:
1
Fitting ad-hoc functional forms (such as Arps, 1945) to the production data from these wells is unlikely to enable meaningful extrapolation to time periods beyond the age range of the data.
2
Using metrics such as the 12-month cumulative oil production (favored by operators) as an analogue for EURs, as has been done in most machine learning analyses of tight oil productivity, results in erroneous results. Overestimates of long-term productivity for recently drilled wells of 50–100% are likely when EUR estimates are based on IP.
3
Over the last 10 years, the average EUR for new Bakken wells has remained largely constant and actually decreased from 2010 to 2017. The average, length-normalized EUR decreased from 2009 to 2015. These trends correlate with a general increase in the water to oil ratio that is best interpreted as a decrease in the average reservoir quality.
4
The changes in 12-month cumulative production (IP) over time are not strongly correlated with the EURs of wells.
5
Estimates of the future production of tight oil plays based on an increase in technically producible oil, due to increasing initial production, result in significant errors.
6
The data do not support published claims that productivity of new Bakken wells has been increasing in the range 10–20% annually. The data also do not support a published claim that the EUR to IP ratio of wells is constant.
7
Our analysis of decline curves of Bakken wells resolves the paradox detailed in the Introduction to this paper, and provides a robust basis for forecasting future US oil production from tight-oil basins.
The results of the current study resolve the apparent discrepancy between (a) operator’s claims of large increases in well productivities and (b) analysts claiming that long-term production of these same wells may be significantly lower than expected. For the Bakken, implementation of more closely spaced, intensive fracturing results in higher initial production and steeper terminal-production declines. Critics focus on the higher terminal-decline rates whereas operators trumpet the higher initial production. These are not mutually exclusive, but their analyses do not incorporate an understanding of the nature of production from multi-stage fractured horizontal wells as expounded here. The overarching conclusion that arises from this study is that the advances in completion technologies, which are in widespread usage, are not increasing the EURs of tight-oil wells. This conclusion is important in the context of estimating the total reserves for tight oil plays and thus for predicting future US oil production. Published estimates that optimization of completion strategies has resulted in 10–20% increases in the lifetime productivity of multi-stage fractured wells are not supported by the analysis of the large production data-base presented in this paper.
The over-arching conclusion of this study is that the ultimate recovery of oil from tight oil basins should not be based on initial production. Estimates of ultimate long term production or EURs, should not be scaled–up to take into account future increases in IP related to increased intensity of hydraulic fracturing. This conclusion should be taken into account in any estimates of future tight-oil production. It places limits on the future contributions of tight oil to the energy production of North America (and globally). This will be critical to any attempt to make robust estimates of future production from tight-oil plays and hence future global-oil production must take our findings into account.
Phew . Where were you hiding ?
QUARK,
there are a couple of ways to view this papers conclusions, many of which I agree with. Higher initial production rates may or may not mean higher total cumulative production. I agree. BUT higher initial rates do make the well PAYOUT much faster, meaning in terms of a strict economic model, higher initial rates rates yield an higher return. my personal experience is as follows, I almost always get all my initial WORKING INTEREST money back within 8 months, double that in the next 12 months and again over the next 3 years. At that point in time it is a bit like an annuity check small but steady year after year. I will do to it every chance I get.
I can say with the exception of my most recent Haynesville well and one gas well in the Gas condensate window of the Woodford in Grady County OKLA, total cumulative production has been less that what was anticipated when the wells were drilled now almost a decade ago. That is NOT to say they did not make money, or they are depleted (all are still producing commercially) it is just to say total cumulative production at this point in the well life is less than was anticipated. 3 of the initial oil units are now being permitted by marathon for density units. 4 additional wells per unit, average pay thickness 200′ and anticipated total recovery based on units adjoining with 4 years of production history should be well north 500,000BOPW and 3-5BCFG. Based on current well cost the nat gas and nat gas liquids will pay for the well and the oil is pure gravy.
Continental experimented with well density starting with 7, then 6, then 5 and now 4. Part of the reduction is due to the new frac technology and as I think most would realize if 4 wells produces that same as 7 wells did, there is substantial cost benefit to that.
With respect to what it means across the US, I am still of the belief that total tight oil production can be maintain or slightly increased dependent on prices for several years to come. It is clear there is no incentive for producers to oversupply the market again. Beyond that we can hope that new secondary recoverer technology will be developed, there is going to be a lot of incentive for that to happen.
Miam, the publication is free!!!
Quark,
Interesting paper, but based on Novi Labs data, average North Dakota Bakken wells completed in 2017 declined about 23% from 48 to 60 months, so the 30% estimate for Boundry Dominated Flow (BDF) fro Bakken wells in 2017 and 2018 does not seem correct. See
https://novilabs.com/blog/north-dakota-update-through-may-2023/
for Novi Labs Data for North Dakota Bakken, click on Well Quality tab and choose 2017 for year of first flow.
I use an Arps hyperbolic until annual decline rate reaches about 12.5% and then assume exponential decline after that point.
Dennis:
“I use an Arps hyperbolic until annual decline rate reaches about 12.5% and then assume exponential decline after that point.”
A valid heuristic to apply, with a physical understanding from the Ornstein-Uhlenbeck diffusion process, which shows the same 2 profiles in decline.
https://www.google.ch/books/edition/Mathematical_Geoenergy/xb17DwAAQBAJ?hl=en&gbpv=1&dq=%22ornstein-uhlenbeck%22+%22pukite%22+%22oil%22&pg=PA83&printsec=frontcover
Fracking is a violent process and diffusion is largely uncontrolled and so the stronger the fracking impulse certainly the more initial output but the cumulative may actually be less as the oil ca be driven deeper or overshoot its collection points.
Think of releasing a perfume in a room vs exploding a bottle.
The EIA’s latest Drilling Productivity Report is out.
The Big Rollover continues.
Ron
Today’s Permian data is a curious situation of where “Down is Up”.
DPR production has now dropped for two months in a row. However the previous months production date has been revised up. The July report had August production at 9,399 kb/d. Today’s August DPR has revised August up by 35 kb/d to 9,434 kb/d, which is higher than the current September 9,415 kb/d
Regardless the down trend is now two months long
“Pipeline operator Enterprise Products Partners is getting upbeat messages from producers about activity, Tony Chovanec, VP Fundamentals and Supply Appraisal, said on the midstream operator’s Q2 earnings call.
“Watch what the producers are saying on — during the second quarter. No one has a bad story. Everybody is very, very upbeat,” Chovanec told analysts. ” ……as i have said before listen to the midstream guys if you want to know what upstream is going to be doing month and years out. I own EPD PAA and ET…. I eat my own cooking.
https://oilprice.com/Energy/Crude-Oil/US-Shale-Shakes-Off-Slowdown-Predictions.html
as I mentioned up thread things are getting pretty rosy in the real oil patch. of course you don’t have to listen to me, lots of other voices out there to keep you a stray.
“As a result of higher expected well-level productivity and higher crude oil prices, the EIA now expects U.S. crude oil production will average 12.8 million bpd in 2023 and 13.1 million bpd in 2024, both annual records. The forecasts were raised by 200,000 bpd for 2023 and by 300,000 bpd for 2024 compared to the projections in July. ” I made this point upthread earlier not to brag🤠
Alan Greenspan also said all is tight, not too long ago. Life has never been better ever since. LOL
Smells like BS. We’ll know in a few more months.
What is happening in Midland County
I keep reviewing the Frac count data published by this site:
https://fracfocus.org/data-download
Over the past month I have noticed that there has been no new frac crews added to Midland County since June 10th. In the attached picture, based on today’s update, the five columns are, Well identifier, Start date, End Date, State and County.
Does anyone have some information that could confirm the lack of Frac activity in Midland or provide some explanation/enlightenment? I am wondering if this has something to do with the drop in Permian/Total DPR production and accounts for the peak in July shown in the above charts ?
Also attached is the same info for Martin County. It has start dates up to July 12. Lea county has start dates up to July 20. Will re-check next week for any change with Midland.
Martin County
According to mid month BOEM figures Vito reached 72kbpd in June, which is just about nameplate.
Hopefully this will show up in the June EIA report.
Iran’s crude output rises to near 3.2mn b/d: Minister
Owji’s latest production figure is also significantly higher than the 2.83mn b/d average that Opec’s secondary sources reported for July, up from 2.75mn b/d in June. Argus — one of Opec’s seven secondary sources — estimated Iranian production at a higher 3.04mn b/d for July, from 2.91mn b/d in June and 2.57mn b/d at the start of the year. Iran has not directly provided a production figure to the secretariat since the US sanctions were reimposed.
https://www.argusmedia.com/pages/NewsBody.aspx?frame=yes&id=2479064&menu=yes
U.S. production on track for first two-month decline since 2022 as operators dial back shale drilling
(Bloomberg) –U.S. shale expansion has come to an end for now with production set to shrink for a second straight month in September, according to a government report.
After topping out with record crude production in July, the U.S. is on track for its first two-month decline since January 2022, according to a Monday report by the U.S. Energy Information Administration. The drop is led by the Permian basin in West Texas and New Mexico, where output will fall for a third month to 5.8 MMbpd, its lowest level since February. The Permian had been the last of the four U.S. shale basins to drive growth in overall U.S. production.
The decline will add more tightness to global supplies, which are slipping in the wake of production cuts from Saudi Arabia and its OPEC allies. Meanwhile, the International Energy Agency said Friday that global oil demand has reached a record and warned that oil prices could climb further.
Operators have been dialing back U.S. activity as growth in global oil demand returned slower than executives thought it would. The slowdown is also being driven by closely held operators that are running out of inventory for drilling new wells. The oil rig count has fallen 15% so far this year.
Oil producers also continue to drive the fraclog lower as completion activity outpaced drilling in July, according to the drilling productivity report. The last time operators added to the supply of drilled wells waiting for frac crews was in December. The lower the count goes, the longer it will take for shale supply to return.
… and in EIA the oil production rose for 400.000 barrel a day in just one week reaching the 12.6 …
https://oilprice.com/Latest-Energy-News/World-News/Oil-Steady-Despite-Large-Crude-Draw.html
Are they smoking strange stuff or just declaring some condensate as oil?
While I always have a bit of skepticism regarding charts on twitter, this chart posted by HFI research shows a 4,000,000 BO drop in OPEC plus EXPORTS from June to August. Roughly from 29million BO down to a hair over 25. I suppose this means they they were not bluffing.
https://twitter.com/HFI_Research/status/1691528988982931456/photo/1
https://twitter.com/HFI_Research
Stocks of crude oil in the US dropped by 6.195 million barrels in the week that ended August 11th, 2023, after a 4.067 million barrels increase in the previous week, while the market expected a 2.050 million decline, data from the API’s Weekly Statistical Bulletin showed
and the draws continue….
“Interestingly, Bloomberg notes that the weakening sentiment comes despite physical markets continuing to flash signs of strength. Crude inventories at the Cushing, Oklahoma, hub are seen draining to their lowest level since April, while Asian refineries continue to ramp up imports.”
https://www.zerohedge.com/energy/wti-holds-losses-despite-bigger-expected-crude-draw
The CTA’s got long at around $70. They are near max long currently. Which mean they aren’t buying anymore. So if prices for any reason don’t go higher from here. (Lack of liquidity) then the CTA’s eventually start taking profits. Oil prices go lower.
Sentiment has very little to do with it.
TSHTF .
The Saudis may be at the point at which they can decrease production and revenue will go up due to the price hike from the tighter market.
HIH help an old man out how did you get that chart to post I never could?
Keep the image below 60kb
I would keep image smaller tham 55 kB, copy and paste into spreadsheet and then save as jpg, or gif type format to reduce image size, sometimes the image needs to be resized smaller to meet th 55 kB file size limit. Text is needed in comment, an X will suffice if you do not care to comment.
TTT ,
1. Single right click on image of the tweet .
2. The tweet will reappear separated on the screen in two parts . Image on the left and text on the right .
3. Pointer on image . Left click to save image .
4. This image was 123 kb .
5. Resize using ” Resize by pixels ” online websites to 55kb .
6. Post image on POB . Note there must be a text message in your post . POB does not post the image only .
Hope this helps .
The truth is leaking out slowly but surely .
https://oilprice.com/Latest-Energy-News/World-News/US-Shale-Oil-Production-Growth-Getting-Increasingly-Difficult-Report.html
Mike S on the KSA and Permian posts .
https://www.oilystuffblog.com/forumstuff/forum-stuff/will-you-lookit-this-now?origin=notification
Shale Wells Are Losing Oil Output Faster Than Expected, Study Says
(Bloomberg) — The steep drop in output from US shale wells is turning out to be worse than expected, forcing oil drillers to work even harder to keep production from slipping, research firm Enverus said in its latest report.
Now, however, most of the land is already owned or leased, offering few opportunities to drill new areas with vast oil reserves. Companies are considering a range of drilling and production strategies to maximize what they get out of each well such as drilling wells closer together, which makes the shale patch a more dense and difficult place to increase the rate of production.
“Summed up, the industry’s treadmill is speeding up and this will make production growth more difficult than it was in the past,” said Dane Gregoris, managing director at Enverus Intelligence Research and author of the report published Tuesday.
In the Permian Basin of west Texas and southeast New Mexico, North America’s most productive oil field, the rate of well production in the Midland area has declined by 0.5% each year since 2014. Well production at the nearby Delaware region has fallen by even more since that time.
The point company in the Permian is probably Occidental, which formed Oxy Low-Carbon as a subsidiary about five years ago. They partnered with the Bill Gates backed company Carbon Engineering and have seen some good results. I just saw that they purchased Carbon Engineering outright and plan on capturing one million metric tons of CO2 per year directly from the air via adsorption, then store it in the Permian. A remarkable side is synthesis of usable fuels.
In my opinion, this isn’t just a side venture, but a major segue in Occidental’s business plan. Unless I have gone daffy in my dotage, Occidental is going to store the CO2, all right, but they’re also going to use it in a massive CO2 flooding plan for EOR, probably in conjunction with water.
CO2 is miscible with oil. Compressed, it is very dense. CO2 can enter fracture pores that plugged up long ago from long-chain hydrocarbons trying to get out of the rock. Introduce CO2 down a dead parent well that has gone through the known cycle of increasing GOR, then a sharp drop-off of GOR (the ultimate signal of a spent shale oil well), and with the different personalities of CO2 with changing temperatures and water, also raising the reservoir pressure, it’s not hard to consider enhanced oil recovery in thousands of wells. This could be the next act in American shale oil.
If I am full of it, this is just carbon capture. Each million metric tons is equivalent to the exhaust from 250,000 cars a year. But I think Occidental has something far more exciting in their game plan. Think of it, somebody (was it Exxon or Chevron?) overpaid Denbury for their CO2 pipelines–which are hard to get any more. This is a built-in plan with the possibility of a giant GAW flooding plan. Or maybe I’ve been out in the sun too long. I’d be happy to hear some of you young engineers take it from here.
Exxon bought Denbury and has been involved in carbon capture research for years. I know a young lady geologist who was on that team. Sadly while that is a very good question I do not have the answer as to what end. Woods did tease an increase in well productivity in their shale holding last month, I think I post the article. But no details, I hope you are onto something, I never count out American ingenuity to solve our problems.
i think i see a pattern
https://www.worldoil.com/news/2023/8/16/occidental-to-acquire-direct-air-capture-company-for-1-1-billion/
It’s amazing grift. We’re saved.
An easier solution would be to just not dig up the fossil fuels in the first place, but I’m a dumb dumb and not a leading Big Oil brainiac, so don’t ask me.
Gerry
My recollection of their objective when I started following Carbon Engineering was to make fuel. They used hydrogen made by using solar powered electrolysis, combined with the CO2 to make a few litres of a synthetic fuel. That is how they Bill Gates interested. At the time it was not economic. Not sure what happened with that direction. They kept on making the capture part more efficient. Surprised to see how well they have done since I have not heard much over the last five years.
You’re exactly right, Ovi. I too was surprised when they managed to scale the process to a commercial level. It’s very interesting that Bill Gates is the money behind this, and one of his best friends, Warren Buffett, now owns 25% of Occidental, which just bought Carbon Engineering. I doubt that’s a coincidence.
Occidental has been partnered up with CE for the last five years, and I think they kept the thing quiet.
This is going to be a really big deal, if it works as well as they’re advertising.
The Big Three (Oxy, Chevron, Exxon) are all shifting very quickly to carbon capture, with hydrogen from hydrolysis. and synthetic fuels. But as far as I know, Occidental is the only one with something like this.
API
Crude -6.195mm (-1.7mm exp)
Cushing -1.00mm
Gasoline +700k (-1.2mm exp)
Distillates -800k (-100k exp)
DOE
Crude -5.96mm (-1.7mm exp)
Cushing -837k
Gasoline -262k (-1.2mm exp)
Distillates +296k (-100k exp)
Production +400 kbpd in just one week. Which shows a hint to the quality of the data.
“US Crude production surged again last week – despite the decline in the rig count – up to near pre-COVID levels…”
according to Zero hedge;
https://www.zerohedge.com/energy/wti-extends-losses-crude-production-nears-pre-covid-highs-spr-build
Now this leads to a question. Since I do not live in the weeds on these issue like Dennis and OVI (I mean that in a polite way) how do we account for a production increase after months of rig reductions. I understand weekly data is volatile but putting that aside, the increase matches what the EIA was predicting and confirms the point made in an article I posted up thread. I first go to they are completing the declared dead duc’s by Dennis and Mike, I know Ovintiv has completed the wells we drilled with them July 22, last month. It could also be be efficiency, wells are being drilled faster although I did not make note of that in the latest company presentations. It could also be higher well productivity. I do not have the answer but it’s worth nothing this is an aberration and deserving of some time to figure it out. Last idea I have is, now that the bigger majors are going balls deep in shale perhaps they are impacting the numbers and we just do not have the full data set to make a conclusion. Ideas?
TexasTeaTwo
Here is your answer from Last week’s report.
Crude Oil Production Re-benchmarking Notice: When we release the Short-Term Energy Outlook (STEO) each month, the weekly estimates of domestic crude oil production are reviewed to identify any differences between recent trends in survey-based domestic production reported in the Petroleum Supply Monthly (PSM) and other current data. If we find a large difference between the two series, we may re-benchmark the weekly production estimate on weeks when we release STEO. This week’s domestic crude oil production estimate incorporates a re-benchmarking that increased estimated volumes by 417,000 barrels per day, which is about 3.3% of this week’s estimated production total.
So that´s the key, re-benchmark, should have thought about that in my salary negotiations…
The sky´s the limit now!
Ovi and Coffee, thanks
https://www.worldoil.com/news/2023/8/16/enverus-u-s-shale-production-dropping-faster-than-expected/
TTT,
Although Ovi may have somewhat answered your question, the sheer, cumulative scale of the ongoing efficiency improvements ought not to be underestimated.
As the gas boys have historically led the oil boys in this so called Shale Era, a quick glance at recent pronouncements may give some perspective.
EQT expects to annually produce 5 Bcfed (almost one million barrels of oil in energy equivalent) using just 2 to 3 rigs. They drilled a >18,000 foot lateral in 48 hours – one run – with the first 12,300 feet being done in a record 24 hours.
Companies are routinely completing almost 10 frac stages per day (Antero is averaging over 11) and the widespread use of modified snubbing units for drilling out frac plugs is shortening the drill out time – and overall completion time – significantly. This is in addition to longer laterals and so called simulfracs which the deeper pocketed operators can more easily perform. Upfront capital expenses can be high. Antero averages 6 new wells per pad each ‘visit’. Their average ‘cycle time’ – from spudding to turning to sales – is a ridiculously short 129 days.
Side note … while I no longer follow the oil side closely, it seems that completions are trending towards one perf per cluster – spaced at ~15 foot intervals – and located at the 12 o’clock position.
Furthermore, (and I do not know how this can be determined), there seems to be a growing consensus that the vast amount of recovered oil from horizontal wells is actually only coming from a feet away from the pipe.
If this assessment proves accurate, there could be many ramifications going forward.
As the Exxon CEO recently stated – in effect – there are still a lot of unknowns regarding the fracturing process.
Coffee you probably caught the ET news today. Consolidation in the industry is something you were predicting several months back. You probably also saw the news that Mexico reported record imports of nat gas. Again something you were on to several months back.
https://finance.yahoo.com/m/61c660fe-05be-3a21-be0a-ce3cd942ff11/energy-transfer-to-buy.html
North Dakota June Production
Up 32 kb/d to 1,167 kb/d, highest since January 2021.
Ovi,
Bakken oil production in June 2023 should be higher than in 2021 & 2022, because they have completed a BOATLOAD more wells. I am surprised that it isn’t higher.
Bakken Wells Completed:
JAN-JUN 2021 = 292
JAN-JUN 2022 = 291
JAN-JUN 2023 = 489
So, with nearly 200 more wells this year, production is up to 1,167 kb/d??
LOL,
steve
Order of 10,000 active wells in the Bakken, so average is roughly 100 barrels per day. Average stripper well produces 10-15 barrels per day. Difference is that strippers can produce for a long time, but fracked wells exponentially decline in the tails.
Steve
In the Bakken the new wells barely offset the decline from the older wells. According to the DPR, for June the new Bakken wells added 57.6 kb/d and the old producers removed 54 kb/d.
The other issue that ND faces is the harsh winters when they have to shut down drilling and completions. During that shutdown, decline continues in the producing wells and it is difficult to make that up. Bottom line is that I believe that ND is on a plateau.
Add to those issues, the slow decline in production per well and the declining peak production of the newer wells. According to NoviLabs, peak production for 2020 wells was 751 b/d. The 2023 wells are peaking at 690 b/d. A lot of headwinds.
Falling Peak Production
Dennis, I want to follow up on your conclusion there are “several thousand” DEAD DUCS based on some private conversation you had with the general several months back. This is not to pick an argument, it is to try to understand where I might not be up to speed. A quick google search suggest the overwhelming number of DUCS will be completed and why “some” may not be. While I agree largely with the articles conclusions and certainly can see their points, it does not make any sense to me that there are several 1000 DUCS with the permanent problems to classify them as dead. The last article suggest perhaps 25% maybe dead. The one and only reason I can think of is bad title issues. Those can be a whole other discussion, but if a well was cased it almost certainly (99%) was done so with the intent of completion. Keep in mind when you choose to complete a well the only economics you care about are, can you get back in revenue the cost of the completion, the drilling and casing cost are already sunk. it would take some pretty crappy rock to not pay out completion cost.
https://www.arnolditkin.com/blog/oilfield-accidents/drilled-but-uncompleted-wells-ducs-what-they-are/
https://www.jdsupra.com/legalnews/here-are-4-reasons-causing-dead-ducs-3962365/
https://jpt.spe.org/as-the-ducs-go-away-it-is-time-to-drill-more-in-the-us
Texastea,
I don’t buy the dead DUC stuff. According to Novi Labs there are about 2200 DUCs in the Permian basin alone as of March 2023, in Dec 2022 there were about 2700 DUCs (probably a better count than March when data would be less completed from State agencies.)
I agree, if a well has been cased it is likley it will eventually be fracked about 99% of the time or more.
Dennis, the reason for dead DUCs is that after the well is drilled, they did not find that the shale would produce nearly as much oil as they thought it would. I hope you know that they can tell from the samples they pull up, just how successful a well will likely be. It costs a lot of money to frac a well. If it looks like it will not produce enough money to pay back the investment, they just leave it.
However, almost any well will produce some oil. So if the driller has a well that will perform poorly, he will let it set until the price of oil reaches a point where it will be profitable. So if oil hits $150 a barrel, a lot of dead Ducs could come back to life.
Ron,
I may be wrong, there are different opinions on this, it seems to me that Texasteatwo may be correct in this case, but there are others with far more knowledge than me that might disagree. The real answer will be known in good time.
Dennis, I do not understand your reply at all. It said nothing. Do you disagree with anything in my post? If so, what. And exactly what will be known in good time? I am not all that good with riddles.
Ron allow me to take a crack at this for you. As you know and contrary to the generals constant “our” oil references, most all oil and gas in the United states is privately owned or owned by state or federal entities. The oil company ask for contracted rights to develop these mineral right based on contracts referred to as an OIL and Gas leases. The lease terms include clauses that require payment for SHUT IN Wells. That is to say, a company can not drill a well and NOT COMPLETE it without paying the minerals owners shut-in royalties. Usually there is specified period of time that is allowed, which of course can be extended by mutual agreement which of course would require additional payment. Now each lease has a primary term, 1 year, 2 years, you get the idea. Once the primary term of the lease has expired, shut-in wells can not hold BY production (HPB) the lease longer than the primary term or shut-in royalty terms unless agreed to by a new contract. I can assure you mineral owners will sue the pants off operators who try to abuse the terms of their lease and keep their minerals from being developed. Secondly, let’s say there is a well drilled nearby on a different lease. A mineral owner can sue for recovery from the oil and gas company who will not recover the portion of oil and gas that is under their land. I could go on and on the legal reasons why there are few if any dead ducs.
ON a more simplistic economic basis, when you drill a well, you evaluate the well for paying quantities of oil and gas ,that is true. Once TD, total depth, is reached, partners collectively decide to set casing or plug the well. The decision at that point is, do we think the well will pay out the completion cost, if the answer is NO, the normal course of business is just to plug the well, same if drilling issues are encountered while drilling and recovery of well bore is cost prohibitive. If the answer is yes the normal course of business to to complete the well under terms that are in the leases.
There are virtually no reason I can think of where an oil company will set pipe on a well with the intent to never complete it.
Now, having said all that, it is possible and routine as I have done it personally to drill a well, hold the largest possible unit (number of acres) with a commercially producing well and then drill subsequent wells that can be competed at any time, as long as the original well is still producing commercially. BUT again that is controlled or can be by lease provisions.
Bottom line is this and I have said it before. IN my 40 years in this business as well as my life partner who has extensive land and legal work for major public corporations as a landman, she continues to work on these types of matters on a daily basis, there is no rational explanation for a HUGE number of “dead” ducs, we can think of. Hope that helps. forgive any spelling mistake I had to get this out quickly.
Ron Patterson, you would be ill advised to accept any of these explanations as reasons why all DUC’s will eventually be completed. Please do not. I can think of a dozen reasons why they will not… without substantially higher product prices or complete side-tracks (re-drills). Or, if ever.
https://www.oilystuffblog.com/forumstuff/main/comment/edc09627-35c7-420b-a677-83944d1efdd9?postId=64de1e2757efac0010de6d5c
It’s hard to accept that finance “engineers” that run the tight oil and gas phenomena would borrow money to drill wells, pay interest on those wells for five years or more and not complete them… but stupid is, as stupid does. Its OPM.
You are basically correct to have doubt; don’t let the cheerleaders dissuade you from common sense. In 2022, at $91/$6, every remaining tight oil or gas well DUC in the US should have been completed. There is a reason they weren’t.
What, they were waiting for higher product prices?! Phfttttt.
Trust your instincts.
Ron,
A dead DUC is one that will never be completed, I disagree with those who claim the number of “dead DUCs” is a large percentage of current DUCs, my guess is that the dead DUCs might be 10% of the total DUCs at most. This seems to line up roughly with Texasteatwo’s assessment, others in the oil industry may disagree with that assessment. Eventually we will know how many DUCs are really “dead”, for now we can only speculate.
I agree that if oil prices were to remain very low (under $70/bo in 2023$) there would be more dead DUCs and if oil prices were higher (say $150/bo or higher) there would be fewer. My guess is that oil prices are likely to be relatively high from 2024 to 2032 and that the number of dead DUCs will be pretty small (under 10% of current DUCs).
Note that the Novis Labs DUC estimate is very different and likely much more accurate than the EIA estimate.
Peak oil 2018?
Fact is nobody knows how much oil is being produced today.
Russian oil tankers are transferring oil from one tanker to another at sea. They are turning off transponders and noone knows how much oil is offloaded and where.
https://foreignpolicy.com/2022/11/23/how-greek-companies-and-ghost-ships-are-helping-russia/
https://insurancemarinenews.com/insurance-marine-news/russia-the-main-reason-for-oil-transfers-at-sea-more-than-trebling/
Who know how much oil is being produced in Iran and bought by Chinese dictatorship.( they have been playing the most ruthless and intelligent foreign policy for decades)
https://www.iranintl.com/en/202305118522
Oil theft is a major issue and further muddies the waters.
https://www.wider.unu.edu/publication/global-oil-theft-impact-and-policy-responses
All we have at the moment is the fact that OPEC has cut production due to low oil prices and that crude prices are under $90 as compared to over $120 for three years around 2012-2014.
This tells us there is plenty of oil around sold legally and ilegally.
Once oil prices start hitting $130 and above for at least 2 years, this will probably indicate peak global production.
Charles,
I agree except the last sentence, not too sure, depends on the economic climate at the time. Geological peak oil may be hidden behind a veil of anemic global growth, thus there is a probability in my opinion that geological peak oil maybe elusive and difficult to spot.
Charles.
The costs of operations are also significantly higher now than 10 years ago.
So $75 oil really isn’t that great. Even $90 isn’t that great. We got over $90 average in 2022 and still made a lot less $ than in 2011-14.
I still think we had the most fun producing oil 2005-2006. Prices were in the $50s. Operating costs were so much lower. There were rigs available to do service work. We weren’t considered pariahs by government regulators or much of the public.
2008 messed stuff up. First big increase in cost of operations. Then 2011-14. But 2022 was probably the worst because labor costs exploded.
In reality, there just isn’t enough labor out there.
In our field there is a lot of production for sale. Few buyers, not because they don’t want it, but because they don’t know long term how they will operate it.
We got lucky and sold some to a young man who will take care of it himself. We had to finance him. Banks won’t touch stripper production.
Talked to owner of a service firm. He used to have 20 employees. He now has 8. Half of his rigs are stacked. We have some wells to plug. He will get to them, but it will be a few months. There was a time where he would have gotten on them next week. Cannot anymore, no labor.
Those critical of immigration need to understand without it, we not only would be starving here in the USA, but the shale industry in the EFS and Permian would be in big trouble.
The people where I live are mostly far right politically. But even here, over 1,000 miles from the Southern border, those right wing business owners are trying to find Mexican migrant labor because there isn’t anyone else. Not just in the melon fields, but everywhere.
We had a tornado this spring. Serious damage. This summer there have been crews doing brickwork on buildings downtown that had minor damage. Everyone on the scaffolding but the company owner is from Mexico. Those Mexican men work hard.
I’m reminded of the same when we make our trips out to the OK panhandle. Lots of beef and pork comes from out there. Who do you think is working in the National meat packing plants and Seaboard hog facilities and processing plants in the panhandle and SW KS?
Shallow Sand: Great comments. Ninety dollar oil is barely keeping up w/inflation. The. Federal Reserve is jawboning another interest rate hike, which I think will break not only inflation but the spirit of performing. risky things for profit. With the shale basins maturing–unless widespread CO2 flooding turns out to be a magic bullet–more conventional wells look appealing . . . until you look at the AFE.
Gerry,
The rate hikes alone would break inflation but that’s not going to happen with $1.6 trillion in deficit spending. We’re going into fiscal dominance and not austerity.
yep i think the fed is now standing pat and inflation will stay elevated. i think they will see it as the lessor of two evils…age old story.
https://www.zerohedge.com/markets/banks-usage-emergency-fed-funds-hits-new-record-high
Charles, Put me down for broad general agreement with your comments. Further more I am “More” in agreement with Dennis’s Oil shock model up thread showing a higher worldwide oil production at some point in the future. I wont quibble with the dates because it is immaterial to your point.
I think Iran is producing and selling all they can. It’s clear in the opec cuts the world has a 3-5 million BOPD surplus. As coffee pointed out the future plans of increased production out of Iraq and others. The world has plenty of oil, thank fully now more widely distributed with American LTO.
I think its is generally accepted by most observers (not cultist) that the world has plenty of oil for the short and medium term (10 years). And with proper discipline, read price controls for suffieint future investment, that time frame can be extended. To me that is a good thing.
Texas
If most people buy electric vehicles in the coming years, then oil prices could happily go up to $150/$200 a barrel. This would make items cost a little more in shops but people would not be spending $100 a week buying fuel.
The higher oil price would allow for more difficult and expensive drilling and the reduction in ice cars would allow that fuel to be used so trucking, aviation and shipping could continue to expand.
Much depends on the rollout of electric vehicles and the price of oil. A global recession could easily disguise peak oil as lack of demand.
An alternative view on oil prices going forward from CITI…they say short
https://oilprice.com/Latest-Energy-News/World-News/Citigroup-Says-To-Short-Oil-After-Summer-Is-Over.html
I don’t trade the commodity but i will take the other side of this argument for two reasons. First I don’t see growth in the short cycle tight oil play this year or until WTI is north of $90 for some length of time. Second we are watching a power play, those with actual oil and those with unlimited money to trade. The winner will make the other their bitch forever. These are high stakes especially as the US election cycle begins in earnest. I am betting on OPEC plus with Saudi leadership to win.
Now this is just random maga conspiracy bullshit and I can offer NO proof on my part to back it up. but I watch these markets Oil is toasted almost every sunday night and monday morning and has been for close to 2 years now based on absolutely NO news. Then the the weekly numbers come up and it slowly claws it way back only to be beaten down the start of the next week.
I don’t know if any you follow the precious metal markets but you see a similar pattern. When markets are at their most illiquid, someones come in and sell years worth of paper to drive down the price. Those type of trades do not happen if one is trying to maximize a gain or minimize a lost. I think the Saudi are in it to win it. Higher for longer, so much like the fed that when they speak others listen and they therefor going forward can carry a big stick and talk softly. that is how I see it from the pits.
Yeah, these games can go on until the commercial stocks get too low – then seller of the real stuff will overpower paper seller.
We saw it in the Corona bottom when the tanks got full – 0 or below. The other way will get ugly, too.
What do states buy? First food then oil then everything else. We have been short before this with the Wagner coup in Russia – a few more day and they would have been in cicil war.
TT you really need to look beyond the FED and other central banks that have nothing to do with the actual global monetary system.
Stop ignoring what’s going on in China. And the reason why dollars aren’t being lent into China. Parts very important parts of the global economy are in free fall.
The largest importer of oil. Their economy is in free fall. Because lack of external demand for their exports. No fucking reason to lend money into China because there is no demand for their exports. Internal demand is also an issue.
We have a massive supply gut of unsold products in the US. Just look at the damn trade data. It’s bad. Really bad. Orders being cancelled left and right.
Look no further than that. Only reprieve oil prices got from their bearish trajectory was the the CTA’s creating an against the trend move upward in price.
This against the trend move is also about over.
OPEC doesn’t create the liquidity needed to move their product which is oil around the world. Banks do that. Eurodollar banks.
Real world issues not some conspiracy selling central banks with endless “money” or bank reserves that aren’t even used in global monetary system.
HHH, lot to unpack there. But you need to recognize the market fundamentals of oil, which you completely ignore. I have been “correct” while you have been wrong. That may change but for the time being I am watching what the Saudi’s, want, if they wont sell their oil for less that $70 none of the stuff you mention above will get the price of oil below that, at least for any length of time. We have beat that horse to death. Time will tell. I read what you say but i must ignore a great deal of it in favor of more important factors.
HHH some oil market fundamentals analysis. I like these guys, HFI research ,and they are rapidly going to the top of my reading list.
https://seekingalpha.com/article/4629583-opec-plus-mid-month-update-saudi-and-russia-are-serious-on-reducing-supplies
as a marker, they are calling for another large inventory draw down next week. lets keep score on their accuracy.
To expand on my conspiracy above, I like many have been bewildered by the markets late reaction to the Saudi plus announced production and exports cut. Over the last several months a new term “de-stocking” has emerged. De-stocking refers to the process whereby large buyers of crude oil could HOLD inventory above their specific needs as the carrying cost of doing so was very little with zero interest rates. As interest rates increased, so did the cost of holding excess inventory, so slowing, even in the face of production cuts market participants needed to sell down their inventory. It may be that is what OPEC + thought they needed to get ahead of as well as putting an end to Biden administration “market manipulation” using the SPR. In any event as we now know the Biden administration is allowing Iran to sell every drop of oil they can, as I assume they now are looking at what will be a political liability as gasoline crosses the $4.00 mark. There are probably legitimate market reason for the aberration we have witnessed but nevertheless less, between keeping oil prices low, both as a boost to the war effort (keeping Russia’s income down) and well as domestic political advantage I would not be surprised, if with a wink and a nod, market manipulation plays some roll.
Points/data below support the general understanding that global growth in 2008 stopped due to a lack of oil growth. Plateau followed with minimal growth from ~2008 to 2016, and decline phase started in ~2018.
Now we are seeing the decline phase steepen, sharp drops in all major producing countries are in progress.
Annualized decline rates of up to 7-8% can be expected in near term. Average decline rates may be somewhat lower depending on many factors.
World peak imports was 2016 @ 71.2 mb/d, 2022 was 68.8 mb/d.
Up to 2008, imports grew by ~4% annually from 1986 – 2008.
From 2008 to 2014 imports grew by <1% annually. High prices during this period failed to significantly impact growth in oil exports.
Peak refining capacity:
Global Peak – 2019 @ 101.97 mb/d
China/Asia – 2021 @ 36.3 mb/d (36%) [In 2022 China, India, and Japan accounted for 31% of imports]
N. Americas – 2019 @ 22.6 mb/d (22%) [In 2022 US accounted for 12% of imports]
Europe – 1980 @ 23.2 mb/d; 2003 @ 18.4 md/d (currently 15 mb/d in 2022) (15%) [In 2022 Europe accounted for 21% of imports]
Middle East – 2022 @ 11.1 mb/d (11%)
CIS – 1979 @ 9.9 mb/d, currently 8.5 mb/d (8%)
C./S. Americas – 1980 @ 7.2 mb/d (currently 6.2 mb/d in 2022) (6%)
Africa – 2012 @ 3.6 mb/d (3.3 mb/d in 2022) (3%)
Also, refinery throughput grew from 56 mb/d in 1981 to a peak of 83 mb/d in 2018. An average annual increase in throughput of 0.73 mb/d (annual growth rate of 1%). More recently, throughput has not recovered and was only 82 mb/d in 2022. Growth in refining capacity also stalled out in ~2015, prior to 2015 refining capacity increased by 1.3%, but following 2015 growth has been an average of 0.5% annually. Excluding Asia, capacity has actually been shrinking by ~0.5% since peaking in 2019.
Kengeo,
Why exclude Asia? It is World refining capacity that matters and Asia is where most of the growth in demand for oil is occuring, so it makes little sense to exclude Asia. What happened after 2019? Anything significant that you can think of?
“Points/data below support the general understanding that global growth in 2008 stopped due to a lack of oil growth.”
Global growth stopped in 2008? It doesn’t really look like that:
Nick G – You a comedian?
https://econofact.org/why-is-the-u-s-debt-expected-to-keep-growing
You might want to break out your assumptions and logic.
Your source refers to just the US, and to debt, and to the future. It doesn’t seem to show that world growth has already stopped.
Someone using GDP seriously in 2023. This is wild, like citing Tucker Carlson for vaccine knowledge.
How else would you measure “global growth”?
If we go by species extinction, then we’re doing even better!
But seriously, GDP is a cooked and utterly irrelevant number to anyone. It always goes up, big whoop. So do pollution levels, number of hectares of forest destroyed, amount of debt accrued, volume of ships and planes moving, the variety of streaming services, comic book movie adaptations, Ben & Jerry flavours… Progress, I suppose.
Feel free to go tell everyone going to food banks (a thing that wasn’t even talked about in my nation prior to 2008) that, actually, they’re much better off now since GDP is bigger than 2008. In fact, things have never been so good!
On an unrelated note, I just got done rewatching Brazil. Great film, and somehow not as dystopian as reality is becoming now.
https://twitter.com/AlexEpstein/status/1692268857690386510
Wind and solar are FAILING Texas
On a super-hot day in Texas, wind is totally out to lunch and solar isn’t performing very well, either.
Electricity prices are sky-high.
thank god for nat gas and coal doing the heavy lifting per usual.
Without Solar Power, This Texas Heat Wave Would Burn Much Worse
Thank goodness the state GOP’s war on renewables has, so far, failed.
“Much like last summer, solar electricity has been critical for keeping the lights on throughout Texas the past few days. It has been a workhorse during the afternoon hours, fulfilling more than 15 percent of the state’s power needs during some of the most critical periods. Natural gas and wind still contribute a greater share, so solar can’t solely be credited with saving our bacon during this first summer heat wave. But when it’s so hot out that the bacon will sizzle on the sidewalk, the sun’s largesse has played a key role in preventing brownouts.”
“The same sun that heats up our buildings and drives our need for AC is the same sun that makes electricity with solar panels. It lines up pretty well,” says Josh Rhodes, a research scientist at the University of Texas at Austin. By contrast, the wind tends to die down on hot afternoons, as well as in the late summer, when temperatures peak. So if Texas didn’t have as much solar power, we’d have to rely more on older, inefficient natural gas plants that operate only during periods of peak demand. We’d risk pushing them to the edge of their capacity and seeing them break down for days or weeks. “Having solar provide during the hottest parts of the day is allowing our thermal fleet to not run itself into the ground as fast,” Rhodes says. It’s also saving Texans money—keeping a lid on electricity costs by replacing the most expensive-to-run gas-powered plants with relatively inexpensive solar.”
more at:
https://www.texasmonthly.com/news-politics/solar-power-texas-heat-wave/
It is not a case of either or.
Wind power is great when wind conditions are good and solar is great particularly when there are clear skies. However wind and solar need almost 100% backup, which is obviously more expensive than just coal or gas. Very often the billions of dollars invested in wind and solar are producing next to nothing.
I am in favour of wind and solar because gas will not last forever and neither will coal, so we need to be ahead of the decline curve as they slowly run out.
Germany dispite having more installed solar and wind capacity than it’s highest ever demand uses lots of coal and gas.
https://energy-charts.info/charts/power/chart.htm?l=en&c=DE&stacking=stacked_absolute_area&year=2022&week=48
The idea that batteries can power cities is still a future fantasy and I don’t need to see any more articles of what might be.
Today (which is all that counts) only nuclear, coal and gas are there on a freezing November evening when little wind is blowing.
The days of cheap electricity are gone.
NIck, we are not going to agree, I happen to to live it texas and I would not use texas monthly as a source of data except maybe a restaurant review. Having said that, energy sources much like a gun or fire extinguisher, they are useless if unavailable when they are needed most. I am not going to debate this the experiment has failed, of course it will continue and it will also continue to fail.
Texas tea,
The failure of the Texas grid had very little to do with wind or solar and was a matter of poor interconnection of the Texas Grid with other US Grid networks and poor preparation of Texas Utilities for severe winter weather. It really is that simple. If Texas wants to go it alone for electricity, then it needs to prepare better for winter weather. Much of the failure of the Texas grid was a failure of natural gas.
Dennis,
You, once again, prompted me to do some research and try to ‘get to the bottom’ of matters (similar to your spurring me to investigate a 2018 blackout in Victoria, Australia).
Immediately following the Uri blackout and ensuing disasters, the ever practical Texans appointed an impartial blue ribbon panel to expeditiously investigate and report on the event.
The ~70 page report and accompanying ~30 page appendix should be THE defining analysis on this tragic affair.
From the Executive Summary … “The failure of the electricity and natural gas systems … had no single cause.”
Your sincere comment on Ercot’s implosion is but another display of a Rorschach-like response to pressing matters of the day. (See Nick G’s article above. Good to see you back, Nick.)
Grid interconnectivity is definitely a double edged sword as California – dependent upon ~25% of its juice from other states (the Blanche Dubois approach … dependin’ upon the kahndness of strangers) – suffers curtailment when regional heat waves occur.
Your New England region continues to skirt perilously close to disaster during prolonged winter cold snaps despite excellent grid interconnectivity.
Coffee….I had to google Rorschach like🤠
Coffeeguyzz, I have read the report, of course there was no single cause, this is generally true of every disaster so basically a statement of the obvious. Wind power output was low due to icing, but natural gas outages were the biggest part of the problem.
Dennis I think we are talking about two different issues. The breakdown of the texas electrical system during the winter storm 2 years ago was indeed “PARTLY” due to freeze up of nat gas AS WELL AS stalled wind power due to ice on the windmill and light winds, as well as not having sufficient coal on hand to stabilize the grid, perhaps we can agree up to that point.
Here is the difference, Texas was trying to require, via new legislation, that all sources of electricity connected to the gird guarantee what they could deliver. That is easy for nat gas because the solution is only writing a check to winterize the pipes. Heretofore it was a cost benefit analysis operators rarely face lengthy cold spells so chose not to winterize.
There is no amount of check writing that is going to make the wind blow when it does not or the sun shine when it is not. There for the “Green energy” companies were threatening to leave texas and were successful in killing the legislation in the house although it was passed in the senate.
At one point during the heat of the day wind was only supplying 4.4% of capacity.
“At one point this afternoon — the hottest part of the day — wind energy in #Texas was performing at a tiny 4.4% of capacity (capacity for wind is 38,000 MW)! It performed far worse than any other energy source just as we have been saying. ”
Wind does nothing but raise rates and destabilize the grid.” https://twitter.com/USWeatherExpert/status/1692355188932125086
you say: If Texas wants to go it alone for electricity, then it needs to prepare better for winter weather. Much of the failure of the Texas grid was a failure of natural gas.” and I say or burn crude oil like you Yankees !
Texasteatwo,
Not a lot of catastrophic grid failures in New England that I can remember, except 98 when a Winter Ice Storm knocked down a lot of powerlines. Yes we burn crude at times when natural gas supply becomes short due to New York State not allowing a pipeline from Pennsylvannia to New England.
Wind and Solar are intermittent and when widely distributed over a large interconnected area the intermittency system wide is diminished. Natural Gas, nuclear or coal can be used to backup wind and solar and eventually synthetic fuels and batteries will be used for cheaper overall cost than using coal, nuclear, and natural gas.
ERCOT has been highly skeptical of forming extensive interconnections to the Eastern and Western grids–and this has to do with more than Texas hubris. GIC (geomagnetic induced current) is that third-phase belch which emits from a near-space solar storm, but also could result from a nuclear device exploded high above our atmosphere with malicious intent. GIC is the current that emits from any E3 phase of such a HEMP (high altitude electromagnetic pulse). As it happens, natural GIC from solar events are much more common in the high latitudes, and specifically affect the Eastern grid the most. GIC is “cumulative,” in that once the current intrudes in long-line systems its effects can induce multiple, repetitive scars in massive transformers but also destroy long transmission lines.
As the world runs this poorly-thought-out energy transition experiment–pouring trillions of borrowed dollars into it–there will be logarithmic increases in the demand for electricity beyond imagined levels. This is happening in Texas currently. It is also occurring in places not as blessed with multiple energy sources as Texas. ERCOT will be able to meet the demand through solar, wind, coal, NG and even a lithium battery dump installed by Elon Musk. As carbon capture grows in Texas–and it will go very fast–blue hydrogen will rapidly become incorporated into the energy mix. I presume that previously-worried-about intrinsic grid inertia has been overcome by synthetic inertia inserted by a flying algorithm, so now variable input sources can be incorporated as available (without a spinning turbine with stored inertia).
The world is about to become an even more dangerous place—-because of patches of extreme electricity shortages. And statistically, no one know where, there is apt to be a HEMP with E3 type GIC spreading cumulatively along long transmission lines, wreaking havoc along that electricity distribution. When that happens–and statistically it’s more likely to happen to the Eastern, then the Western grid–ERCOT might just be the big isolated power grid that saves America.
As a country, we need to applaud Texas and its efforts to grow its electric grid. Texas isn’t the only state to appreciate the vulnerability of the electric grid, but it’s nearly the only one with the ability to grow nameplate output to ever-higher levels using a variety of sources. To show this vulnerability, consider this (and I’m not picking on California). For twenty years, when California got it an electricity pinch, the governor would call up the governor of Wyoming and ask for electricity to be sent along a (very) long transmission line that extended from the Jim Bridger coal-fired utility plant all the say to California. The Jim Bridger was vastly overbuilt as a commercial conduit to California, so this was no great imposition. California could subtly use coal-fired electricity while advertising itself as a “coal-free” state, and its electricity needs were met.
Using coal-fired utility plants is soon going to achieve the social status of visiting the Red Light District. You simply can’t say clean energy and coal electricity in the same sentence without someone laughing at you. Enter ERCOT, soon to be the electricity purveyor to the U.S.
Gerry says “As a country, we need to applaud Texas and its efforts to grow its electric grid.” Agreed but what texas is dealing with is a rapid population growth primary from states with high regulation, high taxes and higher cost of living, in other words, blue states. Texas would be having a much better time of it if the dems were not chasing out their populations. 😎
The Narcissist from Texas pats himself on the back as he demeans others from his conservative misinformation talking points. California has been dealing with heavy immigration since World War 2. Why ? Because of it’s beautiful coastline, mild weather and opportunity. Those who can’t compete for now the highest praised quality of life who fail for limited space. Turn to Texas for cheap low cost land and poor weather for humans.
https://weather.com/weather/monthly/l/2f14ad963bc0efd88183cdff2d1e9f3c3599edad92be15c25b4aa10b9326f43c
VS.
https://weather.com/weather/monthly/l/7b152953560e447726ef93c0251c017bf4ae36bf4fd7a749edf57391532d984c
Eat your heart out with the real facts and your Ford Pinto weather.
https://en.wikipedia.org/wiki/List_of_automobiles_known_for_negative_reception
Nominal GDP per capita 2023
California * $96,222
Texas * $81,130
https://en.wikipedia.org/wiki/List_of_U.S._states_and_territories_by_GDP
People in California make more money. No need for Air Conditioning electric demand in Huntington Beach.
My comments were not to disparage California, but rather to extend a congratulatory pat on the back to Texas for combining the old (NG and oil) with the new in preparation to become the electricity capitol of the United States. Carbon capture and the formation of green hydrogen is about to go ballistic in south Texas. I have little doubt that Texas will embrace the rapid buildout of small modular nuclear to add to its energy arsenal. Texas is energy.
As Texas expands to fulfill that role, ERCOT will very likely keep its interconnectivity to the myriad other utilities making up the Western & Eastern grids to a minimum–perhaps only one large transmission line to each, which can be shut off and isolated until absolutely needed. This would ensure the isolation of what is shaping up to be the formation of the epicenter of energy in this country.
In importance for survival, it’s going to be food & water, electricity, defense. HEMP via E3 intrusion of our electric grid competes with grid-hacking as our greatest threat to electricity security. ERCOT, despite its inadequacies, is rapidly becoming our Iron Dome against solar & hostile attack. No hate in this, just plain fact. And I can damn well guarantee that when–god forbid–the grid breakdown occurs (not if), ERCOT will provide electricity to places in need. Including California.
Gerry, i like the way you think, if you will accept a compliment from a bullshitter🖖
“Unlike Florida, where growth stemmed mainly from domestic migration, Texas experienced moderate increases across all components of population change.
About half of Texas’s population gain since 2000 resulted from natural increase (more births than deaths); around 29% from net domestic migration gains; and 22% from net international migration gains.
https://www.census.gov/library/stories/2023/03/texas-population-passes-the-30-million-mark-in-2022.html#:~:text=The%20population%20of%20Texas%2C%20the,the%20next%20largest%2Dgaining%20state.
Just the facts beach bum, humans do prefer better weather but as a life long texan, born and raised, I would not give up my quality of life, wide open spaces and small l town life for any where else. Texas is the 4th fastest growing state 30% of which is domestic migration, read blue state flight.
On August 14 I posted a table above showing that no wells had been fracked in Midland county since June 10. Two weeks previous to that, 5 wells had been fracked on May 22.
I have checked again today and there is no change. The last frac is still recorded for June 10.
Can anybody provide any information on fracking activity in the Midland County.
https://oilprice.com/Energy/Energy-General/Rig-Count-Decline-Accelerates-Amid-Rising-US-Crude-Oil-Production.html
this is a bit surprising but the trend is intact. where is the floor?
TexasTeaTwo
A little too much hype here. Hz oil rigs were only down by 3 to 467.
I will post a full report for Hz oil later tonight after I get the Frac count.
good man OVI!
Ovi,
There were (7) U.S. Horizontal Rigs cut this week. That is a pretty substantial number regardless if it was split between oil and gas.
Also, U.S. Natgas price continues to remain weak as the WTIC oil price closes above $81 for the week.
If current Europe & U.S. Natgas storage trends continue for the next 4-6 weeks and we don’t have any major geopolitical events or extremely hot weather, then I would suggest…
There is a good probability that the U.S. Natgas Price falls into the $1 range or even below.
steve
Steve
See my reply on rigs below under Rig update. I think Fracs are more critical to Fracs than rigs since my reading of the data is that the rig crews are drilling their wells in fewer days/hrs.
I don’t follow NG but I still see WTI above $85 by early September.
Two possible hurricanes coming to the Gulf in a few weeks.
preliminary winter forecast favor nat gas. A couple of early cold spells will light a fire under nat gas. Not saying it is going to happen but it is something to watch. We may go winter will less than 300BCf over the 5 years average, two additional weeks of cold this winter will take care of any “glut”.
https://twitter.com/BigJoeBastardi/status/1692626836394582280
Due to the immense and growing water cut of the heart of the Delaware Basin, along with a few phenomenal wells (Boundary Raider, North Thistle), coupled with a fairly constant GOR for some time, frequently associated with a rising water cut, I am beginning to think that the Delaware is as much of a water drive reservoir as a gas-driven one. Am I the last person to figure that out? Or is it truly naive?
This has immense ramifications. If it is solution gas driven, as I had imagined, then each well is its own impenetrable boundary-defined little microcosm with oil gathering mostly dependent on the quality of the rock that was fractured, the amount of gas in solution, and also the amount of gas wanting to leave the rock and enter solution. On the other hand, if this is water driven by an aquifer under pressure, then it is like a communal watering hole: when the water pressure and level goes down, the utility dries up for the whole village.
In other words, the water production ails that afflict the Delaware Basin may be due to emptying the pressurized aquifer that underlies the whole thing–and the monster wells that Devon brought on may have as much to do with peak reservoir water pressure as the oil density of the shale. The wells in the Delaware seem to be tapering down together, something you wouldn’t be expected to see if the field were just gas driven.
Could somebody with more geology smarts provide elucidation?
Gerry I don’t work west Texas but i would be curious if by increased water cut you mean, a higher percentage of total fluid produced is water but oil production remains high or total production water stays flat but the amount of oil and gas is going down.
It is also possible in some areas that water bearing zones are mixed into the local geology and are opened up to the well when fraced. I would put based on the limited permeably of all shale water moving though the formation last on my list of possible explanation, but again I do not work west Texas.
Aug 18 Rig and Frac Report
Rig Count Drops but Some Return to Texas Permian
– Overall US rigs down 3
– Texas up 2, Tx Permian up 2, EF flat at 50
– NM and NM Permian flat at 105 to where it was in July 2022 but up 10 from January 2023
– Total Permian is up 2 to 310.
NG was down 4 to 104.
Frac Count for August 18
Fracs are down 6 to 256. The average Frac count for 2022 was 280. For this week the ratio of Frac spreads to rigs was 0.55. In early January with 250 Frac spreads, the ratio was 0.44. For this week with 256 Frac spreads the ratio is 0.55. This reflects the steady drop in rigs since January. This seems to imply that the Rig crews are drilling wells in fewer days, more efficient?
Unfortunately Hz oil rigs are being compared with Oil and NG fracs.
carbon capture is a thermodynamic losing game-
“Capturing CO2 emissions using direct-air-capture (DAC) technology requires almost as much energy as that contained in the fossil fuels that produced the carbon dioxide in the first place, according to new analysis.”
This shouldn’t be at all surprising to anyone who knows some chemistry and puts a little common sense to the issue.
Carbon capture therefore only makes sense (cost, ecological, energetically) in a world that has abundant excess low carbon energy such nuclear and solar. By ‘abundant excess’ I am referring to cheap and left over after all other market demand has been met.
“Energy sources need to be zero- or very low-carbon to maximize net capture efficiency —otherwise more CO2 emissions will be produced using the energy [used to capture the carbon] than would be captured from the air in the process.”
https://www.rechargenews.com/energy-transition/the-amount-of-energy-required-by-direct-air-carbon-capture-proves-it-is-an-exercise-in-futility/2-1-1067588
https://sequestration.mit.edu/pdf/1012253108full.pdf
https://www.wri.org/insights/direct-air-capture-resource-considerations-and-costs-carbon-removal
Of course we could just on pretending that global warming due to carbon and methane emission is no big deal. I know that is the stance most people prefer , and what everyone would decide if/when there is energy shortage.
When it comes to being conservative with a precious living planet, humans are losing the war quick. Combustion always has been our greatest tool of success, and it is also serving as our greatest tool of destruction.
Peak Combustion Day comes in just under 10 years, I figure, but that leaves a huge pile to burn on the backside.
There are a couple of problems with your article on the futility of DAC. One is that the article is two years old in a rapidly changing technology. Two years ago Carbon Engineering was worth about a million bucks. Recently, Occidental paid 1.2B for it. I presume it made some strides. The second “hole” in reason is that the article states a 0.04% CO2 component role in ambient air, which is akin to saying that the incidence of murderers is 0.04% in the Church of the Latter Day Saints. Try sampling the air in the Permian Basin or in South Texas where the refineries are located–that’s where they plan to build it.
The example your article gave is the DAC plant in Iceland, which is one of the most pristine places left in this old world. I understand fully that all air is eventually mixed in the troposphere, but there are local ambient hot spots for CO2. You mentioned the other day that you get paid for expert analysis. I’m not attacking you but it would appear that you’re so bent on talking your religion that you have no time to hear poor Lazarus’s side of things.
The growth in shale production is coming from smaller unknown companies .
https://futurocienciaficcionymatrix.blogspot.com/2023/08/el-crecimiento-de-la-produccion-de.html
A comment extraordinary .
” After the failure to convince the opec (especially the three attempts with Arabia, including Biden’s trip), they are now focusing on their own production. And they have chosen to commit suicide, encouraging an increase in initial production at the cost of losing final EUR. Oil matters now and not five years from now… On the other hand, looking at the substantial increase in Russian drilling, post-sanctions, it is clear that everyone is doing the same. What a long-term vision… “
Forget oil prices. What matters for the economy are fuel prices, especially diesel price. Diesel in the US in now more expensive than when oil was at 110 usd/b 10 years ago.
https://www.eia.gov/dnav/pet/hist/LeafHandler.ashx?n=PET&s=EMD_EPD2D_PTE_NUS_DPG&f=W
Diesel futures price: https://stooq.com/q/?s=lf.f&c=20y&t=l&a=lg&b=1
Electric cars decrease gasoline demand, so oil price is dragged lower. Lower oil price = less oil supply. In the same time we need more diesel than ever, but we don’t have this diesel, because of too low oil supply. So the economy is depressed, and nevertheless diesel price rises.
Good first point Alex.
as to the second however- so far EV’s have nothing to do with a supposed decline in diesel supply.
Simply, the costs of oil production are going up every year as we go after more difficult to produce pockets of oil and as the cost inputs (like steel and labor and chemicals) to the production process goes up.
Also, maybe someone here can tell us- does the current blend of produced oil in the US have a lower content of middle distillates than it did 10-20 years ago?
New posts are up.
https://peakoilbarrel.com/opec-momr-august-2023/
and
https://peakoilbarrel.com/open-thread-non-petroleum-august-19-2023/
[…] Evolución reciente de la producción mundial de crudo+condensado, datos de la Energy Administration Information d elos EU. Gráfica sacada de Peak Oil Barrel, https://peakoilbarrel.com/april-non-opec-and-world-oil-production-drops/ […]