The OPEC Monthly Oil Market Report (MOMR) for August 2023 was published recently. The last month reported in most of the OPEC charts that follow is July 2023 and output reported for OPEC nations is crude oil output in thousands of barrels per day (kb/d). In many of the OPEC charts that follow the blue line with markers is monthly output and the thin red line is the centered twelve month average (CTMA) output.
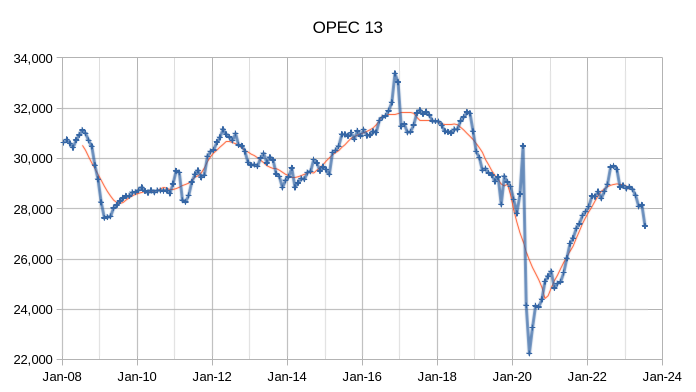
OPEC crude output was revised lower in May 2023 by 15 kb/d compared to last month’s report and June 2023 OPEC crude output was revised lower by 43 kb/d. When the World was at its CTMA peak for C+C output in 2018, OPEC crude output was about 31300 kb/d and by July 2023 OPEC crude output had fallen to roughly 3990 kb/d below the 12 month average peak in 2018.
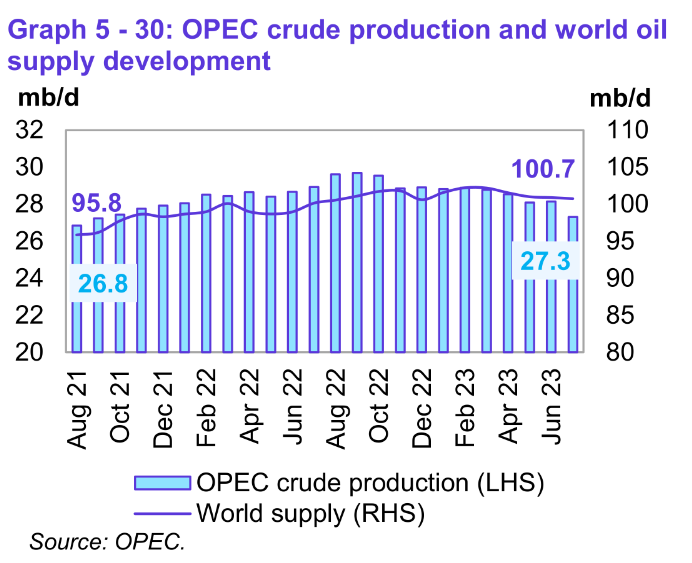
Preliminary data indicates that global liquids production in July decreased by 0.2 mb/d to average
100.7 mb/d compared with the previous month. World liquids output increased about 3.9 Mb/d in the past 23 months (from 95.8 Mb/d in August 2023).
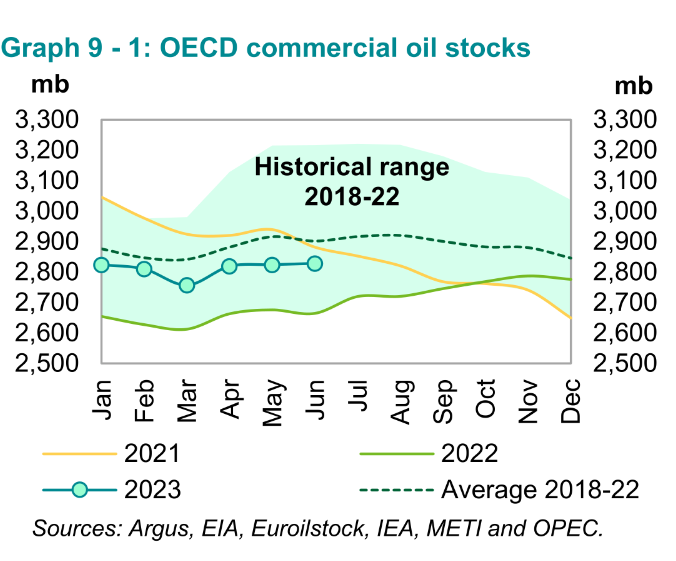
OECD commercial oil stocks increase by 4.2 Mb in June 2023, at 2828 Mb, they were 74 Mb lower than the latest five-year average. World Oil stocks are likely decreasing with the recent OPEC cuts, also note that this chart looks at commercial stocks only, in the first half of 2023 OECD SPR stocks have decreased by 30 Mb after decreasing by 270 Mb in 2022.
If OPEC continues to produce at the July 2023 level of about 27 Mb/d of crude oil, we will see a significant draw in World Oil stocks, assuming OPEC estimates for Non-OPEC Oil Supply and World Oil Demand are correct. My expectation is that the World Oil Market will become very tight and oil prices should rise, unless OPEC increases output to balance the OiI Market.
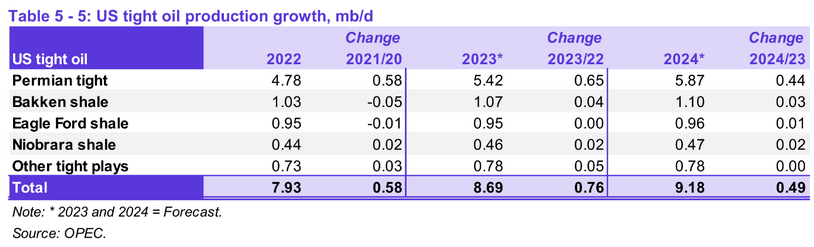
OPEC expects US tight oil output to increase by 760 kb/d in 2023 compared to 2022 (annual average output) with 650 kb/d from increased Permian basin output. In 2024 OPEC projects an increase in annual average US tight oil output of 490 kb/d with 440 kb/d coming from the Permian basin.
The OPEC estimates are optimistic in my opinion, my best guess is an increase of 723 Kb/d in US tight oil output in 2023 and an increase of 358 kb/d in 2024.
The estimate above assumes average well productivity does not change in the future as a model simplification. As the most productive areas of tight oil plays become fully developed, less productive areas will need to be developed and this will likely lead to falling average new well productivity though we do not know when this will begin or how rapidly it will progress.
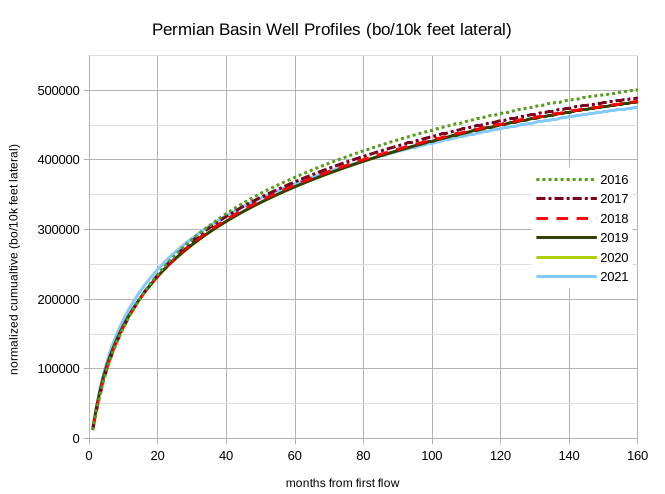
The chart above considers well profiles for the Permian Basin from 2016 to 2021 with EUR normalized for 10 thousand feet of lateral length, these well profiles are barrels of C+C and do not include natural gas or NGL output. I do not show the well profiles from 2013 to 2015, over this period EUR per 10k feet was increasing, but by 2016 it seems proppant loads and frack stages per 1000 feet of lateral were close to optimal. Increasing lateral length over the 2016 to 2021 period reduced output per foot of lateral for the average Permian well.
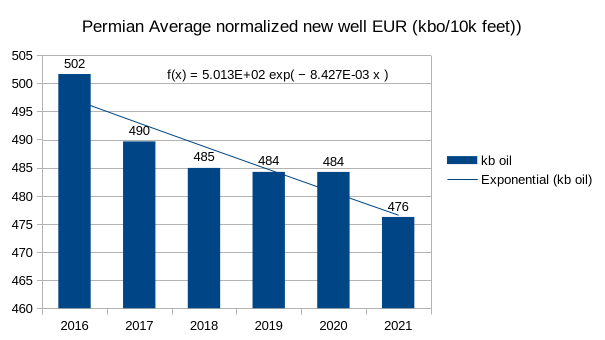
EUR normalized for a 10k lateral length (the approximate average lateral length in 2022) fell from 502 kbo in 2016 to 476 kbo in 2021. The average annual rate of decrease was about 0.84% per year over that 5 year period. It is unclear if this decrease is due to increased lateral length which would increase frictional losses along the the length of the well especially when the well has been placed on artificial lift and tend to reduce normalized EUR or due to fewer high quality areas to develop new wells. It may be a combination of the two factors.
For the Permian basin there have been about 25000 new wells completed from the end of 2015 to the end of 2021, if we assume all of the decrease in normalized productivity per 10k of lateral length has occured due to lack of quality areas to drill new wells we can adjust future productivity so that for each well developed, the productivity falls by 5% for every 25000 wells completed as was the case from 2016 to 2021. The chart below compares two scenarios for the Permian basin where the EUR remains at the 2020 productivity level in the future for the no EUR decrease scenario and a second scenario where productivity decreases by 5% for every 25k new wells completed. About 63000 wells are completed for the two scenarios after December 2021.
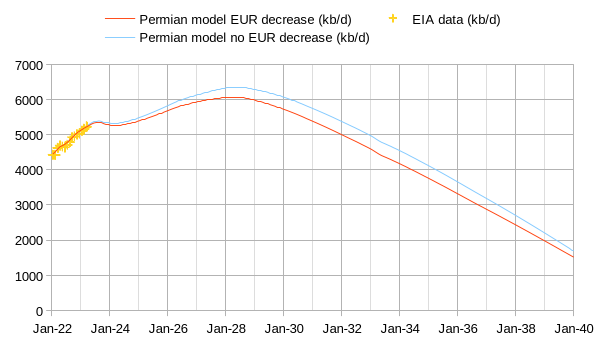
The scenario with the EUR decrease is about 2 Gb less than the no EUR decrease scenario (40 Gb vs 42 Gb). Note that some of the 5% decrease in EUR from 2016 to 2021 may have been due to the increasing average lateral length over that period, though we do not know what proportion is due to this effect rather than decreasing high quality areas for development. Reality is likely somewhere between the scenarios shown above if average lateral length eventually stops increasing due to diminishing returns to increased lateral length.
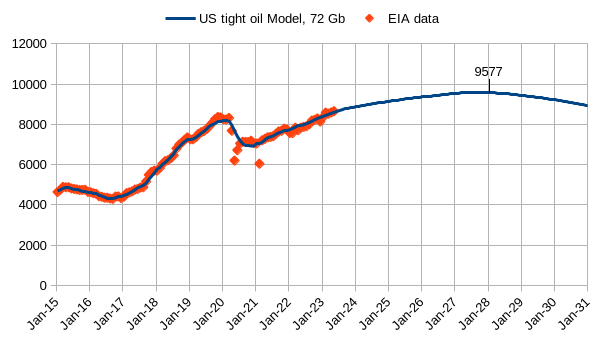
Above is my best guess for US tight oil output, this scenario assumes no average EUR decrease in the Permian Basin, other tight oil plays are assumed to see some decrease in new well EUR. An assumption that Permian EUR decreases at 5% per 25000 wells completed would reduce URR by roughly 2 Gb and the peak would be about 200 kb/d lower, roughly 9400 kb/d.
227 responses to “OPEC MOMR, August 2023”
Thanks, Dennis. Great post. Interesting to note from Graph 5-30 above that world total liquids hit a post-pandemic high around January of this year and have been declining ever since. July’s level was 100.2 million barrels per day, according to the MOMR. The all-time high was in November 2018 at 102.3 million barrels per day.
Ron,
What matters is C plus C as you know. The peak in 2018 remains the peak so far.
I know that Dennis. I was just pointing out that total liquids also peaked in 2018 and is now in decline. Though it is obvious that C+C has a greater hill to climb in order to reach the 2018 peak. It is my opinion that It will never happen.
But then, that is just my opinion. I could be wrong.
Ron,
Total liquids includes NGLs which have been increasing, but as you have stated before and I agree with, bottled gas is not that important. Perhaps you will be correct, but I think we will see a new peak around 2026 to 2028.
Hello Ron,
I just took a look at the MOMR archives (https://www.opec.org/opec_web/en/publications/7107.htm) and struggled to find this 102.3 Mb/d value. December 2018 MOMR states “Preliminary data indicates that global oil supply increased by 0.50 mb/d to average 100.64 mb/d in November 2018, compared with the previous
month.”
It seems that OPEC agrees with IEA in finding that world total liquids supply reached slightly higher levels in 2022 and 2023 (up to 101.5 Mb/d) than in late-2018 (100,6 Mb/d).
Only EIA finds a 102.3 Mb/d value for November 2018 (https://www.eia.gov/international/data/world/petroleum-and-other-liquids/monthly-petroleum-and-other-liquids-production?pd=5&p=0000000000000000000000000000000000g&u=0&f=M&v=line&a=-&i=none&vo=value&t=C&g=none&l=249–249&s=725846400000&e=1680307200000&vb=170&ev=true).
In fact, only EIA finds an all-liquids peak in late-2018.
Yeah, but only the EIA tracks every nation and posts their production numbers. The OPEC MOMR is just a shotgun guess. So I am going with the EIA because they are watching it closer than anyone else. The peak total liquids and C+C were in November 2018. But the total liquids do not really matter. Who cares when bottled gas peaked? C+C peaked in November 2018, according to everybody. End of story.
OVI ,Dennis you might find the twitter thread useful
https://twitter.com/EIAgov/status/1692251780900422031
TexasTeaTwo
I don’t do Twitter. The accounting/adjustment issue was a problem earlier this year when they were over 2 M barrels for many weeks. More recently they are closer to 0.5 M barrels.
The adjustment factor is required to balance the difference in the change in oil inventory vs what the EIA calculates from the difference between import and export numbers and refinery input.
Several rears ago I did this post, together with Art Berman:
8/10/2016
U.S. Storage Filling Up with Unaccounted-For Oil
http://crudeoilpeak.info/u-s-storage-filling-up-with-unaccounted-for-oil
Again, when will I be included in the email list notifying us of new articles?
Matt,
An email is no longer sent out, just check in every 7 to 9 dys for a new post, we do 4 per month.
Dennis, good report
“If OPEC continues to produce at the July 2023 level of about 27 Mb/d of crude oil, we will see a significant draw in World Oil stocks, assuming OPEC estimates for Non-OPEC Oil Supply and World Oil Demand are correct. My expectation is that the World Oil Market will become very tight and oil prices should rise, unless OPEC increases output to balance the OiI Market.”
As a thought experiment, what if OPEC plus wants the market to “balance” using price rather than increasing production? You have two of the largest members, the Saudi’s and Russians that have every reason to do so.
They can’t do that, because it would make the American car lover sad, as well as Joe Biden. Don’t they know they have an obligation to keep?
TexasTeaTwo
SA wants $85 to $90 Brent. Watch what happens when Brent gets above $90. If SA reverses it’s 1 b/d cut using two 0.5 Mb/d cuts over three to four months that will tell what price they want.
What if SA cuts are just natural that they cannot produce more?
Exactly how much Saudi can produce is a deep dark secret. However, there is no doubt their oil production is in decline. And I do think that much of their recent cuts are due to their declining production. That July cut, however, was not due to decline. That one was just too big to be natural.
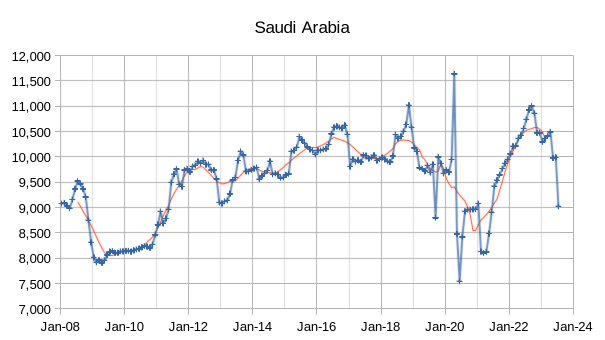
Just guessing, but I would estimate their current level of production, which they can hold for a few months, is somewhere between 10 and 10.5 million barrels per day.
There were some article on TOD back then that showed that the way SA is using water to take the oil out sometimes giving the field a break helps with the oil just coming on top, the way if you mix water and oil and then give it a break to separate on the column …
Svaya, naw, that’s not how it works. The water injection is to increase the pressure and sweep the oil toward the center. They have been doing that for many decades now. There is always water in the oil, and the Saudi oil-to-water ratio has been increasing for some time now. In some places, it is just oil-stained brine.
Hi Ron! As they are trying to keep production levels using water injection, could it be that the production is dropping very steep at the very end of the reservoir ? Kind of a switch where within a few months there is very big drop in production ? It could have happened in one of there fields.
I am not an expert on this domain, so I will reply on experts on this forum to clarify 🙂
Svaya,
Declines are involuntary and cuts are voluntary. Even with declining production one is still going to adjust production according to consumptive conditions. The scale of these Saudi cuts are big but don’t appear to be about preserving oil due to declining production. I’ll believe the headlines for now that they’re about market, and of course, budget considerations.
Preservationary cuts are coming not too far out in the future imo. When that point approaches, we readers here at pob will know ahead of everyone else what’s going on and will see right through the headlines if they pretend otherwise. I think Mr. Shellman is going to get his wish relatively soon and the US is going to ban exports, at which point, given shale’s extreme decline rates, won’t matter by much.
That is also my thinking, They now cut by million barrels and later increase by half as much to give the appearance that they are in control. But, since most of the Saudi oil comes from the super-giant and mega-giant fields, that are in decline, this is a game that cannot last for a long.
…
Here is a map of Saudi Oil Fields with estimates of the field sizes. It has about half of the fields in Simmons’s book and some, such as Khafji is not on the map (probably because it is counted as being in the Neutral Zone). If I add the estimated URR for these fields, I get about 320 Gb, indicating that the estimates are generous. I stress, that these are estimates as many are listed exactly as having 500 Mb of oil.
….
https://www.cccarto.com/oil/saudiarabiaoil/#3/43.83/70.84
Dennis
I think OPEC is purposely overstating their expectations of US shale production so that if inventories start dropping rapidly, they can come in and save the day, while blaming the shale producers for failure to perform.
High prices and a convenient fall guy to blame! Welcome to the world of oil price control by OPEC ( until they run out of spare capacity).
Very good report.
Old Chemist,
That is possible, but my guess is they believe their forecast, we all realize such forecasts are rarely correct.
So I was reading the article: https://oilprice.com/Energy/Energy-General/Net-Zero-Goals-Wont-Slow-Down-Oil-Exploration.html
While reading this article I thought to my self what a great opportunity to 1) solidly my position as the biggest bullshitter on the POB and 2) remind those who questioned my earlier bits of wisdom just how dumb they now look. Its twofer😎For those who are easily offended by the ramblings of a highly successful, but barely literate business man, you might just want to ignore.
“The recovery in exploration spending is taking place amid a double-down on the transition.”
Well color me shocked, you mean the numb-nuts who want to end oil and gas production don’t realize that it’s the oil and gas production that allows for the entire chain of of events from mining to transportation to manufacturing to installation any green transition to even be remotely possible.
“The expected rise in hydrocarbons demand and the relative importance of energy security are two reasons why oil companies are spending more on exploration.”
Ah yes, as Coffee pointed out in a response to Dennis in the last thread, what libs love to do is claim one thing and behind the scenes be doing something else. Coffee pointed out how California uses out of state coal power rather than just admit that the green transition, at best has limits. Germany the same story using cheap Russian gas for the industrial base while “pretending” to be a leader in the green energy movement. Let’s not forget about the NE US whose grid was stabilized by burning OIL. It was not windmills that came to the rescue last winter, it was fossil fuels. Hypocrisy has its risk and those risks have come home to roost. I spend a lot of time in Alaska, lot of folks up there grow a garden every year and then store the produce unit the next years harvest. Not one Alaskan ever throws away the remains of last years crop before this year crop as been harvested. That kind of reasoning escape the green fool. They promote throwing away known provable energy systems before a replacement has been developed. Yea that’s the ticket.
“Indeed, one campaign group dubbed Oil Change International slammed the Inflation Reduction Act as being “one of the biggest handouts to the fossil fuel industry in US history.”
“According to that group, “With tens of billions dollars in giveaways for the oil and gas industry, provisions expanding fossil fuel leasing, and incentives for dangerous and unproven technologies designed to keep the fossil fuel industry in business like Carbon Capture and Storage (CCS), hydrogen, and Direct Air Capture (DAC), this law will not accomplish what we need to have a livable future”
Now I don’t have a deep understanding if the above statement is true, what I do know is this, I would be shocked if it is not. People who truly understand how to keep our society stable and competitive know to do so will require fossil fuels while they openly lie to their base to get their votes. Hope you guy are comfortable with that.
“The gas squeeze that pushed European prices sky-high last year reminded a lot of people embracing the transition that it does not really enhance energy security. It could, at some point, but that would take time, a lot more money and solving several major problems with wind, solar, and EVs. Right now, however, the only sources of energy that do provide energy security are the hydrocarbon sort.
The transition advocates were not the only ones reminded of that fact of life. The oil and gas industry itself may have temporarily forgotten it and got a wake up call last year. So now, spending is on the rise. And the industry is tying it to achieving transition goals ”
I pointed this out over a decade ago (as did others) on this forum only to be banned.
“Continued investments in oil and gas will be needed to make sure that the energy transition happens in a balanced way with a secure supply of affordable and increasingly lower-carbon energy. We will contribute to this balanced transition by focusing our investments on the most profitable and carbon-competitive projects,” Shell’s Integrated Gas and Upstream Director, Zoe Yujnovich, said last month.
Indeed, a fact not often voiced by the transition advocates, both in political circles and outside them, is the fact that the transition away from hydrocarbons depends strongly on those same hydrocarbons.”
Just a polite thank you for doing my part is all I require, I have already received plenty of renumeration for my rather large bets against you goobers.
Which balance? The balance which matters is the Earth’s energy balance with space. We know that we are out of balance and why. And we get the first evidence that society is being destabilized by climate change.
Where is the legislation which says that fuels refined from oil coming from new discoveries should only be used for renewable energy projects? The untruthfulness of governments comes from not telling the public we will have to adapt to much more modest lifestyles in order to reduce emissions. At present we seem to wait for declining oil production to do that job.
Matt, indeed. As Colin Campbell never tired to say that politician cannot tell the truth as they would be voted out of office. Here is a thought that came to me. What if, at least, some of the leaders know what is happening and reason that the only way to prevent a huge crash is to push for renewables as a camouflage and to de-industrialize, and thus make the crash come earlier so that it is a bit less severe as letting the show go on. I may be giving too much credit to them, as they live in their own bubbles. But it is quite clear to most on this discussion group that we are in a collision course with declining output and rising consumption in oil producing countries, which means that soon there is nothing to export, and after that there is not enough for even for the citizens of the exporting country.
TTwit –
The constant dribble you excrete is impressive! Keep it up!
KENGEO,
You know what they say…
CAN’T FIX STUPID.
steve
TexasTeaTwo
““Continued investments in oil and gas will be needed to make sure that the energy transition happens in a balanced way with a secure supply of affordable and increasingly lower-carbon energy.”
+10
This landed in my inbox . WEO outlook 2022 . All energy sources defined including Net Zero etc . Spanish so use Google translate .
https://crashoil.blogspot.com/
Saudi Arabia is currently in a recession. Their balance of trade is falling fast. How many quarters of negative GDP growth can they take?
Only a matter of time before they reverse course and are back producing all they can.
You know they know to when they do this, they’ll earn less. Oil price will fall more than 10% fast, and they will have the extra cost for pumping more (wear of equipment, chemicals, fuel, … all this stuff ) and gain NOTHING.
Pumping more into falling prices is a loosers game. The Russians are holding, back, too, so they will pump more, too when SA abandons their pledge.
Longer term 50-60$ oil will help them again by killing off pesky shale companies in times where the cheap OPM isn’t available in huge quantities anymore.
The democratic US government wants to have 50-60$ oil, both to punish Russia an Iran while calming their car owners for the next election. They still think US shale can run on 30$ oil because of all the marketing BS the companies published in all media.
Thanks Dennis for the report and info.
I have a question, you stated:
My expectation is that the World Oil Market will become very tight and oil prices should rise, unless OPEC increases output to balance the OiI Market.
Why is that expected of OPEC, can’t the non-OPEC countries which are producing ~ 70% of total liquid fuels ramp up production ? Or are we to assume non-OPEC countries are producing at full capacity while OPEC are not ?
Iron Mike,
OPEC MOMR already has non-OPEC increasing output and the forecast is already optimistic in my view. OPEC has cut about 2100 kb/d over the last 3 quarters, if these cuts are maintained I think it unlikely that non-OPEC nations will be able to pick up the slack, instead we will see oil prices rise enough to reduce oil demand so that the market becomes balanced. That’s what I expect, but it is likely that I will be incorrect, as has often been true in the past.
Note that I focus on crude plus condensate output, OPEC produces about 37.5% of World C plus C output.
Dennis,
I think OPEC is overestimating non-OPEC output so they don’t have to increase their production.
I think OPEC can increase production but they just don’t want to, since their main export is C plus C, they want to get the most money out of their export which makes economic sense.
I still think a severe recession is needed reduce oil demand. It seems to me that credit availability hasn’t really been hampered by the interest rate rises. For a recession banks need to stop lending, which is not what is happening at the moment. And as long as credit is available so will the strong demand for oil.
Iron Mike,
I agree with your comment except the part about OPEC purposely overestimating non-OPEC output. I think they believe their forecast and also think they believe that World Oil stocks are too high and are trying to reduce those to increase oil price.
another scorcher here in Texas and like much of the last few days ERCOT once again announces voluntary electrical demand reductions. This is likely to go on for another 10 days to two weeks.
you can follow along with this failed experiment at:
https://www.ercot.com/gridmktinfo/dashboards
If you are talking about solar, than don’t call it a failure until the state has installed about 10-fold more of it. That would be a decent first inning effort,
and yes…Texas will get there. I’m confident of the capability to eventually grow up into the big shoes.
btw-don’t be so fearful. Oil and Gas will still be in demand in a big way indefinitely, so you will still be making your money.
I am impressed that TX gets such a huge chunk of its power from renewables. Many days it’s around 25-30% and it is increasing as time goes on. Far from perfect but a move in the right direction.
Rgds
WP
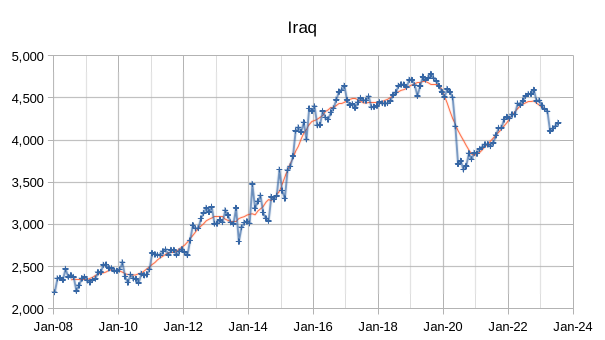
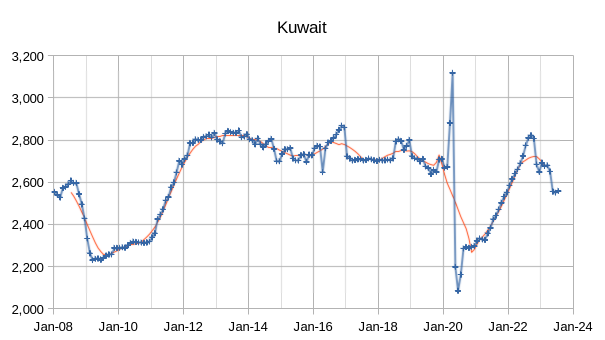
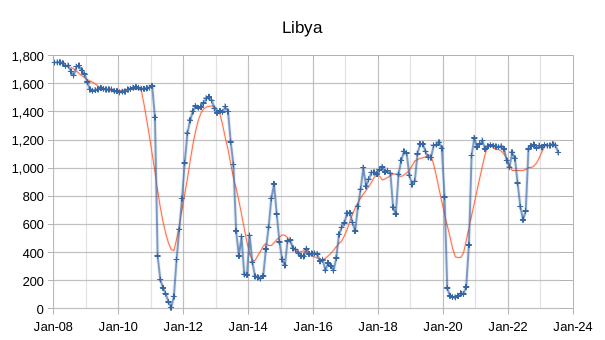
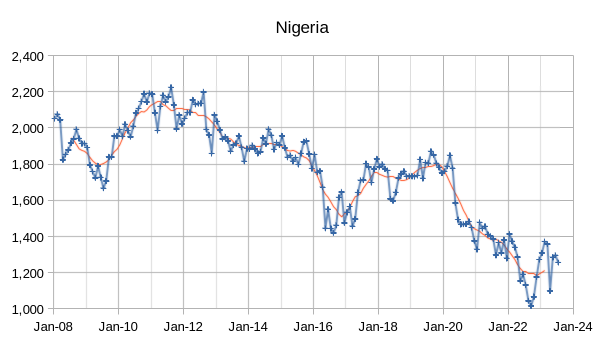
How Much Crude is OPEC 13 Really Producing
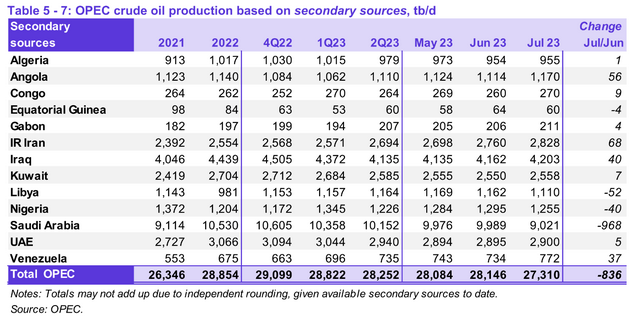
Attached is a table which shows OPEC 13 crude production according to OPEC MOMR, IEA and Argus.
According to the IEA, OPEC 13 is over producing by 550 kb/d. The main difference is with the UAE producing 340 kb/d more than the MOMR reports and Iran is at + 210 kb/d. The IEA has Nigeria below the MOMR estimate.
I think the IEA has it about right because from May to the end of June WTIC bounced around $70/b because of the over production by the UAE and Iran. SA wants at least $80/b WTIC or the extra $4/b Brent and they tried to get the other members to cut but Iran and UAE would not agree. In the end, SA announced their lollipop cut for July to September and immediately at the end of June the oil market went from a 500 kb/d oversupply to a 500 kb/d shortage and inventory started to drop and WTIC slowly rose by $12/b through July in to August. Do the math. 10 Mb/d @ $70/b vs 9Mb/d @$80/b. Everybody in OPEC 13 wins.
Argus also has the OPEC 13 over producing by 390 kb/d. The biggest over supplier is Iran with an extra 210 kb/d, which is in agreement with the IEA. Argus also has a number of smaller over production increments such as Iraq with +90 kb/d.
It will be interesting to see how and when SA decides to increase its production. Will it happen at $90/b WTIC, i.e. $94/b Brent?
The units in the table are in Mb/d.
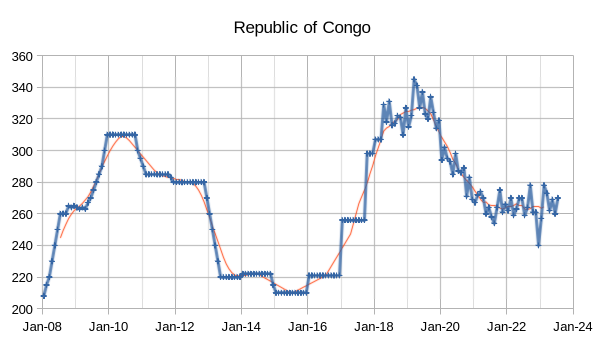
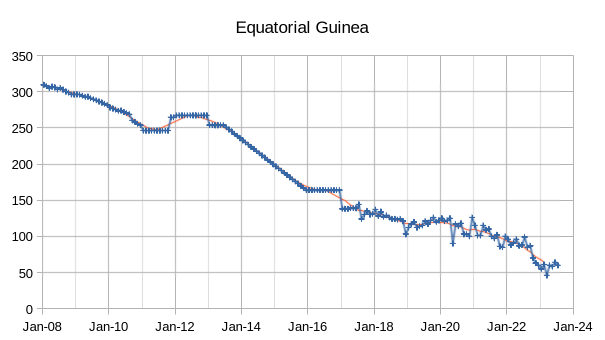
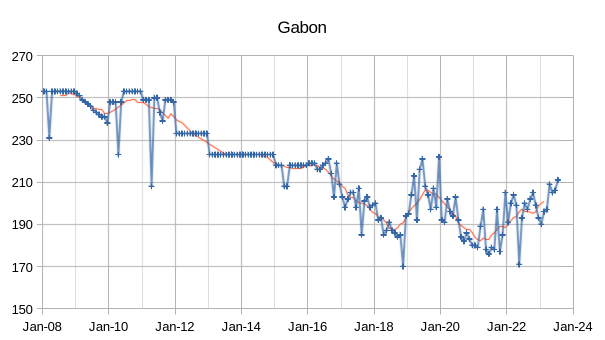
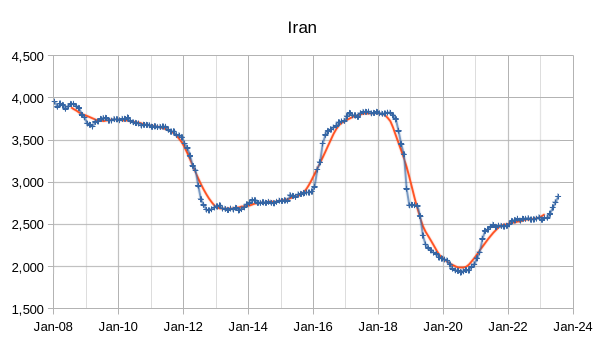
EIA STEO estimate for July 2023 for OPEC 13 crude oil in Mb/d:
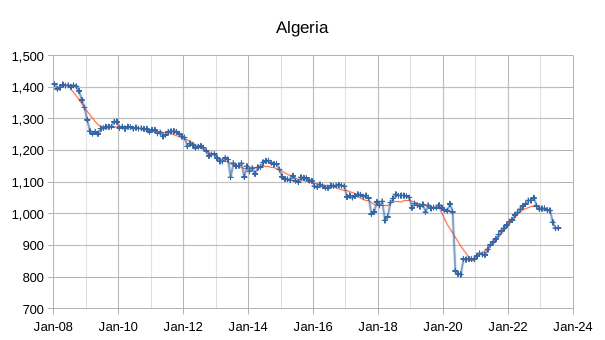
Algeria 0.96
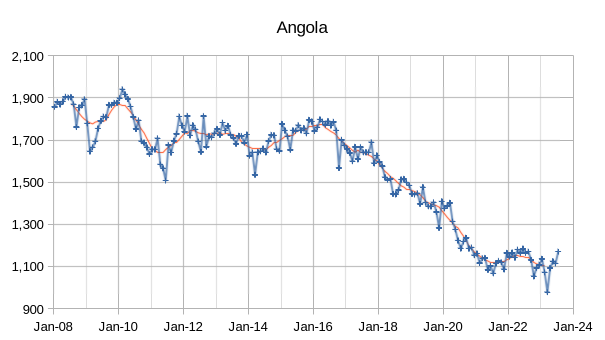
Angola 1.18
Congo (Brazzaville) 0.26
Equatorial Guinea 0.06
Gabon 0.21
Iran 2.81
Iraq 4.28
Kuwait 2.55
Libya 1.13
Nigeria 1.19
Saudi Arabia 9.3
United Arab Emirates 2.9
Venezuela 0.79
OPEC Total 27.62
The Average of the three estimates presented by Ovi and the EIA STEO estimate is 27.62 Mb/d for Total OPEC 13 crude oil output for July 2023. I agree we don’t know exact OPEC crude oil output, but it is likely in the range of 27.31 to 27.86 Mb/d for July 2023.
Dennis
Whether the OPEC production reports are 500 kb/d too high or too low makes little difference to us.
However a surplus or shortage of 500 kb/d in the real market has a major impact on the price of oil. All of the OPEC + 2 Mb/d cuts did little to stabilize the price and could not get it back to $80/b because there still was an oversupply. That was a clear indication to the Saudi’s that they needed another cut to bring the market in to balance. They are the ones that really need to know whether the market is short or oversupplied.
Ovi,
I agree, the fact is that nobody knows the correct numbers.
I imagine the Saudis might believe the OPEC MOMR estimates (as they play a major role in producing those reports). Base on OPEC estimates the market was oversupplied with oil and that is the reason for OPEC cuts. There are various estimates out there, it is impossible to know which estimate is closer to the truth, we can only speculate. This fact is part of the reason for market volatility, basically everybody is guessing at what the market clearing oil price actually is. It is a mystery.
Giovanni Staunovo🛢
@staunovo
·
3h
#Iran’s Booming Oil Flows Surge Above 2 Million Barrels a Day
TankerTrackers says satellite images show new surge in flows
https://www.bloomberg.com/news/articles/2023-08-21/iran-s-booming-oil-flows-surge-above-2-million-barrels-a-day
If we look at EUR vs lateral length we find about 4% of the 5% decrease in normalized EUR from 2016 to 2021 was due to increasing lateral length, so that once average lateral length stops increasing when an optimtum length is determined we might see EUR decrease slow to 1% per 25k wells completed. That would be closer to the no EUR decrease scenario presented in the post for the 100k total wells completed scenario for the Permian basin, roughly 42 Gb URR.
What a joke .
https://www.bnnbloomberg.ca/argentina-fixes-oil-price-at-56-a-barrel-to-put-inflation-in-check-1.1960712
https://oilprice.com/Energy/Natural-Gas/US-To-Remain-Dominant-In-Global-LNG-Markets.html
This is a pretty comprehensive article on the growth of LNG over the next few years with the USA leading. The article also give much evidence to my thesis that that gas will be the bridge to a nuclear future. I may have mentioned I am long (very) midstream to reap the rewards of the now fully built in future growth.
TTT,
Re natgas …
I was just going over some Pennsylvania wells’ production history.
Impressive, to say the least.
Expressed in both oil equivalent numbers and actual natgas priduction,
about 150 wells have produced over 3 million boe (3 MMboe/17.4 Bcf) with leader Deremer 2HC at ~5 MMboe/28.5 Bcf in 3 1/2 years online.
With average US residential natgas usage at 75,000 cubic feet per year, the 8 well Carpenter pad could supply all of Philadelphia’s and Cleveland’s households’ natgas needs for the past 3 1/2 years’ production (~30 MMboe/174 Bcf). Thattsa heckuva return for ~$100 million development cost.
The recently turned in line 5 well King Hippo pad is on track to produce ~7 MMboe/40 Bcf in its first year … enough to provide all of Pittsburgh’s, Cincinnati’s, Buffalo’s and St. Louis’ residential natgas needs for the year.
Cummins’ X15N natgas engine is being positively received in China and is set to be rolled out in the US in a few months’ time.
With the ongoing buildout of LNG plants that you referenced (near doubling current capacity in just a few years … and do not forget Mexico’s Pacific coast projects), demand for natty should remain strong – along with supply – for many years to come.
That Cummins NG engine looks impressive.
Good to have an alternative to diesel.
This past week I took a big ferry (BC to Vancouver Island) that was NG powered.
https://www.cummins.com/engines/x15n-2024
“PACCAR will work with Cummins Inc. (NYSE:CMI) to offer the new Cummins X15N natural gas engine in Kenworth and Peterbilt trucks. The X15N is the first natural gas engine to be specifically designed for heavy-duty truck applications with up to 500 horsepower output.”
Hickory,
Awhile back, an online trade magazine quoted a large, unidentified west coast distributor (sounded like Walmart) as saying that it would immediately replace all 4,000 of its diesel trucks with the X15N power plants when they became available.
Re LNG-fueled ferries, both ISO type containers (as used by the Tasmanian ferries) and larger bulk-fuel type storage (used in the Baltic area) are becoming more widely adopted throughout the world, remote and/or island communities especially making the switch from diesel.
One of the world’s biggest aluminum smelters in Brazil is switching to LNG from diesel as its primary fuel source.
Expressed in financial/energy terms, oil is about 5 times more expensive than natgas for the same heat content. (~6,000 cubic feet of natty – currently under 17 bucks – equates to one barrel of $80 earl.)
This swift, ongoing transformation towards natgas will catch many people unawares.
Coffee….T.Boone Pickens is looking down smiling.
==================================================
Liquefied Natural Gas .. stored in huge steel concrete tanks
==================================================
Step back and marvel at that ridiculous achievement of mankind.
Yes…Walmart w Cummins NG engines
Quite possible that a large scale conversion to natural gas from oil will lead to higher natural gas prices and will tend to reduce the price of oil, it may also pull the peak in World natural gas output to an earlier date.
Hickory
I managed a group that worked with Cummins to develop the first NG powered engines for 40 ft city buses. The research on how to covert a heavy duty diesel engine to spark ignition mode was started at the Ontario Research Foundation in cooperation with Cummins Engine around 1986. Developing the NG fuel delivery system that would let the engine run lean was the big issue along with meeting engine emission standards. As I recall it took about 3 years and then Cummins took the engine in-house to ruggedize it for heavy road use.
We then launched a City bus development program with Orion Bus industries for 50 CNG buses. The big issue was where to put the CNG tanks to get the 400 mile range. The answer was obvious, on the roof. We put 4 20 ft long tanks on the roof that each stored 4000 ft^3 at 3,000 psi.
Attached is a picture of I think one of the first Orion NG buses. The Ontario buses were put into service around 1990 with 25 in Toronto, 15 in Hamilton, 6 in Kitchener and 4 in Mississauga. Orion also had a factory in New York.
Cummins went on from there to develop bigger bus engines and eventually put them into trucks.
Ovi,
That 3,000 psi storage has long been obsolete/unnecessary with the ongoing advances in adsorption (with a ‘d’) technology.
1,000 psi containers filled with activated carbon are now widely used.
A few years back, a research team from Texas A&M produced an inexpensive polymer with adsorbtion characteristics that enable a 22 GGE (Gallon of Gasoline Equivalent) fuel tank to hold CNG at 500 psi.
That low a pressure could come from stepped up residential natgas allowing homeowners to fuel up right in their own driveways.
CoffeeGuyzz
One of my team members was working on adsorption of NG, again in the 1985 to 1990 time frame. As best as I can recall he started working with a professor at Queens University and looked at Zeolites and polymers. I think in the end they decided that polymers were the way to go and selected Saran.
They made pucks, similar in size to a hockey puck and then slowly pyrolyzed them. What kept happening was that the pucks could not maintain their nice uniform shape. If the pucks could maintain their shape they would nicely pack into a cylinder. I don’t recall how efficient those pucks were in adsorping the CH4.
I would be curious to know if the Texas A&M team were able to commercial their work. Are there commercially available CNG tanks which contain adsorption material?
From about 1980 to 1990 we had vehicles running and being tested on methanol, ethanol, gasoline/ethanol blends (15/85 and 85/15), propane, NG, ammonia and a battery powered van that shuttled Ministry Staff between HQ and downtown. Its range was six miles. The ammonia vehicle emitted unburnt ammonia.
It was a very exciting and fascinating time.
OVI,
The September 4, 2019 issue of online magazine ‘Asian Scientist’ contains the short article ‘Flexible Polymers for Natural Gas Storage’. I have heard of no recent info on this development.
This entire field of Covalent Organic Frameworks is exploding in global interest as the convergence of several disciplines (3D printing, nanotechnology, supercomputing) seems to be enabling a dizzyingly rapid introduction – and manufacturing – of an asston of new storage/filtration products targeting various gasses and liquids.
World record, IIRC, is a grape-sized polymer with internal surface area of 10,000 square meters … about 10 football fields.
There are several companies worldwide that manufacture cylinders for CNG storage. (3,000 psi + seems to be normal, to my surprise.)
A company called Ingevity is one that uses adsorbtion and facilitates ‘virtual pipelines’, i.e., trucks shipping CNG (usually to large commercial customers).
If, as I expect, use of natgas will increase dramatically, many more innovations in techniques and hardware are likely to emerge.
Interesting work.
OVI, good to get a glimpse into your professional life, gives me(us) some context for your ideas and contribution.
TexasTeaTwo
I started life as an aeronautical engineer and worked at Dehavilland aircraft. Out of university I was the wiz kid who knew how to use computers, (punch card Fortran on an IBM 1492 with as I recall 64 k of memory), and was tasked with automating processes onto computers. In the end I specialized in the new and upcoming field, at that time, of computational aerodynamics for 3D bodies so that we could reduce tunnel test times and increase the probability of success with modifications.
I then left to take on a whole new challenge. See above.
Hickory
Did you happen to notice that when the ferry docked, they immediately plugged in to shore power (hydroelectric), and shut down the onboard generator?
That was a conversion done about 25 years ago to the complete ferry system in the province. It was complex and expensive with more than 40 ferries of varying vintages, sizes, and countries of origin ; a similar number of docking facilities with minimal electrical capacity and had to be done without impacting the ferry schedules.
People have been doing the right things and moving in the right direction for a long time, but those efforts have been overwhelmed by population and consumption growth.
I didn’t see that. My view was limited at the dock since I was a bike passenger.
The one I was on was a new conversion-
“The two ferries are the first vessels in the BC Ferries fleet to undergo a conversion from marine diesel fuel to LNG. The newer, Salish Class ships introduced last year were purpose-built to run on natural gas. Deborah Marshall, BC Ferries media spokesperson, says the Spirit class vessels will run on both LNG and diesel, with the intent to operate on gas most of the time. The Spirit of British Columbia started its refit last September after sailing to Poland, where the work was done.”
Hickory
Yes , they were all diesel when we did the conversion engineering.
Hmm looks like I am right once again, “one small step for me one giant leap for mankind” . Don’t take it so hard boys nat gas to nuclear was always the path forward, hop in…. the waters fine.
https://www.zerohedge.com/commodities/soaring-number-americans-want-nuclear-power
We can put a bunch of nuclear power stations near the people that think it’s a good idea, it is better than coal or natural gas, but not as good as wind, solar, or hydro in my opinion. It is an expensive option, wind and solar power are far cheaper, natural gas can be used as backup power and eventually there will be enough excess wind and solar power that synthetic fuels produced using the excess wind and solar power will displace most or all of the natural gas backup and nuclear power will no longer be needed and will become a stranded asset.
Time will tell if Texas tea is right, he may be right short term and wrong long term. We will see in 5 to 10 years.
Nuclear will require many Dems in gov’t positions — they may not advocate nuclear power if they have their choice, but they do know how to govern, regulate, oversee, and enforce a public utility.
To that point, “The U.S. Nuclear Regulatory Commission (NRC) issued its final rule in the Federal Register to certify NuScale Power’s small modular reactor.
The company’s power module becomes the first SMR design certified by the NRC and just the seventh reactor design cleared for use in the United States.”
This action came under the chairmanship of the NRC appointed by Biden. Effective Feb 2023
https://www.energy.gov/ne/articles/nrc-certifies-first-us-small-modular-reactor-design
The bigger issue with nuclear deployments in the US going forward , even more than turning everything into a partisan issue, will be funding. No company in the country or the world can fund these on their own, without huge government funding and loan guarantees because of the upfront costs and history of massive cost overruns with the long planning/construction times. Some utilities and their customers have been very badly burned with projects previously.
High interest rates won’t help with funding of any type of big and long project.
That funding bit I overlooked (perhaps because it’s a given). Also consider end-of-life costs for nuclear plants, which need to be added to the funding. Repubs would just hand it over to the free-market and obviously all the EOL costs would be ignored — not my problem, we’ll be long dead, etc.
I think to recycle the old nuclear installations to install in them new kind of reactor just as the scientists did during the 1960s by replacing the ARE by the MSRE in the Oak Ridge National Laboratory. Ok, that’s not the same scale but the reactor building is what it costs the most in a nuclear power plant.
HFI Research
@HFI_Research
·
2h
“Global onshore crude inventory data is so bullish that it’s making people do a double take.
The same double take I did when I saw how much Saudi and Russia decreased crude exports this month.
We will know soon enough.”
ALSO Both HFI and Eric Nuttall have commentary out regarding the shrinking OIL on water inventory, this despite the implied data from IRAN showing higher exports.
https://youtu.be/Zk11vI-7czE
https://consciousnessofsheep.co.uk/2023/07/19/our-predicament-re-stated/
Predicaments only have outcomes not solutions.
There are some smart people on this site, so maybe one of them will know the answer to this conundrum. There are a few whales buying blocks of wells in mature shale basins. Not the Uinta with its waxy crude, or the Powder River, but Bakken, Niobrara, Stack, Eagle Ford, and even the Texas Permian.
Why?
Usually when something like that happens, the private equity company knows something we don’t. Is a new methodology of getting above 15% recovery coming down the pike? Is oil really going to get scarce? These are not penny-ante folks, but those with a billion and up to spend. And they’re buying.
I have a guess. I think carbon capture–for all it has been decried and castigated on these hallowed pages–is about to go mainstream, upscaled, with vast amounts of carbon dioxide being blown down dead and dying oil wells. And I think that CO2 has a collateral benefit: miscible with oil, dense, capable of raising the reservoir pressure, it could conceivably produce an extra million dollars worth of oil from each borehole as it is blown in. Additionally, there is the fabled halo effect, whereby neighboring wells receive a new frack job.
Anybody with knowledge out there care to edify us?
Mr. Maddoux,
Intriguing to hear of interest in the acquisition of older assets in mature basins, especially if by ‘blocks’ you specifically mean contiguous acreage.
Pure speculation – albeit informed – on my part, but here goes …
1. There have been several dozen EOR projects underway for many years now. With the exception of EOG’s publicized Eagle Ford operation, virtually NO info is being publcly disseminated on results.
Hmmm …
The last thing operators would want is for widespread knowledge of an additional 25%+ oil to economically come from US ‘shale’. (That 25% figure came from ND’s EERC in describing the result’s of Liberty’s truncated Stomping Horse EOR project).
2. When Hamm bought the unsolicited Parsley acreage it caught many people by surprise (including, seemingly, then owner Pioneer. In addition to purchasing mostly contiguous Permian land – a pre-requisite for large EOR via gas/water injection – Continental hired Doug Lawler – former CEO of Chesapeake. Just prior to the Covid-inspired shutdowns, Chesapeake was about to embark upon an extraordinarily sophisticated – and large – EOR project in its Eagle Ford operations. Hamm now owns CLR completely, which would benefit him enormously if/when it becomes known rhat OOIP recovery may be in the 30% range.
3. A guy touting his own EOR consulting firm is adamant that high volume, high pressure, short time soak periods are optimal for gas-injection EOR. This dovetails nicely with the very strong demand for the expensive, high volume, high pressure compressor packages that have neen rolling out these past few years.
4. There seems to be ongoing innovations with solvent material transported via water (the SAGD boys seem to be leading in this technology) whereby not only miscible formulations are pumped downhole, but – being liquid – formation pressure can be significantly increased.
5. At lest one outfit – Hess, in the Bakken, I believe, has been experimenting with supercritical gasses (methane or field gas, I think) to better control injection placement.
6. EOG’s seemingly bizarre massive entree into the Ohio Utica (and the ‘fringe’ area, at that) could be explained if they have developed a method of economically high recovery in that notoriously low pressure region. (EOG continues to add acreage in this area, also).
Overall, I would not be surprised to learn in the not-too-distant future of successful EOR processes which would make the early ‘shale’ wells productive once again.
Just my two and a half cents.
Great analysis. I figure something is up. It’s going to be interesting to see how this unfolds.
The Smackover wells are being purchased for their high lithium borehole concentration. Some of the Mississippi Lime wells are valued for their helium content. When you think about it, there are hundreds of thousands of old shale wells.
Something is afoot. Thank you for your informative comment.
Regarding your comments above, Coffee, I’m sure you’re aware that Crescent Point just sold their U.S. Bakken acreage (which was some of the finest) for $500M, and has bought Montney Shale in its place. The Montney is Big Gas, providing the government lets them harvest it, as much of it is over indigenous lands. It was probably a good move for Crescent Point, but that’s not the purpose for my thinking.
The buyer of CPUSA North Dakota acreage is important. That would be Kraken, which is already a great (aggressive) driller in the Bakken. In terms of excellence, though, there was no one better than CPUSA.
The intrigue of the purchase is doubled by the knowledge that the same buyer purchased the eastern fringe of the Eagle Ford, a comma-shaped swath of the Brazos Valley, with Austin chalk on top and a complex multilayered shale down below.
That buyer is both is Kayne Anderson, an LA private equity outfit, which in conjunction with Pincus bought the east Eagle Ford from Chesapeake through Wildfire (which developed a cluster of very fine horizontal wells in that area (I have minerals under one, in Madison County).
Kayne Anderson got nearly 24,000 boe in the Bakken, and nearly 27,000 boe in the Eagle Ford (which we call the Eaglebine–part Eagle Ford, part Woodbine in characteristics). 50,000 boe in the two. But that’s not nearly enough to cash-flow that stuff. Something else is afoot.
The concept of DAC of CO2 has been decried, but when a collector is put in a high-ambient zone the yield is high. Years ago EOG injected CO2 down a horizontal well in Mountrail County North Dakota and guess what? The CO2 broke through into a separate well over a mile away. All shale basins are interbedded with some sort of carbonate. In the Bakken it’s most usually strontium carbonate. CO2 follows not only frack lines but carbonate interbedding seams. Under pressure, it will probably travel for miles, over time.
That unintentional recipient well woke up and produced more oil, which was the CO2 equivalent to the “Halo Effect” of remote fracking. The point here is that injected CO2 down a dead well in the midst of a dying field “finds” other wells in addition to its injection well–the entire reservoir pressure could eventually rise.. CC and CS are coming on a large scale. There’s a reason why Kayne Anderson paid $2B for shale acreage that’s not normally thought to be the shiny penny in the shale world.
I am quite sure that EOG hasn’t forgotten that accidental well interference a mile away from CO2 injection. Low pressure zones like the Ohio Utica don’t have to remain low pressure–that can be adjusted measurably by oil-miscible gas which remains in the reservoir. As you know, EOG is buying the farm over in Ohio–it won’t make a tinker’s dam to them if they cause a Halo Effect five miles over, because they’ll own it. I think we’re likely to see a pretty exciting series of experiments from CC (which is heavily subsidized) and CS (also subsidized), with economical oil recovery.
CO2 flooding has been used on conventional oil wells for decades, of course. But now it’s impossible to build an interstate CO2 pipeline. Enter in-field DAC, CC and CS down unconventional wells that have struggled to get past 10% recovery. This could be exciting.
Mr. Maddoux,
Just got back from some travels and I see your comment.
When Crescent Point entered the Bakken, I believe that stated that they ultimately were looking to do water injections to raise formation pressure like they had been doing in Canada. One pre-requisite was needing to have large contiguous acreage so as to have more operational control of the below ground fluid movements.
Do you remember that colorful outfit that used gelled propane instead of water to frac years ago?
Gasfrac was the company. Went bust. However, they frac’d 2 shallow (~6,000 foot, IIRC) wells in the Eaglebine that had 2 or 3 strong months’ of production before falling off a cliff.
Same thing happened in one shallow well in Ohio (Equinor was the operator). The first few months, people thought the code had finally been cracked in order to profitably produce from these shallow, low pressure formations.
It didn’t work, but the idea of boosting formation pressure has been shown – over and over – to enable liquid hydrocarbons to effectively flow topside IF the pressure boost can be done effectively and profitably.
I would not be surprised if some outfits (Continental and EOG come to mind) already have processes that are bona fide EOR mechanisms.
There seems to be a strong collective sense that if it was feasible and affordable then carbon capture would be a good thing, worth spending large amounts of money on.
Here is a good summary the state of the things and two projects getting funded- Texas and Louisiana.
https://www.science.org/content/article/us-unveils-plans-for-large-facilities-to-capture-carbon-directly-from-air
I remain in a skeptical stance..how I approach everything in this human world. Proof in the pudding. Perhaps if there are a series of technical advances then there will be some feasibility.
I do think it is remarkable that there has been a gradual but definite change in the stance of large swaths of the population, who now seem to acknowledge that the ‘crazy scientists’ who from the 1970’s have been warning about climate warming from combustion were correct in proclaiming this very inconvenient truth.
From decades ago-
“Yes, the vast majority of actively publishing climate scientists – 97 percent – agree that humans are causing global warming and climate change.”-
https://climate.nasa.gov/faq/17/do-scientists-agree-on-climate-change/
Many observers think it is far too late to stabilize this phenomena…that progressive disruption is already baked in the cake. I am one who falls into that category.
All carbon capture schemes pale beside agroecology. See https://kisstheground.com/.
The term “agroecology” is an oxymoron. “Agriculture” is the opposite of “ecology.” Agriculture is “the greatest mistake in the history of the human race.”
You are wrong. Agroecology aka regenerative agriculture aka restorative agriculture respects holobionts (by my definition) and has been practiced for tens of thousands of years (by people we frequently call hunter-gatherers). See https://theproudholobionts.blogspot.com/2022/07/why-agroecology-is-future-of-food.html
Understanding holobionts is the key to understanding life on earth. See https://theproudholobionts.blogspot.com/2022/06/survival-of-fittest-or-non-survival-of.html
You might want to watch Ugo Bardi explain the significance of the holobiont here: https://www.youtube.com/watch?v=oF0nkauaNj4&t=332s
I agree-
Guns germ and Steel
HFI Research
@HFI_Research
For much of this year, EIA monthly US oil production has outpaced the weekly figures.
Following this week’s revision to ~12.8 million b/d for the weekly, we will now see weekly outpace monthly production into year-end.
EIA STEO is too aggressive, so adjustment will narrow.
with several charts: https://twitter.com/HFI_Research/status/1694411386070478869
Canada steps up pace of oil production growth, seen rising 8% in two years
Aug 23 (Reuters) – A busy oil sands maintenance season and early summer wildfires put a dent in Canadian crude production in the second quarter, but oil companies are ramping up growth over the next two years and will add nearly 8% to Canada’s total output, analysts estimate.
The roughly 375,000 barrel per day (bpd) increase in two years would be more than Canada, the world’s fourth-largest oil producer, has managed to add over the last five years combined, even after promising European allies it would boost crude output in the wake of Russia’s invasion of Ukraine in early 2022.
Much of the growth will come from oil sands producers like Cenovus Energy (CVE.TO) and Canadian Natural Resources Ltd (CNRL) (CNQ.TO) tweaking operations to boost efficiency.
Companies are also moving forward on so-called “step-out” or “tie-back” oil sands thermal projects, where instead of building an entirely new facility to steam bitumen deposits, they are linking new areas with existing plants to speed up development and lower costs.
RBN expects total Canadian crude output to increase 175,000 bpd this year and another 200,000 bpd in 2024, while S&P Global Commodity Insights analyst Kevin Birn said annual oil sands production alone will rise around 350,000 bpd by 2025.
Two-thirds of Canada’s crude comes from northern Alberta’s oil sands.
https://www.reuters.com/markets/commodities/canada-steps-up-pace-oil-production-growth-seen-rising-8-two-years-2023-08-23/#:~:text=According%20to%20Canada%20Energy%20Regulator,4.61%20million%20bpd%20in%202018.&text=Much%20of%20the%20growth%20will,tweaking%20operations%20to%20boost%20efficiency.
There is going to be a lot more egress with the opening of the TMX pipeline starting early next year.
“Commodity experts at Standard Chartered have predicted that global oil markets will register a supply deficit of 2.81 million barrels per day in August; 2.43mb/d in September and more than 2mb/d in November and December. The analysts have also projected that global inventories will fall by 310mb by end-2023 and another 94mb in the first quarter of 2024 thus pushing oil prices higher. According to the experts, Brent prices will climb to $93/bbl in the fourth quarter.”
https://oilprice.com/Latest-Energy-News/World-News/Saudi-Arabia-Likely-To-Extend-Production-Cuts-To-October.html
https://www.energyintel.com/0000018a-18b7-d633-a7de-9abf5b520000
“Elevated oil and gasoline prices have put the Biden administration on “alert” mode, but it is hoping that seasonality and bearish sentiment over China’s economic troubles will not push prices higher, he said.
“What would really flip them into true panic mode is where oil prices kept rising,” with WTI at $90-$100/bbl and gasoline consistently at or above $4/gallon, McNally added.”
This article touches on the geopolitics of energy. While OVI speculates upthread on the Saudi intentions I am not so sure they do not have a a bigger goal in mind, that is just getting Brent oil to $85-90 may be the tip of the iceberg. If you caught the news on the BRICS meeting and how a new energy alliance surrounding the BRICS et al is being established to counter the US previous influence, it points to a much greater control for OPEC + control and in my opinion is not a temporary phenomenon. Of course that is speculation on my part, but with the now failed efforts by the US and EU to rid the world of fossil fuels, those with most at stake have an opportunity to drive out of office those pushing that agenda, higher oil prices will do just that, as both the US and EU have dug themselves a very deep hole and yet continue to keep digging. All they have to do is push a little via higher oil prices and it s a win win. US and EU lose power, influence and esteem while the new BRICS trading bloc goes on their merry way.
Texas tea,
What might occur with higher oil prices is an acceleration in the transition to electric transport, OPEC plus might be satisfied with $90/bo for oil prices and is likely to increase output in response to higher oil prices, in addition higher oil prices might also spur higher output levels from non OPEC plus producers also putting downward pressure on oil prices. My guess is that the price of oil will settle in the 85 to 95 dollar per barrel range.
Dennis I cant argue with those conclusion regarding oil price at this time. As OVI pointed out time will tell and if OPEC begins to add incremental oil production to cap prices at or below $100, then yes, my ideas will be wrong.
With respect to any energy transition, its just not happening. The data is clear,
green energy takes a portion of NEW ENERGY DEMAND, it is not replacing anything. I don’t post much of my research on this here because its not really oil/ nat gas related but a green energy transition is a mirage.
Last I looked electric vehicles are selling like hot coffee in the desert in the US, lack of infrastructure and high interest rates are a real barrier.
News alert- according to Texas Tea there is no longer any oil depletion, and therefore
“With respect to any energy transition, its just not happening”
There is a reason that China is far ahead of the US on the transition attempt- electric vehicles, batteries and photovoltaics.
It is not because they are more concerned about carbon emission… it is because they import large amounts of their oil consumption.
When you are at the whim of geopolitical turbulence and see global oil depletion in big letters written on the wall, it can be a big motivation if you happen to have any focus of mind.
The Chicoms will do what ever it takes to avoid the importing of oil and natural gas. Hickory aced it with this comment. The world can count on an ample supply of carbon dioxide from them for many years.
China’s efforts on building up domestic energy that does not rely on oil and gas is just an example of what all countries will be confronting as depletion sets in.
Its not a tough concept.
Everyone is starting out late on the attempt.
Texastea,
A large proportion (more than half) of World Energy consumption added in recent years has come from renewable energy, I disagree that there won’t be an energy transition, wind and solar consumption have been growing at about 25% per year at the World level, we will likely see 15% to 20% growth on average until most energy use is satisfied by wind and solar, the balance will be supllied by hydro, nuclear, amd synthetic fuels produced by excess solar and wind capacity. This will be the reality by 2050, perhaps sooner.
Wouldn’t it be worthwhile to use renewables to cover that new demand? Save a little ffs, which will still be in high demand as long as they’re available. It seems like all you care about is making money off an energy crisis anyway. No lie the greens have told will ever be as damaging as the notion promoted by the ff industry that we don’t need to worry about depletion, that oil and coal and gas will always be cheap and plentiful, etc.
well look what we have here, a dose of reality.
https://oilprice.com/Energy/Natural-Gas/Natural-Gas-Fills-The-Gap-As-Renewable-Power-Falters.html
also to Dennis’s point here in Texas solar as been doing its part for at least the daylight hours at about 13% of total generating capacity or about equal to coal does except coal works 24/7. As we look forward a warning as El NINO may take out much solar generation across the southern US.
https://www.zerohedge.com/weather/el-nino-threat-puts-us-solar-power-output-risk-winter
Right NOW it’s really a wind story or lack thereof. Now for weeks, the large heat high which covers several states is keeping the wind generation at a standstill. Again today, is “action day” to limit electrical use as wind is suppling about 8%. Every day is a race as the sun goes down to keep the lights on state wide.
15 years ago if you had said “don’t bother building wind power because the jet stream is going to collapse” people would have said you were insane. Whoops.
I have opined here on POB that we are living a repeat (at a minimum) of the 1970’s. At this link you will find an inflation chart that looks like I am right again…at least thus far. Now add in the potential for an energy shock/ geopolitical realignment and bingo front row it’s the 70’s show.
https://twitter.com/KobeissiLetter/status/1694706863454187877
and there is more
BREAKING: BRICS announces new members as:
🇦🇷 Argentina
🇪🇬 Egypt
🇪🇹 Ethiopia
🇮🇷 Iran
🇸🇦 Saudi Arabia
🇦🇪 UAE
https://www.zerohedge.com/geopolitical/xi-putin-hail-first-brics-expansion-over-decade-two-gulf-oil-powers-join
In the end all these countries will continue trading in dollars. Eurodollars that is.
None of the BRICS are going to be willing to give up control of their currency in exchange for a gold backed currency. When the local currency is the biggest lever or tool most governments have. They’re not going to give up that power.
There is way more leverage in the offshore Eurodollar market that the world outside the US uses to trade and finance everything between each other than there is leverage in the onshore US dollar market. You’ll see currencies implode if they try leaving the global monetary system. But it won’t be the dollar that is imploding.
The entire world has a synthetic short on the dollar. Because the dollar is what is borrowed to do everything with.
BRICS are going to drive the dollar to all time highs. And it’s going to be very destructive everywhere.
Those Eurodollars that originated outside the US. If you default on them you not defaulting on the US. You’re defaulting on Japan and Europe. Your defaulting on any bank that is a dollar provider outside the US.
Crescent Point Energy signs deal to sell assets in North Dakota for $675M in cash
CALGARY — Crescent Point Energy Corp. (CPG: NYSE) has signed a deal to sell its North Dakota assets to a private operator for about $675 million in cash.
The Calgary-based company announced the sale Thursday, saying in a news release that the limited drilling inventory associated with the assets means oil production from the area is expected to decline over time.
“This (North Dakota asset sale) allows us to realize future value for an area with limited scalability while immediately enhancing our financial position and increasing our focus on our core operating areas.”
Crescent Point’s North Dakota production was about 23,500 barrels of oil equivalent per day (boe/d) in the second quarter of this year.
But the company said that is expected to decrease to 18,000 boe/d by 2027 and decline further in future years.
Italics mine
This implies a decline rate of close to 1,400 b/d/yr, 6%/yr, with regular infill drilling I assume. More evidence that the Bakken is at best on plateau before decline sets in, in a year or two.
https://financialpost.com/pmn/business-pmn/crescent-point-energy-signs-deal-to-sell-assets-in-north-dakota-for-675m-in-cash#:~:text=CALGARY — Crescent Point Energy Corp,about $675 million in cash.
I hate like the dickens to see Crescent Point exit ND—they are a first-class operator, just tops.
But they got a little over their skis, buying the Kaybob Dubernay from Shell and then the Montney shale from Spartan. Plus, the bulk of their operations are in western Canada.
As usual, this was a smart move, to pay down debt and transition to their home base. They had a good position in the Bakken but not nearly as fresh as in the Montney shale, which seems to be a great play. These two acquisitions, along with their other inventory, should fix Crescent Point for the next twenty years or so.
The $675M price for their Bakken holdings was almost a fire sale, which reflects their need to raise some cash. One of the great strengths of Crescent Point is the ability to drill and complete wells at a good price. I just looked over their 2021 data. In the North Dakota Bakken, they drilled their wells for just over $7.5M each, and they were the best in the business for productivity. Interestingly, they were growing their ND Bakken production (23,500 doe/d, up from 19,000 in 2021), and as far as I can tell, their per well productivity has steadily increased, not decreased.
Whoever bought their assets will likely drill the snot out of it. Crescent Point was exceptionally careful with spacing and choke management, treating each well with great interest. People talk all the time about “Tier-One” acreage. Tier-One operators are just as important.
You don’t sell a class 1 asset to fire sale prices – at least not in the current oil price scenario.
There has to be a flaw with these assets, perhaps already almost drilled out locations or other things.
At 60 or 50$ oil fire sales would be more plausible, raising cash.
EULEN_SPIEGEL
BMO seems to agree with you.
09:39 AM EDT, 08/25/2023 (MT Newswires) — BMO Capital Markets on Friday reiterated its outperform rating on the shares of Crescent Point Energy (CPG.TO, CPG) and its C$13.00 price target after the company sold its North Dakota oil and gas assets for US$500 million.
“Crescent Point announced the sale of its North Dakota assets for a cash consideration of ~$675 million (US$500 million). While the sale price is less than expected and reduces near-term cash flow, we believe that the transaction aligns well with the company’s strategy and is expected to accelerate debt reduction. We believe that the shares remain attractively valued and are maintaining our Outperform rating and target price of $13 for Crescent Point,” analyst Randy Ollenberger wrote.
Eulen_Spiegel:
I think Crescent Point was cash-strapped. Relatively speaking.
But there is an obvious flaw with these Bakken assets: they don’t have as many targets for a spacing-particular company like Crescent Point as the acreage they bought. I thought I made that pretty clear, maybe not.
I own quite a bit of Bakken shale mineral rights and heavy overrides (for a small investor), but I’m not blind to the fact that it’s a mature field. Whoever bought CPUSA assets got some good stuff but it’s not wide-open spaces. If the government allows them to develop it to its fullest, the Montney shale is a much better place for them–and the 2X price (over Bakken) they paid for it reflects that.
In a whole sea of tight-spacing, open-choke, ruin-a-well-up-front companies in the shale basins, I simply hate to see best of show leave a basin where I have a stake, that’s all. But there are quite a few very good operators up in the Bakken–on balance more careful than in the Permian. Crescent Point is just a great steward of the mineral resources.
“I think Crescent Point was cash-strapped”
Didn’t they just pay a special dividend?
despite the tremendous expanse of solar and wind power in texas as of this moment nat gas coal and nuclear are producing 88.9% of the electrical generation and we are once again being ask to conserves electricity, since texas is bright red politically and each of got the sound alert on our smart phones I expect the next legislative session to produce better result, you can flow this failed green energy experiment at
https://www.ercot.com/gridmktinfo/dashboards
Last Updated: Aug 24, 2023 19:54 CT
CURRENT GENERATION
Solar306 MW(0.4%)
Wind6,496 MW(8.6%)
Hydro249 MW(0.3%)
Power Storage852 MW(1.1%)
Other105 MW(0.1%)
Natural Gas50,584 MW(67.0%)
Coal and Lignite11,972 MW(15.9%)
Nuclear4,939 MW(6.5%)
Texas tea,
Not surprising that solar output would be low at 8 PM, at about 2:30 PM on Aug 26, about 22.5% of ERCOT power output was from wind and solar combined. This is at roughly the peak for daily demand in Texas.
https://dailycaller.com/2023/08/27/opinion-wind-and-solar-keep-failing-texans-at-the-worst-possible-times-david-blackmon/
Pretty optimistic take on the Vaca Muerta-
“Such solid production growth has triggered considerable speculation that the Vaca Muerta could be pumping as much as one million barrels of oil by 2030, or more than triple the average of 291,377 barrels per day lifted during the first six months of 2023. If that occurs, it will see Argentina become a major regional and global oil producer which will give the troubled economy as well as government coffers a solid boost.
The light sweet oil being produced from the Vaca Muerta, which is light with an API gravity of 39 degrees to 42 degrees and sweet with a sulfur content of less than 0.5%, is cheaper and easier to refine into high grade fuels. This makes it particularly appealing in a world where fuel emission standards are continuously being tightened. According to consultancy McKinsey, as quoted in LatAm Investor, the carbon intensity for extracting the oil in the Vaca Muerta, which is 15.8 kilograms of carbon per barrel of oil equivalent produced, is one of the lowest globally and below the industry average of 23 kilograms. This enhances the appeal of the Vaca Muerta for foreign energy companies, especially with considerable pressure being placed on the global oil industry to reduce greenhouse emissions and become carbon neutral.
The quality of the Vaca Muerta play is underscored by this statement from industry consultancy Rystad Energy:
“. . . there are no issues with the quality of Vaca Muerta’s shale oil or its capacity to produce hydrocarbons at scale (after proper stimulation). Its shale is distinguished by its high pressures and substantial thickness. Its oil yield per foot is demonstrably superior to similar horizontal wells in major US shale plays.”
There are also the geological formation’s low breakeven costs to consider. Drilling, lifting and other operational costs have fallen considerably in recent years as the Vaca Muerta has been developed. The geological body has a low average breakeven cost of $35 to $40 per barrel, with consultancy McKinsey & Company claiming the Vaca Muerta technically breaks even at $36 per barrel, which is competitive with other drilling locations in Latin America and lower than most U.S. shale basins. This further underscores the attractiveness of investing in the Vaca Muerta for foreign energy companies that are seeking high-quality, low-cost plays that produce light, sweet crude oil with a low carbon footprint.”
https://oilprice.com/Energy/Crude-Oil/Vaca-Muertas-Sweet-Crude-Attracts-Global-Energy-Giants.html
HFI Research
@HFI_Research
·
11m
In the years I’ve followed the oil market, I have never seen the Saudis this determined to push oil prices up.” with chart
https://twitter.com/HFI_Research
Giovanni Staunovo🛢
@staunovo
As of August the implied crude shortfall has really accelerated with the latest 4-week average showing draws of close to 5mbd. About 2mbd come from onshore tanks, with China having shifted from a stockbuilding to a stockdrawing pattern. And an even bigger figure is emerging for crude oil at sea. #oott…with chart
https://twitter.com/staunovo/status/1695048151831318906
https://www.vortexa.com/insights/crude/on-and-offshore-crude-oil-inventory-drop-reflects-fundamental-market-tightening/
August 25 Rig and Frac Report
New Recent low for Rigs and Fracs
US Hz rigs down 4 to 463.
Permian down 3, with New Mexico Permian down 4 and Texas up 1
Eagle Ford down 1
NG down 1 to 103
New recent low for Fracs
Fracs down 10 to 246.
How long can production increase while frac spreads decrease?
Ovi perhaps this is the explanation. There is no sign of stabilization of rig count now in the middle of the 3rd quarter and as we move into the 4th quarter. Looks to me like it will be next year and at much higher prices to get industry to begin to “kick it up a notch”. I find it curious, we have completed the ducs we drilled last summer and I am seeing a quite a bit of permitting activity in Central Okla, but if industry was wanting to front run the possible price increases relating to the Saudi/OPEC + cuts, I would have thought we would see the rig count stabilize.
“Earlier this year the EIA revised the number of drilled but uncompleted wells in the top U.S. shale basin, adding several years’ worth of unreported DUCs,” said Phil Flynn, energy analyst at Chicago brokerage Price Futures Group.
Flynn said the revisions imply that drilling-rig productivity has been higher than past estimates despite the U.S. oil rig count having fallen by more than 15% this year.
The EIA “believes active drilling rigs were about 10% more productive in 2021–2022 than previously estimated”, Flynn added.
https://www.investing.com/news/commodities-news/oil-us-stocks-down-6m-barrels-output-at-new-3year-high-3159981
Two Opposing Views on Peak Oil Demand
IEA & Oilprice.Com See Peak Oil Happening This Decade
In June, the IEA took another look into the future and announced “peak oil” was in fact on the horizon. Here’s what its latest prognostications had to say.
“Growth in the world’s demand for oil is set to slow almost to a halt in the coming years, with the high prices and security of supply concerns highlighted by the global energy crisis hastening the shift towards cleaner energy technologies, according to a new IEA report released today.
“The Oil 2023 medium-term market report forecasts that based on current government policies and market trends, global oil demand will rise by 6% between 2022 and 2028 to reach 105.7 million barrels per day (mb/d) — supported by robust demand from the petrochemical and aviation sectors. Despite this cumulative increase, annual demand growth is expected to shrivel from 2.4 mb/d this year to just 0.4 mb/d in 2028, putting a peak in demand in sight.
“In particular, the use of oil for transport fuels is set to go into decline after 2026 as the expansion of electric vehicles, the growth of biofuels and improving fuel economy reduce consumption.”
The case against imminent peak oil demand
A few stats from prominent analyst Arjun Murti offer a sobering case for why a global peak in oil demand may be very far away.
The big picture: In a compelling analysis, he notes the 1 billion who live in the U.S., Canada, western Europe, Japan, Australia and New Zealand averaged 13 barrels per capita annually last year.
The rest of the globe’s roughly 7 billion people? A mere three barrels, Murti’s writes in the latest of several recent posts on the topic.
“Even as attempts are made to reduce rich-country oil demand, the upside potential in the developing world we believe is magnitudes greater,” writes Murti, a Goldman Sachs veteran who’s now a partner at Veriten LLC.
In a video, he argues demand increases are inevitable for at least the next decade, “and frankly I think it is going to be much longer than that.” Murti likes renewables and electric vehicles but describes himself as a realist. “I am not advocating for fossil fuels. What I am doing is applying analysis.”
My take: They are both wrong. Peak oil supply happened in 2018. There is a very small chance that the peak may be breached, but only slightly if it happens. The first article is wildly optimistic that demand will fall while supply is still plentiful. It won’t. The second article is wildly optimistic that there will be plenty of oil to meet demand as demand keeps rising and rising. Wrong and wrong.
Why the holy hell is no one talking about peak supply? These folks are in for a real shock, and pretty damn soon at that. Bu soon I mean this decade.
“By soon I mean this decade.”
https://www.oilystuffblog.com/forumstuff/forum-stuff/why-do-you-suppose-this-is-happening
I might be the least qualified person that posts on the board about oil.
I started pumping AdBlue into my car the other day as the gas station put that next to the regular fuels (which is a dangerous design).
DO NOT MAKE THAT MISTAKE, it corrodes your cars fuel system.
I would love the oil pros and more talented posters to discuss this article by Mike Shellman.
This looks ominous to me.
Sooner in the decade rather than later in the decade?
This is up there with the most important questions in human history.
Interest rates here in US went from 0.25% to 5.25% in about 18 months. Mortgage rates at 7.23%.
There is a wall that the economy is heading towards that it hasn’t hit yet. Not many have had to roll over or refinance existing debt yet. Because it’s only been 18 months.
Obviously I’m talking about the economy in its entirety not just shale producers.
Yield curves aren’t wrong. They won’t tell you exactly when the bottom falls out of the economy. Just that it’s coming.
There is an absolutely enormous amount of debt that won’t get rolled over or refinanced. Nothing inflationary about the next few years.
what would you say about a stagflationary situation, where prices of things you own and things needed to live go up but the economy isn’t growing much or even shrinking. could this lead to feedback loop where commodities like energy and related equities catch significant bids as they accelerate while tech, bonds, and retail decelerate?
I think you need bank credit that is growing that allows consumers to pay the higher price to get stagflation.
There was no shortage of credit creation in the 1970’s it was legit inflation.
Ultimately it comes down to what consumers can pay. Banks decide not to extend credit because of an inverted yield curve. Credit dries up.
Banks are looking at China and saying no thanks. China has had to resort to their huge commercial banks going into swap markets and borrowing dollars and providing those dollars within their economy since Eurodollar banks are saying no thanks. As bad as things appear in China. It actually worse than the data indicates.
I see demand going down faster than supply. Economies are imploding. Just because it hasn’t reached the US yet doesn’t mean it’s not going to.
Consumers in the US. Those with students loans. Come October they will have anywhere from $200-$400 less to spend each month on average.
Commercial real estate is going to hit bank’s ability to extend new loans in a big way.
Interest rates ultimately go back to zero but that don’t mean they can’t go higher first.
When the central banks start cutting again things will be so bad oil prices are falling in big chunks. Like 6%-8% moves down in a day or weeks time.
What happens to US crude production when credit dries out and junk bonds need to be rolled?
I would guess production will fall faster than comsumption.
HHH
Is not Stagflation a very real prospect?
https://en.wikipedia.org/wiki/Stagflation
There are versions of the future that have a considerable probability of occurrence
where Stagflation would be a much better outcome than
what actually happens.
For example, it is not hard to imagine a scenario where
there is hyperinflation along with actual economic contraction.
In fact, this is happening in some places today and has happened many times in the past.
Some people expect that if we have global oil (and then gas) depletion that we will rapidly enter this scenario. The speed and depth of such a dire scenario is partially to be determined by the public policies of regions and countries.
For example, it is not hard to imagine a scenario where
there is hyperinflation along with actual economic contraction.
That is basically stagflation – high unemployment.
Iron..stagflation implies poor economic growth. I was talking about a condition worse than that- contraction.
Charles,
HHH is in the deflation camp. He follows this moron called jeff schneider, who has been consistently wrong on everything and thinks its gospel. He might eventually be right (broken clock) and when it happens they will be like see $30 dollar oil i told you!
Mike,
While I don’t believe Jeff has ever made a call for $25 or any other predictions.
I however have. And yes I’ve been warning for awhile now. And yes it takes time to play out. And yes you were warned.
If the situation changes. If the data changes. If the macro changes. Then I’ll be like ok I was wrong about the call.
None of those have changed. I’m looking everywhere everyday for something that will lead me to believe that this is the bottom. And it can only get better. It just not happening.
So yeah if oil never gets to $90 and instead drops below $70 then $60 on its way to $25 yeah I told you so.
I’m not pro deflation or against inflation. I take all the info in and call it like I see it.
You can make money on both sides of a market.
The yield curves aren’t wrong. If they were wrong the curves would steepen out from here. That’s a fact you can’t argue. Instead what will likely happen is central banks will continue inverting yield curves until economy breaks.
High interest rates aren’t necessarily the problem. Or the biggest problem. It’s the inverted yield curve that’s the problem.
While higher rates will create a wave of defaults when it comes time to refinance loans. The inverted yield curve means banks right now can’t borrow on the short end and lend on the long end. And pocket the spread.
Banks already don’t have incentive to lend and the bad part of the incoming credit crunch isn’t even here yet.
And I do think it’s freaking hilarious the you, HB etc go out of your way to attack me because you don’t like or agree with what I have to say.
HHH,
Jeff and these other youtubers spouting nonsense to make money. They are the equivalent of economic flat earthers. Contrarians for the sake of being contrarians.
I am not attacking you. I am attacking your hypothesis. You are sticking to your position even though in the real world the contrary is occurring.
Only way a recession/deflation will occur from here is if interest rates crush economic activity (which doesn’t seem to be occurring at all), or some black swan occurring causing a financial crisis which no one knows if it will happen.
Until then asset price inflation and central bank support of the distorted system will continue.
Iron
The world is losing 24 billion tonnes of topsoil each year.
https://www.globalagriculture.org/report-topics/soil-fertility-and-erosion.html#:~:text=Each%20year%2C%20an%20estimated%2024,every%20person%20on%20the%20planet.
Farmers have been pouring millions of tons of fertiliser to make up this loss, along with pesticides and herbicides. These technical fixes are reaching their limit.
Massive soil loss is crashing into massive population growth of an additional 1 billion in 14 years.
Higher and higher food prices are here to stay. Higher food prices means higher inflation so deflation is really impossible from here on out.
I think businesses have been holding onto employees waiting, hoping for a second half rebound this year.
When that doesn’t materialize. They’ll have no choice but to cut head counts. I don’t see stagflation as the most likely outcome that we are heading into.
My take besides interest rates and low natural gas prices is that EVERYTHING COSTS TOO DAMN MUCH!”
That and there is little to no labor.
The largest producer in our field has never been able to replace all the people it let go in 2020. It still hasn’t reactivated all its wells.
Finally, are there any young people in the oil business with skin in the game? Almost all the operators here are old.
Why would a bunch of old people want to keep drilling a crap ton of wells anyway?
With what is happening to Saudi Arabia and Russia, that’s pretty obvious.
My two cents- The world is likely to soon see just how much it can afford to spend on the energy sector.
If you include the whole ball of wax including things like
-end user payments for fuel and electricity, N fertilizers, petrochemicals and
-energy consuming and storage equipment, and
-energy efficiency upgrades (including items like heat pumps and electric motors for vehicles) , and
-capital expenditures for oil and gas E and P, nuclear, solar, hydro, wind installations, and
-electrical transmission, transformers and substations, batteries, and
-pipelines and lng processing, and hydrogen production and fuel cells, and refineries, shipping of liquid fuel and
-the mineral supply change related to the energy sector, and
-the capital and labor expenses of the energy sector, including interest and insurance costs
well, then you can imagine that 8.1 billion people pay a lot for it all and are going to have to pay more and more just to keep running in place on basic measures like energy consumption/capita.
Sure, a few items have gotten much less expensive over the past decade, such as oil and gas from shale or photovoltaic power cells, but most things related to energy are on an escalating cost and/or depleting supply curve.
It seems pretty straightforward that just about all things energy are going to cost more, and that family/company/and government budgets are going to be heavily readjusted, with more money allocated to energy than other things.
For people and countries already on a day to day budget, the cost increases may very well push things past the point of viability.
And for everyone else there are going to be very hard choices to be made, more and more as things unfold.
How will we know when we have arrived at peak energy affordability?
Maslow’s hierarchy of needs lists food as the third highest priority for humans ( after air and water). When a population starts to decrease from starvation you will have passed the point of peak energy affordability.
When global primary energy production begins to decline we will have reached peak collective affordability.
Will population peak before or after that moment?
After, of course, the time for the people to nuke themselves to gain access to the last drop of oil, the last cubic meter of nat gas and the last bit of coal. I have an optimistic nature.
Saudi Arabia will likely roll over 1 mln bpd cut into October, analysts say
LONDON, Aug 23 (Reuters) – Saudi Arabia will likely roll over a voluntary oil cut of 1 million barrels per day for a third consecutive month into October, five analysts said, amid uncertainty about supplies and as the kingdom targets drawing down global inventories further.
OPEC+, which groups the Organization of the Petroleum Exporting Countries and allies led by Russia, agreed a broad deal in early June to curtail supplies until the end of 2024. Saudi Arabia at the time announced the additional voluntary cut which brought its oil production to a multi-year low of 9 million bpd.
Earlier this month, Riyadh extended the voluntary cut into September, with the energy ministry saying that it could be “extended, or extended and deepened”.
“We think Saudi Arabia will extend the cut in full at least through October,” Richard Bronze, analyst at consultancy Energy Aspects said.
“The kingdom is adopting a cautious approach after the weakness in oil markets over the first half of the year and will want to see global inventories significantly decline before starting to unwind the additional voluntary cuts,” he added.
Ron this guy think cuts stay in effect till end of year.
https://seekingalpha.com/article/4631328-saudis-dead-serious-on-pushing-oil-prices-higher
weather models pointing to a very cold winter in North America. If it plays out nat gas gonna do a moon shot.
of course we’ve got to get past the heat first. I am positive nat gas but I don’t bet on the commodity itself.
https://twitter.com/BigJoeBastardi/status/1695790532406968789
As the jet stream gets slower and wavier, that is a possibility.
It depends what side you are on– it could get much warmer also.
We will see
Even main stream media is taking note:
https://www.theguardian.com/environment/2023/aug/26/us-summer-extreme-heat-wildfires-climate-crisis
TT2 said:
In the midwest USA, strong El Nino regimes have historically produced warmer winters. In Minnesota here, can lead to 5F higher average temperatures. We’re definitely in the start of an El Nino, but not sure how strong it will eventually turn out.
BTW, one of the trickiest climate indices to understand is the North Atlantic Oscillation(NAO), which is challenging because it cycles so rapidly. I will post more on this but it’s been a tough nut to decode as it’s only a step removed from noise. But I think I cracked the pattern and now have parsimonious models for the major climate indices. This is a cross-validation of NAO, which is to European climate what ENSO/El Nino is to USA
https://user-images.githubusercontent.com/2855758/263587711-f603bfcb-ea97-4648-9808-fa1a5eb5e976.png
Approaching 8.1 billion customers.
Equates to plenty of demand for the foreseeable future
(assuming the big risks don’t put a sudden stop to the experiment).
Coal is near a production decline : the production/consumption is on a plateau since the beginning of the2010s. The production/consumption of gas has stopped its continuous increase while according the last report of the shift project about gas production, the peak of gas production was supposed to occur at the end of the 2020s. And the production/consumption of oil is not better.
And oil is at peak plateau since 2014.
Also, keep in mind that the coal burn could go on for the rest of century if people can’t find affordable energy elsewhere.
The key change was 2007, annual growth from 1993 to 2007 was ~1.6%.
Since 2007, growth has been significantly less, only ~0.6% (all due to North America).
Still not close to reaching the 2018 peak, almost 5 years later…
Excluding North America, between 1990 and 2004, production grew by ~2% annually.
Since 2004, there’s been no change in production…so the plateau technically started in 2004, the first year where the average closing price was above $40 per barrel.
Only in 2020 was the average closing price near $40, for the past decade the average price has been $66 per barrel.
The new range for oil is $60 to $150 with possible moves above $200.
$100 average in 2024
$125 in 2025
$150 in 2026
>$300 by 2030…
Just imagine, without growth of 1P reserves, there will be very little oil left ~50 Gb remaining and only slightly more 2P reserves.
The CO2 emission from the coal on your graph just about exactly equals that from the combination of oil and gas–when you consider the type of coal that will mostly be burned.
And that right there defines everything that is wrong with the green energy movement.
Exxon has published an energy outlook to 2050
https://corporate.exxonmobil.com/what-we-do/energy-supply/global-outlook#Keyinsights
I’ve not yet seen much of it, but share here a chart of the demand for energy they foresee.
A key assumption is that global purchasing power will continue to grow unabated.
Clearly they also foresee a very long fat tail for oil supply. and nat gas not yet peaking by 2050.
Coal down down by about 1/2 from this current peak.
Nuclear up something like 20%.
The executive summary is worth a good read at least-
https://corporate.exxonmobil.com/-/media/global/files/global-outlook/2023/2023-global-outlook-executive-summary.pdf
I don’t see how this jives with their overall projection.
It looks like they are extremely optimistic on new Oil discovery and production.
Some things are just so goddamn obvious that one wonders why people are unable to comprehend what is slapping them in the face. The world is not flat, Trump is an idiot, and there will be NO new oil supply that is required to meet global needs.
Ron,
No new oil supply is just as unlikely (perhaps moreso) than the Exxon prediction, reality will fall between these views and probably closer to the IEA NZE scenario which will require some new oil and gas supply.
I would hope the bog would forgive an illiterate dull spoon but the chart above does not show an energy transition in any shape manner or form over the next 27 years. But of course our local experts probably know more about current, planned and possible energy food chain than exxon. Perhaps I can have my grandkids post a “i told you so” after my passing. 😂
Texastea,
Kodak also knew quite a bit about producing film. My guess is that their predictions for the World market for film in 1995 were not very good. The same will be true for Exxon’s energy outlook published recently. Oil output will be far lower than their forecast after 2030 and wind and solar output will continue to grow exponentially gradually replacing fossil fuel energy use. Perhaps nuclear output will grow a bit, but it has been relatively flat for 20 years, so I am skeptical.
Hickory
That illustration does not include one critical energy source – food. Photosynthetically captured solar energy critical to human survival , production of which is enhanced strongly by the other energy sources.
Talk about a house of cards!
“A world with more people and more prosperity”
Sounds more like a marketing piece than a scientific outlook. But we shouldn’t expect anything else. They aren’t ever going to say the world coming to an end as we know it, they need people to continue investing and keep the wheels of the economic system in motion.
I have three points of contention to raise regarding the Exxon 2050 projection.
First, it assumes rising global purchasing power, which to me fly’s in the face of prospects of issues like rising inflation of just about everything and increased costs of debt service, insurance and natural disasters.
Second, it assumes that global oil production can be maintained at roughly current levels out to 2050…just look at the graph.
I find that to be a highly unlikely outcome, no matter how much money is thrown at the sector. I suppose some dramatic new oil extraction technology could be discovered and developed, but I am not holding my breathe on that any more than I hold it for fusion energy.
Third, it looks like climate disruption from greenhouse gas accumulation in the atmosphere is just now starting to escalate. And it will likely blow past the 2.0C temperature increase level they point to. The resultant global economic damage is heavily underestimated, as I see it.
I will not quibble with the Electricity component of the Exxon projection even if it is heavily optimistic,
with global electricity production doubling over the next 27 years.
The incentives for this massive industrial tidal wave are huge and inevitable,
with the big factors of oil depletion, greenhouse gas climate instability, population growth and a big push for increased energy use efficiency,
being the big drivers of this dominant trend.
Here’s a key takeaway…think we all agree investment won’t matter much at this point…
“Given that oil and natural gas are projected to remain a critical component of a global energy system through 2050, sustained investments are essential to offset depletion as production naturally declines by 5-7% per year”
That’s a 10% drop coming very soon, likely within next 6-12 month timeframe…
look like BP agrees, More oil and gas investment needed.
This weekend, the chief executive of BP, Bernard Looney, said that the world needs to invest in more oil and gas production.”
https://oilprice.com/Energy/Crude-Oil/Global-Fossil-Fuel-Subsidies-Skyrocket-To-7-Trillion.html
Note that BP has a very different energy outlook from XOM, see page 12 and 16 at link below
https://www.bp.com/content/dam/bp/business-sites/en/global/corporate/pdfs/energy-economics/energy-outlook/bp-energy-outlook-2023.pdf
The above is an excellent analysis, if written by some schoolgirl named Polly Anna.
He makes a whole bunch of references to a virtual drying up of Russian oil and gas. India, Pakistan and China have shown a gleeful excitement about glomming that up.
And he very dramatically shaves down the use of coal without implying exactly how he thinks that’s going to happen without immense subsidy from the rest of the world–which would break the World Bank.
Sorry, but on balance, I think I’ll stick with Exxon’s analysis. And it’s more than a little aggravating that the BP CEO says the world needs to invest in more oil and gas but their chief economist presents a cogent format for its destruction.
Investment in oil and gas has faltered for one reason: every government has made it clear that they would be more than happy to destroy any oil and gas company as soon as there is a replacement. Mr. Dale talks about a “smooth transition.” How, when you have multibillion-dollar investments up front that require decades to recoup?
Gerry,
I doubt the transition will be smooth, but consider the fact that World energy consumption increased by 23 EJ from 2018 to 2022, while World fossil fuel consumption increased by only 6 EJ, at some point (my guess is 2028) fossil fuel consumption will stop growing and will start declining with gradual replacement by non-fossil fuel energy sources. The transition will be disruptive and difficult in my view, the Exxon view is likely to prove incorrect.
Source please ?
Iron Mike,
https://www.energyinst.org/statistical-review
Or how about an incredibly simple answer?
At current prices, there is simply no one willing to invest in new projects?
But more importantly, how do you invest when new discoveries aren’t occurring?
It is after all the entire point/reason why these companies exist, to find and develop new oil and gas resources.
If the US oil fields have another growth spurt, it will need to be at a much much higher price point, likely in the 200-300 range, sometime next year…but how will anyone afford those prices?
Kengeo,
At those prices I think the rest of the public and the wider world wakes up to the fact we’re now post peak oil. I doubt a drop of oil gets drilled out of Tier 2 and lower wells even at those prices because of demand destruction.
The implications are basically degrowth, which means an economic depression. No one has seen anything like this ever, the collapse of industrial civilization.
I have previously mentioned several points made in this article, namely that the inflation pig in the oil and gas pipeline has largely run its course and deflationary pressures have taken over and are accelerating. Two, the business will “normalize” as they do. Also mentioned are the benefits of the consolidation we have seen, lower levels of activity will be somewhat deflationary with respect to man and materials going forward. I have used the words “golden era” returning to the oil patch perhaps the picture now becomes a bit clearer. The higher levels of permitting I am seeing in central OKLA jives with the articles broad conclusion, activity will pick up later this year but discipline continues to be the overall theme.
https://oilprice.com/Energy/Crude-Oil/Is-The-Shale-Reinvestment-Surge-Just-A-Blip-Or-A-Strategy-Shift.html
look at that huge f’ing draw
-11.49 -2.42 14.87 -15.40 2012 – 2023 BBL/1Million Weekly
WTI Extends Gains After API Reports Huge Crude Draw
Crude stocks drew-down for the 3rd week in a row, plunging 11.5mm barrels last week (perhaps in preparation for Idalia?)…
API
Crude -11.486mm (-2mm exp)
Cushing
Gasoline (-1.3mm exp)
Distillates (-500k exp)
https://www.zerohedge.com/energy/wti-extends-gains-after-api-reports-huge-crude-draw
OVI,
LOL… looks like the U.S. Govt better start adding a bunch more oil to the SPR.
steve
Steve
Biden should have contacted MBS and agreed to pay $85/b for 100 M bbl that would not come onto the market but go straight into the SPR. It would be below the US’ average price and would allow MBS to sell that oil without affecting the market and possibly repair the ruptured relations.
Why couldn’t they think of that. Hopefully someone in the administration might read this.
https://www.forbes.com/sites/investor/2023/08/29/oil-is-going-to-300-a-barrel/amp/
🖖
Texasteatwo,
That piece was very weak tea imho.
Forbes is best to be read as entertainment——-
yes it was dennis…but history with respect to holding tangible assets(including oil) during an inflationary period is very strong tea indeed. To me the inflationary argument is the ice cream on top of the oil fundamentals, both near term and long term, cake. imho 🤠
I don’t know if this is the proper forum for this issue, and I don’t know that emphasizing it will do any good, but it’s the single most important aspect of global climate change. We all talk about the coal-fired utility plants in China–over 1,100 of them–but a poorly expounded fact is that the mining of coal produces more methane than the burning of it. China still produces roughly 60% of its power from coal. It’s enough to make you sick.
Why are they mining all this coal? For electricity. To make things. Lately those things have been electric vehicles, solar panels, and wind turbines by the thousands. And the U.S. just goes blithely along, buying this crap, talking about the horrors of a Chevy pickup blasting down La Cienega Boulevard when China is, quite literally, polluting the earth making the crap that the rest of the world uses in a poorly thought out energy transition.
Until the world decides that this is reprehensible behavior, it makes no damn difference meeting in Scotland or wherever for the climate conference. And that coal that China mines and burns? About 55% is bituminous, loaded with sulfur, about 30% is sub-bituminous, which is worse, and almost 20% is lignite, which is the moral equivalent of burning cow chips.
Nobody mentions this. Not BlackRock. Not Apple. Not Bill Gates. Not Elon Musk. And we’re talking about the world-changing wonders of shifting to electric vehicles, wind and solar? We are surely doomed!
Gerry
China is proving what I have said for years.
If China were like Germany and had already reached peak electricity consumption per capita then every wind turbine and solar panel would reduce coal consumption by a tiny amount.
However this is far from the case.
https://ourworldindata.org/grapher/per-capita-electricity-generation?tab=chart&country=~CHN
https://ourworldindata.org/grapher/electricity-generation?tab=chart&country=~CHN
All the wind turbines in the U.K produced 80TW hours of electricity last year.
China increased electricity consumption by 400TW hours.
It is impossible to build solar and wind at a rate to match that level of increase. That is why this year China is burning more coal than ever. The same amount as the U.K. will burn in 400 years.
Last year 6 million hectares of forest were destroyed by wildfires, this year was even worse.
Deforestation, soil erosion and desertification have brought global warming forward decades. Talking about net zero in 2040 I leave to people like Island boy.
The time to prevent large scale fires and floods was 20 years ago. The time of consequences is here.
China emissions
The circled part is the industrial belt of Russia, approximately from Omsk to Tomsk. Not a lot of people live there in comparison to the north India Ganges river basin shown south of there. Still, China dwarfs this. Look for example at the NE corridor of the USA or all of Europe. But may not even believe that figure from here apparently:
https://www.windy.com/-Show—add-more-layers/overlays?cosc,30.676,41.924,3,m:eOzafm6
Spot on Charles…renewables are just oil derivatives anyhow, they all cease to matter as oil production decreases. Somewhat ironically, when you need them most (night/storms/cold/heat), renewables aren’t there unless they have a robust backup system (grid w/ batteries).
China knows this, that’s why they sell everyone else the renewable slop and hoard oil and coal.
Meanwhile we used half of our SPR for a short lived price reduction?
Has anyone been able to figure out how US oil production jumped so much the past few weeks? Is it all due to a revision or something? Sorry if discussed somewhere else on this thread…sometimes it’s hard to find it in 200 comments…
273 MM BO, at least (now that many SPR facilities are making water), since 1.21. That is chicken feed compared to the 3.6 G BO of tight oil exports during the same time frame. What we got for all that was a $32 BO INCREASE in oil, gasoline near $4 and failed foreign policy that has allowed Russia, China and OPEC + to strengthen their alliances in the East. Exports are NOT strengthening US national security.
Mike, we are all wondering about the miracle production increase in the USA in the last 2 months. With sinking rigs and spreads…
Has somebody cracked the code, can this be done by just opening the choke and ruining the wells, or are the numbers only pure bulls*?
Its from gretter “efficiencies,” I thought everybody knew THAT !
Just kidding.
Its longer laterals, and bigger fracs, and absolutely pulling the guts out of new wells. RR and EUR is a thing of the past, now cash flow in King. That and 520 completed DUC’s in the Permian (Novi) since January for 420K BOPD (just DUC’s). All of which happened six months lag time ago… just wait three to four months and stuff will look way different. What else? Oh yeah, lots more lying, as in lots more bull shit, yes sir.
“China knows this, that’s why they sell everyone else the renewable slop and hoard oil and coal.”
Thats silly…to be polite. I know you can do better.
China is the number installer of photovoltaics and wind turbines in the world by far.
On their own turf.
It gets worse Mr Maddoux. China is mining and burning 4,800 mtpa of domestic coal and they are also importing 480 mtpa of coal. They wouldn’t be importing coal if they could mine it themselves so they are at or near peak coal. There are 4.8 barrels of oil equivalent in a tonne of coal so that is 69.7 million barrels of oil equivalent per day. In the last few years their coal consumption has increased faster than GDP so what has taken the increased growth? EV sales in China are now 29% of total car sales and the power for that has to come from somewhere. That somewhere is the increased coal burn. The increased coal burn to power electric vehicles means that will tip over into resource decline faster and the cost of mining Chinese coal will go up faster.
Now a lot of the world’s solar panels and wind turbines are made in China because of their cheap coal and thus cheap power. But going EV, in the absence of a nuclear buildout, means that their cost of making solar panels will go up faster. China’s EV fleet means that the cost of renewable energy for the rest of the world will got up faster.
At current rate of coal consumption China has about 35 years left of proven reserves.
HHH
The mines are getting deeper, the seams are getting thinner. Costs are increasing.
China is at peak coal mining so we have another inflation factor at play
You mean another deflation factor at play. Lack of energy is going to mean lack of loans made. Economies are going to absolutely implode down to much lower consumption of all things.
Inflation is always and everywhere a monetary phenomenon. Governments and central banks don’t control the money supply. Commercial banks do.
Investing in China long term is foolish knowing the energy situation. As the export land model plays out in Russia and Saudi Arabia. China’s available oil imports will decrease.
Less oil will mean less coal production. Less coal consumption. Less overall consumption in the economy.
And for anyone wanting to push back and say China will just out bid everyone. Fine, China will get it’s oil but all of China’s trading partners won’t which will result in less demand and less consumption of all things.
HHH,
Charles means the cost of energy will go up, which means cost of everything depending on energy goes up.
Lack of energy might be a factor further down the line when physical limits manifest and there is actual physical shortages, not ones enforced by economic decisions.
Inflation is always and everywhere a monetary phenomenon.
That’s a false statement made by economists ignorant of the real world.
Physical constraints, war and deglobalisation are just a few examples that show inflation isn’t just a monetary phenomena.
As far as I can see here in Australia, banks are still lending out money willy nilly, the property market here is so overpriced both rentals and purchasing. It will continue this way until something tremendous causes the banks to stop lending out money. That’s when deflation and your oil price scenario might come to fruition. Until then we currently living in an inflationary world.
Mike a sudden supply side shock isn’t the same as inflation. There is no money backing higher prices. Which ultimately leads to demand destruction. As consumers can’t pay the higher prices.
If supply can’t increase here then demand will decrease. And oil supply will balance with demand. Inflation isn’t in the cards.
HHH- “Less oil will mean less coal production. Less coal consumption. Less overall consumption in the economy.”
I think you’ve got that wrong. If China faces a shortfall of oil or gas, they will push even harder on coal production and importation. All countries will. And if they can’t get enough coal they will cut whats left of their forests.
Its the combustion addiction… multiplied by 8.1 billion.
Australia and the USA have 40% of the world’s coal reserves.
Australia and the USA have a tight military relationship. Australia needs the USA for weapons. The USA will need Australia for resources.
This will play huge in the future when people are desperate for fossil fuels, rare earths, uranium, food, cobalt, etc etc.
It’s already too late on climate change.
The Beetaloo Basin (which is starting to get frac’ed with USA technology) and the Coober Pedy will look like candy to a 3 year old in the future.
For 20 million Blokes and Sheilia’s and over a trillion in GDP,
Australia becoming the 51st state of America is a WIN-WIN for both countries.
Gerry, thanks. That’s a startling and succinct comment. It supports my suspicion that this “green&cleen transition” meme is just feel-good bullshit.
Industrial production seeks inexpensive inputs, whether it is labor, raw material or energy.
China energy consumption is coal as the number one source.
Many of the worlds industrial products are made in China. In effect the world has outsourced much of its coal consumption to China. If you reallocated the coal combustion to the countries that purchased the end products you would see a very different map, including one that featured the US and Europe very prominently.
Time will tell if the Exxon projection on coal, which includes global peak right around now, plays out as they depict. It assumes a global voluntary restriction on coal combustion.
I’m not so sure it will play out that way. I would not be surprised for humanity to burn a much higher amount of coal than is projected….coal and wood is what people burn when they can’t afford other sources of energy (and if they live in cloudy areas).
Information nugget- The energy payback time for the photovoltaic lifecycle (all inputs from mining to manufacturing, etc) is in the 1-3 year range in moderately sunny areas. Meaning that the next 30 plus years are net positive on energy. Without carbon emission. Solar manufacturer SunPower, for example, includes a power production guarantee of 92% after 25 years. The degradation rate is slow and steady for decent panels.
https://www.cnbc.com/2023/08/30/how-china-became-king-of-new-nuclear-power-how-us-could-catch-up.html
nat gas to nuclear is the way……always has been.
@Hickory, the bit that you and many others continually comment on about PV having a 1-3 year pay back period, I find is totally wrong.
Could you or anyone else that believes this please provide one, just one reference, that shows this to be true. In EROEI it is the Energy Invested bit I find completely misrepresented in EVERY bit of research.
I’m talking about the actual amount of energy invested, how any paper decides on what the Energy Invested comprises. It is nearly always the aluminium frame xx Kwh, the glass yy Kwh, the polymers and plastic zz Kwh, silicon waffers aa Kwh, etc..
No mention of how much energy in the background system operating to bring it all together, which is high, as it includes the energy cost of building the factories, roads, transport vehicles, mines, processing plants, the education and expertise of all the workers all along the way, the ports and ships for transport etc.
I can get the 1-3 year payback period if I use the known energy invested in in just the aluminium, glass, plastic polymers, silicon wafers, copper etc in the proportions given for PV manufacture, and ignore everything else. However when including the entire system operating in the background it is a totally different number. Only the dollar price of PV plus the installation cost, plus the operating and maintenance cost over the life gives a close approximation of the total Energy Invested.
So before using such off the cuff terms as 1-3 year payback, can you please find a single reference that shows this and includes ALL energy costs, not just the easy to measure ones.
Hideaway
The financial payback time is a very good indicator to EROI payback as it includes all costs which reflect energy used at all points from mining the elements used, to paying people who use energy etc.
Financial payback time is 9 – 12 years
The financial payback time is a very good indicator of EROEI providing you use wholesale rates for the power generated. The system is built with wholesale rates not retail. Currently in Australia the wholesale price of electricity is very low or negative during the middle of the day, reflecting too much solar and wind when it’s not required. It means in a real market, no more solar or wind should be built in the AEMO system, as it would run at a persistent loss, so is economically non viable.
Using the solar industries own costs for construction of a solar farm, and their own estimated capacity factors, solar is about 3:1 EROEI. However the actual solar output from the largest 10 solar farms averaged 19.6% capacity factor from 2018-22, while the theoretical capacity factor was 29%. It’s the same for wind where a nearby 132Mw wind farm was planned with a 37% capacity factor, yet only had a 24% capacity factor in the first 4 years of operation.
Things break and need repairing, the main transmission lines can be overloaded and they have to power down, plus there are times when they just turn them off to avoid a negative market rate.
We can’t run a civilization like we have now off solar, wind and nuclear as the EROEI is just too low, but we have all sorts of denial happening (denial of the most expensive energy cost in building them) to make the numbers of solar, wind and nuclear look a lot better than they really are.
Thermal coal power plants only have an EROEI of 3.5-4:1 not much better than solar and wind, but they could provide power 24/7. Even with coal powered electricity we couldn’t have the modern industrial civilization we currently enjoy. It is the much higher oil and gas EROEI that provides for modern civilization as we know it. Same for even hydro power from world averages only has an EROEI 1.5-2:1 over an average 70 year life.
Just as a small comparison, a company I’m invested in, is about to connect a small gas field of ~50B cuft to the WA main pipeline. Capital cost $US14.7M, O&M cost $US0.12/Gj. It will have an EROEI of 42:1 (I have excluded the condensate they are also getting, of over 1Mbbls!! at a cost of collecting and transport).
The biggest weakness in all existing EROEI calculations and research papers, is that they all count existing fossil fuel use in the cost as if it was directly fungible with intermittent solar and wind (without any storage!!)
Reality smell test-
As we all know energy is not as cheap as it used to be.
When the utilities of the world make decisions on new production facilities they are
making long decisions in the range of 30 years.
Their decision equation includes the costs of things like fuel, insurance, financing, labor, maintenance and equipment.
Make no mistake- when a utility purchases material and/or equipment such as turbine, natural gas, transformer, uranium, photovoltaic, copper, steel, or coal, for example
the costs they pay includes all of the energy required in the production and delivery of these items. No supplier at any step in the production chain is paying the costs of the energy out of their own pocket, rather it is always passed on to the product purchaser.
Just how all of this plays out can be seen in the decisions that the global utilities are making for current electrical energy generation stations being installed-
in other words ‘the proof is in the pudding’
“In 2022, we expect 46.1 gigawatts (GW) of new utility-scale electric generating capacity to be added to the U.S. power grid, according to our Preliminary Monthly Electric Generator Inventory. Almost half of the planned 2022 capacity additions are solar, followed by natural gas at 21% and wind at 17%” source is the US government
https://www.eia.gov/todayinenergy/detail.php?id=50818.
China example from S&P global-
China’s thermal power generation, including coal and gas, capacity grew by around 35 GW or 2.7% in 2022, compared with around 145 GW or more than 14% growth, in renewables capacity (solar, wind and hydro), official data showed….China to add nearly 100 GW of solar capacity to reach 490 GW in 2023, which will be the largest solar capacity added in a single year and compares with around 85 GW of capacity added in 2022.
https://www.spglobal.com/commodityinsights/en/market-insights/latest-news/energy-transition/020123-china-to-maintain-renewables-growth-pace-in-2023-despite-uncertainty
You can look through these reports.
Keep in mind a few things
-earlier reports from before 2010 of low eroi for PV are no longer relevant since manufacturing scale and cost/panel have been dramatically improved, as reflected in the price which has dropped by something like 90%. That reflects a much lower energy input per panel.
-the energy payback time for the PV component is a much different number than financial payback time for an installed system. Same applies to all types of energy generating/processing systems. That shouldn’t be a surprise to anyone who is familiar how business and industry works.
-Energy payback time for solar obviously depends on where you put the generating station. In a cloudy area it will be relatively poor, whereas in a sunny area it will be much better. Energy payback time in Ireland or Nova Scotia is going to many years longer than in Spain or Virginia.
https://energyeducation.ca/encyclopedia/Payback
https://www.researchgate.net/publication/317305611_Review_on_Life_Cycle_Assessment_of_Energy_Payback_of_Solar_Photovoltaic_Systems_and_a_Case_Study
https://sinovoltaics.com/learning-center/solar-panels/energy-payback-time-for-solar-systems/
https://www.nrel.gov/docs/fy04osti/35489.pdf
https://www.ise.fraunhofer.de/content/dam/ise/de/documents/publications/studies/Photovoltaics-Report.pdf
Gerry,
China’s energy consumption increased by 21 EJ from 2018 to 2022 (Stat Review of World Energy) and 58% of this increase was from increased fossil fuel consumption with 38% of the increase from higher coal use. Also note that China’s increased energy use comprised 92% of the World increase in energy use, though for the World as a whole only 26% of the increase in energy use was due to increased fossil fuel use, 6 of 23 EJ from 2018 to 2022.
Gerry, the lifecycle carbon emissions for various energy sources has been heavily studied worldwide, and also discussed here (other thread) numerous times.
Here you go with data (compilation study from your government)
Life Cycle Emissions Factors for Electricity Generation Technologies-
(All values are in grams of carbon dioxide equivalent per kilowatt-hour (g CO2e/kWh)
Wind 13
Nuclear 13
Hydropower 21
Photovoltaic 43
Natural Gas 486
Oil 840
Coal 1001
Take note that lifecycle analysis includes the energy and combustion required at all phases of manufacture, deployment and operation. I am not sure how they take into account decommissioning, which is probably hard to accurately measure. But I’m sure various people have worked on putting that into the equation.
Sept 2021 update- https://www.nrel.gov/docs/fy21osti/80580.pdf
Cat is working it’s way out of the bag?
https://oilprice-com.cdn.ampproject.org/v/s/oilprice.com/Energy/Crude-Oil/Whats-Wrong-With-Rystad-Energys-Global-Oil-Reserve-Estimate.amp.html?amp_js_v=0.1#webview=1&cap=swipe
Which is it? Less than 300 Gb or more than 1500 Gb…truth is likely in the middle…URR = 2,200 Gb (at the very most)
Kengeo,
That article by Bentley fails to mention contingent resources which are discovered resources which are not currently considered commercial, the total is about 780 Gb and it is very likely these resources will become commercial in the future as current 2P reserves get produced, the important number is the 2PC reserve estimate of 1283 Gb. Also it is likely more oil will be discovered, adding another 300 to 400 Gb to the total, some of this 300 to 400 Gb will be in the form of future reserve growth.
Yes Dennis, you are probably right. All the cheap stuff is gone. All that is left is those small patches that are yet to be discovered. Then there is the other very expensive stuff, like Venezuela and Canada. That will help. But there is no doubt whatsoever that the scraps that are left will cost a lot more to recover. And those small patches will decline a lot faster.
Here is the headline for the link Gengeo posted.
What’s Wrong With Rystad Energy’s Global Oil Reserve Estimate? Bold Theirs
In a recent press release, energy consultancy Rystad Energy pegs the world’s proved oil reserves at 285 billion barrels.
Rystad Energy’s proved oil reserves estimate is much lower than estimates of organizations such as the EIA, OPEC, BP etc.
Ron,
I read the piece. The problem with it is that it completely ignores contingent resources, a glaring oversight.
Dennis, I said you are right.
con·tin·gent
ADJECTIVE subject to change:
SIMILAR: chance accidental, fortuitous, possible, unforeseen
Yes, you are correct. They just might find a lot more oil. Then again, they might not. 😂
In my experience it is rare that much net recovery is ever added from contingent resources, especially in mature areas. There may be a bit of swapping between possible and contingent but overall the expected recovery is usually probable plus proved; any contingent or possible recovered is on average balanced by 2P estimates that don’t pan out. The large majority of Rystad contingency is with OPEC members, I don’t know how these have been estimated (e.g. I think there is a big reservoir directly under Baghdad, but short of bull dozing the city it is not accessible; is this included?).
Ron,
See
https://www.spe.org/en/industry/petroleum-resources-classification-system-definitions/
Contingent Resources are those quantities of petroleum which are estimated, on a given date, to be potentially recoverable from known accumulations, but which are not currently considered to be commercially recoverable.
It is recognized that some ambiguity may exist between the definitions of contingent resources and unproved reserves. This is a reflection of variations in current industry practice. It is recommended that if the degree of commitment is not such that the accumulation is expected to be developed and placed on production within a reasonable timeframe, the estimated recoverable volumes for the accumulation be classified as contingent resources.
Contingent Resources may include, for example, accumulations for which there is currently no viable market, or where commercial recovery is dependent on the development of new technology, or where evaluation of the accumulation is still at an early stage.
Note that these resources have already been discovered. Whether they become reserves is contingent on oil price, technology, infrastructure, politics, etc. It is possible some contingent resources will never be produced. The median estimate is the best guess of industry professionals on what proportion of all contingent resources is likely to become a part of 2P reserves in the future, with a 50/50 chance that the number will be either higher or lower than the median estimate (P50).
API
Crude -11.486mm (-2mm exp)
Cushing -2.23mm
Gasoline 1.4mm (-1.3mm exp)
Distillates 2.46mm (-500k exp)
DOE
Crude -10.6mm (-2mm exp)
Cushing -1.5mm
Gasoline -214k (-1.3mm exp)
Distillates 1.2mm (-500k exp)
The official data confirmed API’s reported large crude draw and also Cushing stocks continue to fall…
Eric Nuttall
@ericnuttall
·
2h
“Global oil inventories are now only 10MM Bbls away from the record deficit set in June 2022, which reversed solely due to the largest release from Strategic Political Reserves (SPR) in history. We remain bullish.”
Nuttall has several comments and charts for those interested.
https://twitter.com/ericnuttall
Not at all sure how “they” will keep oil from breaking above $83 as it heads to $90. These types of draws are built in at least through the end of September. If we are still @ $80 wti despite those large draws the Saudi will extend or loose face. I am still in the camp they are in it to win it and once again control the market.
Today there is a lot of fast price action.
With the first big DOE draw, “they” manages to create a -3% crash – now the price AI trading computers are set in “big draw – price must go down”.
Prices will have to go up when the draws continue – and finally when at some point the working minimum isn’t there anymore. Much of the global trading stock isn’t free, but on transit on a tanker from SA to Australia or in a pipeline. When the flow begins to fail, prices will go up no matter the things some future traders do, At least the price for the real black goo needed by refineries, not the paper one.
https://oilprice.com/Energy/Crude-Oil/US-Consumer-Oil-Demand-Has-Exceeded-Expectations.html
reasoned oil market commentary.
“After years of rising production costs amid post-pandemic inflation, the U.S. Shale Patch can finally breathe a sigh of relief after the cost trajectory hit a turning point. Production costs fell 1% year-on-year in the second quarter, marking the first time they have shrunk in three years. Drill pipe prices have halved this year, daily rig rates are down by more than 10% and the costs of steel and diesel are also trending lower. According to Goldman Sachs via Bloomberg, Drill pipe prices have fallen by 50% this year; daily rig rates are down by more than 10% while the costs of diesel and steel have been gradually declining. Only labor has been defying this trend as wages continue rising.”
“Global oil markets remain tight, with StanChart estimating that the August global inventory draw clocked in at 2.8 million barrels per day (mb/d), with a further 2.4 mb/d draw forecast for next month. ”
golden age for US upstream
Diesel price over 60 days has increased by 18%…that’s a big jump over a very short timeframe…
We’re already back to Jan/Feb price levels…
Something tells me the Fed has more rate increases in store for economy…
Diesel cost…two months ago i was paying $3.09, today $4.19
Bloomberg Predicts Peak Oil Demand In 2027 Bold theirs
Bloomberg’s analysis indicates that the demand for gasoline and diesel has already peaked in the U.S. and Europe, and is expected to peak in China by 2024, with India following in the 2030s.
Electric vehicles are expected to displace 20 million barrels per day in oil demand by 2040, up from the current 2 million barrels per day.
Despite optimistic forecasts about the EV revolution obliterating oil demand, estimates vary widely, ranging from a severe to a minimal impact on future oil consumption.
A couple of weeks ago, the International Energy Agency reported that global oil demand reached an all-time high of 103mn barrels a day in June. According to the global energy watchdog, robust demand was driven by better than expected economic growth in OECD countries, surging oil consumption in China, particularly for petrochemical production and strong summer air travel. The IEA has predicted that demand could hit another peak in August and remains on track to average 102.2mn b/d for the whole year, the highest ever annual level.
Well, it appears the oil bonanza’s days are numbered. Bloomberg has predicted that global demand for road fuel will continue to grow for only four more years, with demand peaking in 2027 at 49 million barrels per day before entering terminal decline. According to Bloomberg, electric vehicles, ever-improving fuel efficiency and shared mobility are the oil sector’s biggest nemesis, with EVs expected to displace a staggering 20 million barrels per day in oil demand by 2040, up from 2 million barrels per day currently.
Bloomberg reckons that demand for gasoline and diesel for road transport has already peaked in the U.S. and Europe, while demand in China is set to peak in 2024. Demand in other major consuming countries like India will go into a tailspin in the 2030s.
The above discounts the most obvious fuel-consuming phenomenon in the history of the world: WAR.
It seems like I’m the only guy who brings this up and I’m beginning to feel self-conscious about it; however, at Bretton Woods, hegemony was tied to the Gold Standard, which Nixon abolished, and the nearly clairvoyant Henry Kissinger came up with surrogate known for decades as the Petrodollar. Several countries are now not using the Petrodollar. Even the Saudis are comfortable with a PetroYuan.
But it’s more complicated. Whoever has the best semiconductor chip wins. And right now that’s Taiwan. The U.S. figures it can be neck-and-neck in 2028. China subscribes to the One-China philosophy. China has the lock on most things electronic via rare earth elements. China will make a play for Taiwan at some point.
I certainly hope I’m wrong, but I’m a strong believer in Graham Allison’s lifelong work at the Kennedy School, which he published as the virtual inevitability of war between China and the U.S. Over hegemony, of course. And boy, a shooting war can drink up a lot of fuel fast. Of course, it could be over very quickly, and none of this matters, but with annihilation there is no hegemony.
When you compare, the U.S. Strategic Petroleum Reserve is half empty. China has hoarded up to 950 million barrels. That doesn’t sound like a peacetime plan to me.
The average American politician is so incredibly oil stupid they believe because of the Permian tight oil phenomena, and that is what it is, a speed bump, we do not need an SPR. Nine to twelve months, that is what I have been told is what it takes to spud a Wolfcamp well and turn that lousty stuff into JP4 for the military. A year! Right now we’d have to kick China’s ass within three months or we’d be screwed.
We could call a timeout, I guess, and try to import all the crude oil we’ve exported to China the past four years, back, but they might not like that idea.
We could ask the KSA for hep, but I don’t think they would, nor would Russia, Venezuela, Iran, Iraq or anybody else for that matter. We could always get on our knees and beg, I suppose. God knows, because of piss poor policy, we have had to do it before.
But, we’re in good hands, right, so let’s all stay calm and export on. Generally speaking, “free trade is good for the country,” even when it’s the last of our natural resources, right?
It ain’t that bad. China might feed itself if it was happy to go on a completely vegetarian diet but at the moment 40% of the plant protein that goes into their food system is imported – to feed pigs and chickens. I have read that as recently as 20 years ago coal miners in northeast China only ate meat twice a year. That is why the Ukraine war has shocked the Chicoms. It might go to its second anniversary. If war with China went on that long, there would be a lot of unhappy Chinese. That is why they are now tearing up forests, pulling up orchards and bulldozing greenbelts – to plant more grain. Xi has directed that grain production is to increase by 50 mtpa. They spent billions on a greenbelt around Chengdu – now gone.
Mr. Maddoux,
It is certainly justifiable – and, tragically, unsurprising (‘only the dead have seen the end of war’) – that you express trepidation about the possibility (inevitability?) regarding future military conflagration.
Just a few days ago, over 20 drones attacked the Pskov airport.
Pskov is 50 klicks east of the Estonian border. (The drones reportedly came from the western direction.)
Ukraine is 800 klicks to the south … with Belarus in between Ukraine and Pskov.
This attack is being described as the biggest assault upon Russia since WW2 and – as per usual – the MSM is virtually ignoring it.
I simply do not know what it will take for people – Americans most especially – to become more aware of – and effectively engage – with the goings in in the wider world.
Those who attempt to prompt self-interested enlightenment in others are stained by the miasma of being weirdos, conspiracy theorists … some repugnant ‘Other’ unfit to be taken seriously.
Oh well ..
Are you nuts, the NATO directly attacking Russia? Yes, some Russian sources report this, but this isn’t taken seriously even by other Russian sources.
They even don’t allow their rockets to fly to Russia, for a good reason. This is about kicking Russia out of Ukraine, not some total war.
Just the facts: The Ukraine is attacking Moscow on regular base with drones. So they have drones flying so far. The Iranian scooter engine drone even travels up to 2000 km, so it should be possible for any nation to build similar on their own.
They have prepared the attacks for weeks by flying single drones on different corridors to check the air defense. When they found a free corridor, they launched the big attack. No rocket science required, no NATO war required just quite a few cheap drones and a bit preparing.
And they destroyed mostly air lifter planes – a very valid military target.
Price movements make sense since between US, Russia, and Saudi Arabia, 3.0 mb/d was lost from May/June to July with no timeframe to restore those losses…a 10% drop over a month or two is considerable, if continued, that would cut world exports to half in 6 months.
The big question is do we see continued massive drops in exports from the key producing regions, and if so for how long?
If calcs are correct, global crude exports are at >20 year low, last seen in the 2000-2002 timeframe.
15 year plateau was 2004 – 2019, centered at ~2011. Midpoint at ~1,150 Gb, URR = 2,300 Gb.
Estimated producing reserves remaining ~800 Gb.
Of which:
~300 Gb are 1P
~200 Gb are 2P-1P
~300 Gb are 3P-2P-1P
I haven’t seen the rosy plots that Dennis puts together in a while, wondering if they’ve changed at all since last versions?
Kengeo,
No change. Note that at the end of 2018 cumulative C plus C output was 1358 Gb, if we assume that 2018 was the peak and that peak occurs at 50% of URR this would suggest a URR of 1358 times 2 or 2716 Gb, rather than 2200 Gb. Also note that in the real world the peak tends to occur before reaching 50% of URR, so the 2700 Gb URR estimate is likely very conservative (Laherrere estimates a URR of about 3500 Gb).
Global oil supply growing by 1% annually seems like a pretty big stretch.
Right now the countries losing production outweigh those increasing production by wide margins.
Dennis is a economist.
When demand wants more goods, the market provides.
When demand contracts, goods, are less in demand, and price adjustment continue.
(Or something like that)
What could possibly go wrong?
It has somewhat worked for quite a while.
(sarc)
Hightrekker,
I studied both physics and economics. The oil shock model is primarily a physical model.
See https://agupubs.onlinelibrary.wiley.com/doi/book/10.1002/9781119434351
You may find it at your local university library.
https://searchworks.stanford.edu/view/13111483
Kengeo,
Oil supply has been growing since the pandemic. The model has annual World C plus C output increasing by about 628 kb/d on average from 2023 to 2027 which is about 0.7% per year. The estimate is conservative, more likely to be too low rather than too high.
Interesting that you make no comment on 1100 Gb cumulative production being reached in 2009 when peak World output was 74.5 Mb/d (in 2008 at cumulative output of 1072 Gb) and 8.5 Mb/d below the actual peak 10 years later (or more) at 83 Mb/d and cumulative output of 1358 Gb. The 2200 Gb URR estimate for World output that you favor and is 1300 Gb less than a 2022 estimate by Laherrere et al seems quite a bit too low.
New posts up
https://peakoilbarrel.com/steo-and-tight-oil-update-august-2023/
https://peakoilbarrel.com/open-thread-non-petroleum-august-31-2023/