The EIA’s Short Term Energy Outlook (STEO) was published in early August. The chart below estimates World C+C by using the STEO forecast combined with past data from the EIA on World Output.
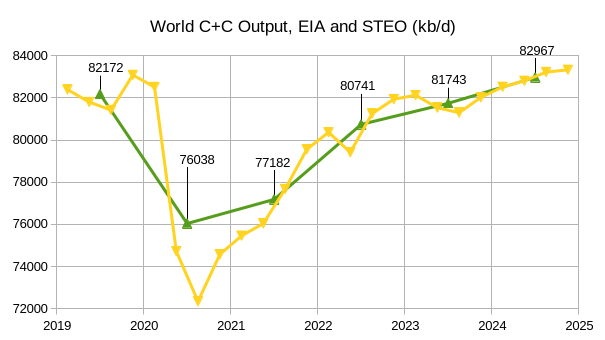
The EIA’s Short Term Energy Outlook (STEO) was revised higher in August compared to July. World C+C output is expected to decrease in the second and third quarters of 2023 and then increase over the next 5 quarters. Annual average World C+C output increases by about 1000 kb/d in 2023 to 81743 kb/d and then to 82967 kb/d in 2024, less than 50 kb/d below the centered 12 month average peak in 2018. This month’s World C+C estimates are about 300 kb/d higher than last month for 2023 and 400 kb/d higher for 2024 due to the revisions in the STEO forecast this month.
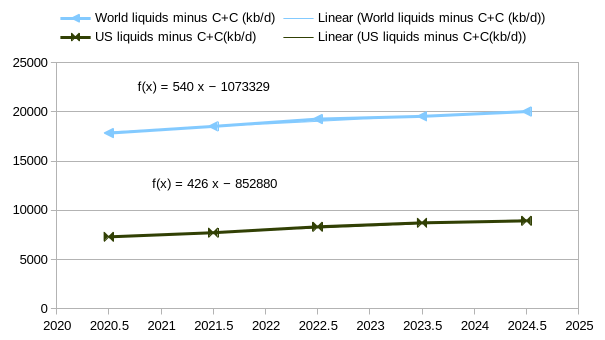
The chart above considers World liquids output minus C+C output aka non-crude liquids such as NGL, biofuels, refinery gain, and other liquids and also presents US non-crude liquids output. The chart includes historical output up to 2023Q1 and uses the STEO forecast for future quarters through 2024Q4. About 79% of the World non-crude liquids increase in output from 2020 to 2024 is expected to come from the US.
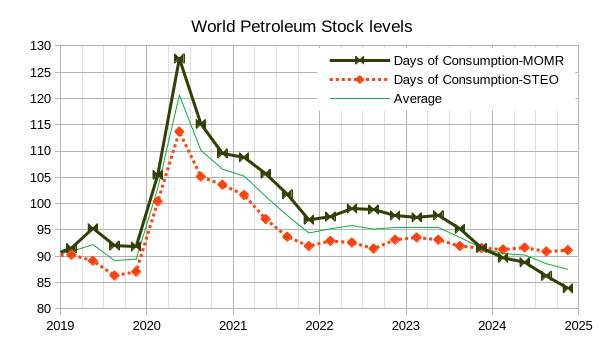
The chart above assumes that at the end of 2018 that World petroleum stocks were large enough to provide 90 days of 2018Q4 consumption and that after that the OPEC MOMR and EIA STEO supply and demand estimates fro World liquids are correct, for 2023Q3 to 2024Q4 the OPEC crude forecast from the EIA’s STEO is used for both the MOMR and STEO estimates because MOMR does not make a forecast after 2023Q2 for OPEC crude output. OPEC expects World petroleum stocks to fall after 2023Q2 based on their World Supply and demand estimates for petroleum, the EIA expects a much smaller decrease based on their estimates.
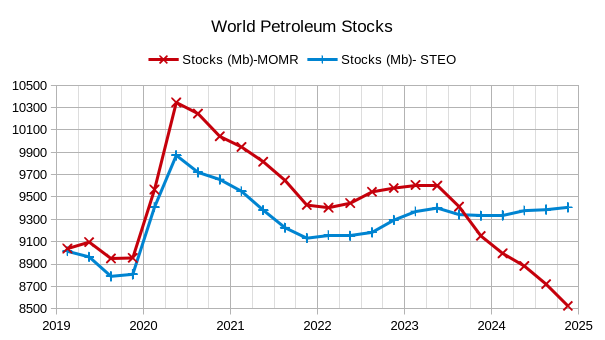
The chart above uses the same methodology as the previous chart, but the data is presented in millions of barrels of petroleum (both crude oil and petroleum products). Note the significant difference between the STEO and MOMR estimates, especially after 2023Q2. If the EIA is correct we might see relatively stable oil prices and if OPEC’s estimate is correct we would expect a significant increase in the price of crude oil.
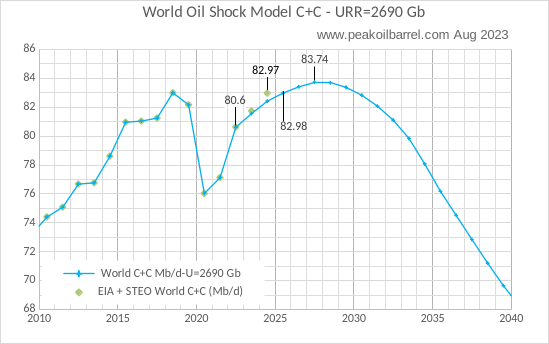
The chart above used Paul Pukite’s Oil Shock Model and my best guess about future oil output. It is assumed that there will be a significant increase in the number of EVs sold worldwide which will reduce demand for oil below the level of supply by 2033 and lead to falling oil prices. The only change from last month is the inclusion of the STEO estimates for 2023 and 2024 on the chart based on the August STEO. The 2024 World C+C output forecast by the STEO is similar to 2025 output in my model, the peak is in 2027 at 83.7 Mb/d.
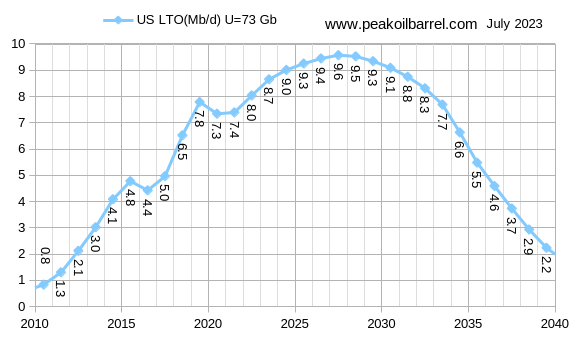
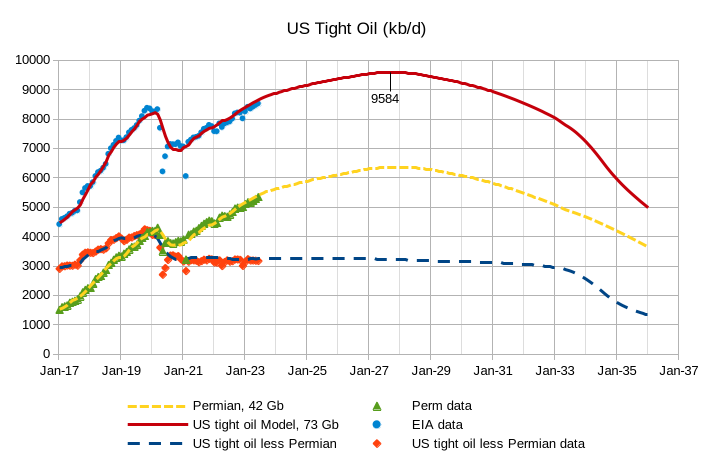
The US tight oil model above is unchanged from last month. Annual average US tight oil output peaks in 2027 at about 9600 kb/d.
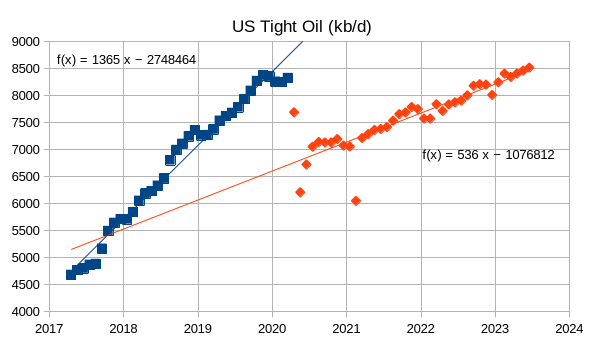
The chart above shows the most recent EIA tight oil estimate (spreadsheet at this link) with data from April 2017 to June 2023. Two trend lines are presented with April 2020 to June 2023 having an annual rate of increase of 536 kb/d and the earlier April 2017 to March 2020 period having an annual rate of increase of 1365 kb/d.
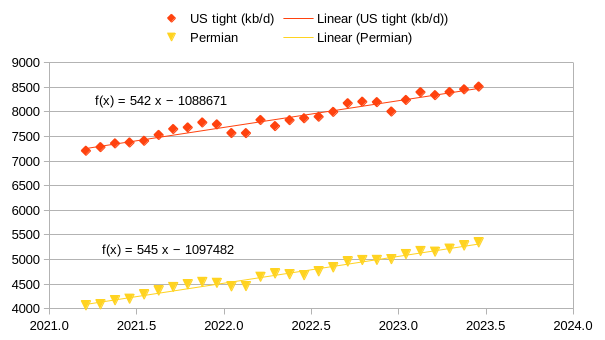
The chart above shows the annual rate of increase in US and Permian basin tight oil output from March 2021 to June 2023, over this period all of the increase in US tight oil output came from the Permian basin. The annual rate of increase is much less than last month’s estimate (625 kb/d for US tight oil) due to revisions in the EIA’s most recent official tight oil estimate.
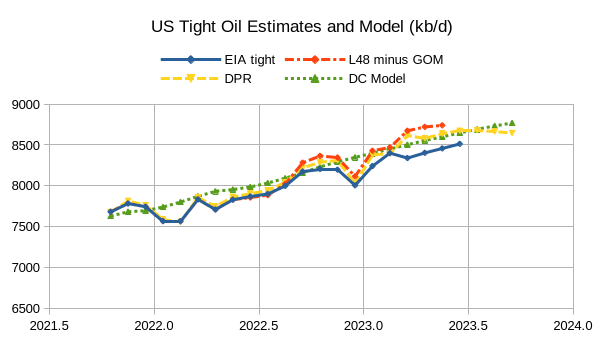
The chart above presents two alternative estimates for US tight oil and compares them wilth my tight oil model (DC Model) and the official EIA tight oil estimate (EIA tight). The first uses the EIA’s C+C estimate for the lower 48 states minus Gulf of Mexico output (L48 minus GOM) and subtracts 1788 kb/d which is roughly the average difference between L48 minus GOM and tight oil output from March 2021 to Sept 2022 (1788 kb/d). The second uses the EIA’s Drilling Productivity Report (DPR) and subtracts the average difference between the DPR and official tight oil estimate from March 2021 to September 2022 (770 kb/d).
It is possible that the most recent tight oil estimate from the EIA may be a bit too low (it was revised significantly lower since the previous month.)
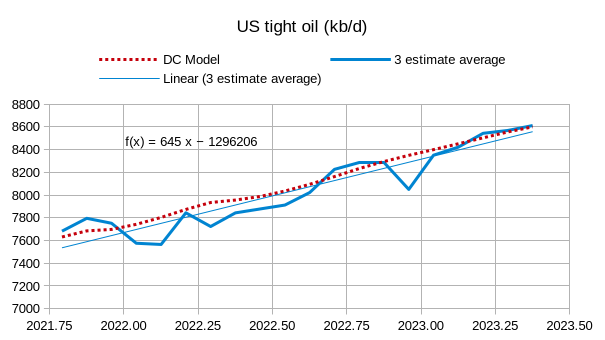
The chart above covers the period from October 2021 to May 2023 and compares the average of three tight oil estimates, the official tight oil estimate and my two estimates based on the Petroleum Supply Monthly (PSM) and DPR data, with my tight oil model. The trend for the average of the three tight oil estimates is an annual increase of 645 kb/d over this period and the model tracks the estimates fairly well.
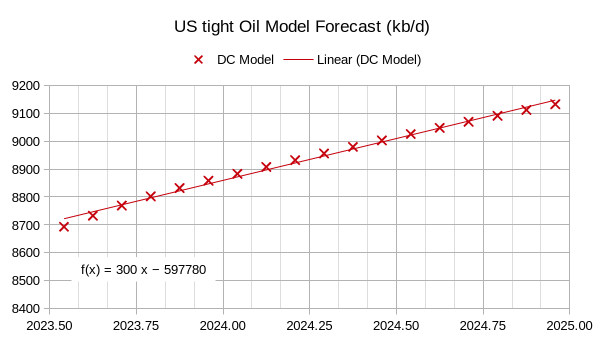
The tight oil model has an annual rate of increase of 300 kb/d from July 2023 to December 2024, less than half the rate of increase from October 2021 to May 2023, from December 2024 to the peak in August 2027 the annual rate of increase in US tight oil output for the DC Model is about 180 kb/d.
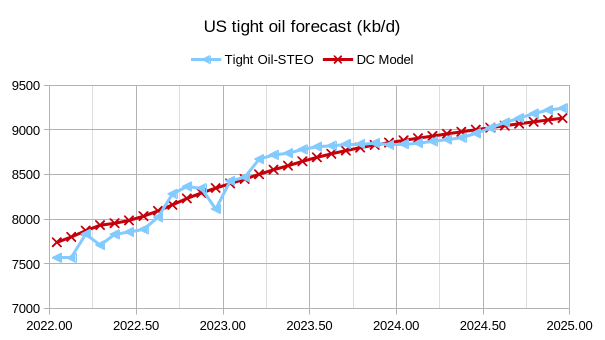
The Tight Oil-STEO estimate shown above subtracts 1788 kb/d from the L48 minus GOM estimate from the most recent STEO, my tight oil model is shown for comparison. The STEO expects flat tight oil output from Sept 2023 to March 2024, with a fairly rapid increase after April 2024 until December 2024, assuming that conventional onshore L48 output remains relatively stable.
The only change in this chart from last month is updated EIA data estimates from the latest official tight oil estimate, the models are unchanged.
161 responses to “STEO and Tight Oil Update, August 2023”
Giovanni Staunovo🛢
@staunovo
·
1h
#Russia: At a televised government meeting, Putin asked Novak, his point man on oil, if he had agreed with #OPEC+ partners to reduce the supply of oil.
Novak replied: “We have agreed, but we will announce the main parameters next week, publicly.”
#oott
Quote
great dennis, with respect to oil price direction…we will learn more nest week.
Giovanni Staunovo🛢
@staunovo
·
1h
#Russia’s Novak: main parameters of #OPEC+ deal to be announced next week #oott https://reuters.com/business/energy/russias-novak-we-will-announce-main-parameters-opec-deal-next-week-2023-08-31/
HFI Research
@HFI_Research
In essence, if you follow the old methodology (production + adjustment), then US oil production for June was really 12.644 million b/d, not 12.844 million b/d.
Quote
Wow, fascinating change.
This is the first month where EIA is reporting transfer to crude oil supply. Production was estimated at 12.844 million b/d, adjustment came in at -200k b/d, and transfer to crude oil supply was 634k b/d.
https://twitter.com/HFI_Research
@Texasteatwo: Can you please clarify?
I just saw that weekly estimations were recently raised by 500 kb/d, but no clue on the reason.
https://www.eia.gov/dnav/pet/hist/LeafHandler.ashx?n=PET&s=WCRFPUS2&f=W
Dennis –
Nice work, lots to look at (14 graphs)!
I do have to say that while you always say your future guesses will be 100% wrong, it’s worth noting that at least 4 year old charts you’ve made have been almost spot on (even with Covid wrinkle in the mix).
It appears Permian production has been a hybrid match to your Permian high completion rate and constant completion rate (with the upslope best matching the high completion rate).
Also noteworthy, your $70 (2017) oil price would be equal to $85 today, WTI is trading currently at $82.40 and Brent is $85.16, that’s also spot on.
One disconnect that I see, it appears your model only has Permian increasing by ~0.25 mb/d annually for next 4 years. By my best guess, that’s not nearly enough to offset the 50 mb/d of production that is dropping by 1-2% (or more) annually.
At this point, with essentially no more room to grow in the Permian and with the production issues Russia and Saudi Arabia are facing, doesn’t future world production growth seem like a complete pipe dream?
Great job and always appreciated Dennis!
Kengeo,
Thanks, note that all of those models are wrong and typically the middle model would have been my best guess in 2017 and that scenario, though too high during the pandemic (which I did not foreseee), is currently too low. So I would not spin this as saying I was right, I was wrong as always and my best guess was too conservative which is nearly always true.
US growth will be marginal, but I expect OPEC will eventually increase output, perhaps in early 2024, Canada, Argentina, Brazil, Norway, and Guyana all have room to grow in my view. We will know more once oil prices stabilize above $90/bo in 2023 US$.
Got it, so based on marginal US growth, is it safe to say that prices are too low and will need to rise? I think that the rapid Permian growth from ~2017 thru present put a lid on oil prices, looking at forecasts we can see that phase is nearly done (maybe by end of this year, or middle of next)?
The only (albeit major) caveat here is that world/US economy seems to be faltering in a major way similar to the 2008-09 Financial Crisis, that has significant potential to put downward pressure on prices.
Lots of uncertainty, but safe to say the Permian growth rates of past 6 years are at the end of the road…
Kengeo,
I expect Permian Basin growth will be quite slow from June 2023 to June 2027, roughly 225 kb/d per year on average over that 4 year period. The days of 1350 kb/d annual growth in US tight oil output (roughly the average rate from Jan 2017 to Jan 2020) are over.
Kengeo,
On future World GDP, I think growth will be at least 2% in real terms. I am not convinced that a Worldwide recession is imminent.
Oh its coming real soon and real hard.
Dennis,
All the yield curves have 100 basis points of inversion. Not just one, all. And it has persisted for a year.
One of two things has to happen. Either the long end of yield curve goes above the short end. Which would mean the 10 year at about 6%
Or the T-bills yields fall back below the 10 year. Meaning FED is forced to cut rates.
Which of these two do you think is most likely?
Why would the FED cut rates? When supposedly the only thing in sight is inflation?
If the 10 year goes to 6% are there any deposits left at the regional banks that originate the majority of commercial real estate loans?
If the 10 year goes to 6% what does that mean for the cost of borrowing in the shale oil business?
What does it mean for the interest expense on national debt?
What does it mean for mortgage rates? 9-10% maybe?
Recession is imminent regardless of how the curve un-inverts.
Do you think the FED will be cutting rates if oil is $90 or higher?
Or do you believe that the inversion can go on forever?
September is usually a seasonal bottleneck when it comes to liquidity in markets. Chances of something breaking will be pretty high.
The higher gas prices go the more pressure is turned up on FED to keep hiking rates. This isn’t going to end in a soft landing.
HHH,
Rates were relatively low from 2011 to 2014 (about 2 to 3% for 10 year Treasury bonds), inflation is coming down so there will be no need for the Fed to push rates any higher.
A recession is possible, but it is not likely to be long term if it occurs in my view. If one predicts a recession is around the corner consistently for a long period, eventually that prediction will be correct, if we look at specific predictions of when this will occur and how often they are correct, we realize that it is not a good bet.
I expect short term rates will come down as Fed reduces rates as the economy slows.
Anon,
Care to be specific? Then we can measure how wrong you will be. Soon and hard tell us nothing if we do not know how soon and how hard. That’s a chicken prediction.
You missing the point Dennis. Banks can’t make money on the interest rates spread with an inverted yield curve. For a year.
One way or the other it has to un-invert. Question is how. Either way it goes it’s deflationary. One is immediately deflationary the other is deflationary after a small lag as the implications set in.
I have one foot in real estate and one foot in finance.
We’re seeing a relatively large supply of lower end properties that were essentially being hoarded now hit the market. The people selling them are aggressive – they will email, text and call to try to move them. Even a few months ago these properties rarely hit the market so the change is truly huge. I think a lot of has to do with the lack of available exit financing – meaning financing for the ultimate owner. Banks have severely tightened their effective lending parameters especially for non-agency loans. Warehouse line providers also have tightened parameters – dwell time has been reduced and equity contributions have been increased. They now also check to see if end buyers are credible because they really, really don’t want to get stuck with loans on their lines. Loans that usually would get DSCR loans now often no longer can because the DSCR<1 so those asset holders are turning into forced sellers.
Things in many, but not all markets, are not great.
Rgds
WP
And I agree with HHH that the inversion makes aggregation borderline impossible so liquidity is melting away in front of our eyes. Even “real money” buyers have stepped back to a fair degree, adding to the liquidity drought.
rgds
WP
HHH,
I agree inflation is likely to fall and the treasury yield curve will get back to normal, mostly we will see 3 month treasury bills fall to about 1% or less and 30 year treasury bonds will remain about where they are at 4% or less, 30 year mortgage rates at perhaps 5 to 6%.
The World economy will plug along at 2 to 3% annual rates of real GDP growth most years.
We might see low inflation (less than 1%) with slow growth in the World economy, but deflation will only occur with a severe recession and if it occurs it is likely to be short-lived.
I understand the inverted yield curve is a problem for banks and that the yield curve must get back to normal eventually.
HHH,
https://retirementlifestyleadvocates.com/podcast/episode/2023-08-27-retirement-lifestyle-advocates-radio-w-karl-denninger
you may disagree but enjoy this. It gets good when Karl enters to conversation
“”The housing market is locked up. People who have 3% mortgages cannot move except under extreme duress because a new mortgage is 7%. And the price of the average house has doubled.As a result, the payment’s gone up by 40%. People don’t have that“
Yeah, and banks are laying off thousand’s of employees that aren’t needed. There is a huge amount of the economy connected to real estate market. Both commercial and residential real estate.
Over in China property values in the large cities fell by an average of 9%. That’s not year over year. That’s between June and July.
Number 1 importer of oil is in serious trouble. The rate cuts the Chinese recently did are like pissing in the wind. Just aren’t going to work too well to stimulate demand.
Can China afford higher priced oil? Particularly when the value of their currency is decided in the Eurodollar market.
China may be asking Russia and the Saudi’s to pump more soon to get the price down.
“Can China afford higher priced oil? ”
They seem well aware of the huge financial risk that all importers or heavy oil consumers (all industrialized nations) are going to face in a world of declining oil exports.
That explains much of their energy policy over the last decade- ramping up East China sea domination, domination of the [wind, solar, battery,EV, lithium processing] manufacturing and deployment global wave, big growth of coal combustion capacity, and domestic nuclear power industry.
As well as beefing up relationships with suppliers like Iran and Saudi Arabia.
Their actions show a high degree of worry, and attempted response to the situation (peak oil).
China needs lower oil prices as their economic model is imploding. BRICS are already at odds with the oil producers needing higher prices and the #1 importer needing lower prices.
Higher oil prices will put further stress on the Chinese currency. Which is already doing very poorly.
Inflation is ultimately deflationary. That’s why I won’t change my mind on much lower oil prices coming.
Inflation pops the credit bubble that brought on the inflation in the first place.
HHH,
The US has not seen a significant period of deflation since 1929 to 1933 and no year where there has been any deflation for the year since 1939. This was before a good understanding of macroeconomics which began in 1936 with Keynes seminal work. Doubtful we will see this again for any significant period (more than one year).
https://fred.stlouisfed.org/series/DPCCRG3A086NBEA
Dennis we are caught in a liquidity trap. Every time central banks step in and governments step in and stimulate it’s in response to liquidity disappearing.
There is no exit because as soon as they exit liquidity starts disappearing again. And with a lag we are right back facing major deflation risk.
It’s no surprise we are facing major deflation 2 years after they did the biggest stimulus ever during Covid.
So can central banks and governments continue doing what they do until the end of time or do we going into a recession or depression that we don’t really ever recover from?
Debt levels in China are way worse than they are here in the US.
China is in the middle of their oh shit moment where nothing they do will fix the problems.
The deflationary shockwave coming out of China is going to be in a class of its own. Nothing to compare it to in the past.
All stimulus really is. Is an increase in the debt load that the economy can’t payback.
HHH,
There are very respected economists that see things much differently than you. I doubt we will see a severe recession or depression in the near term, perhaps there will be one in the next 50 years. The 1929 depression was handled very badly, only if economists forget all that has been learned since 1936, or are not listened to, are we likely to see a depression.
That’s my take.
Dennis there are several hundred PHD economists at the FED that don’t see things the same way I do.
They also don’t even understand the Eurodollar market. They use mathematical models that don’t really have anything to do with the real economy to explain the real economy.
Phillips curve being one of those mathematical models that the FED is using to determine whether to raise interest rates or not.
Ask these Eurodollar bankers why they are unwilling to lend into China. It not a political issue. These banks make a lot of money lending into China.
Economists are very smart useless idiots.
There is nothing quantitative about quantitative easing or QE. They have no idea what the exact quantity of “currency units “ are. And why would they?
Dollar liquidity is created outside the US . They have no way of knowing what the dollar liquidity outside the US is.
Treasury bills, Japanese bills and German bills are the bulk of the collateral used to create dollar liquidity outside US. Throw in Italian bills too because there just isn’t enough German bills to satisfy the demand for collateral. These economists have no idea and their mathematical models don’t capture what the dollar liquidity looks like.
HHH,
Perhaps you know more than everyone in the field of economics, we will see.
I remain skeptical.
Permian constant completion scenario from the post below with current EIA data
https://peakoilbarrel.com/permian-basin-scenarios/
Current Permian Model with constant completion rate, URR about 43 Gb, with about 103 thousand total wells completed (last well completed in Feb 2039 for scenario).
US June production rises
US production was up 207 kb/d in June to 12,844 kb/d. Of the 207 kb/d, 147 kb/d came from the GOM.
I am away and cannot post a picture. Dennis/Ron if you can post a picture please do.
Here is the data for the latest EIA Petroleum Supply Monthly
This chart also includes the EIA Short-Term Energy Outlook as well as the EIA Monthly Energy Review. The PSM data is through June. There was a slight revision downward by 25K barrels per day in the May Petroleum Supply Monthly data.
The Petroleum Supply Monthly is the official data for us production. However it can be revised slightly, like tha April and May data was. The All time high for US production was 13,000K barrels per day in November 2019. The June data of 12,844K barrels per day was 156K barrels per day below that number.
Update on hypothetical options trade:
-hypothetical trade is to sell 2 January 2024 $90 Put contracts of USO at $21.75 each (net credit of $4,350), current value is $15.40 ($3,080), profit if trade closed today would be $1,270 (since ~1.5 months ago).
I would likely close this position and look for a new one…
“Quantifying unproven inventory in the Permian
Geologically viable but unproven inventory at forefront as high-quality drilling locations become scarce over the next decade”
https://www.enverus.com/newsroom/quantifying-unproven-inventory-in-the-permian/
Key takeaways from the report:
Geologically viable (GV) inventory is undeveloped resource ascribed to locations that fall outside the economically proven extents across the Permian Basin but are within geologically viable fairways.
This inventory adds 15 years of inventory at current drilling levels.
EIR has increased its long-term Permian Basin oil production forecast to sustain production levels until 2040.
EIR forecasts dry gas production from GV inventory will add an additional ~2.7 Bcf/d in the Permian in 2030.
Take a look:
https://finance.yahoo.com/quote/CL%3DF?p=CL%3DF
https://www.zerohedge.com/markets/oil-closes-second-highest-level-2023-amid-plunging-oil-inventories
My Grand daughter wanted to provide her Shale Oil Production Forecast chart again.
I couldn’t say no…
steve
Reminds me of ExxonMobil over the last three years.
Steve, maybe you should hang around and not just drop her off at school.
Steve did your granddaughter also prepare your nat gas analysis? I am curious do you use your own analysis as a guide for your personal investments? If so, I assume you also do motivational speaking on the side, in the park where your VAN is down by the river.
https://www.youtube.com/watch?v=Xv2VIEY9-A8
Steve,
Really? Permian at 10 Mb/d? My guess is a peak at perhaps 6.2 Mb/d in 2027 for Permian. I use analysis rather than crayons so I may be wrong.
In the News:
New natural gas-fired capacity additions expected to total 8.4 gigawatts in 2023
So far in 2023, 10 natural gas-fired power plants have come online in the United States with a total of 6.6 gigawatts (GW) of electric generating capacity, according to our Monthly Electric Generator Inventory. By the end of 2023, we expect another six natural gas-fired power plants with another 1.8 GW of capacity to come online, bringing total 2023 capacity additions to 8.4 GW. The additions include both combined-cycle gas turbine (CCGT) plants and simple-cycle gas turbine (SCGT) plants concentrated near the Gulf Coast and Appalachia natural gas producing regions, and in Florida. In 2022, a total of 11 natural gas-fired power plants came online, adding 5.5 GW of capacity. Total natural gas-fired capacity additions increased in both 2022 and 2023 after consecutive declines in the prior three years.
In the next two years (2024 and 2025), we expect 20 new natural gas-fired power plants to come online with a total capacity of 7.7 GW.
https://www.eia.gov/naturalgas/weekly/archivenew_ngwu/2023/08_31/
add in the increase of USA LNG export capacity and the picture becomes clear nat gas is the future. I am not posting the numerous article on the failures of very large green energy (wind Projects) by European companies due to material failure as well as large cost increases. (now who predicted that months ago….) why beat a dead horse?
TTT,
We have had several detailed discussions on this board over the years regarding the extraordinary efficiencies of Combined Cycle Gas Plants.
They can ramp from cold start to full output (we are talking ~500 to ~1,000 Megawatts) in just a few minutes. This makes them ideal for supplying the high demand ‘rush hours’ of 6 AM/10 AM and the 4 PM/8 PM slots, rain or shine, 365 days of the year.
Even using Lazards somewhat skewed LCOE parameters (just check their appendix), CCGTs are far and away the most logical way to produce electricity as long as abundant, economic, reliable fuel supply is available.
Unfortunately, rational discourse on this subject is difficult as cult like mindsets accept NO deviation from the Party line.
Efficient and logical. Thank goodness humans don’t ascribe to those values. Did you know some people look at this map and see nothing?
https://viirs.skytruth.org/apps/heatmap/flaringmap.html#lat=38.64058&lon=-102.43721&zoom=4&offset=15
It’s as if there’s no atmosphere at all. Fortunately, as you suggest, humans are the great rationalizers, and can believe just about anything.
Coffee it appears the direction will be red states, despite the enormous pressures are making the correct decision to deliver reliable energy to their populations. Blue states won’t learn until it breaks them. Same with countries, outside of Europe no one is going to destroy their economy by listening to our “climate envoy”. Same story as the collapse of the Soviet Union, they do not have the capacity to admit failure so they double down again and again until collapse. You give me ten liberals who agree on a solution to any problem, crime, education, poverty, racism etc, i will bet against them 100% of the time. Solving problems is not what they do, making the problem worse and then profiting from it is their model, while at the same time controlling their supporters by keeping them scared.
Good news is even after decades of spewing bullish!t regarding climate doom only the weakest minds pays attention to it. Therein lies the hope. I will be shocked if, after this summer with day after day of barely getting by without rolling blackouts, Texas does not begin to ramp up nat gas plants. They will of course will let the existing wind farms continue to operate but new ones will almost certainly go the way of the horse and buggy.
I suppose you could have made your above comment more offensive, Mr. Coyne, but I believe you would have required professional help to do so.
If I have come across a person with more hyper-inflated opinions of his cerebral fortune, sir, I have forgotten the encounter.
Thanks to all the folks from around the world who have posted remarks here that have enlightened me.
Texas tea,
I think it is a mistake ignore the potential impact of climate change. Natural gas will be the most expensive option, choose it at your peril. From 2005 to 2021 US net summer capacity at natural gas power plants in the US increased at about 7 GW per year, about 1.4% of the 2021 rate of about 492 GW for natural gas power plant summer capacity in the US.
As more natural gas is exported it may become quite expensive to provide electricity with natural gas as the cost of natural gas starts to rise.
Dennis, even if I agreed, which I do not, regarding the climate doomerism, I would want a solution that works, not one that does not. NAT gas replaces coal, nuclear can replace nat gas. If you want a fully electrical society without mining one half of the earth land surface and covering the 1/2 with Chinese solar panels that is the only known possible solution, the rest is just make believe.
Now for a government who has not once in my adult life, SOLVED A SINGLE identifiable problem, what in the hell makes you think they can control the weather. Now I ask you what percentage of people who believe in climate doomerism can also correctly state how many sexes mammals have including humans, I bet it minority.
If the doomerist were right on the data they would not need to lie, they would not need to falsify the data and they would not need to propagandize the issue.
Texastea,
The data is quite clear, and anyone with a decent level of high school science knowledge can see this. The earth is not flat and smoking cigarettes is not good for your health, the last time atmospheric carbon dioxide levels were near today’s level was about 4 million years ago and average global temperatures were about 3 C warmer than today during that period.
Solar and wind are likely to be a cheaper and safer alternative to nuclear power, but if you want nuclear reactors in your neighborhood, that’s fine with me.
GIGO
Excellent response Dennis. I started to reply to Tea yesterday and didn’t because I wouldn’t have been so diplomatic. It’s not like Tea is ignorant, but is to far down the right wing rabbit hole like ten’s of millions of Americans today. Which puts everyone’s future is in jeopardy.
@D COYNE. Concerning, the last reactor to be installed in Russia, the Brest OD-300, Russian scientists and engineers explained to AIEA that it would be safe (= no evacuation of nearby population) even in the worst case (no SCRAM and loss of cooling with the loss of flow of coolant in the reactor vessel) : the reactor would stabilize without further damages than the failure of some fuel claddings (but not their destruction) due to the thermal inertia of melted lead, the configuration of the reactor easing the spontaneous convection of the lead and the passive heat decay evacuation system. The pronostic would be even better with metallic fuel (Russian will use nitrides) and even with the fuel dissolved under the form of salt in a mixture of salts. So, no, I would not be afraid to live near such a power plant.
Jean-Francois Fleury,
Fine with me as long as you live in France, I am a little less confident of Russian Nuclear engineers than you.
There is still the problem of high cost for nuclear power and lack of waste disposal and potential nuclear weapons proliferation.
The disconnection between the two statements by TT2 is telling
“nuclear can replace nat gas. “
and
“Now for a government who has not once in my adult life, SOLVED A SINGLE identifiable problem”
Governments are the only entity that can fund and maintain the complete lifecycle of a nuclear power plant. They’ve done it in the past obviously.
Better start voting Dem or progressive if you want nuclear. The conservative parties will keep hands-off and leave nuclear to the free marketplace. Think that will work?
Paul,
It also strikes me as strange that someone would cite Russian nuclear engineers for safe operation of nuclear plants, there was there minor incident at the Chernobyl plant in Ukraine which was run by Russian nuclear engineers from the Soviet Union.
I am not up on the lastest on the safety of the latest generation of nuclear power plants, but it is an expensive option. I would rather see these plants perfected in Russia or France before I would want one in my backyard.
let me guess, drill baby drill and burn through our fossil fuels even faster so you can make a few more dollars like the conservatard you are, fuck future generations right? You’ll be rich and dead, what do you care. you’re an insufferable douche and I don’t know how anyone here can stand it.
perhaps layman you missed the nat gas to nuclear thesis I been promoting, sounds like you are having a bad day maybe tomorrow will be better.
It a nice aspiration for you to have a ‘nuclear energy thesis’.
But that doesn’t make it real, viable, timely or affordable.
If the US was to get back in the nuclear energy ball game with significant
new generation to help replace its aging fleet, let alone grow the capacity, then it has some very big hurdles to overcome first.
We will know there is serious intent and realism on nuclear when
-new stations are planned, applied for, and funded. So far nothing much.
-a 70-year overdue Federal High Level Nuclear Waste Depository gets built. Currently all of the military and commercial waste is piling up in temporary holding ponds or similar stopgap mechanisms.
-a standardized reactor design gets approved and adopted, with uniform components and engineering. This has been a stated goal since the 1970’s, but nothing has risen to the surface.
More of the same weak Tea.
TT,
You’re suffering from the REAL form of TDS…… trump derangement syndrome, lol.
You’ve swallowed the right wing propaganda hook, line and sinker.
The wind and solar industries will to grow by leaps and bounds even in Texas, a state governed by a hard core trump type Republican Party……… because there’s a TON of money to be made selling wind and solar power which run FUEL FREE, ya know. Or maybe ya don’t.
You’re apparently one with my countless poorly educated neighbors so beloved by your orange orangutan cult leader trump.
Most states have lots of them [Combined Cycle Gas Plants], and that is the biggest reason that coal generation has declined in the last 20 years, with wind and solar being a strong secondary reason.
In fact in some states like Iowa its wind that is the primary reason, now providing over 60% of the state annual electricity consumption.
Lucky country to have a mix of complimentary options.
https://www.eia.gov/todayinenergy/detail.php?id=34172
For a great book review on the subject, with particular attention to Qatar, see A13, today’s WSJ, righthand side of page.
Bloomberg agrees with Dennis about a demand peak around 2027. US and Europe are already past peak gasoline demand and China will be so next year.
https://oilprice.com/Energy/Crude-Oil/Bloomberg-Predicts-Peak-Oil-Demand-In-2027.html
Stephen Hren,
Note that I expect peak supply in 2027 rather than peak demand. Note that demand will be forced to comply with the supply peak by the market price of oil rising to perhaps $150/bo in 2023 US$ or higher, this is how we will know it is peak supply. I expect we might reach peak demand by about 2033 and the evidence will be falling World oil prices, with prices falling to under $50/bo in 2023 US$ by about 2034 (this would be a 3 month average Brent oil price.)
As always, my prediction is 100% certain to be incorrect.
That scenario of supply..price..demand is well spelled out, and with few words. Well done.
So, you foresee high prices leading to both demand destruction and increased rate of substitution
(substitution with electric vehicles)?
Thanks Hickory.
Yes that’s my guess.
Dennis, thanks for sticking your neck out. Has your time frame for peak oil come forward a bit over the last few years? I seem to remember you as a 2030’s kinda guy for a while. and you were often bridged for being a bit of an optimist. … perhaps I’m mistaken. Personally, I see being 20 years off as a 1 generation rounding error. Not a big deal for families with a 200 year plan.
When Mike Tyson was asked by a reporter whether he was worried about Evander Holyfield and his fight plan he answered; “Everyone has a plan until they get punched in the mouth.” What Tyson said is similar to the old saying “no plan survives first contact with the enemy”. But does this mean that there is no need to plan? Absolutely not.
https://www.commit.works/everyone-has-a-plan-until-they-get-punched-in-the-mouth/#:~:text=When Mike Tyson was asked,first contact with the enemy”.
Survivalist,
It has moved forward a bit from 2028 to 2027, 2030 was always my optimistic scenario, I have become less optimistic about tight oil with URR being reduced from about 90 Gb to 73 Gb over the past few years. Generally my scenarios are pretty conservative.
See
https://peakoilbarrel.com/permian-basin-scenarios/
Also consider the following comment from that post
https://peakoilbarrel.com/permian-basin-scenarios/#comment-686480
Mr Shellman suggested that my assumption that average new well EUR would be constant from 2017 to 2022 was not a good assumption. He was correct. Note that the implication was that EUR would decrease.
Here is what actually happened for Permian basin average new tight oil well EUR in barrels of C plus C only (natural gas and NGL is excluded from these estimates).
In the 2019 post, EUR was estimated at 403 kbo for 2017 to 2022 wells:
Current estimate:
2017- 379 kbo
2018- 404 kbo
2019- 440 kbo
2020-445 kbo
2021-472 kbo
Note that much of the increase was due to increased average lateral length.
When we normalize EUR to the lateral length of the average 2017 well (7944 feet) we get:
2017- 379 kbo
2018- 377 kbo
2019- 379 kbo
2020-365 kbo
2021- 374 kbo
So Mike was correct, normalized EUR fell by 5 kbo over 4 years, about 1.25 kbo per year or roughly 0.33% per year.
Cheers Dennis.
Hick, I feel that the prudent opponent, after hearing Tyson’s point, would perhaps plan to get punched in the mouth a few times. Contingency planning is key. Perhaps develop the capacity to absorb attacks, if necessary, and have counter strike options. To paraphrase Paton; a lot of folks get hung up on the tactical and strategic map exercises of security planning, ignoring entirely aspects of hunger, emotion, personality, fatigue, leadership, and many other imponderable yet vital factors. On that note, I feel a lot of preppers score low on agreeableness and are just preparing for their favorite paranoid fantasy aka Larping. As far as prepping goes, Mennonites are better examples to follow than the militia clowns.
Hi Dennis, could go either way. Regardless I agree with your assessment. High prices the second half of this decade with falling supply will mean peak supply. Lower prices with falling supply will mean peak demand. Let’s say $80-100 means essentially simultaneous peak demand and supply. And also possible is continued growth in supply, although I would peg this as the least likely to occur.
Stephen,
Agreed. My scenario is likely to be incorrect, oil prices will tell the tale.
Supply is the key, it’s supported by prices high enough to keep drillers and their ecosystem in business.
Demand is fake, it’s a theory of price sensitivity…the thing is that oil is inelastic and doesn’t give a crap about prices, people pull up to the pump and pump regardless of price or they don’t go to work, don’t eat, and become homeless and die.
The world is either awash in dirt cheap oil and everyone is happy, or it’s not.
I don’t buy any of this demand garbage, seems like a smoke and mirrors job to get everyone to forget that worldwide 1P oil reserves are less than 10 year of current production level…
The cheap oil ran out 20 years ago, it’s an entirely new game.
I’m obviously not an economist…
And yet gasoline and diesel demand in us and Europe has already peaked.
40% of us grain crop goes to ethanol. All these calories will become available as the switch to EVs accelerates. Don’t forget, every time you fill your tank you take a meal out of a persons mouth. Thankfully that will be a thing of the past in the next 10-15 years.
Take a look at the mpg equivalent ratings for EVs. They are all 110+. Four times as efficient. 1/4 the amount of energy for same miles driven.
If you take the corn acreage that goes to ethanol, and divide it by 300 you will be calculating the land area that could provide the same mileage traveled by photovoltaic powering EVs, at a lower cost.
And yet people don’t seem bothered by the pitiful net energy provided by the ethanol industry.
And a fair amount of this land can be rooftops or.other impermeable surfaces – Walmarts, factories, covers for parking lots, etc. Ironically in my experience houses generally make a bad choice for solar. Too many penetrations, weird angles, trees, wrong orientation, etc
When you fill your tank you take a meal from someone. My God
The production of ethanol JUST converts the starch in the corn to alcohol. What remains is a high protein corn product called distillers dry or wet grain. This is then sold world wide as a high quality animal feed. S+H, please look this up and then you will learn the truth and have one less false belief to keep you up at night.
Ervin…of course the distillers grain is part of the equation, being a hugely important component of the harvest. No doubt on that.
However, the 30 some million acres could be used much more usefully than being primarily focused toward ethanol production.
And yes Stephen..all of that replacement solar could be on surfaces other than prime farmland.
Over the next 10-20 years farmers of the country are going to realize how much of an economic benefit they will get having a small part of their acreage under PV is going to be. Mixed grazing under or adjacent to PV is going to be commonplace.
Ervin, I was being generous when I said that for simplicity. Reality is much worse. Generally there is 1-3 gallons of ethanol in a typical tank of gasoline. Each gallon contains 84,000 calories. A typical meal is 600-1,000 calories. So each tankful takes up to 250,000 or 300 meals away from humans (OR animals). That component is burned and gone forever.
Kengeo,
Demand is affected by price especially longer term as people buy more efficient cars, move closer to work, and generally drive less as prices rise. Supply adjusts to demand, and demand also adjusts to supply as the two remain roughly equal over the long term. Demand is not fake, it is simply the consumption of oil.
What about Jevons Paradox? Doesn’t apply? Why not?
Required,
Jevons paradox has to do with demand increasing as prices fall, in this case we are talking about higher prices which tend to reduce demand, Jevons Paraox is not applicable in this case.
Updated tight oil estimate for L48 minus GOM estimate using new PSM data from Aug 31. For July to September 2023, the STEO estimate is used. See text of post for an explantion of L48 minus GOM tight oil estimate (basically 1788 kb/d of conventional output is subtracted from L48 minus GOM output to arrive at tight oil estimate). The 1788 kb/d is the average difference between L48 minus GOM output and tight oil output from March 2021 to September 2022).
For anyone interested in chart technique (and other modern voodoos):
Brent has crossed the 87,70$ today – a mark which caused several turnarounds this year. The way up to 100 is now free, from chart side. The breech is not confirmed yet, with a false break it can go down to 70 again (not very likely with the tight supply at the moment).
So it is possible to see some big movements the next weeks – trading computers and hedge funds like this stuff. My guess: there will be lot’s of trade in paper oil next week.
Eulenspiegel, to build upon your observation, $85 WTI is/was a big barrier and has been going back to 2007. We got a weekly close above that, now we wait for next week and the OPEC announcement. So what i think is this, at a minimun OPEC will defend that floor, inflation adjusted, and without a new source like US shale they will be able to. I ask a few weeks back, what if the group wants price to balance the market rather than volume. With the news of the potential ARAMCO offering that is now looking more likely.
IN the next two weeks if WTI holds these levels or goes higher, you will see a cross on the Monthly MACD. The last three times this has happened 10/09, 4/16, 11/20, oil went on a long multi month or even multi year bull market. I think we are on the cusp of that type of market.
Further as I mention before, i believe both the Russians and the Saudis want a new US president. The best way to do that is to squeeze us with $100 oil and $5 gasoline. Its win win for them. While the world leaders play chess our leader worries about what ice cream he wants today. I bet they are setting up an new SPR release as I write this, dig the hole deeper fools.
https://www.zerohedge.com/commodities/oil-surges-2023-high-saudi-exports-plunge-lowest-two-years-ahead-aramco-50bn-share
peace out boys it been a great week…Weak tea signing off🖖
Compare Contrast 2008 vs 2023
Big picture – 2008 was the beginning/wake up call to the peak oil predicament. The oil production plateau lasted ~10–15 years (~77 mb/d excluding US) and now production is descending into unknown territory.
Commonalities:
Excluding US, worldwide oil production was 76 mb/d in 2008 and 2022, peak was almost 80 mb/d in 2016.
Seems an energy crisis is brewing, both periods have that in common
Financial crisis was a lending crisis, current situation may be similar in that high rates make it difficult/impossible to borrow.
Similar inflation rates due to Fed tightening in 2022-23
Joe Biden in Whitehouse
Gas $4-5 per gallon
In US poverty levels remain same, about 40 million with 10-15 million children
Differences:
Political partisanship, Obama brought out a Republican wave that put an authoritarian Trump into power.
The two parties moved to extremes on both sides, “woke” and an evolution of the 2009 “tea party” movement.
Ukraine war and other major tensions between biggest countries
Covid had a major impact that is still causing supply chain issues all over the world
Interest rates are significantly higher, the effect is not likely to be positive
Renewable energy has grown tremendously since 2008
Today there are 20 million EVs worldwide saving ~2 MB/D in oil.
This amount is likely to double every 1-2 years thru ~2030.
2008 was largest economic downturn since the Great Depression
Major component was bad banking practices, which we have less of today
World has 1 billion more people today (16% increase), with more than half of those in extreme poverty
Extreme poverty was 1.3 B in 2008 vs 1.9 B today, ~50% increase or ~3% annual increase
What we might expect:
Gas prices to go to ~$7
Similar scale economic crisis?
An epic post – folks write long books that cover as much. One quibble though – you’ve succumbed to the false narrative and false equivalency between fascists and racists who want to return to the good old days, and those who are attuned to a sense of justice. Health care and education are not extreme, except in the corporate and monopolized press. Tearing down American democracy is extreme. To equate the two is false, harmful, and serves the means of those pushing the false equivalency.
I said nothing of facism or racism…the point is divergence from a norm or center position…polarization…
this is not unique to the US, can see it in Brazil, Canada, Germany, and many other countries…one only needs to look at education/academia to see the damage progressive politics has caused, the flipside is anti-science conservative politics and it’s flat earth radicals. Unfortunately, “agreeing to disagree” is a thing of the past. Regardless of your political views, it’s critical to understand the other side what drives their views…it’s all about balance
Kengeo,
Interesting viewpoint. I’d add wealth inequality has increased linearly since 2008 and exponentially after covid due to central bank loose monetary policies and government fiscal policies not going where it should have (colour me surprised). The problem of inflation today is largely due to these helicopter money policies and supply chains.
The world will never be the same after covid, just like it was never the same after september 11.
We are heading into unknown territory. Environmental destruction, climate change, energy crisises and war are just a few possibilities as we steady head into a more and more deglobalised two tier world.
St. Vitus dances, incantation rituals, as well as derilatory, media fantasies of Tooth Fairy, Santa Claus, and Easter Bunny fan clubs in the face of unsolvable problems at the end of a once-in-a-lifetime, reckless, planet-consuming feeding frenzy fueled by dwindling fossil fuels
Kengeo
Where on earth do you get electric vehicles saving 2 million barrels per day
Charles
Acording BloombergNEF: https://about.bnef.com/blog/electric-cars-have-dented-fuel-demand-by-2040-theyll-slash-it/ Let’s not forget that this number also includes electric scooters and buses.
Think maths were off a bit, maybe 1 mb/d? Just a WAG really, not that much really, but may grow to a significant amount in 2-3 years. I think all can agree that the existing vehicle fleet needs better economy via smaller vehicles, hybrid engines, etc…but we need $10 per gallon to get that to happen…
Stephen,
Agreed. My scenario is likely to be incorrect, oil prices will tell the tale.
Hint:
They might have 5 years ago.
Fracs Down Two
Fracs were down by 2 to 244 this week from 246 last week.
Last week Fracs were down by 10 to 246 from 256 the previous week.
09/01/2023 -2. 244/ 246
08/25/2023. -10 246/256
08/18/2023. -6 256 / 262
08/11/2023. +5 262 / 257
08/04/2023 -11. 257 / 268
No charts since I am not home.
Rig count- Horizontal Oil Rigs
Horizontal oil rig count for US unchanged at 463, peak was 572 rigs in November 2022, Permian horizontal oil rigs down 2 rigs to 305, peak was 337 in April 2023. New Mexico Permian horizontal oil rigs unchanged at 101 rigs peak was 105 rigs in August 2023, TX Permian horizontal oil rigs down 2 to 204 rigs peak at 244 rigs in April 2023.
Note that the peaks are just for the recent period covered by the chart from Jan 2021 to September 2023.
Ovi has called out the lack of a plugin hybrid vehicle with decent range as a missing segment of the vehicle market option mix, and I wholeheartedly agree. So far the best option is the Toyota RAV4 prime, which is a small suv with 42 miles of electric range before the gas engine is deployed. Most other options currently on the market have much less range.
The engineering challenge as I understand it is the difficulty of balancing the performance gains from electric motoring with the extra vehicle weight added, at reasonable costs, all while keeping the same level of ICE capability in place.
Well, VW may be on the verge of introducing a big step up in this vehicle segment with a PHEV Passat station wagon coming out in Europe this winter with an all electric range of 100km [62miles]. For most people this will allow over 80% or 90% of their travel to be electric based, while still having the ICE capability for longer trips. The result being much fewer trips to the petrol station each year….Hallelujah for that.
https://www.volkswagen-newsroom.com/en/the-all-new-passat-variant-17559
If more makers/models can achieve this engineering balance effectively then petrol demand destruction will be hastened.
I wonder how much this vehicle will cost. The Prius Prime has a similar range for EV driving as the RAV4 prime, about 42 miles. Cost is about 33k, roughly 10k less than the RAV4 prime., the Tesla Model 3 RWD with 272 mile range us about 34.5K after 7500 Fed rebate, in Massacheusetts buyers may be eligible for another 3500 in rebates, bring cost for Model 3 to 31K, less than the Prius Prime.
The cost difference of PHEV Prius vs RAV4 is largely due to being vehicles of different capability regarding cargo capacity, ground clearance, ability to handle rougher roads.
If the PHEV passat comes out as indicated, it will be in a different capability category as well.
I’ve not seen any news about when it might be available in the N. America
Also, Toyota has teased about dramatic improvements in solid state vehicle batteries, but I remain skeptical until we see it.
How much oil do cars consume
The amount of oil used by cars is far less than most people think
https://www.energypolicy.columbia.edu/sites/default/files/pictures/CGEP_Electric%20Vehicles%20and%20Their%20Impact%20on%20Oil%20Demand-Why%20Forecasts%20Differ.pdf
It is around 27%.
There are 1.2 billion cars in the world and they use between 25 and 30 million barrels of oil per day.
10 million electric vehicles would reduce oil consumption by around 250,000 barrels per day.
However if this reduced the demand for petrol it would simply make the reconfiguring of refineries worth while and aviation and cruises will take up any slack.
The fallacy in this argument is that all cars consume an equal share of gas. Not true. Most miles are driven by cars 6 years or younger. Since EVs are 4-5 times as efficient as gas cars, the more miles people drive the more they will benefit from switching. I work in real estate/construction and the realtors/inspectors/electricians etc who drive the most miles (30-50K/yr) are switching as fast as they can justify it to EVs. So the more likely numbers will be at 5% EV penetration a 15-25% reduction in gas consumed.
Stephen
Provide studies that support your statement.
The fact remains that cars only consume around a quater of all oil products. Refineries are starting to reconfigure to produce less petrol and focusing on other products.
I can assure you the extra 520 million people on the planet by the end of this decade will want their share.
Their share of computers, cars with rubber tyres. Their share of flights around the world. Their share of goods transported in ships.
There simply will not be enough and people and countries will fight to get what they need
Charles-
“The Energy Information Administration has released data showing that the transportation of people and goods accounts for about 25 percent of all energy consumption”
note- this is ‘energy’, not oil.
Rather- they say “The transport sector, responsible for around 60% of total oil demand”
with on road passenger transport accounting for about 1/2 of that.
One half of total oil demand (light transport) is a big target for saving… of money, of fuel, of combustion. Oil not burnt for simply pushing people a round can be used for other more critical or hard-to-substitute purposes.
On a more personal level, having a PHEV or EV, and your own personal solar power producing facility , allows a person and family and business to have a mechanism to weather the first phase of oil depletion without the risk of huge price inflation.
The escalation of ICE vehicle travel cost/mile could be crippling for those in most countries.
https://www.oilystuffblog.com/forumstuff/forum-stuff/read-this-please
Another must read Mike Shellman piece.
Another great piece by Mr. Shellman.
I agree with Mike that some are overestimating Permian potential. I also agree it is a bad idea for the US to be exporting its energy resources. Here is my long term estimate for Permian output (this assumes US policy on exporting crude does not change). Permian output in 2050 is 36 kb/d in this scenario.
en·ti·tle·ment: the belief that one is inherently deserving of privileges or special treatment.
1. a right to benefits specified especially by law or contract. 2. : belief that one is deserving of or entitled to certain privileges.
What does the Bible say about entitlement?
The scriptures warn us repeatedly that the spirit of entitlement leads us to anger and to fight against God and His eternal plan.
What is the role of entitlement?
Entitlement refers to an outcome that individuals believe they deserve to receive from their relationships (Attridge and Berscheid, 1994). This outcome is important because it allows the distribution of resources within romantic relationships (Lerner and Mikula, 1994).
How does entitlement affect people?
People who feel entitled to admiration and respect from others do not make good companions. This research shows one reason why. Entitled people adopt self-image goals (goals that aim to construct and defend a positive self-image), which then lead to interpersonal conflict and hostility.
Why is entitlement a problem?
Entitled people often interview well and can land leadership roles because of their confidence. However, they often lack team spirit and avoid problem-solving in the workplace. Most of the decisions an entitled person makes are self-serving. This can quickly become apparent to their co-workers.
Mike says- “to drain Texas dry of all Her hydrocarbon resources for exports is NOT lowering the price of oil”
Dennis, do you really believe Mike’s comment is true in the short run over the next 10 to 20 years ? In late 2014 the Permian turned the world from under supplied to over supplied and cut the price of crude in half.
I’m all in on preserving resources for the future. But, to expect prices to remain the same and cut the production of the Permian. Can only mean entitlement of burning other nations resources first. Cutting the Permian production should be paired with living within ones own means. Otherwise, it’s just business as usual and kicking the can down the road a few years. I don’t think the entitled rich in America are ready for that. Even the poor or average American are rich on the world stage.
The real answer to finite resources and climate change is transform to renewable energy and population reduction, no matter how painful withdrawal from the addiction is . Otherwise your just rearranging the chairs on the Titanic for the entitled.
Huntingtonbeach,
I don’t think Permian output will make a big difference in the World price of oil going forward, in the past higher Permian output was matched with cuts by OPEC and the long term price of oil may not have been affected much.
I believe Mike’s point is that there are many places in the World with more oil resources than the US and they are willing to sell us oil. Buy that oil and only produce as much tight oil as can be refined in the US, Canada, and Mexico and conserve the rest for future use. This can all be done while transitioning to EVs, wind, solar, hydro, geothermal, and nuclear power with some natural gas used while the transition proceeds. The transition will be a 20 to 30 year process (possibly much longer), conservation of resources makes sense to a long term thinker.
Thank you, DC. I am that, a long term thinker.
Eighty two% of all US exports are light, tight oil from the Permian Basin, where liquids well productivity is declining, usable groundwater required for frac’ing is depleting, gassy oil wells are turning into oily gas wells, a lot of that associated gas is flared, economics are bad, horrendous amounts of borrowed capital has been lost and unless more CAPEX magically appears, rig counts will continue to decline,
In the past 30 months the price of oil is up $35 a barrel and gasoline in the US now averages $4 a gallon. I thought exports were suppose to help the US? Tight oil’s use as a foreign policy tool has failed miserably; Russian and Middle Eastern oil has strengthened China and US relationships with that country, and the Eurasian landmass is in the toilet.
My stance on US oil exports is quite simple; when you are facing starvation and still have food in your cache, for your family, why feed the entire neighborhood?
American oil and gas buys America time. We are decades away from an affordable transition to renewals. We should embrace Canadian and Venezuelan oil imports for their quality, it’s not too late to build the right refineries for the right oil and we should quit lying to each other about how much affordable oil there is left in the world.
Most arguments in favor of draining America first, for the sake of exports, revolve around personal financial gain, from CEO’s all the way down to data-sell companies. Most “what-ifs” are going to occur anyway, much sooner than people think, and no export advocate I have heard can think past next week, much less 5 years out. They all believe the Permian Basin will produce the same about of oil for the next 30 years, we can only absorb 4.5 MM BOPD of the stuff, why not dump the rest? We’ll never need it.
But we WILL need it, every barrel of it.
Berman, by the way, says 4 MM BOPD of super light oil off the world market might raise the price of gasoline in the US 10 cents.
Otherwise, all these explanations and arguments for MY stance on exports only makes sense to you. Not to me. I liked the lecture on entitlement, especially from California, globalization is bunk (ask them BRIC boys) and the price of oil better get to $130 quick or everybody in the world is going to be riding squeaky bicycles. And being complacent about policies because politicians rule the country is EXACTLY what is wrong with America. People will believe what they are told to believe. Not me.
I am comfortable with my position on exports, and why, even though I am a Texan, have a half century IN the oil and natural gas business and am mostly chided for it. Country first.
Those still standing, with the most natural resources, wins.
The future is NOT now, it’s in the future.
Thanks Mike,
Stated much more eloquently than I could have done. I agree with your position on exports. I am not influential so it is not likely politicians will consider this position as they only think as far as the next election, unfortunately.
Mike,
If you are ever interested in explaining your position in full, you can do a post here at peak oil barrel, sometimes the posts get picked up by more well known places on the internet, so that your position might get more visibility on the web. You have my email address but I no longer have yours. Get in touch if interested.
Thank you, Dennis, but I have written extensively about the subject elsewhere, provided reasonable alternatives to draining America dry, etc. etc; as you can see below, it would be fruitless to try and explain further. People get deeply entrenched in their idealism and its hard to get them off high center.
Its an American thing, a common sense thing and given all the oil you and others project recoverable from the Permian it is certainly NOT a close the gate after the horse is gone thing. Good grief. My only “intentions” are enlightenment. And, a friendly reminder, I am not posting links to OSB on POB, others are.
In the US we like the status quo; we swim with the fishes. it’s never a problem until its a disaster. So be it. Thanks again.
Mike,
Just trying to help get your message out, you state your case much better than I can and obviously your knowledge is far more extensive than mine.
I certainly appreciate all you have taught us, please keep it up.
Thanks.
I don’t want to cause another big stir here as I know how passionate y’all are about this subject, but I continue to believe that the notion that Permian shale should have been left in the ground and not exported or consumed is a dead issue. It would have never been practical to accomplish and would have had an immense negative financial impact to the countless parties that benefit from the cash flow, tax revenue, related economic activity, etc. etc…
These are mineral rights owned by individuals, gov agencies/entities and private entities that have a right to develop them at their free will within reasonable guidelines set by regulators. Denying them this right would have been impossible in our free country. Further, the hundreds of $billions would not have flowed out into the economy, governments, institutions, and private hands to do the good that it has and continues to do.
It’s an interesting concept to discuss, but not a practical one in reality.
Gungagalonga,
In this free nation a crude oil export ban was in place for 40 years from 1975 to 2015.
Nobody is saying the oil should not be developed, if a company wants to produce and sell this oil in the US, Canada, or Mexico, they would be free to do so.
There is no reason the export ban should ever have been lifted in 2015 and the policy could be reversed.
Also the Texas RRC could enforce spacing rules and fufill its mission to not waste resources by not allowing any further flaring of the natural gas resource in Texas.
You should know this history, it is not a secret.
Dennis, Mike S. has written many times that the Permian Shale was the last great American Resource and should have been left in the ground for future generations. That Liars have depleted it. Which I disagree with.
I have no problem with export or no export… as long as American crude can be produced in a free market.
Whether the Permian oil is exported or not, it is still removed from Permian Rock first at the same rate, so why fight it. Either way, export or no export, Permian rock is produced the same.
The TRRC enforces its rules but is not perfect, Tell me exactly where the TRRC did not enforce it’s spacing rules.
If the US chose to reinstate the crude oil export ban, we might see something like the scenario below where about 15 Gb of Permian basin oil is saved for future use by US citizens.
I suspect most people will be very surprised to visualize this difference as depicted in the two graphs.
Since an export ban would be a very big political act, I suspect it would take a big event to make it happen such as a massive terrorist attack or initiation of a war directly involving the US, or the election of a staunch authoritarian nationalist with majority support among the nation.
Alternatively, it will take a gradual large shift in national opinion. Its hard to imagine two distinct points of view such as Texas Tea and Mike Shellman agreeing on this topic, particularly given the paramount position that vested interest plays.
Either way, the start time for such a change in policy will be years in the future. Any projection of the scenario should probably have a start date somewhere in the 2025-2032 timeframe.
Hickory,
Note that a crude export ban was in place for 40 years from 1975 to 2015 under both liberal and conservative administrations. I agree this change seems unlikely as politicians do not hink beyond the next election, long term thinking is not part of their calculus.
A scenario that assumes a crude export ban was reinstated in Dec 2028 might look something like this with only 4 Gb of Permian tight oil saved for the future (assuming 43 Gb is the likely URR with no change in policy). My guess is that the 43 Gb scenario is most likely as I agree a change in policy seems unlikely.
Dennis
I am not totally clear on what Mike is intending with his no export ban. Does he want more oil left in the ground for when the World hits the post pandemic peak, which could be either higher or lower than November 2018. I see the following scenarios.
– Oil produced in the US must be processed in the US. The short fall is made up by importing oil from Canada and other foreign countries. This makes no sense since what is happening now is the US producers are getting the best market price they can get from their buyers and the US is importing a quality of oil better suited to their refiners. If an LTO producer could get a better price locally, he would sell it internally.
– Regulate the amount of oil produced in the US to some nominal level, say 8,000 kb/d. Some pretty serious economic repercussions from such a decision. Would also drive world oil prices higher.
Ovi,
Mr Shellman can answer better than me.
My understanding of his position on crude oil exports from the US is that he is ok with exports to Canada and Mexico, but would like to see exports banned to other nations.
US policy was to not allow any crude oil to be exported from 1975 to 2015. The US exports about 4000 kb/d of crude oil with about 300 kb/d being exported to Canada. So if this policy was instituted, either refinery capacity for tight oil in North America would need to be increased or US output would need to be reduced by 3700 kb/d (probably it would be a bit of both).
Mr. Shellman may believe that the World minus the US can increase C plus C output by 3700 kb/d or that prices might need to increase to reduce demand if this is not possible.
He claims that oil prices will not increase (or seems to imply this) in response to such a policy so he may be confident that other nations have the capacity to increase output by roughly 3700 kb/d. It is not clear to me that this is a good assumption, I think OPEC might be able to increase output by about 2700 kb/d and perhaps Russia might be able to increase output by 500 kb/d, it is also possible that if sanctions were removed from Iran and Venezuela that the other 500 kb/d could be made up (I doubt this will happen), also there may be future output increases from Brazil, Canada, Argentina, Norway, and Guyana (this will take several years).
I doubt the 2018 peak In World C plus C output would be surpassed if such a policy were put in place in the near term (before 2025).
Dennis
I agree that it would be best if Mike would clarify his intentions.
Today the politics in the US really complicates the situation. The GOP is promising to unleash US production. In the meantime the Democrats are trying to limit productivity through NG capture and limiting drilling on Federal lands. I guess the oil producers want to collect their cash and don’t want to end up with stranded oil.
With all of the politics involved and the economic implications, I think the free market will rule. I think keeping the oil in the ground policy is the same as that horse has escaped from the barn.
Thank you Dennis. That puts the idea into a more accurate perspective I believe.
Ovi- “Some pretty serious economic repercussions from such a decision [export ban]. Would also drive world oil prices higher.”
Absolutely.
One such repercussion would likely be the escalation of overt resource nationalism on oil and other energy sources from the other big energy exporters. Reverse globalization, and not just with energy but probably with food, important minerals and manufactured goods like motors and semiconductors.
The risk of unintended consequences on are this are huge. I think that Saudi Arabia, Iran and Russia would love to see a US oil export ban.
Hickory,
There was no problem with resource nationalism from 1975 to 2015, I doubt this would be much of a problem except that oil prices might rise, but I expect that higher oil prices will occur in any likely scenario.
It is not clear that such an export ban will cause World oil prices to increase any more than they are already on course for with OPEC cuts.
“There was no problem with resource nationalism from 1975 to 2015,”
Oil was used as a form of economic warfare, and countries did nationalize their oil sector in this timeframe.
But it will be much more likely as we approach and surpass peak oil, with exports being in particular focus.
Hickory,
The oil embargo happened in 73 to 74, the crude oil export ban was a response. Nationalization of oil resources is up to individual nations.
In most cases since 1975 this has not affected oil exports, in fact most of the restriction on World oil exports have resulted from US foreign policy decisions regarding Iran, Venezuela, and Russia or due to civil war in Libya or the Iran Iraq war from 1980 to 1984, also Iranian revolution in 1979 and breakup of Soviet Union in 1991.
In my opinion not much of this has to do with resource nationalism as I understand the term.
As to what happens as we approach the peak in supply depends in part on the level of demand and the response to higher oil prices. We might see the transition to electric transport accelerate and peak demand may quickly follow peak supply and oil prices may drop.
As to what happens as we approach the peak in supply
That happened 5 years ago, here on planet Earth.
Hightrekker,
The same was said in 1985 and even in 1988 it might have been said that the peak was 8 years prior.
Perhaps 2018 will be the final peak in World C plus C output, but my guess is the 2027 or 2028 will be the final peak in World C plus C output.
Time will tell.
Dennis—
You have to deal with reality—
The peak was 5 years ago.
Will there be a future peak?
Possibility, but reality was the peak 5 years ago.
While reality confines ones thoughts, one cannot get away from it.
Come now, try reality for a bit—-
Hightrekker,
The current peak is 2018, the reality is there have been many previous peaks, each surpassed by the next. Based on my analysis, my best guess is that the final peak will be in 2027 or 2028 a just slightly more than 2018 (probably 1 to 2 Mb/d higher).
In any case it does not matter much, I am confident there will be a plateau of about 82 plus or minus 2 Mb/d from about 2015 to 2030, the average World C plus C output over that period for my best guess scenario is 81.6 Mb/d.
Generally my scenarios of the future have tended to be too low in the past.
I recognize the current peak year is 2018, the question is whether that will remain the peak in the future, my opinion is that the odds are perhaps 1 in 10 that 2018 will still be the year of peak C plus C output by 2030.
I recognize the current peak year is 2018, the question is whether that will remain the peak in the future
The question was when world peak was-2018.
We are not talking about the future.
All –
This is an incredibly simple issue.
Since the late 1990s, US has been using ~20 mb/d of oil.
Between 2000 and 2010 average import of crude was 12.5 mb/d.
More recently imports have dropped to ~8 mb/d.
If the permian fizzles out faster than most people think, where will we get 4.5 mb/d of oil from? Mexico? Not likely, they are only producing half of what they were ~15 years ago. They are consuming what the produce, no exports from Mexico to US…
Canada consumes about 2.2 mb/d, yet only produces 5 mb/d, but they already trade with US. Maybe the US can afford to pay more than other countries and will do so.
Every drop of oil we save today can be used tomorrow…
This situation is also happening to other producing countries, they want growth and economic stability, they will certainly be redirecting their oil supplies and reduce exports.
110% of this from Kengeo.
Until 2015 America did not export hardly any crude oil. Oil prices were stable, we had a secure long term source of energy, employment was strong, schools were built, kids were educated, found jobs, we were safe, as in true national security, national debt was manageable, as was personal debt, both of which have now reached Pluto. Cheap and abundant oil and gas gave our nation an industrial edge over the entire world and our country’s economy was mighty.
The issue of whether to export or not only gets complicated when people that benefit from it all financially, or want oil unrealistically and emotionally gone from our lives completely, start lying about it so profusely. And OMG, can they lie. Yeow!!
It is indeed quite simple. US tight oil exports are already failing the test of time. You’ll see.
Oh, and please, don’t worry too much about the 3% of American population that is lucky enough to own minerals under shale oil and gas and feel like its their “right” to drain America first.
Since 2004 I estimate they’ve racked up close to $800 B of free income from tight oil and gas, N. Dakota down to Texas and back to the APP Basin. They’ll be OK, I promise. Nobody, I repeat NOBODY is advocating to leave it in the ground.
It’ll get produced (probably at higher prices!) and when it does and stays in America, it will benefit ALL Americans. Even the renewable advocates. It won’t get stranded, it will just stay in our… family.
How can any good American think that’s bad?
Thanks Mike – agreed, other important point is why should all the O&G folks work themselves “out of a job”. My inclination is that if there’s ~15-20 years of work left, cut production in half so we can make it last 40 years…rough guess is petroleum directly employs around 20-30 million people and indirectly employs at least that many.
That’s likely more than 25% of the entire country that makes a living from Oil and Gas work…we should preserve those jobs for as long as possible…
120% on THAT, Ken.
In correspondence from colleagues in West Texas, a lot of people are sitting at home again. Rigs are going to the barn and they are back out of work. Up and and down, up and down. Careers are more important than jobs that last three years with one year of unemployment. All completely avoidable. I advocate for careers that last 40 years or more, not volatile “jobs.”
Of the 80,000 hands or so in the Permian in upstream D&C work, they are going to be out of work, permanently, very soon. Slow down…move qualified upstream hands downstream into production, into gas reinjection and maximizing recovery rates of oil in place. Stop exports and that will happen. Move hands into R&D, lets learn how to do this stuff better. 10% recovery rates suck. Instead of exporting 82% of Permian tight oil production we should be improving RR’s to 20% and tweaking refineries, moving heavy oil out of Canada, Mexico, Venezuela to make dissel in the US.
America is always in a big damn hurry. This amazing resource is being totally fucked up, sorry…WORSE than Hogans goat.
Mike and Kengeo,
Kengeo suggests other nations might do what Mr. Shellman suggests and restrict their exports of crude oil as well.
This is a problem for the US as we refine about 16 million barrels per day, with about roughly 3 Mb/d of capacity for LTO inputs, we only produce about 5 Mb/d of conventional oil (at most) in recent years so without imports or modifications to refineries to accept higher quantities of LTO we would be short by 8 Mb/d of needed inputs to refineries.
It does not seem likely that many nations will respond by restricting crude oil exports as the US has done in the past (1975-2015) so this is not likely to be an issue.
Sometimes actions have unintended consequences as Hickory has already suggested.
D Coyne : the Russian ministry announced discussions with the partners of the OPEP+ to … reduce further the oil production. Obviously, they are not in position of increasing their production even by 500 kb/d but in position to hide the decline of their production.
Jean.
If the war in Ukraine ends and sanctions are removed, Russia might return to 10 Mbpd output. If not, Iraq and UAE might be able to increase output and Iran if sanctions are ended.
D Coyne : what you are writting is unpossible. In 2020, despite the demands of the Saudis, the Russians initially refused to decrease their production because they knew that closing some of their old oil (and they have a lot of them) wells to decrease the production would mean a permanent cessation of extraction due to damage to the reservoir from interrupting the extraction process. I remember having read during fall 2021 that during spring, decisions would be taken to cease permanently extraction for some oil wells. During the same period, commentators have judged that the Russian oil industry was not running smoothly due to the increase in accidents, an indication of underinvestment in maintenance. The fact that Russia is now in oil production decline is something which has been forecasted since many years by several publications. And to add on this, I suspect that Russian oil industry has been shaky for a long time, with oil revenues not being invested in developing domestic technological skills, the Russians having needed and still needing foreign skills for this and that, due to embezzlement indulged in by the oligarchs, the state beneficiaries of the kleptocratic system and the first of them, Vladimir Putin. In these conditions, I have difficulty believing that Russia will return to its former level of production.
Jean,
I think they may be able to maintain a plateau at about 10 Mb/d for a 5 year period, but it may require help from international service firms. Once the Ukrainian war ends and sanctions on Russia end, they may be able to get back to 10 Mb/d. In any case, if I am wrong there is still potential in OPEC major producers to develop more resources and increase output at high oil price levels.
Time will give us these answers.
Currently there seems to be a positive correlation between oil and the dollar. Higher oil prices go the lower currencies that aren’t the dollar go.
From a Eurodollar point of view it makes sense. As you’ll need more and more collateral to buy oil as prices rise. The fact the collateral has been repriced lower by rising interest rates doesn’t help.
I don’t think this is long term bullish for oil though as countries continue getting steamrolled by the Eurodollar and oil prices. Demand tanks when the bubble pops. Not there yet. But getting much closer.
The center of the global monetary system isn’t the Fed and the rest of the central banks their bank reserves aren’t used in the global monetary system.
Government bills used as collateral by commercial banks are the center of the global monetary system.
So keep that in mind. Central banks are powerless. They don’t even operate in the global monetary system. And have no means of providing dollar liquidity other than selling dollar assets to get dollars.
Or using collateral to borrow dollars to then re-lend those dollars into economy. They don’t have a printing press.
They can print bank reserves sure. But bank reserves aren’t money in the Eurodollar market.
Eurodollar market is roughly 5-6 times as large as the onshore dollar market in the US. So there is way more leveraging of collateral. The value of the dollar isn’t decided by what goes on inside the US. It’s decided by what happens in Eurodollar market.
When dollars aren’t provided. Because of say high oil prices or call it inflation or lack of collateral. Dollar goes up in value.
We are heading straight into a dollar shortage that will be worse than the dollar shortage we experienced in 2008.
If your an oil bull. You want to see currency like the Chinese yuan increase in value. Because it means the dollar is doing what we want and need it to do which is to grease the global economy.
A weak dollar means business is good and we are growing.
Russian ruble is back near 98.00 again. Heading back above 100.00 soon.
And I’d say higher oil prices are hurting Russia via the currency.
And another thing. All those Chinese yuan and India rupees they are receiving for the oil they are selling are losing purchasing power fast as the value of both the yuan and rupee continue to fall against the dollar.
HHH
I agree dollar shortage will create a balance of payments issue. Correct me if I’m wrong but something similar happened when Volker jacked the rates up. This time the system has too much debt so the effect will be insolvency. I give an example, one fast food franchise owner I know with well over 150 locations just defaulted on his debt because he had no skin in the game. The bank had to take on the entire business unit. However without an operator all they’d have are worthless real estate. So the bank offered management to stay on a 50% bonus on their annual salary 1/2 up front 1/2 in 6 months. That’s just one example that I personally know. What else is happening?
Bottom line is the rate increase made the business unit unprofitable. This will roll through real estate outside the US as mortgages reset and forget about CRE they’re done. But it’s going to fall on the banks get ready for bankruptcy.
Yeah, over in the UK for instance they don’t finance home loans or mortgage the way we do here. Most are 1 and 2 year loans sometimes 5 year loans that will have to be rolled over at an interest rate that are 4-5 times the current rate of interest they pay currently. Not many homeowners will be able to afford that. This will have to be dealt with real soon.
And I think a lot of pension funds own these home loans. Because you know home prices never go down in the UK. Not sure there is even the option of modifying the loans.
Here in the US our small and mid sized banks that originate 70% of all CRE loans. The problem is too big. They won’t be able to write these loans down. They will have to fire sale assets as deposits continue leaving for 5% returns in money market funds and US treasuries. And no the FED’s bank reserves at the discount can’t make these banks whole. Because bank reserves aren’t the same as bank deposits.
The swap lines that the FED has with some of the other central banks don’t really matter either. They don’t increase dollar liquidity.
Those swap lines aren’t the same as book entries on the balance sheets of the Eurodollar banks that literally make global commerce possible.
All the problems we are seeing be it China, Germany, UK, and the US are all related.
Article on OilPrice predicts peak demand for oil later in this decade.
https://oilprice.com/Energy/Crude-Oil/The-Tipping-Point-In-Global-Oil-Demand.html
Higher fossil fuel prices globally result in increased adoption of lower cost solar and wind energy-
“The surge in fossil fuel prices last year made renewable energy sources more competitive, with 86% of all new installed renewable capacity exhibiting lower costs in 2022 compared to electricity powered by fossil fuels…In 2022, 187 gigawatts (GW), or 86% of all the newly commissioned renewable capacity, had lower costs than fossil fuel-fired electricity, the agency said” [equal to annual electricity output of roughly 45 nuclear power plants]
https://oilprice.com/Latest-Energy-News/World-News/Soaring-Oil-Gas-Prices-Made-Renewables-Cheaper-Than-Fossil-Fuels-In-2022.html
Hickory
Annual output is meaningless. We consume electricity on a second by second basis and the grid needs to be balanced likewise.
Solar and wind are great when it is sunny or windy. However at 5pm in winter there is no solar and wind can be as little as 2% of demand.
In Germany do you know what the installed solar and wind capacity is?
Do you know how many times this year wind and solar produced less than 5% of demand in a 24-hour period?
Have a look at week 6 and 7. If you took all the lithium batteries manufactured in the world to date. They would power Germany’s shortfall for 14 hours.
https://energy-charts.info/charts/power/chart.htm?l=en&c=DE&stacking=stacked_absolute_area&source=total&week=07
The true cost of wind and solar is wind and solar plus 98% backup for at least 4 days.
That is why Germany has the highest electricity prices in the world.
https://iea.blob.core.windows.net/assets/567bac7c-5b6f-4aab-8e88-90af3e464d97/World_Energy_Prices_2019_Overview.pdf
Charles, if you were planning a grid with 100% solar or wind…then yes it would be a problem requiring massive storage and overproduction to deal with.
But in this world we live in and for the next many decades,
the intermittent sources of solar and wind energy will serve as a mechanism to decrease the heavy reliance on oil, gas and coal, all of which are subject to supply depletion and escalating cost.
Likewise, a nuclear plant needs backup because of maintenance and refueling, but that doesn’t mean that its energy output in not extremely valuable.
So, if an importing country can cut its natural gas consumption by 50% by installing wind or solar capacity it is a very big deal for financial and economic stability of the nation.
Variable output natural gas (peaker) power plants serve very well as complimentary backup to the intermittent sources of energy and variable demand response.
Sure beats just sitting around with hands in the pocket while fossil energy depletes and fuel inflation bits hard. Of course, your country could just continue to more rapidly de-industrialize and then shed population… this is what is at risk.
Iowa with its greater than 60% wind energy supply of total electrical demand
doesn’t seem to be struggling with grid integration or electricity price-
on average Iowa pays 2cents less than the national average.
https://www.chooseenergy.com/electricity-rates-by-state/
Hickory
You said wind and solar are cheap, they are not. I have shown you why the electricity is expensive because of the cost of running and maintaining all the backup.
Looking at your map the most expensive states generally have the highest rates of wind and solar.
Just reducing coal and gas will not help as we will end up using it all anyway, it will just take a bit longer.
China has hardly any storage so despite very large increases in wind and solar it is burning as much coal this year as the UK will in 430 years. That should tell you everything about how good wind and solar are without storage.
It is all getting very very expensive
Sub $1 Natgas Prices Coming???
I have been warning subscribers of a possible SUB $1 Natgas price for several months now. While the Natgas price continues to be volatile, it remains near lows set in the Spring.
The next 4-6 weeks will be the REAL TEST for Sub $1 Natgas. I believe we are heading below $2, but will the Natgas price fall below $1??
With European Natgas Inventories now at 93% Full, two months sooner than normal… what happens when Europe reaches FULL CAPACITY in the next 4-6 weeks??
steve
A new tight oil estimate is out from the EIA, I compare it to a tight oil estimate that uses the Petroleum Supply Monthly (PSM) and the STEO forecast for US L48 minus GOM and subtracts 1781 kb/d of conventional output from the PSM and STEO to estimate tight oil output.
The trend for the estimate has an annual rate of change of 552 kb/d for the March 2021 to December 2024 period. The annual trend for the official estimate from March 2021 to July 2023 is 560 kb/d.
Oil prices spike as Saudi Arabia, Russia extend 1.3 million barrel a day oil cut through December
DUBAI, United Arab Emirates (AP) — Saudi Arabia and Russia agreed Tuesday to extend their voluntary oil production cuts through the end of this year, trimming 1.3 million barrels of crude out of the global market and boosting energy prices.
The dual announcements from Riyadh and Moscow pushed benchmark Brent crude above $90 a barrel in trading Tuesday afternoon, a price unseen in the market since November.
The countries’ moves could increase inflation and the cost for motorists at gasoline pumps. It also puts new pressure on Saudi Arabia’s relationship with the United States, as President Joe Biden last year warned the kingdom there would be unspecified “consequences” for partnering with Russia on cuts as Moscow wages war on Ukraine.
“This additional voluntary cut comes to reinforce the precautionary efforts made by OPEC+ countries with the aim of supporting the stability and balance of oil markets,” the Saudi Press Agency report said, citing an unnamed Energy Ministry official.
State-run Russian news agency Tass quoted Alexander Novak, Russia’s deputy prime minister and former energy minister, as saying Moscow would continue its 300,000 barrel a day cut.
The decision “is aimed at strengthening the precautionary measures taken by OPEC+ countries in order to maintain stability and balance of oil markets,” Novak said.
Benchmark Brent crude traded Tuesday above $90 a barrel after the announcement. Brent had largely hovered between $75 and $85 a barrel since last October. A barrel of West Texas Intermediate, a benchmark for America, traded around $87 a barrel.
There is a lot more to this article. Click on the blue headline above to read it.
Vertical Onshore Oil Rigs for US
The chart below has US L48 minus GOM conventional C plus C output. Given the rig count shown above with output falling when the rig count was 40 to 60 rigs over the 2016 to 2019 period, it seems unlikely we would see outpit rising when the rig count was between 10 and 25 from June 2021 to June 2023. The conventional output is based n the Petroleum Supply Monthly data and the official tight oil estimate. The underestimate of tight oil output has caused a false rise in conventional output in the chart below from June 2022 to June 2023 in my opinion.
I wonder if oil men could comment on whether they think conventional output in the US has increased from 1800 kb/d to 2100 kb/d over the past 18 months. This would be roughly a 30% annual increase in conventional C plus C output for the onshore L48 of the US, does that sound right?
To me it sounds wrong, I think either flat output or perhaps reduced output since Jan 2022 seems more reasonable.
Dennis.
During 2020 a very significant amount of US onshore lower 48 conventional wells were shut in.
Given the lack of labor and equipment in service to get those all back into operation, there was likely a lag effect in reactivating many of those wells, even into early 2022 when oil prices spiked over $100.
There could be some unconventional mixed in too, I don’t know. But compare current months to pre-pandemic. Still slightly below pre-pandemic production levels.
I also do not think the Baker Hughes vertical rig count is accurate.
The Illinois Oil and Gas Association has been reporting 10-12 active rigs since spring. Baker Hughes doesn’t reflect these.
The same is true with Kansas. Independent Oil and Gas Service Inc. reported 38 rigs running in Kansas, down from 59 during the same period in 2022.
Shallow sand,
Thanks. I cannot find data for Illinois rigs from IOGA, maybe it requires membership. Do you have a link to this data?
Are the rigs running since spring (10-12 rigs) more or less than the average rig count in 2019?
Chart below has trailing 12 month average output for Illinois based on EIA data, the 30% increase in conventional output suggested by the PSM minus EIA tight oil official estimate does not seem to be coming from Illinois.
Shallow sand,
Also consider the comparison of US states which produce tight oil (with tight oil output subtracted to give conventional only output) with those states that do not produce any tight oil (including condensate from shale gas producing states). Is there some reason that conventional output would only be increasing in the tight oil producing states since January 2022? I must be missing something obvious here.
Thanks for your help solving this mystery.
I missed this one from a week ago….
https://www.reuters.com/business/energy/russia-faces-domestic-fuel-crunch-braces-more-shortages-2023-08-31/
Diesel is up only 18% since late June, while oil is up almost 30%…imagine diesel may run up another $0.50 or so…Jet fuel is up almost 40% in 2 months…($2.25/gallon in late June and now $3.20/gallon).
MOSCOW, Aug 31 (Reuters) – Russia, one of the world’s biggest oil producers, has faced shortages of fuel crucial for gathering the harvest in some parts of its southern breadbasket and the situation may get worse in coming months, market sources told Reuters.
Traders said that the fuel market has been hit by a combination of different factors including maintenance at oil refineries, infrastructure bottlenecks on railways and the weaker rouble which incentivises fuel exports.
The SPR gets refilled a tiny bit..
https://wolfstreet.com/2023/09/05/crude-oil-wti-jumps-to-highest-since-november-as-spr-gets-refilled-saudi-arabia-russia-extend-production-cuts/
Hoping someone can tell me where production growth has come from lately?
When I add up production for top Permian producers I get following:
Exxon ~0.32 for past 12 months
Conocco ~0.37 for past 12 months
Devon ~0.28 but droping 10% past 12 months
Pioneer ~0.5 for past 12 months
Occidental ~0.33 gaining 10% past 12 months
This all works out to no growth over 12 months for Permian top 5 producers…
Maybe it’s more recent production growth…
It’s fascinating that guidance from most of these companies has Permian growth pegged at 7% annually…
Works out to almost 0.6 mb/d annually…similar to what Dennis has…hard to believe….
I would guess that they are all underestimating the number of wells needed to keep production in place, just a guess.
A new thread regarding US June Oil Production has been posted.
https://peakoilbarrel.com/us-june-oil-production-rises-on-gom-jump/
A new open thread Non-Petroleum has been posted.
https://peakoilbarrel.com/open-thread-non-petroleum-september-6/