OPEC Update, November 18, 2023

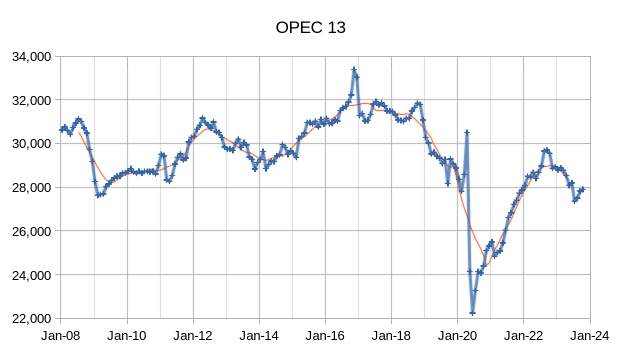
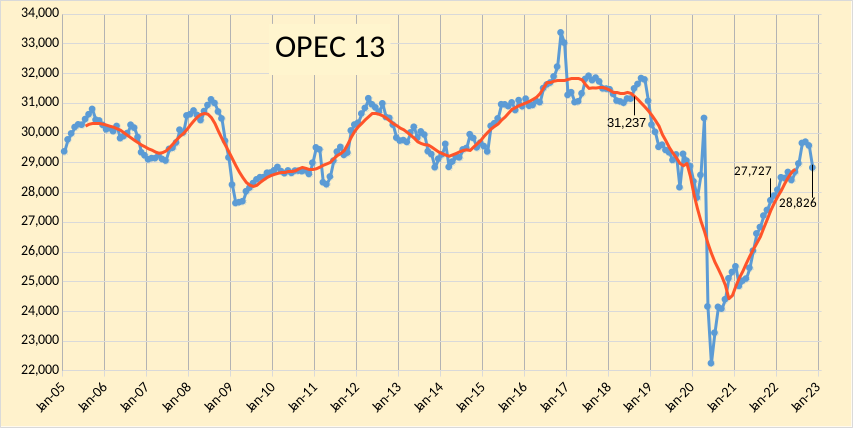
The OPEC Monthly Oil Market Report (MOMR) for November 2023 was published recently. The last month reported in most of the OPEC charts that follow is October 2023 and output reported for OPEC nations is crude oil output in thousands of barrels per day (kb/d). In many of the OPEC charts that follow the blue line with markers is monthly output and the thin red line is the centered twelve month average (CTMA) output. 

Read More

STEO and Tight Oil Update, August 2023

The EIA’s Short Term Energy Outlook (STEO) was published in early August. The chart below estimates World C+C by using the STEO forecast combined with past data from the EIA on World Output.

The EIA’s Short Term Energy Outlook (STEO) was revised higher in August compared to July. World C+C output is expected to decrease in the second and third quarters of 2023 and then increase over the next 5 quarters. Annual average World C+C output increases by about 1000 kb/d in 2023 to 81743 kb/d and then to 82967 kb/d in 2024, less than 50 kb/d below the centered 12 month average peak in 2018. This month’s World C+C estimates are about 300 kb/d higher than last month for 2023 and 400 kb/d higher for 2024 due to the revisions in the STEO forecast this month.

Read More

EIA Short Term Energy Outlook, Tight Oil Report, and IEA Oil Market Outlook, May 2023

The EIA’s Short Term Energy Outlook (STEO) was published in early May. The report that follows compares World Petroleum Liquids output from the STEO with estimates from OPEC’s Monthly Oil Market Report (MOMR) from May and the IEA’s Oil Market Report (OMR) from February 2023 with an update on World liquids output based on the summary of the May report with my estimate on quarterly output in 2023 based on the annual estimate for 2023 published in May 2023 and the quarterly numbers published in February 2023.

Figure 1
Read More

OPEC Update, December 2022

The OPEC Monthly Oil Market Report (MOMR) for December 2022 was published recently. The last month reported in most of the OPEC charts that follow is November 2022 and output reported for OPEC nations is crude oil output in thousands of barrels per day (kb/d). In most of the OPEC charts that follow the blue line is monthly output and the red line is the centered twelve month average (CTMA) output. 

Figure 1
Figure 2
Read More

Decline in World Conventional Oil Output and Peak Oil

World Conventional Oil output peaked at a centered twelve month average (CTMA) of 74193 kb/d in July 2016. This peak is unlikely to be surpassed in the future. I do not include an estimate of unconventional oil produced in Venezuela as this data is difficult to find. In the chart below, I compare World C+C output to World conventional oil, which I define in this post as World C+C minus the sum of US tight oil and Canadian oil sands. The units for most charts (figures 11 and 12 are exceptions) will be kb/d on vertical axes. Data for oil output in all charts that follow will be the centered twelve month average output. Data is from the EIA’s International Energy Statistics.

Figure 1
Read More