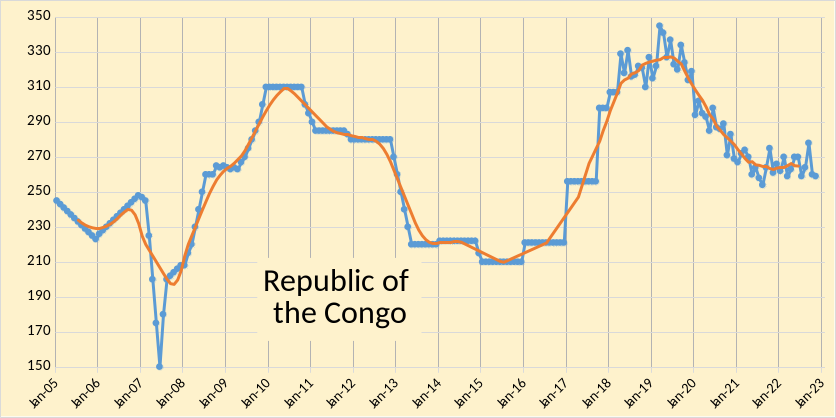
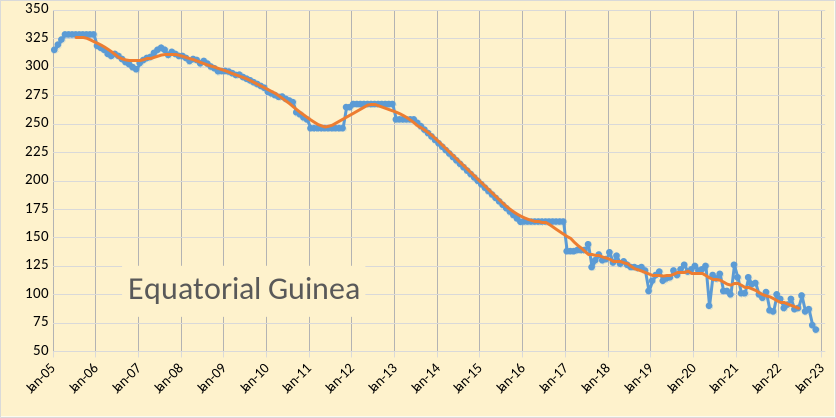
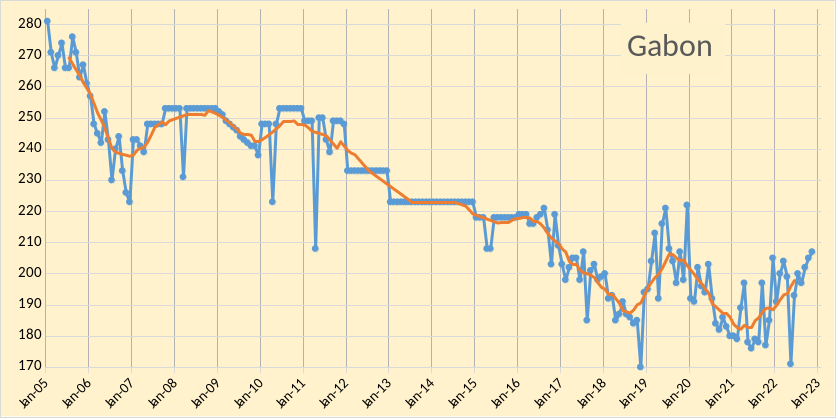
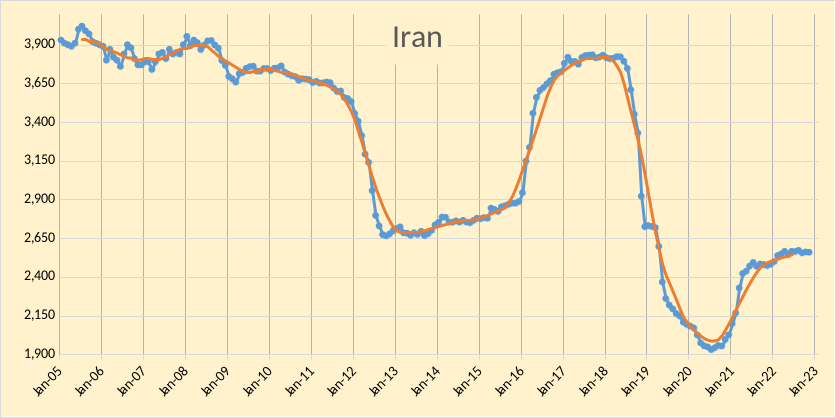
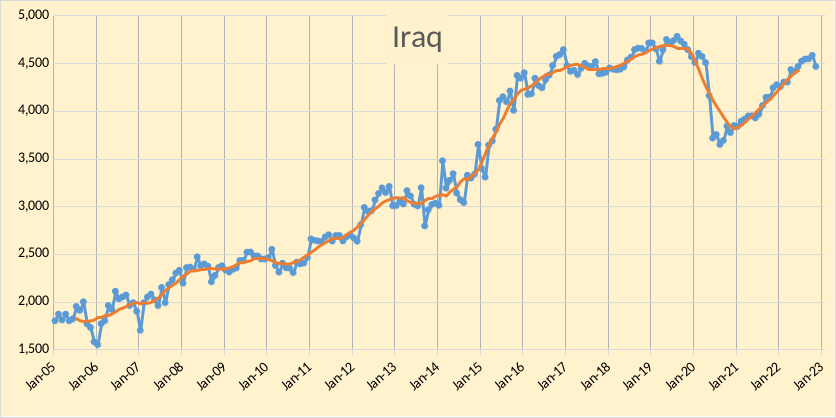
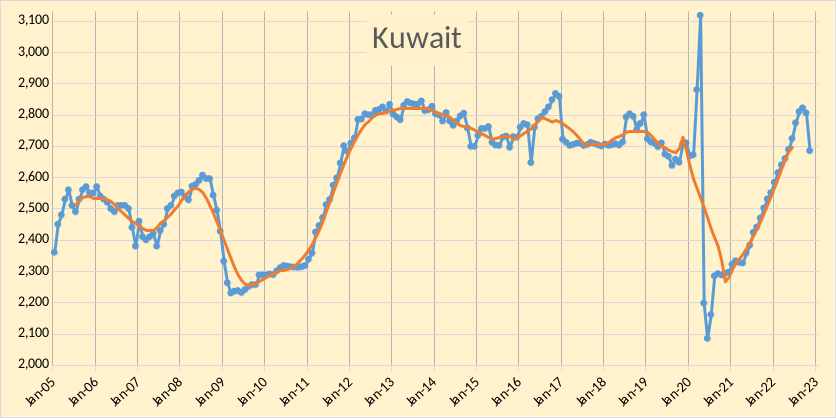
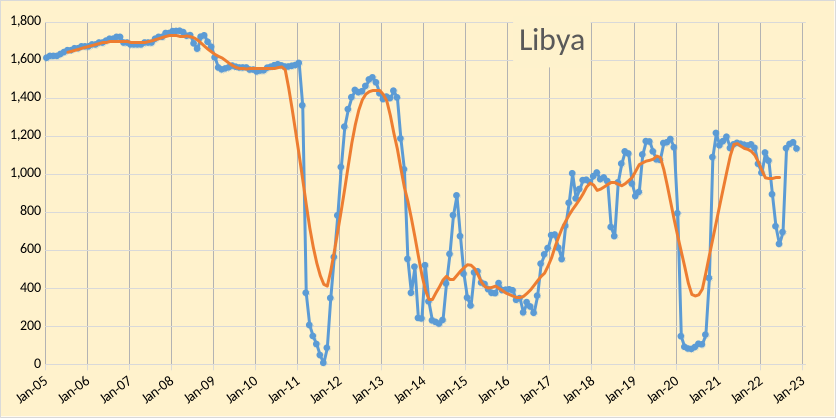
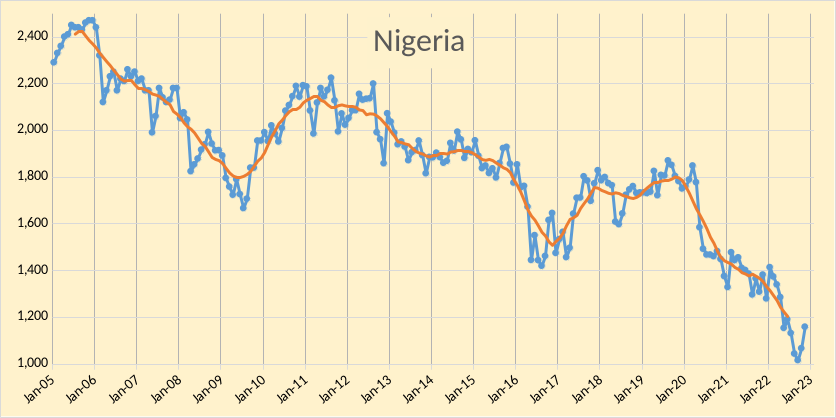
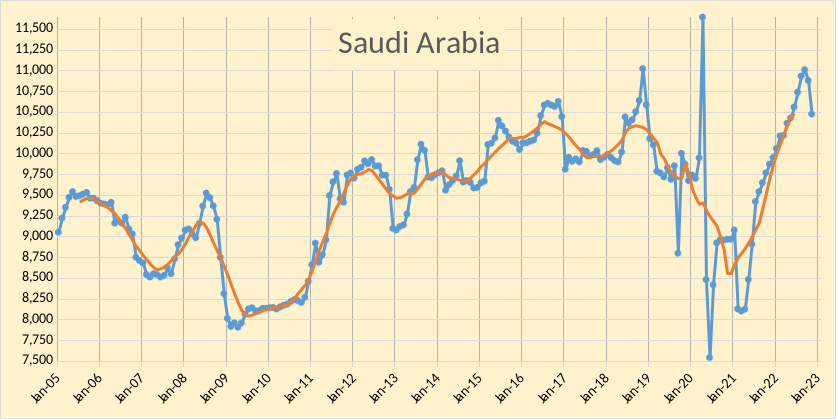
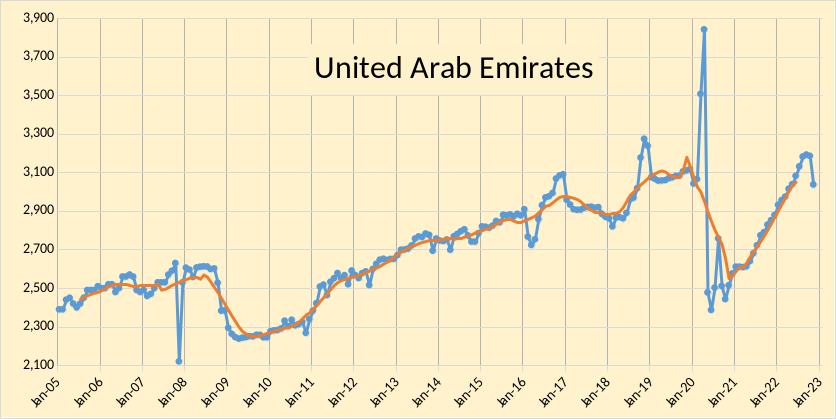
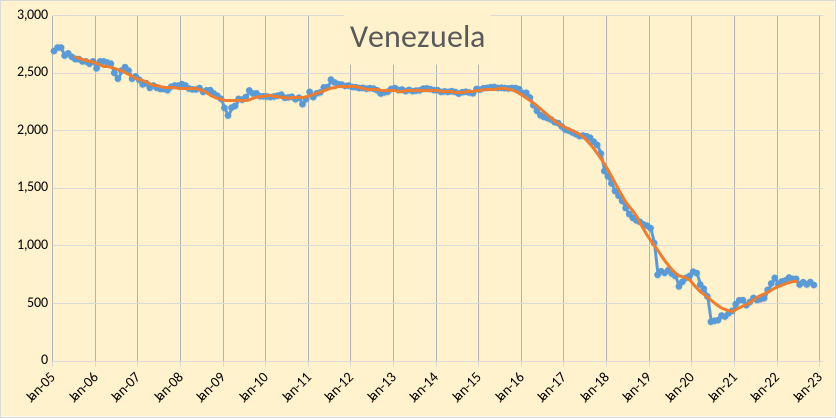
The OPEC Monthly Oil Market Report (MOMR) for December 2022 was published recently. The last month reported in most of the OPEC charts that follow is November 2022 and output reported for OPEC nations is crude oil output in thousands of barrels per day (kb/d). In most of the OPEC charts that follow the blue line is monthly output and the red line is the centered twelve month average (CTMA) output.
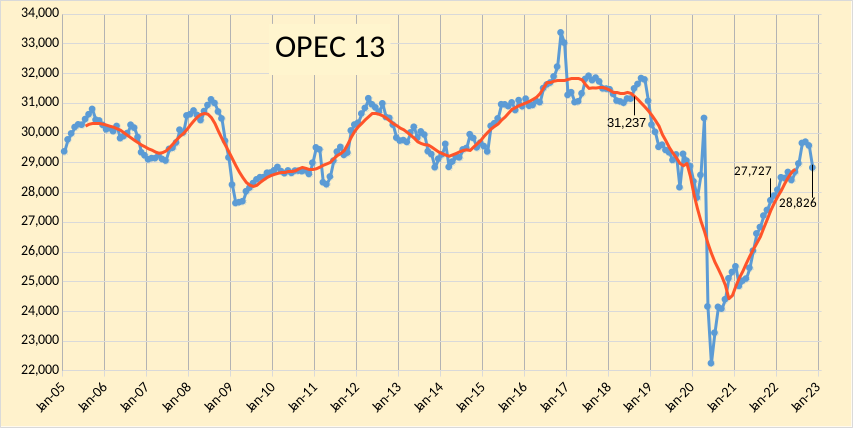
OPEC crude output was revised lower in September 2022 by 8 kb/d compared to last month’s report and October 2022 OPEC crude output was revised higher by 76 kb/d. OPEC output has increased by 1099 kb/d since Nov 2021, from 27727 kb/d to 28826 kb/d. When the World was at its centered twelve month average peak for C+C output in August 2018, OPEC crude output was 31237 kb/d (as shown on the chart), November OPEC crude output was 2411 kb/d below that level.
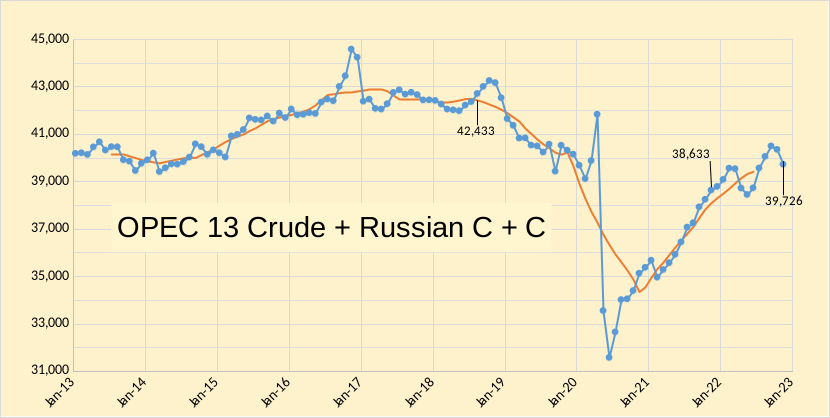
In the chart below we have Russian C + C and OPEC crude oil output. Output for OPEC13 crude and Russian C+C was 42433 kb/d in August 2018 when World C+C output was at its centered 12 month average peak, output for Russia and OPEC was 2707 kb/d below the August 2018 level at 39726 kb/d in November 2022. In the past 12 months OPEC and Russian output has increased by 1093 kb/d from 38633 kb/d in November 2021.
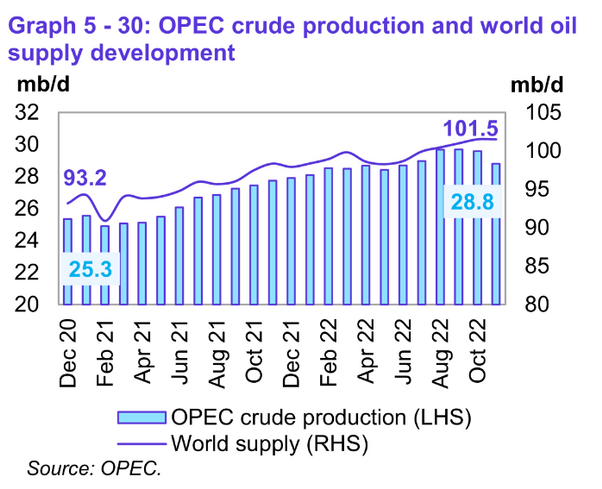
World Oil Suppy (all liquids) was 101.5 Mb/d in November 2022, 8.3 Mb/d higher than output in December 2020, OPEC crude oil output increased by 3.5 Mb/d over the same 23 month period.
OPEC expects the balance of supply and demand to be pretty close to the the November 2022 OPEC output level of 28.83 Mb/d from 2022Q4 to 2023Q2. If OPEC’s estimates for future supply and demand are correct we might expect oil prices to be fairly subdued in 2023, perhaps in the $70-90/bo range for Brent crude.
The chart below makes a guess at World stock levels of about 8000 Mb for the end of 2019Q4, the oil market was fairly balanced in 2019 with little stock change though the exact stock level is unknown because non-OECD stocks are not reported. Note that the actual level is less important than the change in the level of World stocks of oil, the actual level at the end of 2019 might have been anywhere from 8000 to 9000 barrels of petroleum products plus crude (including oil travelling in tankers). I assume for this scenario that OPEC output remains at the November 2022 level from 2022Q4 to 2023Q4 (future output is obviously not known) and see what would happen to World stocks in this scenario using OPEC’s expectation for future oil demand and Non-OPEC output. The projection starts in 2022Q4.
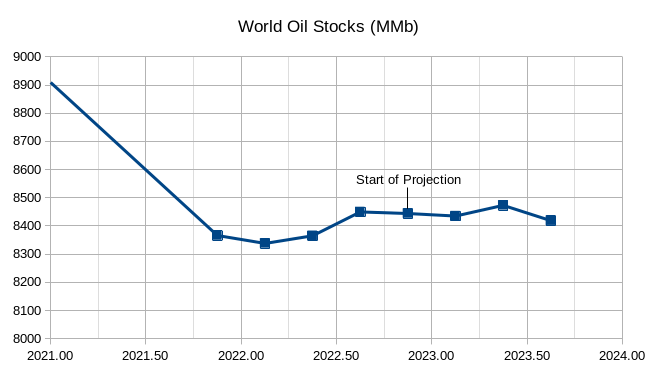
Note that stocks rise from 2022Q1 to 2022Q3, this is part of the reason for the OPEC cuts, from their perspective the market is well supplied and they may be aiming to bring stocks closer to the 2019Q4 level (8000 million barrels in this scenario). Also note that stocks change very little from 2022Q3 ro 2023Q4 under the assumptions of this scenario.
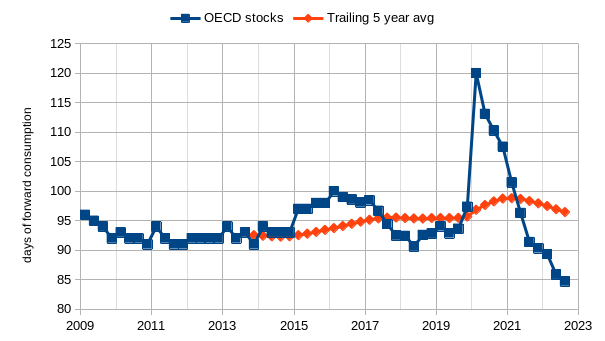
OECD stocks continue to be much lower than the 2009 to 2019 period, but OECD stocks seem to be playing a less important role in determining oil prices of late.
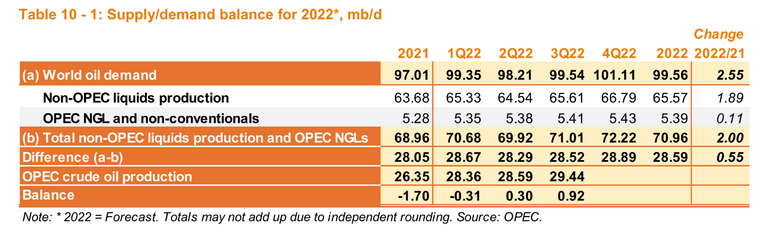
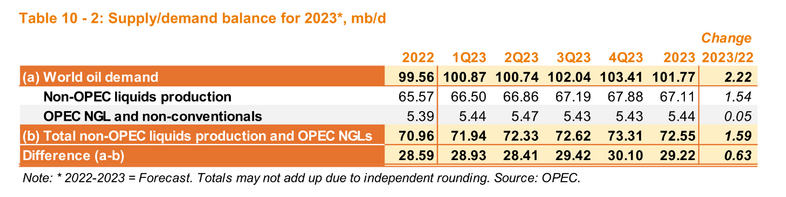
Below are OPEC’s forecast for Oil supply in 2022 and 2023, unfortunately they report in all liquids rather than C+C.
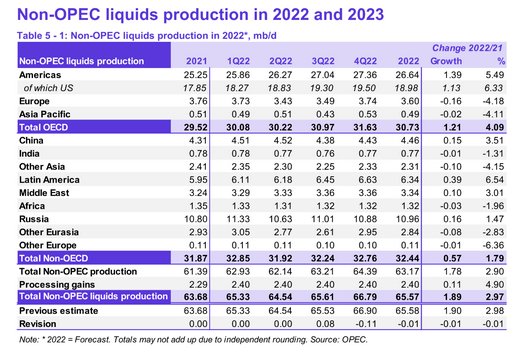
Of the 1.47 Mb/d of increased non-OPEC output that OPEC forecasts for 2023, 1.15 Mb/d is expected to come from the US, with increased output from Canada and Norway of 0.48 Mb/d combined, output falls in Russia by 0.85 Mb/d but this is offset by increases in other Non-OECD nations so that the total non-OECD decrease is 0.16 Mb/d. Of the 1.15 Mb/d increase in US output in 2023, 0.78 Mb/d is expected to be tight oil with NGL adding another 0.33 Mb/d.
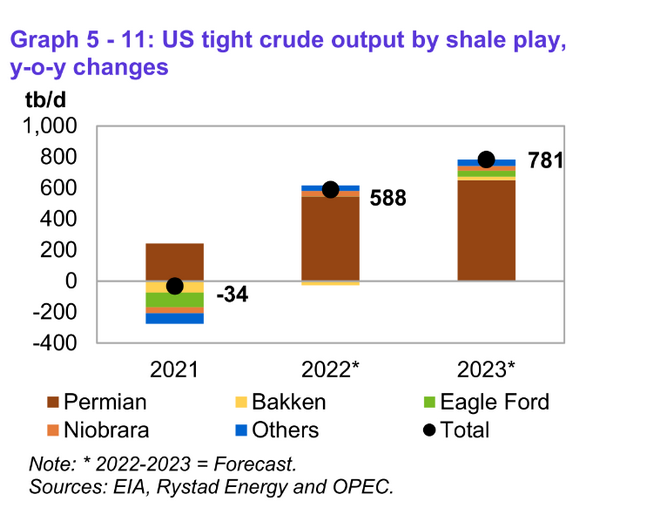
The chart below gives more detail on OPEC’s forecast for US tight oil year over year increases from 2021 to 2023 for various tight oil plays.
196 responses to “OPEC Update, December 2022”
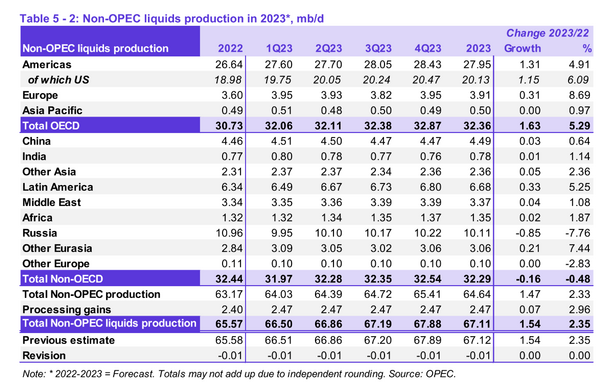
Table 5 -2. OPEC has Russian total liquids 2023 production about one million barrels per day higher than the EIA STEO has them. I haven’t checked any of the rest.
I tried to find how much tight oil was produced from the beginning until now in total and this is not an easy number to find
Svaya,
From Jan 2000 to Oct 2022 about 24 billion barrels of tight oil were produced in the US based on EIA estimates. For the rest of the World the amounts are small and I do not have an estimate for tight oil produced in the rest of the World (all nations excuding US).
Data from spreadsheet linked below from EIA
https://www.eia.gov/energyexplained/oil-and-petroleum-products/data/US-tight-oil-production.xlsx
Thank you very much
do you happen to know the lowest and highest estimates for the still in the ground tight?
Svaya,
My guess is a minimum of 60 Gb for US recoverable resource and the EIA estimates about 130 Gb for tight oil recoverable resource in the US, for remaining tight oil resource it would be 36 Gb minimum and 106 Gb maximum (I am taking the EIA estimate as a maximum, there may be higher estimates out there, but I think they are very unrealistic). My best guess (50/50 odds in my opinion that resource might be higher or lower) for recoverable tight oil resource in the US is 80 Gb, with 56 Gb remaining to be recovered. This assumes no export ban and that demand for oil remains strong through 2040 (with oil prices remaining above $80/bo on average from 2023 to 2040 in 2022$).
Thank you,
130Gb is a lot
make me wonder if US extract that amount conventional in its entire history
Svaya,
I believe about 217 Gb of conventional oil was extracted from 1900 to 2021 in the US. (I am defining conventional oil as all crude plus condensate output minus tight oil output).
https://www.eia.gov/dnav/pet/hist/LeafHandler.ashx?n=PET&s=MCRFPUS1&f=A
I agree the 130 Gb estimate is probably too high, I believe about 50 Gb of tight oil might be extracted from the Permian basin, about 9 in North Dakota (Bakken), maybe 8.5 Gb from Eagle Ford, perhaps 3.5 Gb from Niobrara, with the balance of 9 Gb from condensate in shale gas plays and other smaller plays (Anadarko, Powder River, and Austin Chalk). My subjective estimate is that there is about an 80% probability that US tight oil cumulative output will be between 65 and 95 Gb.
Note that I am usually wrong on this stuff, the future is difficult to predict.
The North Dakota Bakken production report was due out today before 4 PM CST. It didn’t happen. I suppose the blizzare in Western North Dakota may have had something to do with it.
Dennis
There is quite a difference between OPEC and the STEO for LTO production increase in 2023.
For 2023, the STEO is forecasting a 420 kb/d increase for the On-Shore L48 while OPEC is looking for a 780 kb/d increase, a difference of 360 kb/d. Also note that almost half of the 2023 STEO increase occurs in November and December.
Maybe next month the OPEC and STEO forecasts might converge.
I think Bakken, Eagle Ford and Nibrara are going to see accelerating falls in 2023. In 2020 there were a couple of minor new formations opened up in Bakken and a. new field in EF, which compensated for decline in older areas, but it doesn’t look like these are going to be able to grow much more. In the Permian the largest producing Wolfcamp formation looks like it is just past a peak plateau now, at least in Texas. Whether the rest of the Permian can compensate remains to be seen but the oil price volatility, economic uncertainty, labour shortages and equipment inflation will all militate against it, and any new Covid like black(ish) swan event is much more likely to have negative impacts rather than positive.
The Bakken tier designation has been reformatted, as some tier-nothing areas have produced the best wells. Divide county with thin but dense benches is almost virgin territory for 3-mile laterals with great yields b/c of high ethane cuts that are used as a diluent for long chain hydrocarbons.
The Bakken may well slip next year, as not many rigs are operating, but with the new yields, the basin is still a pretty strong place for an investor to be.
Thanks, that may explain things better, I’m not sure. Was referring to the lower baked and lower three forks in the bottom right here, they have provided some growth but look like they have peaked. I don’t understand how reclassification would produce that shape. Without that addition the decline, over the last two years or so, would have been almost double.
Macro: three-thousand square miles of ignored Bakken acreage was reformatted this year as Tier One. This expands (by a lot) the amount of Bakken/Three Forks to D&C.
Micro: individual wells are usually exceptionally good, and are choked back to slow decline, with subsequent re-injection of field gas that has an unusually high ethane cut–a superior gas for cleaning out the pores in very long laterals (3-4 miles).
I’m not particularly a cheerleader for the Bakken, but one must look at these graphs in context of D&C activity and also designation changes. Before the pandemic, there were 50-55 rigs working the Bakken. Mid-last-year there were 18. That’s nothing. No wonder production fell off. Slowly, this has worked up to 40. With the quakes in the Permian and the strict regulations on Weld County Colorado Niobrara, I expect to see the rig count continue to grow in the Bakken. I could be wrong, but some of my best production has been on “condemned” acreage thought to be no-account. This is a grossly underreported change in the complexion of the Bakken–and is in sharp contrast to the Permian, which was over reported and overvalued.
My only point is that, since it was cheaper to get checkerboard acreage, this is still a fairly strong place to be as a small investor. Especially with Divide County coming into play. There is still quite a bit of oil in these forgotten fields, such as the Granite Wash and the Austin Chalk. Depending on price for oil, some of it may become lost. But I doubt it.
Gerry,
Here’s my question. You say that “three-thousand square miles of ignored Bakken acreage was reformatted this year as Tier One.”
Who did the “Reformatting of the 3,000 square miles of the Bakken?”
Please don’t tell me it was Lynn Helms (N.D. DMR) or Ron Ness (Pres of N.D. Petroleum Council).
steve
I’d understood that ethane flood wasn’t even at a full scale trial yet. How many wells or sections are using this method? I can understand choking wells as flow is established but with such high rates of decline it must be for short times, or it would imply the wellhead has the wrong design. How many wells are like that?
My guess for North Dakota Bakken/Three Forks, Eagle Ford, and Niobrara for 2023.
Ovi,
Also note that a better comparison is to look at annual averages, the OPEC MOMR gives annual average tight oil output in 2022 and 2023, for the STEO the difference between the annual average in 2022 and 2023 is 470 kb/d, about 310 kb/d less than the OPEC estimate. My estimate is between the two estimates from the EIA and OPEC at about a 600 kb/d increase in the 2023 average annual tight oil output compared to 2022. The average of the EIA and the OPEC estimate is a 625 kb/d increase in annual average tight oil output from 2022 to 2023.
Dennis
To get an idea of where the US is going over the next year, one must take a close look at what is happening in the Permian. Things are changing.
In the attached chart, rigs were being added in the Permian at the rare of 1.92 rigs/wk from January 2021 to the end of July 2022 when rigs peaked at 330. Since then the weekly rig count has bounced around 325 ± 5 except for a few weeks. Also since March, completions have been fairly flat at around 435/mth. In July the gap between completed and drilled wells dropped to 14 and for January 2023, the DPR is forecasting that the gap will drop to 8. The use of DUCs is dropping and there is no indication at this time that drilling will exceed completions, especially with WTI at $75/b.
Looking at this data, and considering the current price and lead times for equipment. My guess is that the Permian has reached a stable situation with rigs and completions. The rig count will remain flat at close to 325 coupled with an associated 430 to 435 completions per month.
According to the latest DPR, this steady situation would indicate an increase in Permian production of 37 kb/d in going from December 2022 to January 2023. The production chart also shows signs of Permian production rolling over, over the last few months.
So at this time, I think an overall US On-Shore L48 production increase of close to 400 kb/d is a good estimate for 2023.
Ovi,
Perhaps. Note that my Permian basin model assumes 429 wells completed per month in the Permian basin which results in average annual output for US tight oil of 8400 kb/d in 2023. Your guess of 400 kb/d may be nearly correct if my model is accurate and 2022 tight oil output is revised higher (more in line with my model for 2022 which has annual 2022 US tight oil output at 7940 kb/d. For my model the increase in average annual output is 460 kb/d, the earlier 600 kb/d is based on EIA data for tight oil output using the data through Sept from the October tight oil report and filling in Oct to December with my model output.
The EIA data for tight oil has been strange lately so we are stuck without a decent estimate. On rig count, you have pointed out correctly that there tends to be a slowdown in the rig count increase over the holiday. The number of wells drilled per rig in the Permian tends to be around 1.35 tight oil wells per horizontal oil rig. So 325 rigs is probably plenty to drill 429 wells per month which would stabilize the DUC count if the completion rate averages around 429 per month.
Any of these assumptions can be wrong, and of course the same is true of the assumptions that underly the STEO forecast which changes monthly.
Longer term view of US Horizontal Oil Rig Counts. It is difficult to predict in advance future changes in trend, many of the changes were a result of a big change in the price of oil.
Ovi,
Also keep in mind we are talking about US tight oil output rather than just the Permian basin, for all US horizontal oil rigs the monthly rate of increase has been about 15 per month (3.47 per week) on average over the past 2 years. For the past 6 months the rate of increase in rigs has slowed to 1.3 per week. Difficult to know what future rig counts will be, the current rate of increase is unlikely to continue, will it be higher or lower in the future? Oil price will be a big factor along with costs of labor and other inputs in the oil field in the future.
Dennis
Below is a table that shows the number of rigs in each basin on July 29 and December 16.
Note there has been essentially no change in Permian rigs. The gains have occurred in Cana Woodford, Niobrara, EF and Williston.
I think that the Permian drillers and the Frac spread crews have found an optimal economic balance of 325 rigs and 430 completions. Over this time period, WTI has fallen from $100/b to $75/b.
Most Permian counties lost rigs in the second half of 2022, only Lea in NM and Glasscock look to have had significant and continuing growth.
Ovi,
That could be, note that a completion rate of 430 would result in Permian output growth of 420 kb/d, fairly close to EIA L48 onshore change in annual average output from 2022 to 2023 for all US tight oil of about 470 kb/d from 2022 to 2023, slightly lower than my model estimate for change in average annual tight oil output from 2022 to 2023 of about 480 kb/d. Note that from Dec 2022 to Dec 2023 my model has Permian output up by 349 kb/d and US tight oil by 419 kb/d, fairly close to the EIA estimate.
I agree the OPEC estimate may be too high, but I would caution that my estimates historically have tended to be too low.
George
Thanks for that thought on where rigs are increasing. This what I extracted from BH. I just list counties where there is a change of ± 4 or more.
Column 4, 2 – 1, is the change in rigs between July 29 and January 28.
I think things are clearer with trends rather than picking the end points. The picture might look different for horizontal only but this shows all rigs. Martin and Reeves might have small increases but I wouldn’t say they are particularly significant and might be reversing.
Scenario for Permian basin with a decrease in the completion rate from the recent 7 month average (using Novilabs well completion data from Jan 2022 to July 2022) of 429 wells per month to 334 wells per month from 2025 to 2029 (with a gradual decrease in completion rate from Nov 2022 to Dec 2024). The average output from Jan 2023 to Dec 2029 for this scenario is 4894 kb/d. Completion rate in new wells per month is on the right axis and Permian tight oil output in kb/d on left axis. URR=32 Gb and total wells completed from Nov 2022 to July 2034 is 40255 (94 months/ ~8 years at recent drilling rate) and from Jan 2010 to last well completed there are 78310 wells completed for this scenario. Recent estimates by others range from no more than 6 years of drilling inventory to no less than 10 years of drilling inventory at around $60/bo in Permian basin, I chose the middle of this range at 8 years for this scenario. The scenario is extremely conservative in my view.
A revised tight oil scenario with oil prices at $80/bo from 2023 to 2040, the Permian scenario above is used with revised Bakken, Eagle Ford, Niobrara, and other tight oil scenarios. I assume the completion rates in all basins except the Permian remain close to Sept 2022 levels until 2030 and that well profiles remain unchanged from 2020 to 2030. URR is 66 Gb for US tight oil for this scenario. Permian completion rate falls from 429 to 330 in this scenario (see chart upthread).
I repeat a link to my article:
11/12/2022
OPEC 10 crude production and quotas during Covid
http://crudeoilpeak.info/opec-10-crude-production-and-quotas-during-covid
The tight oil and shale gas companies are not mainly dividend paying. They issued a few before 2011 and more there was a notable increase 2021, which may signal a change in approach. They only do share buy-backs to prevent dilution from shares issued for management compensation. Their business models have mostly been about growth, except that since 2015 there hasn’t been any. With inflation included the total combined asset value has been falling. Within that total several companies have been taken over by other companies in the list (so their remaining assets have been retained (Rice by EQT, Energen and QEP by Diamondback, WPX by Devon, Concho by COP, Oasis and Whiting merging to form Chord, and Cabot and Cimarex forming Coterie). Some private companies and producing acreage have also been bought in, mostly more than has been sold off to companies outside those shown. Some debt has been written off as a couple of the companies have gone through restructuring. The difference between assets and equity is liabilities including debt (principal and interest, pensions, abandonment costs etc.). To me this is a chart that shows companies heading to fade out at various rates. Prices are not currently high enough to prop them up much and another year like 2020, for whatever reason, would finish a few more of them off fairly quickly.
Further complicating the Permian out look is the latest earthquake.
https://oilprice.com/Latest-Energy-News/World-News/Earthquakes-Increase-Costs-Even-More-For-Texas-Shale-Producers.html
In the previous thread there was some discussion about ending US crude oil exports. Most of the crude oil exported is tight oil. The scenario below has a hypothetical end to crude oil exports on Jan 1 2023, the completion rate for tight oil wells drops rapidly in response and tight oil output falls to around 5000 kb/d in 18 months (the completion rate drops gradually to 140 wells per month minimum in July 2023 from 916 in Sept 2022, the completion rate gradually increases from 140 in Sept 2024 to 250 maximum in Sept 2027. The URR of the scenario is 45 Gb and the last well is completed in July 2031, about 158500 wells are completed in all US tight oil plays in this scenario from Jan 2010 to July 2031.
Big Oil Pours Billions In The Permian Basin
By Alex Kimani – Dec 16, 2022, 5:00 PM CST
The majority of energy companies have avoided spending big to expand production in the aftermath of the 2020 oil crisis.
Big oil is raising spending in the Permian in 2023.
Low-emissions oil projects are on the priority lists of many oil companies.
Permian Projects
ExxonMobil Corp. (NYSE: XOM) has not announced a drastic increase in spending, but has said that its capital spending for 2023 will be closer to the top end of its annual target of $20B-$25B, a level it expects to maintain through 2027. The company said more than 70% of its capital investments will be deployed in the U.S. Permian Basin, Guyana, Brazil and LNG projects across the globe. These investments will help increase the company’s upstream production by 500K boe/day to 4.2M boe/day by 2027 with half of that expected to come from the high return regions in the Permian Basin and other high-return regions. Exxon also unveiled plans to boost spending on lower emission projects by 15% through 2027 to ~$17B through 2027.
Exxon’s peer Chevron Corp. (NYSE: CVX) announced on Wednesday that FY 2023 capital spending budget will clock in at $17B, at the top end of its $15B-$17B medium-term range and up more than 25% from expected spending in 2022.
The company said that upstream capex includes more than $4B for Permian Basin development; ~$2B for other shale and tight assets and ~$2B to go into projects that lower carbon emissions or increase renewable fuels production capacity, more than double the 2022 budget. Although Chevron’s spending for 2023 will be considerably higher than capital spending in the 2020-21 pandemic years, it’s still much lower than the $30B annual average of the 2012-19 period.
https://oilprice.com/Energy/Energy-General/Big-Oil-Pours-Billions-In-The-Permian-Basin.html
I wonder if this will be possible if the earthquakes continue. A 5.3 near Mentone November 16, followed up by a 5.4 just East of Midland December 16.
Both appear to be among the strongest ever experienced in the State of Texas and are the strongest since the shale boom began.
Reading they are running out of room to dispose of water. Not sure how the Permian can keep growing in this scenario.
Do we know what depth these earthquakes originated from? In short, deeper than the injection horizons?
Shallow sand,
They may need to start recycling frac fluid which will increase costs, though it might be cheaper than trucking the water to areas where disposal might be safer.
Perhaps inducing earthquakes via strategic water injection will become the new norm.
California could manage their high risk tectonic setup with water injections that stimulate more common but lower intensity quakes. Relieve the pressure at a manageable level.
U.S. Oil Exports Hit Record High
“In these times of uncertainty, moving America’s energy to other U.S. demand centers and our overseas allies and trading partners has never been more critical for our economic and national security,” said Sean Strawbridge, Chief Executive Officer for the Port of Corpus Christi.
https://oilprice.com/Energy/Energy-General/US-Oil-Exports-Hit-Record-High.html
This may be of interest, though mainly aimed at investors. It estimates OPEC+ spare capacity at zero. https://bisoninterests.com/content
How did the EIA do with its price predictions this year? Answer: not great. Why do they bother?
– In our January 2022 Short-Term Energy Outlook (STEO), we forecast that crude oil prices will fall from 2021 levels.
– We expect global petroleum production will increase by 5.5 million b/d in 2022
https://www.eia.gov/todayinenergy/detail.php?id=50858
Biggest US shale operator says more drilling would harm industry
Head of Pioneer hits back at White House claims that companies are ‘un-American’ for opposing output increases.
The head of America’s biggest shale oil operator has hit back at White House claims that his industry is acting against the national interest by failing to accelerate drilling, insisting that doing so would trigger a run on energy stocks.
Scott Sheffield, chief executive of Texas-based Pioneer Natural Resources, said that pouring profits into faster output growth at the expense of shareholder returns would send investors fleeing and leave the sector “back at the bottom” of the stock market.
His comments come after Amos Hochstein, the White House’s chief energy adviser, told the Financial Times that it was “un-American” for companies to funnel record profits fuelled by Russia’s full-scale invasion of Ukraine into shareholder returns. He called on operators to “seize the moment” by pumping more oil to offset the market disruption.
Great article but quite lont. Click on the headline to read the rest of it.
Ron FT is behind paywall.
Try this one
https://biz.crast.net/americas-biggest-shale-operator-says-more-drilling-will-hurt-the-industry/
The North Dakota – Bakken oil production report was due out Friday. It didn’t happen. Apparently, Lynn Helms and his crew could not get to their offices. A few days ago, they had a blizzard in North Dakota. Williston only had 12 inches of snow, but the snow just doesn’t seem to be melting very fast.
Below is a snip from the Williston weather report. The temperature is reported in Fahrenheit. The numbers in bold are high for the day.
This will likely knock a few hundred K barrels per day off North Dakota oil production in December. And repair work will likely carry on into January. Temperatures that low will likely cause the water in the oil to freeze and pipes could burst.
We sat and watched a really cool Christmas light showed put on and paid for by the largest service contractor in our community. It was something, especially for our little town.
As I sat there, I thought about how many times these guys went through rough spots since the GFC. Yet here they were able to put this on this year.
Just a boom and bust business. Only going to increase.
Yes, Ron, not liking this weeks weather forecast. We won’t be -29F like Williston, but it’s going to be a bad one here too. Just hoping for no ice. Electricity going off is the huge issue when there is a cold snap. Once it’s frozen, it’s hard to thaw stuff out until temperatures are above freezing.
Will try to keep warm up here, Mike, you lucky SOB! Lol!!
The North Dakota and Bakken data is finally in.
All North Dakota October Production Data
North Dakota production was down 654 barrels per day in October.
It’s hard to look at this graph and not conclude that North Dakota peaked in 2019.
https://www.youtube.com/watch?v=NyOENts_d4Y
15 minutes of oil financial chatter
1) Shortage of US Dollars and effect on oil markets
2) China to Pay Saudi in Yuan
3) Russia wants 1 gram of gold for a barrel of oil in response to price cap
and more…
Global Oil Demand Climbs in October While Crude Production Falls – JODI Data
Global oil demand climbed counter-seasonally in October by 75 kb/d and was 1.7 mb/d higher than a year ago, according to new data from the Joint Organizations Data Initiative (JODI). Demand growth was driven primarily by gains in China, the US, and India.
Meanwhile, global crude production declined by 228 kb/d in October led by losses in Russia, Saudi Arabia, and the US.
While markets tightened compared to September, global inventories of crude and refined products climbed counter seasonally by 37.9 mb. Global inventories remain 406 mb below the five-year average.
SNIP
Highlights for October oil data:
Saudi Arabia
Crude production fell by 84 kb/d to 10.96 mb/d.
Russia
Crude production fell by 107 kb/d to 9.99 mb/d – a five-month low.
United States
Crude production fell by 297 kb/d to 11.97 mb/d.
It looks like September 2022 will be the post-pandemic high for a long, long time.
Underinvestment rules the day in a depleting asset base.
Shale firms set to remain on a slower growth path
The high growth rates in 2017-19 came at a substantial cost, with rapidly accelerating legacy decline rates needing ever-increasing investment just to maintain output — let alone grow — taking a rising share of profits. With slower growth, firms spend less to offset rapid legacy decline rates and can employ efficiency and technology gains to help expand production.
Permian focus
Switching objectives from output growth to rewarding shareholders has concentrated investment activity in the less mature, but much more prolific, Permian basin. Output remains below pre-pandemic levels in more mature shale producing regions — such as the Bakken and Eagle Ford formations — and growth has stalled. Operators in these regions are investing only enough to sustain output and keep the cash flowing. The Permian accounts for effectively all the 1.5mn b/d increase in US tight oil production since December 2020 — an average monthly growth rate of 1.3pc, compared with 2.8pc in 2017-19.
Clearly management is rethinking how to maximize profits and the lifetime of this precious resource.
Attached is the latest Frac Spread count chart. Down 10 for the week ending December 16 and down 25 from the recent 300 high. This is simply a repeat of last year’s holiday slowdown. Combining the new management think and current WTI price, it is difficult to see a significant overall increase in number of frac spreads above 300, especially in the Permian. The only clue to the number of frac spreads in the Permian will be through the rig count.
https://www.argusmedia.com/pages/NewsBody.aspx?frame=yes&id=2402083&menu=yes
An indirect indicator of global oil production and demand is global airline passengers.
At some point air travel for most will become less affordable, whether it is due to high jet fuel prices reflected in ticket prices, or due to loss of passenger purchasing power as the cost of all energy requiring goods and services goes up [food, heating and cooling, manufactured goods, clothing, land transport, etc].
We will see if airline passenger miles recovers to the precovid peak of 2019-2020, and if it does -for how long before the effects of peak oil are reflected in this indicator.
I think you’re confusing passenger counts with passenger miles. High airline passenger counts are mostly just an indication of weak rail infrastrcture. For example, routes like NYC to Washington wouldn’t make any sense for airlines if America had decent rail. Long distances aren’t practical by rail. That affects passengers miles much more than passenger counts.
This is a simple chart showing inter city distances that make sense for cars, trains and planes.
https://youtu.be/LlxohbiQG6Y?t=230
I was looking for a chart on airline passenger miles, but didn’t find a global one…so it just # of airline passengers. On a global basis it likely serves the purpose pretty accurately.
Global volume of seaborne trade is also a good candidate for reflecting the effect of peak oil, as it unfolds.
Petroleum Consumption For Dummies In a New Green World
While individuals may believe EVs have somehow lowered gasoline demand worldwide, the data from the IEA suggests otherwise. According to the IEA August 2022 Oil Market Report, both gasoline and diesel consumption will hit new highs in 2023.
Of course, this is just a forecast, but the fact remains, the world can’t offset petroleum fuels with EVs or Green Energy for an extended period of time. Sure, we can add EVs, Wind, and Solar Power, but these machines DO NOT LAST FOREVER.
I just did a Subscriber post on the coming Collapse of Wind Power due to the Natural Decline Rate of Wind Turbines at their 15-year lifespan. Thus, the more Wind Power we add this year, the more wind power will have to be REPLACED in approximately 15 years when these Wind Turbines are no longer economically viable. I call it the Wind Turbine Replacement Red Queen Syndrome.
However, the SMART PEOPLE of the world will continue to add more Wind Turbines right up until the point, we head over the Energy Cliff, and like we see in the UK, they are ramping up Coal Imports to keep the Lights on and keep people from Freezing. You should see this Massive Coal Truck Convoy in South Africa transporting coal to the port to be shipped to the UK. So much for Green Energy… LOL.
Anyhow, even if EVs did somehow reduce gasoline consumption, the BIG PROBLEM is the Global Supply Chain is driven mostly by DIESEL, not gasoline. While we can offset gasoline consumption with EVs or Carpooling, we can’t CARPOOL the Goods transportation Industry all that much.
So, for all the GREEN ENERGY GURUS out there polishing their new EV with a NET ZERO STICKER ON IT… enjoy the DELUSION while it lasts.
Oh yeah… if you want to make sure your EV is truly NET ZERO Emissions, then make sure the Electric power you use to charge it is from 100% Green Energy. If not, the emissions take place at the Coal or Natgas electric power plant. 🙂
GOD HATH A SENSE OF HUMOR.
HAPPY HOLIDAYS.
steve
The modern world exists because of 1. Plastic, 2. Fertilizer, 3. Steel, 4. Concrete and these 4 exist because of fossil fuels. Wind and solar power cannot ever produce these 4 materials to allow life to continue as we know.
ERVIN,
Agreed… you are speaking to the Choir here.
Interestingly, this recent GREEN ENERGY PUSH reminds me of a famous line in the movie Aliens 2 by Sigourney Weaver, who played Ripley, “Did IQs Drop Sharply While I Was Away?”
https://www.youtube.com/watch?v=vDs_pbOR9A4
Watching seemingly intelligent people making policies and technologies that actually make the problem worse suggests… IQs HAVE DROPPED SHARPLY.
steve
Steve, you keep dancing around the fact that, especially for urban transport of goods and/or people, electric vehicles are up to six times as efficient. And this may blow your mind, but yes they can even replace diesel engines. Anyone who runs a business with an accountant or would otherwise like to turn a profit that involves high transport costs will all but be forced to convert to electric mobility in the next decade.
Let me do a quick bit of math for you since you seem to be struggling with it. When something is six times as efficient that means it can do the same amount of work with one sixth the same amount of energy, regardless of the energy source.
See how that works? It’s kind of like the energy tooth fairy, except…better!
See graph below
Stephen,
Let me see if I can apply some logic based on this understanding…
Correlation does not imply causation
Maybe you should insert the “High Gasoline Price” this year as it negatively impacted demand.
https://www.bloomberg.com/news/articles/2022-08-09/gasoline-demand-forecast-cut-for-this-year-amid-high-us-prices#
According to the EIA, the average U.S. Gasoline price in 2019 was $2.50 a gallon versus $3.82 a gallon this year.
So, Stephen, you don’t think a 53% increase in the price of Gasoline over 2019 didn’t impact demand???
Happy Holidays,
steve
I think it would be a big incentive for choosing a means of transport that is six times as efficient.
Also notice the decline starts before oil prices spiked.
Not saying it’s all EVs but a general move towards using energy more efficiently. Isn’t it interesting that gasoline consumption was down 10% while the economy still grew this year?
Also to note, as EVs develop a strong battery industry there will be huge benefits to taming the intermittency of renewables with cheap stationary batteries. Much of the science will be transferable. That’s the secondary reason for the development of an electric vehicle industry.
Steve, you have short term economic vision. Remember your economic collapse of Exxon you predicted that you no longer like to talk about. EV production is in it’s infancy and will triple in the next 2 years. BTW, fossil fuel electrical infrastructure doesn’t last forever and fossil fuel is finite.
Don’t let the perfect be the enemy of the good
Whale oil was used as a cheap illuminant, though it gave off a strong odor when burnt and was not very popular. It was replaced in the late 19th century by cheaper, more efficient, and longer-lasting kerosene.
HUNT,
I will agree with you that EVs are in their infancy if you agree that in order to ramp up EV production, we would need to employ ENERGY TOOTH FAIRIES, especially, as fossil fuel production declines.
Where do you think they are going to get the energy, metals, and materials to ramp up EVs?
The ENERGY TOOTH FAIRY?
Happy Holidays,
steve
Steve,
Solar, wind, hydro, nuclear, and perhaps a bit of natural gas and coal, though in a decade or less these last two will be priced out of the market imho.
Dennis,
So, if I am following your logic…
First, I would imagine we agree that Green Energy Wind & Solar = Fossil Fuel Derivatives. If we don’t agree on that, please reread Ripley from Aliens 2 Quote above.
Secondly, If natgas and Coal are going to be priced out of the market, how do we plan to replace worn-out Wind & Solar Units? With Star Trek Replicators?
Lastly, with Natgas prices reaching Nose-bleed levels in the EU & Germany, new Wind Power is now being PRICED OUT OF THE MARKET as more European Wind manufacturers close down due to high “FOSSIL FUEL” energy costs.
So, I’d imagine those whose “IQs Dropped Sharply While I was Away,” would suggest moving wind turbine manufacturing to areas like India where it’s cheaper.
Unfortunately, this is not a solution because HIGH PRICES are going to HIT EVERYONE. That is, if your IQ Hasn’t Dropped Sharply.
Happy Holidays,
steve
Well Steve is right. Solar panels and wind turbines are made in China using coal-sourced power at $0.04/kWh. In the Australian desert under ideal conditions those solar panels produce power at the same cost as diesel at $0.15/kWh. What would happen to the cost of solar panels if we tried to make them using power from solar panels? Solar panels and wind turbines are artefacts from the age of stupidity. And the Chicoms are burning through their coal endowment fast. As the cost of energy goes up we will just get poorer.
David,
Your costs for solar needs to be updated, typically these days in the desert solar produces electricity at about 4 cents per kWhr (US $) or less. Coal is pretty expensive these days, the marginal cost of Chines electricity using imported Australian coal is not close to 4 cents per kWhr.
Chart below has Australian coal cost. In October $427/metric tonne.
Steve,
The energy is provided by wind and solar. The same argument could have been made about oil and natural gas when coal was king. Initially wind and solar are produced with energy from fossil fuel, as the proportion of energy production from wind and solar increases, this is less and less the case. The math is exceeding simple, I am surprised you need this explained.
Scenario below assumes wind and solar continues to grow at the average rate of the past 7 years. By 2050 98% of World energy consumption is from non-hydro renewables, the rest comes from hydro and nuclear power.
steve —
with Natgas prices reaching Nose-bleed levels in the EU
Gas prices are high, but crashing after the panic in September — down about 70%. You tend to be excitable and overreact to short term market movements.
Meanwhile gas consumption is down 20% in Europe. Turns out a lot of that consumption was just waste anyway.
https://ec.europa.eu/eurostat/web/products-eurostat-news/w/ddn-20221220-3
Hey Steve,
Here is what we can agree on. I don’t think using bold print is shouting. What I’m not going to do is use phases like “ENERGY TOOTH FAIRY”. Dennis and Stephen have already given you a lot of push back and I’m more in line with them, than yourself. I remember back in high school the controversy about running out oil and the need for the Alaska pipeline construction.
Personally I feel a lot better about depleting oil reserves now than I did 15 or 50 years ago. When electric transportation was fantasy and no one had even heard of tight shale at The Oil Drum. Once cheap electrical storage is figured out. Exxon will be in a shit load of trouble.
Happy Holidays
Alimbiquated . ” Meanwhile gas consumption is down 20% in Europe. Turns out a lot of that consumption was just waste anyway. ” Waste ?? Is it ?? What do you smoke ??
Yes , what is the cost . ??
100 % Zinc production shutdown .
100 % Nickel production shutdown .
70 % fertiliser production shutdown .
50 % glass production shutdown .
50% aluminium production shutdown .
30 % steel production shutdown .
The largest chemical complex in Europe (BASF ) running at 70 % capacity and announcing it will move entirely to China . The result of BASF capacity utilisation is in the downstream industries . Yeah shortages of medicines , shortage of paints , shortages of printing colors etc high prices of 75 % in associated industries . I warned you specifically in 2019 ” don’t mess with Putin ” and ” don’t dance with the bear ” . So now you are gloating that the EU used 20 % less gas , good , but at ” what price ” ? 25.5 % inflation in Hungary , 23 % inflation in the Baltics and 10.9 % inflation in Germany and EU . There is no free lunch . Now they come up with the stupid EU price cap . EU = hot air . Yeah ” Cutting your nose to spite the face ” . Keep it up because then you will have no face to save .
The bailout bill of Germany alone reaching Euro 1.3 trillion . Uniper will be bailed out in perpetuity or at least the printing presses run out of ink or paper .
Auf Wiedershen , Amigo . Drink the koolaid .
P.S ; Understand the Paretto principle also called 80/20 . I have posted that here several times .
Alim are you prepared for Weimer ? The madness continues .
https://mishtalk.com/economics/eu-imposes-the-worlds-largest-carbon-tax-scheme-inflationary-madness-sets-in
Wake up .
Hole in Head, what are you proposing as an alternative?
My son-in-law works for a UK based company and he has talked to his boss who lives NW of London. He is saving gas by closing off rooms, being in the house with coats and hats and gloves. Using electric space heaters in occupied rooms and the home thermostat set at 60. He is a well paid manager and this is how he has quit wasting natural gas.
Stephen , you are an old timer so you already have the answers but just to refresh your memory , here goes . Peak energy (oil, gas, coal ) is not a problem , it is a predicament . Problems have solutions , predicaments have results . What alternate do I have ? Answer is none . Do we have an alternate to the wind not blowing or the sun not shining ? What is the alternate to breathing ? We must accept that FF were a one time shot provided by nature to mankind and we burnt them to be where we are which is ” Peak Civilization ” . The bank account is now running on empty . As to EU actions they are a cumulative effect of ” politics + stupidity ” . There is no antidote for ” politics + stupidity ” . I am not much of help here , but then why must there be solutions/ alternatives to all matters in the universe ? Many theorems , equations etc in science still remain unsolved . Be well .
Thanks for your reply, HiH, nice summary. I will remain forever a skeptic, the story is untold and no one knows how it will end. It is too complicated to have an obvious and simplistic ending. For sure massive amounts of human misery are in store over the next few decades but I’m not convinced every last thing will fall apart.
15 years for wind you shout in bold letters (a sign of desperation),
and what will oil production be in 15 years?
Hick,
I ain’t shouting… it’s called Highlighting.
Regardless, while it’s true that oil production will continue to decline, Wind Power will also decline. Why? Because it takes a massive amount of Fossil Fuels to extract the materials, manufacture them, and transport and construct the Wind Turbines & Blades on the site.
However, we must continue to replace wind Turbines on a 15-year rotation. Thus, the Wind Power Red Queen Syndrome worsens as we add more Capacity each year.
I don’t have all the answers, but Wind & Solar ain’t it…
steve
Steve,
Solar lasts for 30 years, stuff breaks down, energy is needed to make new stuff, much of the energy can come from solar which will become the cheapest source of energy before long, particularly in high solar resource areas. Solar output has been growing Worldwide at 30% per year, if that rate were to continue a lot of fossil fuel energy could be replaced, the solar produces electricity directly so it is two to three times more exergy than fossil fuel because the losses are far lower, maybe 5 to 10% vs 50 to 66%.
Steve-“I don’t have all the answers, but Wind & Solar ain’t it…”
Lets talk this through just a little more.
Using less energy to do the essential parts of living is the best gain you can hope/work for…
things like higher efficiency ICE’s or better yet EV’s, heat pumps, insulation, and dramatically decreasing the miles traveled for yourself and all the goods and services that you consume, is a start.
Secondly, until the population declines closer to pre-fossil fuel levels (less than 1 billion 150 yrs ago), stop gap measures of energy production like nuclear, solar, wind, hydro, biomass, geothermal are all going to be utilized to the maximum that people can afford to deploy. At best, I think it will be a managed retreat from the condition of extreme fossil solar energy overshoot of the past 150 yrs. Some people are a little more optimistic on that. We shall see.
If your region or country does have options, it comes down to which source gives that most energy/$ invested over 30 years. 30 years because that is a standard investment timeframe used by the utilities of the world, and creditors. And is roughly one generation.
You don’t think much of wind (although your opinion is baked in a big sauce of sloppy bias), but for some regions that is by far the best primary option.
Other places have no viable wind, but may have other viable options.
Many places will have the luxury of going after a combination of options.
Some places will have the capability to actually produce much more energy than the local population utilizes. Put your factory there, if you have the foresight.
For planning purposes, peak oil is far in the rear view mirror folks.
btw- as an example Iowa gets something like 60% of its annual electricity from wind. It has only scratched the surface on capacity, and will have the capability to deploy a second and probably third round of turbines. Better late than never, for their citizens.
In the long term it is either sodium-cooled plutonium breeder reactors or horse-drawn carts.
“In the long term it is either sodium-cooled plutonium breeder reactors or horse-drawn carts.”
In between now and the long term (say for the next 5 decades anyway), people are going to feel very fortunate who have solar or wind, etc to supplement the dwindling fossil solar energy they now have in relative abundance.
Not a complicated concept.
In the long term, we’re all dead.
I’m not an expert in wind at all but what I’m finding is an average 20 year lifespan for wind turbines with information provided by the EPA. The history of wind turbines doesn’t allow an accurate number as most are under this age and the pace of innovation is high. Obviously with so many moving parts they will not last as long as a PV panel for instance.
https://energyfollower.com/how-long-do-wind-turbines-last/
And a shale well lasts how long again? Five years?
Stephen,
If we assume the average 2020 Permian well reaches end of life at 19 bo/d (crude oil output), it is about 13.1 years, if we assume 15 bo/d for end of life (an oil pro suggested this was a better estimate at today’s oil price) the life of the average 2020 Permian well is extended to 14.9 years. By 2020 Permian well I mean the average of the Permian wells that started production between Jan 1 and Dec 31, 2020. Note that I use the 19 bo/d estimate to be conservative and because an oil pro had suggested the 20 bo/d estimate in the past. This is an extremely conservative estimate unless oil prices fall to under $35/bo in 2022$, which seems unlikely over the next 8 years imho.
I agree that nuclear power is the only realistic option for long term maintenance of our industrial/technological civilization, but sodium-cooled plutonium breeder reactors and fusion power both suffer from a lack of developed reliable commercial units. That takes time (experience) and some luck, and we may not have enough of either.
Another option would be separating uranium from seawater to use in commercially proven nuclear reactors. Unfortunately I am not aware of any work going on in this area although years ago the Japanese did some investigation and then shelved it.
It is probably safe to guess that this source would be considerably more expensive than mined uranium which is why commercial interests are not spending money on it
but when mined uranium runs out in 80 to 100 years at present rates of consumption, and much sooner if nuclear is expanded to replace fossil fuel derived energy then ????
I read a puff piece from Larfarge about how they supplied 134,000 cu yd of concrete to the construction of a 300 MW wind farm in Ohio. Doing the math gives in excess of 6200 truck loads.
Typically you can only get 10 yd in a cement truck so twice that actually
In one breath all the cornucopians state how solar is already cheaper than all the fossil fuels and how renewables will be able to do everything currently done with fossil fuels, yet all seem to forget that everything gets built with fossil fuels not renewables. We run devices with electricity, we make them with oil, coal and gas.
New mines in desert areas are putting in some solar to reduce costs, but none of them are planning to run the entire operation off solar, why not?? The reason being that they get subsidies to include solar, plus the ESG tick of approval, and use the solar during part of the day when it’s sunny to reduce a bit of diesel use in remote generators.
Running a mining operation off just solar would require billions of dollars in batteries, a much larger capacity of solar panels than is needed just for the mine (because of energy inefficiencies charging then electricity back out of batteries). It would cost billions to do this for even moderate mines. That’s just the processing part, the digging out of the ground and waste removal still uses diesel, with no plans anywhere to use an alternative…
Of course what’s also overlooked by most is the decreasing ore grades meaning we need even more energy to produce the same amount of any mineral mined. The renewable believers NEVER take this into account, nor the minor detail of all the extra millions to billions of tonnes of mined metals we will need to go close to being able to run a modern civilization on renewables.
Take any mid sized mine as an example, today they run on perhaps 6-8 generators of 2-3Mw capacity, using thousands of litres of diesel per day. A new mine with both solar and diesel back up will still need all those generators, but will also need hundreds to thousands of tonnes of solar panels, their supports and all the wiring in excess of just the generators. A new mine being set up ‘green’ uses a lot more energy in it’s build to start with!!
Before someone comes up with the usual ‘what’s the answer’ if green isn’t so green, the reply from me will be there is no answer, civilization is toast because the current lifestyle is clearly not sustainable in any shape, manner or form. Collapse is the most likely outcome, right back to the hunter gatherer stage eventually if there are any humans left. The only question is how long it will take. Probably not in my lifetime, but possible in my grand children’s lifetime..
https://oilprice.com/Energy/Energy-General/The-Global-Economy-Is-Finally-Realizing-That-Fossil-Fuels-Are-Finite.html
Gail says renewables go to fossil fuels and will end with them
Gail is a Cabbage For Christ
Her actuary skills are there, but ideologically crippled.
Steve —
Your silly “red queen” theory of wind power applies to any power plant, and yet the electricity industry has been chugging along just fine for more than a century.
At this point you’re just throwing things against the wall to see what sticks.
Interesting analysis at link below, especially the Oil and Gas market sections
https://blog.gorozen.com/blog/market-overview-q3-2022
“However, we believe OPEC’s current output, at 29.9 mm b/d, represents its maximum capacity….weak oil demand has given the Saudis cover to slow production once again. We continue to believe the real reason they slowed production is field exhaustion.”
‘With demand now pushed up against total pumping capability, the only thing keeping inventories from continuing their multi-year plunge has been the 1.5 mm b/d of coordinated releases from US, European, and Japanese strategic petroleum reserves.’
‘Inventories are about to fall below the levels seen back in 2007, just before oil surged to over $145 per barrel. A price spike to well above $200 per barrel is becoming more likely over the next six months.’
Yes, it was just a couple of months ago I (among others here) was noting that the big OPEC producers were near their all time highs and wondering if they could sustain that level and if the economy would stay strong long enough to really test them. One way or another, whether due to the economy or their own inability to produce at that level, it wasn’t long before they were back down from those high production levels.
I’m not convinced oil is going to $200, only because I see the economy turning down strongly in 2023, notwithstanding any attempted opening up in China. Still, what do I know, could easily be wrong.
https://www.rystadenergy.com/news/russian-upstream-investments-set-to-plunge-by-15-billion-this-year-as-sanctions-o
https://www.dailymail.co.uk/news/article-11558539/Russian-pipe-takes-gas-Europe-explodes-enormous-fireball-killing-three.html
Another Russia to Europe pipeline blows up.
Oil infrastructure is defenseless.
Resilience posted a good one. It seems no one has posted the link yet.
Peak US Oil Production Looms as the Domestic Shale Boom Ends
It appears that the U.S. fracking boom is ending far earlier than many industry experts and CEOs predicted. After an understandable dip in 2020 due to the pandemic, oil production still has not regained the record levels achieved in 2019, and predictions that the industry would set new records this year have not materialized, despite 2022’s high oil prices.
In late 2018, DeSmog first raised the alarm about the reality that the U.S. shale industry was likely to hit peak production much sooner than most experts expected.
At the time and since, the oil industry has continually promised big things for the future of U.S. shale oil production.
In 2017, Inside Energy reported that the governor of North Dakota was aiming to have the Bakken shale play produce 2 million barrels per day. In that same article an analyst for S&P Global Platts predicted that even in 2027 the Bakken would be producing 1.5 million barrels per day. The Bakken peaked at 1.5 million barrels per day in 2019 but has yet to return to that level.
Similarly, a 2019 article in industry publication oilprice.com noted that “there is a consensus in the market that the Permian Basin will be the dominant part of 2040 US oil supply.” In that article, industry analysts Rystad predicted the Permian could be producing 7.5 million barrels per day in 2040.
And in 2020, Rystad made optimistic predictions for the future of U.S. shale oil at its Energy 2020 Americas Virtual Annual Summit.
Very long and very good article. This is only a small portion of it. Click on headline to read.
For US tight oil the scenario below shows what might happen if the tight oil completion rate remains at the Sept 2022 level until Jan 2030. For the Permian basin the scenario is consistent with an 8.5 year drilling inventory at the current rate of completion.
Tight oil output peaks in 2030 at 9396 kb/d for this scenario.
Dennis
What is the quality of the Permian wells in the model. Are they constant from 2022 to 2030. The impression I get from Novi labs is the quality of 2022 wells is lower than 2021 wells. What happens if there is an average 5% decline per year in well quality going forward?
The decline could be the result of needing to drill a mix of Tier 1 and Tier 2 wells?
Ovi,
I use the Average 2020 Permian well profile in my Permian model and assume the well profile is unchanged from 2020 to 2030, in my opinion it is too early to judge the quality of 2022 wells.
Consider the Bakken/Three Forks which is more mature than the Permian basin by about 4 years (and has a mean TRR estimate by the USGS that is more than 6 times smaller than the Permian basin), based on Novilabs data from their October 2022 report
https://novilabs.com/resources/state-of-shale-oil-gas-q3-2022/
there is little evidence of decreasing well productivity in any major basin (Permian, Bakken, Niobrara and Eagle Ford) except the Eagle Ford from 2016 to 2021, most basins have been relatively flat after increases from 2013 to 2016. Chart below has well productivity normalized for lateral length so it is cumulative output at 12 months per 1000 feet of lateral.
The average 2020 Permian well profile used in my Permian model is below the coefficients for the hyperbolic model where q is qi and d is Di, the first month output is 12962 barrels per month and hyperbilic model is used for months 22 to 91 (I use mid month in model so month one is month 0.5 and month 91 is month 90.5 (subtract 0.5 from month). For months 1 to 21 I use the data from Novilabs for my model and this data is used to estimate the hyperbolic model. After month 91, I assume exponential terminal decline at 12.5% per year and well is shut in at month 157 at 19 bo/d output. EUR is 436 kbo over 157 months from first flow (13.1 years).
Ovi,
The Permian well profile is assumed to be unchanged from 2020 to 2030. Note that to my eye the 2022 wells look to be about the same as the average 2020 well, but the early data is often revised so I don ‘t think we can accurately assess the productivity of the average 2022 well at this time (too early to assess).
The chart (in comment after this) looks at Bakken well profiles from all sub basins, not a lot of change from 2018 to 2021 for the average Bakken/Three Forks well in North Dakota. It is doubtful we see a 5% decline in average well productivity before 2030 at current drilling rates. If there is some decrease such as the decrease we are seeing in the Eagle Ford, completion rates could potentially increase to offset the decrease in individual well productivity. Note that I have been predicting a decline in average well productivity since 2012, each year I move the date one year forward, so far with the exception of the central Eagle Ford subbasin (which had increasing well productivity from 2013 to 2017 which then returned to the 2013 level by 2021) well productivity has either increased or remained flat year after year. Eventually average well productivity will decrease, I will adjust my models after I have seen this occur.
I was just rechecking my Eagle Ford model and I use the average well profile from 2017 for wells after that date, the model well profiles have not been updated for 5 years (my focus has been on the Permian basin).
If we assume Eagle Ford wells start to decrease in Productivity starting in Jan 2023 (note that the average 2021 well is more productive than the 2017 well that I use from 2017 to 2022) at 2% per year the scenario changes very slightly as shown below. As we currently see little evidence of decreased average well productivity in the major tight oil plays except the Eagle Ford, which has mostly seen increased average well productivity from 2017 to 2021 with 2022 productivity falling back to the 2020 level, it does not make sense to include future well productivity decreases until they occur. Assuming it is about to occur as I have done for the past 10 years simply leads to underestimates of future output.
Bakken cumulative output from Novilabs
https://novilabs.com/blog/north-dakota-update-through-july-2022/
Dennis
Thanks for all your work. Looking at the above chart for the Permian, if monthly completions stay the same going forward, yearly increases will get smaller. Not clear to me what higher WTI prices might do. I think drilling might increase a bit but I think more would go to investors.
Ovi,
My pleasure.
Yes a constant completion rate results in a gradually decreasing rate of increase due to higher legacy decline rates as more wells are added. In some of my previous scenarios the completion rate gradually increased from 430 to 600 over the 2023 to 2028 period and the increased completion rate offset this effect to some degree so the rate of increase was relatively linear over the 2023 to 2028 period. It is not clear if there will be a future increase in completion rate, for now it seems to be relatively flat in the Permian, higher oil prices might change things, difficult to predict, you may be right that most of the profit will be returned to shareholders.
One thing that tight oil producers may eventually realize is that demand for oil may stop increasing in the future or at least increase a slower rate. Eventually we reach the point where oil prices start to fall if demand grows more slowly than supply. At that point the oil that is in the ground may be stranded along with any uncompleted wells and much of the existing infrastructure. If oil prices rise, oil companies would be wise to take advantage of the opportunity and produce as much as they believe the market can bear without crashing the price of oil, leaving oil undeveloped may be a missed opportunity. It would be better for the environment to leave the oil in the ground and perhaps they are trying to combat climate change, this would be something new.
Ovi,
I have read that the difference between tier one and tier two wells is not that significant.
See
https://jpt.spe.org/whats-difference-between-tier-1-and-tier-2-not-much
‘The world should be worried’: Saudi Aramco — the world’s largest oil producer — issued a dire warning over ‘extremely low’ capacity.
The global oil market remains tight according to Saudi Aramco, the largest oil producer in the world. And that does not bode well for a world that still relies heavily on fossil fuels.
“Today there is spare capacity that is extremely low,” Saudi Aramco CEO Amin Nasser said at a recent conference in London. “If China opens up, [the] economy starts improving or the aviation industry starts asking for more jet fuel, you will erode this spare capacity.”
Nasser warns that oil prices could quickly spike — again.
“When you erode that spare capacity the world should be worried. There will be no space for any hiccup — any interruption, any unforeseen events anywhere around the world.”
—Yeah, that’s what happens when world oil production peaks.—
Folks, read this article. There is far more than I can post here. Helms says drillers are moving out of core areas into other counties. He says their production will rise but does not say what will happen in the core counties.
North Dakota oil production remains flat in October; blizzard to impact December production Bold mine.
orth Dakota oil production in October remained flat compared to September, while natural gas production decreased by 1%, the state Department of Mineral Resources reported Monday.
Meanwhile, state officials expect last week’s blizzard to cut into December production.
October oil production was 1.120 million barrels per day, and there was “really no measurable change whatsoever” from the previous month, according to state Mineral Resources Director Lynn Helms. The state’s oil figures lag two months as officials collect and analyze data from energy companies.
Helms early this year said oil companies consider the Bakken oil patch to be “mature,” which means low rates of production increases compared to other areas such as the Permian Basin of Texas and New Mexico, where U.S. oil producers are more focused on growing their operations. New Mexico surpassed North Dakota last year as the nation’s second-biggest oil producer.
SNIP
Mineral Resources is expecting a significant drop in December oil production due to last week’s blizzard. Officials anticipate it will take a few weeks for the oil patch to recover.
“Crude oil trucks were not moving, pumpers weren’t on the road, tanks filled up and wells were shut down,” Helms said.
The industry is hoping to see production rebound this week. But the Christmas holiday week and the arctic air blanketing the state are going to set crews back, Helms said, adding that a significant amount of production will stay offline until after New Year’s.
Bakken model assuming well profile is unchanged from 2019 to 2030 and then average well productivity falls by 4% per year from 2031 to 2037. Notice that model underestimates output in 2021 and 2022, for October 2022 model output is estimated at 941 kb/d and NDIC reports 1079 kb/d for North Dakota Bakken/Three Forks output in October 2022 (model is about 13% too low).
Dennis, the idea that Bakken production will remain flat, at current levels, until 2030 is not supported by the facts. Helms realizes that the Bakken is a very mature field. The sweet spots are gone, and the drillers are moving out into much lower-producing areas. That means production per well will start to fall, and Bakken production will start to fall. Helms says that the Bakken is mature and says he expects New Mexico will soon follow. I tend to agree. More from the article:
Helms early this year said oil companies consider the Bakken oil patch to be “mature,” which means low rates of production increases compared to other areas such as the Permian Basin of Texas and New Mexico, where U.S. oil producers are more focused on growing their operations. New Mexico surpassed North Dakota last year as the nation’s second-biggest oil producer.
Helms on Monday noted that New Mexico’s production saw a 4% increase and that state continues to see “production increases like we used to have three or four years ago.” New Mexico’s oilfield patch eventually will mature like the Bakken has, he said.
North Dakota production is starting to move out of the Bakken’s core area, and into so-called “Tier Two” areas. Divide and Burke counties saw significant production increases in October, and “We may be seeing the beginning of a trend,” Helms said.
Yeah, and that trend is down.
Ron,
The trend that Helms means is that core county output will fall while non-core county output will rise.
The model I used assumes the completion rate rises from July’s rate of about 60 completions per month to 70 per month. I noticed there is a big difference between the Novilabs completion data and the DPR DUC spreadsheet estimate for Bakken completions in 2020 to 2022, the annual average for 2019 for the two sets of data is very close for completions in the Bakken, so I decided to try the DPR data for Bakken completions for 2020, 2021, and 2022. For the past 12 months the average annual completion rate has been about 74 per month so I assume the completion rate falls to this level from the reported 81 completions in November in DUC spreadsheet and then remains at that level. Scenario below, data match for October 2022 NDIC data for Bakken and model is quite close, though for most of 2021 and 2022 the model is about 100 kb/d below NDIC data.
Nobody know what the future completion rate will be, this is simply a guess.
For the past 12 months the average annual completion rate has been about 74 per month so I assume the completion rate falls to this level from the reported 81 completions in November.
Dennis, the 81 completions were for September, not November.
North Dakota Department of Mineral Resources December Director’s Cut October 2022 Production Numbers
Completed
September 81 (Preliminary)
October 54 (Preliminary)
November 58 (Preliminary)
The Bakken is a very mature field. All the sweet spots are drilled up and the rigs are now moving out into lesser-producing areas. Production will start to drop very soon.
End of story.
Ron,
The NDIC numbers for completions are often revised later, I used the spreadsheet linked below and used Bakken completions. For the three months you listed the DPR DUC spreadsheet has 85, 83, and 81 completions.
https://www.eia.gov/petroleum/drilling/xls/duc-data.xlsx
As of July 2022 about 96% of North Dakota Bakken/Three Forks output came from Dunn, McKenzie, Mountrail, and Williams county.
We will see how fast production drops, I think it will be relatively gradual through 2030.
So far there is very little evidence that well productivity has dropped significantly.
The chart below has 2017 to 2022 well profiles (cumulative output vs month from first flow) for the 4 core counties of the ND Bakken/TF. Not a lot of indication yet of a productivity drop.
And the total well costs of drilling and completing are way too high relative to the commodity prices and we see this by reduced completions.
LTO Survivor,
In the Permian basin, the completion rate has been around 430 per month for the past 6 to 8 months, so it is not clear that rising costs have resulted in fewer completions. I agree that higher prices and/or lower costs might increase the completion rate. For the Bakken there may be fewer completions because investment in the Permian basin may be more attractive or they may have limited drilling inventory that they are trying to preserve.
Perhaps we will see the completion rate in the Permian basin fall as you predict. According tho the EIA the floowing list gives Permian monthly completions from Jan to Nov 2022:
410
429
450
436
437
439
439
435
430
442
435
The average rate since March 2022 has been about 438 completions per month, with the rate mostly bouncing around in the 430 to 442 range for the past 8 months.
On the facts, output is trending up a bit over the Jan to October period for North Dakota Bakken/TF, I dropped the data from April as this makes the increase appear steeper (that data point is an outlier).
So only Jan-March and May to October data is included (9 data points). The line on the chart is the OLS trend for the nine data points.
A longer term estimate of the decline from Jan 2021 to October 2022 (again dropping outlier from April 2022) gives an annual decline rate of 14 kb/d, my scenario is slightly lower than this at about 11 kb/d from Jan 2023 to Jan 2031 (simply using endpoints in this case and then dividing by 8 years).
That is the strangest chart I have ever seen. Why is April’s data missing? The below chart, with the same data except I include April, is how charts are supposed to look. 🤣 And I show the Average exactly as it is, declining. Your chart shows the data increasing. It is not increasing, Dennis. Do the 12-month average, and you will get the exact decline rate my chart shows.
Dennis, your charts are designed to obscure, not to enlighten.
Click on the chart to enlarge.
Ron,
I am doing a trend line using ordinary least squares (OLS) regression, not a 12 month average. When the Data point from April is included it makes the slope more positive.
Chart below, the annual rate of increase is 50 kb/d when we do an OLS regression with the April data point included. The previous chart (with the April outlier dropped) has an annual rate of increase of 11 kb/d which in my view is a better estimate.
For an understanding of how to fit a trendline to a set of data see
https://en.wikipedia.org/wiki/Ordinary_least_squares
I am using NDIC Bakken data from
https://www.dmr.nd.gov/oilgas/stats/historicalbakkenoilstats.pdf
rather than the all North Dakota data you are using.
I see including the April data pulled the left side of your line down quite a bir. Well hell, just wait until you get the December data. That will flip your line like a see-saw.
Which means… It would be a lot more accurate just to use the 12 month average to get a better trend.
Gentlemen, Please just aknowledge the limitations of your (and oneanothers’) mathematical methods. These limitations are shown here spectacularly:
– Ron: “It’s going down!”
– Dennis: “It’s going up!”
I think it makes hardly any sense to just look at 12 months when you have +10 years of data.
As far as the Bakken is concerned, I believe they will face a downturn, unless they come up with some new technique to ameliorate their processes.
I think it makes hardly any sense to just look at 12 months when you have +10 years of data.
And just what makes you think we are both only looking at 12 months of data? Quite obviously you have not been following this debate very long. It has been raging for years. And we both enjoy it, otherwise we would not do it. You just saw a couple of posts and then put in your two cents worth. And as expected, that two cents worth made no sense whatsoever.
Verwimp,
The Bakken model is based on data from 2004 to 2022, so 18 years of data. The future completion rate is unknown, if it is 30 wells per month, output will be different from 100 wells per month, recently (past 7 months) the average completion rate has been around 76 per month for the Bakken so I chose something close to that (74 per month) for my model. It might be higher or lower than this, we don’t know.
China’s open; ambulances likely burning lots of diesel.
“Chinese oil demand could rise by 1 million barrels per day on average from 2022 to 2023.”
—Goldman Sachs
https://www.reuters.com/business/energy/goldman-sachs-says-chinas-reopening-could-lift-oil-by-15bbl-2022-12-12/
They’ll have chaos the next 2 months – with a lot of people trying a self lockdown due to corona panic.
They preached 2 years of corona is absolute deadly – and then opened with almost no propaganda before. That won’t work good.
I think this scientist is right – he wrot the big towns will have corona one month long. Then the new year celebrations will bring it to all villages for the 2nd wave, and the returners to the one in the cities that didn’t had it already.
There WILL be chaos, even when omicron is mild. The problem is the speed, the overloaded medical system and the propaganda.
Aftere this, China will reopen with full force. Or even harder – all these missed vacations and trips will be done. I’ve seen it here, chrismas markets made good money even when normal spending was dampened by inflation shock.
PS: No goose this chrismas – it’s not worth this price.
It is basically March 2020 in China. There will still be a lot of Covid around all next year at a minimum. Possible new variants worldwide from this scenario also, giant weakly immuned populace is likely to produce some humdinger variants. I wouldn’t expect China to recover until Spring 2024 at the earliest
HHH/Anybody who understands bond spreds
Two weeks ago, the 10 yr 2yr spread was 80 basis points. Today it is 54 basis points.
Does this imply there is a lower chance of the US moving into a recession and more likely a slow down in the economy?
It was inverted by 80 basis points two weeks ago. Short term yields are starting to fall faster than the long term yields. Some call this a bear steepening of the yield curve.
It’s confirming we are going into recession. People are piling back into bonds for safety. Driving yields lower.
Deflationary shock on its way in 2023.
The inversion of the yield curve is saying more people are betting against the FED and are betting heavily that yields go lower. Not remain high or at current level for prolonged period of time.
If oil prices were going to remain elevated or go higher like $100 or higher. I’d expect bond yields to reflect that inflation is here to stay or will be sticky. That’s not what bond yields are saying.
https://www.youtube.com/watch?v=wRsopaUFjgI – Jeff Snider from Eurodollar.University.
HHH,
I’ve been reading up on your EURODOLLAR stuff. I used to 1/2 ignore it because I thought you were talking about the EURO vs the DOLLLAR.
The EURODOLLAR actually means “Offshore” US Denominated ledger entry.
EURO Dollars aren’t created by the Central Bank they are created outside the USA.
It’s original purpose is simple,
In a global economy it is implausible (Triffin’s dilemna) to mail physical US dollars and or Gold around the world in a reasonable timeframe ( It could also be stolen and who pays the shipping costs? ).
So it is a distributed real time ledger system. And it is not controlled by the Federal Reserve. And there is no physical representation other than entries in ledgers around the world.
According to this guy the Federal Reserve is basically impotent relative to the Eurodollar,
it is the key to understanding the global monetary system.
HHH
I don’t get a “bear steepening curve”. The curve/slope is shallowing from 80 basis points to 54. In other words it is slowing moving toward a more normal growth scenario.
Yield curve is going to steepen and un-invert but not by things getting better. It’s the exact opposite of what we want. Short term rates are going to fall below long term rates. But long term rates are also going to be falling. It’s just what happens in a recession.
HHH , hi . What I am watching is the Target 2 imbalances and the fragmentation of the interest rates between Italy and German debt . Also of secondary interest for me is the Eurodollar flows which I learnt from you . For me the Target 2 is going to be the tipping point for EU debt and will be the first to hit the DE ( Devolped Economies ) . Eurodollar flows are hitting the EM’s ( Emerging Markets ) real big . Practically speaking the whole of Latin America and Africa are now suffering the Eurodollar issue . As I look at the DE the first domino will be either UK or NZ both will have a currency crisis and then this will move to the core . The cookie crumbles at the edges and the fish rots from the head down . Thanks for educating me .
Copy / paste .
The BIS released a report on eurodollar/eurocurrencies a while ago, page 67 in:
https://www.bis.org/publ/qtrpdf/r_qt2212.pdf
There is a notional amount of 100 trillion € of euro-dollar and other euro-currency derivatives, 80 trillions are eurodollars. The actual present market value of these derivatives is probably around a couple of % of this amount, in that sense not much of a problem.
In this case “euro” has nothing to do with the currency called euro. Euro-dollars are just off-shore created $, outside the jurisdiction of the US, you can do the same with yen or the currency called euro to get euro-yens or euro-euros. The euro dollar system was started in the 50ies. It’s been the main global supplier of money for a long time. 90% of international trade/investment is made through euro-currencies. According to Jeff Snider these mentioned derivatives are essential for creating money in the eurodollar system:
https://www.youtube.com/watch?v=dm0fhu5rM_s&t=1020s
Jeff would even like to include these derivatives in what we call money, I would agree. A larger fraction of a new debt will be newly created money than from a notional amount of a new deriviative. But some money is likey created as a consequence of newly created derivitives in the eurodollar system. This is what Jeff claims.
The eurodollar system may now meet increasing troubles with the raised interest rates and the strong dollar. Something could break.
I found this summary of the eurodollar system, originally posted on ZH, for some reason it had disappeared there:
https://t1mproject.medium.com/down-the-rabbit-hole-the-eurodollar-market-is-the-matrix-behind-it-all-a7a054dd4b0f
I have long maintained that before we see lines at the pump we will have a financial collapse of massive proportions .
Russian oil exports fall by 11% for Dec 1-20 -Kommersant
MOSCOW, Dec 21 (Reuters) – Russian oil exports fell by 11% for Dec. 1-20 compared to the previous month, after the European Union’s embargo on Russian oil came into force, the Kommersant daily reported on Wednesday, citing unidentified sources familiar with the situation.
Russia’s exports to non-CIS countries – covering both pipeline and sea-borne shipments – totalled around 560,000 tonnes per day during the period, Kommersant reported.
The EU’s embargo on Russian oil purchases came into effect on Dec. 5 in a move Brussels says will cut the bloc’s imports of Russian oil by 90%. Before Russia sent tens of thousands of troops into Ukraine in February, Europe bought around half of all Russia’s oil exports.
Ovi,
You asked earlier about a scenario with well productivity decreasing by 5% annually. I investigated this a bit further and if we assume productivity decline starts in October 2022 at an annual rate of 2% per year (for a scenario with a completion rate of 429 wells per month) this would be consistent with the USGS F95 TRR estimate of 45 Gb for the Permian basin. The F95 estimate, for those not familiar with this terminology, is a lower bound TRR estimate which the USGS expects has about a 95% probability of being below the actual TRR. In my analysis I already restrict the likely resource to ony 55 Gb of the 75 Gb mean estimate of the USGS for Permian TRR. With no productivity decline and the well spacing and lateral length I have assumed the no productivity decrease scenario has a TRR of about 50 Gb, the rate of average annual well productivity decrease I have assumed (2%/year) reduces the TRR to 45 Gb.
Below I present scenarios with fewer wells completed (82k vs 121k for full TRR) due to profitability at my assumed $80/bo maximum oil price with declining oil prices after 2031. The no average well productivity decrease (average new well EUR constant from 2020 to 2030) scenario has a URR of 33.3 Gb and the 2% annual productivity decrease (EUR decrease by 2% each year) scenario (for months when 429 wells are completed) has a URR of 31.8 Gb.
The two Permian scenarios are compared in the chart below, my guess is the higher of these two will be closer to reality for the assumed completion rate of these scenarios (which is identical for both scenarios.) In addition I expect both of these scenarios are highly likely to be too low, especially if oil prices rise to over $90/bo as many predict. The completion rate in a high oil price scenario is unlikely to remain constant at 429 wells completed per month as these scenarios assume.
Dennis
Thanks for looking into the impact of decreasing annual productivity of 2% on URR.
Glad to see that your model shows there is not much of an impact on overall URR. I agree the red graph is more realistic.
My sense from looking at the rig count and completions from the DPR report for the Permian for the last six months is that Permian operators have settled into a steady routine. This makes me think that your constant monthly completion schedule is the correct way to model future production from the Permian, until some information emerges to change that assumption.
Ovi,
You’re welcome.
Note that most of my scenarios assume oil prices rise to $100/bo in 2022$ and remain at that level from 2023 to 2030. I agree over the short term a constant completion rate may be correct, but it seems unlikely that this will be a correct scenario for 2023 to 2030 unless oil prices remain at current levels longer term (8 years or so). From my perspective the constant completion rate scenario for the Permian basin would be a lower bound, an F95 scenario if you like. My best guess remains that the completion rate gradually rises to 600 completions per month over the Jan 2023 to June 2027 period and then stabilizes there for a year or two before declining.
I could of course be wrong as has been consistently the case in the past.
Have a great holiday!
Ovi,
Looking at past 6 months the average WTI spot price has been about $95/b, but monthly average prices have been falling and the most recent weekly average WTI price was about $75/bo. I doubt oil prices remain this low, but I never get oil prices right,
Permian completions and WTI oil price
I seldom ever get oil prices wrong because I seldom ever predict oil prices. But I am going to make an exception today. I am predicting oil prices in 2023 will average higher than they did in 2022. I expect prices to move above $100 a barrel by next summer. But if they don’t reach that point, prices will still be higher next year than this year.
Ovi,
Note that the annual rate of decrease in new well productivity for my models (when I make such an assumption) is proportional to the completion rate. In simple terms if a 429 new well per month completion rate held constant over 12 months causes a 2% decrease in new well productivity a doubling of the completion rate to 858 new wells per month would increase the annual rate of decrease in new well productivity to 4% per year. Likewise a lower completion rate of 214.5 wells per month (average for year) would lead to an annual rate of decrease in new well EUR of 1% per year.
Winter Storm, Sub-Zero Temperatures Hammer North Dakota Oil, Natural Gas Production
A winter storm last week shut in an estimated 300,000-400,000 b/d of oil production in North Dakota, and producers now must contend with bone-chilling temperatures as they attempt to restart operations, according to the state’s Department of Mineral Resources (DMR)
SNIP
“Once a well goes down in this kind of weather, it can be extremely challenging to get that pumping unit up and running again,” Helms said. He addressed reporters during a press conference to discuss October production figures.
North Dakota’s natural gas production averaged 3.13 Bcf/d in October, down 1% from September. The gas capture rate improved to 95% from 94%, reflecting industry efforts to minimize routine flaring.
The statewide volume of flared gas fell by 7.8 MMcf/d from September to average 149.8 MMcf/d in October.
SNIP
North Dakota’s drilling rig count stood at 43 as of Monday, compared to monthly tallies of 45, 43 and 40 for September, October and November, respectively.
“The drilling rig count has stalled in the low to mid-forties with a gradual increase expected over the next two years,” Helms said.
He added that, “drilling activity is expected to slowly increase with operators maintaining a permit inventory of approximately 12 months.”
North Dakota’s drilled but uncompleted well count stood at 489 as of October, up from 474 in September.
Completions totaled 58 in November, compared to 54 in October and 81 in September, based on preliminary DMR estimates.
Helms highlighted that the number of active completion crews had risen to 20 just before the blizzard earlier this month, “but there was no completion activity last week and very little is expected this week.”
How Will these Freezing Temperatures Affect The Permian and Eagle Ford
Ovi,
I doubt this is much of a problem
For midland forecast see
https://weather.com/weather/tenday/l/Midland TX?canonicalCityId=15abdda2bdd355e04515b1772070fb52a23d5eb1ff3962a19b65a49bc2883537
Overnight low temps at about 13 F, warms up to the 60s next week.
Lea County does not look good
I read these projections and models with amazement. I may be out of synch.
1. Ghawar, the Arabian granddaddy, is over 70 years old. In 1993, its water cut was 25%. In 2003, it was 33%. After that, we’re guessing. What is known is that conventional reservoirs of oil usually decline dramatically at about the 50% mark. Some put the water cut today at 50-60%. It is in . . . terminal decline.
2. We should stop and think just how desperate the United States has become: we’re getting most of our oil from tombstone rock–black shale interbedded variously by carbonates like limestone or strontium. For every barrel of oil that is produced in the North Delaware (the New Mexico side), about four barrels of water has to be disposed of in an arid desert, which usually means transporting it down into Texas where limitations on saltwater disposal wells are not so stringent.
3. The only commercial whale in the last decade has been the Exxon-Hess Guyana field, which is so gassy they had to manufacture new storage ships for production.
4. These shale basins are merely a very small and exceptionally transitory way station toward the peak oil that Mr. Simmons talked about in 2005. As it happened, Matt Simmons was probably right on the money, were it not for the interjection of the shale basins. This is the equivalent of getting blood out of a turnip.
5. The new Russian finds were Sakhalin-1 and S-2, on an island. Otherwise, the big finds were in permafrost that is melting. In addition, giant sinkholes are occurring in the shadow of the Siberian Traps. This was a disaster in the making . . . before the Ukraine invasion.
I’m not out to blast models, I sort of like looking at them, but when you look at where the oil comes from–Russia, OPEC, U.S.–production is not going to follow a linear progression, and past history doesn’t remotely define the future. At the risk of being labeled a pessimist, we are on the precipice of the cliff. And nobody is ready. When Ghawar goes into steep decline–where I suspect it is now–then we’re going to experience what it’s like to revert to the old models–the ones that show sharp deterioration that take your breath away.
I agree Gerry. I follow world production, I believe, closer than anyone on this list. Well, perhaps everyone except you. It is just so goddamn obvious that world crude oil production has peaked. Only the stone-ass blind can deny it. People keep looking at the Permian. What the hell for? The Permian is just a bit player in this drama. World production is the story, not the Permian. And world crude oil production obviously peaked in 2018.End of story.
I totally agree Gerry. I just got off the phone with an established private Permian Operator and he was saying that his new well’s IP rates in the core are roughly 1/2 the original rates in the core. His last statement to me on the phone was “the pressure is depleted all over the Permian and the Net Present Value of the wells at current prices represent 1.65:1 for every dollar spent. That doesn’t sound like a great business model to me. This is the real world in real time.
I am not a pessimist by nature just a realist.
Mike,
Thanks for that information, LTO survivor recently said something about $11 MM per well, perhaps that is a different basin or maybe different lateral length or depth, in investor presentations they claim their capital costs are about $8 MM per well, there’s probably a ton of variability as each well is unique.
LTO Survivor,
What kind of annualized rate of return do you target? A 65% ROI sounds pretty good if that is the company’s average rate of return.
Of your capital or on your capital?
LTO Survivor,
My mistake sorry. if the NPV of a 10 million dollar well is 16.5 million and those cash future cash flows occur over 15 year period, then the annual real rate of return is roughly 3.4%/year. I agree this is too low a rate of return for such a risky investment. Higher oil prices will be needed for continued investment.
My guess is that you would be looking for at least a 10% annual real rate of return (or perhaps 15%), though you may use other measures such as ROIC which accounts for interest, taxes, etc for a business.
Rats! I sure wish DC’s ARR calculations based on 1.65:1 ROI would have stayed up, I could have had some fun with that. It sorta explains why he believes that the Permian tight oil sector can maintain current drilling/completion rates from cash flow, pay dividends, service debt, pay increase lease operating expenses associated with produced water “happenings,” cope with severely declining well productivity AND, drum roll, please…pay “all Permian debt back at YE 2024.”
Rats.
Mike,
The debt can be paid back by June 2025 at the prices I assumed ($100/bo, for crude, $35/b for NGL and $4/MCF for natural gas. At lower prices (say $60/b for crude, and $21/b for NGL, natural gas remains at $4/MCF, it takes until 2031 to pay back debt (assuming 25% of cash flow goes back to shareholders as dividends or share buybacks. If oil price is at $75/b from 2023 to 2026 with NGL at 35% of crude price and natural gas at $4/MCF, Permian debt could be paid back by the end of 2026. As you have pointed out, companies may choose not to pay back debt early and may just send all the excess cash flow back to investors. The point is that there is plenty of cash flow to pay back the debt.
Costs are too high . No money to be made . Petrofac is an offshore contractor owned by Shell and NAM ( Dutch Corporation ) .
https://www.energyvoice.com/oilandgas/470587/petrofac-losses-100m-2022/
Some interesting info on shale hedges from Art Berman ,
https://twitter.com/aeberman12/status/1605936022998728704
I thought we had already established that Ghawar is already well below its peak of 5MM from data on the Aramco IPO, can someone comment? Simmons was
a bit premature, I got the sense he thought Ghawar would be mostly done by 2010 if memory serves.
I found this from 2019
https://financialpost.com/commodities/energy/saudi-arabias-biggest-oil-field-is-fading-faster-than-anyone-guessed/wcm/1063c30d-3e63-4511-b87b-b91e5807990d/amp/
Chinese tight oil will remain a wild card this decade. Recall that no one saw the US approaching energy independence in 2008 when many of us, myself included, thought peak oil had arrived. A combination of transitioning to EVs and rapid shale development could take China out of the oil import biz, especially with other factors like demographics slowing consumption. Not sure if it will happen or not but folks are definitely looking into it
https://phys.org/news/2022-09-lacustrine-shale-reserves-bolster-china.amp
It is definitely something that can and IMO most likely will happen. The most limiting factor regarding tight oil is infrastructure cost, and I would bet on it in China rather than in Russia. China is a bit mountainous as such, but I have no doubt they can “copy best practices” and make sure thight oil (or gas) work there with state support. China would remain an energy power house economy for some time whether someone like it or not.
Isn’t the problem there that the rock is too flexible to be fractured properly?
The Saudis have said repeatedly recently that OPEC is close to producing at full capacity. I don’t think they hiding any spare barrels anywhere to goose up the price.
Stephen,
Yes Ghawar peaked a while ago. What some fail to realize is that of 1500 Gb of discovered remaining oil resources, only about 500 Gb have been developed and are producing, this leaves approximately 1000 Gb yet to be developed.
For those who do not know this, expected URR for World oil is about 3000 Gb to 4000 Gb, I typically use 3000 Gb. About 1466 Gb will have been extracted by the end of 2022 (where I assume average output in 2022 is 80 Mb/d), leaving 1534 Gb to be extracted in the future. A scenario below with gradually increasing extraction rates for conventional oil and a very conservative tight oil scenario (URR=64 Gb) and extra heavy oil scenario (URR=97 Gb), total World C plus C URR is 2818 Gb for this scenario, peak is in 2027/2028.
With a relatively fast transition to electric transport this scenario will be too high and only 2300 to 2500 Gb might be extracted as we find alternatives to oil that are better for the environment and are cheaper and also as we choose to use energy more efficiently ramp up electrified hugh speed rail to reduce air travel, choose to travel by air less and find other types of energy to use for water transport, long haul goods transport can also be moved on electrified rail with rail to factory and warehouse and warehouse to customer handled by short haul EV trucks.
Dennis wrote: What some fail to realize is that of 1500 Gb of discovered remaining oil resources, only about 500 Gb have been developed and are producing, this leaves approximately 1000 Gb yet to be developed.
Dennis, where are these 1,000 Gb of discovered oil resources that have not been developed? Who is sitting on all that oil and making no attempt to tap it?
Please tell me, I really need to know just where this hidden oil is?
Ron,
About 300 Gb or more in Orinoco belt and Canadian Oil sands. have not been developed and are not producing any oil. The oil is not hidden it simply is a resource that has not been developed and/or has not started producing.
At the end of 2020 there were 38212 million barrels of proved reserves in the US and there likely was another 53000 million barrels of probable reserves and contingent resources for a total of 91 Gb of discovered resources, of the proved reserves 10.6 Gb were non-producing reserves, add this to probable reserves and contingent resources and we have about 64 Gb of nonproducing resources in the US alone with producing reserves at about 28 Gb, so the ratio of non-producing resources to producing reserves is more than a factor of 2 for the US.
The data for much of the rest of the World (Norway and the UK have excellent data) is not very transparent.
See
https://www.rystadenergy.com/news/total-recoverable-oil-worldwide-is-now-9-lower-than-last-year-threatening-global
Rystad estimates about 300 Gb of proved reserves in the World, typically we would expect only proved reserves to be producing, my model has about 500 Gb of producing conventional reserves at the end of 2021, this is close to the 2P level of reserves for the World reported by Rystad (45 Gb of the 2P reserves are from Canada and Venezuela) if we assume most of the 2P reserves in Canada and Venezuela are unconventional extra heavy oil the Rystad 2P estimate is similar to my estimate for producing conventional reserves, basically this leaves about 1000 Gb of undeveloped resources the total remaining resource is 1572 Gb with approximately 1000 Gb of that resource not yet producing.
I cannot seem to get the chart to post,
link to chart
https://www.datocms-assets.com/75979/1661280656-20220630-world-recoverable-oil-pr.jpg?fm=webp
Ron,
I forgot about 350 Gb is undiscovered oil in the Rystad 2PCX estimate, so it is approximately 700 Gb of discovered resource which has not yet reached the stage of producing reserve.
Dennis all that Orinoco and Canadian oil is what they call “hard to produce.” And all that “undiscovered” oil is being discovered at the rate of about 5 Gb per year. That alone should scare the hell out of any cornucopian. There are a few oil production gainers but far more losers.
I predict that by next summer, you will be agreeing with me, peak oil is in the past.
Ron,
We will see, I don’t think we will know until 2025, much depends on future oil prices, if they remain at the current level from now until 2030, then you will likely be correct and the peak will remain 2018. If oil prices rise to $100/bo or higher and remain at an average annual level of $100/bo for Brent crude in 2022$ (or higher) from 2023 to 2028, then my expectation is that you will be wrong. I hope you are correct, the more oil that remains in the ground the better, but high oil prices will increase the rate that new wells are completed throughout the World and will likely increase World oil output.
We will not know until oil prices rise and stabilize at a higher level what the industry response will be.
URR- “The term ultimately recoverable resource refers to the oil that is estimated to be recoverable from a field or region over all time”
‘Recoverable’ makes some very big assumptions aside from the actual quantity of oil that actually exists in sizeable pockets somewhere down below.
One assumption is that the oil will be affordable to recover- discover, drill, extract and refine.
Affordability of ever increasingly-more-expensive-to-deliver oil
is no guarantee.
In fact, even though 8 [soon to be 9] Billion people may want to purchase all of that 2500 or 3000 Gb of predicted URR,
collectively they may just not be able to muster the financial resources to pay for the production costs.
A big chunk of the residual URR may never get produced and will be called financially stranded.
Who can predict future affordability?
One way lack of affordability is manifest is through inflation, with costs to produce [oil from residual pockets] rising higher/faster than income from additional production.
Downtrend financing may be much, much more challenging than uptrend financing had been over the past 100 years.
About 1466 Gb will have been extracted by the end of 2022, . . . leaving 1534 Gb to be extracted in the future.
So, is that remaining oil just like the already-extracted oil?
Is it like the oil in Ohio in the 1890s that lay literally a few yards below the surface?
Is it like the Spindletop gusher that initiated the “oil age”?
Is it packed into several shiny new Ghawars?
Or is it a plethora of pittances stowed away in thousands of locations in formidable circumstances?
Not to worry Mike, Dennis, I hope, is going to tell us. He says: What some fail to realize is that of 1500 Gb of discovered remaining oil resources… That is, this oil has already been discovered.
Dennis is going to tell us where it is… I hope, I hope. 🤫
Ron,
You are correct that some of this is risked prospective resources in yet undiscovered fields, Of the 1572 Gb of resources that Rystad lists, 354 Gb is undiscovered. So of the 1218 Gb of 2P reserves and contingent resources, 500 Gb of this is producing, 718 Gb is not producing and 354 Gb is expected to be discovered in the future. Note that very little of the Orinoco belt resource is included in this estimate which is claimed to be 250 Gb. Also Canadian oil sands may be larger than the Rystad estimate, by 50 Gb, so that is a potential 300 Gb “discovery” of extra heavy oil in the future (it has already been discovered, but they have decided not to include it in their estimate.) I imagine the other 54 Gb of discoveries will come from the Atlantic coasts of South America and Africa.
See chart at link below
https://www.datocms-assets.com/75979/1661280656-20220630-world-recoverable-oil-pr.jpg?fm=webp
For my model I have about 2800 Gb of conventional oil discoveries from 1870 to 2300, by 2022 2600 Gb of conventional oil has been discovered, with 1420 Gb of those discoveries having been produced by the end of 2022 and 495 Gb is developed and proding but yet to be extracted for a total of 1915 Gb of developed producing plus produced oil, this leaves 685 Gb for my model that is non-producing resources, not yet developed to the producing stage. This matches pretty well with the Rystad estimate. (2PC=1218 minus 500 Gb of producing reserves leaving about 718 Gb of non-producing resources.)
Mike B,
There is a tendency to produce the easiest stuff first, so no it is not easy pickins. With the coming energy transition probably 500 Gb will never be produced as there will be cheaper options.
Most of it is classified as contingent, which means it is only viable if various requirements line up properly, such as a high and stable oil price; risk accepting stake holders; adequate capacity (i.e. a large, skilled workforce) in the E&Ps, EPICs, service companies, OEss and fabrication yards; ready, cheap capital; and a welcoming social an economic environment. Things are evidently not lined up as required as the IOCs prefer dividends and buy backs over investment and OPEC chooses to cut quotas rather than expand spare capacity. Oil price is too low and too volatile, the industry is highly risk averse, 10 or 15 years ago the workforce was considered ageing but there hasn’t been a “great crew change” so much as a “great crew exodus”, loans are high interest and difficult to get, and ESG issues, economic downturn and social and environmental instability dominate.
The numbers are likely too high, the Shift project’s interpretation of some Rystad data probably was closer to reality (and lower). A lot is in Russia, Iraq and Iran, which are years away from even being assessed, Brazil has a chunk but it isn’t apparent from its official reserve figures or recent development history, Angola and Nigeria reserves are much lower than estimated, US tight oil looks lower based on the latest production trends and EIA reserve estimates (and companies’ own data showing continuous negative revisions), etc.
George,
You are correct, of 1220 Gb of 2PC resources roughly 670 Gb is contingent resources. How much of the contingent resource is developed, future reserve appreciation and future discoveries are all unknown. If supply of oil is short oil prices are likely to rise to a level that might lead to development of these resources. If oil prices remain at current levels it is possible much less oil will be developed to the producing stage.
The model below assumes the rate the resources are developed falls to half the rate of the 1918 to 2022 period in 2023 and gradually falls to 13% of the pre 2022 rate by 2097, we also assumes lower extraction rates as shown on chart. URR is 2523 Gb. The scenario assumes no demand reduction due to a transportation transition, potentially after 2035 demand might fall below supply and lead to lower output than shown in this scenario (extraction rates would be lower in that case).
Attention! Attention Everyone!
Dennis Coyne’s latest chart (above) has the post-covid peak (82.2 million b/d) below the the pre-covid peak (83 million b/d).
Dennis has finally seen the light. Peak oil is in the rearview mirror. 😉
Ron,
The scenario uses a very conservative tight oil estimate that assumes no increase in the future completion rate in the Permian basin. If we use the more realistic tight oil scenario, peak output rises to about 84 Mb/d in 2028. Basically this scenario only occurs if oil prices remain at current levels, if that seems likely to you then 2018 will be the final peak. I would put the odds at less than one in ten that the 2018/2019 peak will not be surpassed (this would be the 12 month average peak, centered is in 2018, trailing is in 2019).
More realistic tight oil scenario included in scenario below.
I understand Dennis. You have all bases covered. If 2018 turns out to be the peak, then you are correct. But if the peak is years later, you are still covered.
I am not hedging my bets at all. The peak month was November, 2018 at 84.585 Mb/d and the peak 12 month average was January 2019 at 83.08 Mb/d regardless of the price in this decade. The price has been above $100 a barrel this past year with no increase in production. Now that inflatin has taken costs higher and interest rates are hitting drilling borrowers hard, higher prices will mean very little.
Ron,
Yes unlike you I do not think the future can be predicted. I make a set of assumptions and using the information I have available I see where those assumptions lead. If oil prices remain under $80/bo in 2022 $ from now until 2028, I think your belief that the 2018/2019 12 month average peak in World C plus C output will never be surpassed may be correct. My best guess is that oil prices will be above $90/bo (2022$) on average over the 2023 to 2028 period and there will be a new peak in World C plus C output.
It will make little difference one way or the other as the most likely scenario is a plateau near the 2018/2019 peak (maybe just below or just above that level) from 2024 to 2030 followed by decline, whether 12 month average output is 82 or 83.1 Mbpd for some 12 month period in the future will be of little consequence.
Many oil producers have plenty of cash flow at $80/bo or higher so interest rates are not that important, higher costs will be offset with higher revenue due to higher oil prices. It is profits that matter.
We will see how it unfolds, despite what you believe the story has not ended.
If these scenarios charted by Dennis come close [with URR around 2500 Gb]
both charts show decline in global crude output by at least 25% over the decade of the 2030’s [17 yrs from now]
Global population over 9 billion at the end of the decade.
Only a few countries will have any crude oil available for export, if any.
Maybe URR will end up a little higher. I wouldn’t bank it.
I’d put my money elsewhere.
Hickory,
Those 2500 Gb scenarios are in a sense, best case scenarios where demand is muted keeping oil prices low. I am not that optimistic, reality is likely to be somewhere between the 2500 Gb and 2800 Gb scenarios with higher oil prices, of course the higher the oil price, the more likely people will wake up and start moving towards other forms of transport that use less oil, societies in wealthier nations may recognize the need to upgrade to high speed electrified rail to reduce intercity air travel as well as upgrade freight rail systems to reduce oil use in long haul trucking. We may get to very low oil use for all forms of transport (land, air, and water) eventually, but it will take 20 to 30 years at least and perhaps 50. In 2021 about 65% of C plus C consumption was from the transport sector (land, air, and water) with about 52.5% from land transport, reducing use by industry may be more difficult.
Understood. Its going to be dicey.
That’s chilly reading, Gerry.
“… were it not for the interjection of the shale basins.”
Granted, I am a lay observer here who doesn’t know shite. But around 2010-2015, it occurred to me that this “Shale Revolution” was about the worst thing that could have happened (short of decline) because it:
1) made predictions of peak oil look “WRONG”;
2) put everyone in a frame of mind of “we will never run out”;
3) delayed even further an already appallingly delayed planned response to world decline;
and 4) (as Mike S never tires of pointing out) absolutely squandered the last measure of abundance the US has had. Yet complacency has become sacramental.
We could have prepared, but we didn’t, so we aren’t. My geology professor from long ago, Professor Hatfield, said to me, unequivocally, in 2007: “Michael, it is too late.”
So, yes, I’m with you there on the edge of the precipice. But who the F am I?
The supply side is having problems, no doubt. If we had a favourable investment environment I could question if some overlooked part of the world could compensate somewhat. But as it looks now, it is difficult to see how to grow supply. Holding steady or limiting decline is more easy several places, although over the shorter run.
The surprising part for me (living in Europe) is more how adaptable we can be on the demand side. Even if problems are really big, it is actually possible to reduce demand quite substantially without it being a too big deal. It has been mentioned several times on the non petrol thread – but a wartime mentality is actually working surprisingly well in Europe at the moment. The level of living standard slack has several layers it seems.
https://www.resilience.org/stories/2022-08-09/the-status-of-global-oil-production-part-2/
Shallow Sand, how are things your way with this cold snap? Heard about power outages in Kansas.
So far the power has stayed on. We shut in some low volume leases. Hopefully nothing else will freeze up. But this wind isn’t helping and it’s going to get -10 later tonight, which is bad for us.
It will be above freezing in less than a week. If we can get through the next four days we will be fine.
Update. Some leases we thought would make it, didn’t, and froze up. We caught them before any messes were made, but it’s still frustrating because it’s more work to re activate a lease that hasn’t been drained before a freeze.
No sun and windchills that haven’t relented are the problem.
Shallow sand,
Sorry to hear that, try to have a good holiday, hopefully the warmer weather next week will help.
Norway fails to meet targets for 8 months in a row .
https://twitter.com/WhiteTundraSG/status/1578150857727610880/photo/1
The need for oil. PJM and ISO New England are generating 5740 MW burning residual fuel oil. This requires 67 gal pre MW or 384,500 gal/hr. And the cold air is just arriving.
New posts are up. The EIA’s Short-Term Energy Outlook. I have also included some charts to explain the EIA’s “Other Liquids”