By Ovi
The focus of this post is an overview of World oil production along with a more detailed review of the top 11 Non-OPEC oil producing countries. OPEC production is covered in a separate post.
Below are a number of Crude plus Condensate (C + C) production charts, usually shortened to “oil”, for the oil producing countries. The charts are created from data provided by the EIA’s International Energy Statistics and are updated to December 2025. This is the latest and most detailed/complete World oil production information available. Information from other sources such as OPEC, IEA, STEO and country specific sites such as Brazil, Norway, Mexico, Argentina and China is reported to provide an extra one or two month production preview beyond the EIA.
The EIA’s April STEO report has made significant and major revisions to the projected World oil production due to the US/Iranian war. Also US projected production has been significantly revised upward. See US chart at the end.
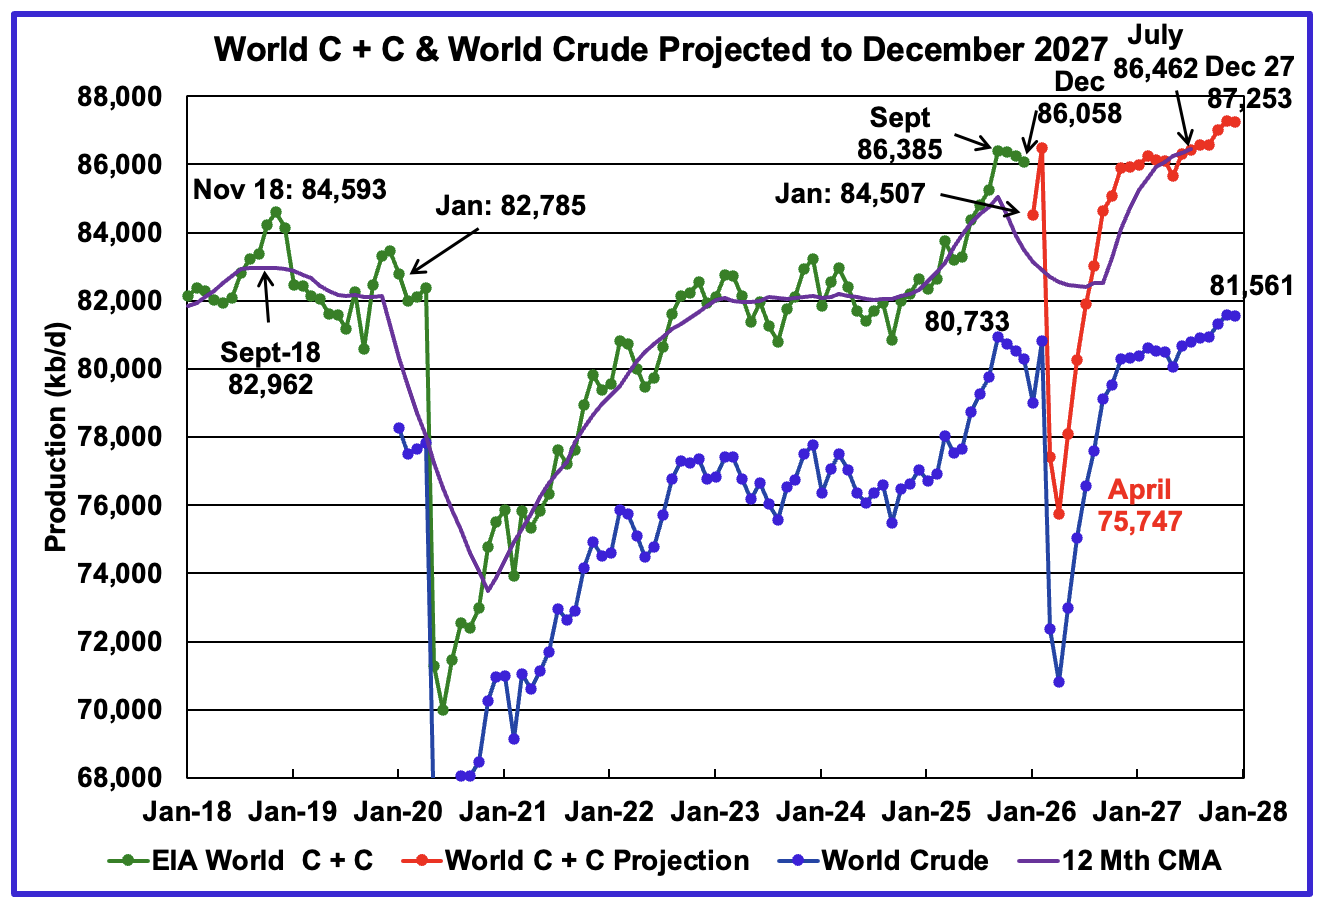
The World’s December oil production decreased by 192 kb/d to 86,058 kb/d.
September 2025 is the new current World Peak Oil at 86,428 kb/d for the next year and a half when more oil production is brought online in late 2027. Note that after the March 2026 output crash, oil production only gets back to the November 2025 production level in February 2027.
This chart has been updated using the April 2026 STEO to project World C + C production out to December 2027. It uses the STEO report along with the International Energy Statistics to make the projection. Production in January 2026 is projected to decrease by 1,551 kb/d to 84,507 kb/d. March/April production drops by more than 10,000 kb/d due to the Iran/US war. April production at 75,747 is 10,722 lb/d lower than March 2026.
The 12 month Centred Moving Average shown at July 2027 is 86,462 kb/d vs the September 2018 12 month CMA of 82,962 kb/d.
For December 2027, production is projected to be 87,253 kb/d, a new projected high and an upward revision of 219 kb/d from the previous report. Most of that increase is from the US. See US chart below.
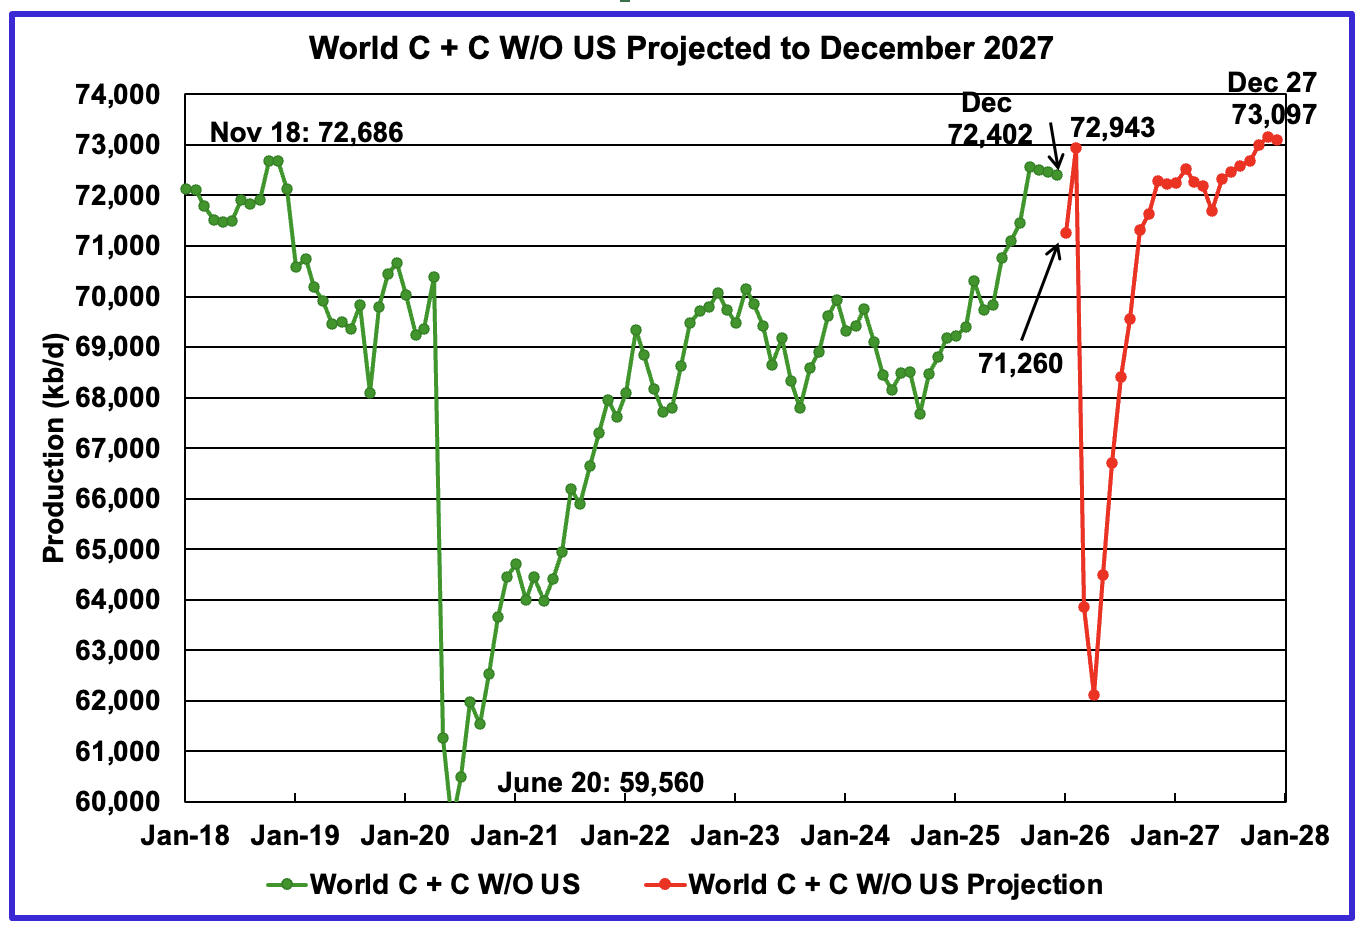
December’s World oil output W/O the US decreased by 59 kb/d to 72,402 kb/d. January’s production is expected to decrease by 1,142 kb/d to 71,260 kb/d.
The projection is forecasting that December 2027 World W/O US oil production will be 73,097 kb/d. This is only 154 kb/d higher than the expected February production of 72,943 kb/d. Very little growth expected from the Non-US World oil producing countries.
A Different Perspective on World Oil Production
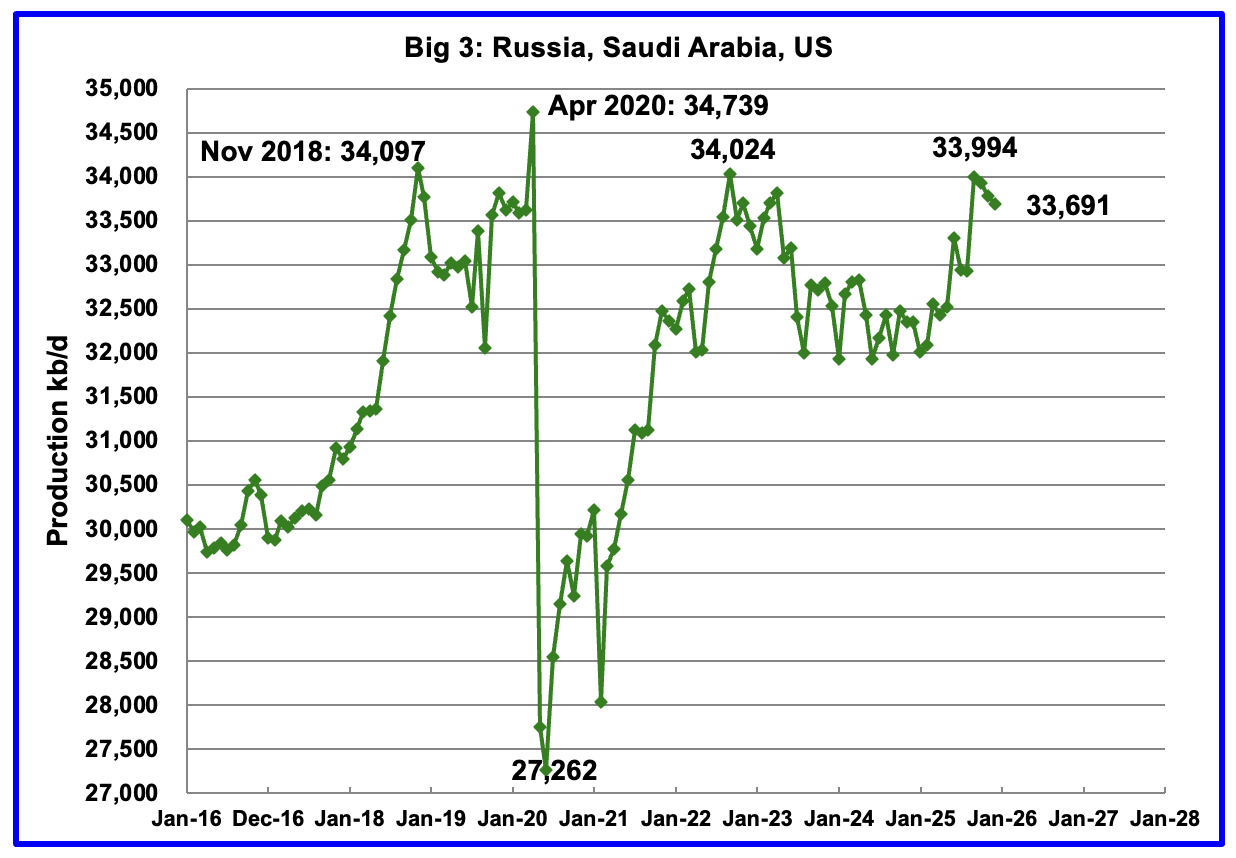
December’s Big 3 oil production decreased by 93 kb/d to 33,691 kb/d. The US December drop was offset by the Saudi Arabia increase.
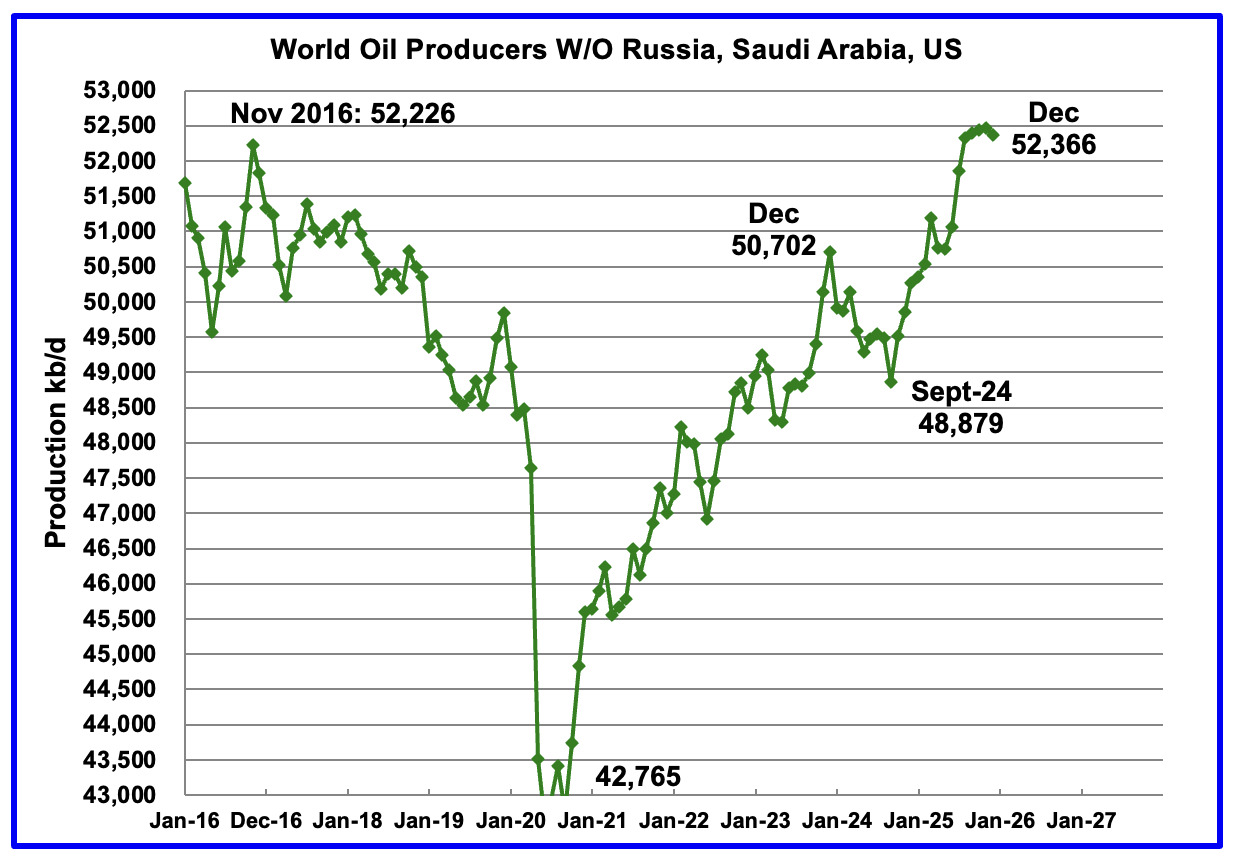
Production in the remaining countries has been slowly increasing since the September 2020 low of 42,765 kb/d but dropped in December. December 2025 production dropped by 100 kb/d to 52,366 kb/d. Gains in Brazil were offset by losses in Kazakhstan, China and Iraq,
Countries Expected to Grow Oil Production
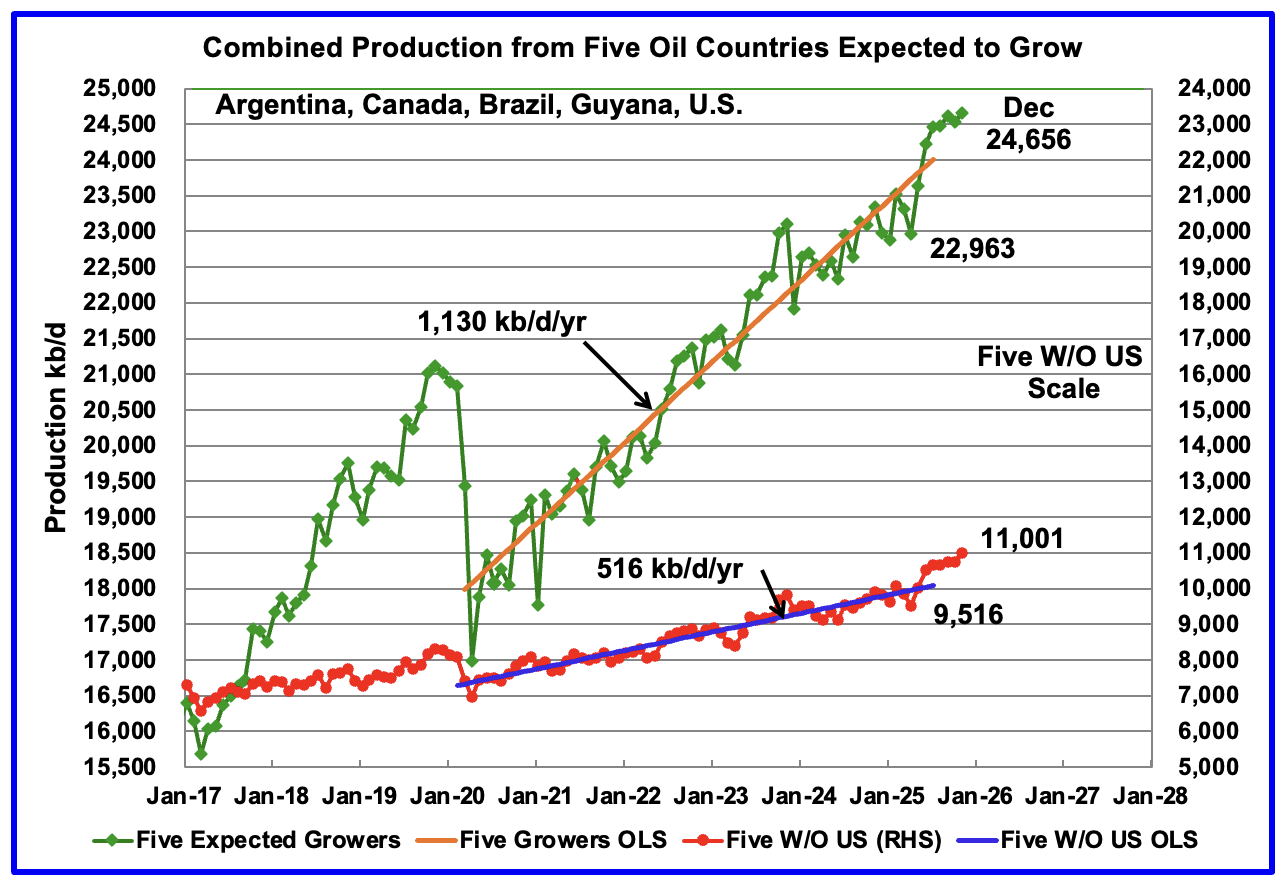
This chart shows the combined oil production from five Non-OPEC countries, Argentina, Brazil, Canada, Guyana and the U.S., whose oil production is expected to grow. These five countries are often cited by OPEC and the IEA for being capable of meeting the increasing World oil demand for next few years. For these five countries, production from April 2020 to July 2025 rose at an average rate of 1,130 kb/d/year as shown by the orange OLS line.
To show the impact of US growth over the past 5 years, U.S. production was removed from the five countries and that graph is shown in red. The production growth slope for the remaining four countries has been reduced by 614 kb/d/yr to 516 kb/d/yr.
December production has been added to the five growers chart and it rose by 118 kb/d to 24,656 kb/d. December’s production increase was primarily due to the large Brazilian increase offset by the US drop. For the Five growers W/O U.S., December production rose by 251 kb/d to 11,001 kb/d, with Brazil contributing 242 kb/d.
January’s production for the five countries is expected to drop due to drops in Brazil and the US.
Note: The OLS lines are updated to July 2025.
World Oil Countries Ranked by Production
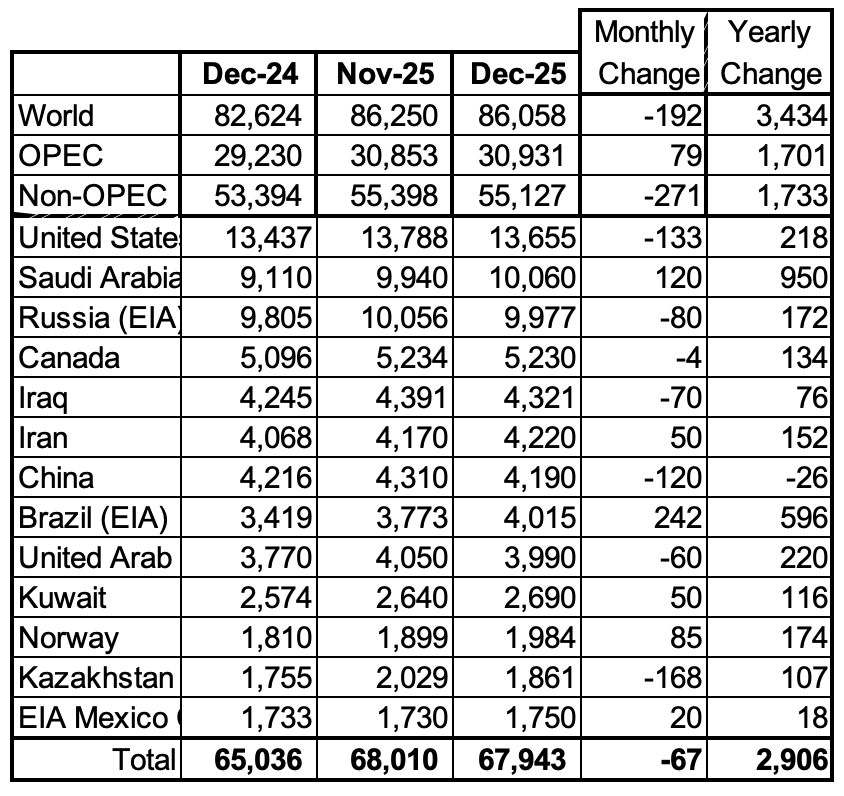
Above are listed the World’s 13th largest oil producing countries. In December 2025 these 13 countries produced 78.9% of the World’s oil. On a MoM basis, production decreased by 67 kb/d in these 13 countries while on a YOY basis production rose by 2,906 kb/d. Note the large YoY increases from Saudi Arabia and Brazil.
December Non-OPEC Oil Production Charts
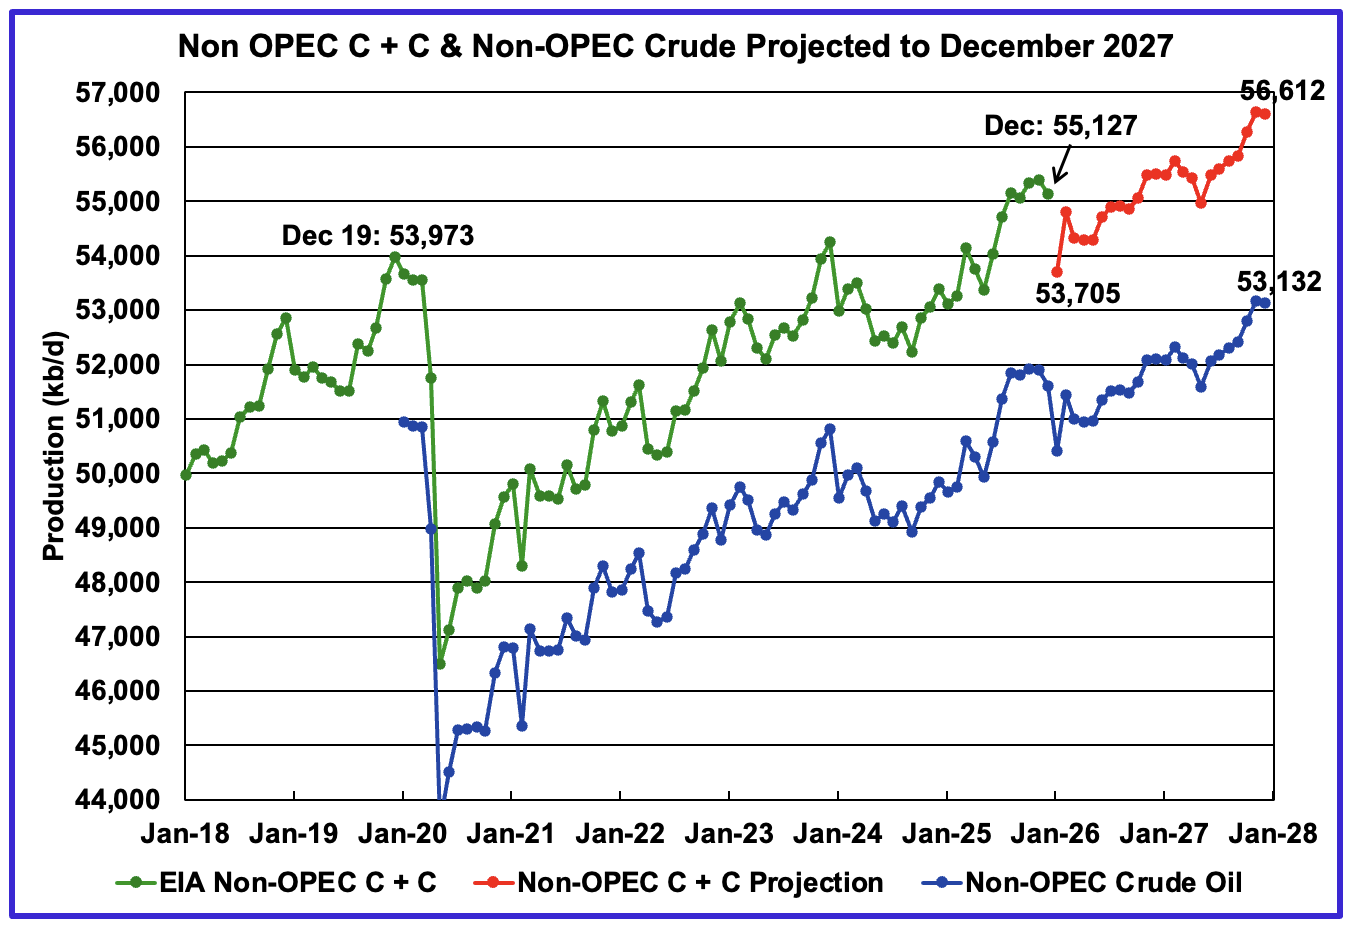
December’s Non-OPEC oil production decreased by 271 kb/d to 55,127 kb/d. January is expected to drop by 1,422 kb/d to 53,705 kb/d. This large production drop is due to large drops in Brazil, China, Kazakhstan and the US.
Using data from the April 2026 STEO, a projection for Non-OPEC oil output was made for the period January 2025 to December 2027. (Red graph). Output is expected to grow by 1,489 kb/d from December 2025 to reach 56,612 kb/d in December 2027.
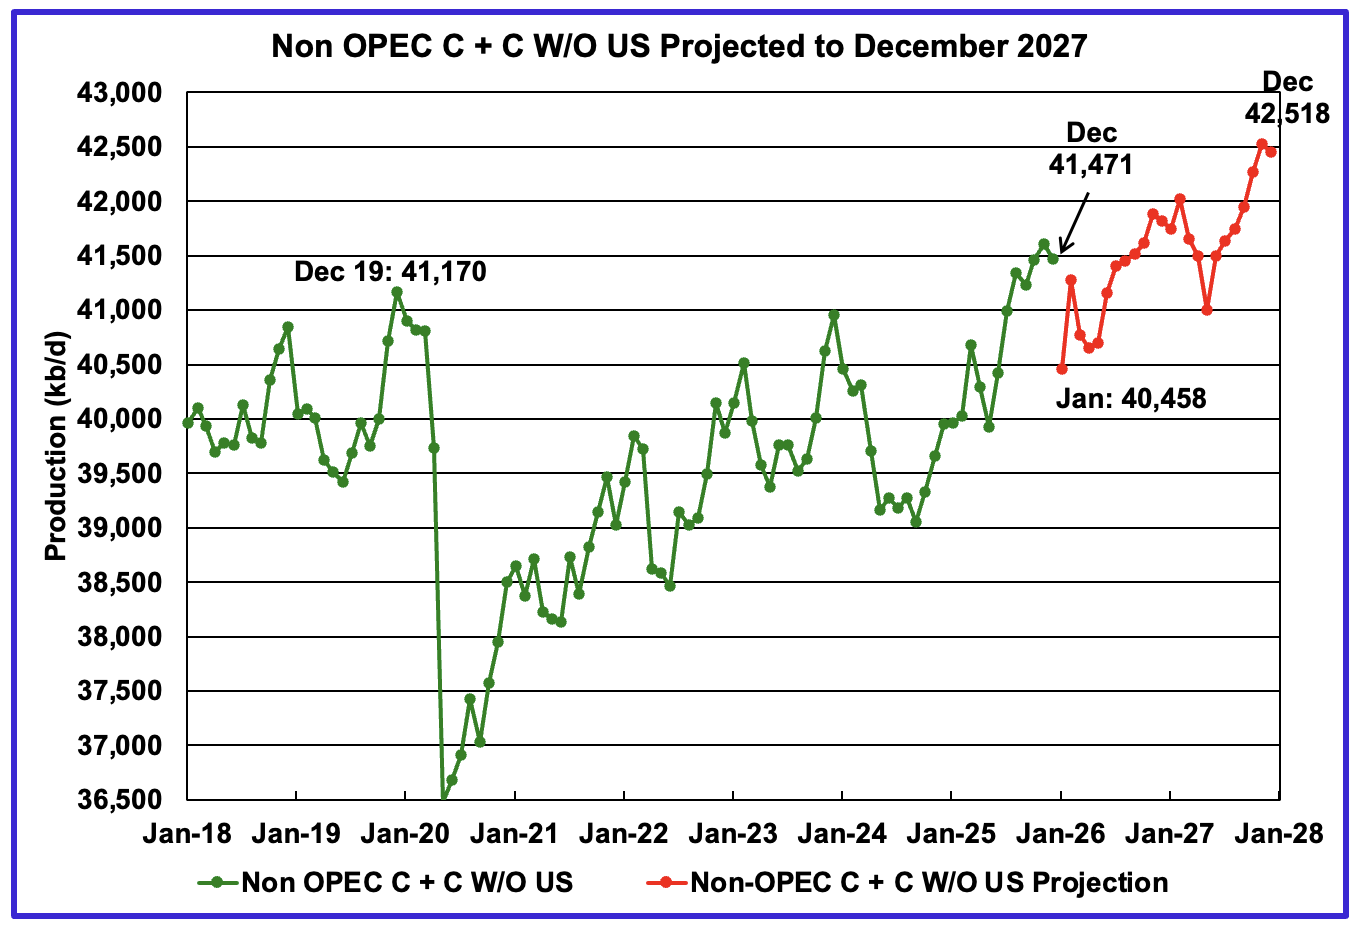
December’s Non-OPEC W/O US oil production decreased by 137 kb/d to 41,471 kb/d. January’s production is projected to drop by 1,013 kb/d to 40,458 kb/d.
From December 2025 to December 2027, production in Non-OPEC countries W/O the U.S. is expected to increase by 1,047 kb/d to 42,518 kb/d.
Non-OPEC Oil Countries Ranked by Production
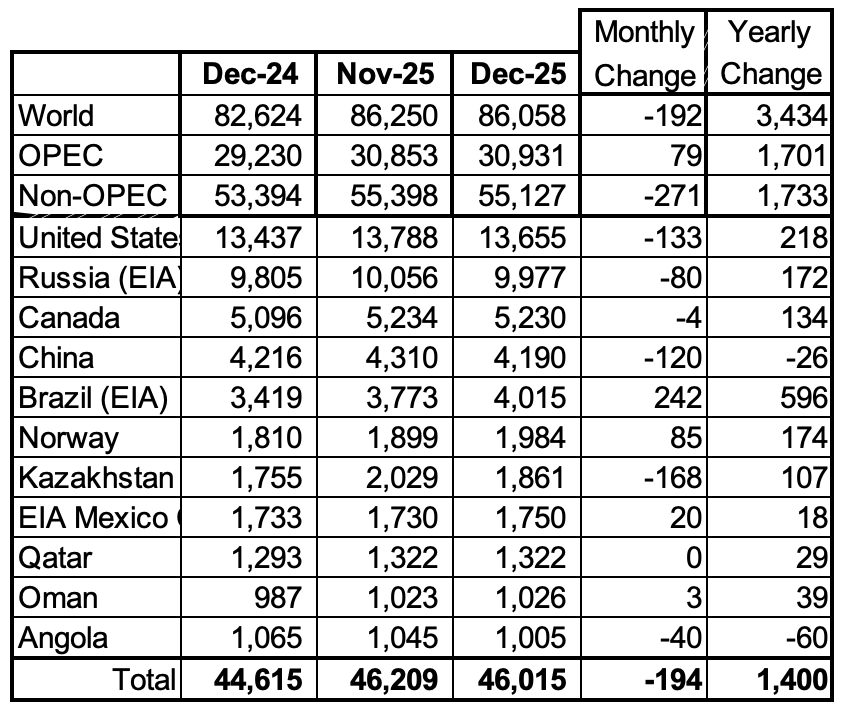
Listed above are the World’s 11 largest Non-OPEC producers. The original criteria for inclusion in the table was that all of the countries produced more than 1,000 kb/d.
December’s MoM production decreased by 194 kb/d to 46,015 kb/d for these eleven Non-OPEC countries while as a whole the Non-OPEC countries saw a yearly production increase of 1,733 kb/d to 55,127 kb/d. Major yearly gains came from Brazil and the U.S.
In December 2025, these 11 countries produced 83.5% of all Non-OPEC oil.
Non-OPEC Country’s Oil Production Charts
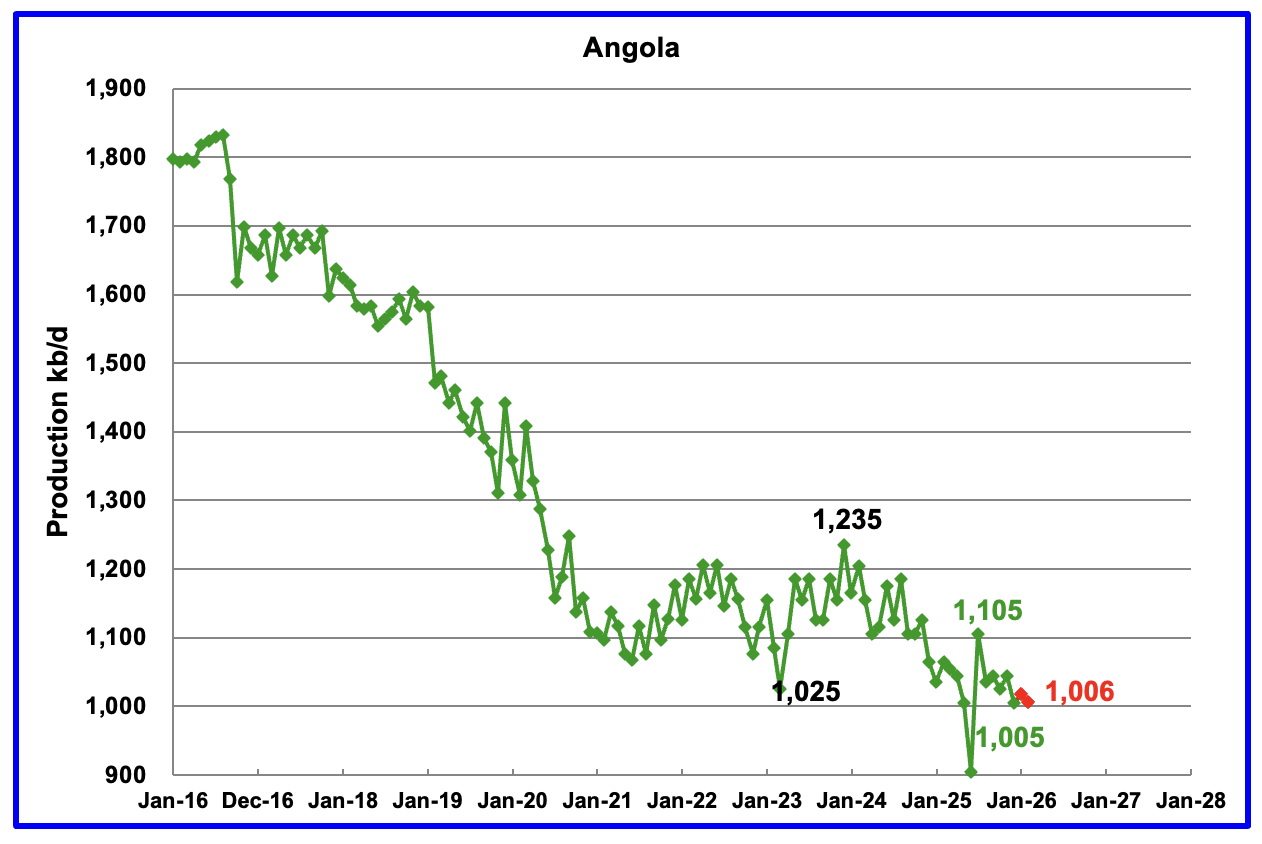
The EIA reported Angola’s December oil production dropped by 40 kb/d to 1,005 kb/d.
According to Angola’s National Agency for Petroleum, December’s production was 1,028 kb/d. Production in February was reported to be 1,006 kb/d, red markers.
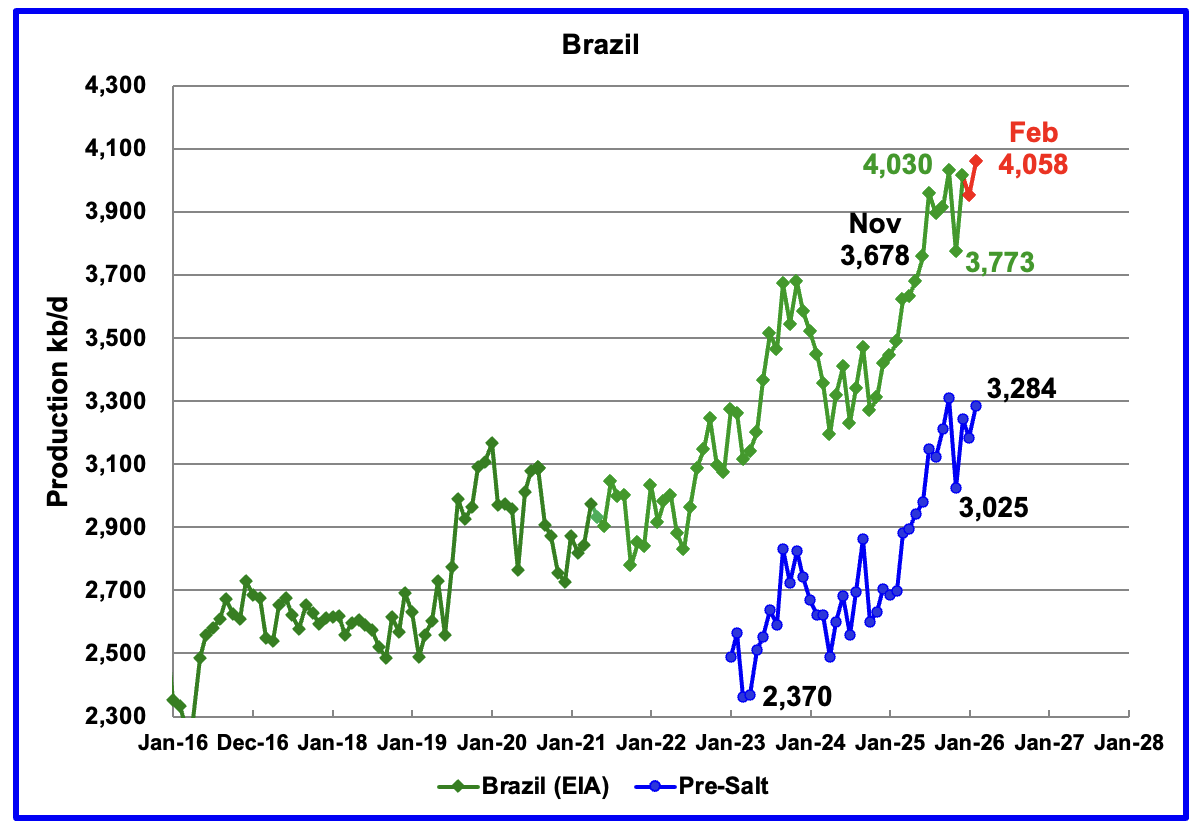
The EIA reported that Brazil’s December production rose by 242 kb/d to 4,015 kb/d. According to this Article, the pre-salt reservoirs remained the backbone of national production, accounting for nearly 80 per cent of total oil and gas output.
Brazil’s National Petroleum Association (BNPA) reported that production dropped in January and rose to a new high in February to 4,058 kb/d.
Pre-Salt production was a major contributor to December’s rebound.
According to the March OPEC MOMR: “Oil project start-ups are expected at the Buzios and Wahoo fields, as well as from the Albacora Leste Cluster. However, operational challenges and unexpected disruptions on certain platforms may still affect the anticipated production timelines.
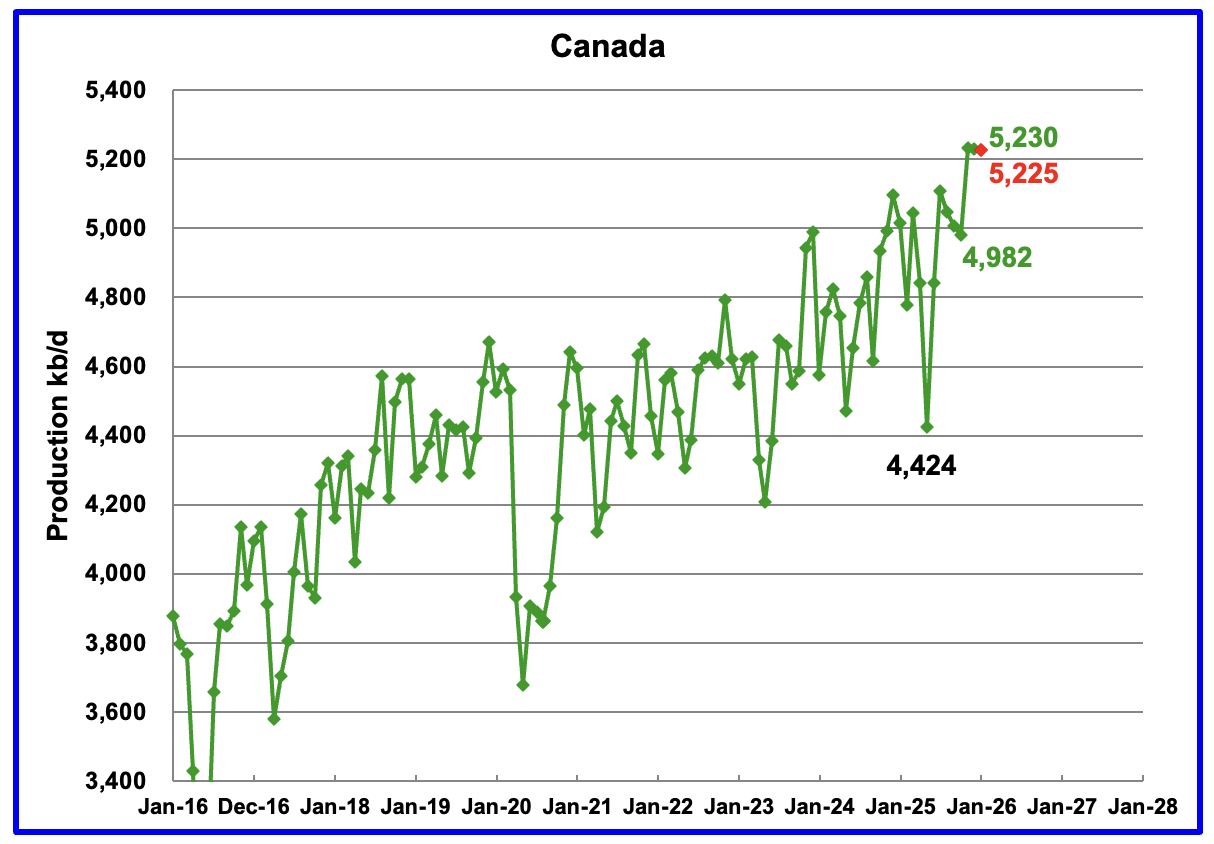
Canada’s oil production decreased by 4 kb/d in December to 5,230 kb/d.
A projection has been made for January production based on preliminary production provided by the Canada Energy Regulator (CER). January’s projected production is expected to drop to 5,225 kb/d, red marker. The CER estimate contains some NGLs which have been removed from the projection. On average the EIA reduces the CER’s monthly production by 375 kb/d which was also done for the December estimate.
According to this Article, Canada is in talks with US officials regarding a proposed revival of part of the canceled Keystone XL oil pipeline.
“The project proposed by Calgary-based pipeline company South Bow and its U.S. partner Bridger Pipeline – which could increase Canada’s crude exports to the U.S. by more than 12 per cent if it goes ahead – was one of the topics Hodgson said he and Canada’s Ambassador to the U.S., Mark Wiseman, discussed with U.S. Energy Secretary Chris Wright and U.S. Secretary of the Interior Doug Burgum.
Canada is framing the prospect of a new cross-border oil pipeline as a way it can help the U.S. achieve energy security even as the war in Iran disrupts supplies and raises prices for consumers, Hodgson said in an interview at the CERAWeek by S&P Global conference.”
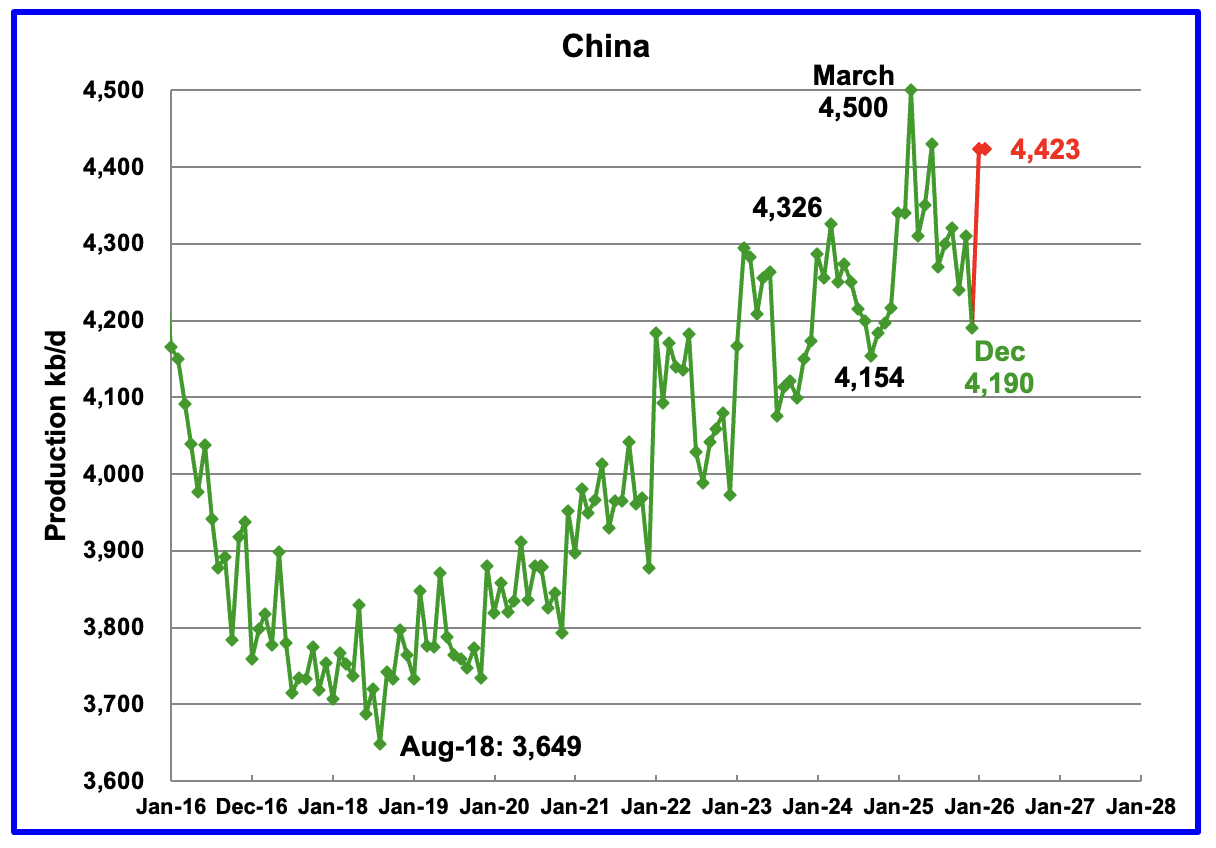
The EIA reported China’s December oil output dropped by 120 kb/d to 4,190 kb/d. On a YoY basis, China’s December production decreased by 26 kb/d. For January and February, China reported average production of 4,423 kb/d.
Note the large drop of 310 kb/d from March 2025 to December 2025. That appears to be a record drop over those nine months.
For the last two years, March has proven to be a record production month. Will this March become another new record?
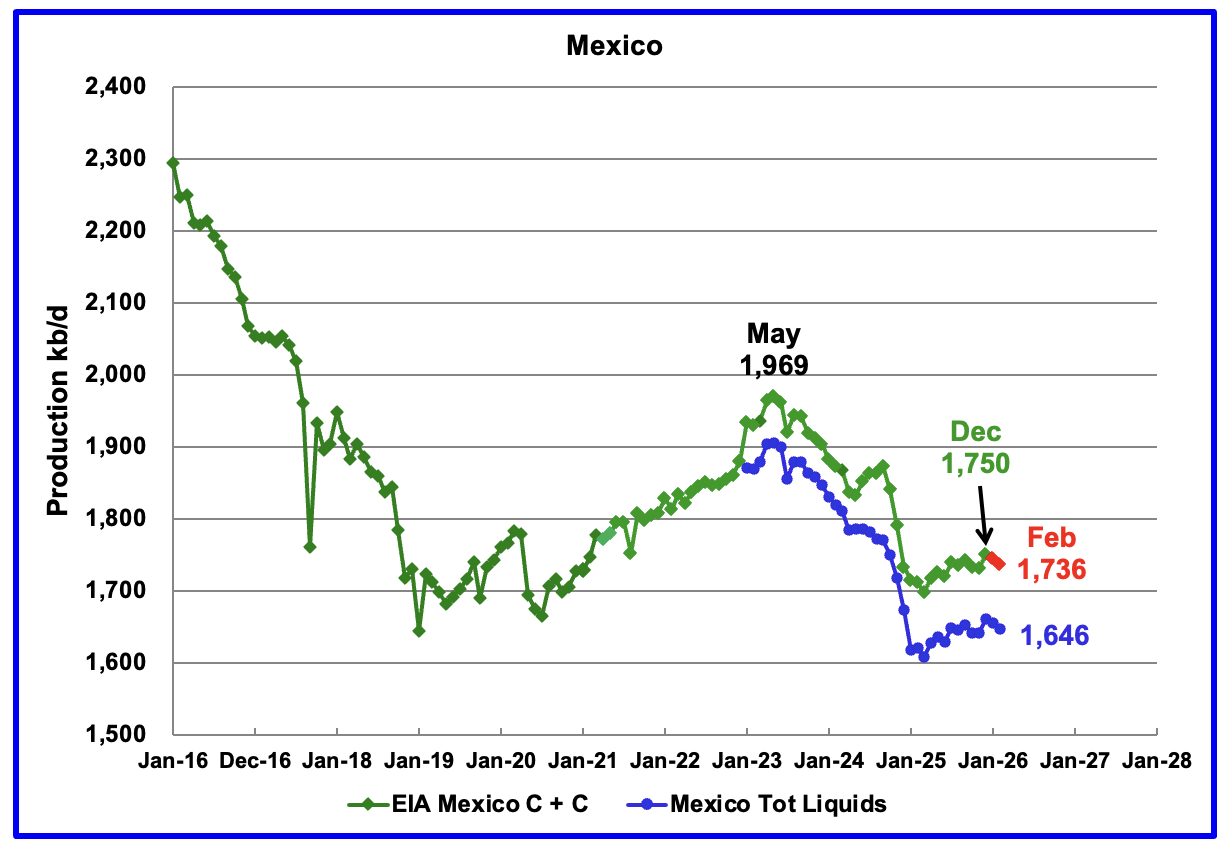
According to the EIA, Mexico’s December output rose by 20 kb/d to 1,750 kb/d.
In June 2024, Pemex issued a new and modified oil production report for Heavy, Light and Extra Light oil. It is shown in blue in the chart and it appears that Mexico is not reporting condensate production when compared to the EIA report.
In earlier EIA reports, they would add close to 55 kb/d of condensate to the Pemex’s “Total Liquids” report. More recently the EIA has been adding 90 kb/d of condensate to Mexican production. For January and February production, 90 kb/d have been added to the Pemex report. February’s production is estimated to be close to 1,736 kb/d. Note that Mexico’s production, as reported by Pemex for the last eight months has stabilized around 1,650 kb/d.
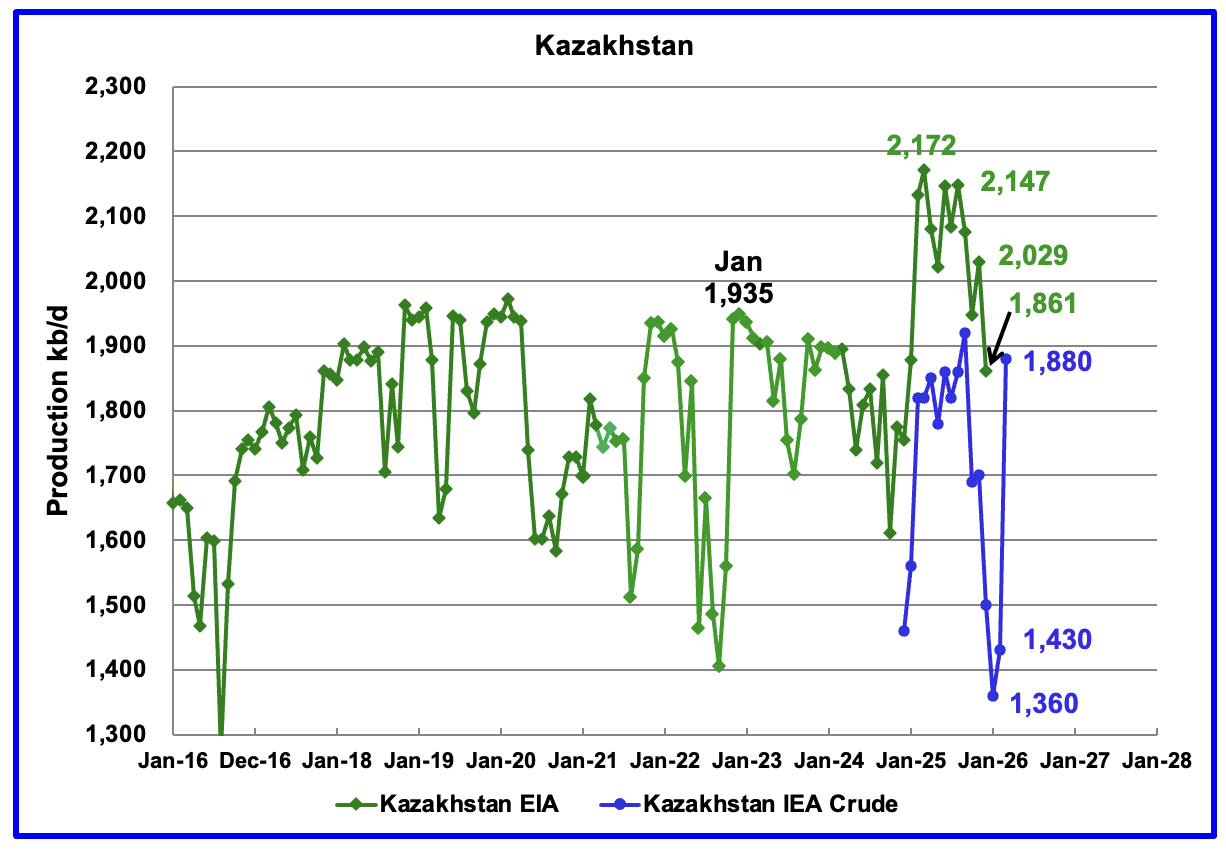
According to the EIA, Kazakhstan’s December oil output decreased by 168 kb/d to 1,861 kb/d.
Since Argus no longer reports OPEC + crude production, production data for Kazakhstan will now be taken from the monthly IEA reports. The IEA’s March OMR reported January 2026 production was 1,360 kb/d. The April OMR reported that production rebounded in February and March. March production rebounded by 450 kb/d to 1,880 kb/d even though this Report stated that Kazakhstan was supposed to reduce production in March.
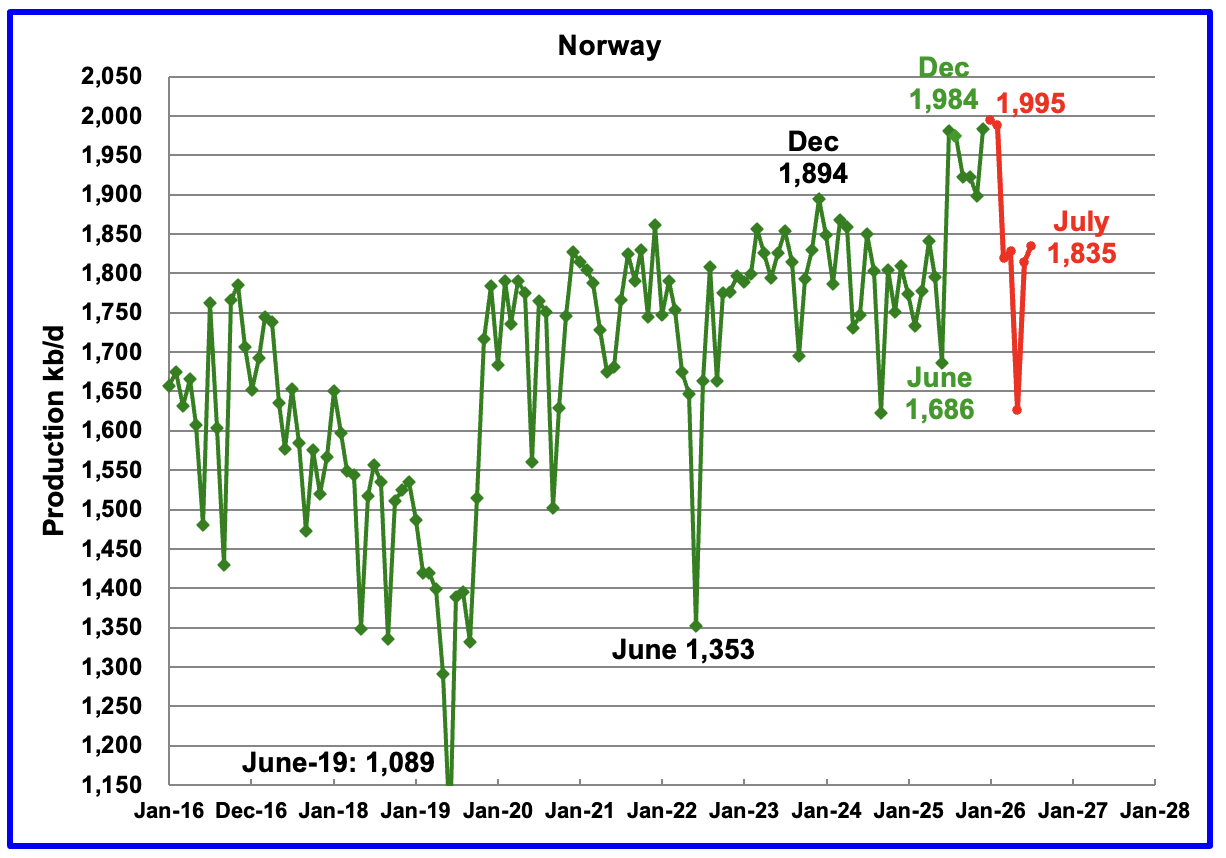
The EIA reported Norway’s December production rose by 85 kb/d 1,984 kb/d.
Separately, the Norway Petroleum Directorate (NPD) reported that January’s oil production rose to 1,995 kb/d, a new high, red markers.
The Norway Petroleum Directorship also reported that February’s oil production dropped to 1,988 kb/d and was 5.7 % above forecast. The red markers are the NPD’s production forecast.
According to OPEC’s March MOMR: “Norwegian liquids production is forecast to drop by about 40 tb/d to average 2.0 mb/d in 2026. Several projects are scheduled to ramp up through the year, including Balder/Ringhorne, Heidrun, Gina Krog, Maria, and Snohvit.
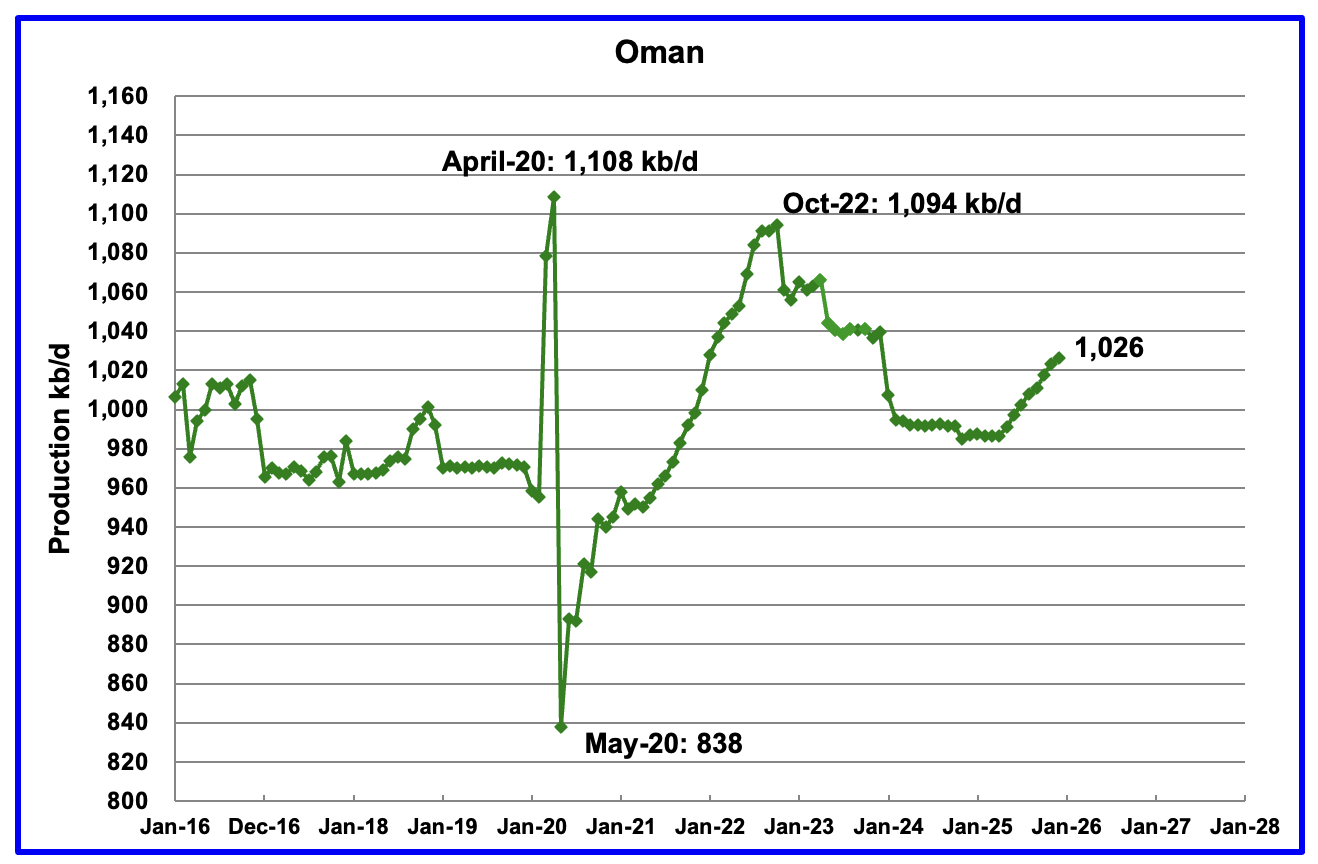
According to the EIA, December’s output rose by 3 kb/d to 1,026 kb/d. Oman’s production appears to have started a budding growth phase. Previous production peaked in October 2022.
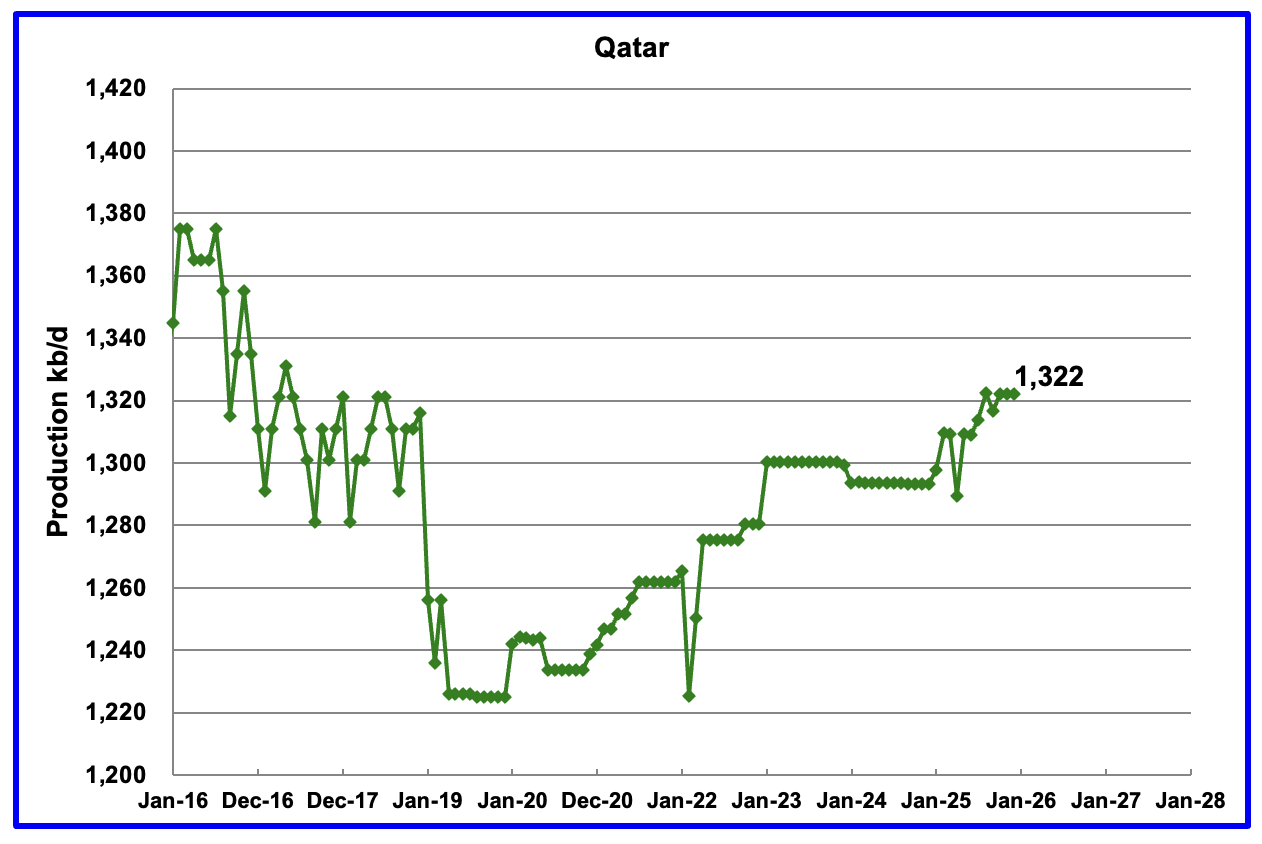
Qatar provided the EIA with monthly updated oil production back to January 2025 but seems to have stopped again in August. Qatar’s December output was reported to be 1,322 kb/d, unchanged from November.
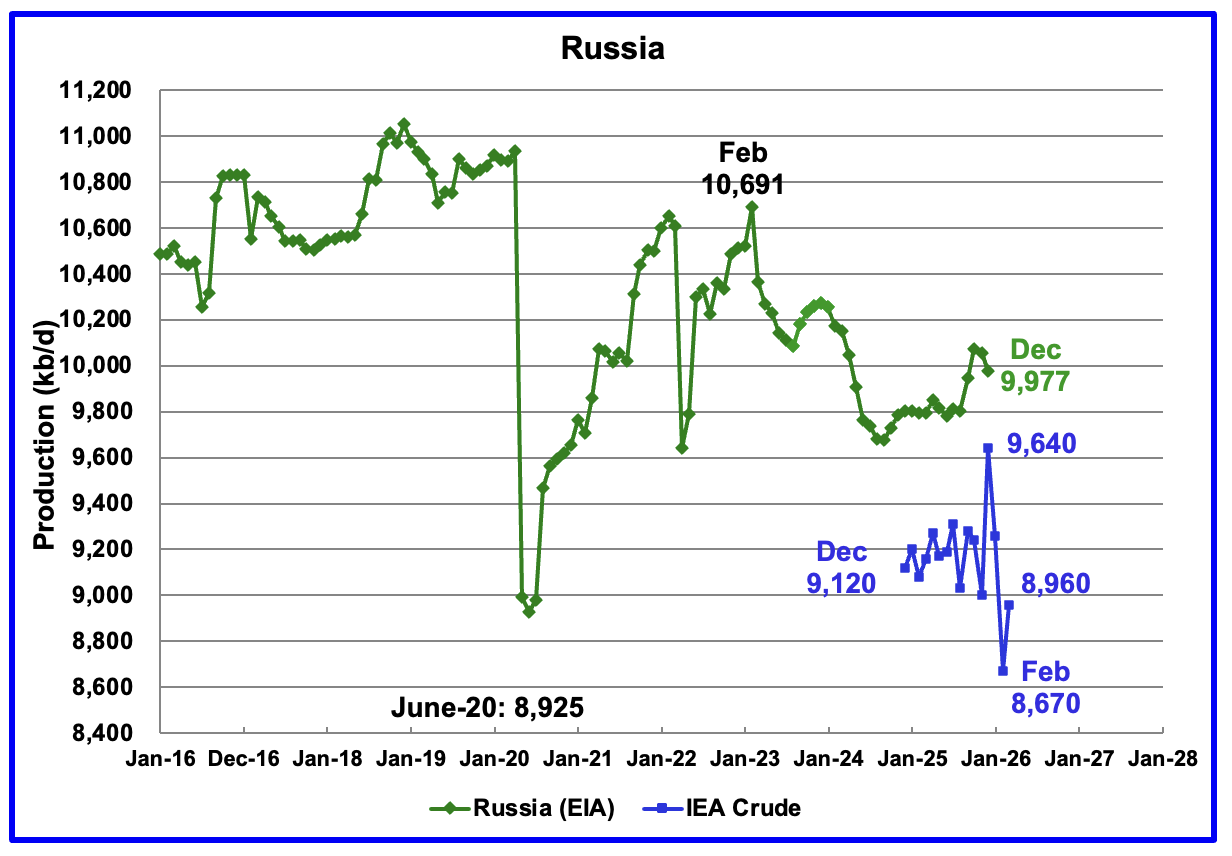
The EIA reported Russia’s December C + C production decreased by 80 kb/d to 9,977 kb/d and was up by 172 kb/d from December 2024.
Up to August 2025 Argus Media used to report OPEC + crude production which included Russian production. That monthly report has now been discontinued. The above chart now shows Russian production as reported by the IEA. It is difficult to assess the accuracy of the IEA report but over the last few months before publication stopped the IEA’s Russian production had been around 100 kb/d to 150 kb/d higher than Argus’ Media. The best that can be done at this time will be to compare the production trends between the EIA and the IEA. I think that Russian oil production continues to be a major state secret at this time because of the damage being caused by the heavy bombing to its related crude oil processing facilities.
According to the IEA’s February report, December’s crude production rose by 640 kb/d to 9,640 kb/d. The April IEA OMR is reporting that Russian crude production hit a new February low of 8,670 kb/d and rebounded to 8,960 kb/d in March. This is the first clear indication that Russian production is being affected by the Russia/Ukraine war.
The OPEC April MOMR is reporting Russian Crude production in February and March was 9,164 kb/d and 9,167 kb/d, respectively. February does not compare well with the IEA’s 8,670 kb/d but March is a bit better with OPEC’s estimate being 207 kb/d higher than the IEA’s 8,960 kb/d.
February STEO Projection
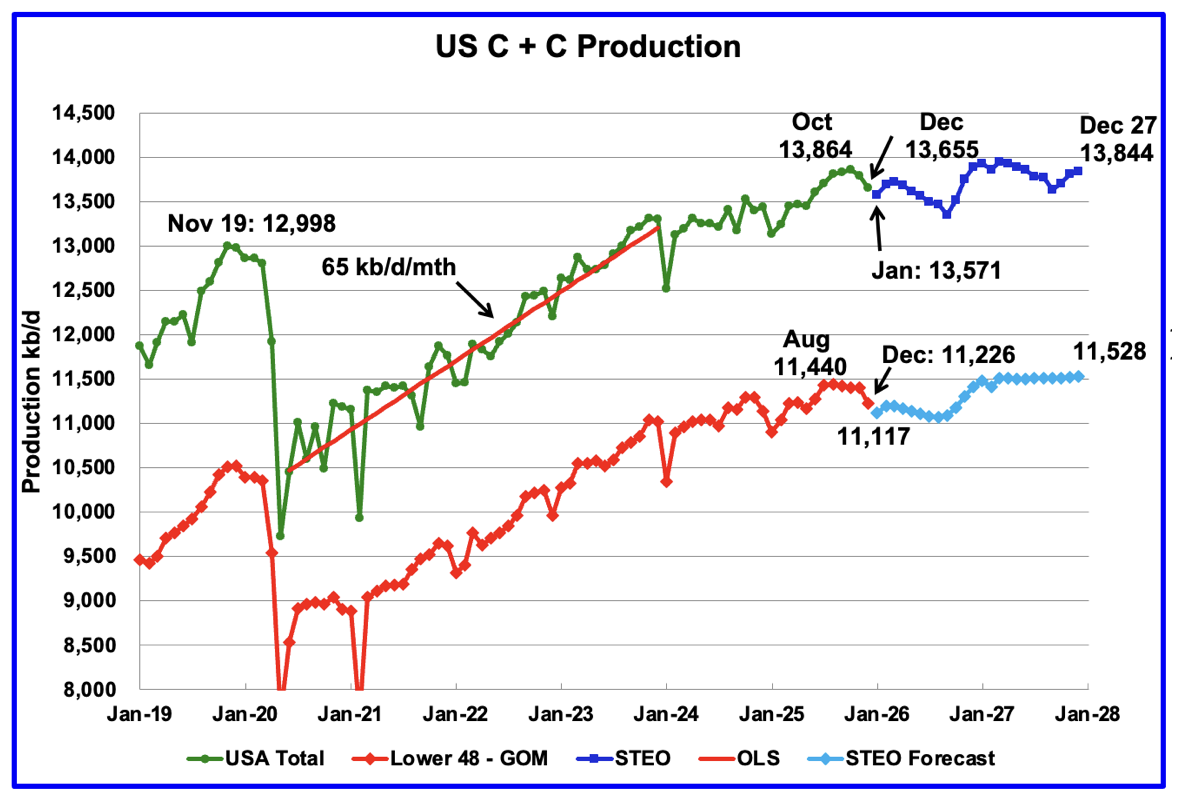
March STEO Projection
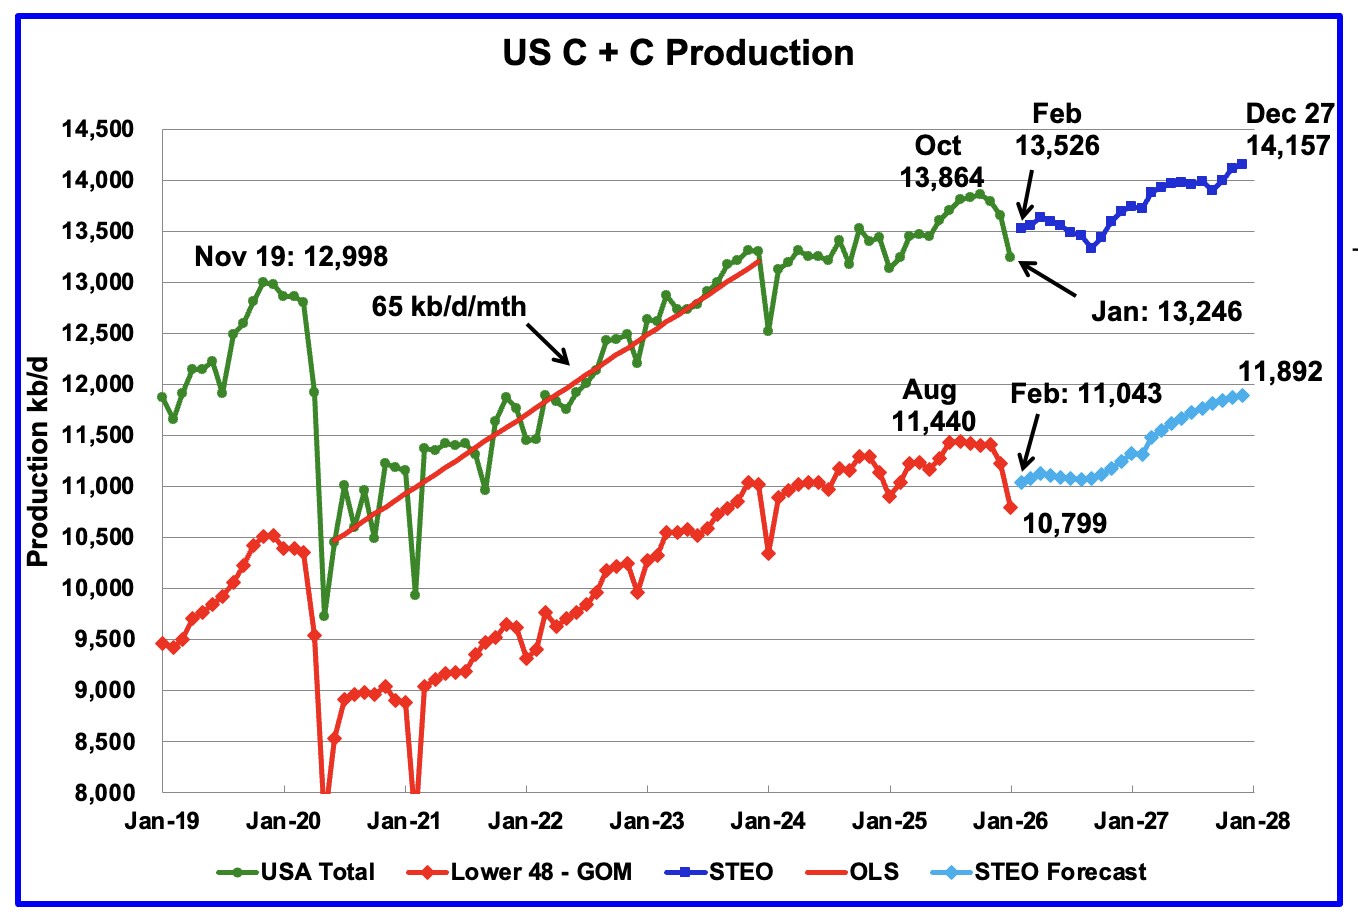
April STEO Projection
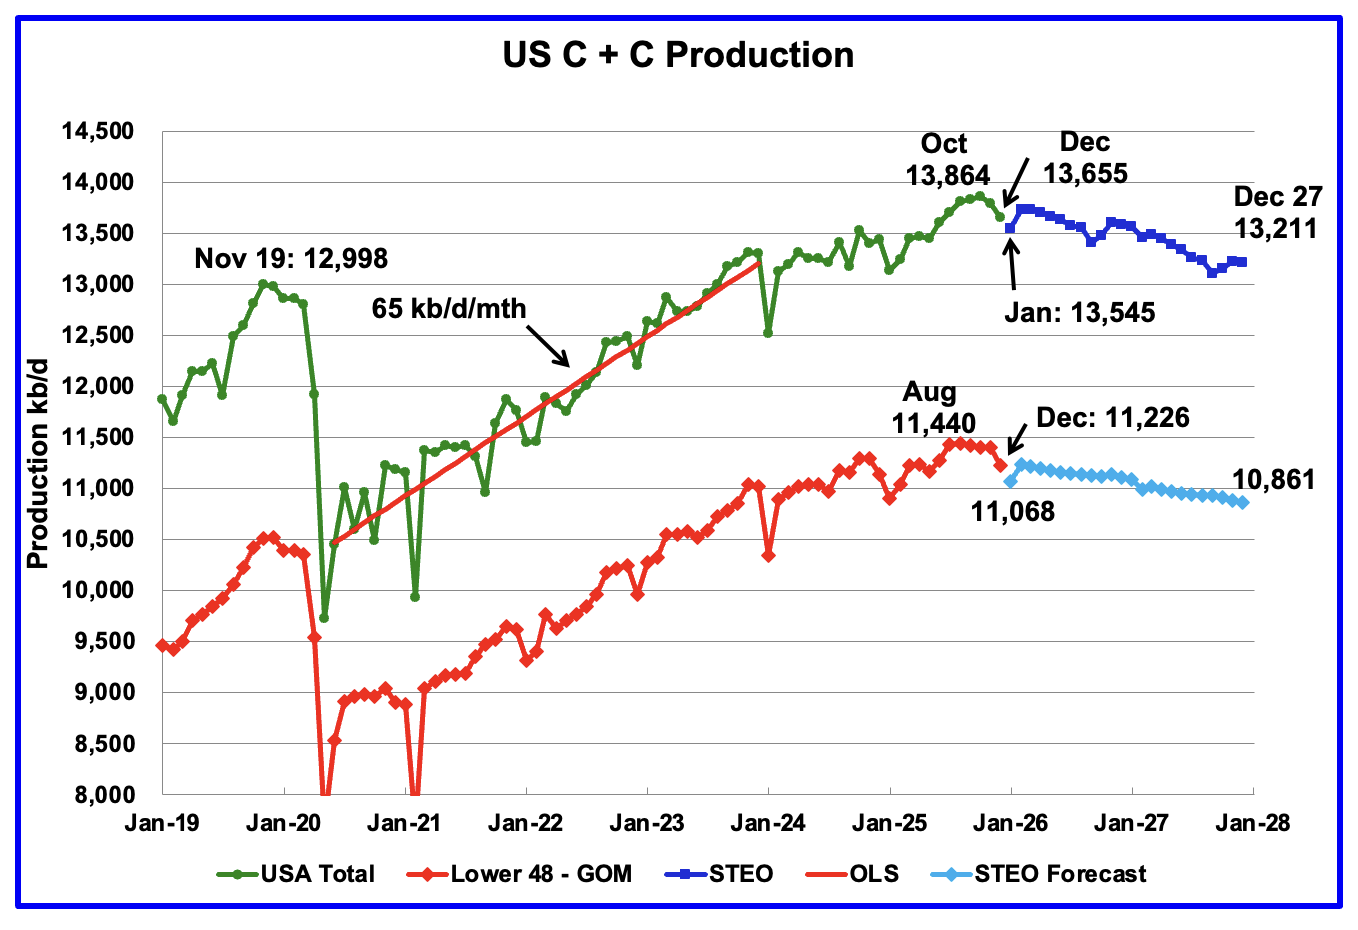
This last US production chart showing output up to January 2026 is the same as the one published last week in the US update. However the projected portion of the two production graphs, light and dark blue, have been updated according to the April 2026 STEO.
This is a case where a few pictures are worth a 1,000 words. To show how significantly the STEO projections have changed over the last three months, the STEO projections for February, March and April are posted above for comparison.
For US production, December 2027 production has gone from 13,211 kb/d in the February STEO to 14,157 kb/d in the April STEO, an increase of 946 kb/d. For Onshore L48 production, December 2027 production has gone from 10,861 kb/d in the February STEO to 11,892 kb/d in the April STEO, an increase of 1,031 kb/d. The rising production comes from increases in the Permian, Bakken and Eagle Ford basins.
Clearly the STEO’s price projection to $109/b for WTI in April and then slowly dropping back to $64/b should induce more drilling. However there is no indication of the quality of the wells the new drilling will be bringing on.
We need to track the upcoming weekly rig counts and keep a close eye on them. The weekly oil rig count has been essentially flat at close to 367 operational rigs since August 2025.
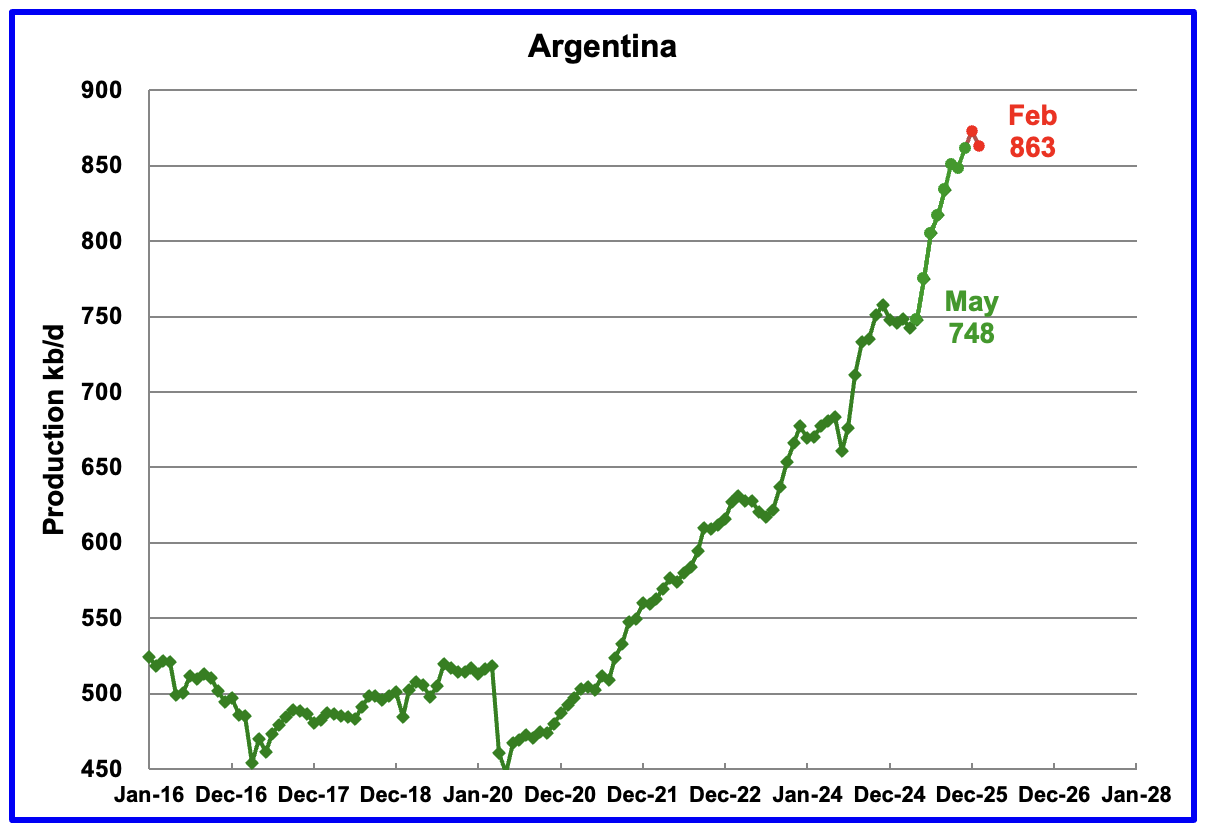
Argentina’s production has grown by 115 kb/d since May. Red markers are production as reported by the Argentina Ministry of Energy.
136 responses to “December World Oil Production Slides”
Thanks Ovi.
I think the STEO projection for US C+C output is nonsense. Keep in mind that there are not that many viable DUCs, many are older “dead” DUCs which may never be completed. The key metric that you alluded to in your post is the horizontal oil rig count moved forward by 6 to 8 months to account for the typical lag between spud and first flow from a well. Have we seen a significant increase in the rig count over the December to March period that would account for the projected increase from June through Sept 2026? No we have not. This STEO forecast is an exercise in wishful thinking. Most of the US increase comes from the Permian basin in the STEO forecast (67% of L48 onshore increase) and yes Bakken and Eagle Ford contribute most of the balance (93% of L48 OS increase from the big 3 tight oil basins). Horizontal oil rig count for Permian+Eagle Ford+Bakken in chart linked below.
rigs 2604
Permian rig count at chart linked below. Little evidence we will see an uptick in Permian output by September based on rig count.
permian rigs 2604
Dennis
Thanks.
I have to wonder if the models the STEO uses are broken. I can see how higher prices would drive higher production in older models. However WTI prices fall steadily after March 2026 back to $60/b in 2027 and production keeps on rising. Also not sure if the modellers have the option of modifying the forecast based on additional info.
In an earlier post I did find an article that stated that more NG pipelines were being built in the Permian so that oil production could be increased.
As you note we need to keep tracking the rig count.
To what extend do you think the Trump admin is aware of these “realities” ?
How about Trump himself ?
Ovi,
I would note that Mr Shellman believes that more pipelines for natural gas won’t affect oil production very much, the high oil prices need to be sustained for 12 months or more in order to affect tight oil production very much in my opinion. We will see how rig counts change over time, for now the current high prices are likely to affect production 7 months in the future, but probably not without an increase in rig counts.
OPEC production down by about 7.9 Mb/d in March from February level based on secondary sources in OPEC MOMR for April 2026. A pretty large hit to World output, roughly 9.3% of World average annual C+C output in 2025.
Thanks Ovi, great work.
Schinzy
Thanks
We are in for some interesting and turbulent times over the next three to four months. Its not clear for how long and how well the World can withstand $95/b oil.
From JP Morgan
U.S. shale well productivity remains a focus for investors, as it is one of the key drivers of E&P capital efficiency. In our quarterly update, we note that 2025 well productivity has increased in 4 of 7 major oil basins based on 2025 6-month oil cumes, with the DJ Basin (+13%), Eagle Ford (+6%), PRB (+3%), and Bakken (+2%) all showing YoY gains. One of the key takeaways is that 2025 well productivity data continues to show declines in productivity across the Permian, with 6-month oil cumes down by 8% in the Delaware Basin and 4% in the Midland Basin, confirming the trend in our prior sets of analysis (see here and here. In the natural gas basins, the Haynesville is showing a sizeable YoY increase in productivity on both 3-month gas cumes (+18%) and 6-month gas cumes (+17%) in 2025, though we believe that 2024 data was heavily influenced by price-induced production curtailments. The gains are more modest when comparing 2025 vs 2023, up 4% on 3-month cumes and 5% on
6-month cumes. In Appalachia, we note that SW Appalachia natural gas productivity is trending higher in 2025, up 14% on 6-month gas cumes, while NE Appalachia is down 4% YoY on 6-month cumes.
Seppo
I posted the attached chart in the last US update. It is clearly showing a top in Permian production. The large January drop is certainly an anomaly because of the cold weather in the Southern states. It will be interesting to see how much February production will rebound.
Two or three days of lower production and not starting production on new wells sounds like a minor bump. Unfortunately that is not true.
The Permian currently has 225 rigs operating each week. Assuming it takes 10 days to drill a well, that means 23 wells a week are being drilled or starting or completing the ones started a few months back.
No drilling occurred for 4 days which means 13 wells weren’t drilled of completed. So for those 4 days, the steep decline in all of the newly drilled Permian wells continues. That is lost production forever. I am curious to see how February Permian turns out because I am assuming even completions were stopped during that freezing weather.
A perm
Ovi,
We have Permian tight oil output through March see
https://www.eia.gov/outlooks/steo/xls/Fig42.xlsx
and chart below. Feb and March Permian output returned to the Nov and December level, based on EIA data. See chart linked below. I expect we will see either flat or decreasing output from the Permian basin in the future rather that the fantasy suggested in the STEO.
permian 2604
https://mishtalk.com/economics/petrodollar-nonsense-yet-again-this-time-in-two-opposing-directions/
Mish destroys the petrodollar nonsense.
Good article.
All major currencies are fungible.
If a country runs a trade deficit their currency will accumulate in reserves in the other country.
It is all just math.
Not a secret cult deciding what the Reserve Currency is.
People like to price things in US Dollars because they are relatively stable ( 2-3% inflation ) and the USA has the largest capital markets in the world. So everyone has dollars.
It is really this simple. I learned this from Mish.
Can someone explain the disconnect between WTI/Brent paper barrels and physical barrels?
Is it possible the US Treasury is shorting crude oil?
Shallow sand,
The spread is large due to uncertainty and volatility. The futures markets may be optimistic about how quickly things resolve. The spot market reflects real world tight oil markets due to the closure of the Strait of Hormuz.
Here is an analysis of what is happening.
https://www.oxfordenergy.org/wpcms/wp-content/uploads/2026/04/Comment-Energy-Quantamentals-8-Oil-Crisis-in-the-Eyes-of-a-Financial-Trader.pdf
SS
The difference is due to paper barrels, which is what you see quoted at the CME, see attached picture, versus Prompt Barrels which have to be delivered in the next 5 to 10 days.
The paper barrels are typically sold before expiry so delivery is not taken. In some cases they may be.
A refinery that is concerned with not getting any more oil due to what is happening in the Middle East can try to buy oil that is floating in the water and is within 5 to 10 days of its delivery port. That is prompt delivery.
WTI
Thank you Ovi
-“Note that after the March 2026 output crash, oil production [global] only gets back to the November 2025 production level in February 2027”. EIA projection as of April.
I wonder if some demand destruction will be part of the mix by then, as some countries find oil importation to be a risky habit? Also wondering about Gulf exporters planning to find additional alternative routes and ports that bypass the Iranian choke point.
-Canada has increased production to over 5Mbpd in the past year or two.
Ovi do you have a rough estimate of potential max production levels that is likely to be achieved?
postscript- on demand destruction this is the kind of news I expect to hear more of “PM Lecornu explicitly rejected broad fuel subsidies in favor of targeted, long-term investments in EVs and heat pumps — a reversal of the 2022 approach that left France with the eurozone’s largest budget deficit.” They are planning to double electrification spending efforts.
Hickory
Some demand destruction is already taking place. Here is what is happening in Egypt
“As of April 2026, Egypt is implementing emergency energy-saving measures—including encouraging remote work on Sundays (the first day of the work week) and strict 9 p.m. closures for shops and restaurants—to combat a severe fuel shortage. These measures, which also include a 30% reduction in fuel for government vehicles, are aimed at managing a 50% increase in oil import bills following the U.S.-Israel war with Iran”
With regard to Canada’s ability to increase oil production, the number I keep hearing is 100 kb/d/yr. Not sure for how many years that would be. The oil that would be produced is called Western Canada Select. It a mix of heavy crude and a diluent like propane and pentane. Suncor and Canadian Natural Resources upgrade some of that to a synthetic crude. Most is shipped to Texas refineries and some is put on ships in the Gulf for export. 890 kb/d are shipped to the West Coast and loaded onto ships to China and the far east.
https://vancouver.ctvnews.ca/business/article/suncor-plans-major-shift-in-focus-to-in-situ-oil-sands-output-by-2040/
If the water shipping industry had to live on 7 or 10% less fuel, they’d have a lot of ways to do it – they wouldn’t be forced to cut their cargo volume:
“cutting a ship’s speed in half can reduce fuel consumption up to eight-fold.”
https://www.iea.org/commentaries/how-the-shipping-sector-could-save-on-energy-costs
——————————-
“ Demand destruction” is an odd phrase. It suggests that its necessary to sacrifice good things to cut FF consumption. OTOH, a lot of FF consumption is of very low marginal value. For instance, the Egyptian employees who are working at home on Sundays are probably very happy.
Nick, a good chunk of the economy is fake. They’re not going to let go of the fake make work unless we literally have no energy. And even then…
“South Korea has secured 273 million barrels of Middle Eastern and Kazakh crude that will not need to transit the Strait of Hormuz—volumes that would sustain its economy for more than three months.”
Naphtha too.
I like how Albanese was talking about securing 100 million litres of diesel for Australia.
Australia uses that daily. Thank you for solving doom for 24 hours, mate.
Will the US be the last man sitting?
“‘We Should Not Let Them Into Our Country’: Ford CEO On Chinese EVs ”
I am not advocating that the US open the door to China EV’s (although that may be a good idea),
rather just pointing out that most countries in the world are embracing globalization by purchasing vehicles from the best source. This gives them the best product at the best price, and allowing them the chance to get by with less oil purchase.
This one looks good to me, but so do a more than a dozen others.
https://www.edmunds.com/car-news/2026-geely-galaxy-m9-hybrid-chinese-suv-tested.html
Maybe i missed it but the relatively short recovery in production seems unlikely. Is there an assumption the strait opens up soon and damaged infrastructure repaired. immediately? The projected quick recovery compared to Covid seems odd.
I’m following youtube channel of ’What’s going on with shipping’, latest video now https://youtu.be/cGQVhnP0POE?is=nXpclz-VFvB5H1ZZ. According to the channel it really is not a quick thing to restart oil shipping when/if Hrmuz is open for traffic… (in a video already a while ago…).
Sal is great. Found him after the container ship got stuck in the Suez canal. I’m curious about the empty tanker traffic to the US as it isn’t clear to me that w have sufficient exports to fill those tankers.
Rig Report for the Week Ending April 17
– At this point there is no indication that higher WTI prices are attracting increased drilling.
The rig count drop that started in early April 2025 when 450 rigs were operating was unchanged this week. Drilling continues at a steady rate of 367 ± 5 rigs per week since August 2025 while WTI closed just shy of $84/b today, down $15/b from last Friday.
– US Hz oil rigs were unchanged at 369, down 81 since April 2025 when it was 450. It was also up 7 rigs from the low of 362 first reached in the week ending August 1, 2025. The rig count is down 18% since April 2025.
– The New Mexico Permian rig count dropped by 2 to 87 rigs. Eddy and Lea both dropped by 1 to 37 and 50 respectively.
– Texas added 2 to 176. Midland and Martin were both unchanged at 22 and 26 respectively. There were very few changes and minimal internal shuffling within Texas. Reeves added 2 to 15.
– Eagle Ford was unchanged at 33.
– NG Hz rigs dropped 2 to 110.
A Rig
Frac Spread Report for the Week Ending April 17
The frac spread count dropped by 6 to 165. From one year ago, it is down by 35 spreads and is also down by 50 since March 21, 2025.
A frac
Seems Hormuz is closed again. Prices will probably rise when markets open.
Dennis
Some insiders made a lot of money placing a bet 20 minutes before the announcement. Sounds like this might be Iranians.
“Investors placed a bet worth about $760 million on a falling oil price around 20 minutes before Iran’s foreign minister announced on Friday that the Strait of Hormuz was open, another sizeable wager on the world’s most traded commodity ahead of major announcements in the course of the Middle East war.”
https://economictimes.indiatimes.com/markets/us-stocks/news/traders-place-760-million-bet-on-falling-oil-ahead-of-hormuz-announcement/articleshow/130338898.cms?from=mdr
It must be possible to trace the identities of these “investors”. They should be prosecuted for insider trading.
Sadly, this US administration very likely is a big part of such trading lately, and won’t do anything about similar corruption.
There is significant infighting within the regime hence the confusions.
@Nick G It seems it is Barron Trump who did that. I don’t know if it is more than rumors.
Trump is an utter disaster for the world’s oil and gas industry
https://www.telegraph.co.uk/gift/2d3fd205740942e2
The bittersweet joke in energy circles is that the Nobel committee should create a new climate prize to reward Donald Trump for his outstanding services.
Nobody has done more to accelerate the world’s electrotech revolution and pull forward the irreversible collapse of the oil and gas industry – not even Greta Thunberg, Al Gore or the strategic planners of the Chinese Communist Party.
…
Kingsmill Bond, Ember’s director of energy, said this shock had hit just as electrotech comes of age and is undercutting legacy fossil fuels on pure cost for power, heat and most land transport across the majority of the world’s populated regions.
“We didn’t have an alternative in past crises. Now we do. We have a suite of completely new solutions that change everything,” he said.
“Solar power coupled with storage is down to $60 [per] MWh across the global sunbelt. It costs $160 [per] MWh right now to cover just the cost of importing variable gas in Asia. It’s game over for LNG in Asia,” he said.
gerryf,
It’s simply amazing to me how intelligent and at the same time, stupid, many analysts-experts are on the subject of energy.
Kingsmill Bond is no exception. He suggests that nobody has done more than Trump to accelerate the world’s “Elecrotech Revolution.” I gather Bond believes these solar panels and batteries are made from Giant Star Trek Replicators powered by the ENERGY TOOTH FAIRY.
Trump has certainly done more to destroy Global Oil & Gas Supplies and Infrastructure, much more than the 2020 Covid Lockdown, because that was DEMAND DESTRUCTION, whereas here, you have SUPPLY DESTRUCTION.
Regardless… the world is being led by High-Tech Leaders that believe “Green Energy” or “AI Data Centers” are the new future…. THEY ARE NOT.
If this Iran War continues, and I believe it will, as Trump’s Ceasefire and Talks are just a Stalling Tactic to land troops and continue the bombing… well, we will experience a Breakdown in the Global Economy and Markets like never before.
Looks like Trump has certainly moved forward the NET OIL ENERGY CLIFF…
steve
Steve/gerryf,
I just watched the most disturbing, distressing 60 minute interview that I have ever listened to in my entire life … a Larry Johnson sit down with some incredibly well connected/informed guy named Robert Barnes.
(https://www.youtube.com/watch?v=hqY9uztGxKI … if I copied the URL correctly).
In this piece, Barnes reveals umpteen bits of White House insider(s) data that explains a LOT of the destructive, crazy, erratic goings on of the past several weeks.
Micro recap …
Trump has clear signs of early dementia
Many of his inner circle are ‘walking on eggshells’ to avoid the dementia-fueled outbursts of rage
Trump truly believes in the preposterous confabulations that he has regularly been posting on his Truth Social site.
Only Vance has been standing up to the most egregious proposals regarding cataclysmic escalation. (Trump has just removed Vance from attending Tuesday’s Islamabad negotiation meeting, sending Kushner/Witkoff alone.
According to Barnes, K & W are as much influenced by their financial ties to the GCC as to their long standing allegiance to the Zionist agenda.)
Japan turning to coal.
US navy playing ‘pretend’ in this blockade charade.
Widespread farmer bankruptcies throughout the US (likely most of the world).
Imminent political ‘tsunami’ in the US that will re-shape this country within a few years so as to be totally unrecognizable to its past 250 year existence.
Exceptionally dark presentation by Barnes, but at least it offers some coherent understanding of this recent insanity.
Coffeeguyzz
Clear Signs of Dementia for Sure
Trump kept out of the room during operation to find downed pilots in Iran after ‘screaming’ at aides for hours, report says
When President Donald Trump learned that two American pilots had gone missing in Iran on Good Friday, he “screamed at aides for hours” and was then “kept out of the room” while his team was given minute-by-minute updates, according to a report.
Back in Washington, D.C., Trump’s fears about how the war was playing out “were ramping up,” according to The Wall Street Journal.
“Trump screamed at aides for hours” after he was informed the fighter jet had been shot down and two airmen were missing, the outlet reported, citing a senior administration official. “Images of the 1979 Iranian hostage crisis—one of the biggest international policy failures of a presidency in recent times—had been looming large in his mind,” The Journal reported.
https://www.independent.co.uk/news/world/americas/us-politics/trump-screamed-aides-missing-pilots-iran-b2960603.html
Steve,
“powered by the ENERGY TOOTH FAIRY.”
Well, the first generation of oil wells were drilled by horses, and transported by horses. Oil is building renewables. That’s how it always works: one technology is used to build the next.
Renewables are the future – the whole scientific and engineering community, around the world, knows that. Even in the US – it’s only the FF industry, using it’s very large income to buy politicians – that says otherwise.
Coffee & Ovi,
I heard the same thing about Trump. If true, this is certainly a critical factor in determining Trump’s ability to function as the Commander in Chief… the same situation as with Biden’s decline in the last 1-2 years of his presidency.
Nick G,
While you bring up a valid point regarding oil wells drilled by horses, it is a different story to extend that to Wind-Solar-Batteries. Why? The Full Cycle EROI of Wind, Solar & Batteries is extremely low and unsustainable if we remove Oil-Natgas-Coal from the equation.
Again… the ENERGY TOOTH FAIRY mentality.
Interestingly, if we look at the total Energy Added over the past 15 years, there is double the amount of FOSSIL FUELS to RENEWABLES. So, the idea that we can expand Wind-Solar-Batteries without Oil-Natgas-Coal is futile, because the Techies believe in the ENERGY TOOTH FAIRY.
Those with their heads screwed on correctly realize what a Disaster this Middle East Crisis is to the Global Economy and Supply Chain. Unfortunately, the Western Markets, especially the U.S. Stock Exchanges, are DEAD FROM THE NECK UP.
If Trump decides to continue to escalate the Iran War and land troops, that should be the Death Knell of the Global Economy as we know it…
What it looks like afterwards… I have no idea, but it won’t look anything like what it is today.
steve
Steve,
“The Full Cycle EROI of Wind, Solar & Batteries is extremely high”
True.
“and unsustainable if we remove Oil-Natgas-Coal from the equation.”
That doesn’t make sense. Please expand on that idea.
“total Energy Added over the past 15 years, there is double the amount of FOSSIL FUELS to RENEWABLES. “
Sure, because renewables were small 15 years ago. In the last three years renewables are much larger than FF.
Nick G,
The EROI of Wind, Solar, and Batteries, which some analysts have stated have higher EROIs, are based on burning Oil-Natgas-Coal to manufacture, transport, and construct these non-renewable renewable power units.
If we remove Oil-Natgas-Coal from the equation, then the EROI of Wind, Solar & Batteries is much LOWER, likely 2X-4X lower. But, no one has done EROI figures for Wind, Solar & Batteries if they were manufactured, transported, and constructed without Oil-Natgas-Coal.
Again… the world believes in the ENERGY TOOTH FAIRY.
Lastly, the same problem is taking place in HIGH TECH. The Idea that Technology is more efficient is a BIG PHAT CANARD because everyone is omitting and discounting the 50-75 years of Time Binding, the Education, infrastructure, Energy & Capital invested to get Technology where it is today.
Just think about the amount of Energy it takes just to run the Global High-Education College University System that produces the very professionals who make technology more complex.
Technology DOES NOT make things more efficient; we just can’t see the massive Supply Chain and the 50-75 Years of Time Binding that got us where we are today.
Similar to the ENERGY TOOTH FAIRY… this is the GREAT HIGH TECH EFFICIENCY BIG PHAT CANARD.
steve
Steve,
“The EROI of Wind, Solar, and Batteries, which some analysts have stated have higher EROIs, are based on burning Oil-Natgas-Coal to manufacture, transport, and construct these non-renewable renewable power units.If we remove Oil-Natgas-Coal from the equation, then the EROI of Wind, Solar & Batteries is much LOWER, likely 2X-4X lower ”
Uhmmm..that doesn’t make sense. Manufacturing uses the same amount of energy inputs whether it’s powered by FF or renewable electricity. Transport and construction would use less renewable electricity, of course, because electric motors are about 3x as efficient so they use 1/3 as much energy to do the same stuff.
So, if renewables were produced with renewable energy inputs, their E-ROI would go up sharply.
———————————-
“no one has done EROI figures for Wind, Solar & Batteries if they were manufactured, transported, and constructed without Oil-Natgas-Coal.”
Of course they have. Electric trucks have been around for more than 100 years (GM manufactured and sold them from 1912 to 1918). The calculations are easy, as noted above: the tires, aerodynamics and much of the drive train is identical – the main difference is the far more efficient electric motors (and regenerative braking helps even more). Similarly, onsite installation would be done by electric equipment that would also be more efficient. All of the vehicles, from mining trucks to construction equipment like cherry-pickers exist right now in electric form.
Diesel trains, around since 1925: they’re electric plug-ins with onboard diesel generators. Diesel submarines, around since 19105 same thing. The first simple passenger EV invented about 1835, the first production passenger EV roughly 1890. First hybrid electric about 1900 by Ferdinand Porsche.
Electricity and electric motors have been around longer than diesel and diesel ICEs.
Nick G,
Nice post. However, the main ERROR in the analysis concerns SCALING.
steve
Steve,
Thanks!
Now, you’ll have to expand on that comment. I’m not aware of significant, long-term problems with scaling renewables or electrification.
Solar resources are much larger than FF: humans produce very roughly an average of 20 terawatts, and the sun drops about 180,000 TW 24×7.
Rare earths aren’t rare (even though China is trying to monopolize the *processing* of rare earths).
Batteries can be made with a very wide variety of chemistries – there’s no one element that is essential.
Metals are generally recyclable and abundant – copper might be temporarily inconvenient, but roughly 90% of its uses can be provided by substitutes, especially aluminium. For instance, electric motors and generators can be made with aluminium: aluminium is lighter,which is nice, but bulkier, so the designs are a bit different (which is the kind of thing that is inconvenient – you need a good reason to switch and redesign a lot of stuff).
So…you’ll have to expand on that idea.
The diminishing marginal utility of extracting metals and fuels (the first cut is the deepest) means that, due to rising costs, the necessary leverage to sustain industrial civilization is no longer sufficient.
Heavy industry, which was built on cheap fossil fuels, cannot be sustained with diffuse energy harvests from wind and sun.
It is as if someone were watering down the magic potion for Asterix and Obelix. Once the magic potion is too diluted, they can no longer keep the Romans at bay.
El Mar,
At some we will be forced to downsize, by one constraint or another.
I am surprised the population has continued to grow so long.
I’ve been watching this all play out since I was 15 yrs old.
At that time it looked like things like copper, oil, soil, and water (and others) were
going to run short before long.
Well, here we are 50 years later. The human bulldozer still rolling on, for a while longer anyway.
Vaclav Smil has smashed the “Green, Alternative, Electric” revolution with 4 simple words that cannot be ignored:
CONCRETE, STEEL, AMMONIA, PLASTICS
Mike, do you have a link where Vaclav Smil wrote those four words? I would like to read his whole article.
Edit: Never mind, I found it:
Civilization Runs on Ammonia, Plastic, Steel, and Cement—for Now
Mike B. I don’t buy that simplified Vaclav tagline.
Those and other constraints apply to the whole of civilization, commerce and industry,
not just to attempts to diversify energy supply beyond oil, coal, gas.
Perhaps its all just a losing battle in the end,
but it is a battle that humanity will fight nonetheless.
Hickory, Vaclav Smil is not a man who would just quote four words and claim that it explained everything. No, he is a man of deep research, nothing frivolous. Did you read the article from the link I posted above? The article is only five pages long, a ten-minute read even for a slow reader.
The article was not written by Smil at all but is a book report on Smil’s book, How the World Really Works: The Science Behind How We Got Here and Where We’re Going Therefore it was not, as you thought, a “simplified Vaclav tagline.”
Well, the book runs 336 pages, or 10 hours and seven minutes for the audiobook version. I have not read the book and would never criticize it without reading it. But the book report that quoted the four words and why they were important told me a lot. I must say, from that book report, I think it very likely that I would agree with Smil.
Yes I agree Ron, and I have read some of his work including two good books,
but headline grabbers like “Vaclav Smil has smashed the “Green, Alternative, Electric” revolution
are off the mark in my opinion.
Its undeniable that an electric motor in a washing machine a much better use of energy than a internal combustion engine would be. Thats why we do it that way, and the same applies to other applications such as personal transport (except for perhaps the less than 10% of trips in the world that are long and out of reach of charging infrastructure).
What will run out (or become too expensive for the average person) first on the world export markets- oil or copper, urea or aluminum, lithium or soy? People in 1st grade today will probably find out.
Thanks for the book suggestion- I didn’t read that one yet, but I just put it in my queue.
I have read 6-7 Vaclav Smil books; they are pretty dense when it comes to rigor emphasis on backing everything up with sources and numbers. And that is probably the strong points of his books – it gives free minds something to elaborate on.
The four problem areas when it comes to fossil fuel dependency as stated in the Mike B post above are real. I would say you could tweek the fossil fuel dependency with very different prospects depending on what area is in focus; in addition the world is so big that the expansionist game when it comes to extracting more resources is still on. And the last point is that a more reduced approach regarding consumption and environmental preservation keeps getting ignored probably because of human ambition. Not much more than that to add :-). Well actually loads of facts and point of views…
“I have read 6-7 Vaclav Smil books”
He has written 43 total. Don’t know what to make of that. Is there much repetition? Are the contents consistent? I have one book, IIRC it was mainly a narrative/
Paul P
Yes. The overarching theme of his books is energy efficiency and payoff throughout history. Once you have read some of them, you get the idea. He substantiates everything with a lot of numbers. Then everybody can try to check it against other sources. His sources are good enough most of the time in my view.
Is anyone aware of a source for up to date transit information for the Strait of Hormuz other than IMF Portwatch linked below?
https://portwatch.imf.org/pages/cc317ba850e34c4dadbead6f7b336fb1
The continued actions and associated chaos from the Trump administration continue to be a bit surreal, but certainly no surprise.
T Hill,
Sal Mercogliono’s site ‘What’s Going on with Shipping’ is THE preeminent site for all relevant maritime happenings with the Hormuz situation currently dominating Sal’s daily+ postings (~20 minute highly informative/entertaining videos).
Actual real time ship status can be had at the marinetraffic.com site (map option), but interpreting the myriad icons can be daunting.
Plus, transponder shut offs and ‘spoofing’ can confuse an outside observer.
Thanks Coffee. I typically avoid video due to the low information density. Sal’s 4/18 clip breaks that mold. Excellent.
T Hill. Wouldn’t it be nice to have an interactive assistant that is excellent at filtering video and podcast down to the high density content that is tuned to our particular requirement? For example skipping material that we have previously digested, and serving up curated content at moments notice.
I think that capability is now at our fingertips, or close.
Consider how much faster you could have progressed with your studies if you had such capability from the start, along with an ‘always on’ tutor.
Up above there is talk about Trumps erratic behavior and mental health/dementia.
I don’t buy it.
I mean I don’t see anything new in his mental function, other than that he has exhibited a slight shift since 2015 now being less restrained by the normal balance of power that presidents are exposed to.
He is surrounded by ‘yes’ men and has the Supreme Courts grant of immunity in his pocket.
He has been a man of poor character and is poorly read, having achieved power by inheritance and a unique ability to ‘wheel and deal’, bluster and bully. None of this is new, rather it has been clear as day for decades to anyone who has taken a moment to look and listen.
And I say shame on you…all of you who have volunteered (or accepted payment) to be a member of his team, anyone who has laughed at his juvenile or rude quips, anyone who gave a vote to him in any election, or who has ever logged on to his social media shitstream, including twitter/X. The republican party needs to completely clean house from any official/member who been a supporter, all having failed the test of moral integrity.
This has all been obvious from before the start.
People who have any association with him are disqualified from any support/vote from me. They have demonstrated extremely poor judgement. And yes, that absolutely applies to Vance, Rogan, Nikki Haley, Warsh, Tulsi Gabbard as just a few examples of thousands.
Hickory
As an outsider, what surprised me about the last US election was how many US citizens forgot Jan 6. All of the signs of a dictator who wanted to retain power were there. How could the voters forget or ignore that little fact.
Hickory,
Agreed, 77.3M voted for him a second time with what was or should have been full awareness of what was coming. For energy and the conversation on this site that means things that were easy to anticipate such as:
1. Efforts to block wind, solar and development of low carbon energy.
2. Efforts to block EV tech and growth
3. Continued and increased support for midwest/republican ethanol production.
4. Increased direct and indirect subsidies for the fossil fuel industry.
5. Military action against Venezuela and Iran
6. General anti-science approach to energy, climate, health, etc.
And, all of this with as little attention to the rule of law as he can get away with. Certainly a number of these votes related to the above items were linked to voters wallets. However, articles like the one below make it clear that motivations for many had very different drivers.
Piazza & Van Doren (2025), It’s About Hate: Approval of Donald Trump, Racism, Xenophobia and Support for Political Violence
https://pmc.ncbi.nlm.nih.gov/articles/PMC12333664/
Ovi,
I would suggest that a majority of these people did not forget or ignore Jan 6. For them, this was a feature and not a bug.
Nobody hates this kind of insane behavior more than me. I’ve lost two close family members, who died prematurely because they were following their religion. This kind of cult behavior makes me absolutely crazy.
But…I think we have to understand that these followers are victims. They grew up in a culture that taught them to obey authority and fear people who are different. They’ve been bathed in misinformation, fear and hatred by their family, friends, religion and the media they follow – Fox, talk radio, social media, etc.
They’re victims, and I only wish we understood how to deprogram them.
Ovi, yes I am surprised at the same. Shocked to put it more accurately. And he pardoned them all without any significant pushback from the republicans.
Going back further I was shocked that in 2015 the republicans picked him as their candidate…a man of such blatantly poor character.
To me picking character is more important than particular issues, when it comes to picking the president especially. Someone with good character knows the value of having trusted and respected allies and trading partner relationships, for example. They know that being a good role model is a paramount part of the job.
Excellent points T Hill
Interesting comments by Mark Carney at link below
https://www.cbsnews.com/news/mark-carney-canada-us-close-ties-weakness/?utm_source=firefox-newtab-en-us
EIA post on World Oil Stocks from April 20, 2026
https://www.eia.gov/todayinenergy/detail.php?id=67504
ND February Oil Production
Production rose by 4 kb/d to 1,130 kb/d.
A ND
Trump cites defense production act to sign energy-related memorandums
“President Donald Trump invoked the Defense Production Act on Monday to sign a series of energy-related presidential memorandums, the White House announced, as his administration aims to tackle rising fuel prices as a result of U.S. and Israel’s war on Iran.
Trump signed memorandums on coal supply chains, domestic petroleum production, natural gas transmission and liquefied natural gas capacity.
“Today’s determinations allow the Department of Energy to use funding secured in the One Big Beautiful Bill to strengthen our grid infrastructure and unleash reliable, affordable, secure energy,” White House spokeswoman Taylor Rogers said on X.”
Not quite sure what this means. Does it allow the DOE to pay companies to drill for Oil?
Meanwhile Chinese exports of solar panels doubled overnight.
https://electrek.co/2026/04/22/china-shipped-a-record-68-gw-of-solar-in-march-heres-why-it-matters/
At this rate they’d be exporting 815 GW of solar a year, though it probably won’t be sustained. Most of this is to sunny South and Southeast Asia, and to Africa. If you figure 20% capacity, that comes to about 160 GW of constant output.
Compare that to nuclear: About 380 GW worldwide, running at maybe 85%. That’s about 320 GW of effective capacity. At this rate, new solar would surpass it in two years. And that doesn’t include China’s own solar buildout, that’s just exports.
For those of you who like to consider the energy supply system beyond (in addition to) fossil fuels , things like nuclear, wind, solar, geothermal, hydro, storage etc
I suggest you consider the possibilities detailed in the piece I’ve linked below. Interesting to ponder, and I think the author is well grounded/fact based.
90% is a high goal, but for many parts of the world 60, 70, 80%
is well within reach as the economics and technology now sits.
I’m not talking about Glasgow, but Lyon, Atlanta or Istanbul yes indeed.
https://nworbmot.org/blog/solar-battery-world.html
Into maps?
https://globalsolaratlas.info/map?c=9.142594,-22.678721,3
Cool map. The system I’m getting installed in the coming weeks is just under 10 kWp and estimated to make about 7,400 kWh. annually. And that’s in foggy wet England.
This is using new 485 watt Longi Hi-MO panels.
Wow…485-watt Longhi Hi-MO X10!
“The 485W LONGi Hi-MO X10 solar panel (specifically the LR7-54HVH model) features a 30-year linear performance warranty that guarantees at least 87.4% of the original power output after 30 years”
Sweet.
When I was younger I’d hear guys talking about their hot rod engines like that.
Did you ever imagine that you would be an independent power producer?
This was a free upgrade from the REA Fusion2 panels that are bifacial, but lower output. So quite chuffed with that. Didn’t think I’d be able to cover my own use and export much, but getting 20 panels (cheaper to do it all at once and not do some panels and then maybe expand at a later date) seems to have given me a potential pay off time of barely 6 years. And that’s with energy bills at the present rate, to say nothing of increased ones thanks to a certain strait.
Given my little bungalow and my recent tinkering with the heat pump to get every minor efficiency bump I can, I can certainly see myself becoming a little power station in the summer at least.
Just need a smart meter that works again so I can take advantage of export tariffs that allow my battery to discharge at peak times and recharge when it’s cheap at night.
Gotta say, the subsidence issue cutting my gas off and making me consider this switch just before the world went to shit thanks to Trump hitting Iran was a blessing in disguise. Was not fond of spending £400 a month on resistive heating and boiling water on a portable induction hob for four months, mind. Now to check my e-bike and get back to cycling to work as it gets sunnier.
Thanks Hickory, very interesting!
Kleiber,
That sounds great. Can you share your cost detail with us?
Sorry, only just noticed this comment. The system all in is around £13k with the newer panels being only an extra £200 on the original quote for the REA Fusion ones. That’s a 14.4 kWh. Alpa ESS battery and inverter set and 20 panels coming to around 9.7 kWp.
Wow. £1.3 per peak watt, including a 1.5 hour duration battery, is great!
Hi there Ovi, thank you for the continue work on these data.
Very difficult to get the full picture out of Russia, two weeks ago local officials anonymously admitted some wells are being shut in:
“Russia’s major Baltic Ust-Luga port suspended oil exports a week ago after heavy drone strikes and fires. As Ukrainian drones target both export infrastructure and domestic refineries, Russian oil pipeline system has become choked with oil and storage is filling up, the sources said.
That means some oilfields will have to reduce their output to avoid flooding the system further, they said.”
From this piece: https://www.msn.com/en-ca/money/topstories/exclusive-russian-oil-output-cuts-are-unavoidable-as-drone-attacks-shrink-exports-sources-say/ar-AA1ZZAy7
Since then both export terminals in Novorossiysk and Tuapse were bombed again, with storage facilities also hit. Over last weekend the heat from the burning fuel and crude in Tuapse was such that many dwellers fled. Amazing images:
https://mastodon.social/@[email protected]/116435220863507410
Some sort of death spiral is about. Wells are being shut in, all the while labour and technical tooling to repair the damaged infrastructure grow scarcer. Likely a more lasting drag on world crude extraction than the closure of the Strait of Hormuz.
Prof Robert Pape lays out the current situation in the USrael Iran conflict: Iran’s emergence as a global power. See https://substack.com/home/post/p-194792228
The economic consequences will be profound. Major disruptions to the flow of oil provoke major disruptions to the flow of cash. I am struggling to understand what will happen to oil markets.
Schinzy
T has created the world’s fourth super power, Iran. With T declaring an open ended ceasefire, the waiting game begins now.
The US is waiting for Iran to succumb to the daily loss of $300 M$/d. How long can they hold out?
Iran is waiting for T to succumb to the rising price of oil and US gasoline. As long as Iran can stop roughly 5 Mb/d to 7 Mb/d of oil being delivered by SA, Kuwait, UAE and Oman to the world every day by blockading the straits, the price of oil will slowly climb by a dollar or two every day and US gasoline will rise by a few cents every day.
That is the setup/standoff that was created today. How long will it last and how will it end? Will it be TACO or something else?
Thanks Schinzy, very interesting.
ERCOT is the grid operator for the state of Texas.
“Texas Power Demand Could Quadruple by 2032, ERCOT Warns”
https://oilprice.com/Energy/Energy-General/Texas-Power-Demand-Could-Quadruple-by-2032-ERCOT-Warns.html
And yet the energy system of the state is Gung Ho on exportation of domestic fuels.
Gung Ho was know as the most enthusiastic man to have ever lived. Song Dynasty 1097
in a flight from Shanghai to Dallas, I met a team of Chinese engineers who are heading to Texas to build data centers, with the designs of data centers in China and with 3-Electric integration (Wind/Solar, Battery and Metro integrated), cooling and almost all hardware made in China, they even claim they have servers built with 3rd party GPUs from TSMC.
“and Metro integrated”
What does that mean? Grid?
US tight oil output using EIA data linked below
https://www.eia.gov/outlooks/steo/xls/Fig42.xlsx
Chart at link below, looking pretty flat since Nov 2024, perhaps higher oil prices change that, but we may need more active horizontal drilling rigs to accomplish the task.
us tight oil
For those interested in refining and Fluid Catalytic Cracking there is a new post on Mike Shellman’s Oilystuff blog. Makes a change from debating Trumps mental state and the Straits of Hormuz.
https://www.oilystuff.com/group/oil-natural-gas-refining-stuff/discussion
https://mishtalk.com/economics/insider-trading-by-the-trump-administration-or-its-hot-connections/
massive insider trading by Trump Administration.
Pardons will be given to anyone caught.
A professional cyber security analyst has been monitoring these trades and correlating with Trump’s erratic comments.
Are the Trump’s buying the dip?
which might explain why Trump says one thing and changes it hours later.
Just another reason for impeachment in 2027.
How much gold do the pardons cost?
Rig Report for the Week Ending April 24
– At this point there is no indication that higher WTI prices are attracting increased drilling.
The dropping rig count that started in early April 2025 when 450 rigs were operating dropped this week. Drilling continues at a steady rate of 367 ± 5 rigs per week since August 2025 while WTI closed just shy of $95/b today, up $11/b from last Friday.
– US Hz oil rigs dropped 2 to 367, down 83 since April 2025 when it was 450. It was also up 5 rigs from the low of 362 first reached in the week ending August 1, 2025. The rig count is down 18% since April 2025.
– The New Mexico Permian rig count dropped by 1 to 86 rigs. Eddy dropped by 2 to 35 and Lea added 1 to 51.
– Texas was unchanged at 176. Midland and Martin were both unchanged at 22 and 26 respectively. There were very few changes among the larger oil producing counties and minimal internal shuffling within Texas. Loving added 1 to 19 and Reagan added 1 to 7.
– Eagle Ford dropped 1 to 32.
– NG Hz rigs rose by 4 to 114.
A Rig
Frac Spread Report for the Week Ending April 24
The frac spread count rose by 4 to 169. From one year ago, it is down by 36 spreads and is also down by 46 since March 21, 2025.
A Frac
Ratio of Frac Spreads to Oil Rigs
This ratio has been bouncing mostly between 0.44 and 0.46 since January 2025. The excursions out of this range are primarily due to the Xmas season drop in frac spread crews heading home for the holidays.
The big drop from 0.62 in January 2024 to 0.45 in July 2025 and April 2026 may be due to the introduction of multi-frac spreads which are still being counted as one.
A Spreads
Ovi,
There has been a move to efrac fleets and also to larger horsepower equipment. So a frack spread in 2027 is different than a frack spread in 2024. Similar changes might have occurred in the drilling rigs, but maybe the rate of technological change was different. May have been faster for frack spreads than drilling rigs, but I do not have any evidence, speculation on my part. Mr Shellman would obviously know more than me.
Dennis
WRT rigs, the higher HP power results in shorter drilling times or longer wells.
Switching to efracs does not change HP but it will reduce CC emissions. Not sure if it would reduce costs. I would be surprised if costs were reduced in switching from cheap portable NG generator to stringing a power line to bring electricity to a site.
The big change in frac spreads has been the introduction of Simul-frac spreads. I may have used the wrong word in calling them multi frac spreads.
Ovi,
A higher horsepower frack spread allows more wells to be fracced at one time and likely allows more wells to be fracced by a frac spread in a given amount of time. Essentially simulfrac on steroids. An efrac setup allows higher horsepower at lower cost. Associated gas can be used to produce electricity at low cost if electric power is unavailable.
Fossil fuel advocates would have us believe they can build a fire brighter than the sun. The hubris is unbelievable.
Just go out into any empty field at dawn and watch the sun turn darkness to light, and in a few short hours heat the entire area to the horizon on all sides by thirty degrees or more. How many power plants and oil rigs would you need just to do that? And that field is just a dot on the map.
These projections seems pretty obvious, as some of have pointed out here recently-
“International Energy Agency chief Fatih Birol says the Iran war has permanently changed the fossil fuel industry and will accelerate a shift toward renewables, nuclear power and electrification at the expense of oil demand…
Birol told The Guardian that the damage to confidence in fossil fuel security is permanent, and that countries exposed to the Strait of Hormuz disruption will rethink how much geopolitical risk they are willing to embed in their energy systems.”
I’d add that fossil fuel sourced from low risk reliable trading partners will remain in high demand.
For most of the world the US is not in a category of ‘low-risk reliable trading partner”.
Well, I can’t think of any consumers of oil (from Texas to Maine, from London to Seoul) who aren’t exposed to the risk of high oil prices. Our president seemed to think that the US was shielded from oil risk by domestic supplies, and was blindsided by our current pricing. He should have known better, and if he had any competent advisors, who weren’t afraid to tell truth to power, they would have told him. Of course, prices could rise a fair amount – IMO that’s very likely.
And NG is mostly the same – many countries are being very surprised by price increases.
And finally, pollution (in general and GHGs in particular) is a real and large cost. Investors should price in the risk of investing in FF assets whose ROI depends on a long life – there’s a very significant risk of such assets being stranded by events (such as climate disasters that suddenly give politicians freedom to handle such costs appropriately).
Responding here to a couple of upthread posts.
Ron,
Thanks for the link to the book review on the work by Smil. The author of the book review cites Roger Pielke as his source for climate information and spends quite a bit of the article based on that source. Huge red flag.
A shorter work by Smil that has some similar points as this particular book of his can be found in a 2024 report cited below.
Halfway Between Kyoto and 2050 Zero Carbon Is a Highly Unlikely Outcome
https://vaclavsmil.com/wp-content/uploads/2024/06/HALFWAY.pdf
I’m up to about 35 years of professional practice now on the concrete and steel parts of Smil’s pillars of civilization and also tend to agree with many of his arguments. As an aside, this personal experience also contributes to my skepticism about the current urban planning assumptions about the relative efficiencies of urban environments.
Hickory,
Yes, an ever-present personal tutor could have been quite a boon in many respects. I have read a number of articles recently which describe the largely successful experiences of a number of experienced, respected professors in using AI to attempt to replace themselves. However, I am reminded of my great disappointment when I recently returned to my first uni and found one of my favorite libraries empty of physical books. I recall spending hours pulling book after book off the shelves to wander through them. I wonder if I would have ever stumbled across Robert Maillart or that first beautiful old Kachelofen with a personal AI tutor, or if I did would they have had the same impact.
T Hill
I have to appreciate your posts. I have yet to try to discover something that I strongly oppose in them – but I have not found anything at all.
When it comes to urban planning you get the benefit of serving more people with the same infrastructure. Why not build more scyscrapers based on concrete and steel? A lot can be said about urban planning, but it is probably based on too ambitious assumptions. Building water/sewage infrastructure that can last a hundred years and are maintenance friendly as well would help. Along with building bridges that are meant to last.
I actually think AI is great, but I am a bit worried about everything getting too complex. I guess the math behind it is that whatever we put into computers and data centers are worth it compared to the benefit overall for some extended time period.
Thanks Kolbeinih.
Yes, there can be some efficiencies of serving more people per unit of local infrastructure. But, what is the total footprint of these cities?
The issue of urban vs rural efficiency and sustainability is a question of accounting that is large, messy and with a good deal of uncertainty. Like EROI, it is also an accounting balance that is subject to selected boundaries. This makes it difficult to be certain, but my skepticism about cities winning this comparison is linked to:
1. Available studies (some) that show rural areas are more efficient and sustainable. A portion of this can also be attributed to increased consumption in cities due to the tendency for wealth concentration.
2. Fundamental break in ecological nutrient flows in cities.
3. Inexorable nature of entropy on the built environment. Rust never sleeps.
4. Personal experience with the incredible contrast in cost and complexity of physical infrastructure in dense urban areas vs smaller villages/cities or more rural areas.
5. Locations of a large share of cities in areas particularly vulnerable to risks including seismic, drought, sea level rise, etc.
“ incredible contrast in cost and complexity of physical infrastructure in dense urban areas vs smaller villages/cities or more rural areas.”
Of course, but dense urban areas are…dense. Rural infrastructure can be relatively hard to maintain: long distances, low incomes to provide funding, etc. The urban per-capita physical infrastructure may not be any greater. The urban funding burden may be lower.
The real question: As you say, analysis is very hard. But…are there any half-way decent analyses of the per-capita maintenance cost of urban infrastructure vs suburban vs rural?? And maybe even an adjustment for relative incomes? (I know I’m dreaming, but I gotta ask.) All I see in either direction is hand waving…
One last thought – the cost of educating immigrants and the poor falls more on urban school systems than on suburban or exurban systems – rather by design. For example, NYC spends about $40k per student!!! Rural schools, on the other hand, typically are just badly underfunded. These things really need to be factored into such a comparison.
Nick,
Yes, there are some analyses of this issue. I cited a number of them recently. You pointed to a single one with the attention grabbing title by Rees. Read the others and then another dozen or so beyond that. I believe the evidence points more towards rural sustainability and efficiency.
I would also suggest you revisit the facts on poverty in urban vs rural US, infrastructure funding and school funding. I think you’re a bit off the mark.
Yes, there are challenges to both rural and urban infrastructure maintenance. Been there, done that. In both settings. From small scale to large scale.
T Hill,
Well, you did say “My interest is in the consequences on both sides of the faustian bargain that we’ve made with oil and other fossil fuels. That’s my lens for most of the discussion on this board and for this land use issue.”
So, if oil & FF is your lens, isn’t that what I should have addressed? That quote says to me that you’re arguing that Peak FF is the central problem with urbanization. And, I would disagree with that – it’s seems very clear that renewables and electrification can move faster than depletion.
If you’re arguing that the transition towards net-zero is too slow to properly reduce the risk of climate change, and that urban efficiencies are small or non-existent, that’s one thing. It’s a reasonable argument, but it’s very different from a Peak FF argument.
And, I just looked at the list of studies again, and they all seem to be about energy. I’m looking for an overall analysis of costs, not something that only looks at energy.
If we’re looking for a good and comprehensive quantitative analysis of the relative costs of urban vs rural infrastructure, what study would you suggest that I start with?
—————————
Possibly I should explain my POV. I’ve done a lot of consulting work for government, and one of the interesting questions that governments often face is cost comparisons between jurisdictions. In particular government is responsible for infrastructure, so it would be interesting to find good analyses.
OTOH, if you’re only interested in energy, I’d be fine discussing that. But, we should be clear what we’re discussing…
Nick,
You remain off the mark for this issue despite your attempted spin.
Financial cost might be the right lens if you are balancing a budget in a single point in time in a single muni. It is not a particularly useful lens for the question about the relative efficiency and sustainability of rural vs urban settings.
For example:
1. How would currency exchange rates be normalized in a consistent and accurate way?
2. How would you normalize costs over the long life of the built environment, and do so across different munis in a consistent and accurate way?
There are many others. Regulatory cost burden variation, mixed private and public costs, mixed levels of government costs,….
“You remain off the mark for this issue”
Well, which issue? Overall cost, or the much narrower issue of energy?
“ despite your attempted spin.”
I’m disappointed at the implication of a deliberately misleading presentation. I’d remind you that the viability of complex urban areas is well accepted in the mainstream of energy analysis, and that the idea that Peak FF will cause the collapse of complex urban areas is definitely a fringe idea. In other words, it’s an unusual claim that bears the burden of proof. Actually, I’d make a stronger argument: the idea that transportation between rural areas and cities will fail just makes no sense. Electric trains and electric trucks have been around for 100 years, and China is seriously ramping up replacement of heavy trucks and related equipment across the board.
The idea that farming will collapse without NG is highly unrealistic. NG is only needed to produce H2 to combine with nitrogen to produce NH3 (ammonia). H2 can be produced electrolytically – this is a mainstream and proven tech. “Green” fertilizer might cost 2x as much as “grey” fertilizer. This is trivial: it would raise food costs less than 1% in the US (US total fertilizer spending is about $20B and total US food expenditure is about $2.6T, so fertilizer is less than 1% of food cost, and doubling that would add less than 1%).
“How would currency exchange rates be normalized”
Well, if we’re comparing rural California with urban California (or comparing areas within any country), we don’t have currency issues, right?
“normalize costs over the long life”
We can adjust for inflation. What other problems do you anticipate?
“There are many others”
Well, sure. That’s what makes such analyses difficult. I’ve seen a lot of superficial comparisons – as you say, a lot of complex costs have to be included – overhead allocation, for instance, is a subject all of it’s own – I’ve done my share of those studies. On the one hand it can be done with sufficient time and care. OTOH, even a beginning attempt at serious, transparent analysis would be helpful. One step at a time…
Nick,
Yes, I do interpret your comments here and elsewhere as spin.
I list 5 specific points above in response to a query from another comment. None of these 5 points suggest that peak FF is the central problem of urbanization as you state. None of these points suggest that transportation between cities and rural areas will fail as you state. I could go on.
I do appreciate some of the reference material you cite like the recent Ember study.
Thank you for elaborating on the theme!
First of all T.Hill, but also Nick G.
There are some experiments ongoing from my hometown (Oslo) involving high raise buidlings (20-30 floors) using as much renewable materials possible together with the whole building running on ground heat through a pump system for heat. It takes time get some results regarding the economics of such an experiment.
Some natural features make some areas more habitable. Rivers, temparature variations and steady precipitation are on the top of my mind. Erecting 2-4 floor buildings situated near river systems using much less steel and concrete, using electrical transport/less personal transportation/less commuting is of course ideal. The whole plan have to include supporting less ideal areas as well. We are undoubtedly exploring what is possible using more electricity and less fossil fuels in the mix going forward.
T Hill,
I’m still not quite sure what you’re unhappy about. Is it simply that you feel that I’m misinterpreting your concerns? If so, that’s unfortunate. I hope my previous comments will be useful, if not to you then others.
So – your concerns are summarized in the 5 points?
Well, I took another look at them – it seems to me that 1, 3 and 4 are basically the same concern: that cities are more difficult to maintain and operate than rural areas: efficiency, sustainability, entropy, cost and complexity are all about the work and other inputs required to run these areas.
5 is straightforward: I agree that sea level rise is going to be very difficult for some cities to handle. I doubt Miami or Bangkok will be here in 100 years. There will be very substantial climate migration.
2 also seems straightforward, but in the other direction: we’re simply talking about recycling things like phosphorus, nitrogen, trace minerals…this really doesn’t seem fundamentally difficult to do. We don’t do it because it hasn’t seemed essential, and it would be a big project – but it would be several orders of magnitude smaller than the work required to move 99% of the population back onto farms (less than 1% of the population lives on farms currently, and if we’re going to move people to solve a disconnect in nutrient flows,we’ll have to move them all out of cities – not just the big cities, but even the smallest).
So…we’re back to comparisons of the difficulty of operating and maintaining rural infrastructure vs urban. Seen anything that quantifies this??
A VLCC carries about 2 million barrels of crude and travels at about 15
knots or about 28 Km/hour. Travel time between the Strait of Hormuz and
final destination averages around 35 days. So there was a 35 day offshore
storage buffer between when the Iranians began filtering traffic through the
Strait and deliveries began falling. Conversely if everything went back to
the way it was before the USrael Iran war today, it would take 35 days for
deliveries to resume.
The spread between dated Brent and Brent has dropped to about $12. Still
high, but financial markets are starting to incorporated the fallout from the
supply disruption.
https://oilprice.com/Latest-Energy-News/World-News/UAE-Quits-OPEC-as-Hormuz-Crisis-Drags-On.html
UAE leaves OPEC and OPEC+ pretty big news.
https://mishtalk.com/economics/national-gasoline-prices-hit-the-highest-level-since-start-of-war-in-iran/
More analysis
Interesting news. Can’t say that I understand the timing. I don’t know when the UAE will be able to export normally. Looks like we have a standoff in the USrael Iran war with both sides claiming victory.
I’m with Schinzy. I can’t see the point in the short term.
I also haven’t seen any explanation in the long term either. Any ideas? Are they just mad at the Saudis?
My Guess: 1) the Saudi’s were the main force behind this war ($2B to Jared buys a lot of favors), and the UAE is angry about the war; and 2) the damage to ME oil & gas production facilities will combine with the current shortage to keep oil prices high for quite a while and the UAE wants to be free of quotas so they can produce as much as possible once the strait is open.
Nick G,
And where exactly will the UAE be exporting this oil to, given they need to pass the strait ?
Iron Mike,
Yes, I wasn’t clear – I’ve edited it to fix that.
“ UAE Energy Minister Suhail al-Mazrouei has been telegraphing the direction of travel for a while. “Oil, no matter how much we defend it, it’s in decline mode,” he said in late 2022. “To assume oil is going to be there forever is wishful thinking.”
Abu Dhabi has been positioning itself as a peer to OECD economies rather than another producer in the cartel, with a $100 billion clean energy partnership signed with Washington and a national net-zero pledge for 2050. Staying inside OPEC was getting harder to justify.”
UAE wants to get out of oil while the getting is good, and it looks like that means maximizing production in the short term while it plans for a post-oil future.
For anyone interested in the impact of oil shocks/supply interruptions:
https://ember-energy.org/latest-insights/the-new-twin-fossil-shock/
Good stuff, thanks Nick.
Ember does excellent energy data collection/analysis.
Their annual global electricity report is chock full of info.
We are at a milestone in change right about now.
7th Annual report- Global Electricity Review 2026
https://ember-energy.org/app/uploads/2026/04/Global-Electricity-Review-2026.pdf
In the midst of discussing the UAE leaving OPEC, this guy cops to peak oil USA & the Permian.
https://youtu.be/hC_deZoJIrU?si=uEadftx10mc59xNF
Yeah, either the Queen collapses from peddling and UAE wants to profit from 5MBD rather than 2, or China furnishes the world with BYD and PV and demand collapse leaves all those billions in the ground.
As far as UAE, my take is the short term effect will be minimal. Once the Strait of Hormuz is open (maybe 2028?) UAE will be able to produce as much as the oil market will bear. Seems to me this may be the beginning of the end for OPEC. Time will tell.
As for motive, I think they no longer find it useful to be on the same economic team as Iran, Russia, and some other neighbors. Better to simply avoid those meetings and constraints, and to carve out their relationships/contracts independently.
US February Oil Production
February production was up 389 kb/d, rebounding off the late lower US January storm. Texas and NM were the major contributors to the gain.
A US
Just learned the UAE does have a pipeline, the Habshan – Fujairah pipeline, that enables them to bypass the Strait of Hormuz.
But only about 1.5Mbpd?
They say they’ve expanded their production capacity to 5M, and their OPEC+ quota was only 3M…
Nick,
Correct, at present about 1.5 Mb/d, longer term perhaps they build more pipelines in order to bypass the Strait of Hormuz.
Fujairah port just got bombed.
Rig Report for the Week Ending May 1
– At this time there is no indication that higher WTI prices are attracting increased drilling.
The dropping rig count that started in early April 2025 when 450 rigs were operating dropped minimally again this week. Drilling continues at a steady rate of 367 ± 5 rigs per week since August 2025 while WTI closed just shy of $102/b today, up $8/b from last Friday.
– US Hz oil rigs dropped by 1 to 366, down 84 since April 2025 when it was 450. It was also up 4 rigs from the low of 362 first reached in the week ending August 1, 2025. The rig count is down 18% since April 2025.
– The New Mexico Permian rig count dropped by 4 to 82 rigs. Eddy dropped by 3 to 32 and Lea dropped 1 to 50.
– Texas added 3 to 179. Midland and Martin were both unchanged at 22 and 26 respectively. There were a few small changes among the larger oil producing counties. Glasscock added 1 to 2, Loving dropped 1 to 18, Reagan added 1 to 8 and Upton added 1 to 12.
– Eagle Ford added 1 to 33.
– NG Hz rigs dropped by 3 to 111.
A Rig
Frac Spread Report for the Week Ending May 1
The frac spread count rose by 5 to 174. From one year ago, it is down by 27 spreads and is also down by 41 since March 21, 2025.
A Frac
interesting piece on the dilemma faced by the Trump administration in its war with Iran.
https://www.theweek.in/news/middle-east/2026/05/04/project-freedom-vs-war-powers-act-why-us-strategy-for-gulf-conflict-is-hitting-limits-at-home.html
An Update to US Oil Production has been posted
https://peakoilbarrel.com/us-february-oil-production-rebounds-2/