By Ovi
All of the Crude plus Condensate (C + C) production data for the US state charts comes from the EIAʼs Petroleum Supply monthly PSM which provides updated production information up to February 2025.
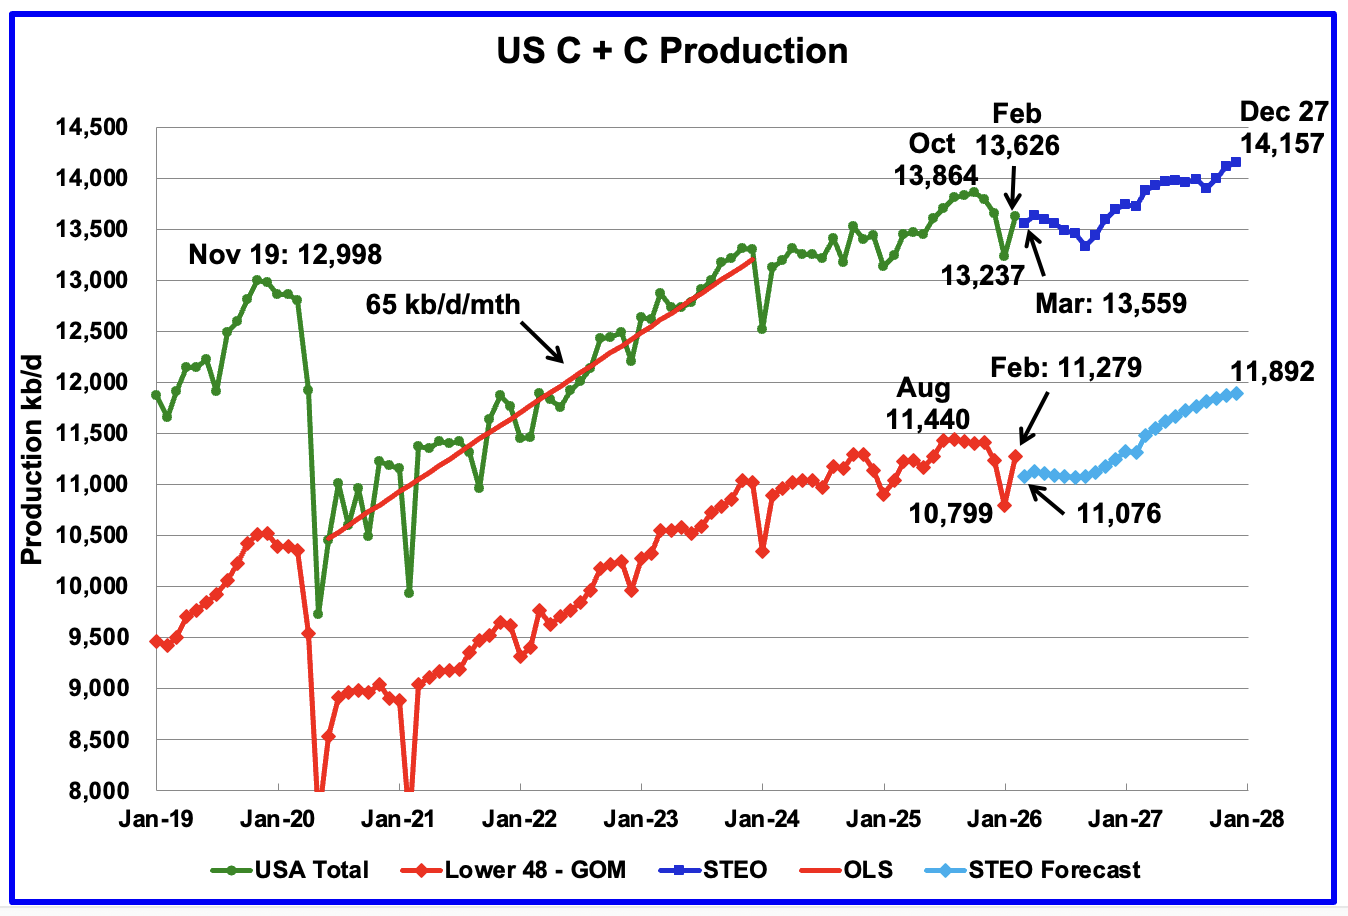
U.S. February oil production increased by 389 kb/d to 13,626 kb/d and is down by 238 kb/d from October. The largest increases came from the Big 2 states, TX and NM. March production is expected to drop by 67 kb/d to 13,559 kb/d according to the April STEO. Peak US oil production occurred in October 2025 at 13,864 kb/d but may be exceeded in early 2027, according to the STEO forecast.
The dark blue graph, taken from the April 2026 STEO, is the U.S. oil production forecast from March 2026 to December 2027. Output for December 2027 is expected to rise to 14,157 kb/d. From February 2026 to December 2027 U.S. oil production is expected to increase by 531 kb/d.
The light blue graph is the STEO’s forecast for the Onshore L48 output to December 2027. February Onshore L48 production increased by 480 kb/d but then dropped in March to 11,076 kb/d according to the April STEO. From February 2026 to December 2027 production is expected to increase by 613 kb/d to 11,892 kb/d. The rising production starting in September 2026, according to the EIA, is due to expected higher prices for WTI and more NG pipelines being built. Note how production is essentially flat out to October 2026.
U.S. Oil Production Ranked by State
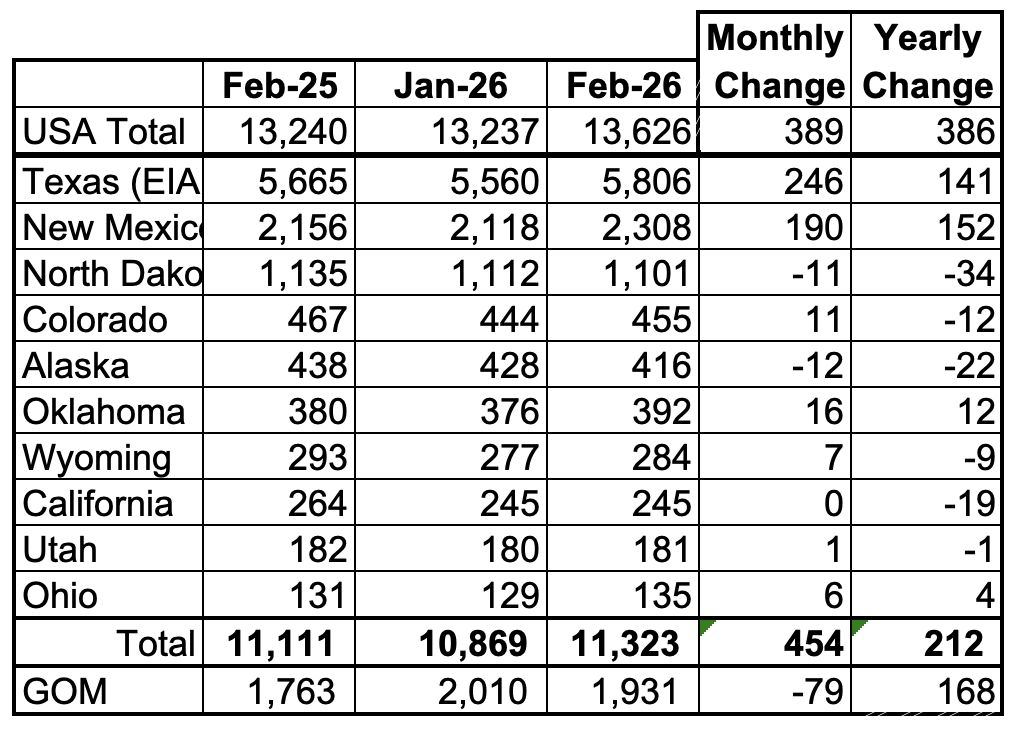
Listed above are the 10 US states with the largest oil production along with production from the Gulf of Mexico.
These 10 states accounted for 83.1% of all U.S. oil production out of a total production of 13,626 kb/d in February 2026. On a MoM basis, February oil production in these 10 states rose by 454 kb/d. On a YoY basis, US overall production increased by 386 kb/d with the largest contributors being Texas and New Mexico and the largest decliner being North Dakota.
State Oil Production Charts
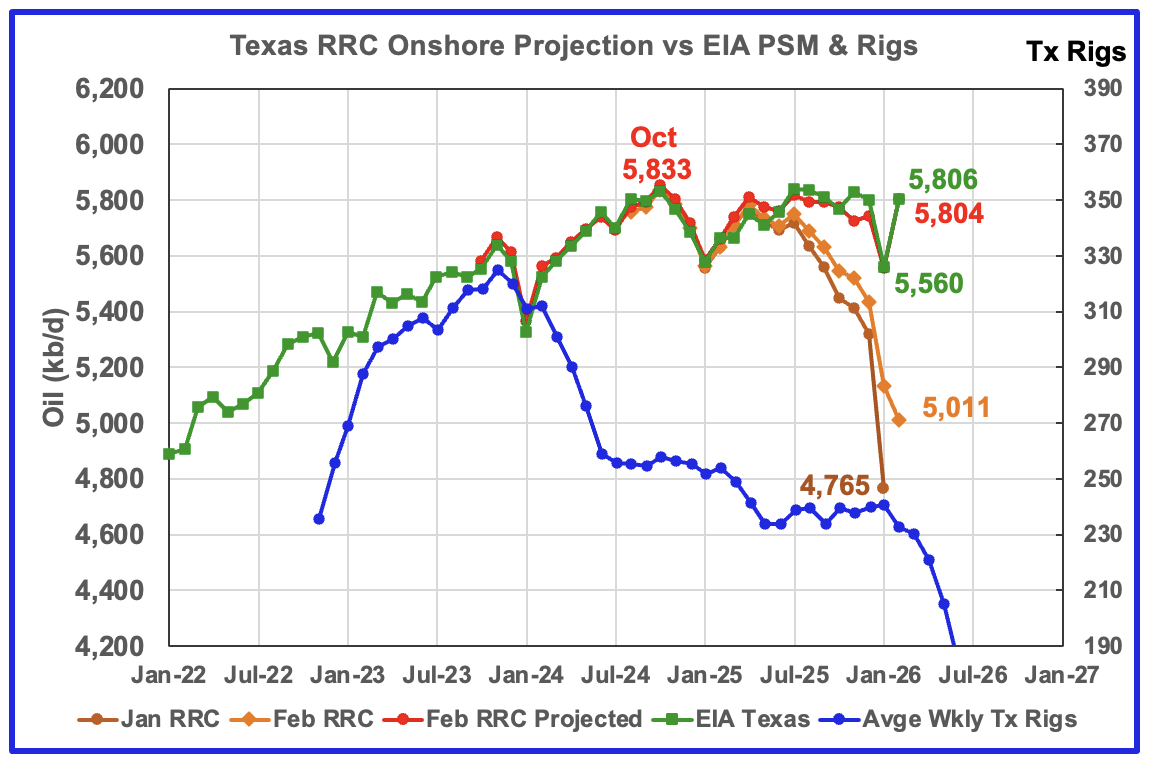
Texas February oil production increased by 246 kb/d to 5,806 kb/d according to the EIA.
The Texas’ RRC initial production for February dropped by 122 kb/d from January to 5,011 kb/d. The projection added 918 kb/d to raise February’s projected production to 5,804 kb/d. While the projection differs from the EIA estimate by just 2 kb/d, I think this is a fluke and is related to the large January production drop and February rise.
The red graph is a production projection using the January and February Texas RRC data.
The blue graph shows the average number of weekly rigs reported for each month shifted forward by 10 months. So the 276 rigs operating in July 2023 have been shifted forward to May 2024. From February 2024 to July 2024, the rig count dropped from 312 in time shifted February 2024 to 256 in July 2024. That drop of 56 rigs had little impact on production up to July 2025. August 2025 appears to be the first month when the impact of the start of a flat rig count is resulting in essentially flat production. Will the rig count drop starting in time shifted February/March 2026 result in dropping Texas production going forward?
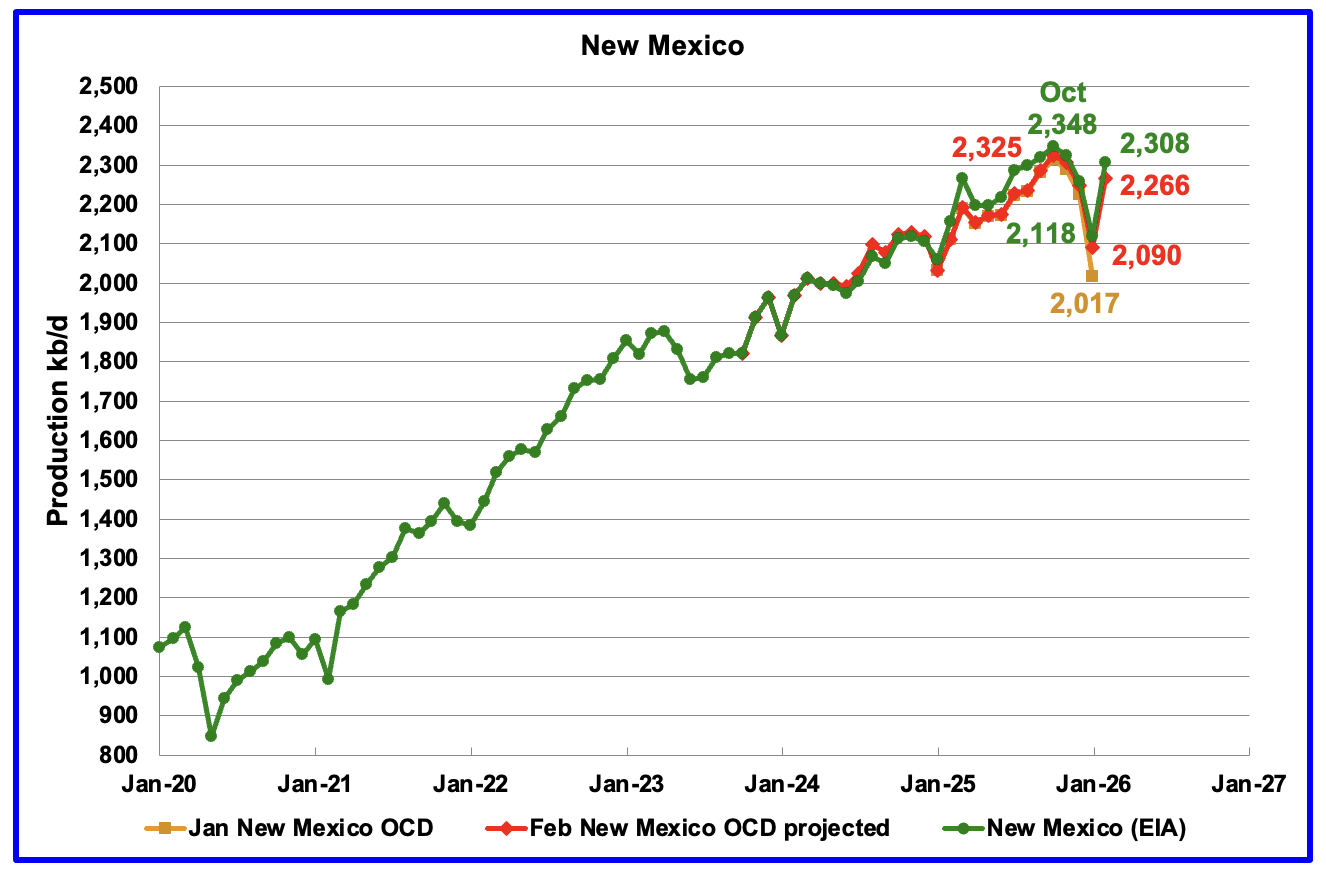
According to the EIA, New Mexico’s February production rose by 190 kb/d to 2,308 kb/d. YoY production rose by 152 kb/d, the largest contributor to overall rising YoY US production.
The red graph shows the projected output up to February and is calculated using the preliminary January and February NM OCD data. February’s projected production increased by 176 kb/d from January to 2,266 kb/d and is 42 kb/d or 1.8% lower than the EIA’s reported February production. While the numbers are slightly different, the trend is the same.
The largest contributors to the 190 kb/d NM increase came from Lea and Eddy Counties which rose for a combined 184 kb/d. See Permian section further down.
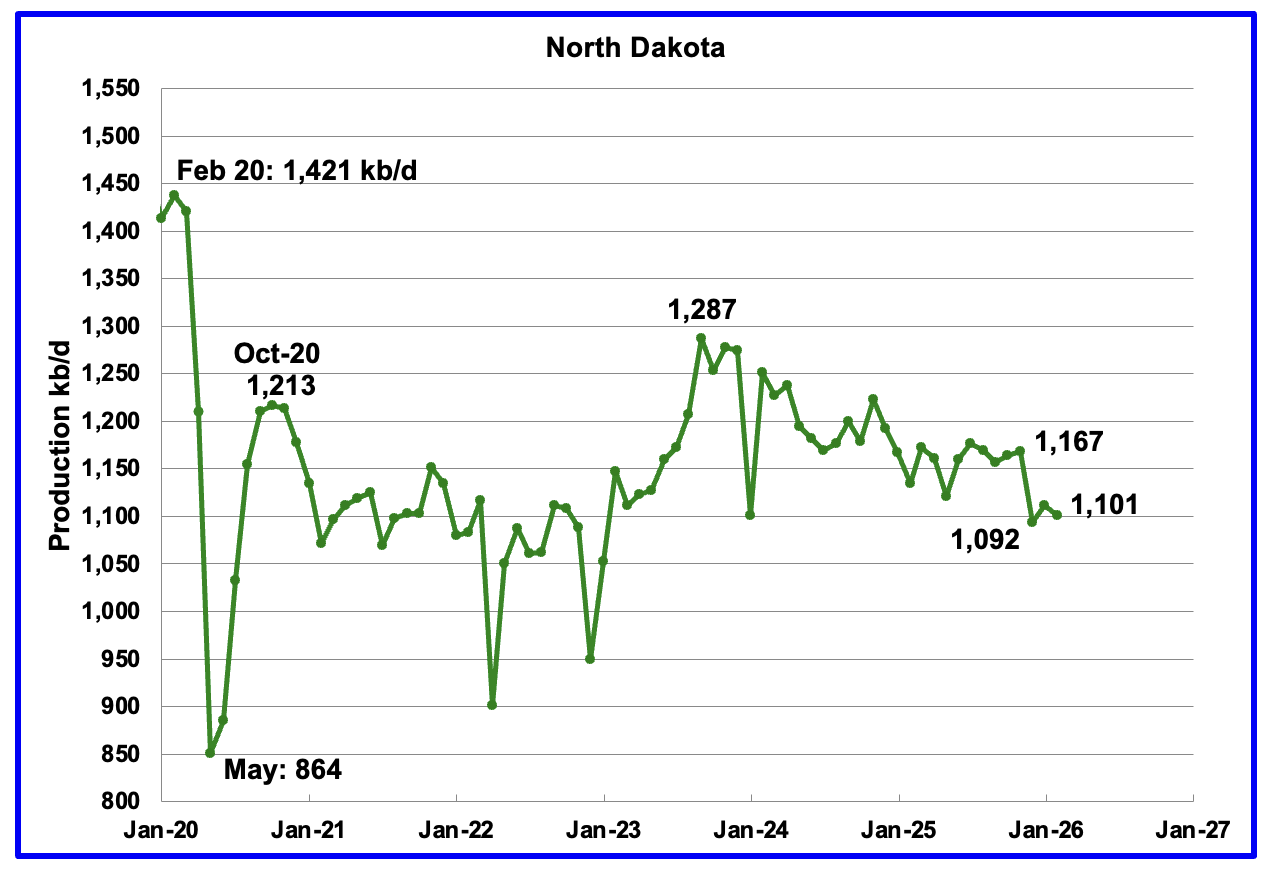
Production in North Dakota dropped by 11 kb/d in February to 1,101 kb/d, according to the EIA.
The North Dakota Department of Mineral resources reported February production increased by 4 kb/d to 1,130 kb/d, which is 29 kb/d higher than the EIA’s estimate.
According to this Article, North Dakota operators are getting an unexpected premium for their oil in April.
“North Dakota oil shipped on the Dakota Access Pipeline is fetching nearly $7 more per barrel than a U.S. benchmark price amid volatility caused by the Iran war.
State regulators aren’t sure why prices for North Dakota oil at its destination in Illinois are higher than traditional benchmark prices. One possibility is the light, sweet crude can be more easily refined into products like jet fuel and diesel that are experiencing demand surges in Europe and elsewhere.
How much of that higher price benefits North Dakota will be more clear in the coming months, said Justin Kringstad, director of the North Dakota Pipeline Authority.
“Royalty owners, the producers, the state, all share that uplift,” Kringstad said.
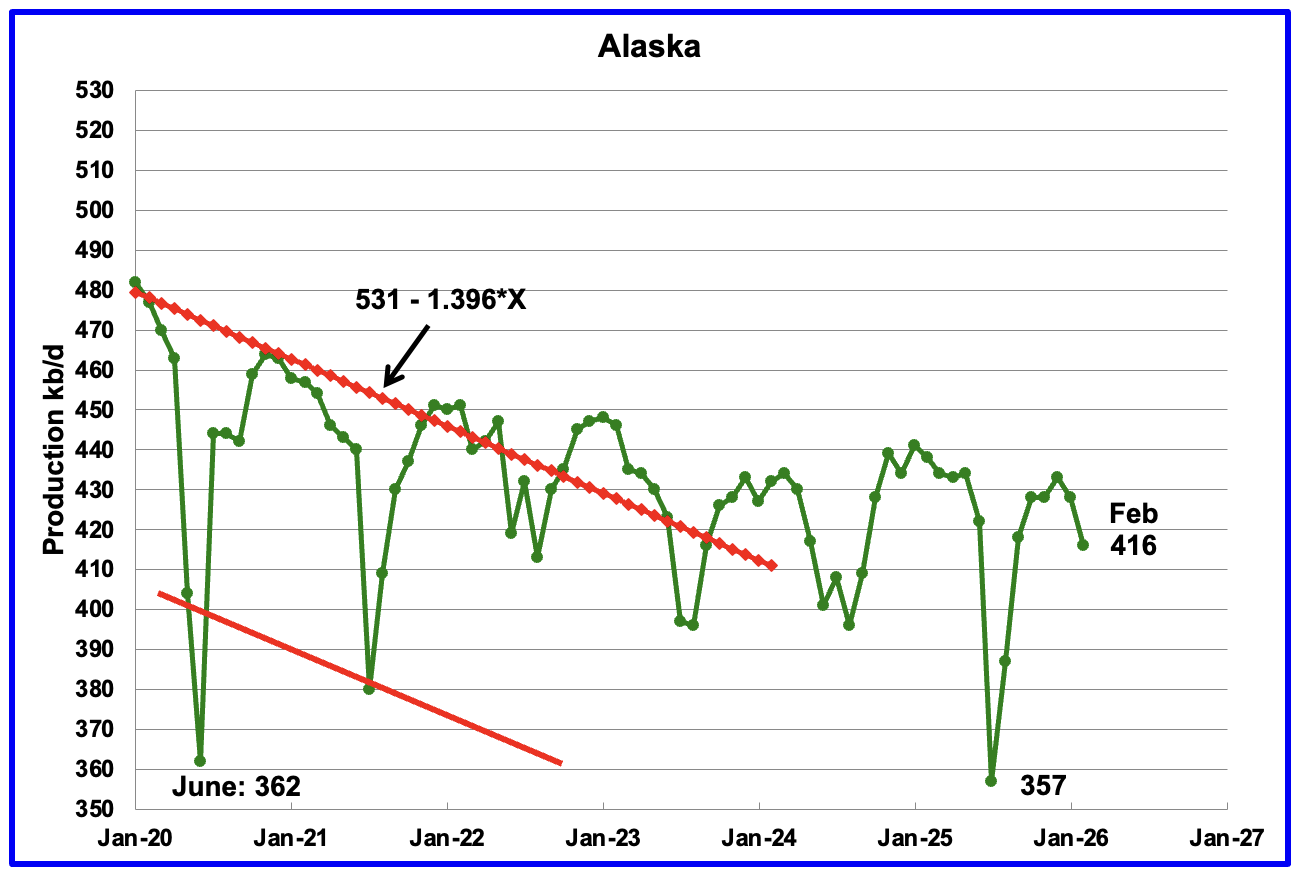
Alaskaʼs February output dropped by 12 kb/d to 416 kb/d while YoY production decreased by 22 kb/d. The EIA’s weekly reports indicated that February production would average close to 431 kb/d.
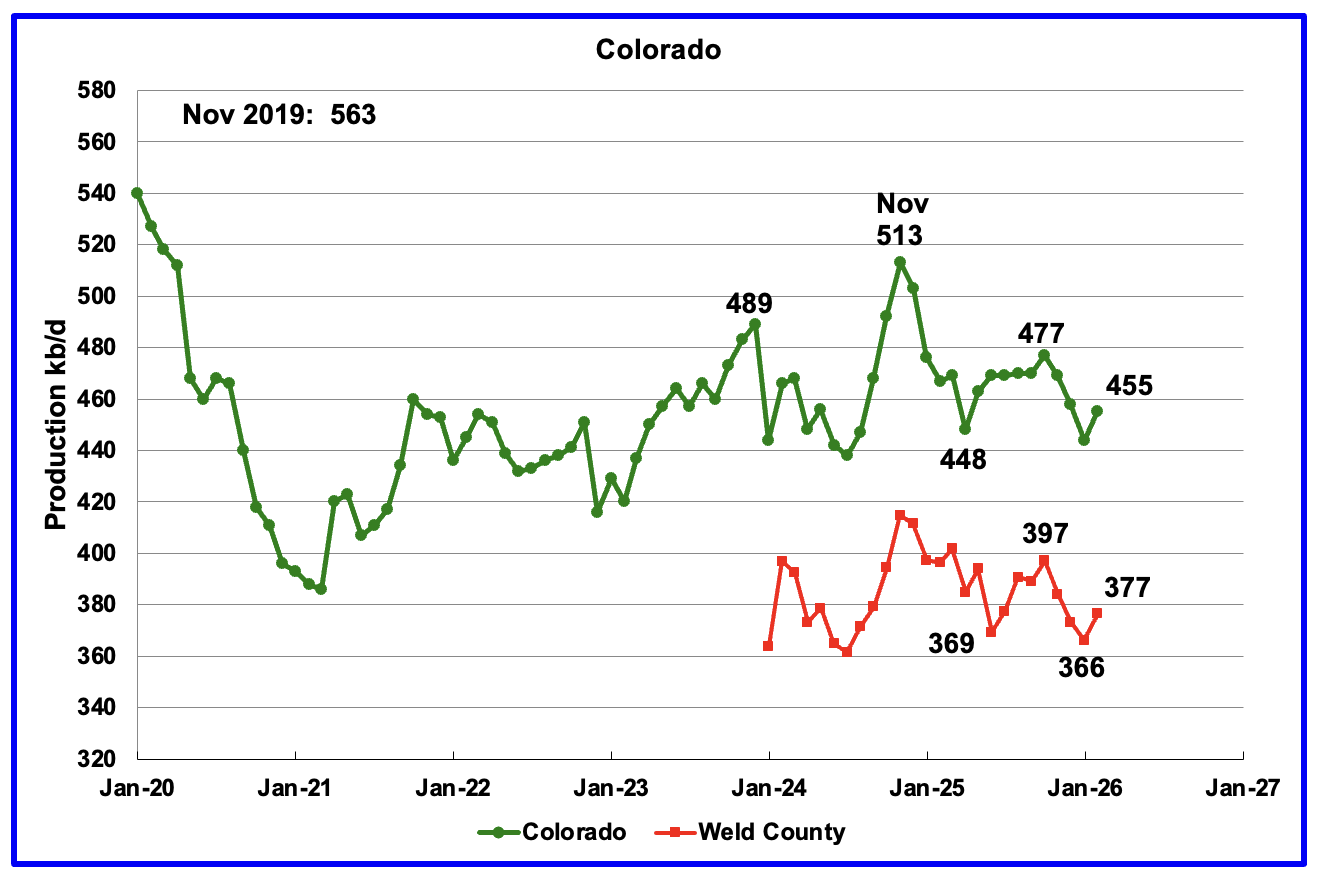
Coloradoʼs February oil production rose by 11 kb/d to 455 kb/d.
The biggest oil producing county in Colorado is Weld County and its production has been added to the chart. The two graphs have almost been parallel over the last six months. Weld’s production rose by 11 kb/d in February to 377 kb/d.
Colorado began 2026 with 7 rigs in January and they rose to 9 rigs in April. Of the 9 rigs, 7 were stationed in Weld county.
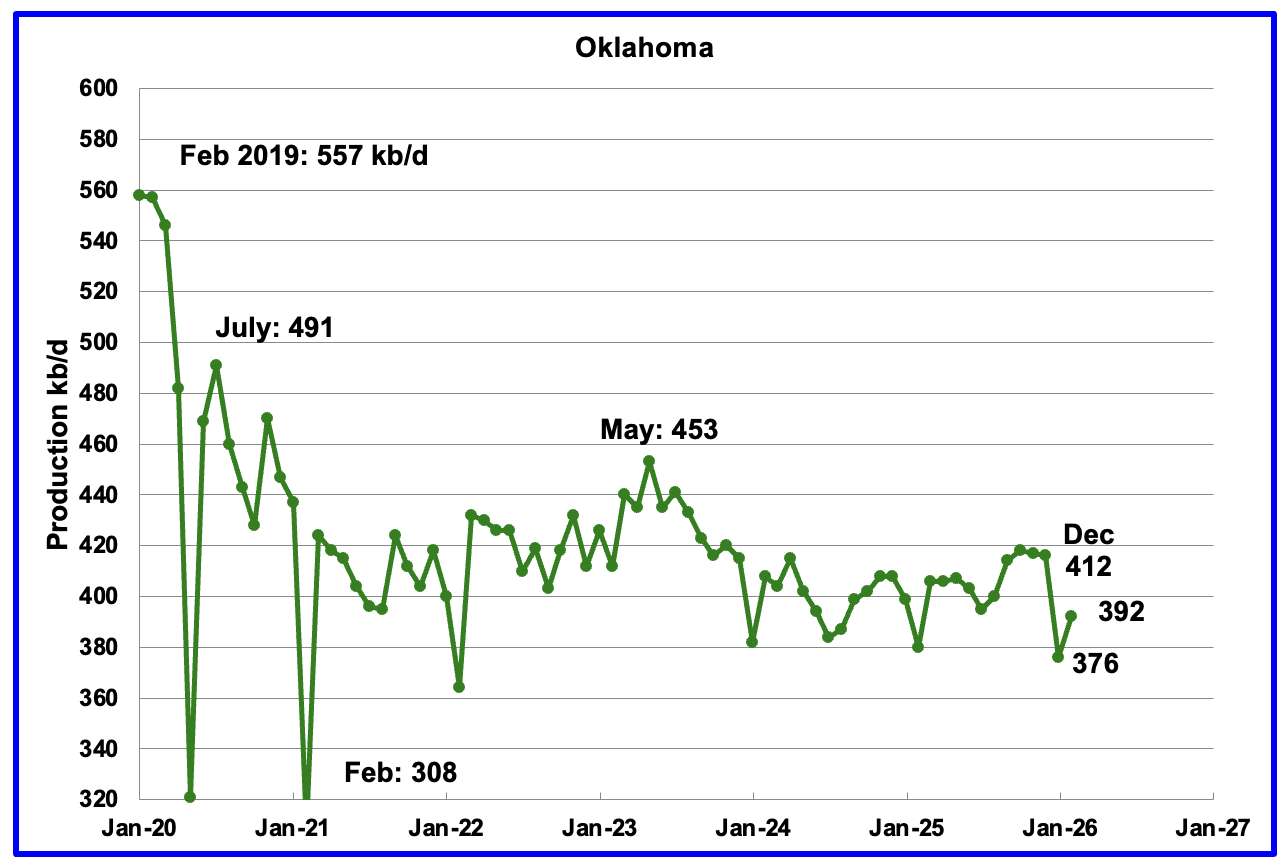
February oil production rebounded by 16 kb/d from January to 392 kb/d.
Oklahoma’s January output dropped by 38 kb/d to 376 kb/d. Production remains below the post pandemic July 2020 high of 491 kb/d and is down by 79 kb/d since May 2023. The large drop out of the 400 kb/d ± 20 kb/d range may be due to the late January extreme weather.
Oklahoma had 51 operational rigs in May 2025 which slowly dropped to 41 rigs in July 2025. The rig count has been fairly steady around 40 from July 2025 to April 2026. The steady rig count since July 2025 may be showing up in the steady oil production around 400 kb/d.
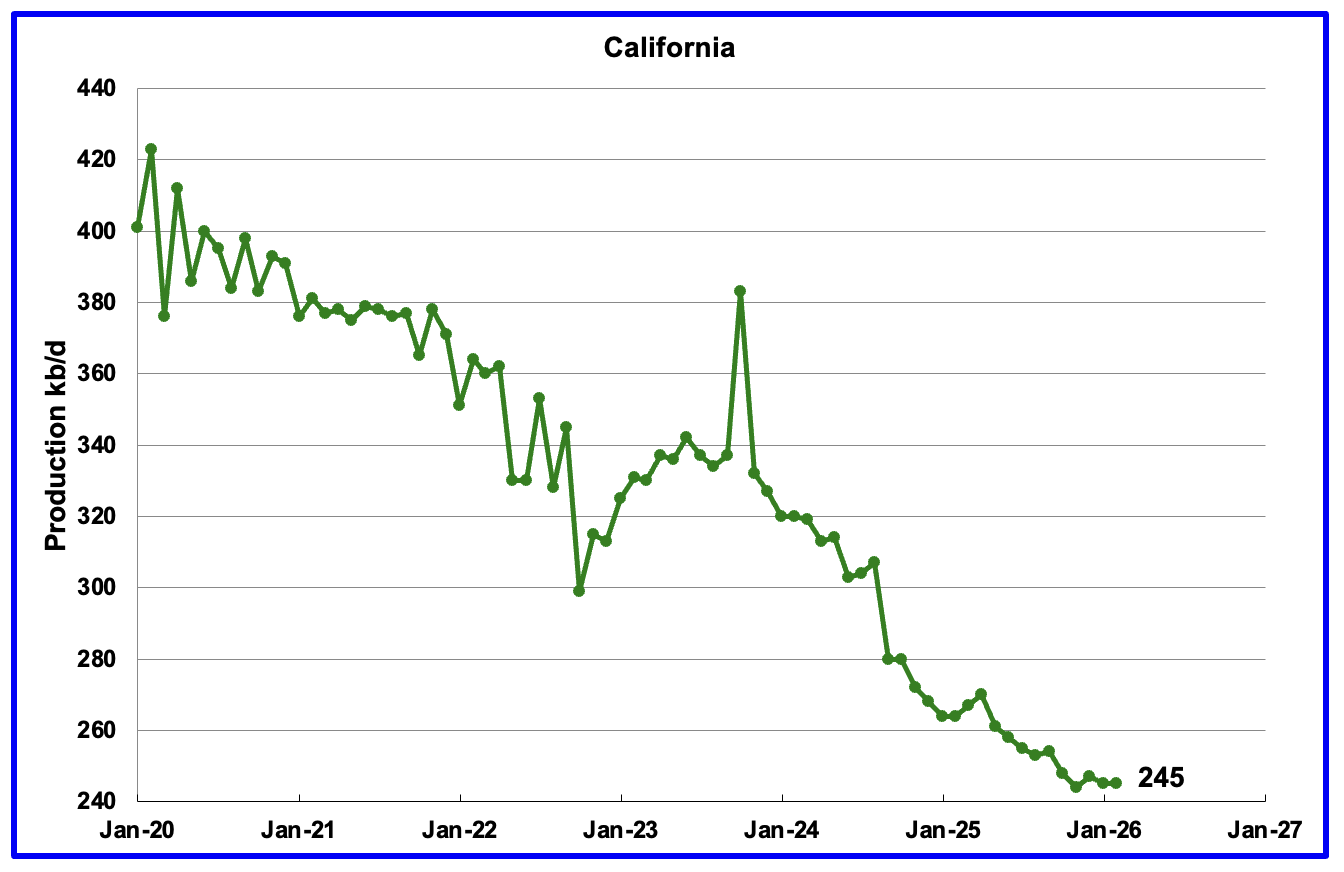
California’s overall declining production trend continues. February’s production was unchanged at 245 kb/d. YoY production dropped by 19 kb/d.
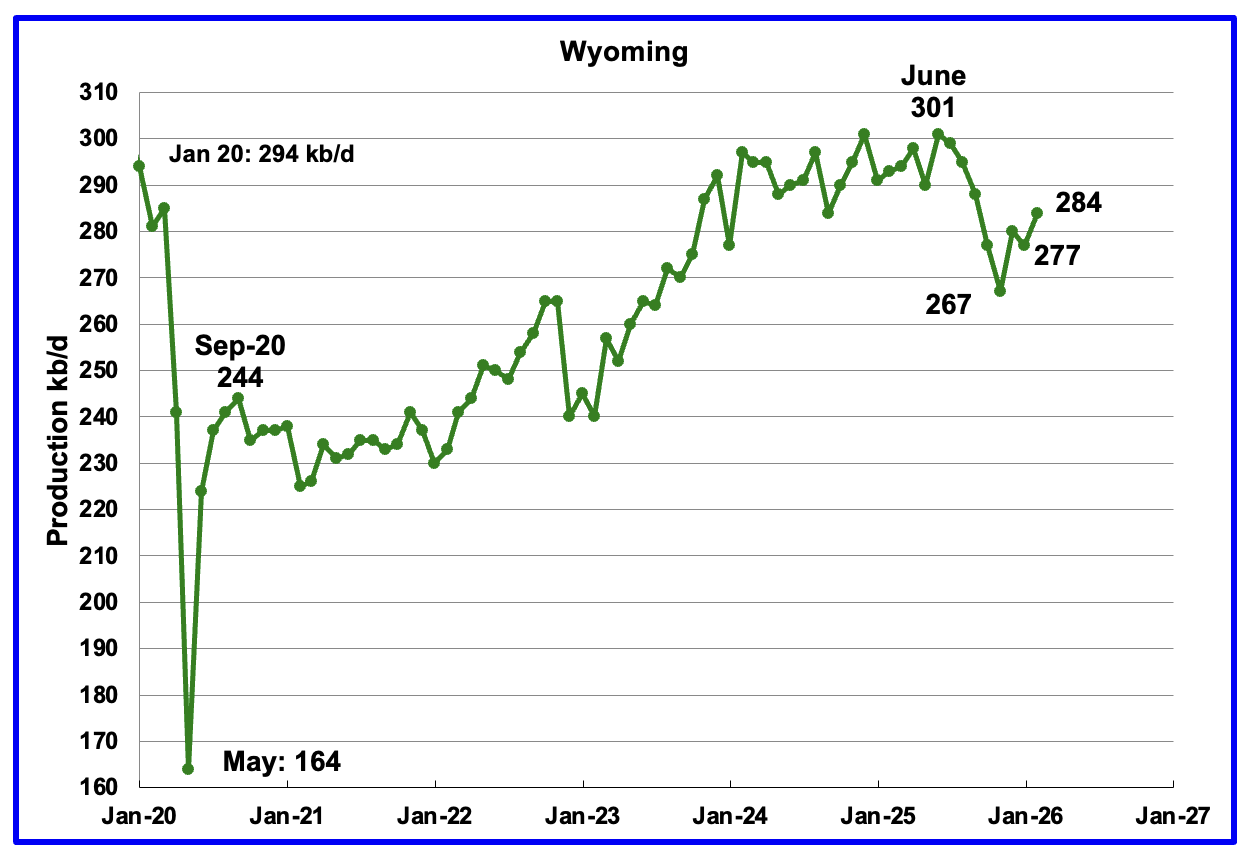
Wyoming’s oil production reached a post pandemic high in December 2024 and again in June 2025 of 301 kb/d. Production dropped in each of the subsequent 5 months before rebounding in December. February’s production rose by 7 kb/d to 284 kb/d.
Wyoming started the year with 13 rigs and in April had 14 operational rigs.
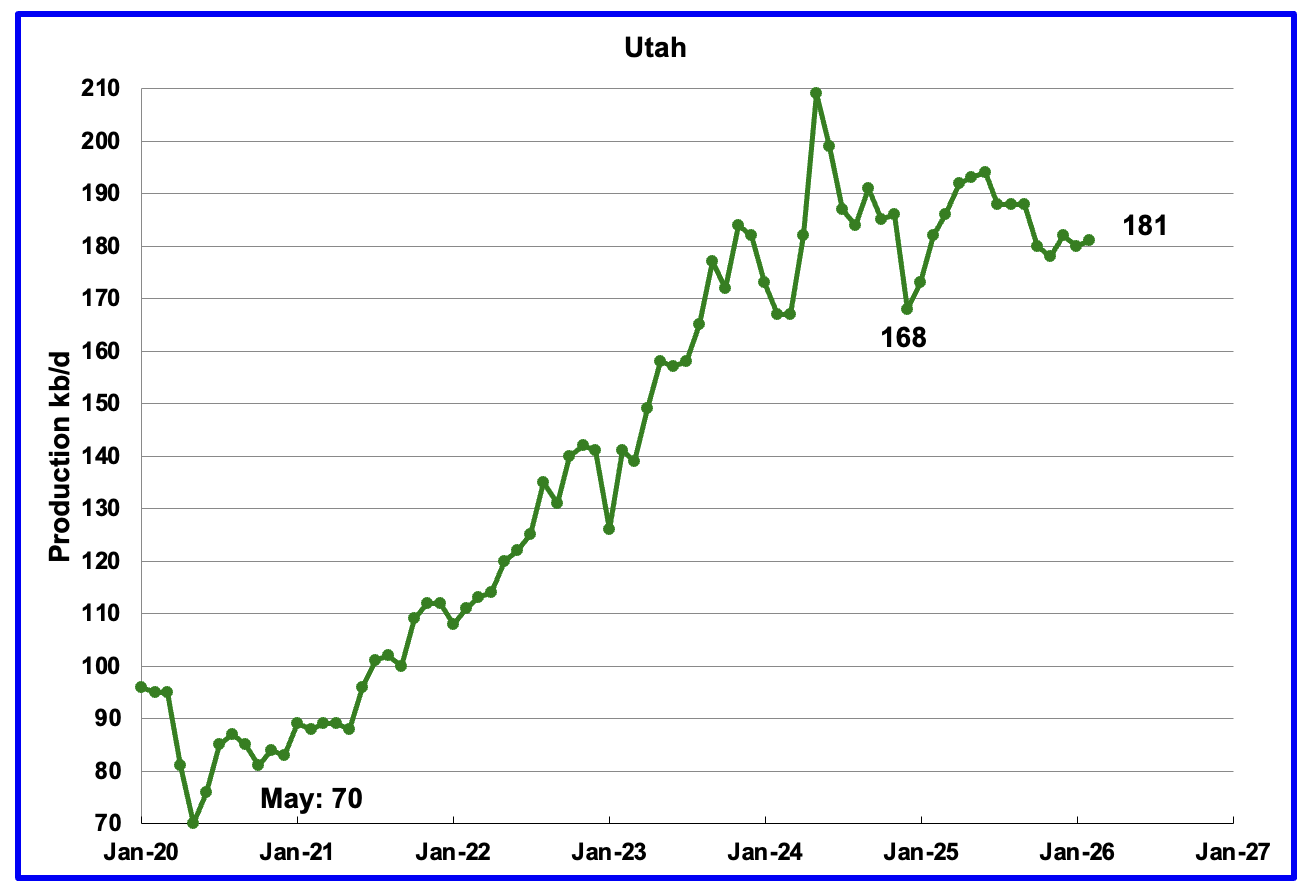
February’s production rose by 1 kb/d to 181 kb/d. Utah had 11 rigs operating in late January. By early May, the number of operational rigs had dropped to 8.
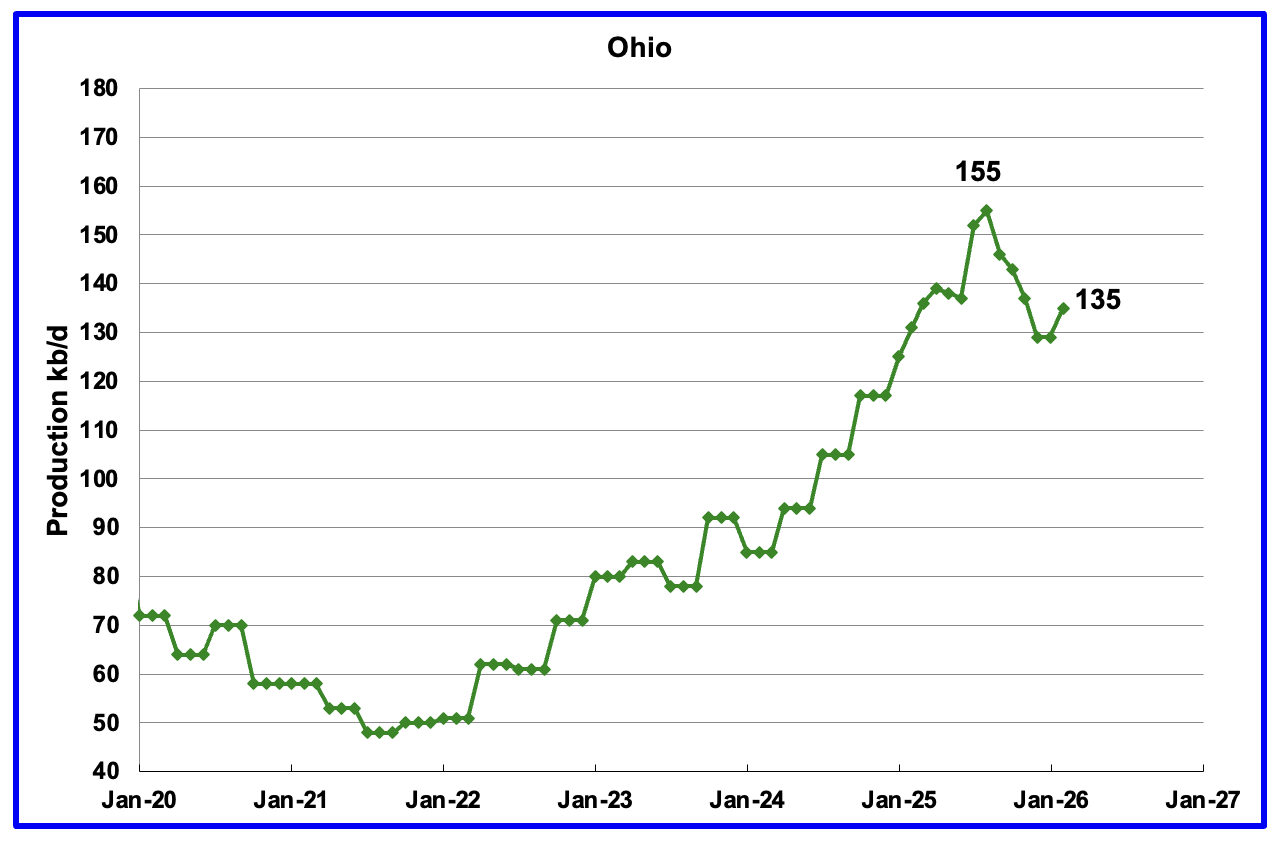
Ohio’s February oil production increased by 6 kb/d to 135 kb/d and was 20 kb/d lower than the August peak of 155 kb/d. In January 2026 Ohio had 12 NG rigs operating. At the end of April, nine NG rigs were operational along with one oil rig.
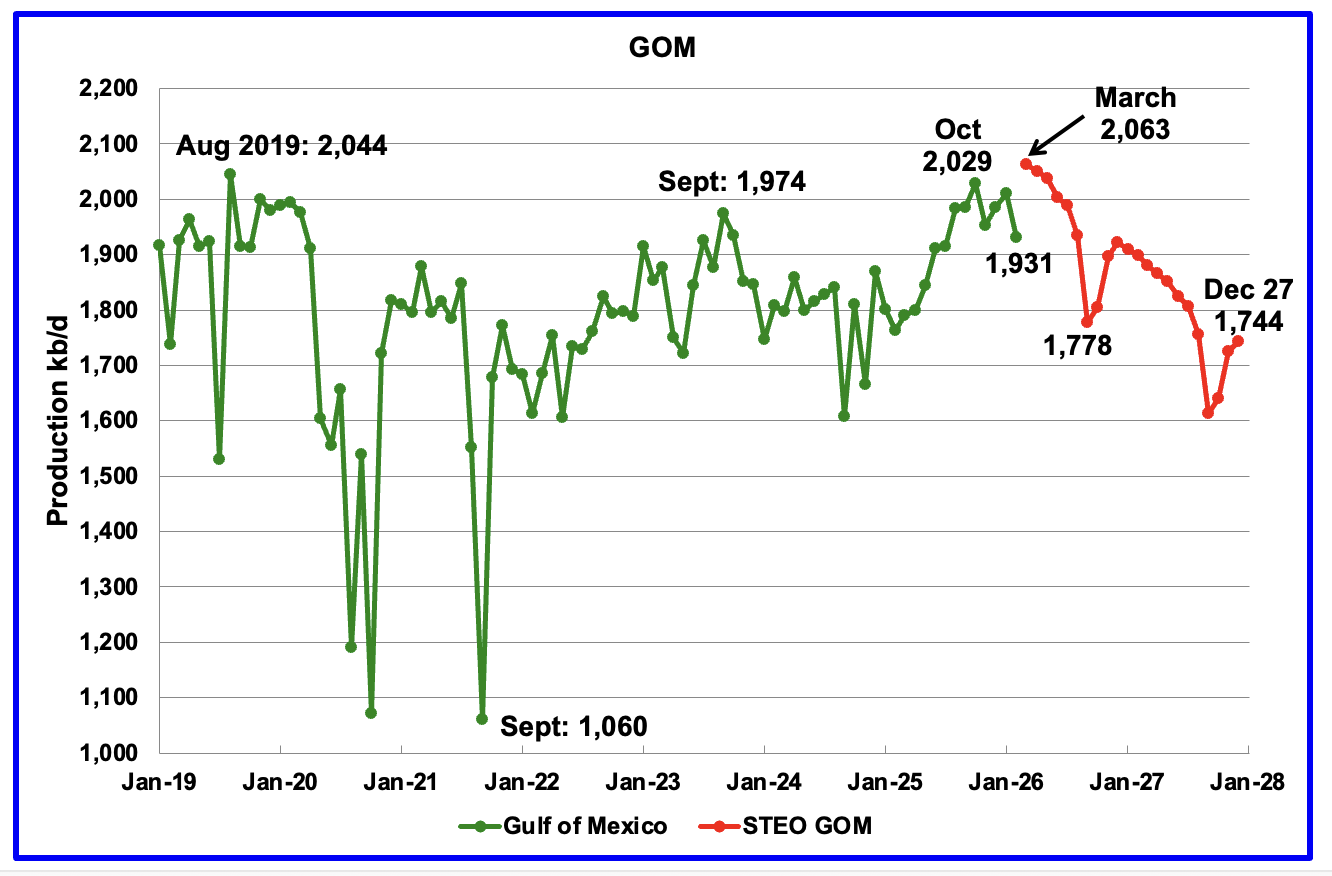
GOM production dropped by 79 kb/d in February to 1,931 kb/d.
The April 2026 STEO GOM projection has been added to this chart. For March production is projected to increase to 2,063 kb/d. If the projection is correct, March’s production will be a new high, exceeding the August 2,019 high by 19 kb/d. It also projects production in December 2027 will be 319 kb/d lower than March 2026 at 1,744 kb/d.
A Different Perspective on US Oil Production
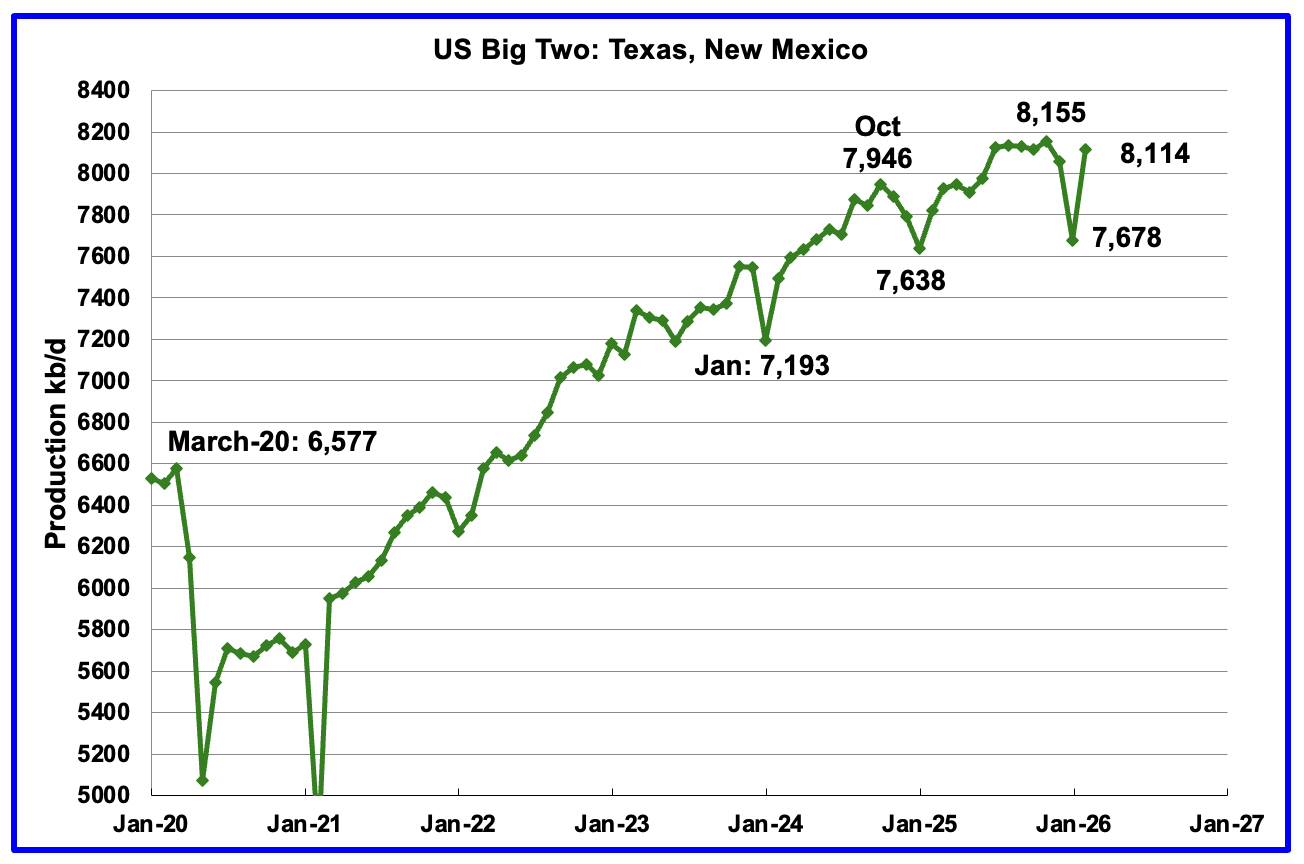
Combined oil output for the Big Two states Texas and New Mexico.
February production in the Big Two states increased by a combined 436 kb/d to 8,114 kb/d. The increase was due to a rebound in production from the late January storm. Clearly these two states were the drivers of US oil production growth up to July 2025. The essentially flat production starting in August 2025 was the first sign that production in these two states was close to peaking. The next few months will tell the tale.
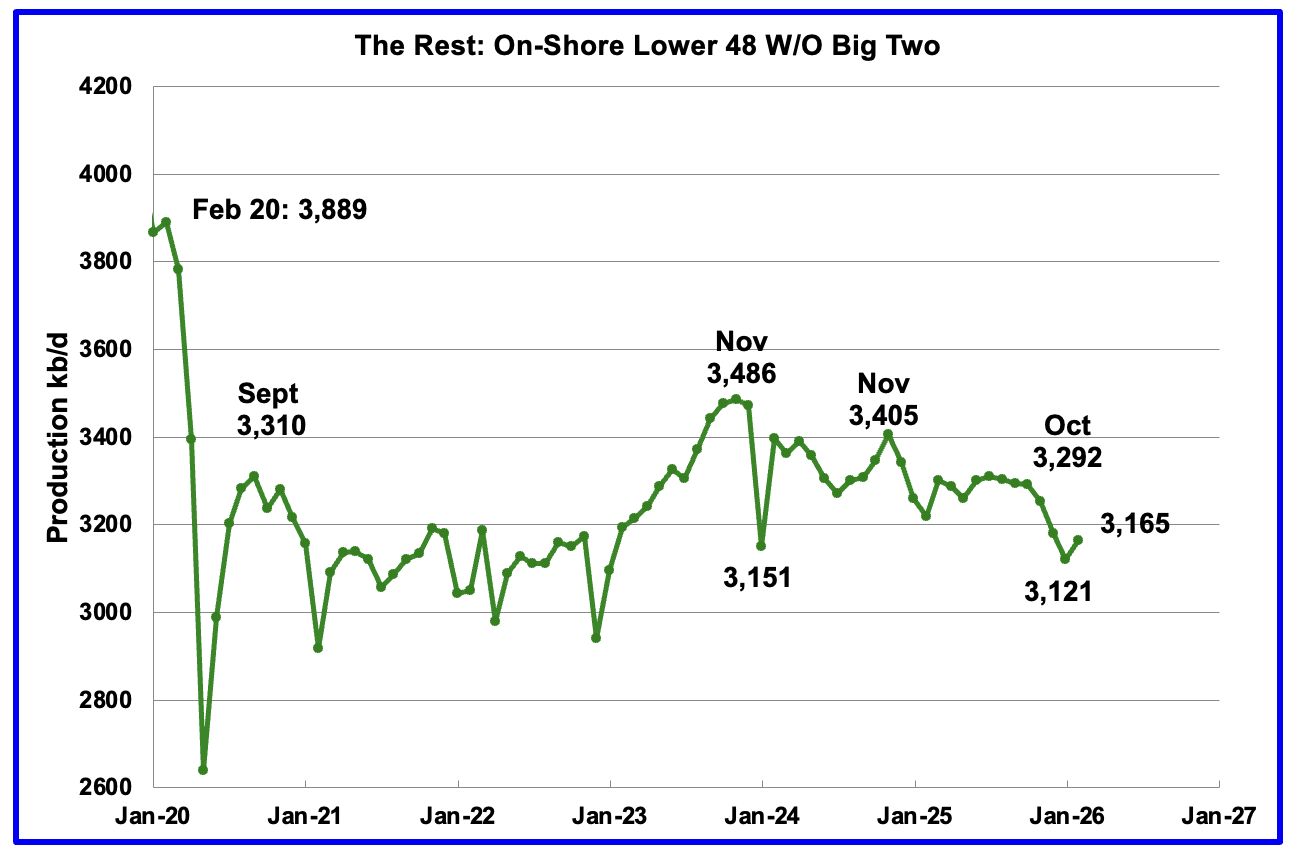
Oil Production by The Rest
February oil production by The Rest rose by 44 kb/d to 3,165 kb/d and is 321 kb/d lower than November 2023.
Permian Basin Report for Main Counties and a District
This special monthly Permian section was added to the US report because of a range of views on whether Permian production will continue to grow or will peak over the next year or two. The issue was brought into focus many months back by two Goehring and Rozencwajg Reports and Report2 which indicated that a few of the biggest Permian oil producing counties were close to peaking or past peak.
A more recent report was issued and can be reviewed Here. In this report they state:
“For years now, we have outlined with what we hoped was clarity, and what we now submit was prescience, the view that U.S. shale oil, that great source of modern supply, could not grow forever. It would mature, crest, and begin its long descent. That moment, by our models and measures, has arrived: shale has plateaued, and 2024 appears to be its high-water mark. And yet, investor sentiment has scarcely been more downbeat.”
This section will focus on the four largest oil producing counties in the Permian, Lea, Eddy, Midland and Martin. It will track the oil and natural gas production and the associated Gas Oil Ratio (GOR) on a monthly basis. The data is taken from the state’s government agencies for Texas and New Mexico. Typically the data for the latest two or three months is not complete and is revised upward as companies submit their updated information. Note the natural gas production shown in the charts that is used to calculate the GOR is the gas coming from both the gas and oil wells.
Of particular interest will be the charts which plot oil production vs GOR for a county to see if a particular characteristic develops that indicates the field is close to entering or in the bubble point phase. While the GOR metric is best suited for characterizing individual wells, counties with closely spaced horizontal wells may display a behaviour similar to individual wells due to pressure cross talking . For further information on the bubble point and GOR, there are a few good thoughts on the intricacies of the GOR in an earlier POB comment and here. Also check this EIA topic on GOR.
New Mexico Permian
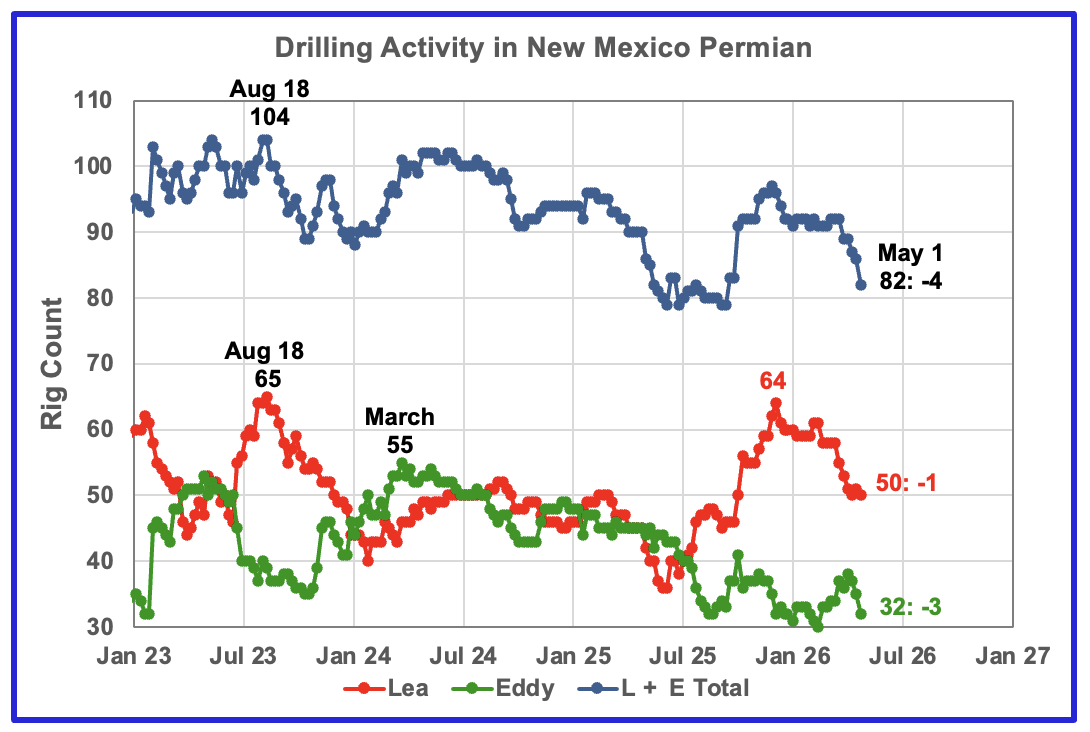
The rig counts in Lea and Eddy counties were moving in different directions up to March 2026 but have both started to decline over the last four weeks. Over the past five months Lea County dropped 14 rigs to 50 while Eddy dropped 5 rigs from 37 to 32 in April. Overall NM dropped 11 rigs to 82 from December 2025 to early May 2026.
Oil Production in New Mexico’s Primary Permian Counties
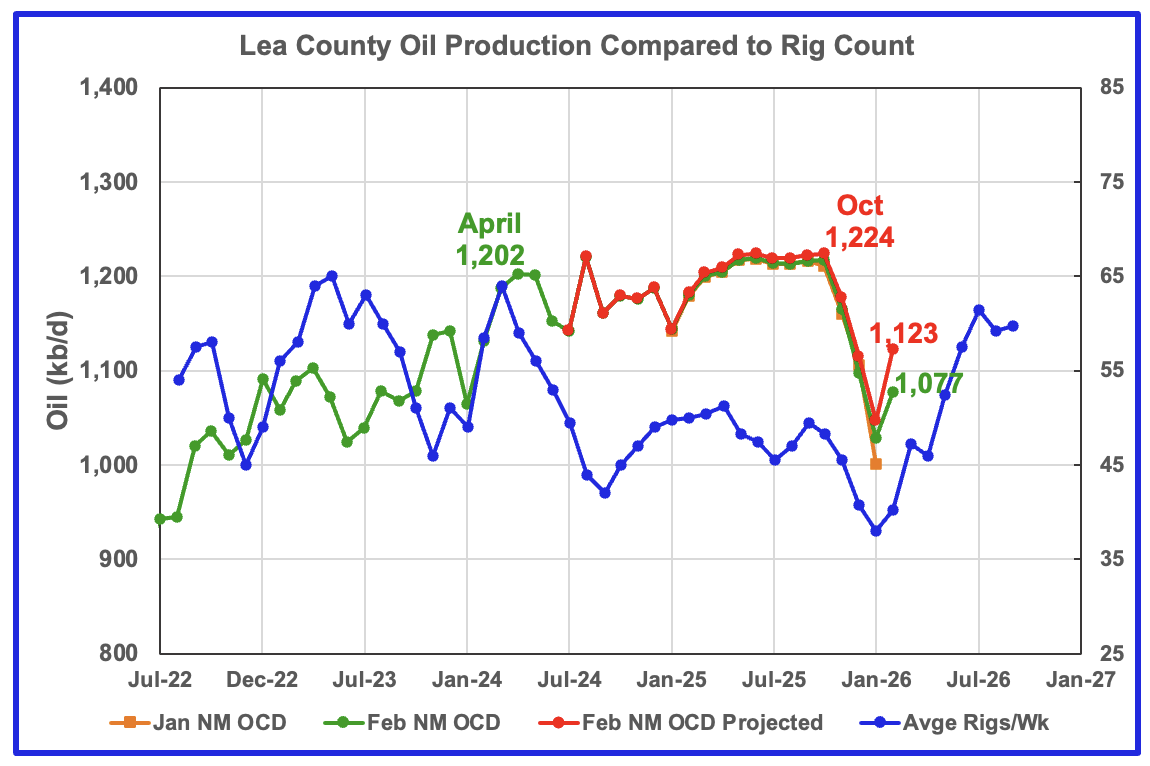
Lea County’s oil production started its plateau phase in April 2024 at 1,202 kb/d and it continued to October 2025. November 2025 to January 2026 have seen steady production drops in both the projected and NM OCD’s preliminary production. However the majority of January’s projected production drop of 69 kb/d was due to the severe January weather. February projected production rebounded and came in at 1,123 kb/d, an increase of 76 kb/d from January. This could be related to the time shifted increasing rig count and to some storm related recovery . The question/issue here is whether production will exceed the October peak of 1,224 kb/d or peak at a new lower level?
Preliminary February data from New Mexico’s Oil Conservation Division (OCD) indicates Lea County’s oil production rose by 48 kb/d to 1,077 kb/d, green graph.
The blue graph shows the average number of weekly rigs operating during a given month as taken from the weekly rig data. The rig graph has been shifted forward by 7 months. So the 64 Rigs/wk operating in August 2023 have been time shifted forward to March 2024 to show the possible correlation and time delay between rig count, completion and oil production.
Note that rig counts are being used to project production as opposed to completions because state completion data is not available. Completion data from the Drilling Productivity report below indicates that the number of completed DUCs exceeds newly drilled wells in the Permian basin.
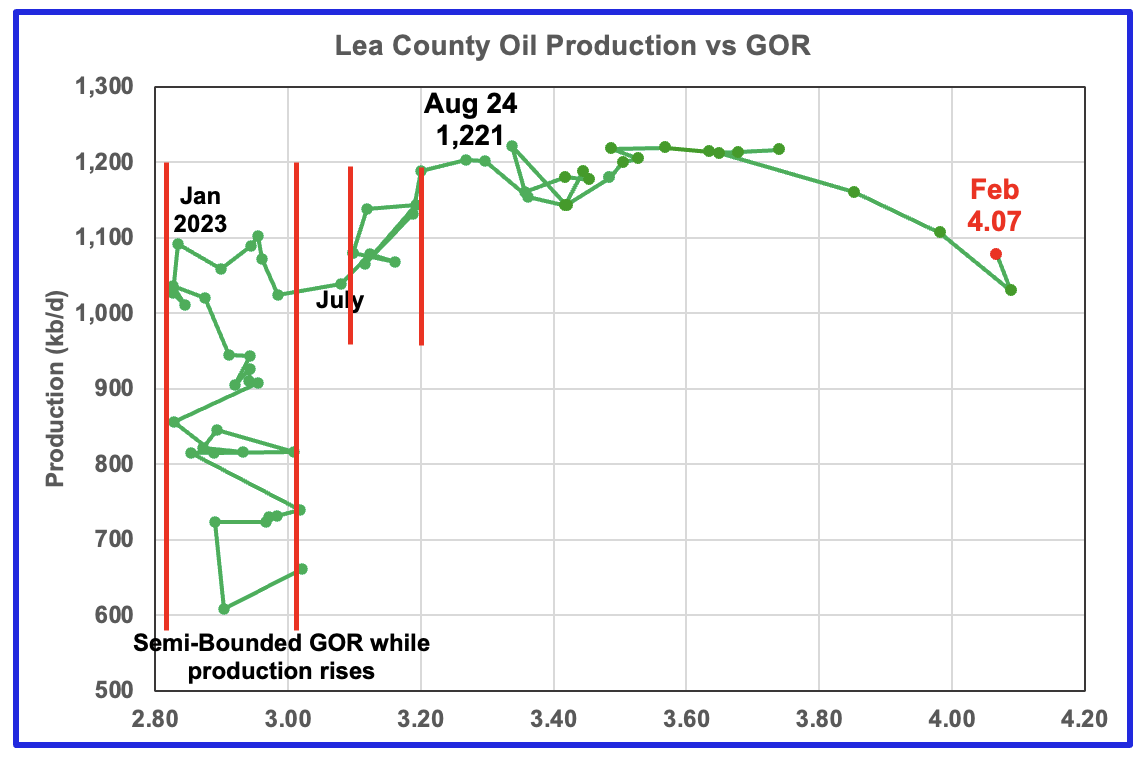
After much zigging and zagging, oil production in Lea county stabilized just below 1,100 kb/d in early 2023. Once production reached a new high in January 2023, production appeared to be on a plateau while the GOR started to increase rapidly to the right and first entered the bubble point phase in July 2023.
Since July 2023 Lea County’s production continued to increase as the GOR remained within a second semi-bounded region. This may indicate that additional production was coming from an oilier part of a layer since the GOR’s behaviour since August 2023 to March 2024 time frame appears once again to be in a second semi bounded GOR phase accompanied with rising production.
The GOR moved out of the second semi-bounded GOR region in April 2024 and production hit a new high of 1,221 kb/d in August 2024. From August 2024 to February 2025 the GOR was range bound between 3.34 and 3.53 but starting in June 2025 the GOR started to rise every month, except for one, to hit new highs. February saw a double change in direction, both a production increase to 1,077 kb/d and a GOR decrease to 4.07.
This zigging and zagging GOR pattern within a semi-bounded GOR while oil production increases to some stable level and then moves out to a higher GOR to the right has shown up in a number of counties. See a few additional cases below. The rising GOR to new highs and dropping oil production in Lea county is an early indicator that production may be entering a declining phase.
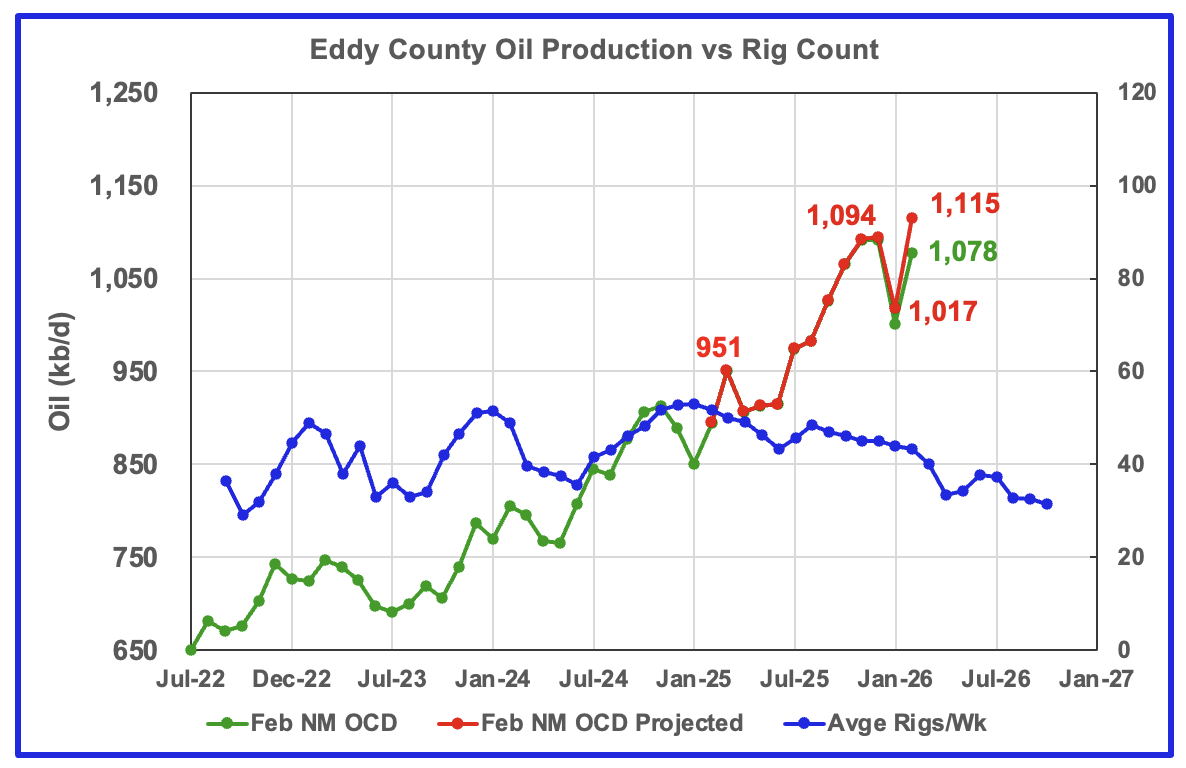
Eddy’s February projected oil production increased by 108 kb/d to 1,115 kb/d, a new high, while preliminary production from the NM OCD increased by 77 kb/d to 1,078 kb/d. Most of the production rise was due to a rebound from the severe January weather. Eddy’s month over month production updates are typically very few and small and primarily occur in the last two or three months which indicates that the monthly updates are close to being final, say 95% of final.
It is difficult to discern what really happened in Eddy county in January and February. It is not clear if the large January drop is a real production drop associated with the late January severe storm along with a bit of delayed reporting. The January drop seems to be too high for a two to three day weather related incident. Throw in some late/unreported January production into February which then shows up as February production and a new February production high appears. Need to wait for March production to clarify January/February production.
The blue graph shows the average number of weekly rigs operating during a given month as taken from the above weekly drilling chart. The rig graph has been shifted forward by 8 months to roughly coincide with the increase in the production graph starting in October/November 2023.
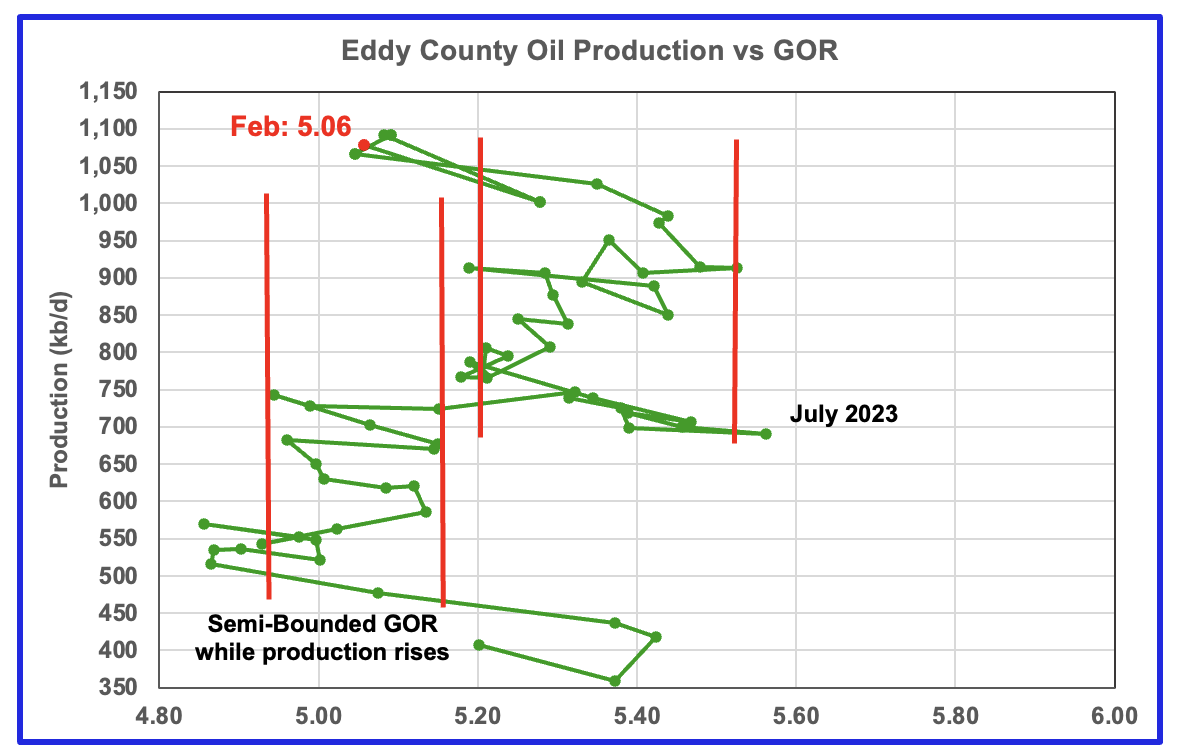
The Eddy county GOR pattern is similar to Lea county except that Eddy broke out from the first semi bounded range earlier and then added a second wider semi-bounded GOR phase.
For February New Mexico’s Oil Conservation Division (OCD) reported preliminary oil production increased by 77 kb/d to 1,077 kb/d while the GOR fell back to 5.06 and moved back into the first Semi-Bounded GOR range
Texas Permian
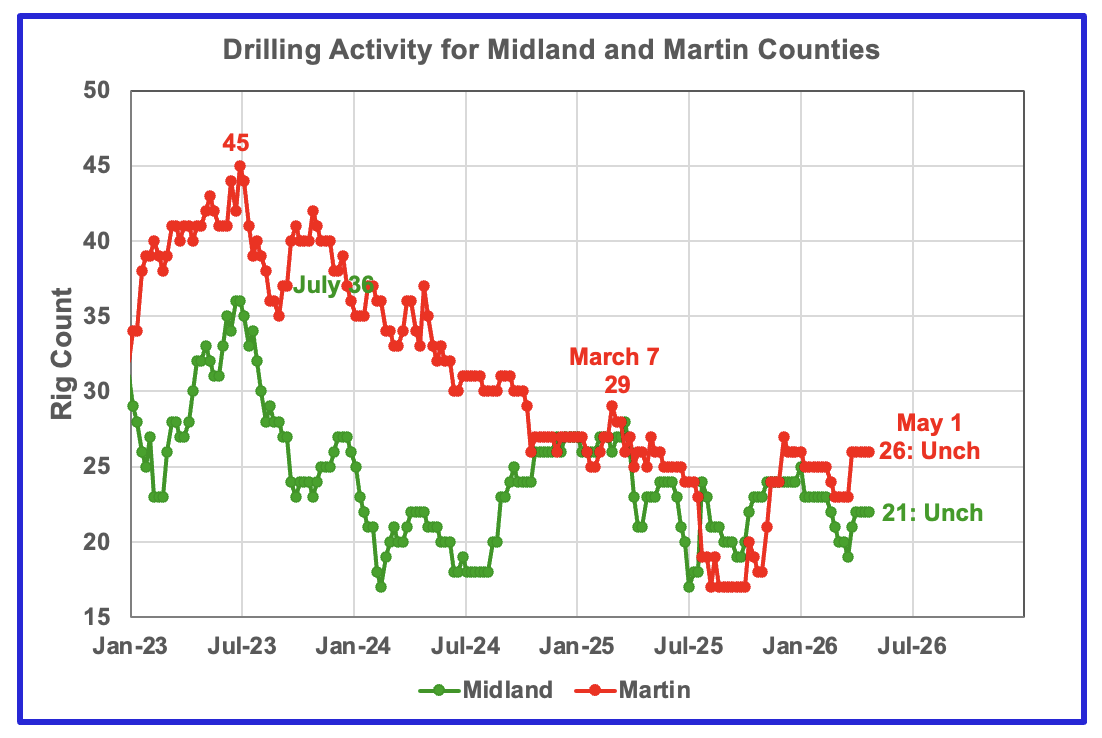
The rig counts in both Midland and Martin counties have not changed in the last 4 weeks after both counties added 3 rigs in early April. Not clear if the rigs were added due to higher oil prices.
Oil Production in the Two Primary Texas Permian Counties
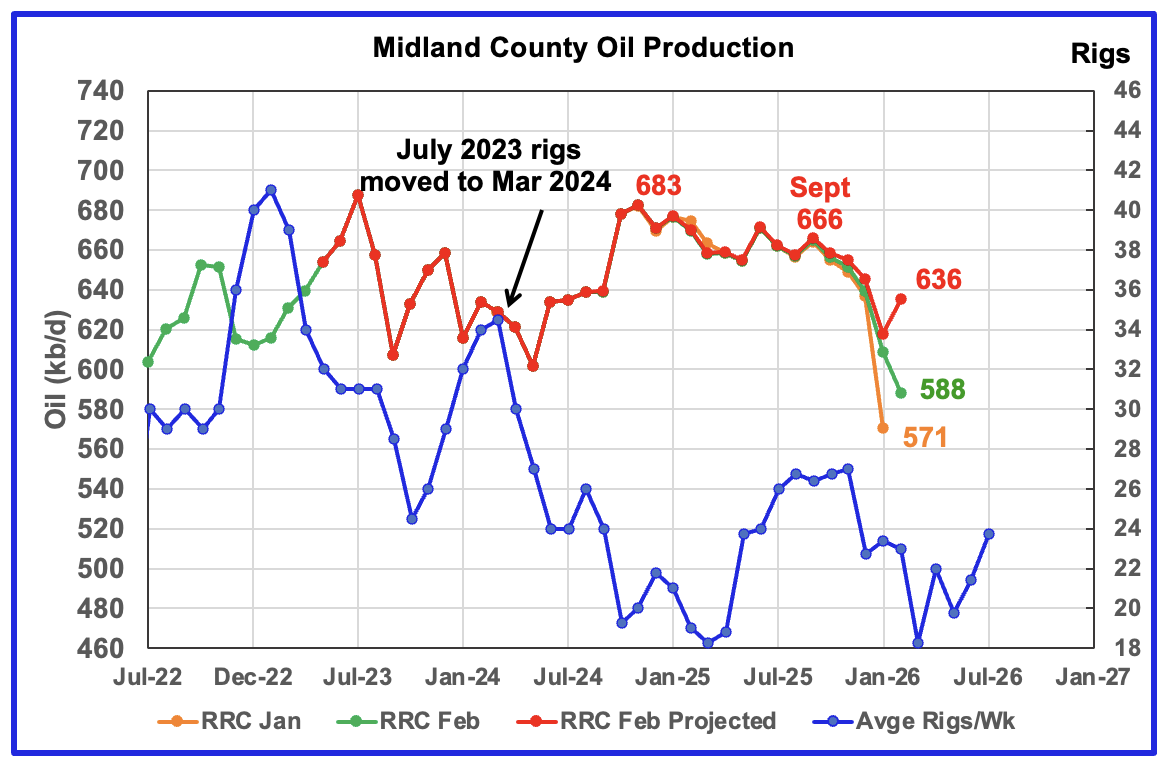
February’s projected production rose by 18 kb/d to 636 b/d. Part of this rise is due to the production rebound from the severe Texas winter storm in late January. With the rig count dropping in time shifted December and March, the February increase may be temporary.
This current chart shows production peaking in November 2024 at 683 kb/d. Also the production projection and Texas data are very close up to September 2025. Combining the dropping production with the sharp drop in the time shifted November 2025 rig count makes me think that Midland’s oil production has entered its declining phase.
The orange and green graphs show preliminary oil production for Midland County as reported by the Texas RRC for January and February, respectively. The red graph uses January and February data to project production as it would look after being updated over many months.
The blue graph shows the average number of weekly rigs operating during a given month as taken from the weekly drilling chart. The rig graph has been shifted forward by 8 months to better align with the latest production.
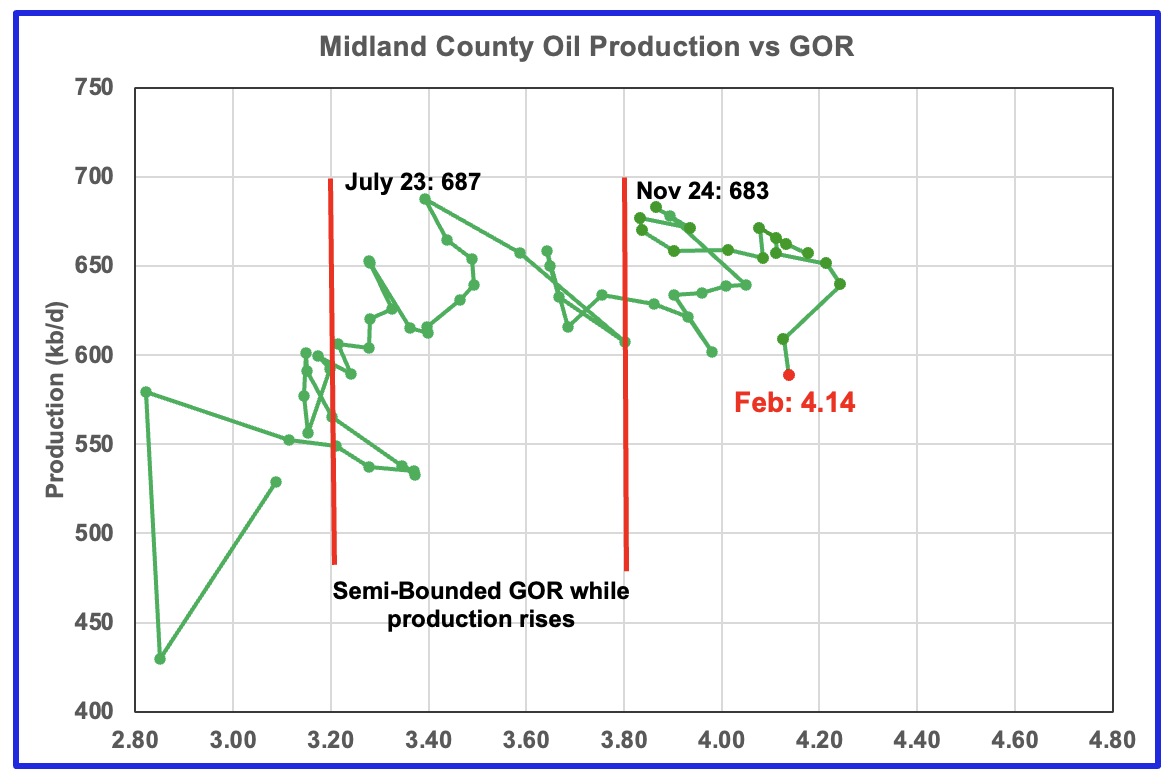
For February the Midland GOR ratio rose slightly to 4.14 while the reported preliminary oil production dropped by 21 kb/d to 588 kb/d.
When the Midland county GOR initially moved into the bubble point phase, oil production and the GOR stayed within a narrow GOR range of 3.8 to 4.2 outside of the initial Semi-Bounded GOR region from March 2024 to October 2025. For January and February the GOR has dropped back into the narrow range.
The overall rising GOR along with a dropping preliminary production is another indicator that Midland County may have passed peak production.
The oil production and GOR data shown in this chart are based on the RRC’s February preliminary production report.
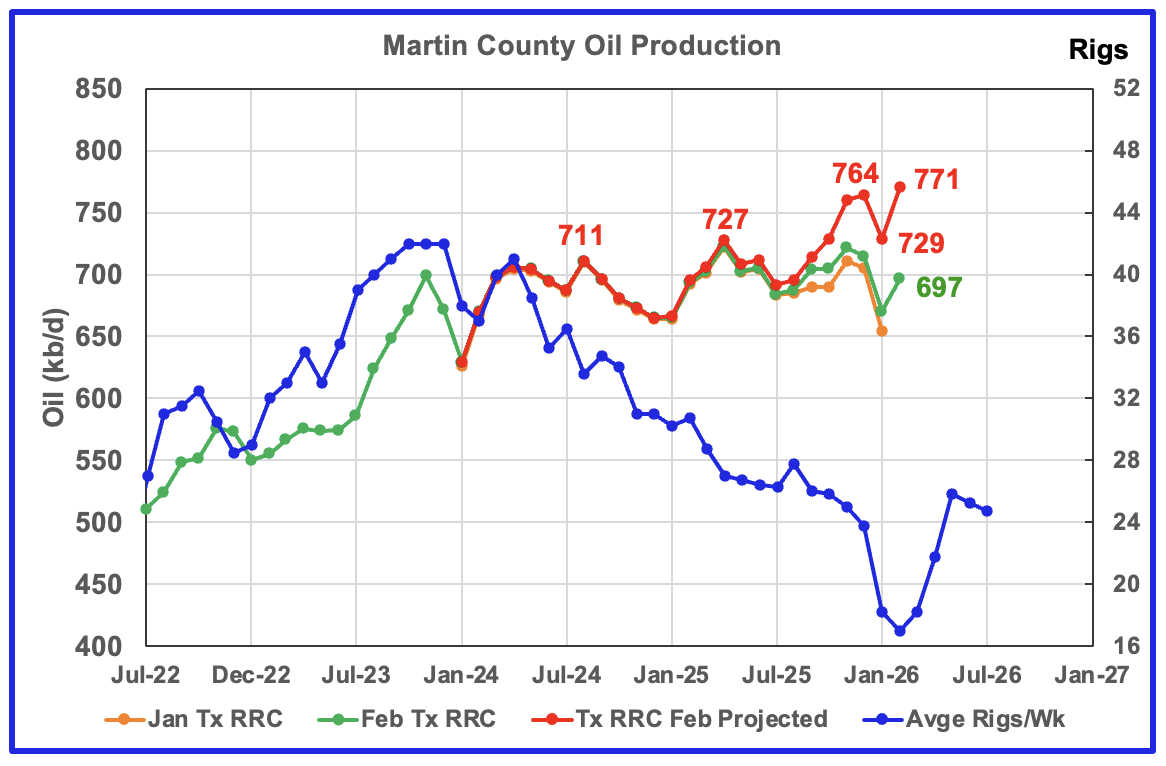
Martin county’s projected February oil production rose by 42 kb/d to a new high of 771 kb/d. It is surprising to see the new high because new wells were not brought on in late January due to the severe winter storm. Dropping rig counts and rising production, if true, must indicate new wells are very productive and have high IPs.
The red graph is a projection for oil production as it would look after being updated over many months. This projection is based on a methodology that uses preliminary January and February oil production data.
The orange and green graphs show production for Martin County as reported by the Texas RRC for January and February. The blue rig graph time shifts the rig count forward by 6 months.
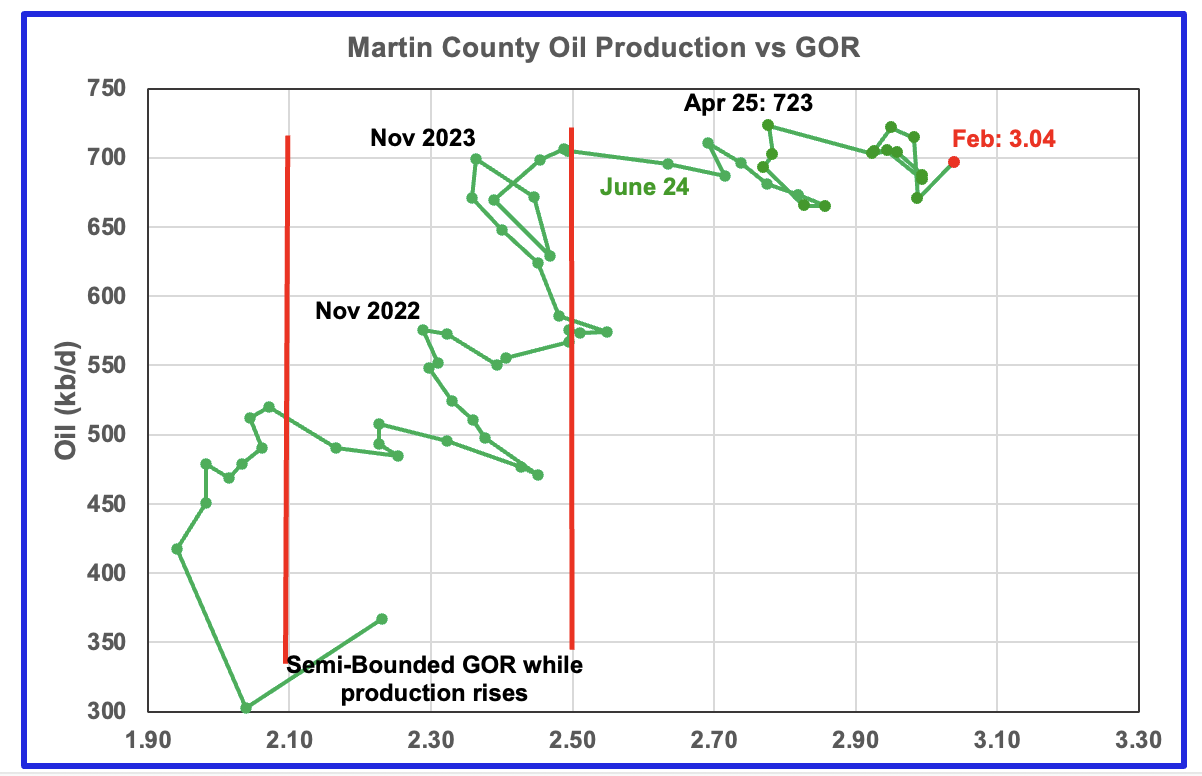
Martin county’s oil production after November 2022 increased and at the same time drifted to slightly higher GORs within the semi bounded range. However the June 2024 GOR saw its first move out of the semi bounded region.
The RRC’s preliminary February 2026 production for Martin County shows a 26 kb/d increase to 697 kb/d accompanied by an increase in the GOR to 3.04.
Martin county has the lowest semi-bounded GOR boundary of the four counties at a GOR of close to 2.50. The February GOR is now clearly out of the semi-bounded region. Martin County has now entered the bubble point phase that should result in a plateau phase that should shortly turn into a slowly dropping oil production phase.
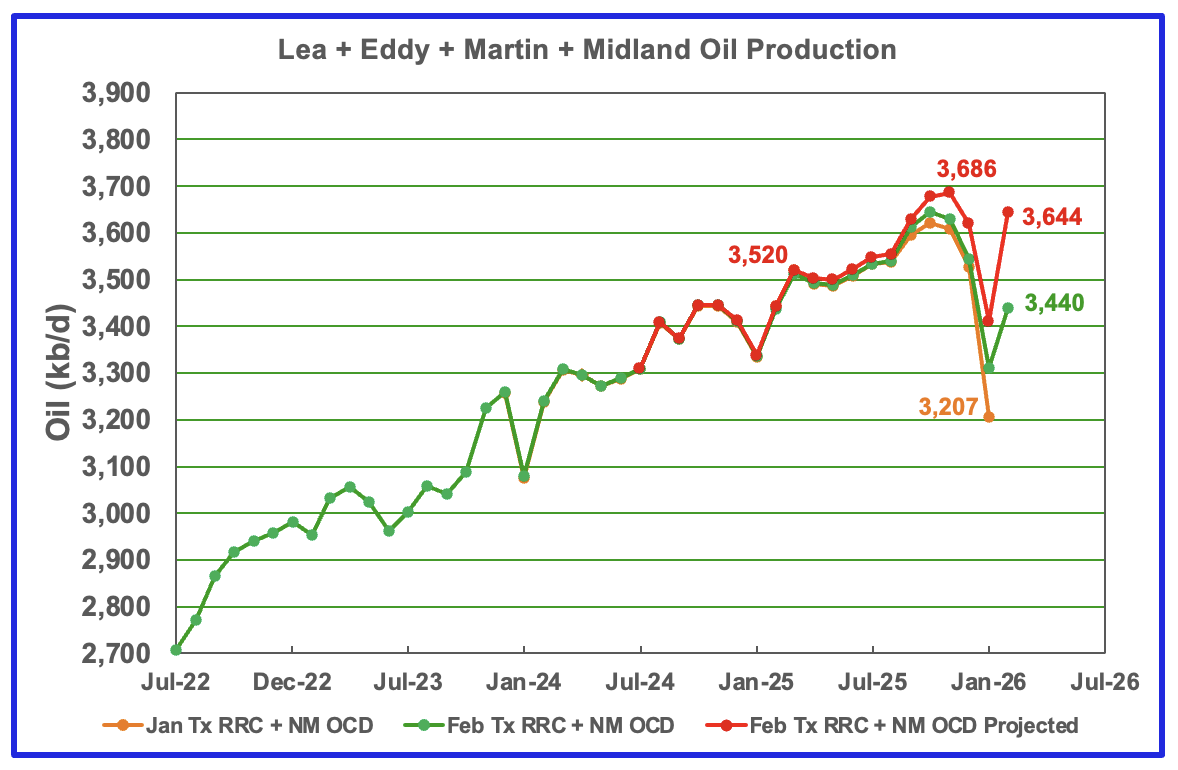
This chart shows the total oil production from the four largest Permian counties. Assuming current Permian production is close to 6,600 kb/d, these four counties account for 55% of the total.
February’s projected production increased by 233 kb/d to 3,644 kb/d and is a significant rebound from the late January winter storm. Of the 233 kb/d increase, the largest increments came from Lea and Eddy counties, 76 kb/d and 108 kb/d respectively.
The January and February initial production data are shown in the orange and green graphs respectively. The red graph uses the January and February production data to project a final updated production for February.
Findings
– February projected production increases are possibly a bit optimistic. The optimistic projections are mainly due to the late January severe winter storm and how the January under production affects the projection methodology for February. Need to wait for March production to clarify January/February production and the trend going forward.
– Lea county entered its plateau phase in May 2024. While oil production is not following the rig count graph directly, the dropping rig count has resulted in Lea County production being in a steady flat plateau phase up to October 2025. However November to January had production drops which indicate Lea County has entered a declining phase. That declining phase could enter a lower level plateau phase in 2026 as the time shifted post February rig count begins to increase.
– July to November production in Eddy County saw a steady increase to 1,092 kb/d. While December’s projected production increased, it was very small, 2 kb/d, and may be indicating the beginning of a peaking/declining phase. The size of the production drop in January production and the rise in February may not be realistic because they are both affected by January’s under production. The full effect of January’s severe weather on January and February production will not be known until March’s production is reported.
– February Texas RRC production data shows that Midland County’s projected production slowly dropped from February 2025 to January 2026. This makes me think that Midland’s oil production has entered its declining phase. While February’s projected production increased, it may be due to January’s underproduction. However the rising time shifted rig count starting in March 2026 may indicate an upcoming rising production phase but not to a new high. The addition of six new rigs to Midland county in real August 2025 to 24 from 18 was an unexpected surprise and makes one wonder what it implies for Midland county oil production going forward after allowing for drilling start to production delay/lag.
– Martin’s county small February projected production increase indicates that its oil production may be close to entering its plateau phase of close to 750 kb/d.
Texas District 8
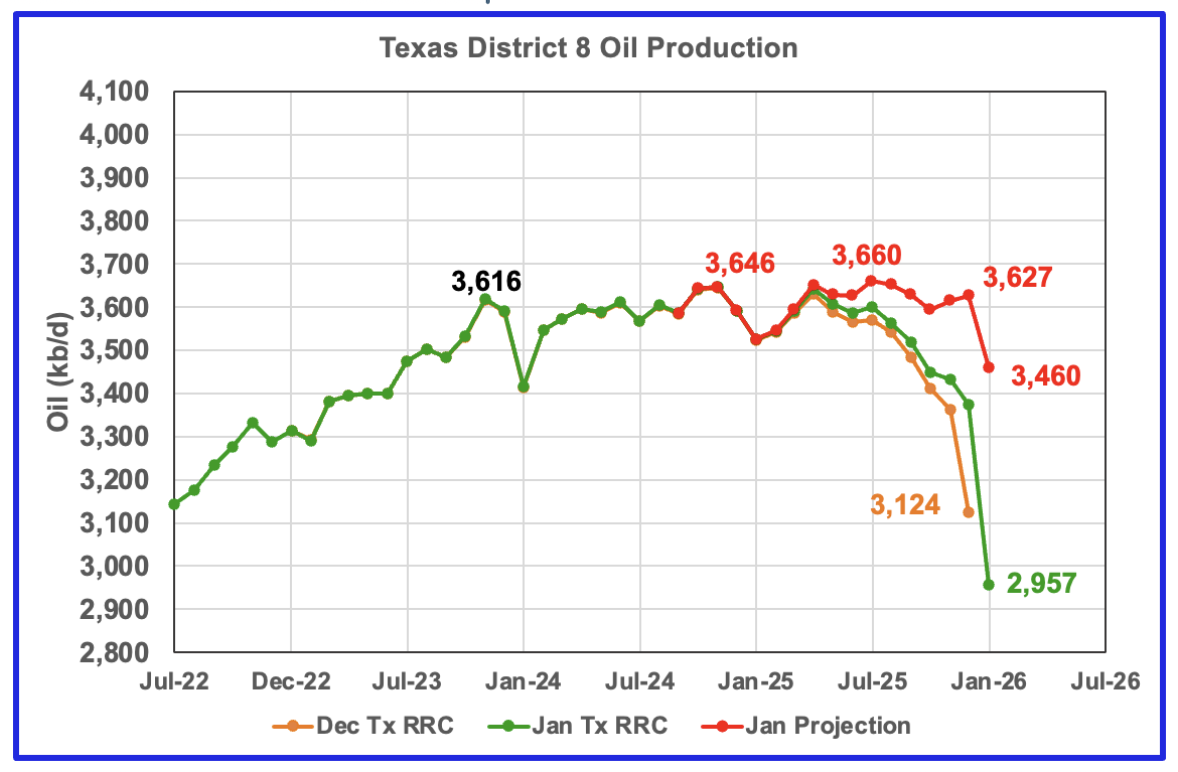
Comparison Chart from previous report.
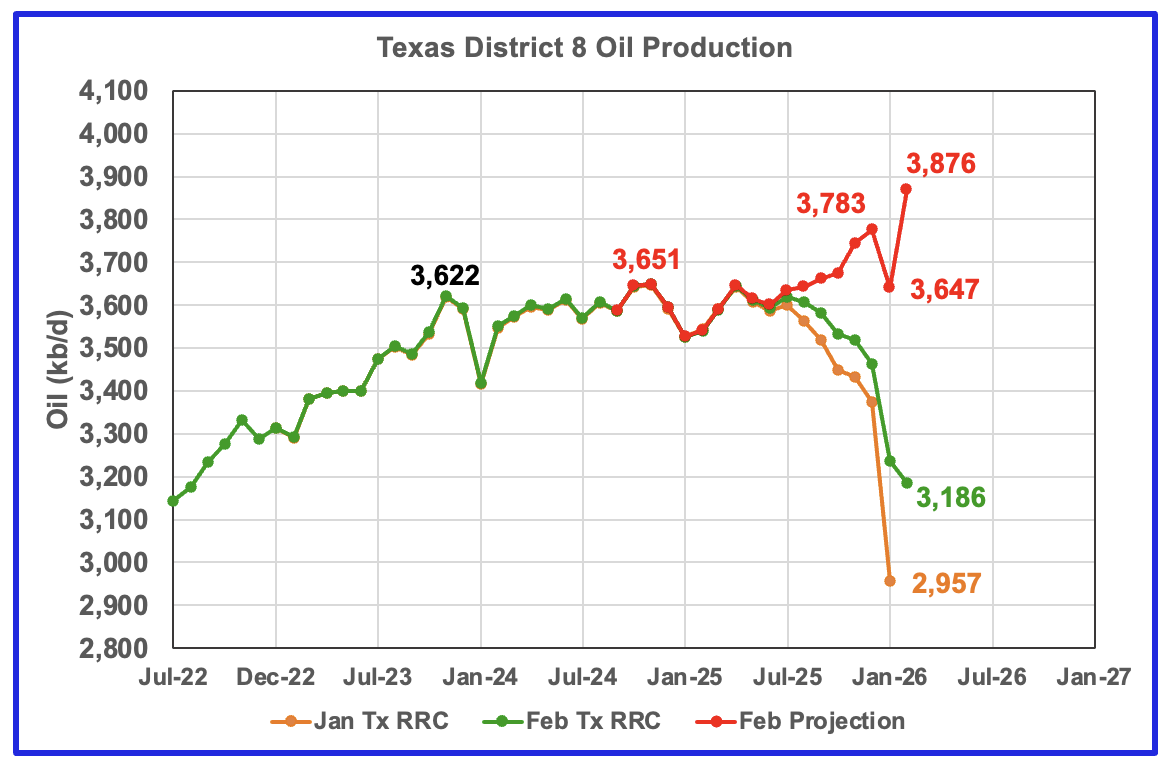
District’s 8 projected production rose by 229 Kb/d in February. This is an overly optimistic projection that is being affected by the low production associated with the late January storm.
Compare the production for December 2025 in the comparison chart with the February update, 3,627 kb/d to 3,783 kb/d, an increase of 156 kb/d. This is due to the much larger gap between the green and orange graphs in the latest chart and the comparison chart. The larger gap may be due to delayed reporting by the Texas RRC.
The District 8 comparison chart may be more realistic in the sense that it is indicating that District 8 is in its plateau phase.
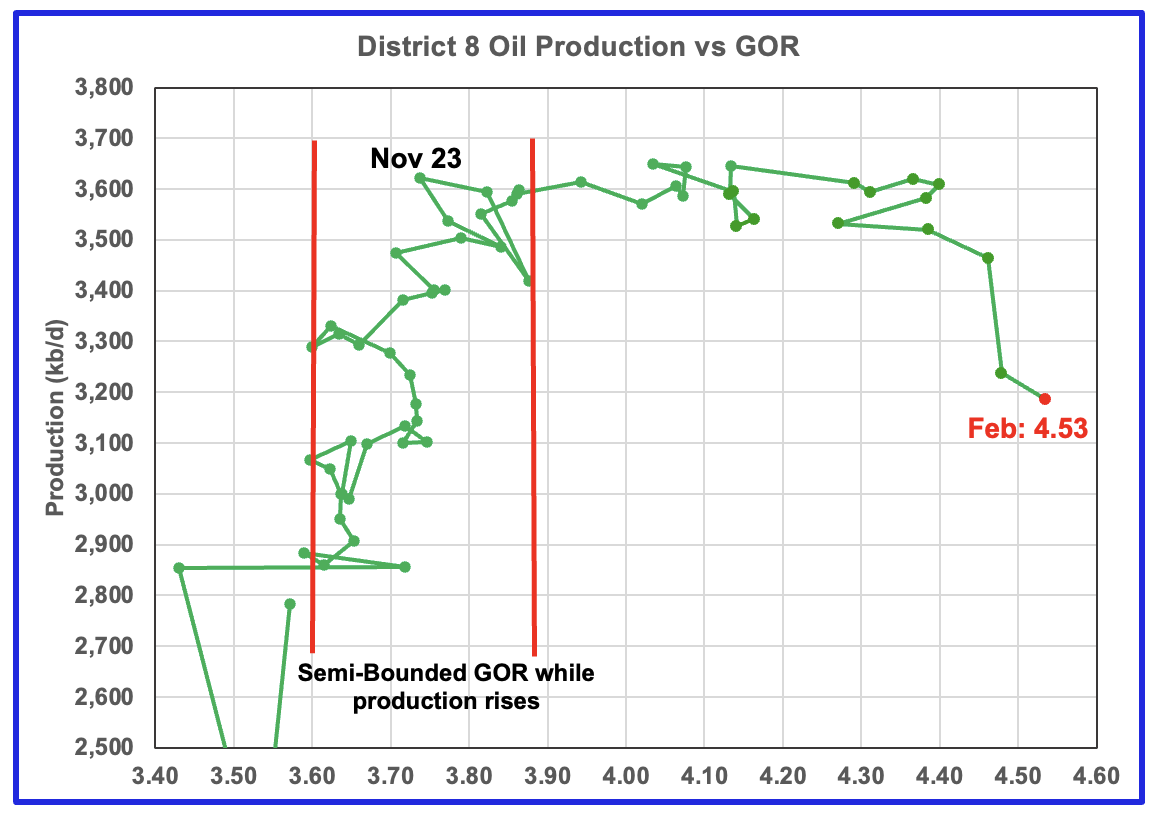
Plotting an oil production vs GOR graph for a district may be a bit of a stretch. Regardless here it is and it seems to indicate many District 8 counties may well be into the bubble point phase. The February GOR increased to 4.53, a new high as production continued to drop
Oil Production and GOR Charts for Four of the Next Larger Texas Oil Counties
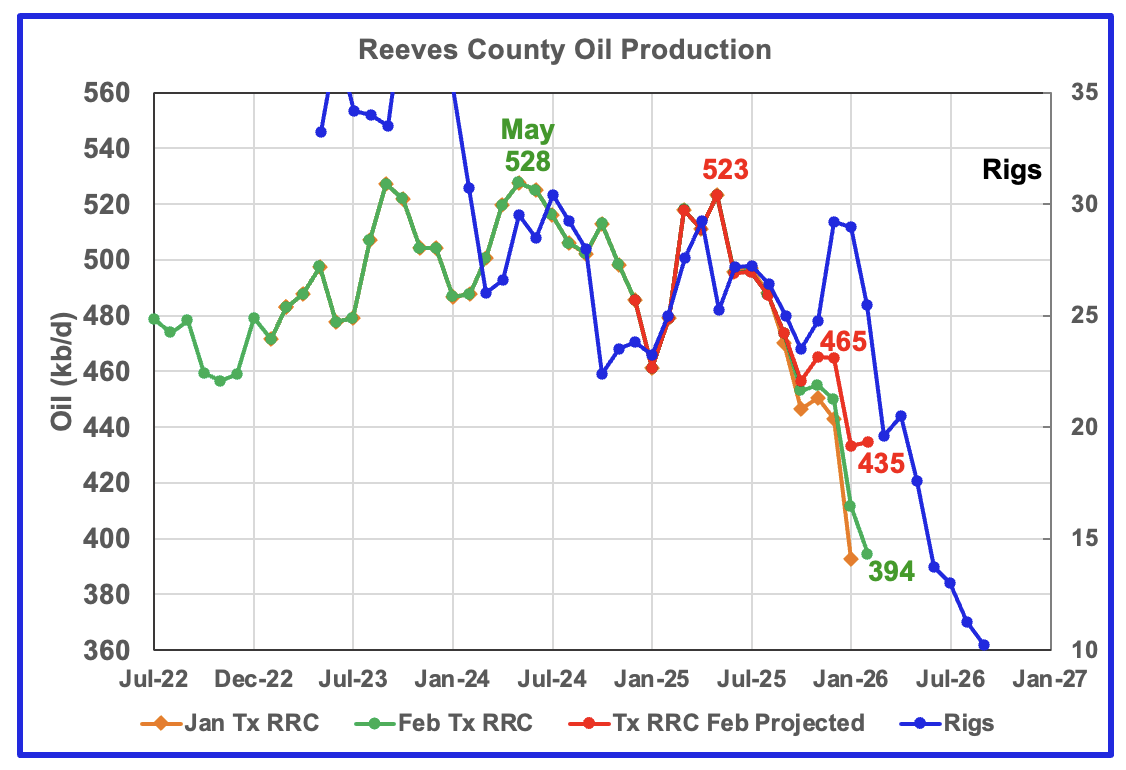
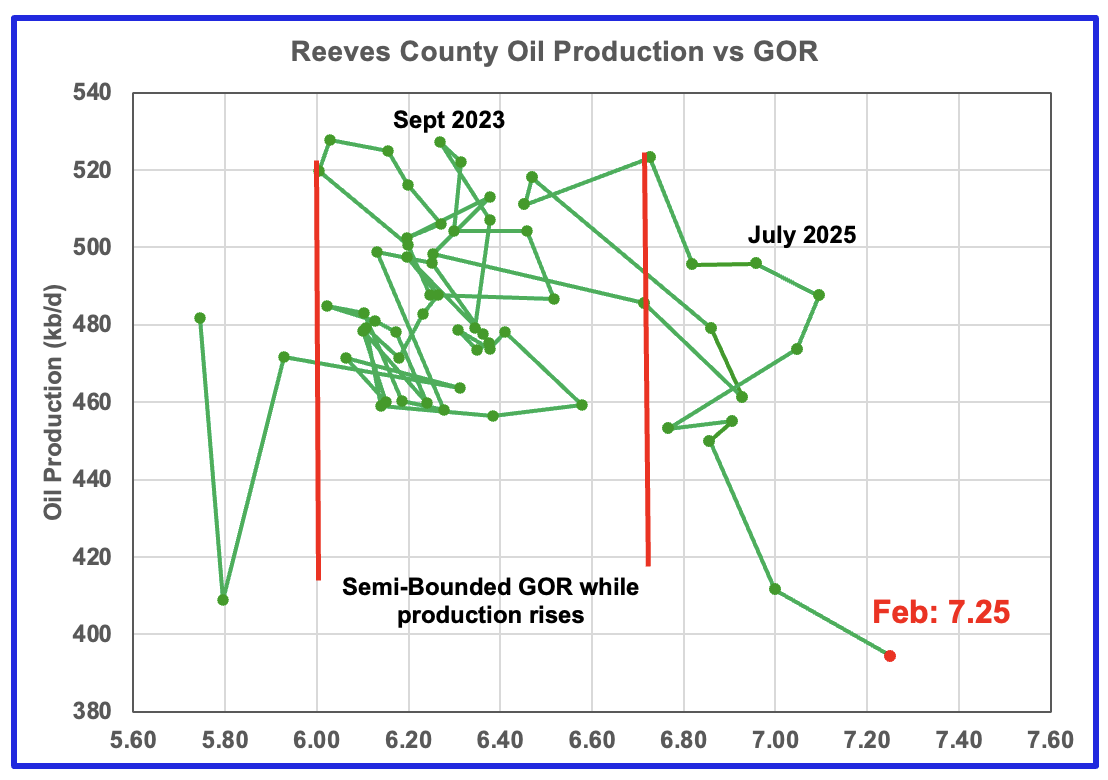
Reeves County GOR is high because it is the number one Texas county ranked by gas production. The current C + C production is almost evenly split between crude and condensate, with condensate about 17% higher than crude.
Reeves County GOR first moved out of the Semi-Bounded region in June 2025 and in February reached a new high of 7.25 while initial production dropped to a new low of 394 kb/d.
The rig count is time shifted forward by 7 months.
In real June 2025, 29 rigs were operational in Reeves county. By late April 2026 the rig count had risen to 15 from a February low of 10 . Regardless of the current increase, 29 rigs to 15 rigs is a large drop in 10 months.
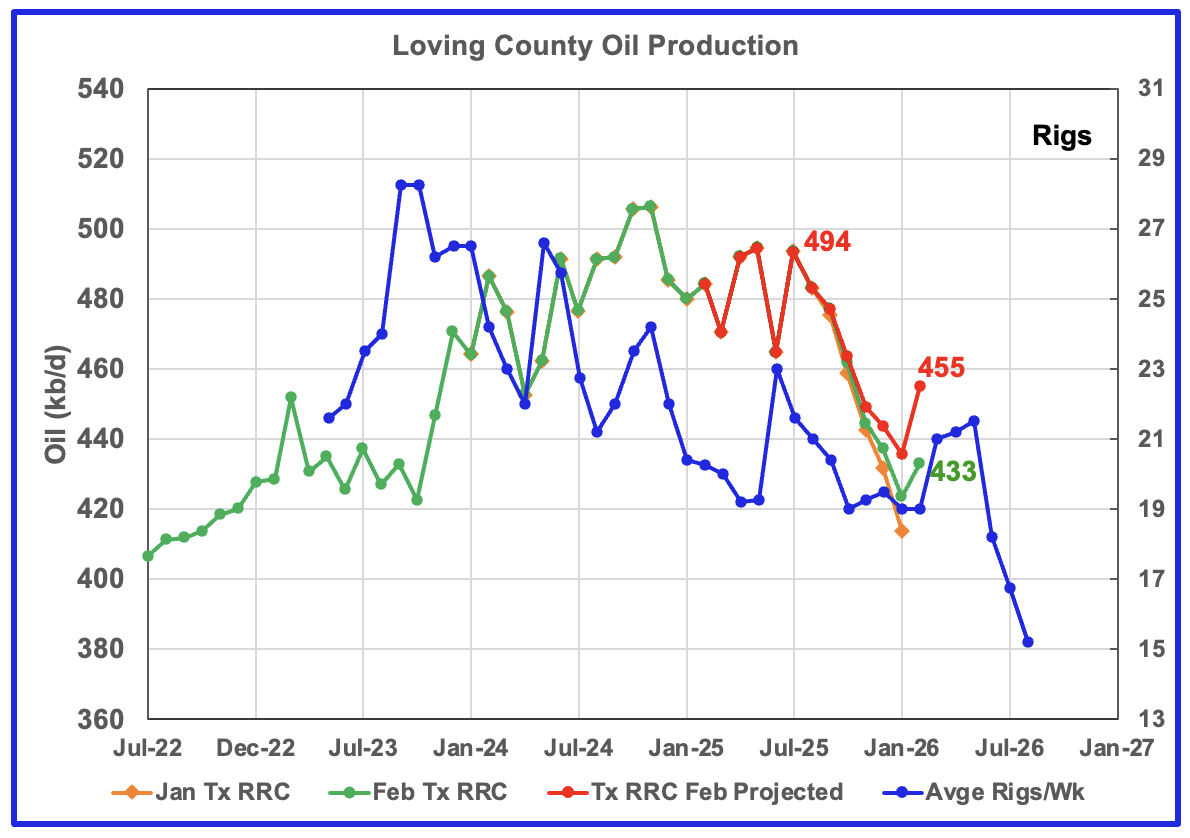
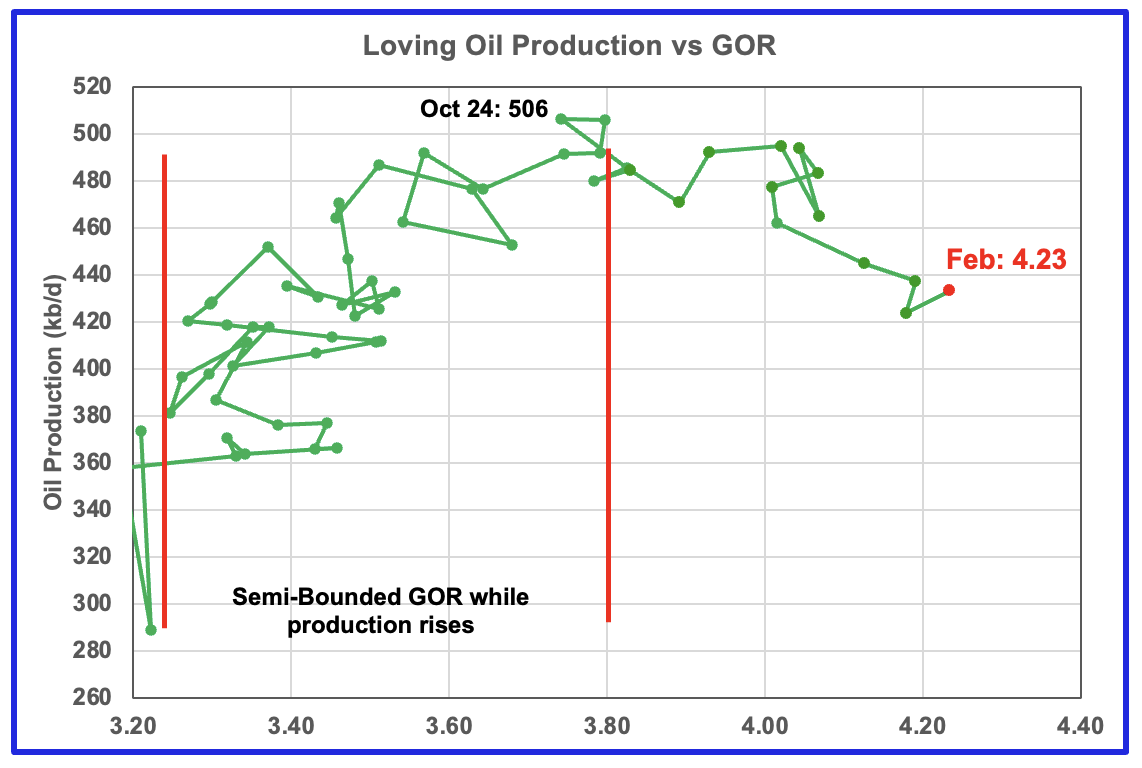
Loving’s projected production rose by 19 kb/d to 455 kb/d in February. For Febuary, the GOR increased to 4.23, a new high, while preliminary production had a small increase. It will be interesting to see if production continues to follow the rising rig count.
Loving’s rig graph is time shifted forward by 8 months.
Loving had 19 operational rigs in real June 2025 and also in late April 2029.
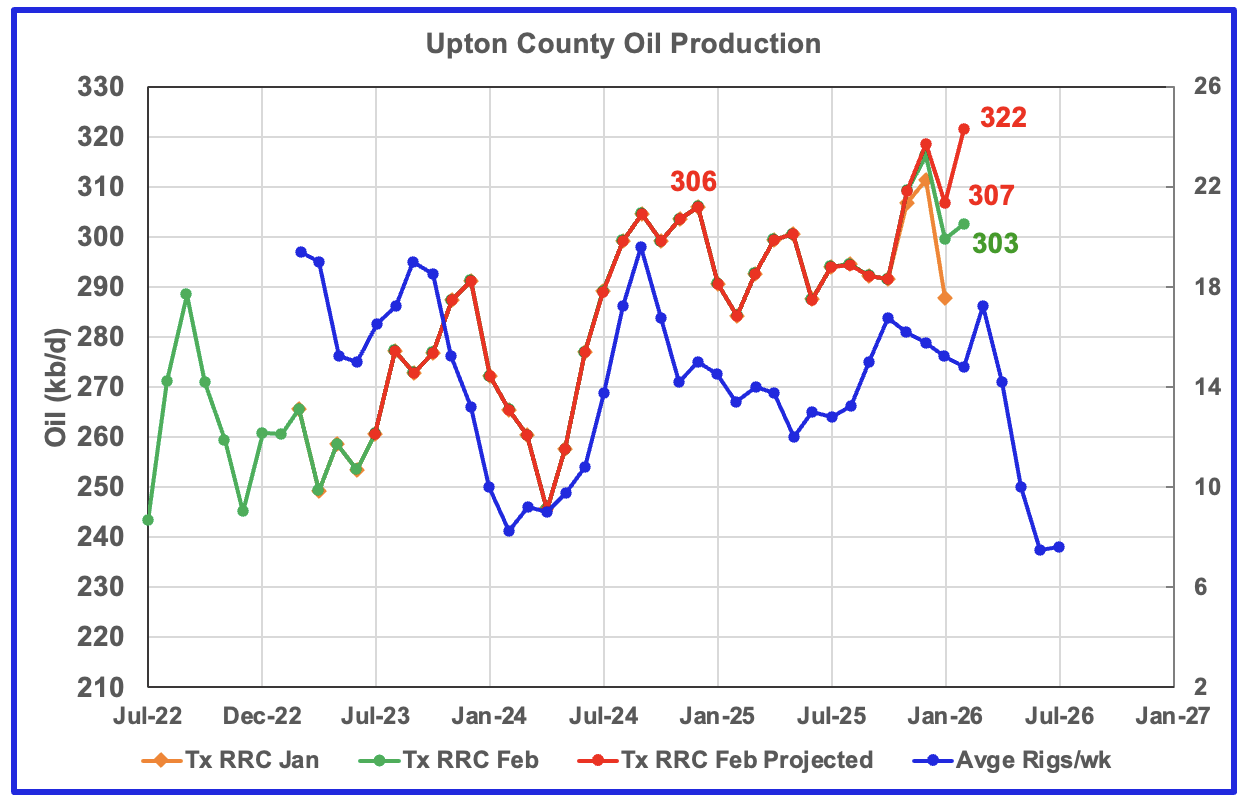
Upton’s projected February production rose by 25 kb/d to 322 kb/d.
For the next few months Upton County may see a production increase associated with the rising rig count which started in time shifted August 2025. A decline may begin in time shifted April 2026 as the rig count begins to drop. February’s production projection increase may also be affected by the late January under production related to the storm.
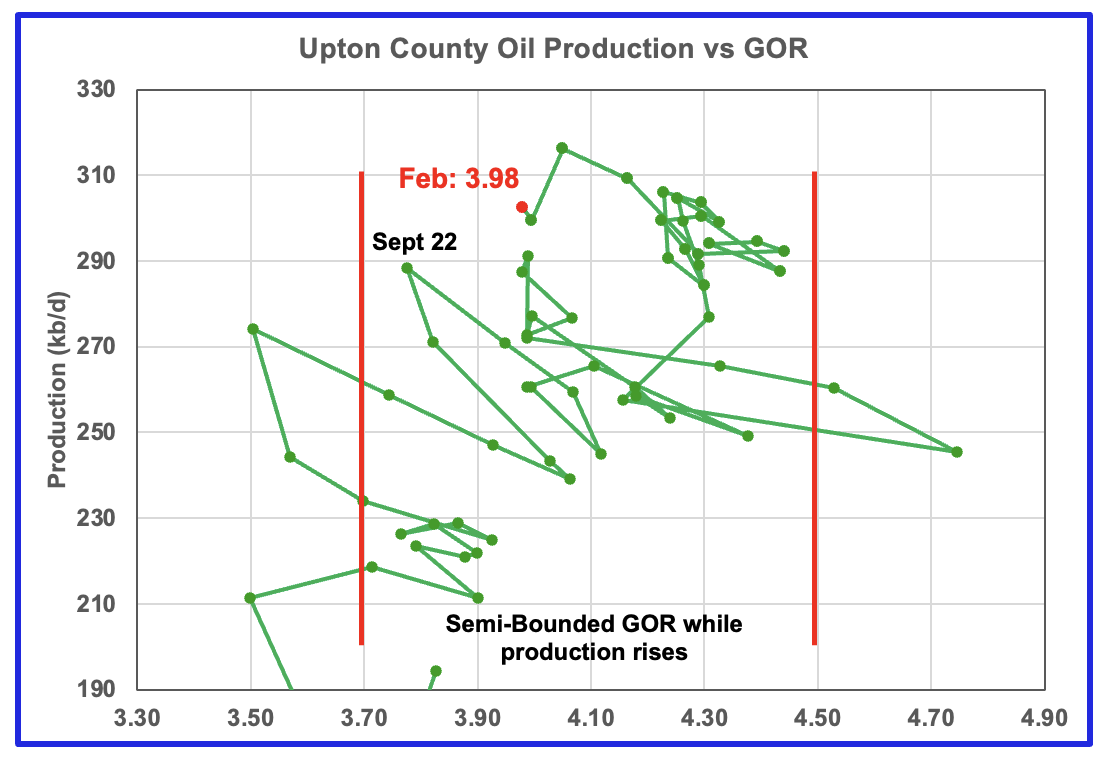
Upton’s GOR continues to stay within the Semi-Bounded region at 3.98.
Upton’s rig chart has been time shifted forward by six months. Upton began 2026 with 7.6 rigs. In real April 2026, the rig count had risen to 13.
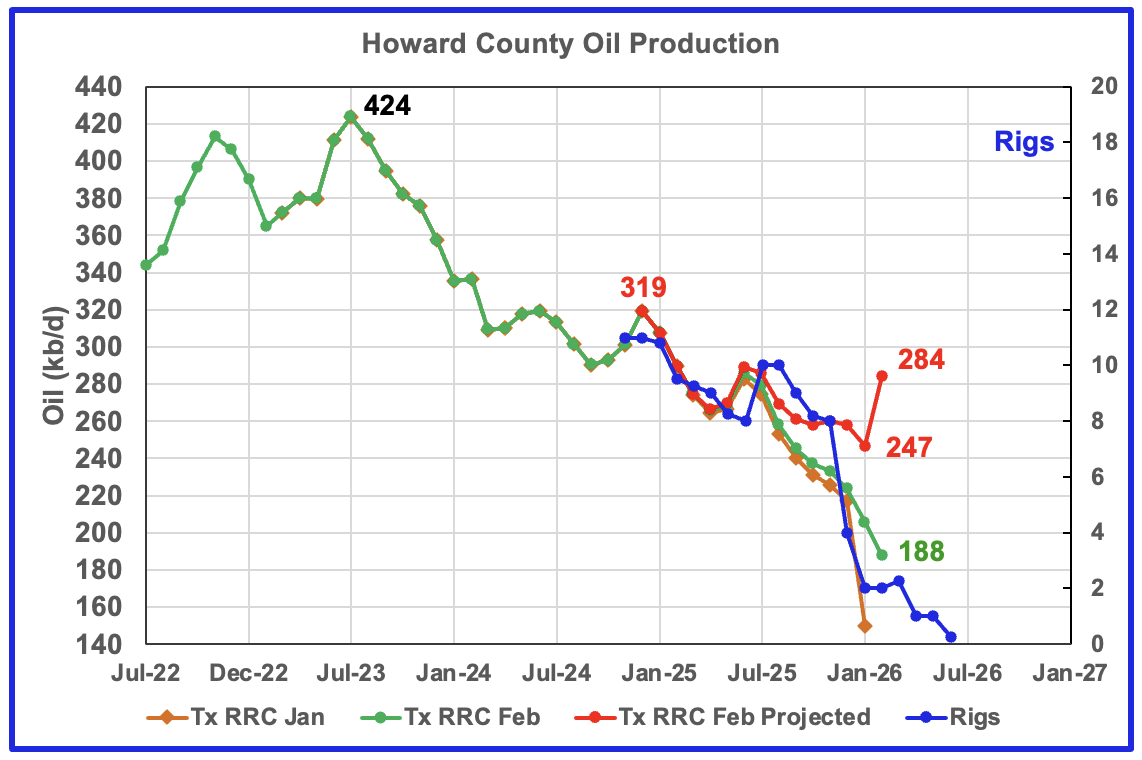
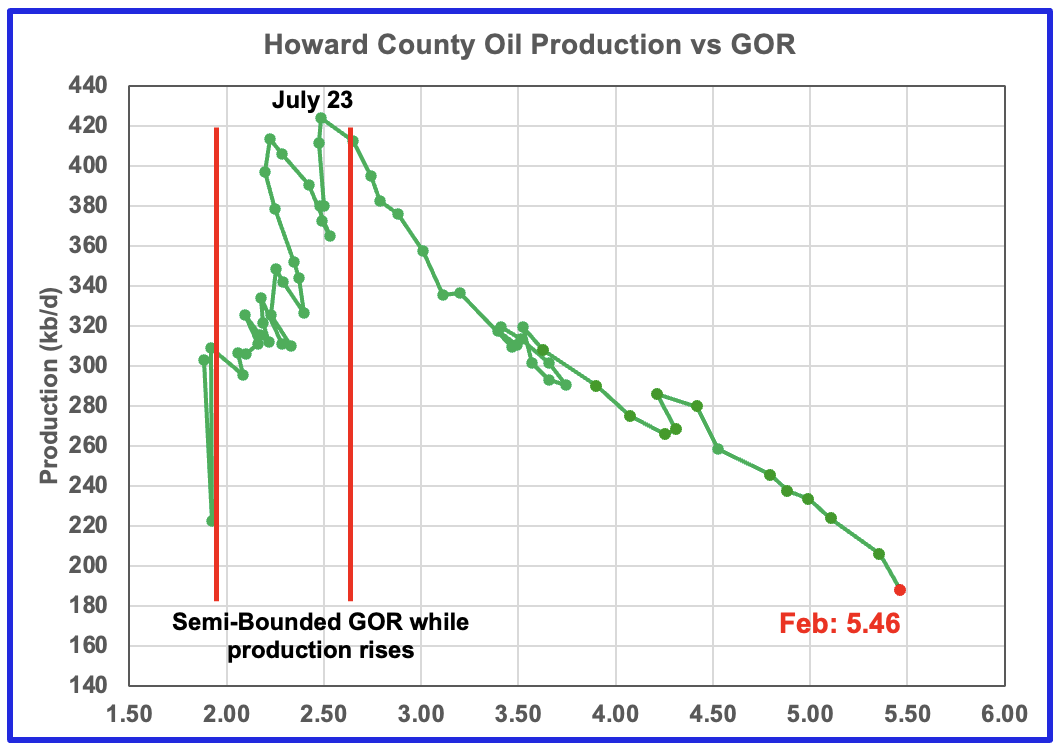
Howard County oil production peaked in July 2023 and has been in a slow decline ever since.
February’s projected production rose by 37 kb/d to 284 kb/d. This may be an optimistic projection due to the low January production.
Note the rig count in time shifted June 2026 is 0.25, i.e. 1 rig for one week in real January 2026. The rig graph is time shifted forward by 5 months. In real April 2026, Howard added one rig for a total of one operational rig.
For February the GOR rose to a new high of 5.46 as the initial production dropped to 188 kb/d.
Drilling Productivity Report
The Drilling Productivity Report (DPR) uses recent data on the total number of drilling rigs in operation along with estimates of drilling productivity and estimated changes in production from existing oil wells to provide estimated changes in oil production for the principal tight oil regions. The new DPR report in the STEO provides production up to March 2026. The report also projects output to December 2027 for a number of basins. The DUC charts and Drilled Wells charts are also updated to March 2026.
The DPR has made been significant upward changes to the oil production forecasts for the three tight oil basins, Permian, Eagle Ford and Bakken reported here. It is not clear if the increases are related to the sudden rise in the WTI oil price from $65/barrel in February 2026 to over $100/b in March 2026. While production starts to rise in October 2026 all the way to December 2027, the price of WTI slowly drops back to $64/b in December 2027.
The forecast seems be model driven whereby increases in the oil price brings on new drilling and the associated increase in oil production. Also interestingly there appears to be the typical six to seven month delay from February 2026 before production begins to rise. The only flaw in this possibility is that oil prices fall steadily from March 2026 to December 2027. Also there has been no reported significant increase in drilling rigs in March and April 2026.
For the Permian, production was expected to increase in October because there was an expectation that new gas pipelines were being built that would permit more high GOR oil wells to be drilled. However the projected increase has been increased further.
So at this time, it is not clear if the sudden production increase starting in the September/October time frame is simply a partially driven model forecast or related to pure Hopium.
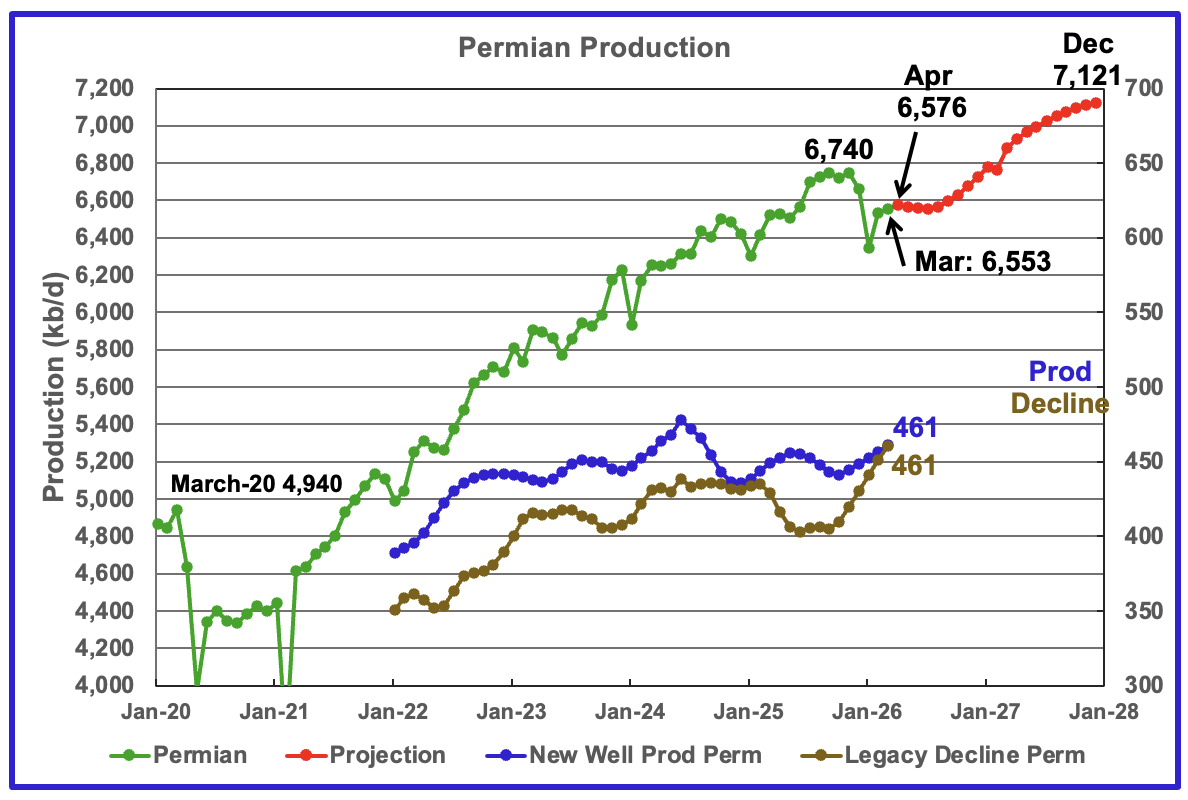
The EIA’s April STEO/DPR report shows Permian March output rose by 20 kb/d to 6,553 kb/d. March production is expected to increase by 23 kb/d to 6,576 kb/d. From March 2026 to December 2027 output is expected to increase by 568 kb/d to 7,121 kb/d. December 2027 production has been revised up by 143 kb/d from the previous report.
Note that production begins to rise steadily from September 2026 to December 2027. According to the EIA, this is due to higher prices for WTI and more NG pipelines being built. The gas pipelines are needed to capture the associated flared gas coming from new oil wells.
Production from new wells and legacy decline, right scale, have been added to this chart to show the difference between new production and legacy decline.
These numbers reflect a one year production trend and provide the production contribution from new wells over a rolling 12-month period to determine if the rate of new production is increasing or decreasing compared to previous periods. The averaging process approximately adds a six month delay.
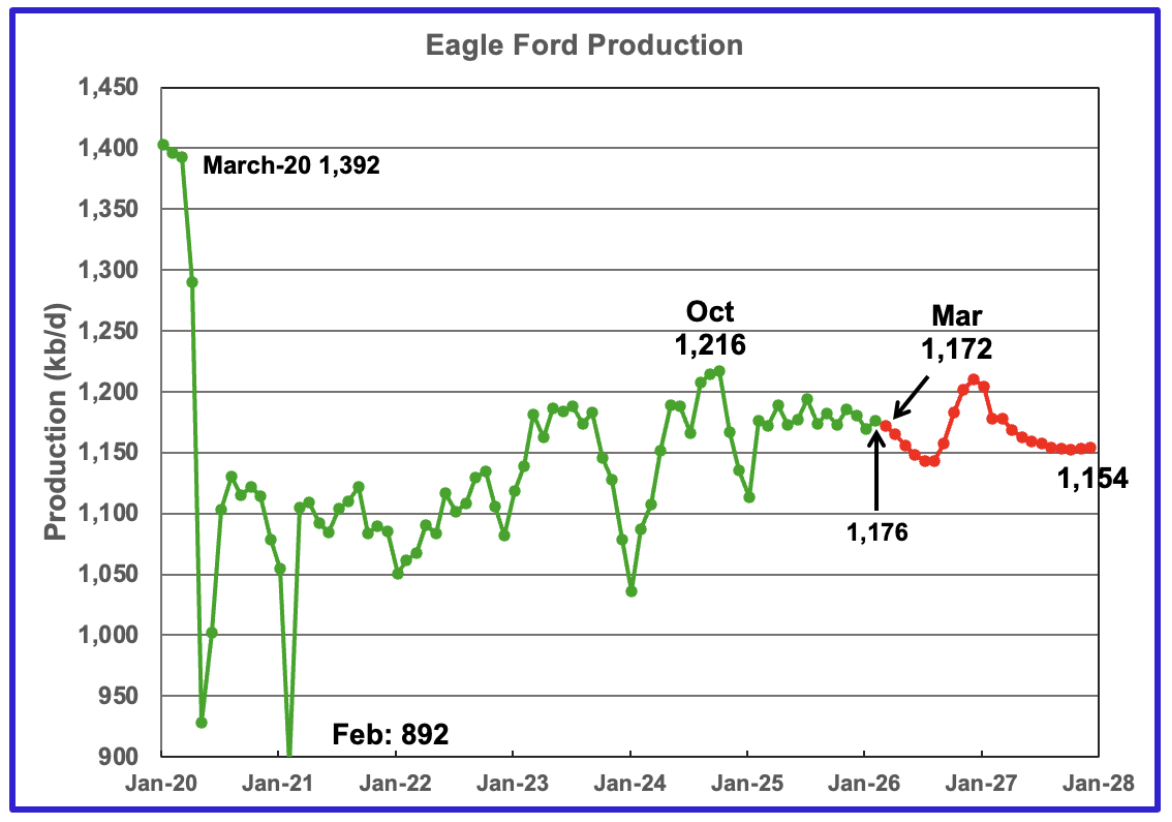
Comparison chart from previous post.
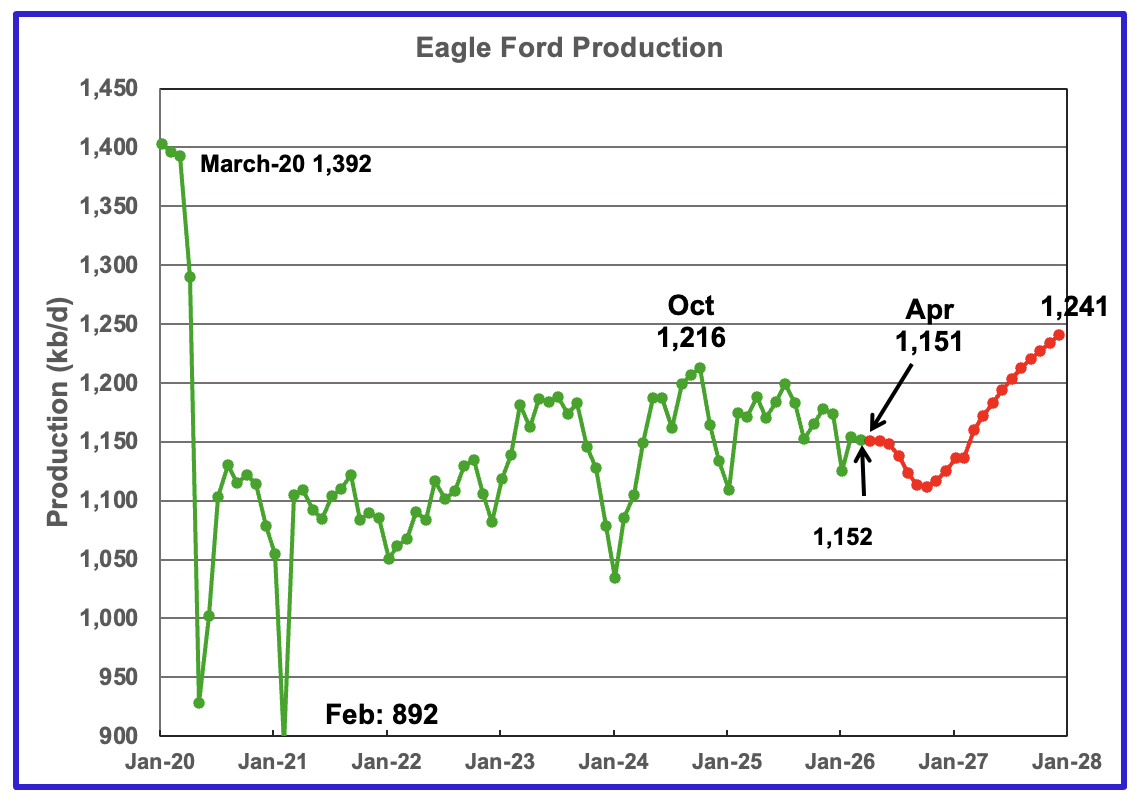
March’s output in the Eagle Ford basin decreased by 2 kb/d to 1,152 kb/d. April’s 2026 production is forecast to drop by 1 kb/d to 1,151 kb/d.
Output in December 2027 expected to be 1,241 kb/d, revised up by 87 kb/d from the previous report. The dramatic production change in going from the February report to the March report can be seen by comparing the current month chart with the comparison chart above.
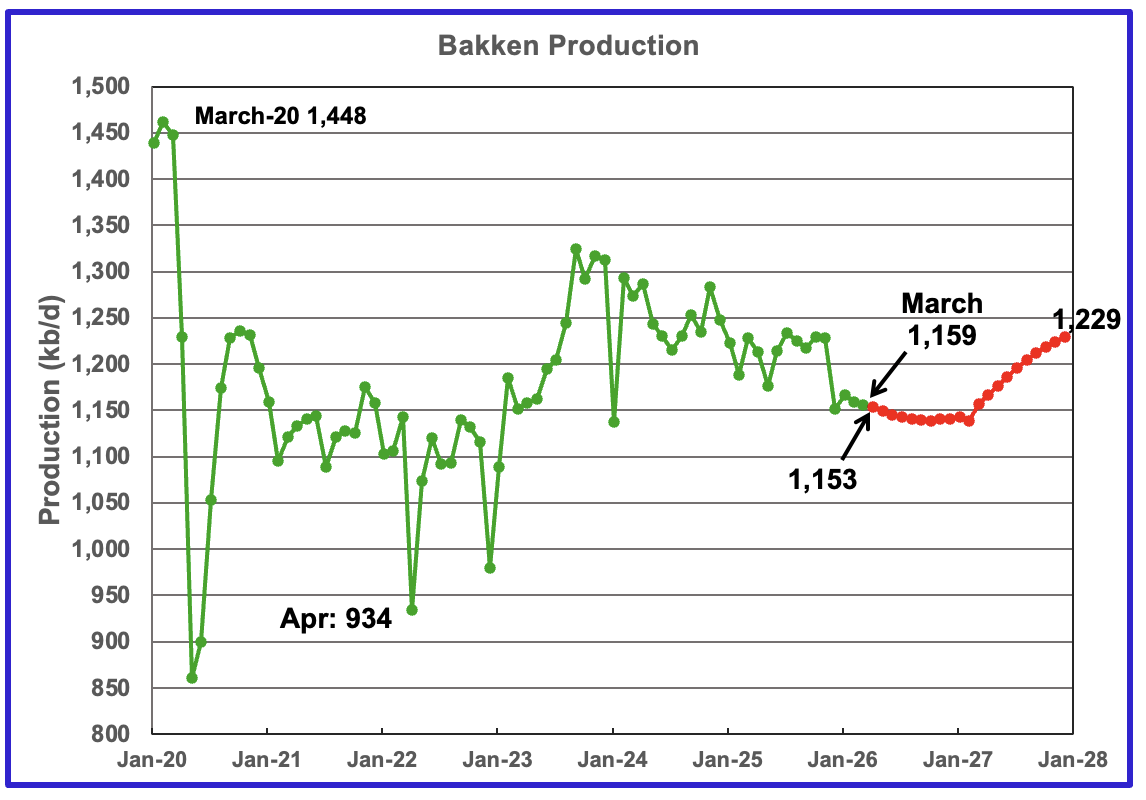
The DPR/STEO reported the Bakken’s March output dropped by 3 kb/d to 1,159 kb/d. April 2026 production is expected to decrease by 6 kb/d to 1,153 kb/d. The STEO/DPR projection, red markers, shows output rising to 1,229 kb/d in December 2027.
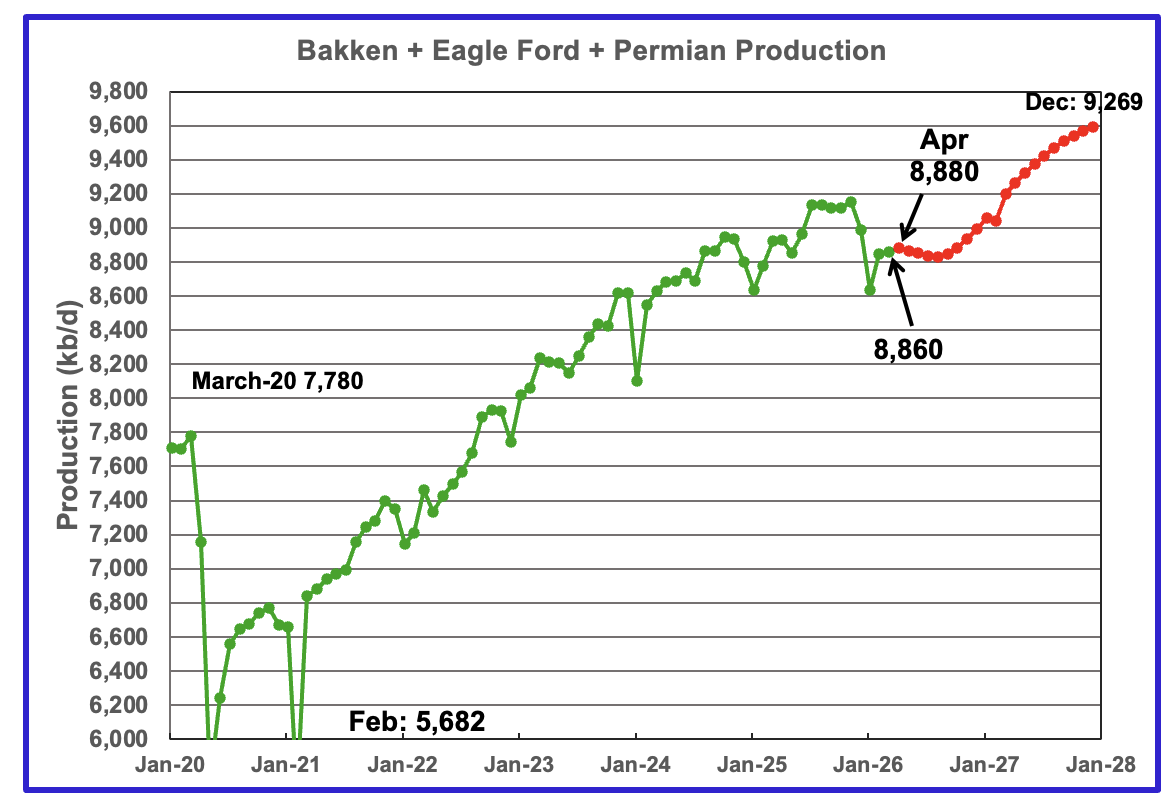
This chart plots the combined production from the three main LTO regions. March output increased by 13 kb/d to 8,860 kb/d. April is expected to add 20 kb/d to 8,880 kb/d. Production for December 2027 is forecast to be 9,269 kb/d.
DUCs and Drilled Wells
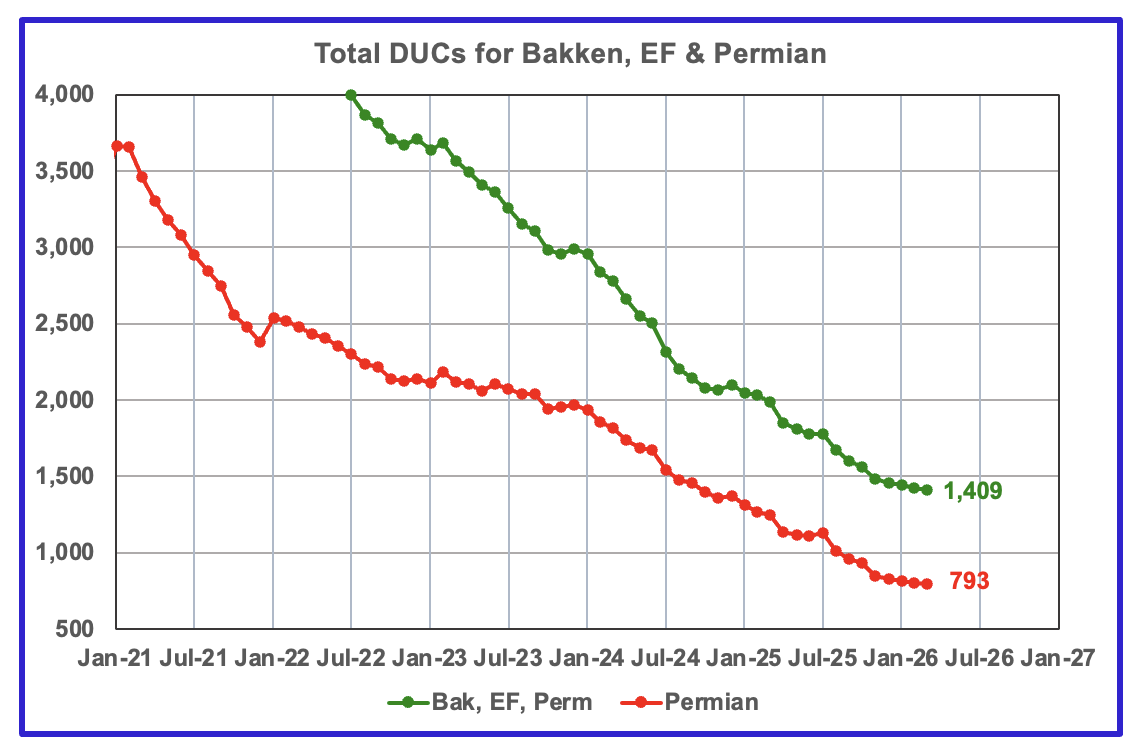
The number of DUCs available for completion in the Permian and the three major DPR regions continues its dropping trend. March’s DUC count for the three basins dropped by 16 to 1,409. In the Permian the DUC count dropped by 11 to 793.
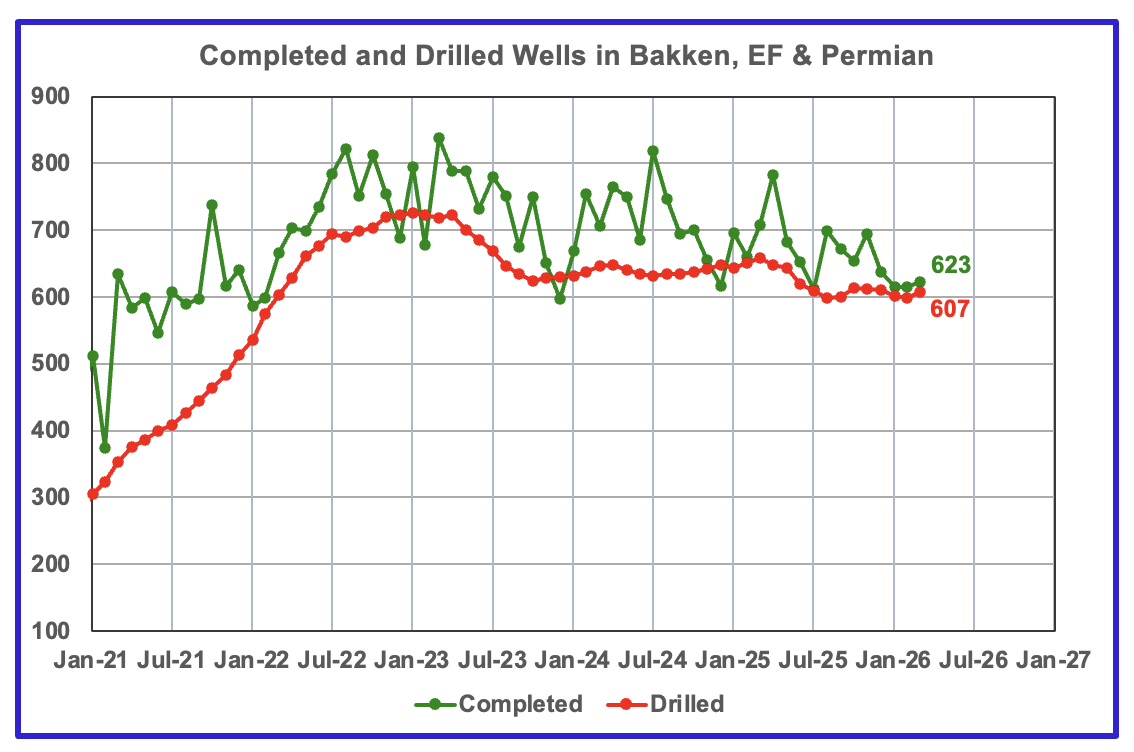
In the three primary regions, a total of 623 wells were completed in March, 8 more than in February. There were 607 wells drilled in March 2026, up 9 from February 2026.
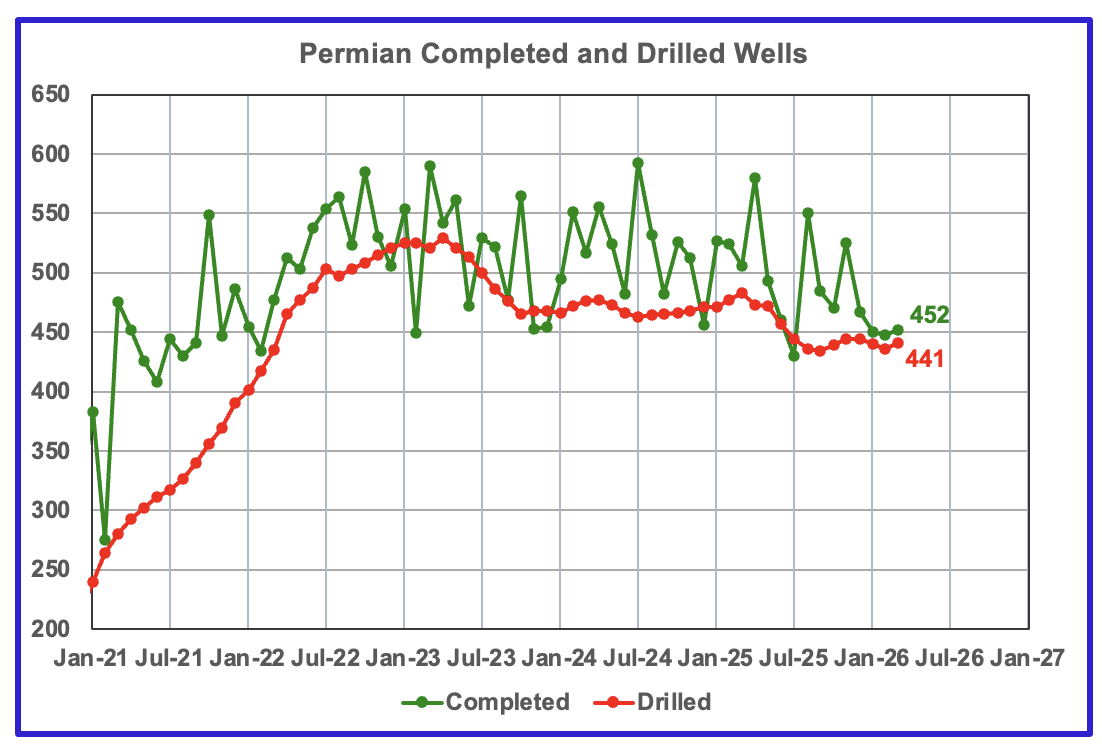
In the Permian, 452 wells were completed in March and 441 were drilled.
110 responses to “US February Oil Production Rebounds”
Thanks Ovi, great stuff.
Chevron CEO Mike Wirth on current Hormuz crisis
https://oilprice.com/Latest-Energy-News/World-News/Chevron-CEO-Warns-of-Emerging-Physical-Shortages-in-Crude-Oil.html
Interesting that Permian DUCs as estimated in STEO are less than a 2 month supply for recent completion rate.
The STEO forecast for US output after October 2026 is wrong, It will be flat at best at the oil prices forecast by the EIA in the STEO and more likely down slightly.
Drop in economic growth as a result of oil and nat gas market disruption is going to surprise many people in the world. Seems underestimated.
Dennis
Thanks
Good point on the DUCs. Didn’t realize the supply was less than two months with the current completion rate of 452 DUCs/mth, as shown in the last chart.
I agree with you on the projection past October. Glad you raised it since I was reluctant to do so. Makes me wonder if there was some discussions held with the projection/forecasting group.
Also note that the current monthly production increase and decline rates are equal for the Permian at 461 kb/d. Unfortunately this is now an average so it is a little more difficult to translate that number to current production.
A few years back there was no averaging and you could relate the production increase and decline to the monthly production change.
Ovi,
I didn’t read your post carefully before commenting, sorry. You had that covered in your post in your discussion of the DPR. On reflection, it may be that higher oil prices and more natural gas pipelines leads to a return to the recent tight oil peak in Oct 2025, but the lack of increase in horizontal oil rig counts so far, makes me think that is an optimistic/unrealistic forecast. It is highly unlikely, in my view that tight oil exceeds the October 2025 peak and a more realistic forecast would be flat output at 9000 kb/d +/- 200 kb/d for US tight oil. Basically the tight oil forecast from Jan to Dec 2027 from the April STEO is wishful thinking.
Dennis
I call it Hopeium
Some people in Russia are starving. Watch for about 2 minutes, beginning at about four minutes (4:00) into this video. I found it shocking. I did not know things were this bad in Russia.
Russia Isn’t Slowly Declining. It’s Breaking. Putin Is On The Way Out.
Ron —
It’s hard to judge if Russia is really near collapse, but there is no question that panic is spreading. You should check out YT videos about Vladimir Solovyov, the Kremlin’s main TV propagandist. He’s freaking out.
Also the “Z bloggers”, Putin’s war cheerleaders, are turning against him as well.
Ron, I don’t recommend you trust this source. It’s clear he’s misrepresenting your own wishes as reality. It’s a complete lie.
People selling used things sell all sorts of useless junk for pennies in the hopes that someone will find use for them. It’s a shame to just throw them away. This is a tradition that’s always existed in Russia, I believe; I remember it from childhood. This will upset you, but people aren’t starving. The footage was filmed in an unknown location. This doesn’t happen anywhere in Russia. Although there are many other negative phenomena, such as blocked internet platforms and stupid laws banning mentions of drugs, fascists, and much more. Western media are biased and often lie and distort reality. For example, Navalny never had widespread support in Russia, and, to my knowledge, there are no political prisoners. Rather, they try to convict them for other crimes if they can be caught, and there are very few of them. For example, I don’t know of a single case in my city. Many still believe that Russia started the war in Georgia in 2008.
Sorry for the off-topic, I just wanted to clarify my post.
Opritov wrote: Ron, I don’t recommend you trust this source.
Opritov, this is a Russian national named Konstantin Samoilov. He has been blogging on Russia for at least two years. He posted from inside Russia until about a year ago. Then he fled because he feared arrest. He now posts from somewhere outside Russia. He will not post his location because he fears he will be killed.
You wrote: The footage was filmed in an unknown location. This doesn’t happen anywhere in Russia.
No, the location was known and it was inside Russia. Obviously you did pay much attention because he clearly states: Now these images come from Rostov-on-Don, the city I grew up in that I know quite well.
After the street scenes, it shows the main city square in Rostov. It shows elderly people, mostly retired, begging for food because their meager pensions are not enough to buy enough to live on.
Hey, I have been watching this guy for over a year now, and I trust him implicitly. He is Russian and very obviously knows what he is talking about.
His blog is called: Inside Russia Check it out.
Ron, these stories were circulating in 2022. This is nothing new, and I would be wary of such channels. There was a similar guy who reported on China and how it was almost near collapse. Those videos started in 2012 and they’re still going and it’s still not true.
The Russian milblog groups have always had a love/hate relationship with Putin, because on the one hand he has built Russia up over the decades, but on the other, he is a liberal who keeps giving the likes of Trump the benefit of the doubt on things like that stupid summit in Alaska. Putin isn’t even integral to how the state functions now, so I don’t get this obsession with the guy. Do people genuinely think when Putin dies Russia will suddenly become that gas station with nukes that everyone in the West so desires? Foolish.
If old people begging is an indication of collapse, then the US is also collapsing too, given you guys throw patients out of hospital beds into the street in St. Louis it seems. It changes nothing on the battlefield, and the Russians have been making bank off the Trump induced oil shock (finally, peak oil is real!).
Kleiber wrote: The Russian milblog groups have always had a love/hate relationship with Putin, because on the one hand he has built Russia up over the decades, but on the other, he is a liberal who keeps giving the likes of Trump the benefit of the doubt on things like that stupid summit in Alaska
Oh my God! Putin is a liberal! Putin is a right wing dictator, and that is about as far from a liberal as one can possibly get.
Okay, he is a Communist. But obviously he is not a true Communists. He is a dictator and a dictator cannot possibly be a liberal. Liberalism is a political and social philosophy that promotes individual rights, civil liberties, democracy, and free enterprise. That is everything that Putin opposes.
I am a liberal. I know what a liberal is. Putin is not a liberal.
“Opritov, this is a Russian citizen named Konstantin Samoilov…”
Ron, I know who this person is. I remember that post where you linked to his YouTube channel.
“No, the location was known…”
Earlier, I was incorrect about the location being unknown; I was referring to the circumstances surrounding the filming of this episode.
—
Ron, I don’t believe this guy, or rather, this one video (I haven’t watched the others). Because I’ve probably never seen people begging in my life (I was just trying to remember, but I can’t; maybe I’m forgetting something).
I’ll try to share what I know:
The minimum pension in Russia is about $200 (depending on the minimum consumption level in a particular region). In Moscow, it’s much higher. Pensions are awarded after age 65 for men and 63 for women, and if a person hasn’t worked their entire life, they’re awarded five years later. Life in Russia is not expensive. For example, my total utilities (I live alone in a 73 square meter apartment) are about $120, internet and mobile phone service are $10 per month. Farm-raised beef at the market costs between $8 and $11. Everything is very cheap if you have your own place. Healthcare is free, but I prefer to go to private specialists and dentists. Four years ago, my rheumatism flared up and I spent two weeks in the hospital; everything was free (examinations, ultrasound, MRI, and so on). So far, I don’t see any signs of a crisis in Russia. I am apolitical, like most of my friends. I consider the war in Ukraine, the way it is going, a mistake, but since I am not involved in it, I don’t think I have the right to judge how it should be conducted. I am satisfied with President Putin, although I often agree with criticism of him and the government in general. What they write about corruption and abuse of power, I think, is largely true. But I personally have not had to deal with the need to pay bribes or anything like that. I consider Putin a right-wing politician. He constantly makes many mistakes. This is due to his personal qualities and those around him, their assistants, and experts in various fields.
I understand I won’t be able to convince you otherwise. You’ll trust Samoilov more. I’ll be happy to answer any questions.
P.S. And yes. Due to the government’s plans to block the Internet, my middle son is planning to leave Russia; he works as a programmer for an Israeli company.
Opritov wrote: Because I’ve probably never seen people begging in my life
Woah! You have never seen people begging in your life? Where do you live? I live in one of the most prosperous nations on earth, the USA, and I see begging almost every day. I recently lived in Florida, New Mexico, and Alabama. In Florida and New Mexico, and occasionally in Alabama, I encounter a beggar at almost every busy stop light. And I often give them a buck or sometimes two bucks. But in Russia they don’t have beggers?
But hey, I understand your position. And I understand you have no choice. And you have to say you are apolitical. Yes, I understand. You live in Russia. But you should do as Konstantin did and flee Russia. Then you could say whatever you damn well please. I do have that privilege. We have free speech in the USA, but Trump is trying to stop that. But for now, I can say, Yes, we have homeless beggars in the USA. And I will not get arrested for saying that.
You’ve confused me; I started remembering. I asked my son if he’d seen them. He lives in St. Petersburg and says there are a lot of them sitting on the streets with signs, mostly asking for money to buy alcohol. From what I remember, gypsies and alcoholics have approached me at markets asking for money (I don’t give it on principle). I didn’t think it was panhandling, where people sit and ask for food. It probably has something to do with where I live (I don’t live in the city center).
Yes, there are homeless and beggars in Russia too, but I think that’s often their choice.
I have close friends who hate Putin and constantly follow reports about the lives of those around him. I’m comfortable with the government, not because I’m afraid, but because I can’t influence it. You’re right that freely criticizing the Russian government is dangerous. Otherwise, I don’t feel any problems, and I’m not planning to leave because of that. It’s also true that television stations that criticized the government disappeared in Russia around 2005. This didn’t bother me because I watched nothing but the news, and I quit watching television around the same time. Like most of my friends, I use YouTube and Telegram, and sometimes listen to the radio. There’s also a lot of religious coverage in the media; I’m neither superstitious nor religious.
I don’t think Trump’s policies will continue after he leaves office. I don’t like liars and braggarts. But I don’t see anything wrong with his desire to make “America great.” I believe the best citizens are those who engage in “productive labor,” meaning those who make cars and produce food. I don’t see anything
Ron —
Despite the “Nothing to see here citizen, move along” from the pro-Putin voices here, there is no question that the Russian government is very concerned both about the economy and about Ukraine’s growing ability to bomb targets all across Russia at will. And by “very concerned” I mean obviously panicking.
Solovyov went on a rant a few days ago about how reporting bad news — even if true — can be seen as a betrayal of Russia. So the reactions here are no surprise.
What the results on the ground will be is a different question, of course. For example, rumors about lapdog Shoigu planning to kill Putin with drones seem unrealistic.
Somailov is sound most of the time. However, I don’t see the point of arguing over that video of retirees, when there are for more concerning news out there.
The Kremlin and regional governments are facing a terrible decline in tax revenue, primarilly triggered by a sharp slow-down of economic activity. In some regions corporate profits have halved since last year, on average profits are down 30% vis-a-vis 2025.
https://www.globalbankingandfinance.com/russian-finance-minister-warns-regional-budgets-strains/
Even with the Strait of Hormuz blocked, tax reveneus from petroleum and gas keep declining. Reuters is projecting a 7% percent retraction for Janurary-May compared to the same period last year. [Ovi, the decline in petroleum extraction and export is now very real].
https://www.msn.com/en-gb/money/other/russias-oil-and-gas-tax-revenues-seen-rising-in-may-but-still-down-year-to-date/ar-AA21OL21
Whereas I cannot possibly attest to the claims of hunger, food inflation has long been a concern for the Kremlin. So much so it is now taking control over the largest agricultural producer in the country.
https://www.occrp.org/en/news/russian-court-orders-takeover-of-major-food-producer-amid-wartime-rise-in-state-seizures
Ron, no offence, but you may need to look up what liberal actually means. And also, what communist means, because Putin is assuredly not a communist, lol. Like, you’d have to have gotten your facts from FOX News to come to this conclusion.
Do you actually know how the duma operates and Russian federalisation at all? Do you even know the powers that forced Yeltsin and then Putin into power were the liberal nationalists?
I would highly recommmend watching TraumaZone by Adam Curtis on the BBC to see just how batshit thinking Putin is some authoritarian communist is. It’s literally the total opposite of what the man did over the last 20+ years. He was put in by MI6 and the CIA to OPPOSE the communist party candidates gaining traction, fer crissake! This was a point repeated by Sir Dearlove as being one of the biggest intelligence agency fuckups of the 20th century with the benefit of hindsight, because Putin played along up to a point, notably after the Kursk disaster where he cleared house and went off script.
After the atrocities the West inflicted in Russia post ’91 with the shock doctrine, is it any wonder though?
Here’s an AI overview based on Bloomberg reporting:
“ As of May 2026, the Permian Basin is seeing a rapid increase in drilling activity, with producers like Diamondback Energy adding rigs—potentially 30+ by year-end—to ramp up output. This surge is driven by high oil prices resulting from the ongoing US-Iran conflict and disruptions in the Strait of Hormuz, with Permian production acting as a critical, stable substitute for lost Middle Eastern supply.
Bloomberg.com
+2
Permian Basin Impacts (May 2026):
Production Surge: Diamondback Energy reported Permian production averaging 521,000 barrels per day (bpd) in Q1 2026, exceeding expectations.
Rigs Increasing: The industry expects to add up to 30 more rigs in West Texas and New Mexico by year-end, reversing a three-year decline in rig activity.
Oil Prices: The Iran conflict has raised WTI crude prices significantly, pushing companies to maximize output in “advantaged areas” like the Permian.
Significance: Permian producers are viewed as a key source of incremental supply to global markets experiencing shortages due to the conflict.”
Similar report from Fortune;
https://fortune.com/2026/05/04/top-us-oil-producer-declares-green-light-drilling-oil-amid-iran-war/
Please do not share AI generated text.
Jake, could you please explain what is wrong with AI generated text? Perhaps you do not realize that AI generated text draws its information entirely from human generated material. Or perhaps you believe that material hardware can actually think and reason. It cannot.
Also, AI-generated texts are generally considered public domain, meaning they can be used without restrictions.
Nick,
For actual changes in Permian rig counts see link below for Week ending May 1 posted by Ovi.
https://peakoilbarrel.com/wp-content/uploads/2026/04/A-Rig-4.gif
Just because one company is planning on increasing the rig count does not indicate an industry-wide change, other companies may choose to reduce rig counts.
Also note that there is about an 8 month delay between increased rig count and an increase in wells producing oil, so an increase in rigs in May would result in increases in producing wells in January 2027, if it actually occurs. Note the flat/ decreasing Permian rig count in the chart linked above from July 2025 to May 2026.
The future is highly uncertain, the current oil futures curve has oil prices falling to $80/b by Dec 2026 and to $70/b by December 2027 for Brent oil. Oil producers may not be convinced that the current high oil prices will be sustained.
I think by now everyone understands that AI generated responses are unavoidably probabilistic. The AI is joining words together that might plausibly be correct, but there is no guarantee of any accuracy. The terms and conditions of your AI specifically says not to believe the output without checking.
In my job, we have routine AI queries we submit a few times a year as part of a reporting process. We save those queries and reuse them. We were surprised the first time we resubmitted a query and got a wildly different response than previously. We’ve seen it a number of times now. Query output that require judgment or understanding are as likely to be wrong as they are right. Queries that require combining information from disparate sources also gets thrown off.
I’ve also used AI for coding, and even there, you can send a query and get a response, and you think ‘That’s not bad”. You ask for a slight change, and what you get back bears little relation to the output from three minutes ago.
If your AI has links to its ‘sources’, you can frequently see why it isn’t responding accurately to your question, but other times it’s a fog of misunderstanding.
The AI has no ‘understanding’ as you know it. Paragraphs based on no understanding aren’t really worth much are they?
I agree with Jake. AI slop is just that.
Dennis,
I guess my question is whether higher price will bring more supply. If it can, what would be reasonable to expect? Given the Iran war started with no notice, and that all along the president has been talking prices down, if there is a relationship between price and supply, what would the time lags be? For example, how soon could we reasonably expect rig count to rise in the field? My impression is that corporate decision making isn’t overnight, and that rigs could easily take more than 2 months to deploy, so current rig count so far might not be illuminating.
The whole issue of supply and demand is complex. One problem is that short term elasticity (both supply and demand) are very different for short-term vs long-term: long-term response is roughly 3x as large as short-term, and the president is working very hard to convince everyone that this is a short-term supply problem. Wall Street traders seem to be mesmerized by the president, but I think sensible people are beginning to disbelieve this messaging…
It’s worth noting that energy sources that can respond quickly are indeed responding: Chinese exports of solar panels & BOS have doubled year over year, and EV sales and Chinese EV exports are behaving similarly.
Jake, Gerry,
I agree that AI needs to be verified. In this case I don’t have a subscription to Bloomberg, so I thought the AI summary might be a useful starting point, and added the Bloomberg source and the comparable Fortune article for further reading.
Nick,
In theory higher prices would likely lead to higher output, ceteris paribus. The problem is that future prices are unknown and we are in a situation with particularly high uncertainty so there are more unknown unknowns. The war started on Feb 28, more than two months ago, we get rig counts weekly (last data point is May 1). My guess is that oil companies have thought the high oil prices would be temporary, up to now, eventually this might change, but based on the most recent rig data it hasn’t changed yet. Will it change in the future? Unknown.
Also keep in mind the increase in tight oil output is simply exported, US refineries can only handle so much tight oil, that’s why the US crude export ban was lifted in 2015.
Also keep in mind that the EIA expects WTI price to fall to $64/b by Dec 2027 in the most recent (April) STEO, similar to the price level in Sept 2025.
Hi , Opirtov . Good to see you around . I agree with you ” One swallow does not a summer make ” . I can post videos of the posh localities of New Delhi and Mumbai and all would think that India was the first world . Does that disguise the fact that 800 million live on 5Kg of wheat/ rice per month/ per person FREE provided by the government ? You are accurate in your assessment . I like you left this blog because of its jaundiced views . Denise and Ovi do terrific work but then why is it that OFW has 3000 + comments on a post and even Quark whose blog in is Spanish has more than 100 comments every alternate day than POB and OSB ? Sorry — If all you have a hammer then all you can see is nails ” . This is what happened with POB and Mike Shellman . Too USA centric and cannot tolerate an alternate POV . Well the world has changed and folks here have not . Again I repeat I have a lot of respect for Denise , Ovi , Ron and Mike Shellman because without them I would be ” energy illiterate ” .
Sad to see POB go the way of TOD . 😭
hole in head
Would you be kind enough to share links to the other blog sites that reference as more active?
thank you!
T Hill,
I’d guess that OFW refers to ourfiniteworld.com
It is, in my opinion, highly unrealistic about FF and renewables, and energy and economics in general, but your mileage may vary.
HIH, my very personal social media outlet is directed at the American oil and gas industry, often in great contradiction to its “abundance” narrative, and to Americans that might be interested in learning more about oil and natural gas instead of being brainwashed on the internet.
I am a very proud, conservative American, very proud South Texas oil man with 60 years of experience that has drilled and participated in over 500 oil and gas wells, with his own money. I went around the world on oil well fires and blowouts for a decade with the largest well control company in the world. Events that would terrify you. Name the country, I’ve been there…trying to prevent a disaster. My personal stories on those events and countless stories on worldwide oil and gas history, which you never had any interest in, and took countless advantage of to vent personal opinions, were an early morning outlet for expression, nothing more. Fun for me, that I suggest many appreciated.
My bottom up analysis of the U.S. shale phenomena is always backed up with real data; I actually have owned countless interests in tight oil wells. I always accepted criticism of my analysis, as long as it was on topic and from sources I respected. For the record, I never had more than a few comments to my posts, ever. Most of what I wrote was over people’s heads. The tight oil industry in America dislikes me immensely. I try to tell the truth.
The world HAS changed. Good call. I am not a globalist; quite the contrary. I dislike, greatly, people that live in Europe, that consider themselves “worldly,” that might feel they have the moral high ground over me, criticizing my great country…most of the time with their hands out, expecting cheap American oil/ LNG exports, and American military might to protect them. I criticize my country’s energy policies because I live here, and after 60 years in the business, have earned the right.
It was never my intent to provide you, or anybody else, a venue for entertainment, or anti-American hate. It was to share, and teach. I stay in my lane.
You seem to have a lot of time on your hands, try managing your own blog. Good luck !
What do you think about Novi Labs’ claims that there is enough high-quality shale inventory at least through 2040?”
https://novilabs.com/resources/why-theres-enough-core-shale-inventory-thru-2040-with-brandon-myers/
Mike, Europe is actually paying a lot for LNG from the U.S. Take a look at the prices at which you sell gas to Mexico (which, by the way, they are also starting to re-export). And when it comes to oil, your refineries wouldn’t be able to manage without imports of heavier crude grades. You have too much light crude.
Greetings from Poland, which spends a larger share of its GDP on defense than the U.S. and buys most of its military equipment from you.
Holeinvoid
I do not find your criticism of this site especially warranted. There have been numerous “off topic” discussions going on through the years. If there is no censorship – these would go off the rails. And no interesting discussion overall would be the result. To limit the discussion to oil and gas and the natural extension to fossil fuels and renewables should be what this site is all about. I guess (without knowing anything special), that having a minimum threshold of knowledge for issues discussed would be the best for all parties involved. You have the the knowledge to comment here (holeinvoid); I have no doubt about that.
Nick G,
Thanks for the pointer to Our Finite World. It has been quite some time since I’ve followed that one. I lack the expertise in finance to critique the work by Tverberg, but had long ago come to a similar conclusion about her take on low carbon energy sources. Her opinion on these sources often seemed predetermined rather than guided by the data.
Piotr,
See the following Novi presentation, it suggests about 4 to 5 years of Tier 1 and Tier 2 inventory will be profitable for D&C in the Permian Basin, the best will be completed first, in the first 3 years or so and then productivity decreases as a higher proportion of lower tier wells are completed and likely completion rate falls as wells become less profitable. This is the reality. For other US tight oil basins the situation is likely worse than the Permian.
https://www.linkedin.com/posts/novi-labs_inventory-exhaustion-in-the-midland-basin-activity-7432528800468332544-EH8D?utm_source=share&utm_medium=member_desktop&rcm=ACoAABDV_wMB3QBPTlgD0zpWSJp3xTFeAV0uqvA
The podcast is probably on the optimistic side.
Chart with historic shale gas and tight oil output for US at link below from EIA.
chart(121)
US Oil and WTI price at links below, based on this data, oil price alone is not sufficient to raise oil output.
https://www.eia.gov/outlooks/steo/data/browser/#/?v=3&f=A&s=0&start=1998&end=2027&linechart=COPRPUS~WTIPUUS&ctype=linechart&maptype=0&map=
chart oil and price
“ based on this data, oil price alone is not sufficient to raise oil output.”
That’s not what I see in this chart. I see a sharp price increase from 1998 to 2008, followed by a sharp output increase from 2012-2018. The reason that’s not clear is two-fold: 1) there was a big lag between the price increase and the output increase, and 2) there was a “phase-change”, where the industry developed techniques that broke through “barriers to entry”, and after those techniques were developed the industry could continue higher levels of output even if prices stagnated or dropped somewhat.
There are big lags in this industry. The same is true of some related industries like nuclear., and it was true of wind and solar 50 years ago. Nuclear hasn’t broken through, though it’s trying with small modular reactors. Solar in particular has broken through in dramatic fashion, and utility-scale solar can be installed relatively very quickly. And now it’s becoming possible for homeowners to install “balcony” solar, where all you have to do is shop at a big-box store in the morning, and plug it in that afternoon. EVs can be bought almost as quickly.
Mike has an interesting post on oilystuff. https://www.oilystuff.com/groups
Here is a chart showing correlation between higher oil prices in the U.S. and increased oil production. You hear this crap a lot all over the internet: the cure for higher oil prices is higher oil prices. Top chart in green is prices, bottom in blue is U.S. C+C production in BOPM.
As you can see there is not much of a correlation at all. Higher oil prices from 2009 to the end of 2014 led to the beginning of the tight oil revolution….or did it? During that same period the industry engaged in tight oil extraction borrowed over $400 B, most of which was lost, in the growth over profit brain fart.
The odd thing about those charts, and this argument, is that they make a pretty good argument that higher prices cause higher production (with a lag), and that higher production in turn lowers prices. IOW, the cure for higher prices is…higher prices. Boom and bust – the oldest story in the book for commodity markets. And, yes, a bust is likely to make producers lose money – sometimes quite a lot of it…
I could be wrong – this is a very complex situation – but this seems like the simple explanation for what we see.
Hi Dennis, if you superimpose no. of wells drilled on the historic oil output how does it match up (i.e. the underlying data to your convoluted oil shock model)? Thanks Phil
Hi Dennis, if you plot no. of wells drilled on your historic shale oil production graph how do they match up (i.e. the underlying data on your convoluted oil shock model)? Thanks, Phil
NickG,
As I said price increase alone is not sufficient to raise oil output. Other ingredients are needed such as technological breakthroughs, time, etc. So one can see what they want to believe in that chart. In some cases higher prices led to higher output, in other cases lower prices led to higher output. Also keep in mind that real prices would be a better metric than nominal prices.
Chart below has trailing 3 year average real oil price in 2025$ vs US crude oil output. The correlation coefficient is 0.06.
price v crude
“ Other ingredients are needed such as technological breakthroughs, time,”
Absolutely, but that’s consistent with the price signal being very important: tech R&D is incentivized by price, and the price mechanism takes time to work.
“ one can see what they want to believe in that chart.”
Well…no. Look at Mike S’s handy price chart from 2000 to 2008, then look at production from 2008 to 2015. On the one hand, it’s roughly an 8 year lag! On the other hand…wouldn’t anyone in the industry say that the high price period caused the production increase??
“ trailing 3 year average…coefficient .06”
So, I see 2 problems: the 3 year trailing average only delays , on average, by 1.5 years – that’s not nearly enough to capture an 8 year lag. And a 3 year average probably leaves too much noise.
And 2) you can’t do that kind of correlation over a long period where there are different “regimes”, where the price production interaction is different. For example, from 1971-1981 the US had price controls on crude oil – that tends to eliminate the price signal!
:
Hi Phil S,
My tight oil models use average well profile for different basins (Permian, Bakken/Three Forks, Eagle Ford, Niobrara, and rest of US tight oil) and the variation in the average well profile over time (changes with well length, proppant use, and areas drilled) as well as the well completion rate to estimate output. The chart below compares model with data from Jan 2010 to Feb 2026, the correlation coefficient between model and data over that 17 year period is 0.9982. See chart below for model, the model after Feb 2026 is a guess, likely (or certainly) incorrect.
tight 2605
Mike is spot on on price vs output for US in my view. Chart below has monthly US C+C output in thousands of barrels per month (kb) vs average monthly real oil price in 2025 US$/b. The linear regression is shown in red with R squared on chart (under 5%).
real price and oil
Thank you, Dennis. You are correct. Once the tight oil and tight gas phenomena occurred, everything changed and the correlation to price and production ceased. It is a resource not profit dependent, but entirely QE/debt dependent. Even today the sector is still borrowing money to facilitate share buybacks and dividend payments to share holders. I would think the blind, like Nick G, the staunch anti-oil advocates, would find happiness in that. I don’t. It worries me to death. I care about our future.
I apologize to your community; I often cannot bare the political bias here. I will stay away in the future the very best I can. Be well.
Mr Shellman,
Your comments are always welcome as far as I am concerned, we have all learned a lot from you and most of us appreciate it greatly.
My apologies if this seems offensive, any offense was not intended.
Phil S,
Here is lateral feet drilled vs tight output from March 2021 to March 2026, note that lateral feet completed is a better metric, as sometimes more wells are completed than drilled. The wells drilled data is pushed forward by 6 months to account for the delay between well being drilled and first flow from the well.
feet drilled and tight
You have heard of TACO. Now there is NACHO – Not a chance Hormuz opens.
Scott Bessent has been masterful in managing paper oil prices. But gasoline is $4.99 in my town.
Either someone has hacked into the Trump Administration’s phones or the Trump family is making a killing trading oil futures at 3-4 am EST every so often before the President truths.
Is it ok for the Trump family to own interests in the betting platforms where you can place bets on US military strikes?
Shallow sand,
You probably know more constitutional law than most of us. If the election in November goes badly enough, perhaps Trump is removed from office for corruption and incompetence, Seems doubtful as the Republicans don’t think it is their responsibility to uphold the Constitution, there won’t be enough votes in the Senate to convict and remove from office on impeachment.
buying the dip
Dennis.
None of this will happen.
What is sad is that I don’t think I’m making a political statement here. Just calling balls and strikes.
But any criticism of President Trump and it’s an immediate attack followed by a what about that a Democrat has done, and usually I agree the Democrat should be held to account too.
The poll about whether one could beat Trump in a fight is telling. Keep in mind Trump brought this up vis a vi an 8 year old. All in fun.
Trump is 80. Yet 39% of Republicans do not think they could beat President Trump in a fight. Only 33% believe they could, and the rest refused to answer.
I posed this question jokingly to my MAGA friends, and none could bring themselves to answer.
I’m getting the feeling if President Trump said he shot 38 under in an 18 hole round of golf, most MAGA would believe it. (This is what Kim Jong Il claimed he shot in his first ever round of golf).
After all, they believe the 2020 election was stolen and voted for Trump again in 2024 despite the 1/6/21 debacle at the Capitol. Most un American thing I’ve seen a President do in my 56 years was incite that riot by claiming he won an election he lost.
We will have to see if the Republicans are ready to go another direction in 2028. I doubt it. It will either be Trump trying for term 3 or Don Jr.
Shallow,
I think the next great scientific frontier is neurology and psychology. In this case, what makes people vulnerable to cults of personality??
Nicki, that is good news; you folks with so much fear, and hate, over ONE president, in 47 different American presidencies since America was born, need help, badly. I worry about you. But only for my country. Otherwise, I don’t give a shit.
It will indeed be interesting to find out what makes people so fearful of “personality.” Of, as you say, cults.
I try and stay in my lane (you should too, whatever lane that is!) and about oil prices vs. oil production you could NOT be more incorrect. You may refer to me as Mike Shellman, BTW; I have nothing to hide. My “chart,” that you refer to is actually a Scientific American chart used in an article it published a few days ago. Google it. Reread my post, or not.
Lets first recognize that what we are talking about in this debate about higher prices equating to more U.S. oil production is tight oil, with a very short investment cycle of six months, maximum. You seem to imply that higher oil prices between 2008 and 2015 led to a surge in U.S oil production from 2016 on. Are you implying that the cash carry forward from 8 years prior led to higher production?
The R&D reason is stupid; I am not going there.
The export ban was lifted in 2015 and the shale oil industry borrowed hundreds of billions of dollars because it, all of a sudden, had a market for its lousy oil. It eventually lost every dime of what it borrowed., pretty much.
Rig counts from 2015 onward, in the Permian, rose to 590. This all occurred on DEBT, not higher oil prices from eight years ago prior. Christ, you neither have ever been in business for yourself nor made a Friday payroll, have you?
Now, at $97 WTI, the rig count in the Permian is 242, half of what it was, at 2 times the product price.
Please, stay out of the oil business. You know shit about it.
The takeover of Iran by mad mullahs caused a spike in oil prices that ruined Jimmy Carter’s presidency. But it wasn’t really in his control.
Trump brought this on himself. Republicans can only be rescued by gerrymandering (or worse) at this stage.
So Trump was up till 3 AM today. He spent the whole night publishing obvious lies on his blog about Obama and Hillary Clinton, accusing them of treason and lambasting his own Department of Justice (run by a former personal lawyer) for not arresting them and many others for treason.
Rig Report for the Week Ending May 8
– At this point there is no indication that higher WTI prices are attracting increased drilling.
The dropping rig count that started in early April 2025 when 450 rigs were operating rose this week for the first time in three weeks. Drilling continues at a steady rate of 367 ± 5 rigs per week since August 2025 while WTI closed just shy of $96/b today, down $6/b from last Friday.
– US Hz oil rigs rose by 3 to 369, down 81 since April 2025 when it was 450. It was also up 7 rigs from the low of 362 first reached in the week ending August 1, 2025. The rig count is down 18% since April 2025.
– The New Mexico Permian rig count was unchanged at 82 rigs while rigs moved between Eddy and Lea counties. Eddy rose by 2 to 34 while Lea dropped by 2 to 48.
– Texas added 2 to 181. Midland and Martin were both unchanged at 22 and 26 respectively. There was only one small change among the larger oil producing counties. Upton added 1 to 13 and is up 7 since the beginning of the year.
– Eagle Ford added 1 to 34.
– NG Hz rigs dropped by 3 to 111.
A Rig
Frac Spread Report for the Week Ending May 8
The frac spread count rose by 5 to 179. From one year ago, it is down by 16 spreads and is also down by 36 since March 21, 2025. The frac spread count has risen by 14 over the last three weeks.
A Frac
**Holy Merde — US oil production = 82% shale oil !?!? **
Hey all,
I’ve been away from peak oil topics for close to 20 years now. I used to trade oil/gasoline/kerosene pretty heavily and spent a lot of time studying peak oil. I believe it IS and was real, but it was delayed by the shale oil boom, and thinking about peak oil while the shale stuff kept ramping up was worse than watching the paint dry, so I drifted off to other things.
But given the Hormuz being closed now for roughly 2 months, it feels like the world is in an amazingly dangerous situation in terms of fuel/plastic/fertilizer supply.
Re oil, I just checked US oil production, and currently:
US oil production: 13.6 million barrels per day
Shale oil: ~11.1 million b/d ~82% (!!!!)
This seems insanely dangerous. Possibly way worse than if conventional oil had just slowly declined according to Hubbert’s curve.
Pls correct me if I have this meaningfully wrong, but shale oil wells have a decline rate of 60% or more in the first year, then further fast declines per year.
Once this stuff peaks, it will drop FAST.
Maybe the whole race to energy crisis/food crisis/depopulation is for the elites to get ahead of the curve on this one.
Hungry, destitute people can become extremely angry and dangerous, especially if they have weapons.
Do I have this right, particularly about the steep curve we are facing with peak shale oil?
I look forward to any comments/advice.
THC,
In July 2025 US tight oil output was 9.43 Mb/d and US C+C was about 13.7 Mb/d, so about 69% of US C+C was from tight oil. The decline will be quite rapid as basins deplete and average well productivity starts to fall as less productive areas are drilled. See chart at comment linked below for one possible future tight oil scenario (some believe this scenario may be optimistic, it is my best guess, but certain to be wrong (may be too low or too high, not known).
https://peakoilbarrel.com/us-february-oil-production-rebounds-2/#comment-796170
The shale and tight condensate are so large in US — they are about 3.5Million BOPD.
If including NGL, Codensate and NGL will probably be twice the size of Condensate, i.e. 7Million BOPD?
besides Permian will have more condensate and NGL, the Appalachian (Utica and Marcellus) will also contribute significantly.
In Argentina oil and gas map, shares of VacaMuerta shale oil and gas are also close to US, i.e. gas 65% and oil 69%.
https://oilprice.com/Energy/Energy-General/Argentinas-Shale-Boom-Is-Rewriting-South-Americas-Energy-Map.html
There is a caveat though about NGL and condensate, the VacaMuerta condensate mainly come from the “condensate and NGL wet gas field” — they are so strong, like the rising Southwest Marcellus !!!
Unlike Permian, the oil blocks in VM has much slower rise in GOR and condensate/NGL.
Sheng Wu,
Note that condensate is not the same as NGL, the condensate is included in C+C data, the rest of NGL (propane, butane, and ethane) are not included, nor should they be, the NGL is useful for heating, cooking and petrochemical input, but not for transportation.
THC
Attached are some normalized production curves, normalized relative to the highest production rate, for the Permian, Bakken and EF basins as taken from the following link. As you can see, after one year, production is down by 70% in the Permian and EF basins and down 60% in the Bakken.
This post focusses on US and Permian production to assess whether US production has peaked.
Where did you get the 11.1 Mb/d for tight oil. The chart before DUCs and Drilled wells above shows current tight oil production to be closer to 8,860 kb/d.
https://www.sciencedirect.com/science/article/pii/S1995822624002139
A Tight
Ovi,
Similar production curve analysis or DCA has been conducted/presented by NOVI and also several other geologists, from Art to Patzek/Saputra,…. and many professional to freelance like me.
I was reading the work from NOVI and Frank Male on Bakken, and I realized that the changes in production patterns over the years from 2006 to 2018 reflects a hidden fact that few dare to admit — the operators overworked the Mid-Bakken and that the Bakken might have a second life to become true “shale oil”, and here is my interpretation,
https://www.linkedin.com/pulse/different-production-patterns-tell-driving-forces-shale-sheng-wu-ra7be
Frank Male’s paper pointed out the discrepancy of conventional DCA and Bakken real DCA. As Scott Lapierre and Frank all pointed out that the newer laterals’ production reached BDF much earlier, and result in much faster accelerated decline. The link above you presented from China researchers did not include that, and it is often blamed by shale critics, from Art to Mike. Scott would point out more than Frank that it is the bubble point death.
But, I am writing to emphasize that it actually showed that the larger frac jobs increased the permeability significantly. Therefore, the conjecture before, i.e. “no shale oil” because oil is too viscous than gas and shale has too low perm are not the real driving forces, or actually road blocks, and they are defeated by newer larger frac jobs.
There is a true anaolog of Bakken high TOC shale, and it is the SouthWest Marcellus, now in Ohio, they are actually producing prolific shale oil.
Prolific Ohio output in chart below, about 135 kb/d recently.
chart(123)
Here is what prolific looks like from New Mexico, roughly 16 times Ohio’s output.
chart(124)
DC,
I should have said that the Marcellus shale oil in Ohio “only just started”, but rest for sure — it is quite prolific, with production rival many in Delaware sub-basin, NM in terms of each lateral; but also rest for sure that the acreage is not as large as in the 2 counties in NM, and often they are not multi-stack as in Delaware, and only 2 — Utica and Marcellus, and often when Marcellus is producing wet-gas-condensate, the Utica is only dry gas.
Currently, most of the shale oil production in Ohio comes from Utica, but I see potential upper stack Marcellus with high TOC shale like in Upper and Lower Bakken could produce black oil. There is no reports yet, and hope it is not due to the “no shale oil” in the professional geology.
2025 Monthly Averages: over 7Million barrels per day, highlighting that the highest point in the latter half of 2025 was September at 241,752 thousand barrels (approx. 8.06 million b/d). EIA’s Annual Energy Outlook 2026 (AEO2026) is even more optimistic. The agency has raised its 10-year forecast, estimating that NGL production will average 8.85 million b/d from 2026 to 2035, a 14.4% increase from the projection in the previous year’s report. By 2050, EIA projects production could reach 11.3 million b/d, driven by robust growth in natural gas processing.
Sheng Wu,
NGL is not oil, it is relatively unimportant for transport, can be used for heat, cooking and petrochemicals, but more like natural gas than oil for 85% of the total. The condensate portion is relatively minor, about 12% of NGL produced in 2025. See
https://www.eia.gov/dnav/pet/pet_pnp_gp_dc_nus_mbblpd_a.htm
Sheng wu,
The gas is prolific, the C+C not so much for the Utica and Marcellus.
I was digging into more recent EROI work and came across the paper below. Has anyone been into the weeds on this study enough to critique its strengths and weaknesses?
Their observations about low ‘useful stage’ EROI for fossil fuels due to inefficient conversion to useful energy is nothing new. Their first main point is that wind and solar are as good as or better than fossil fuels in many cases. Most pertinent to this site would be the comparison for road propulsion. This does seem to reflect the facts and global trends, and I’m thinking about the Ember annual report Hickory linked recently and the experience of Australia solar+battery smoothing PM price peaks. Obviously a huge benefit if this proves to be the case and we can wean ourselves from the terrible Faustian bargain we’ve made with FF. Climate change, other pollution, war, government corruption, etc.
However, the data that caught my eye as most unexpected was that their analysis of variation in EROI for FF since 1970. While gas drops like a rock, oil is closer to flat. The authors acknowledge that this contradicts the current narrative.
Are they right?
“Estimation of useful-stage energy returns on investment for fossil fuels and implications for renewable energy systems”
https://www.nature.com/articles/s41560-024-01518-6
If shale is 11.1 million and GOM/GOA is 1.9 million, that means onshore conventional is only 600k? That can’t be correct.
Shallow sand,
Average tight oil in US was 9293 kb/d in 2025, Total US C+C was 13586 kb/d and Federal offshore was about 1910 kb/d in 2025. Conventional C+C was roughly 2383 kb/d for 2025 annual average for the US.
US tight oil trailing 12 month average with Feb 2026 at 9.32 Mb/d (peak to date), up 20 kb/d from Oct 2025 level (9.30 Mb/d). Chart at link below.
tight ttm 2605b
What is lower 48 onshore conventional for 2025? I assume Alaska is considered conventional?
Shallow sand,
Just deduct Alaska’s 2025 annual average from the number I gave. Roughly 421 kb/d less so 1962 kb/d for L48 onshore conventional C+C for 2025 average.
Oil imports to China, the largest importer, have fallen dramatically.
https://www.channelnewsasia.com/commentary/iran-war-china-cuts-oil-imports-energy-prices-6109266
I wonder what is the latest production and export level for Venezuela?
Chevron CEO suggests that the increase from Venezuela alone could help beat down the gas and diesel prices here in the US.
Venezuala crude output was 988 kb/d in March 2026 based on secondary sources, they claim 1095 kb/d in March 2026 about 14 kb/d more than the average they claim for 2025. It is likely they are producing all they can produce as they have not been subject to OPEC quotas for the past 10 years or so.
Another discussion of Chinese oil imports: https://www.vortexa.com/insights/import-loss-stock-build-how-china
Trump spent the entire afternoon yesterday in Florida watching golf on TV. He published the same aerial view of a gold course six times on his blog. Then he published a bunch of AI slop showing himself as a naval hero defeating the Iranians. Then a bunch of AI slop about a wrestling match he’s planning at the White House.
His mind is gone. He changes his positions daily. He is widely ridiculed all around the world.His only real goal is being president for life and building monuments to himself.
Putin is now suggesting that a different marionette, the disgraced former German Chancellor Schroeder, run the negotiations between Russia and Ukraine.
Alimbiquated
I wonder who will do the talking/negotiating when he meets with Xi. Also will he fall asleep when he is not the centre of attention.
Ovi —
Likely some real estate clown with cultish faith in American exceptionalism based on watching Fox News. Trump prefers loyalty to competence.
Ovi, you are insulting my country and the president that is currently in charge of my county when you say stupid shit like this. This Alimbiquated wanker does NOT live in America either, like you, but because he is a coward, and comments on American social media anonymously, is a chicken shit, a probable entitled European that believes America owes it something and is just angry over his plight in life. He is relentless in his criticism of my country because his country needs my country’s help. Tight shale oil exports, for instance. Military assistance, for instance. Billions of USD assistance to NATO, for instance.
You too? Canada too?
You are, I believe, a self-proclaimed Canadian professional engineer.
In America, professional engineers are bound to ethics standards regarding truth, unbiased analysis and engineering principles. In the Society of Petroleum Engineers (SPE), for instance, to which I use to be a proud member, it would never be acceptable to render engineering related analyses, and publish that, even on social media, that were tainted by political bias. That is exactly what you have done. I KNOW this to be true because I have worked with engineers all over the world. They have scruples. They are bound to the code in which they embrace when they became professional engineers. They render opinions, as engineers, without bias. Their profession expects that of them,
You can cut and paste all the dumb EIA data you want; its meaningless unless you have been in the oil and gas business and know what it means. When you cut and paste numbers, then use that opportunity to make political statements against my country, you have NO credibility whatsoever.
Mike, no insult insisted from me.
Yes, I’m from Europe. But you need a president in his prime in these hard times. My parents are so old as the current president. My mother is still an active artist – but can’t take this beating anymore that a president needs to take in a crisis.
A normal conservative candidate, in his 50s or early 60s would be great. Not Trump anymore, and not a democrat like “Sleepy Joe” that was a puppet most the time reading from a tele prompter.
By the way – mixing up Europe is a good thing, the more the press complains here the better. People are fed up with wokeness here, too, and conservative parties are getting stronger each month. I was in the USA the year before the first Trump election, and got this vibe. This is starting here, too.
Getting a good deal in China would not only be best for the USA, but for Europe also. Good luck.
Hey Ovi,
I see others indicate that you may be a licensed professional engineer in Canada? This thread gave me reason to read the ‘Engineers Canada’ code of ethics. I am familiar with the US ASME, ASCE and IEEE codes of conduct, but found the Engineers Canada content and structure to be admirable.
https://engineerscanada.ca/sites/default/files/Yukon/APEY_Code_Of_Ethics.pdf
Actual legal requirements and standards for the practice of professional engineering in the US are controlled by states. Are there any specific province or territory regulations that you would point to in Canada as good examples of similar controls?
I see that SPE has what they call a Code of Conduct for members, but had also not been familiar with that particular document. It is interesting to see how they vary from the other large US engineering societies.
As always, thank you for the hard work and insights that you provide in this forum.
Mike,
You have also criticized Trump and his administration on many occasions, does that mean you have no credibility?
You do not hesitate to criticize other nations, seems to me that other nations can criticize the US as well. This is sometimes called freedom of speech.
Why Are Americans So Bloody Stupid?
0:00 The Superpower Engineered to Fail
3:15 What is Critical Thinking (And Why Does It Matter?)
6:30 A Nation Founded on Anti-Intellectualism
11:00 The School System: From Prussia to No Child Left Behind
22:30 Adulthood: Compelled Loyalty & The Media Machine
34:00 The Cost: Healthcare, Debt, & Epistemic Tribalism
40:15 Why the World Is Done Being Nice
48:30 A Final Note to Our American Viewers
https://www.youtube.com/watch?v=j9MubNsh3rs
Mike
You say: “In the Society of Petroleum Engineers (SPE), for instance, to which I use to be a proud member, it would never be acceptable to render engineering related analyses, and publish that, even on social media, that were tainted by political bias.”
Please show me where in my post the analysis is “tainted by political bias.”
T Hill
It’s interesting that people have gleaned that I am a professional Engineer. I was certified by the Ontario Professional Engineers. Different provinces have slightly different rules. There is a professional group trying to eliminate the cross province differences.
Mike, whatever is going on with you is making for very caustic communication. What the president has done attacking and threatening Iran with annhilation has precipitated the worst oil supply shock in modern history. The closure of the gulf was not necessary nor validates the ginned up rational that Iran presented an existential nuclear threat, This closure has condemned most of the global south with immediate hardship. Your resume and others on this forum has no bearing on that reality. Like a kid who sends a tire down a hill onto a roadway causing mayhem the deed is done. Folks will condemn the kid, vilify his upbringing etc.
In the meantime there’s a lot of carnage down there on the road.
And the kid has gone home to play with Legos
Hi DC, Sheng Wu, Ovi, shallow sand!
Thank you so much for taking the time to respond in detail!
I’ve been gone from peakoil for so long, I went to the bookmarks I still had, and most of them were dead.
Even back in the 2000’s, peak oil was a niche, but at least there was a relatively vibrant community and there was some interest among those in the mainstream oil industry.
Matt Simmons and his Twilight in the Desert come to mind. Do we have anyone like Matt Simmons in the peak oil community currently?
And are there any conspiracy theories about his death? I recall his furious theories regarding the Deepwater Horizon (BP) oil spill right before he passed.
Anyway…..
Ovi,
Re: “the 11.1 Mb/d for tight oil”
Gotta be honest here, I was so shocked by the way US production had spiked and how the growth was pretty much *all shale* freaked me out that I didn’t check the numbers or the source properly. It probably was some random link/chart that the search engine spit out. Apologies!
**Peak oil**
I was really happy to get so many responses here. Thank you all.
Is this currently the most active peak oil related chat site?
Any other places where there is quality discussion going on?
**Hormuz / global scenario**
I imagine most of you feel the same, but every morning:
1. I wake up and check the news
2. Hormuz still closed
3. Oil front month still around $100 WTI/Brent
4. Everyone is acting like things are fine
But from my perspective, things are far from fine:
*Clearly the major geopolitical players are not interested in restoring normal flows through the Hormuz.
*Global supply of oil, fertilizer, naphtha, etc. are way down
*Sooner or later we will have serious issues with energy, food, plastics (=most manufactured products), metals, etc.
This will most certainly lead to a sequence of events that has probably never happened in my lifetime (and I’m getting old).
Sorry to sound doomerish, but I feel like we are watching history unfold, and only a few people are awake to what might be coming.
That said, we can’t change things, but we can still enjoy the sunrise, a nice hike, and other basic pleasures in life.
Cheers to you all,
THC
See Oilystuff.com for great insights from an oil pro with 50+ years experience as an oil producer.
Also the 11.3 Mb/d is roughly the 2025 average output for L48 onshore C+C output for the US, with about 9.2 Mb/d from the shale regions with most of shale region output from tight oil and shale gas wells.
The fertilizer shortage could create serious problems in the short term.
https://www.ifpri.org/blog/the-iran-wars-impacts-on-global-fertilizer-markets-and-food-production/
heavy reliance on fossil fuels and international trade, and persistent inefficiencies in fertilizer use continue to expose global agriculture to significant risks.
You’d hope that higher prices would improve efficiency, but I’m not holding my breath.
DC,
Thank you for the tip re oilystuff.com. I’ll take a look.
9.2Mb/d of shale — good Lord, that is a lot!
I’m looking at some charts presented by Laherrere in Nov. 2025 (I don’t think I can post the jpg here) — he seems to have us right around the peak of LTO at this moment?
What are people here thinking about the timing of peak Permian shale?
THC
This post focuses on the 4 primary counties in the Permian, Lea, Eddy, Martin and Midland and the production charts are posted above. Due to lag in releasing the data, a procedure is used to forecast what the final production will be after being reported for one year. Bad reporting for one month affects the results.
There is one chart that sums the output from those four counties. I think that chart, which is a bit optimistic this month and the District 8 chart are signalling that the Permian is near its peak. A few more months of data are required before making a more definitive statement.
Permian production will not be falling off a cliff as long as drilling and completions continue. I don’t agree with Laherrere’s comment below.
THC,
I agree with Ovi on the peak, but Laherrere’s forecast may be roughly correct, note that his horizontal scale is very long (1950 to 2100). Here is my Permian scenario for 2005 to 2100, not very different from that of Laherrere. Also note that my scenario for US tight oil has a similar URR to Laherrere’s best guess of 70 Gb. See chart below for my Permian scenario using Laherrere’s time scale on horizontal axis, I use kb/d on vertical axis vs Gb/year on Laherrere’s chart. 1 Gb/a=2738 kb/d.
permian 2605
US tight oil scenario with URR=71 Gb, vertical scale in Gb/ year and horizontal scale similar to that used by Laherrere. in chart below.
Tight oil output will be falling fast as the number of quality locations is limited so the completion rate is likely to fall quickly after 2030. Mr Shellman documents this very well at https://www.oilystuff.com/groups
us tight 2605
I prefer to use a shorter time scale for tight oil as in the chart below from 2000 to 2050, after 2050 tight oil output from the US will be very low.
tight 2605b
Dennis,
If you look back at Laherrere’s forecasts on TOD, you’ll see that they were quite low – at the time of the forecast things were peaking and starting a steep decline.
2013
theoildrum.com/node/10009
Figures 10-12
Nick G,
Mr. Laherrrere’s recent forecasts have been better. In 2013, many (including me) did not expect tight oil output would rise to the levels we see today. The EIA’s AEO 2013 published in May 2013 had US tight oil output at 2630 kbd in 2026. One needs to keep the historical context in mind.
Laherrere has also had some optimistic forecasts as at link below
https://aspofrance.org/2022/08/11/how-much-oil-remain-to-produce-laherrere-et-al-16-juillet-2022/
A revised forecast (World C+C URR=2800 Gb) is on page 7 (first chart) of link below
https://aspofrance.org/2024/04/30/graphs-jhl-2024-jean-laherrere-28-avril-2024/
See link below for AEO 2013 tight oil forecast
chart(125)
Dennis,
Both the 2022 and 2024 charts seem to be the same thing: peak is always right now (that is, the date of the forecast), followed by fairly high rates of decline.
I took a look at Laherrere’s basic view of oil, and was disappointed to find it was very traditional – assuming that oil was the basis of the economy and couldn’t be replaced. Difficult alternatives to familiar oil are included, such as CTL, and yet renewables and EVs are somehow not transportation fuels.
Sigh.
“Expanding EV adoption continues to reduce oil demand, with oil displacement growing by 30% to over 1.3 mb/d in 2024 – equivalent to Japan’s entire transport sector oil demand today. By the end of the decade, EVs are set to displace over 5 mb/d of diesel and gasoline in the STEPS, and China’s EVs to account for half of displaced oil.
Electric LDVs drive most of the oil displacement, accounting for 80% today and around 77% by 2030. The relative impact of LDVs becomes smaller over time as technology developments and the expansion of charging infrastructure drive electrification in the heavy-duty segment, with electric trucks and buses together displacing nearly 1 mb/d in the STEPS by 2030.”
STEPS is a fairly conservative IEA scenario, assuming partial implementation of announced government policies.
https://www.iea.org/reports/global-ev-outlook-2025/outlook-for-energy-demand
Nick,
Note that the scale of the horizontal axis makes the decline look faster than it is, his recent forecast looks reasonable, it may be that more EVs will help, but difficult to ramp up very quickly.
Current crisis has oil output down by 12 Mb/d, close to 15%.
Permian scenario with different horizontal scale, URR=37 Gb. Cumulative output through April 2026 for Permian tight oil is about 16.6 Gb and for the scenario cumulative output reaches 18.5 Gb in March 2027 (50% of URR).
permian 2605b
Jean Laherrere presentation draft, 2st December 2025
https://lyis.ca/pfet/jean/USdec2025.pdf
From the conclusion:
“Thanks to hydraulic fracking, since 2008 oil and NG production are bursting but, after
peaking now, their decline will be as sharp as their increase.”
DC, Nick, Ovi,
Thank you *so much* for sharing information in spite of my being way behind the curve in terms of recent peak oil research.
**What if**
Is it possible The Hormuz closing has brought on The Big and Final Peak?
It is impossible to know exactly what sort of damage has been done to energy production, storage, and transportation infrastructure in the Middle East, but it is probably significant.
Wells are likely being capped as well, I assume.
*Even if Hormuz is “open”(ed), ship transit volumes may not return to previous levels for years, if ever.
*Capped wells may take time to return to production and production levels may not reach previous levels.
*Shale depletion rates will eventually catch up even in Texas/NM.
*Other shale areas (Argentina?) would require investments and infrastructure that seem unlikely given the political instability.
Any thoughts?
Could we have already reached and passed the monthly global peak oil production level?
THC,
The 12 month average is the number I focus on, we may be close to peak, if the Strait of Hormuz reopens we may see a new peak average annual output, maybe in 2028-2030. Note that the future is uncertain, currently the World annual peak in C+C is 2025 at 84.41 Mb/d, perhaps we see 85 Mb/d by 2028, my guess is a plateau at about 84.6 Mb/d from 2025 to 2030, followed by decline.
Art Berman is talking to Nate Hagens. https://www.youtube.com/watch?v=Gk6xm5IuY4w&t=63s
Also, after Maduro was kidnapped, the oil industry executives said that Venezuela was noninvestible. Now US is importing more Venezuelan oil than it has over the last seven years. That was a news item I saw a couple of days ago.
EIA data on Venezuela crude oil imports to US
https://www.eia.gov/dnav/pet/hist/LeafHandler.ashx?n=pet&s=mcrntusve2&f=a
weekly data shows high growth since February, not clear how reliable the weekly data is, I prefer the monthly data which is corrected over time.
https://www.eia.gov/dnav/pet/hist/LeafHandler.ashx?n=pet&s=w_epc0_im0_nus-nve_mbbld&f=w
The next link has 4 week average which may be more accurate
https://www.eia.gov/dnav/pet/hist/LeafHandler.ashx?n=pet&s=w_epc0_im0_nus-nve_mbbld&f=4
also see chart linked below
chart(127)
Yes, I noticed that one yesterday and listened to the entire interview. Great stuff.
I sometimes have trouble understanding Art’s tweets, but he usually expresses himself well in long-form interviews and articles.!!
Sadly, both Art and Nate are fossil fuel advocates. They hide that with a lot of words, but at the end of the day they’re defending FF one way or annother. They may argue that fossil fuels are essential, and without them civilization will collapse (it won’t), or they may argue that it’s a mistake to blame FF for climate change (it’s true – FF is only responsible for 80% of climate change!) but at the end of the day they’re defending and justifying FF.
IOW, drill, baby, drill.
——————————————
I tend to not watch videos, but I read some of the comments, and was struck by this one:
“What Americans need to understand is that while their economy is relatively untouched now, folks here in Japan are pinning 99% of the blame on the US. This has huge knock-on effects because emotions drive decisions. Decisions like “Should I spend $50,000 to send my kid to an American university? Should I buy American or Australian beef?” These individual decisions add up, to say nothing of the state-level decisions. The US floated for a long time on the victory of WWII, our massive support for developing countries, and our pop culture, but those days are over. It took generations to build the trust and respect that the world had for the US, and like the east wing of the White House, Trump took a bulldozer to it.”
———————————
The above reminds me – If you watch old television (aka pre-2024) you’ll notice a broad assumption of great competence and good intentions on the part of US agencies: if the CDC or FEMA or the FBI is called in, the people who arrive are sharp and trustworthy.
Sadly, that’s over.
I said 3 months ago that the Venezuela heavy is different to Canadian heavy oil sand, much easier to produce and improve to transport.
also, it has more value in terms of composition, similar heavy crude in CHina sells close to regular crude or even at a slight premium
https://www.linkedin.com/pulse/orinoco-oil-rare-earth-crude-sheng-wu-eta1c/
An update to World Oil Production has been posted.
https://peakoilbarrel.com/january-world-oil-production-drops/