The EIA’s Short Term Energy Outlook (STEO) was published in early May. The report that follows compares World Petroleum Liquids output from the STEO with estimates from OPEC’s Monthly Oil Market Report (MOMR) from May and the IEA’s Oil Market Report (OMR) from February 2023 with an update on World liquids output based on the summary of the May report with my estimate on quarterly output in 2023 based on the annual estimate for 2023 published in May 2023 and the quarterly numbers published in February 2023.
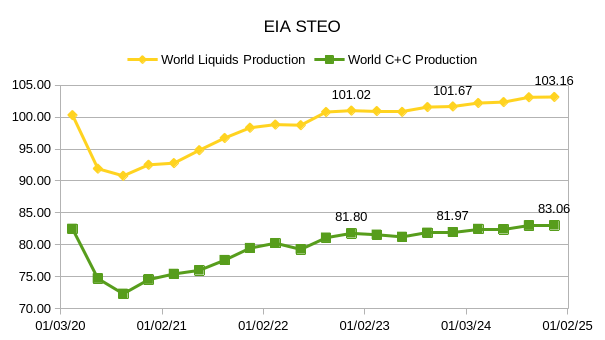
In the chart above, I modified the EIA Liquids estimate from 2023Q2 to 2023Q4 by assuming that the OPEC crude output matches the call on OPEC for those months. This assumption reduces the 2024 annual output for World C+C to about 82.74 Mb/d from the STEO estimate of 82.94 Mb/d.
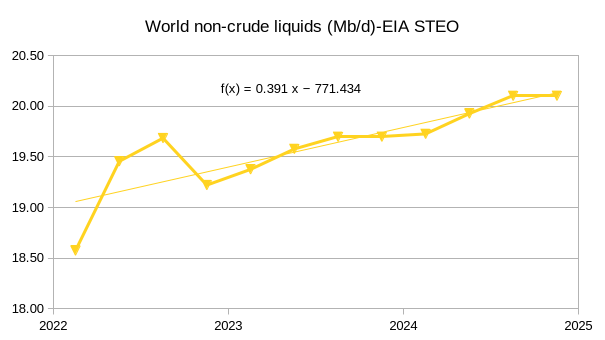
The chart above shows the increase in the gap between World liquids and World C+C from 2022 to 2024, which I call non-crude liquids (mostly NGL, but also biofuels such as ethanol and biodiesel, and refinery gains). The rate of increase based on OLS on the data in the chart is 391 kb/d per year. Much of this increase is probably from the US which has increasing Natural Gas and NGL output.
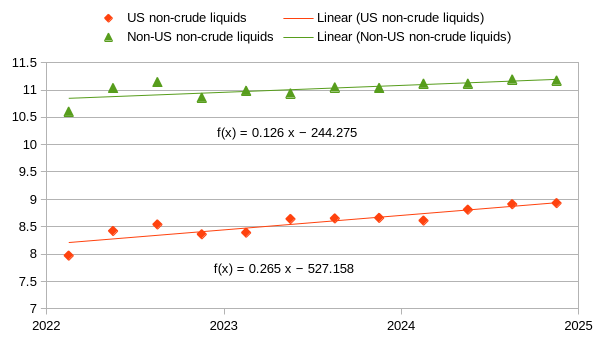
The chart above confirms that about 68% of the increase in World non-crude liquids comes from the US based on the EIA estimates in the STEO.
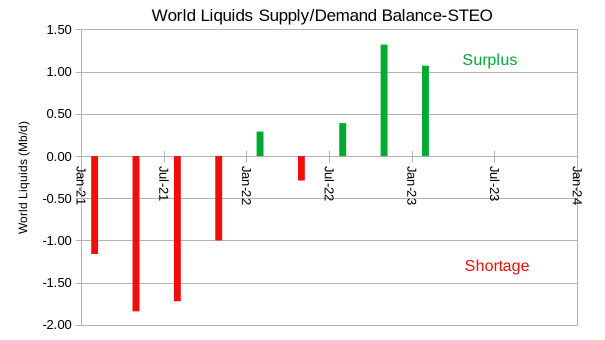
Figure 4 above shows the balance of supply and demand for World Liquids through 2023Q1, beyond this I have assumed OPEC acts as a swing producer and trys to balance supply and demand on World markets. Thus there is no surplus or shortage on the World market after 2023Q1, if OPEC chooses the EIA Non-OPEC supply and World demand estimates as the basis for its output.
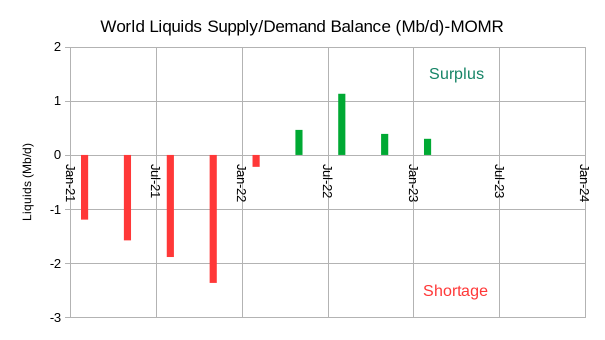
Ther chart above considers the World Liquids supply and demand balance based on OPEC’s estimates for World supply and demand. As before we assume OPEC chooses to meet the call on OPEC so that after 2023Q1 there is no surplus or shortage. I do not show a similar chart for the IEA OMR because the data is 3 months old, I cannot construct this type of chart for May because I cannot access the full May Oil Market Repert from the IEA.
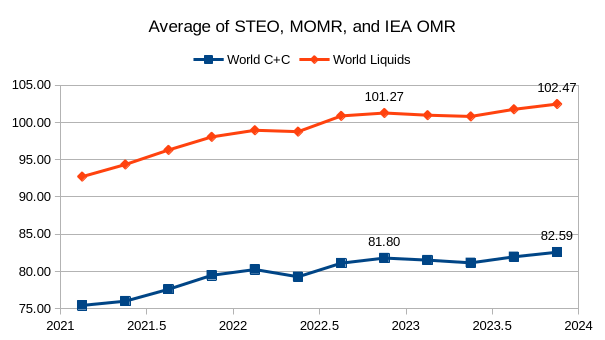
The chart above takes the average of the EIA STEO, OPEC MOMR, and my estimate for the IEA OMR for May for World liquids. It uses a similar methodology as was used for the STEO to construct an estimate of World C+C based on the EIA’s International Energy data for World C+C and the ratio of World minus US C+C to liquids ratio for 2022. When comparing with figure 1 note that the horizontal scales are different and that the 82.59 Mb/d for 2024Q4 in figure 6 should be compared with the 81.97 Mb/d estimate for the same quarter in Figure 1. In short, the EIA estimate is the most conservative of the three agencies for their 2023 estimate for World C+C (for 2023 annual output EIA is 81.67 Mb/d vs 81.81 for the 3 agency average).
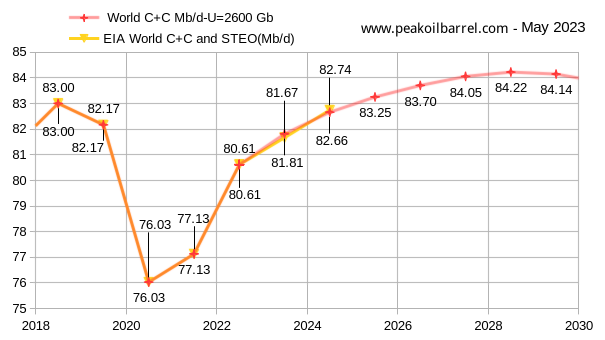
The chart above uses Paul Pukite’s Oil Shock Model to estimate future output with the assumption that a transition to electric transport reduces oil demand to less than supply by 2035 (+/- 2 years). The data above the line is EIA data up to 2022 and 2023 and 2024 are the STEO estimates, the data below the line is the model output. The 2018 peak is exceeded in 2025 for my best guess model (100% probability this will be wrong) and the peak is in 2028 at 84.2 Mb/d.
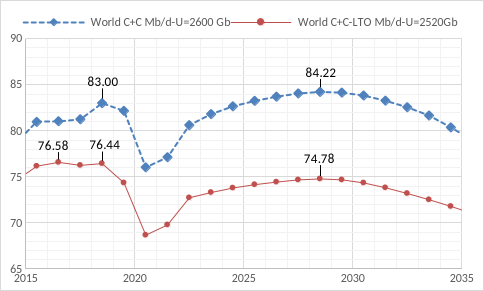
The chart above shows the amount of difference tight oil has made to the World Oil Market, World C+C less tight oil peaked in 2016, a new peak is only reached in 2028 due to increased tight oil output from 2018 to 2028. This is the reason I focus on tight oil.
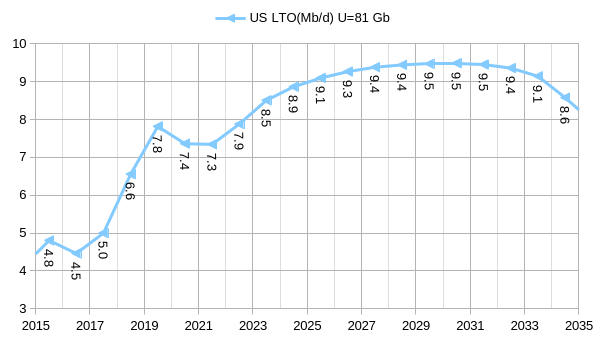
The chart in figure 9 shows the tight oil model used in my Oil Shock Model in figure 7. Output peaks in 2029 and is roughly on plateau from 2027 to 2032. The data shown on the chart is average annual output in millions of barrels per day. Note that at the peak in 2018 tight oil output was only 6.6 Mb/d. I will cover future tight oil output in greater detail below.
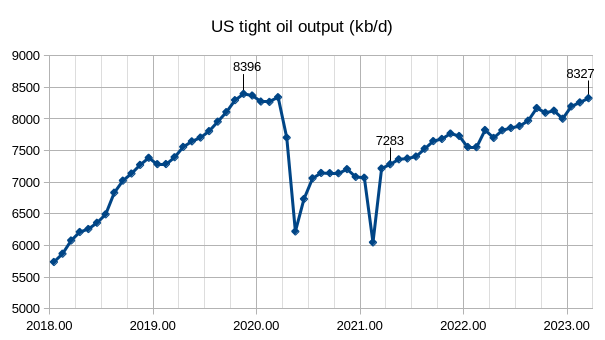
Figure 10 gives an overview of US tight oil output based on EIA Official estimates. The peak was November 2019 at 8396 kb/d. In March 2023 output had reached 8327 kb/d some 69 kb/d below the peak. In April 2021 output was 7283 kb/d so the simple straight line increase over two years was 1044 kb/d or 522 kb/d per year. Note the difference in the slope of the line from Jan 2018 to Dec 2019 vs. April 2021 to March 2023, roughly a 2.5 times steeper slope in the earlier 2018-2019 period.
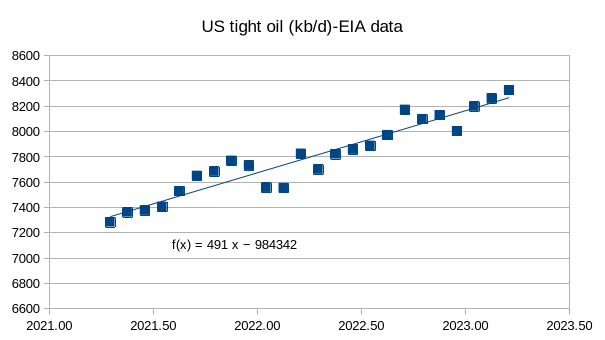
The actual annual rate of increase is better measured using an OLS trend and in figure 11 we see that this is about 491 kb/d per year over the April 2021 to March 2023 period for US tight oil.
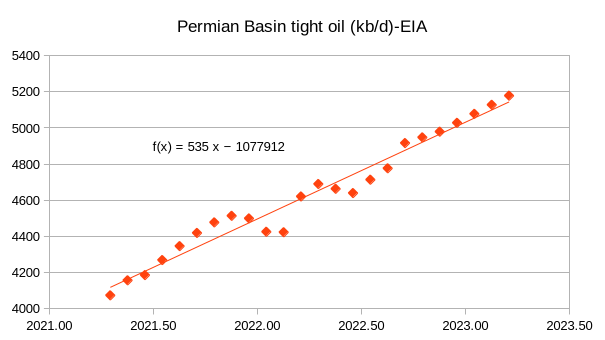
For the Permian basin the annual rate of increase was 535 kb/d per year from April 2021 to March 2023.
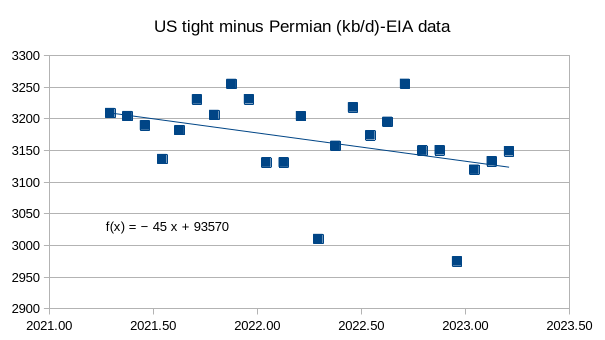
For US tight oil minus Permian tight oil the rate of decrease in annual output was 45 kb/d per year.
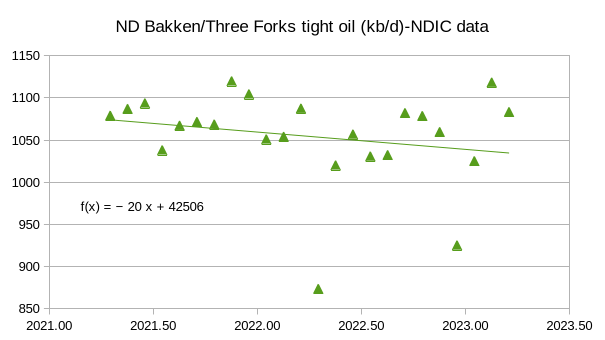
For the North Dakota Bakken I use NDIC (North Dakota Industrial Commission) data in figure 14. Average annual output decreased by 20 kb/d per year over the past 2 years.
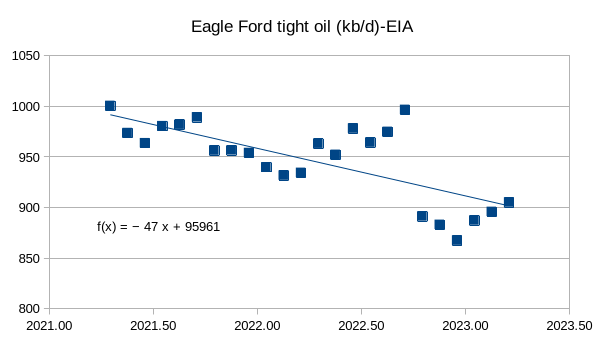
The chart above looks like there may be a problem with the most recent 6 months of data, there have been a number of revisions lately to EIA data and this looks suspicious to me. In any case, the trend is a decrease of 47 kb/d per year over the past 2 years.
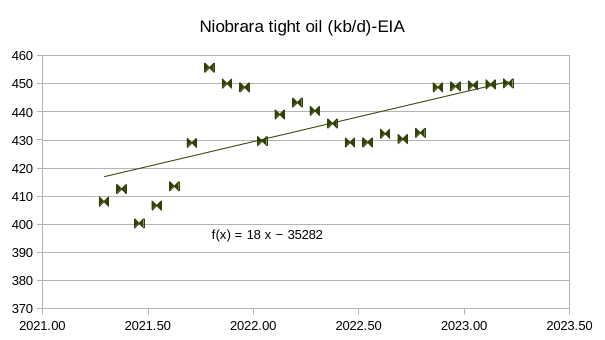
The data for the most recent 5 months for the Niobrara also looks anomolous, but the trend is an increase of 18 kb/d over the past 24 months.
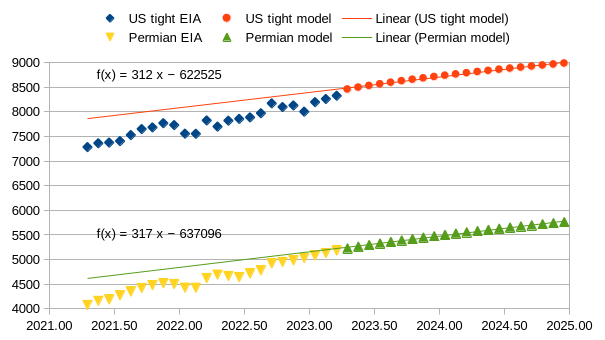
The chart above shows projected output for a scenario where the completion rate for US tight oil wells remains constant at the March 2023 level until December 2024. US tight oil increases at an annual rate of 312 kb/d from April 2023 to December 2024 and Permian output increases at an annual rate of 317 kb/d over the same period.
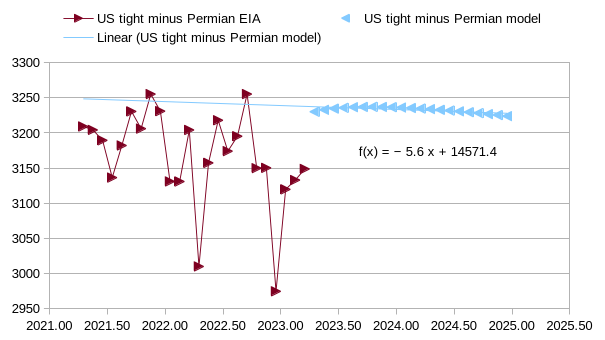
The chart above shows the decrease in non-Permian US tight oil output for my best guess models, my expectation is that the recent 3 months of data will be revised higher in the future, potentially the model is about 50 kb/d too high. Annual output decreases at about 6 kb/d per year over the April 2023 to Dec 2024 period.
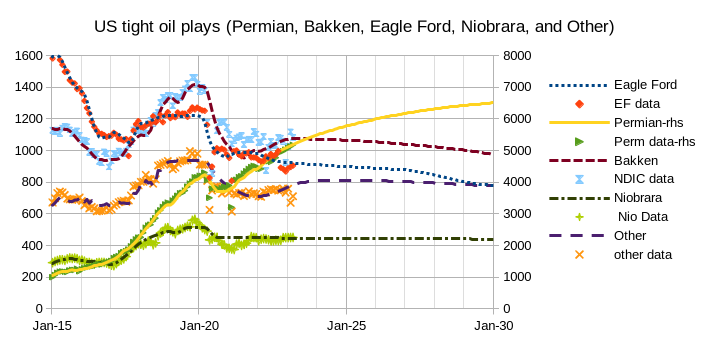
Note that the scenarios above assume no increase in the completion rate after March 2023, it remains constant from April 2023 to December 2029. The Permian model and data should be read on the right hand vertical axis, all other plays are read from the left hand vertical axis. Permian scenario URR is 51.7 Gb, Bakken URR is 9.2 Gb, Eagle Ford URR is 8.5 Gb, Niobrara URR is 3.5 Gb, and Other tight oil URR is 7.6 Gb.
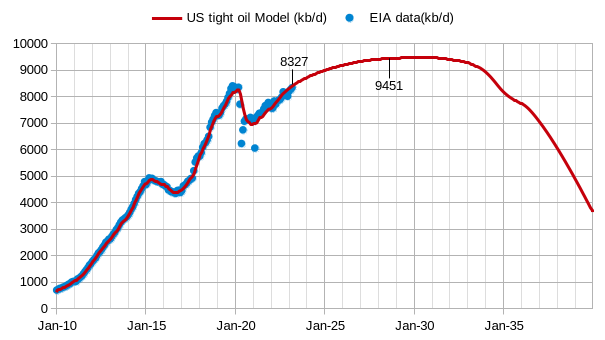
The chart above simply is the sum of the scenarios presented in Figure 18. I extend the chart out to 2039 just to show that I do expect output to decline fairly quickly falling by half in 5.33 years from 9000 kb/d in Jan 2034 to 4500 kb/d in April 2039. The URR of the tight oil scenario is about 81 Gb. The average annual rate of increase from March 2023 to July 2028 is about 2.4% per year for this scenario.
169 responses to “EIA Short Term Energy Outlook, Tight Oil Report, and IEA Oil Market Outlook, May 2023”
US Rig and Frac Update
Rigs and Fracs dropped again but the drop has slowed from the previous few weeks.
Hz oil rigs are down 56 from the November high of 572, to 516. Alaska dropped 2 and Louisiana dropped 4.
Permian rigs have been increasing since September 2022, but the trend reversed at the end of April when they peaked at 345. For the week ending May 26, Permian rigs are unchanged at 335. Texas was up 1 to 297 and are at the same number as a year ago.
Hz NG rigs have been added to this chart. A small drop of 2 rigs occurred in the week ending May 26. The drop occurred in Louisiana.
Dennis
Great Job. Too much new stuff to comment. I appreciate your models compared to the other experts.
How would World Liquids minus US look. Would it be flat?
Thanks Ovi.
Ovi,
Not exactly clear what you are asking for, but over the 2022Q1 to 2024Q4 period, the World minus US liquids output would have an average annual increase of 817 kb/d. Not all that flat.
Dennis
In Figure 2, World liquids are growing at 391 kb/d/yr. I now realize figure 3 has the info I was looking for. US non-crude liquids are growing faster than World non-crude liquids.
Ovi,
Figure 2 is non-crude liquids, I am shortening crude plus condensate to crude in title it is actually total liquids minus C plus C in figure 2. Sorry for not being clear.
Frac spreads dropped by 2 to 260 in the week ending May 26. For the previous two weeks frac spreads dropped by 10.
Dennis
Not sure how it happened, but my comments on your post were supposed to be first but somehow my chart ended up first.
The EIA Monthly Energy Review has March 2023 C+C production down 257,000 bp/d. The EIA STEO has March 2023 production up by 110,000 bp/d. That’s a difference of 367,000 barrels per day. We will get the official numbers Wednesday in the EIA Petroleum Supply Monthly. However, even those numbers will be subject to revision, but not nearly as much as the STEO or the Monthly Energy Review.
The Moral of this story is that the EIA hasn’t a clue as to what oil production was in March or will be any month thereafter.
Ron the MER estimates for the most recent few months is usually not very good. The STEO is also not great.
Well, I will plot them again Wednesday along with the data from the EIA’s Petroleum Supply Monthly. Then we will know who was closest.
I am guessing production will be down for March. I think the Monthly Energy Review data are too low, but their numbers will be closer to what the Petroleum Supply Monthly shows for March than the STEO. Then again, that’s just my wild-ass guess.
Ron
What is your guess for how much output will be down in March? Tight oil output was 66 kbpd higher in March based on the most recent tight oil estimate.
My guess is 12,400 kb/d, as I posted below. If I am way off, then that will be that. I have been wrong before.
Old Chemist
in the previous post you asked: “For the 70% of the tar sands that are not economically viable for the mining approach due to overburden, SAGD is utilized, is this component of oil sands production lumped in with the bitumen guys, or is it lumped in with traditional oil production?”
Attached is a chart that shows the two components of bitumen production. As you see, in-situ is more stable and lately a bit higher than mined. Mined bitumen is more subject to cold weather conditions than in-situ.
Ovi
Thanks. For the mining portion, I agree incremental production in the future will be minimal, for SAGD, if the price is right, significant increases are possible.
In Figure 1 there is a slight decline for 2023, after that you have again an increase, usually STEO graphs keep trends from the past, if the trend of the past in this case is slight decline, where IS STEO deriving the 2024-2025 increase from?
Svaya,
Probably expected increases from OPEC, recent decline is due to oversupply leading to OPEC cuts it is expected that these will be reversed around 2023Q4.
where IS STEO deriving the 2024-2025 increase from?
Svaya, check out my post above comparing the EIA’s STEO with the EIA Monthly Energy Review’s expected March 2023 oil production. There is a 364,000 barrel-per-day difference in their predictions. They are just guessing. Their guess is no better than mine or Dennis’s guess.
Well, perhaps just a tad better than Dennis’s guess. 🤣
Ron
Your guess is…?
My guess is that US output will be up by 50 kbpd from what was reported for Feb in the last PSM at the end of April. The STEO is likely to be closer to the May PSM estimate for March 2023 than the MER IMHO.
My guess is 12,400 kb/d for March. If you are guessing production will be up 50 kb/d then your guess is 12,533. We will see who is closest Wednesday.
Ok thanks, we will both be wrong, but one of us may be closer which means nothing, no idea what happens in GOM and the tight oi estimate will likely be revised. Our guesses are only 130 kbpd apart.
Dennis/Ron
I will place my bet with the STEO. I have checked a few times and they are not off by much.
March: 12,589 kb/d
Ovi,
I agree the STEO is usually pretty good one month out so your guess may be best, we will know in a few days.
Ovi,
The April STEO had Feb 2023 at 12554 kb/d vs PSM at and of April at 12483, so about 71 kb/d too high. Only one month though. For Jan 2023 the March STEO was 12241 kb/d vs PSM at 12536 kb/d, so too low in that case by almost 300 kb/d. Always difficult to predict the future.
I think the STEO, for its longer-term outlook, estimates demand, then assumes the supply will simply meet demand. After all, they assume supply will always meet demand.
Ron
I think that is what they do for the World, not sure what they use for individual nations as the oil market is a World market and how much supply comes from which nations is tricky.
Dennis, I really don’t think it is all that difficult for them. Their long-term predictions for each producing nation are not all that accurate. They have absolutely no idea what Kazakhstan will be producing in two years, or any other nation for that matter. They make sure it is not too different from what they are producing today, just a little higher if they have been flat or increasing production. And if a nation is in decline, they make them decline a little, but not too much.
I seriously doubt that they are analyzing each nation’s ability as to what they can actually be producing in two years.
Note to all.
March 2023 US output was 12696 kb/d according to the most recent EIA estimate. Ovi had the best guess at 12589 kb/d. The MER estimate was 470,000 barrels too low at 12226 kb/d. The MER estimates for the most recent two months are best ignored.
@RON PATTERSON
Wild guess or educated guess? Isn’t this wild guess dangerous? As Mike S keeps saying, I mean STEO might serve as input for managing the SPR and other policies.
My wild-ass guess could not possibly be dangerous because no one except a few people on this list pays any attention to it. As far as the government using the STEO for managing the SPR or anything else, then I don’t think there is anything dangerous with that because the STEO never does anything really wild. They always just stick with the going trend, or pretty close to it.
IMHO sticking to the trend is tantamount to a wild guess. I mean EIA should do better than STEO I find better analysis here in the comments of this blog. I rather have an educated guess.
Svaya,
You are wrong that the STEO just extends past trends. Much of it is based on economic forecasts and fairly sopisticated microeconic analysis.
Ovi is correct that they do a fairly good job. Prediction of the future is not an easy task.
Hi Ron,
See figure 7 in the Post and note that for 2024, my guess is lower than the STEO.
The 2023 guess is based on the average of the OPEC, IEA, and STEO estimates for 2023. Obviously those could be wrong, but taking the average guesses of 3 major organizations is likely to get us pretty close in my opinion.
It may be that my 2024 estimate is too low, that has happened before and may happen again, all the while many here will claim that my estimates are too optimistic.
We will see.
EROEI . An article by Art Berman .
https://www.artberman.com/2023/05/27/does-renewable-energy-have-a-higher-eroi-than-fossil-fuels/
It doesn’t matter. If your energy supply starts to dwindle, you have to switch to something else. If that something else has a lower EROI, then you have to find something that has a higher EROI.
Personally, I think we will have that in the form of Perovskite cells. When? I don’t know. I’m hoping before Peak Oil and Gas take a bite out of our civilization. It seems like we are getting close to both and I hope the cells arrive first. The alternative is to shrink like the Romans did in the 3rd to 5th centuries.
I’d hate to see broken down pickups piled high with firewood and smokey chokey winters. Lived through that in the early 80’s and that sucked.
The perils of EROEI . Nate Hagens .
https://www.youtube.com/watch?v=XTxPZdeKZgM
Thanks H in H, Hagens makes an excellent summary and thanks to Dennis for another informative post.
Shouldn’t STEO have worst and best scenarios?
What if the future production will be like this, what would be the consequences:
Svaya, such a sudden and dramatic change in all the US tight oil wells happening, and all at the same time, is something that is just not going to happen. Why would every tight oil well in the US suddenly have the same problem, all at the same time? And, at the same time, we suddenly find that all new wells are dry holes? Let’s not get ridiculous.
Worst case is worst case, and there is a similar curve like this in the recent past in the same graph:
That drop was not due to natural decline or any catastrophic natural event. That is unless you count Covid 19 as a natural catastrophic event. What happened was that there was a sudden drop in demand. This caused a deliberate cut in production. That is, the oil producers did this on purpose! What you are proposing cannot happen unless drillers decide to do it purposefully. That is not likely to happen unless most of the world’s population is suddenly killed off.
And yet it happened
Of course, it happened. That point is not in dispute. The point is they cut production because the pandemic cut consumption. Really, what is so hard to understand about that?
Svaya,
If thefe is anew pandemic or WW3 your scenario would be reasonable.
I would put the odds at 1 in 10000 or less that it is likely.
Note that my scenario is not based on the STEO. It is simply a guess based on a constant tight oil completion rate from April 2023 to Jan 2032 with a falling completion rate after that date.
Odds of my scenario being correct are roughly zero. The math is simple. Number of possible future scenarios is infinite, the probability of any single scenario being correct is one divided by infinity or zero.
It is simply a guess based on a constant tight oil completion rate from April 2023 to Jan 2032 with a falling completion rate after that date.
Dennis, I did not realize you expect completion rates to remain steady until 2032. The chances of that happening are near zero. I think the falling frac spread count says the completion rates are very likely to start falling around May 2023. That’s like the day before yesterday. 🤣
Ron, perhaps completion rates will fall, but they don’t always match well with frac spread counts or rig counts especially over the short term. Long term, the scenario is likely conservative unless oil prices remain at $75/bo or less long term, I doubt oil prices will be that low for much longer.
Svaya,
What happened is that tight oil output fell for a couple of months sharply from 8343 to 6221 kb/d over a 2 month period (March to May 2020), then ouput rebounded strongly rising to 7361 12 months later and to 8327 kbopd 36 months later, a rise of 1000 kb/d per year over 3 years. Those are the facts of the case.
Permian Basin Tight Oil Scenario below has no wells completed after Sept 2022. This is not remotely realistic, but shows how unrealistic the scenario you presented is.
Dennis, I am no economist, but I think the reason oil prices are so low right now is that we have a creeping world recession in our midst. If it gets better, then oil prices will rise, and perhaps completions and production will perk up. But I believe the recession will slowly get worse.
I hope not, but that’s the way I see the economic winds blowing right now.
@dennis Of course my scenario “might” be unrealistic. But with scenarios there is no other way to see before hand what is unrealistic or not, other than wait and see strategy.
Svaya,
There are different degrees of unrealistic, your scenario has roughly a .0001% or lower probability of being correct whereas my scenario from the post (URR=81 Gb) through 2030 has about a 50/50 chance of being either too high or too low. It is possible the tail of my scenario after 2030 is too high, potentially URR might be 60 to 70 Gb, if oil prices drop after 2030 due to a fast transition to electric land transport. I have assumed oil prices drop below $80/bo in 2023$ after 2035, that assumption is based on a “realistic ” transition to EVs.
Ron,
You said earlier:
Dennis, I did not realize you expect completion rates to remain steady until 2032. The chances of that happening are near zero. I think the falling frac spread count says the completion rates are very likely to start falling around May 2023.
Note that for my scenario I used the April DUC spreadsheet that estimated 464 completions in March 2023, this has recently been updated to 510 completions in April 2023 with an average completion rate of 508 wells per month from Jan 2023 to April 2023 in Permian basin and 1081.5 completions over those 4 months for all DPR regions.
The scenario in the post has 954 wells completed per month for all basins so it is relatively conservative compared to EIA estimates for completion rates. Even if completion rates fall a bit due to lower completion rates they will need to fall by about 6% from recent EIA estimates just to arrive at the level of my scenario.
With recent frack spread count dropping around 10% we may see the completion rate drop.
Ron , sudden and dramatic. It happens . Here is Ben Bernanke in 2005 saying housing has never crashed and then in 2008 it did . Sudden and dramatic leading yo GFC 2008 .
https://www.youtube.com/watch?v=cBrV1MszSjI
I never said nothing could suddenly happen. I said total oil fields could not suddenly turn straight down. All new wells could not suddenly be dry holes. If oil production started dropping straight down, then it would have to be deliberate action like in 2020.
Of course, financial markets could collapse overnight.
If the producers no longer make money on it is the drop voluntary or not?
The drop in consumption was not voluntary on the part of the producers. The drop in production was voluntary on the part of the producers.
Look, it’s not that hard to understand. There is a difference between deliberately shutting a well down by turning off the tap and a well slowly depleting and finally running dry.
Are we still looking to signs that the world is already in a recession ? here is a marker .
https://www.livemint.com/economy/world-bank-report-highlights-declining-globalization-due-to-russia-ukraine-war-covid-pandemic-and-us-china-trade-tensions-indian-exports-under-stress-11685291947934.html
Ron/Dennis
Here is another perspective on March output. The MER just uses the weekly data to project March and April. I have just run the weekly numbers for March and April and they give essentially the same numbers as the MER, March 12,223 vs 12,226 and April 12,277 vs 12,277.
Attached is a chart that shows the weekly and monthly US oil production numbers. Over the last few months, the weekly numbers are running roughly 250 kb/d lower than the official monthly EIA numbers. Using 12,250 for the weekly average for February and March and adding 250 kb/d gives an estimate of 12,500 kb/d for March, green marker.
The STEO estimate is 12,589. So that gives two estimates above 12,500 kb/d.
A good guess for March would be 12,550 kb/d.
Thanks Ovi,
Nice analysis. Keeo in mind that the EIA has tight oil up by 66 kb/d in March 2023 from the Feb 2023 level. So if tight oil is not revised lower in May the 12500 kb/d estimate for March would assume non-tight US C plus C declined by 39 kbopd, certainly possible, but I think it will be closer to the STEO estimate as you suggested previously.
Ovi,
I mis read your comment, the 12550 kbpd estimate sounds very reasonable.
So it is BAU as was expected regarding the debt ceiling battle .
Hole in head,
Still a long way until legislation is passed in 2 chambers of Congress, I hope things are solved, but US politics are a mess these days, Compromise is considered a four letter word these days in US politics.
I was looking at the trend for World output of C plus C from 2023Q1 to 2024Q4 and it is an annual rate of roughly 1000 kb/d based on average of IEA, OPEC and EIA estimates for 2023 and the EIA STEO for 2024, for US C plus C output for 2023Q1 to 2024Q4 based on STEO estimate the annual rate of increase is only 162 kbopd (only 16% of the World increase).
Interesting IMO.
Contrary to what is being promulgated in many quarters, the economics of tight oil and gas are very borderline right now. Some of this has to do with falling EURs of tight oil, but a part is also due to the well-hashed-out increase in the GOR and a high WOR in the prolific Delaware Sub-Basin. Tight oil is a treadmill. Step off momentarily and things rapidly go to hell.
Since oil and gas are commodities subject to inelastic behavior, prices are volatile. I agree with Mr. Patterson that a recession is likely coming, but there is going to be, at some point, a collision of the economic reality of producing new oil with the price of oil and gas. Put plainly, some of those Delaware wells with high GORs and also excessive water cuts are one step from breakeven.
The poster known as SVAYA over-dramatized his decline curve, but his concept is not crazy. As you all know, these tight oil wells are subject to parabolic decline. If you miss a good price for oil and gas during an eighteen-month IP, you’ve in effect lost your profit margin. It is a travesty at this point to keep the pedal to the metal, drilling with no coherent plan, willing to sacrifice a good well to the whims of short-sellers in the longest run-up to a recession in world history. If the recession is deep, and also broad, and oil falls to $40-50 and gas to zero, much of the new well part of this business is suddenly upside down. Today there was a story about NG prices in Europe possibly going to zero soon. If this happens, you’re going to see a dramatic pause in drilling the few remaining Tier-1 sites at the same time that hundreds of thousands of tight oil wells enter their third through tenth year of life. A lot of these old wells are producing less than 35 bopd.
I submit to you that we’re teetering on the edge. And a severe global recession could push us over that edge. Tight oil production is not too different from an aging population hit by a pandemic in which the birth rate declines right along with the survival rate of the elderly. I’m not trying to be the harbinger of doom, but the demographics of the tight oil basins are not as strong as they might appear.
And they can’t be modeled. It would require a supercomputer on steroids to handle the scenario of a catastrophic pause in new Delaware production, along with the decline of several aging basins. I know that there are still a lot of nonbelievers, but billions of gallons of wastewater are being transported from NM to Texas for reinjection into over-pressurized reservoirs. We’re about a Richter-6 away from one hell of a slowdown. Were that to happen, it would get ugly fast in world oil markets.
So what’s the answer? Well, as a country in which 50% of all oil and gas production comes from hydrocarbons stored in the rock, we’ve got to face a harsh reality very soon. By we, I’m talking about our president, our Congress, the American people. The tight oil business owes it to the American people–indeed, to the world–to level with them about what’s happening. The posters above are right, in my opinion: A nightmare scenario could happen very, very quickly.
Great comment, my graph is an over-dramatization, but worst case and best case scenarios, should create exactly that: an interval where discussion is possible. Living in Lalaland, where tight oil stays around 9MB/d for more than a decade is not where I can envision this, I mean we are talking about tight oil, 9MB/d for more than a decade for something as capital intensive as tight oil, without consideration of these:
– increasing inflation for materials, labor and equipment;
– increasing cost of credit;
– increasing water cut;
– increasing gas cut;
– increasing economic woes internationally;
– increasing geo-political tensions;
A supercomputer would do the job modeling tight oil, but only if the input data is clean otherwise is garbage in garbage out.
Humans have their own “supercomputers” but work with analogies in mind, and for me tight oil industry is analogous to a pump, and I rather pay attention to people working with this “pump” because reports of “noise”, and “vibration” (volatility?) are signs that this pump is not operated well, operated outside of parameters might cause the pump to explode.
Svaya,
Note that I assume fairly conservative oil prices for my tight oil scenarios, oil at $80/bo, NGL at $28/b, and natural gas at $2/MCF. Prices of inputs in the oil field have stopped rising so quickly and at the price deck I have assumed, new wells can be financed from cash flow, no credit required. A simple spreadsheet is enough to do a rough model. Economic woes and geopolitical tensions have been with us for the past 50 years. If we see a nuclear war or Global depression the model I have laid out will be wrong, but I see those as low probability scenarios before 2030. Your scenario has tight oil output falling by a factor of 4 in 21 months, it will take 5 years or so for tight oil output to drop that fast (to 2000 kb/d) in a scenario where no new wells are completed after March 2023 and even that scenario is very low probability.
No need for global depression or nuclear war what if there is a US decline in prestige and power similar to the Soviet one wouldn’t it have the same effect on oil
Svaya,
There was a severe political cris in th former Soviet Union nations as the Soviet Union fell apart. The US is quite far from such a scenario. Note also the difference in percentage output from the peak in your scenario for US tight oil vs Soviet Union.
The way I see it Soviet Union lost the cold war, and now from where I am standing, Eastern Europe, I see there is a hotter war between US and Russia.
If US looses this war by proxy I don’t see why it cannot have the same or worse consequences than loosing Cold War.
Another great post Gerry.
I personally find the idea that Russia who was the former #1 Oil Exporter on the planet
Threatening to blow the UK and East Coast of USA off the planet with Nukes (how could you trust that as a source of oil? )….
Alarming.
If you look at Saudi Arabia (911 attacks), Russia and USA Shale….How could you feel good about our oil future??
Gerry,
I agree at current oil, NGL, and natural gas prices tight oil wells are likely not very profitable. The scenario below assumes no tight oil or shale gas wells are completed after March 2023. This is about as fast as tight oil could decline. Does this seem a reasonable scenario to you? I would say it is not very likely before 2030, probability less than 1% (likely much less).
reasonable or not, likely or not it can be a scenario, thanks for the graph
Svaya,
Yes it is a scenario, but unlikely scenarios are not useful.
SVAYA, I got your point about Energy Inaccuracy Agency worse case scenarios from the get-go; it was a valid opinion and not deserving of the ensuing shit, and lectures, you received, particularly the one about unlikely scenarios not being useful. That’s a goodun. I wrote something last week about how stoopid EIA estimates in 2021 likely caused the Biden administration to go on its SPR dumping spree.
I put a chart up for you on Forum Stuff titled SVAYA. Its an image Enno and I worked on back in 2016 using his algos for decline rates across all US tight oil basins ( for the record your comment was for all US tight oil, not just the Permian; at least I caught that). If we were to recreate that image I put up for you the decline of US tight oil today, if it were to stop in a 3-5 month period. would be much steeper than the image from 2016, something not a whole lot different than what you proposed. However unlikely that is to happen, what WOULD happen if it did should scare the hell out of everyone. 64 % of US oil production (and it isn’t even really “oil” anymore it’s so light, and getting lighter) is here today, essentially gone tomorrow.
Mike,
The first chart I did was Permian only because that’s what I had done back in Sept 2022, I did all US tight oil above or see link below. Does this seem a reasonable scenario?
https://peakoilbarrel.com/eia-short-term-energy-outlook-tight-oil-report-and-iea-oil-market-outlook-may-2023/#comment-757866
@Mike Thank you very much
Comparison of my analysis with Enno’s from 2016, my scenario has no wells after 2023 vs the scenario from shale profile starting in 2016. It may be that the wells completed from 2016 to 2023 behave a little differently. than earlier wells.
Click on chart for larger view.
Gerry, You are correct in your analysis. It seems like the current administration is “hell bent” on destroying the Oil & gas industry to push the new green agenda which IMHO is not ready for prime time. There is absolutely no way the smaller public companies can do the following simultaneously with the current price of oil & gas: (1) pay dividends (2) pay down debt (3) grow production. It is not possible unless costs drop by 30% like right now/today. (plus there are fewer and fewer banks willing to lend to the Upstream sector)
If the current prices of oil & gas remain at the level we see today for the rest of 2023, the drilling rig count will fall another 40% and we will see negative growth in both oil & gas production domestically for the remainder of 2023.
Making predictions about production, prices and demand in a fast changing political and financial environment is a fool’s errand; however, I do believe the Saudis need/want Brent Crude priced above $80 per barrel. How they get there is another story.
LTO , correct . They don’t want , they need $80 per barrel oil .
https://gulfbusiness.com/saudi-net-reserves-drop-to-410bn-in-april/
Thanks LTO Survivor,
The middle scenario in chart below for Permian basin assumes the completion rate falls to 40% of the April level in the next 12 months to about 300 completions per month and remains at that level until 2031 then completion rate decreases. High scenario has 464 completions per month and low scenario has no new wells completed after March 2023.
Dennis,
I really like this chart at least for the next 18 month time segment. I don’t annticpate oil prices can hit your low price scenario. A low price to me would be $30 per barrel which would induce shut-ins in the LTO world because the lease operating costs across an entire producing portfolio (publicly traded small to medium companies) including the most recently completed wells and wells 3-5 years old are approximately $30 per barrel. If there are fewer new wells drilled the lease operating expense number approaches 40$ per barrel.
I think your middle chart is closer to my expectation. However oil prices going to $200 per barrel would create at most 500 mbpd growth over the next year. There are not enough drilling rigs, oilfield labor, completion crews, DUC s, drilling inventory available even at $200 per barrel. This just my opinion.
As I said earlier, the financial, political (domestic & international) is so chaotic that making any predictions is may be the most difficult task I have ever encountered during the past 40 years.
LTO Survivor,
The high scenario assumes $80/bo and $2.50 NG, AND $28/b NGL. Output increases at about 300 kbpd over 2023 to 2024, next 21months.
I think 200 per barrel would see larger increases than your guess.
LTO Survivor,
On rereading your comment, I agree over short term we won’t see a rapid rise in output, I don’t think $200/b is likely short term in any case. World Market seems well supplied and that is likely to continue for rest of 2023, prices might make it to 90/b in 2024. More likely we will stay in 70 to 90 dollar range IMO.
LTO Survivor,
After 18 months what makes sense for middle (300 well per month) scenario in your opinion?
Is your expectation that the completion rate would decrease at that point? Note that over the next 18 months for that middle scenario about 6400 new wells are completed in the Permian basin. Total Permian wells completed up to Sept 2024 for the middle scenario is about 48300. A very conservative scenario would have at least 110 thousand wells completed in the Permian basin. The scenario below has only 106 thousand wells completed. I am guessing you do not think a plateau in output is possible even at $85/bo and $3/MCF and NGL at 35% of crude price.
Howdy, LTO Survivor: May in the Permian saw less than $70 oil at the WH after transportation deducts, a little north of $1 Waha gas and a little south of $18 for NGL’s (Platts, Plains, branschbach.com and personal). Your $30-40 per incremental BO “lease operating expenses,” (thank you!) by my definition, would include G&A expense, severance taxes and actual operating costs… including some form of DH maintenance, I don’t know. I’ve seen some $15 per incremental BO water costs of late. It would likely not include ad valorem tax per incremental BO, interest on long term debt, paying down debt, or P, A & D set aside. Nor would it include dividend costs per incremental BO, which I don’t even know how to estimate. Those dividends have now become a burden on every BO produced.
Those costs, above, are all per gross BO produced, reported and yacked about all over the internet, not NET barrels to the working interest, the folks that pay ALL the bills. That in the Permian is effectively another $17-18 per incremental BO “cost.”
My point, sir, is this: ROI on a typical $12MM Delaware well is <130% and wells are NOT paying for themselves in a time frame that allows staying on the drilling hamster wheel. Indeed I see that almost every large independent in the Permian is now raising money thru bonds, the new CAPEX scheme. Nobody out there is able to drill new wells on net revenue and some debt is being paid down on the front porch, for the benefit of the public, and more debt is growing out back, where nobody can see. You may correct me if I am wrong, please.
I simply don't want folks believing that $30 is a "breakeven" price. Its not. It's now back to a race to the bottom between poor economics and declining liquids productivity…that make economics even worse. The Permian tight oil sector needs much higher natty prices, and places to put the stuff.
Mike,
Thanks. Using natural gas price at $1/MCF and NGL at $18/b, for the average 2020 Permian well to pay out at 58 months would need a wellhead oil price at $73/bo, this assumes capex is $12 million. At $80/bo at wellhead for oil (same NG and NGL price as before) the well pays out at 38 months. Total net revenue over the life of the well is about 17 million for the $80/bo, $18/b NGL, and $1/MCF NG scenario. Not a great investment and I am not taking account of increased water disposal costs and perhaps higher frac water costs as well, reality may be much worse.
Revised scenarios with 300 wells per month, 382 wells per month and 464 wells per month from March 2024 to Jan 2032. In April 2023 the EIA estimates that 510 wells were completed in the Permian basin, for the 300 well scenario wells completed drops from 510 wells in April 2023 to 300 wells in March 2024, for the 382 well scenario there are 487 wells completed in April 2023 and this drops to 382 wells in March 2024, the 464 well scenario has a constant completion rate of 464 wells per month from March 2023 to Jan 2032.
The no new completions scenario after March 2023 has been dropped as I do not believe it is realistic.
The 300 well scenario corresponds with a 40% drop in completions from the April 2023 EIA estimate for completions in the Permian basin (510 new wells per month) and the 382 well scenario is about a 25% drop in the completion rate from the April 2023 level. In my view all three of these scenarios are conservative, but may be realistic if oil prices and natural gas prices remain in the $75 to $85/bo range for crude and $2.50 to $3/MCF range for NG with NGL at 30 to 35% of the crude price.
Gerry…you point out here that the economics and future prospects of tight oil basins are marginal, and vulnerable to decline.
With that in mind, the country would be foolish to continue to go so slow on ramping up domestic electricity production, grid enhancement, and EV deployment. These projects don’t happen overnight. Time is measured in decades. Even longer for certain components like hydroelectric dams or nuclear power plants, national nuclear waste storage facility (over 70 years now).
Many in the country have been clamoring for long term investment in these projects since far prior to the turn of the century (since the 1970’s in fact), realizing that the depletion moment would be upon us pretty quickly.
As you said “The posters above are right, in my opinion: A nightmare scenario could happen very, very quickly.”
True…that scenario has only been temporarily forestalled by tight oil production.
If not solar/wind/nucs for replacement energy generation, then what? Drill where? Cut out which sectors first? We’ll probably need answers and actions that include all of the above.
With full and nationwide effort.
“ Dennis, I am no economist, but I think the reason oil prices are so low right now is that we have a creeping world recession in our midst. If it gets better, then oil prices will rise, and perhaps completions and production will perk up. But I believe the recession will slowly get worse.”
Ron, I’m with you on that one, in fact I’ve been predicting this months ago. We have a fully developed stagflation in the western economies and things will stay flat: growth and oil production (can’t say if a little bit more Denis’ or Ron’s way). But the emerging economies will continue to creep up the ladder and will have completely changed global wealth distribution by the end of this decade. This Is my best case scenario, innecessary to talk about the other ones …
Are we just going to ignore that just when prices trying to break their support, there is a release from the SPR
https://ycharts.com/indicators/us_ending_stocks_of_crude_oil_in_the_strategic_petroleum_reserve
?
Svaya,
This amounts to 300 kb/d over the past 60 days, you are aware that the crude input to refineries in the US is about 16000 kb/d? This would be about 2% of that and these are releases from the SPR that were previously mandated by Congress.
If we look at it from the World perspective where about 80000 kb/d of crude oil is consumed, this SPR release is 0.375% of World crude oil consumption, oil prices are determined on the World Market, so prices are not likely to be affected much.
I am aware, but these releases for the market have more of a psychological value rather than a utilitarian one,
none the less using the SPR like this could be a problem for when the refineries might need those, the way the reserve is today, 16000 kb/day that would be 21 days at best, but I can imagine that that draw is lossy and some of it is wasted in those reservoirs so 21 days is the highest ceiling.
Svaya,
Yes if the US stops importing oil the SPR would not last long. Current imports of crude oil were about 6278 kb/d in 2022. Recently (Feb 2022) the SPR was at 371579 kb, so that is enough to last 59 days. Also note that the US imported 4354 kb/d of crude from Canada in 2022, these imports are likely to remain stable, so non Canadian crude imports to the US amounted to only 1924 kb/d in 2022, so from that perspective the SPR would last 193 days. This does not take into account US exports of crude and Petroleum products which might be reduced in a crisis. The crude exports do not help much because this is tight oil that we do not have refining capacity for, but swaps of tight for heavier grades of oil could be required reducing imports needed and fewer exports of products would reduce the crude input needed for refineries.
Bottom line, the low level of the SPR might not be a problem, though it was a bad move to sell it off in my opinion.
Yes it was a really bad move especially because when they will need to fill the SPR the price will increase and if the price is already high that is a double whammy
Svaya,
Yes I agree. It seems they should be refilling now while oil prices are low, but sales mandated by Congress in the past mean that more oil must leave the SPR, once those are finished refilling might begin, it seems oil cannot go into the SPR at the same time it is coming out, guess there is only one pipe which seems stupid if correct.
Not all that clear what’s going on, maybe they think it does not need to be refilled.
I hate to say this but I would’t put it past the current administration to empty the SPR as much as needed in order to keep inflation lower into the next election cycle for 2024. It worked once for this administration and there is no question they would go back to the “well”. No pun intended.
“For the first time, global demand for each of the fossil fuels shows a peak or plateau across all WEO [World Energy Outlook] scenarios…
For the first time ever, a WEO scenario based on today’s prevailing policy settings – in this case, the Stated Policies Scenario – has global demand for every fossil fuel exhibiting a peak or plateau. In this scenario, coal use falls back within the next few years, natural gas demand reaches a plateau by the end of the decade, and rising sales of electric vehicles (EVs) mean that oil demand levels off in the mid-2030s before ebbing slightly to mid-century. This means that total demand for fossil fuels declines steadily from the mid-2020s to 2050 by an annual average roughly equivalent to the lifetime output of a large oil field.”
“Global fossil fuel use has grown alongside GDP since the start of the Industrial Revolution in the 18th century: putting this rise into reverse will be a pivotal moment in energy history. The share of fossil fuels in the global energy mix in the Stated Policies Scenario falls from around 80% to just above 60% by 2050. Global CO2 emissions fall back slowly from a high point of 37 billion tonnes per year to 32 billion tonnes by 2050. This would be associated with a rise of around 2.5 °C in global average temperatures”
source- IEA
https://www.iea.org/news/world-energy-outlook-2022-shows-the-global-energy-crisis-can-be-a-historic-turning-point-towards-a-cleaner-and-more-secure-future
Opinion- It will not turn out exactly like this, but roughly so.
Rough in many ways.
ENERGY CLIFF DYNAMICS: Massive Debt & Interest Rate Swap Derivatives Bubble Looking For a Pin
One of the main factors overlooked by the Energy Industry & Economists is how the oil supply has a direct relationship to GDP. While Economists have provided Economic models suggesting energy has a much lower effect on GDP, their models FAIL MISERABLY. But, they still keep these stupid Economic GDP models because the Market would disintegrate if the Correct Mathematic Models were known.
Several Economists have pointed out the FLAW in the Mainstream Economic Model with and without an Energy Input. They claim a 1% decline in Energy supply would only have a 0.3% impact on GDP. This of course, is utter HORSE-SHYTE. But, many Economists and Individuals continue to believe it.
I highly recommend watching this entire interview by Professor Steven Keen on “Debunking Economics: the Failure of Neo-classical Economics.”
I have the video starting at 43 minutes when he begins to discuss energy in the Economic Models, but it’s worth the time to watch the entire video where he BLOWS apart Classical Economics which are still the models used by the Federal Reserve and most Economists.
With Global Oil Supply Growth now GONE, very few realize how the POPPING of the massive World Debt & Derivatives Bubble will impact future CAPEX for continued Oil Production.
https://www.youtube.com/watch?v=bYMsO1j9XAk&t=2592s
steve
Brilliant
Dennis, I don’t believe if is possible to model future tight oil production with a reasonable degree of accuracy, because there are too many variables. When the price of NG was reasonable, the increasing GOR was of little consequence, but at close to zero, it quickly becomes a salient chokepoint in the equation of economic viability. When the water cut was reasonable, saltwater disposal was a mere bother; now that the closest West Texas disposal wells to New Mexico are running borderline high pressures, and the WOR is rising, getting rid of the water has become an expensive, dangerous, onerous task. When new well EUR was substantial, and the price of oil was higher, one could ignore the rising GOR and rising cost of production, but now not so much.
There are quite a few negatives occurring at one time, and they’re accrual. Does it make sense to keep trying to bust last year’s production quota in such an economic milieu? Probably not, especially when this is America’s last hurrah. I’m not pulling for any one variable to go further south, but nothing remains constant. When new production in the #1 tight oil basin is mostly coming from one county in a state that won’t even accept the wastewater they generate, it doesn’t take a fervent imagination to figure out that this might not end well.
But that’s not the part that concerns me most. It’s that I don’t think anybody—Pioneer, Chevron, Occidental, Exxon, EOG—can slow down, exercise constraint, stretch out the future. Perhaps in a capitalist society nobody should exercise caution, but we’re talking about the future of this country. It matters that the reserve currency of the country with global hegemony is the Petrodollar. It matters that we aren’t building enough ships to remain the Navy to the world. We have no energy policy, apart from throwing trillions of dollars toward renewables projects. I understand that at least half of the country wants us off oil and gas NOW, and that’s precisely what worries me: At a time when the prices of oil and gas should be very high, they are very low in the case of NG, and only middling in the case of oil. This is precisely the environment that breeds malaise the likes of which I see from . . . you . . . not to be catty.
I’m long enough in the tooth to remember when we ran short on oil. The world was a much simpler place back then. What I’ve tried to point out in the nicest way possible is that models for the future are being drawn using flatus and moonbeams. They’re being drawn with the warm fuzzy belief that no leader in his or her right mind would go nuclear, or that China would never be so outrageous as to make a move on Taiwan, or that Saudi Arabia, that standard-bearer of grisly behavior, would be so aggressive in building the new city of Neom that they’d murder a trio of people who didn’t want to give up their homes.
We are quite rapidly moving toward the day when there will be life-threatening electricity shortages all around the globe. And that’s before even considering the risk of electromagnetic pulse generation shutting down the grid. The energy transition has outrun itself; the cost of fossil fuel has fallen to seriously inept levels; the only production unit in America is faltering much faster than people believe. For Christ’s sake, the name of this site is peak oil, and yet most people who write stuff on here act as though that’s some fantasy ride at Disneyland.
I’m not Nostradamus, but I don’t think we need him. I think we merely need to believe our lying eyes.
Gerry,
I agree, it is not possible to model the future as the variables are infinite as are the number of possible variations for the variables. The scenarios make a number of assumptions which are likely to be incorrect. I agree low prices and high costs will be a problem. I would think that water recycling would help with the water problem and low natural gas prices will lead to fewer natural gas focused wells which might solve the low natural gas price problem.
Note all my scenarios have peaks, we simply see things differently. So I guess you think the no future completions scenario seems more reasonable? We will see.
Gerry ” I understand that at least half of the country wants us off oil and gas NOW, and that’s precisely what worries me: At a time when the prices of oil and gas should be very high, they are very low in the case of NG, and only middling in the case of oil.”
A different perspective on this particular statement…
Something like half the country would like the US to take the process of weaning ourselves off a depleting resource seriously, as they have since the 1970’s peak conventional oil production and Saudi embargo. Add global warming to their concern, and yes- a huge swath of the country does want an aggressive approach to adaptation to the conditions that have been building now for decades (despite the substantial but brief reprieve from shale oil).
Secondly, higher oil and gas prices that you say we ‘should’ have now would spur increased production. Better if the country produced what it has left slowly so that it lasts longer. The unregulated ‘gold rush’ since 2012 has been folly for this country.
The reason prices are ‘low’ (these prices used to be considered very high) is because the export spigots are wide open.
Regarding policy, better put grid upgrades high up on your platform if being relevant is a goal.
Great Post Gerry. I agree.
D Coyne: “So I guess you think the no future completions scenario seems more reasonable?”
No, I don’t think that at all. I stated very plainly that I didn’t think the majors could slow down if they wanted to.
They are on the treadmill.
Gerry,
Sorry, I misunderstood your comment.
I agree it would be good for oil resource development to slow down from current levels. The original scenario I posted assumes the rate of development stops accelerating. Using completion rate as a proxy for “rate of development” for tight oil plays in the US the chart below has the completion rate for figure 19 at the end of the post. Basically the scenario has completion rate steady from April 2023 to Jan 2032, which is different from the increasing completion rate from 378 wells completed in June 2020 to 954 in March 2023 ( an average rate of increase of 17.5 wells per month over 33 months).
Note that I would agree that this scenario is likely to be incorrect, but I think it more likely than a scenario with zero completions starting in April 2023, very possible that the completion rate will fall, especially if oil, NGL, and natural gas prices remain at current levels (I expect they will rise between now and September 2023).
My batting average on general oil price movements continues to be pretty good. One thing I would note is that oil is now uncorrelated (0.07 over 15 day) or slightly negatively correlated (-0.16 over 90 day) with the USD. This is a “new” phenomenon – over 180 day period oil is 0.64 POSITIVELY correlated with the dollar. I think a lot of people thought the dollar run was over. Well – apparently it was just taking a break.
https://www.tradingview.com/symbols/TVC-DXY/
not sure why oil has lost connection with the dollar. But over the past year the dollar spends more time negatively than positively correlated (70% versus 30%)
Twocats,
Your prediction for June 2023 average monthly price for WTI is? We can check your accuracy at the end of the month. You can try other future months as well. My guess is $75/bo plus or minus $5/bo for average WTI price for the month of June 2023.
no one trading financial instruments that I know looks at the average of something. “dollar cost averaging” is one of the oldest scams on wall st. (recently [last year] adopted by crypto! that’s funny). In fact – I would be looking for a brief spike in oil. but in three days people will be calling for a bull run, and then I would short it again. I mean if you’re looking for a play – why not consider natural gas. It has huge upside with very little downside. granted the volatility will give most people nausea and I won’t go near it. but it you are looking for some “tail” option plays – that would be my go. a run to $2.65 is in the cards over the next week.
Twocats,
Not looking for investment advice. You claimed that you get prices right. Can you predict historic prices?
““dollar cost averaging” is one of the oldest scams on wall st.”
TC, agree. It works for those who don’t have the gray matter to understand the market(of which I am realizing that is most people) or who don’t have the time because their focused on their primary source of income. A lot like automatic reinvesting dividends and you can’t time the market. The second and third oldest scams. They all go against the idea of buying low and selling high and says let me manage your money because your not smart enough. The truth is if you buy into those ideas, you probably should let someone else manage your money.
For over 30 years I have been a buy and hold investor who reinvested dividends and made small optional cash payments into DRIP plans. I have also made the maximum contributions to my retirement plan for over 30 years, 100% invested in mutual funds.
I’ve not done too bad for a non-smart investor with not enough gray matter to understand the markets.
Of course, I’m a dummy with a finance degree and JD from a Big Ten university. No Ivy League nor Stanford pedigree here.
The best investments I have made have been in farmland. Oil had been better, until Thanksgiving, 2014.
I’ll add I did a lot of income tax work and estate tax planning work for 7-8 figure net worth clients in the 1990’s and 2000’s. None were stock traders. Zero.
I did have an elderly client who had churning broker. That broker turned a $1 million+ brokerage account into sub $100k brokerage account when the internet bubble burst. Not sure why an 80 year old widow needed to be in and out of internet stocks.
I know there are people who are successful trading the market. But they are incredibly intelligent. Top 1/10 of 1%.
That eliminates the rest of us. So we are doomed to boring.
I suppose we could invest in a Peruvian Sliver mine or roller coaster like A.G. Pennypacker, aka Cosmo Kramer.
You under estimate yourself
“Not sure why an 80 year old widow needed to be in and out of internet stocks” Who was managing the estate finances ? Self directed ?
“Top 1/10 of 1%” – is that opinion or fact ? Trading and investing are not the same thing.
She had given the broker full authority to make trades.
I was just doing the income tax return and had prepared her estate plan.
The broker told her my comment on her investments and frequency of trades was none of my business and that I was also not qualified to comment.
The tax return preparer is usually the only person aware of the churn.
Of course .1% is my opinion. I really don’t know much, just my observations.
Most net worths in my area m result more from people who live below their means. Inherited wealth not squandered is a close second.
“Most net worths in my area m result more from people who live below their means”
This should be the Golden Rule taught in a personal finance class to every high school student. As a posed to how to fill out a credit card application after one has maxed out their other cards.
I would suspect today a financial advisor with a fiduciary responsibility. Those brokers actions would be criminal. Today, stock trades are free or nearly free. 20 plus years ago the broker was ringing the register every trade.
SS, with your knowledge of the oil industry and it’s extreme price swing. It seems to me that trading the industry would be a lot easier for you than managing stripper wells. It’s not 1/10 of 1 percent or rocket science, you tell me. My primary reason for following this site is to keep up on information on the industry. I would guess Dennis could make a lot money if he turned his hobby into investing. But, I suspect he’s more of a ETF, mutual funds, managed investor kind of guy. Myself, a finance and economics major it’s like a hobby for me and interesting. You need to position yourself that if the market goes up, it’s an opportunity. If the market goes down, it’s an opportunity. The biggest mistake I hear people make is they get cold feet when the market goes down and sell for a loss. That other shit I did for over 40 years was a job.
I always enjoy your comments on your business
We had high oil prices due to supply side shocks not inflation. Which on a global view took more collateral more Eurodollars to buy and sell oil which positively correlated oil and the dollar.
Now we are in mild global recession. Later on this year it will be major global recession. Coupled with banking crisis which gives us 2008 style scenario. And it’s global. China, Europe, and US all at same time.
Sovereign wealth funds are going to take a huge hit later on this year. OPEC might just say the heck with oil prices and open the taps as wide as they can to fill the gap of the losses they take on their sovereign wealth funds later this year.
These sovereign wealth funds are in global equities to the tune of 60-70%.
Understand just from a US perspective equities or stocks since 2009 the rise in valuations is 100% due to corporate buybacks. $15 trillion in corporate buybacks. Well later on this year credit gets turned off the corporations become sellers of stocks not buyers.
HHH, you may well be right. But your credibility is shot. I watch “later this year” with interest…
John,
In the future HHH still expects oil to be $25/bo, but he has not put a date on it after his previous claim of March 2023. Hole in head has predicted $25/bo in 2025. My guess for $25/bo would be 2037.
HHH,
I agree with parts of your speculation. Two things, firstly what makes you think sovereign wealth funds won’t sell their position in the global equities and hold cash (CHF, YEN, or USD), gold or any other defensive asset class ?
Two, why in the world would OPEC countries which rely almost solely on oil for their national income, sell it at discount rates when they can just reduce the flow of their taps ? Especially knowing damn well that the twilight of the oil age is near, and it could be regarded as a precious commodity 10 years from now ?
I know it is ZH , but then it is not on CNN , MSNBC , ABC etc . Press banned from OPEC+ meeting
https://www.zerohedge.com/markets/oil-plunges-goldman-and-others-sees-rising-odds-another-opec-output-cut
Who are they going to sell to? The SWF’s are invested in all kinds of equities around the world to diversify away from just selling oil.
We get into a credit crunch where banks don’t make the loans necessary for existing loans to be rolled over or not enough collateral by borrowers to roll over existing loans at higher rates. The corporates become forced sellers of their own stocks in order to meet debt obligations.
Yield curves have be warning this was coming. People just don’t pay attention to them and don’t understand them and rely of government or FED to tell them the state of global economy and monetary system.
Who are they going to sell to?
In context of the above here is a ” To be or not to be ” situation . Biden government passes CHIPS ACT 2022 to enable set up chip factories in USA and then goes on to prohibit sales and sanction the largest consumer of chips on the planet–China . Micron Technologies CEO has asked the same question ” Who do we sell to” ?
“And it’s global. China, Europe, and US all at same time.”
this is so important to understand. china reopening is not going according to plan in both manufacturing AND services
“The PMIs and other economic indicators for April add to evidence that the rebound is losing steam. Last month, imports contracted sharply, factory gate prices fell, property investment slumped, industrial profits plunged and factory output and retail sales both missed forecasts.”
https://www.reuters.com/markets/asia/chinas-factory-activity-falls-faster-than-expected-weak-demand-pmi-2023-05-31/
and this is in an economy where they can kind of make up the numbers.
The EIA Petroleum Supply Monthly”> is just out. Production was up even more than Dennis or Ovi guessed. January and February production was also revised upward.
The furthest right in the data posted below is the Petroleum Supply Data. It is only through March.
Looks like Ovi’s guess was best. I think it was initially 12,590 and then revised to 12550 kb/d. If the PSM estimate is accurate he was too low by over 100 kb/d, I was too low by 160 kb/d, and Ron by 296 kb/d.
I did guess we would all be wrong, but I thought the average of the three of us (12507 kb/d) would have been closer, as a group our average guess was low by 189 kb/d.
I wonder if we will see a major revision to the “official” EIA tight oil estimates this month. It looks like tight oil output might have increased by about 136 kb/d in March 2023, vs the April 28, 2023 EIA estimate of about 66 kbopd.
The tight oil estimate will be updated today or tomorrow by the EIA.
Twocats
China’s recovery has been on investor’s minds recently. It may not be recovering as fast as oil traders hoped. This could account for the recent poor correlation.
China manufacturing PMI dips in May, falls short of expectations
SHANGHAI — China’s factory activity weakened further in May, underlining the economy’s shaky recovery from the COVID-19 pandemic, as orders softened.
The official manufacturing purchasing managers’ index (PMI) came in at 48.8 this month, down from 49.2 for April, the National Bureau of Statistics reported on Wednesday. This extends a string of declines since March, after a brief uptick in the first two months of the year.
The 50-point mark separates a contraction in activity from an expansion. A Reuters poll had predicted the figure for May would come in at 49.4.
Wednesday’s data follows April’s softer-than-expected key statistics, including production and investment, raising concerns about China’s growth momentum.
The PMI’s sub-indexes that cover production, new orders and raw material inventory contracted in May, hinting at softer demand not only for exports but also capital investment.
Although it remained on a growth trajectory, China’s nonmanufacturing PMI dropped to 54.5, from 56.4 in April.
https://asia.nikkei.com/Economy/China-manufacturing-PMI-dips-in-May-falls-short-of-expectations
Ovi – I’ll have to think about that. Perhaps you could say there are three ways for the dollar to thrive: 1) if the money supply is shrinking and dollars are simply rarer (HHH thesis). 2) as a safe haven asset from global turmoil (used to happen all the time, not so much anymore?). three: as a semi-commodity currency – a) if people are buying refined oil products (good for us economy) and b) buying oil means dollars are flowing in global trade.
just spit balling here. probably above my pay grade.
China might buy some oil using their currency. Then turn around and export refined products in dollars.
Saudi’s will immediately exchange those Chinese yuan for either gold or guess what? US dollars.
The whole narrative behind the dollar’s death is dumb.
As we get pass the debt ceiling. Bond and T-bills yields are going lower. Because there is no inflation, just deflation and you can see it literally pretty much everywhere you look.
Commodities are imploding. What happened to the commodities super cycle? Prices to the moon?
New orders just aren’t there. What comes next is layoffs.
If OPEC fails to cut production again oil will be at $60 in a hurry.
Holding prices artificially higher than they should be by cutting production doesn’t solve the problem. It compounds the problem ultimately leading to even lower prices.
The path from a rapidly growing humanity to a slow growing, and then contracting humanity
will be bumpy and extremely different than from what has come before.
It is upon us.
btw- Global oil demand has now reached a rough plateau. We have arrived at the top ( /- 5%), after 150 years of rapid growth…Let that sink in.
Prices for oil will swing wildly as small temporary supply excesses and shortages play out as the system digests the dramatic changes at hand. There are tens of millions of cooks stirring the pot, with all sorts of different interests and goals. Smooth sailing would be a shock.
“The path from a rapidly growing humanity to a slow growing, and then contracting humanity will be bumpy and extremely different than from what has come before. It is upon us.”
Yes, I think this is a too-little understood point. When people look at the overall numbers, they see that global population is still rising, and most of the wealthy countries still have rising populations and, if they see the great demographic transition at all, they see as something happening in the future, or somewhere else.
But, when you consider how people consume less as they age, and how many developed countries are going into negative population growth already, and declining consumption per person of many things, and the reduced birth rates even in most middle income countries, the reality is, from a consumption perspective, the effective world population is already falling, and this fall is accelerating quite rapidly, as the combination of Covid and inflation and high house prices and high energy prices and now high interest rates, means birth rates going even lower (fertility rate is now below 1 in South Korea – there were 250,000 births last year there, compared to over 600,000 in 2000), life expectancy is falling in the US, real incomes are falling in the UK, GDP/capita is falling in Canada, etc, etc.
As for global oil ‘demand’ reaching a plateau, this may be a bit pedantic, but ‘demand’ is as high as ever (as seen when pandemic stimulus resulted in a flood of goods being shipped from China to the West Coast ports in North America, or in booming travel and tourism figures), it is just that the amount of oil we can *afford* to produce and consume has hit a plateau. If we were still producing oil the way we did in the 60’s, consumption could still keep rising, even with the (consumption-weighted) population declining – but we aren’t.
“it is just that the amount of oil we can *afford* to produce and consume has hit a plateau.”
Yes, that is the big point I was getting at. The affordability of oil for collective humanity to both produce and consume on a global scale may have reached its plateau. I’m not saying its about to rapidly decline, but the big growth phase is over.
If we do reach a slightly higher level later in this decade it will be a brief episode.
This doesn’t mean that continued oil production won’t be very valuable, but it does mean that less and less will be available/affordable for light transport. And it also means that some places in the world will struggle mightily to get the supplies that they rely on for basic functions.
Hickory,
Not all that clear that oil prices will go up a lot, they may stay in the range they have been from 2015 to 2022 in real terms. After 2030 they might return to the low levels of 1986 to 2003 when real oil prices in 2020$ were in the 20 to 40 dollar per barrel range, this assumes demand falls and results in an oversupplied oil market after 2030. The 2023 oil price represents the EIA STEO forecast for annual average price in 2023 in 2020 US$.
There have always been places where affordability of energy is a problem for many, this will also be true in the future.
“There have always been places where affordability of energy is a problem for many, this will also be true in the future.”
Right.
I am saying that I expect that disparity to get much more pronounced.
Hickory,
Perhaps, if there is a shortage of energy which causes prices to rise, I don’t think there will be such a shortage, on the contrary there may be oversupply and dropping prices.
I guess we just see things differently. As wind and solar power expand and electric transport also expands, demand for fossil fuel will be reduced to the point that prices will fall and affordability will increase rather than decrease.
Yes. You think the job will get done in time, and I don’t.
I think we started way too late, and the job is too big.
It would be good for humans if you are right.
HHH, can you explain your hypothesis/assertion that when the Central Bank prints money they just become Bank Reserves and can’t be spent in the economy?
I am not disagreeing with you. I just don’t understand that.
Why not give banks used toilet paper and call them reserves if you can’t do anything with them?
I am genuinely curious as I would like to learn the EURODOLLAR stuff.
They don’t become bank reserves. They are bank reserves.
Ask your employer to pay you in bank reserves from now on. Then go to your local grocery store, gas station or anywhere else and try to spend them.
You’ll find your employer can’t pay you in bank reserves and you can’t spend them. Anywhere!
Real money that chases goods an services in the economy is created by banks via loans. All the crap that goes on a FED just doesn’t matter. None of it is what they say it is. FED buys bonds in secondary markets meaning it plucks them off the banks balance sheets. These banks aren’t given actual money that they can use in real economy. They are given bank reserves. Just an entry on FEDS balance sheet that they collect a small amount of interest on.
There are some good resources online if you want to learn about Eurodollars and how the plumbing of the actual monetary works. And why the actual monetary system is Eurodollar banks. Not the FED and other central banks.
Jeff Snider actually does a really good job of explaining it in a way that average people can understand it. Start there if you actually want to learn. He has tons of videos on YouTube so if you have the time it cost nothing. You’ll learn way more there than you can from me from just the little bit I reveal here.
The EIA international data will be published in a few days, either Friday or sometime next week. I thought I would check it to see if there had been any revisions in the previously reported data. I was shocked. There had been major revisions. The World data was revised up by 422 Kbp/d, Russia up by 524 Kbp/d, and Saudi up by 820 Kbp/d. But Canada had been revised down by 1,244 Kbpd. That’s one and a quarter million barrels per day. That leads me to believe that these numbers are not real. But I cannot imagine why they would post phoney numbers.
The data below is the new revised EIA data for the World and the top 18 producers and the amount that their production data has been revised.
Ron,
the Canadian estimate is way off for Jan 2023, the Canadian government estimate is more like 4732 after substracting the typical 140 kb/d that the EIA does to account for C5 from NGL (EIA excludes this which is stupid IMHO). So Canadian output for Jan 2023 will be revised up by 1335 kb/d. If there are no other revisions this would bring Jan 2023 World C plus C to 83.4 Mb/d.
I knew the Canadian data is way off. That’s what makes me believe the other revisions are way off also.
Considering the current status of world affairs it reminds me of Jean Claude Junkers statement a while ago.
(not saying it is so, but it´s a scenario)
Laplander , I will fill in the blanks . No problem .
I created the chart below using the revised EIA data for Saudi Arabia. I have no confidence that the EIA data is anywhere near correct.
Ron,
There will no doubt be lots of revisions over time. Data is never perfect especially recent data.
August and September 2022 are not all that recent. Do you believe Saudi production jumped over one million barrels per day from August to September? I don’t!
Probably just a data error, it will get fixed in time. I consider recent data the last 12 months.
You might want to check your data for Aug 2022, I have 11160 kb/d for KSA C plus C from EIA. Agree that data for Nov 2022 to Jan 2023 looks too high, JODI has 10468, 10435, 10453, 10450, 10464 for Nov 2022 to March 2023 (possibly these are crude oil only values and about 200 kb/d of condensate should be added.)
Note that the JODI numbers match with KSA’s self reported numbers and generally one would expect them to under report, they have no reason to over report ( the self reported numbers are a bit higher in January).
Dennis, the OPEC MOMR is published about two weeks after the last data. And they very seldom have revisions as much as 100 Kbp/d for the total. And revisions are much less for individual countries. The EIA should only do half as well.
Ron,
They should probably do better, US Government Agencies tend to be starved of funds, this might not be the case at OPEC.
Ron,
Chart below compares JODI data with EIA data for Saudi Arabia. The JODI data is likely crude only and from Jan 2015 to Dec 2021 the average difference was about 226 kb/d, Jodi data was 97.7% of EIA C plus C data on average over that period. A better estimate of Saudi C plus C for jan 2022 to March 2023 would be to take the JODI data and divide by 0.977.
Dennis, JODI says they get all their data from direct communication. They call Saudi and ask them what they produced last month. What you post above looks like what the MOMR has for what they call “direct communication.” But what the MOMR posts is crude only, not C+C. Anyway…..
Ron,
Yes similar to direct communication, which for KSA varies little from secondary sources, yes it is crude only, but the difference tends to be about 2.3% or 226 kb/d over the 2015 to 2021 period between EIA C plus C and JODI. Note also the mistake in the August data in your chart, you should upload the most recent EIA estimate.
Big revision to tight oil data for May report. Almost 200 kb/d higher for February and March.
Tight oil for March 2023, April report 8327 kb/d, May report 8505 kb/d. Tight oil output was 8562 kb/d in April 2023.
Trends for tight oil and permian
OPEC oil output falls in May after voluntary cuts, Reuters survey shows
Summary
– OPEC output falls 460,000 bpd from April – survey
– Saudi output falls by 430,000 bpd, biggest drop in group
– Quota-bound members miss implied target by 850,000 bid
LONDON, May 31 (Reuters) – OPEC oil output fell in May after Saudi Arabia and other members of the broader OPEC alliance made voluntary output cuts to support the market, a Reuters survey found on Wednesday, although increases elsewhere in the group limited the decline.
The Organization of the Petroleum Exporting Countries has pumped 28.01 million barrels per day (bpd) this month, the survey found, down 460,000 bpd from April. Output is down more than 1.5 million bpd from September.
The largest reductions came from OPEC’s Gulf producers Saudi Arabia, Kuwait and the United Arab Emirates, which largely implemented their voluntary cuts, the survey found.
How to explain such a large drop and declining prices for oil? Very week demand? China’s weak PMI and rumours of continuing high Russian production and KSA is not happy with Russia.
https://www.reuters.com/business/energy/opec-oil-output-falls-may-after-voluntary-cuts-reuters-survey-2023-05-31/
Oil prices .
Tweets
Conversation
Oil Bandit 🛢️
@OilCfd
What we do know about oil:
-The prince needs it at 80
-Joe is contented at 70
-Winnie pooh likes it at 65
-We stop drilling at 60
-Vlad is happy with whatever he can get
The truth is always in the middle
8:07 PM · May 31, 2023
HiH
That’s funny, by your logic:
Joe = Truth
You said it, not me…
Isn’t Winnie the Pooh in the middle?
Update of US Car Sales
The sales numbers increase, despite the oil price is still higher than the threshold of ~5.5 %BOE.
I’ve heard, subsidies for BEVs in USA are now about 7500 USD/car. And the SPR release has lowered the gasoline price for some months. Both reasons are sufficient to explain why the threshold is not working.
In Germany, subsidies for BEVs are 6500 Euro/car. In China, BEV purchasers are free of tax (10%). A worldwide race to subsidize the car industry is going on. I’m curious how long this lasts and what will happen when it ends.
Part of the value a chart provides is the ability to convey information in as simple a manner as possible, but no simpler.
You information may be great, but it hurts my eyes and head looking at that chart. So I don’t try to figure it out.
Maybe a different way of plotting could help.
Shale Oil Companies Low Breakevens For DUMMIES…
With the oil price now at $70 , this should be rewarding the Shale oil companies with MANNA FROM HEAVEN.
However, we see the continue decline in the U.S. Oil Drilling Rig count today with another 6 Rigs CUT from the Permian, Eagle Ford, & Bakken.
Just wait until OPEC, which is now beginning its own FED PIVOT away from the U.S. & WEST and closer to the BRICs as they consider more OIL CUTS, and don’t rule out another ARAB OIL EMARGO on the U.S. or Western countries continuing the U.S. Unipolar Global Dollar Hegemony.
The World is getting quite tired of funding our $1-2 trillion deficits each year as the CLOWNS up in GOVT continue to increase the Debt Ceiling.
Gosh… this is gonna be fun.
steve
Steve,
Only a clown thinks the debt ceiling is a good idea, most nations either do not have a debt ceiling or set it at a level far above current debt levels (over 3 times higher for Denmark, the only other industrialized nation with a debt ceiling). The World can choose not to buy US Treasury Securities and because of the drama over the debt ceiling that is chosen by Republicans, borrowing costs for the US are likely to be higher because the asset does not seem as safe. Nobody is forced to buy US debt it is a choice made by foreign individuals and governments because the asset is considered very safe.
Tight oil does not make a lot of money at current prices so the rig count and frac spread count may continue to fall.
“With the oil price now at $70 , this should be rewarding the Shale oil companies with MANNA FROM HEAVEN. ”
Read Mike Shellman’s comments ( or visit his blog ) http://www.oilystuffblog.com
to learn how Natural Gas and NGL prices are affecting shale production as “gassy oil wells” are turning into “oily gas wells”;
If I can understand it, you should be able to.
Thank you, Andre. I try to make it easy, because once you get past all the lies, it IS easy.
I would like it if people read a comment made by John on Forum Stuff regarding the fact that oil exports averaged 4.8MM BOPD in March and for the same month China imported a little south of 1 MM BOPD of that US oil. What portion of those exports to China were from our nation’s Strategic Petroleum Reserve I don’t know, but it CONTINUES to be drained weekly, in spite of pledges to end withdrawals months ago.
China threatens the US directly and indirectly every week over something; every man, woman and child in the US should be furious about this. That hydrocarbon exports aid US energy security is a blatant lie.
https://www.oilystuffblog.com/forumstuff/forum-stuff/why-joe-why
I think this is what Mike is referring to.
Mike,
The SPR sales that are occurring now were mandated in Congressional Legislation.
https://oilandenergyonline.com/articles/all/congress-calls-additional-spr-sales/
There have been about 16 million barrels drained from the SPR since Jan 6, 2023, about 94 kb/d.
The EIA numbers don’t seem to add up for March 2023, the published numbers suggest a crude stock draw of 7.3 million barrels in March. But if we look at net input of crude to refineries, crude production, imports of crude and exports of crude in March 2023 the implied stock draw is 39.5 million barrels, this is a large error of some 32 million barrels.
See
https://www.eia.gov/dnav/pet/PET_SUM_CRDSND_K_M.htm
Notice the 32 million barrel adjustment, the EIA really needs to get its act together.
I guess this is why Mike calls it the Energy Inaccuracy Administration.
Leaves us wondering what the real numbers are. Since Jan 1981 up to March 2023 the adjustments add up to 2.8 Gb.
If things were being done correctly there should be just as many positive adjustments as negative adjustments over time, they seem to have a flawed methodology.
I really don’t give a rats ass what the “real” numbers are, Dennis. That distracts from the point and the point is that American oil needs to STAY in America…for Americans. We will need every stinking barrel of remotely affordable oil we have left in the country. Instead we are selling it to “allies?!!” below other world oil postings, using our valuable groundwater resources to extract it and burn its associated gas up flare stacks. And in the Permian Basin export “sacrifice zone,” someday West Texas is going to split apart from injected, produced water.
So, if it is 914K BOPD exported to China in March, or 9.14 gallons, it is close to aiding and abetting the enemy, who might someday use American Wolfcamp oil to put in their jets and fight the US over Taiwan, or the Ukraine. It is stupid beyond belief and clearly almost everyone in America is content with watching it happen before their very eyes.
Jesus, I can’t believe anybody with a square centimeter of cranial capacity thinks exporting the very last of US tight oil resources is good for American long term energy security. And to China?
The EIA is a large government entity influenced heavily by the Congress that keeps it funded. Its estimates about the future are worthless. It, like everyone else analyzing oil and gas production, has to wait for the data to come out of the states in which it originated. Patience is a virtue; bad estimates cause problems.
MIke,
I agree exporting the oil is a bad idea, not many agree with this point of view. The EIA seens to do a bad job of estimating output, imports, exports, etc. Putting together all the data from the states for production, inputs to refineries, imports and exports is a big job.
Not clear that anybody does this well. If it is done well somewhere, it is probably very expensive data and I cannot afford it.
ANDRE,
I get all that… I was being sarcastic. The U.S. Shale Oil Industry is heading for DISASTER.
KISS – KEEP IT SIMPLE STUPID.
steve
A new thread regarding US oil production has been posted.
https://peakoilbarrel.com/us-march-oil-production-at-post-pandemic-high/
A new open thread Non-Petroleum has been posted
https://peakoilbarrel.com/open-thread-non-petroleum-june-3-2023/