A guest post by Ovi
All of the Crude plus Condensate (C + C) production data for the US state charts comes from the EIAʼs Petroleum Supply monthly PSM which provides updated information up to March 2023.
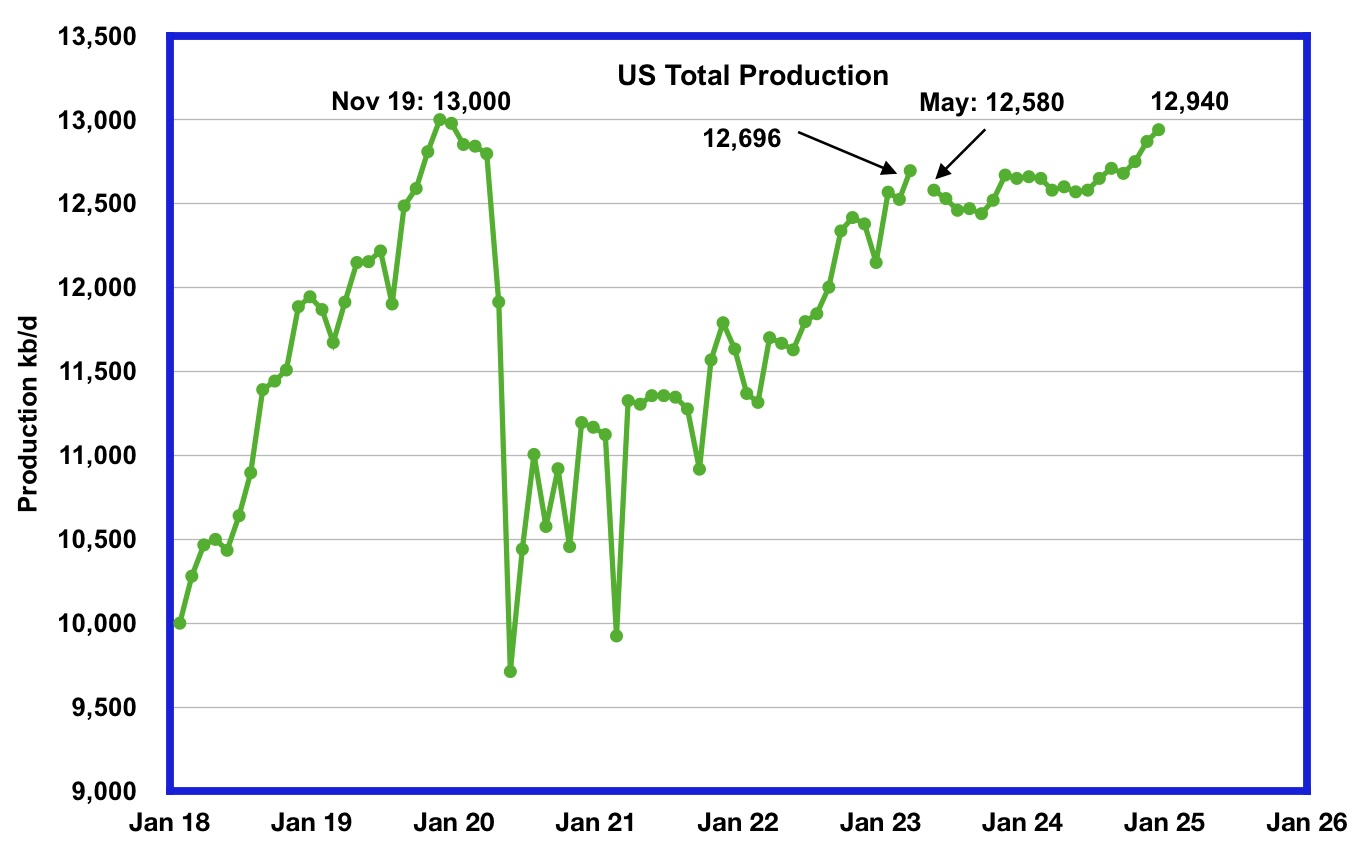
U.S. March oil production increased by 171 kb/d to 12,696 kb/d, a new post pandemic high. Note that February’s output was also revised up by 42 kb/d from 12,483 to 12,525 kb/d. So relative to the initial EIA February report, production is up by 213 kb/d.
The EIA’s forecast production drop that starts in May 2023 could be associated with the drop in completions that started in early May combined with a projected drop in GOM production.
In March, seven of the ten states had production gains, with Texas having the largest.
The green graph from May 2023 onward is taken from the May 2023 STEO and is the forecast for U.S. oil production from May 2023 to December 2024. Output for December 2024 is expected to be 12,940 kb/d which is 60 kb/d lower than the November 2019 peak of 13,000 kb/d. Production will be essentially flat from May 2023 to September 2024.
Oil Production Ranked by State
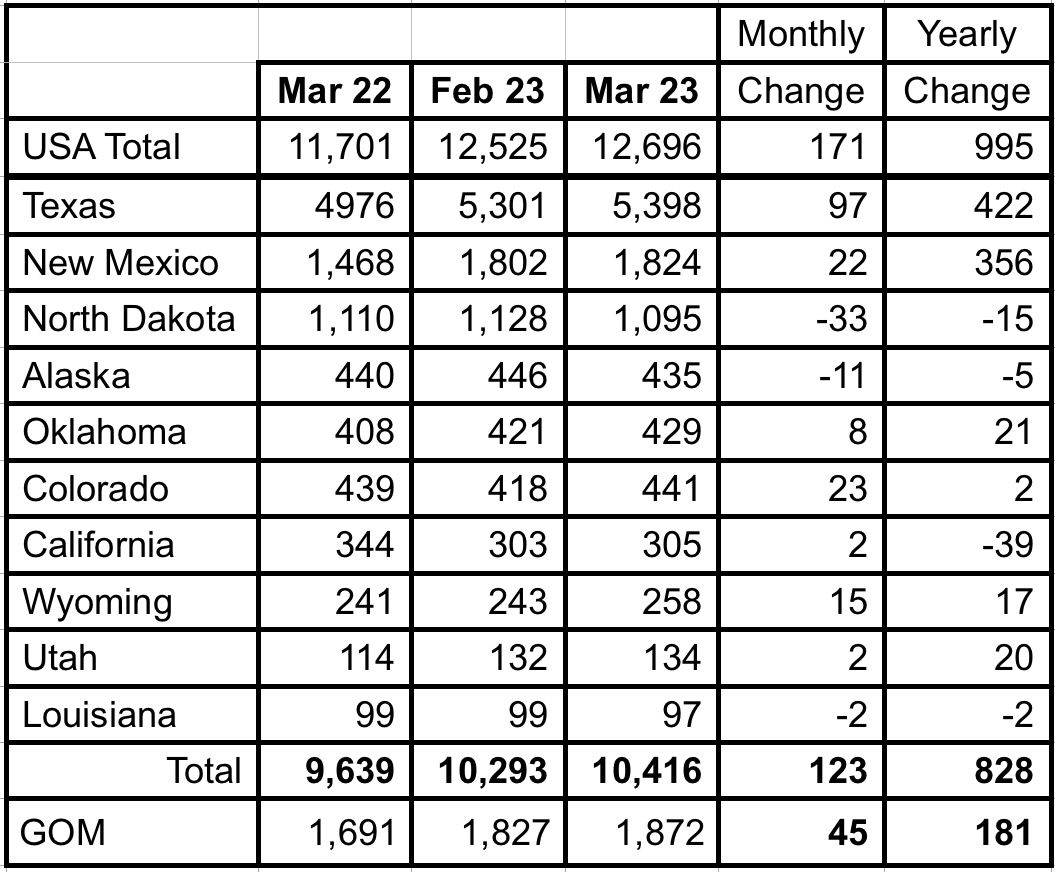
Listed above are the 10 states with the largest US oil production along with the Gulf of Mexico. These 10 states accounted for 82.0% of all U.S. oil production out of a total production of 12,696 kb/d in March 2023. Note that New Mexico oil production, if it keeps increasing as it did over this past year, could surpass the GOM in the near future.
On a YoY basis, US production increased by 995 kb/d with the majority, 778 kb/d having come from Texas and New Mexico.
State Oil Production Charts
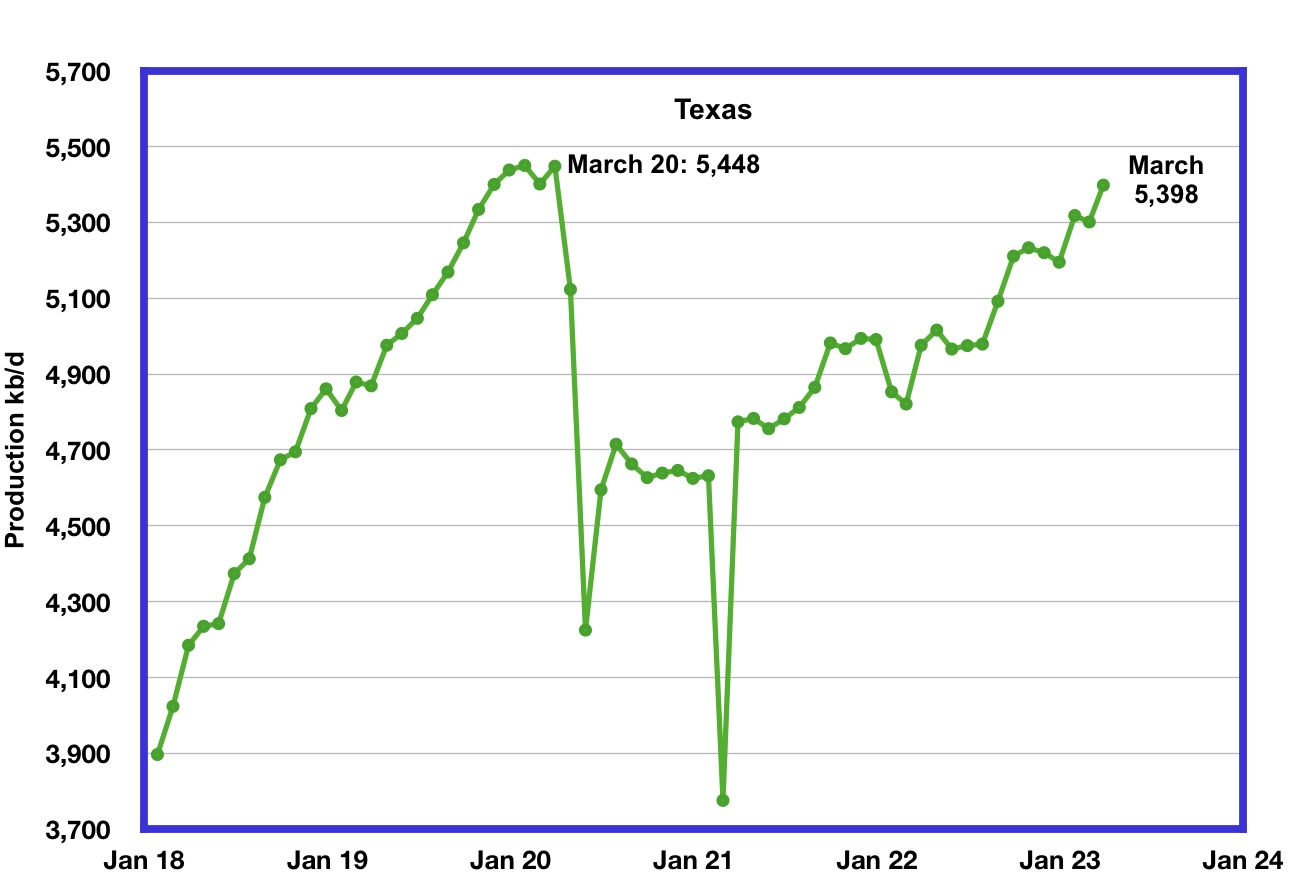
Texas production increased by 97 kb/d in March to a new post pandemic high of 5,398 kb/d. March’s output is 50 kb/d short of the March 2020 high of 5,448 kb/d.
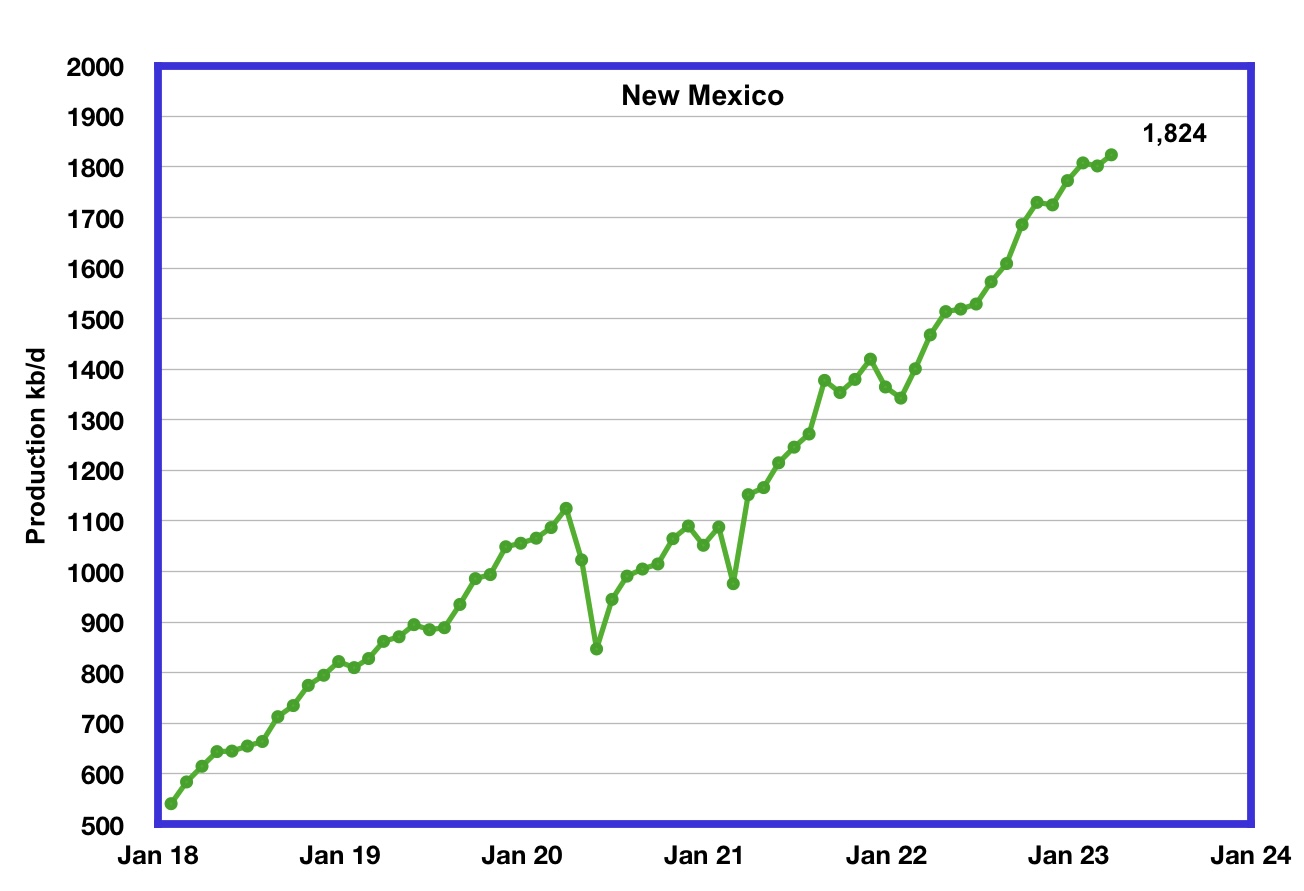
New Mexico’s March production continued at a record level but was little changed from February. March’s production increased by 22 kb/d to 1,824 kb/d.
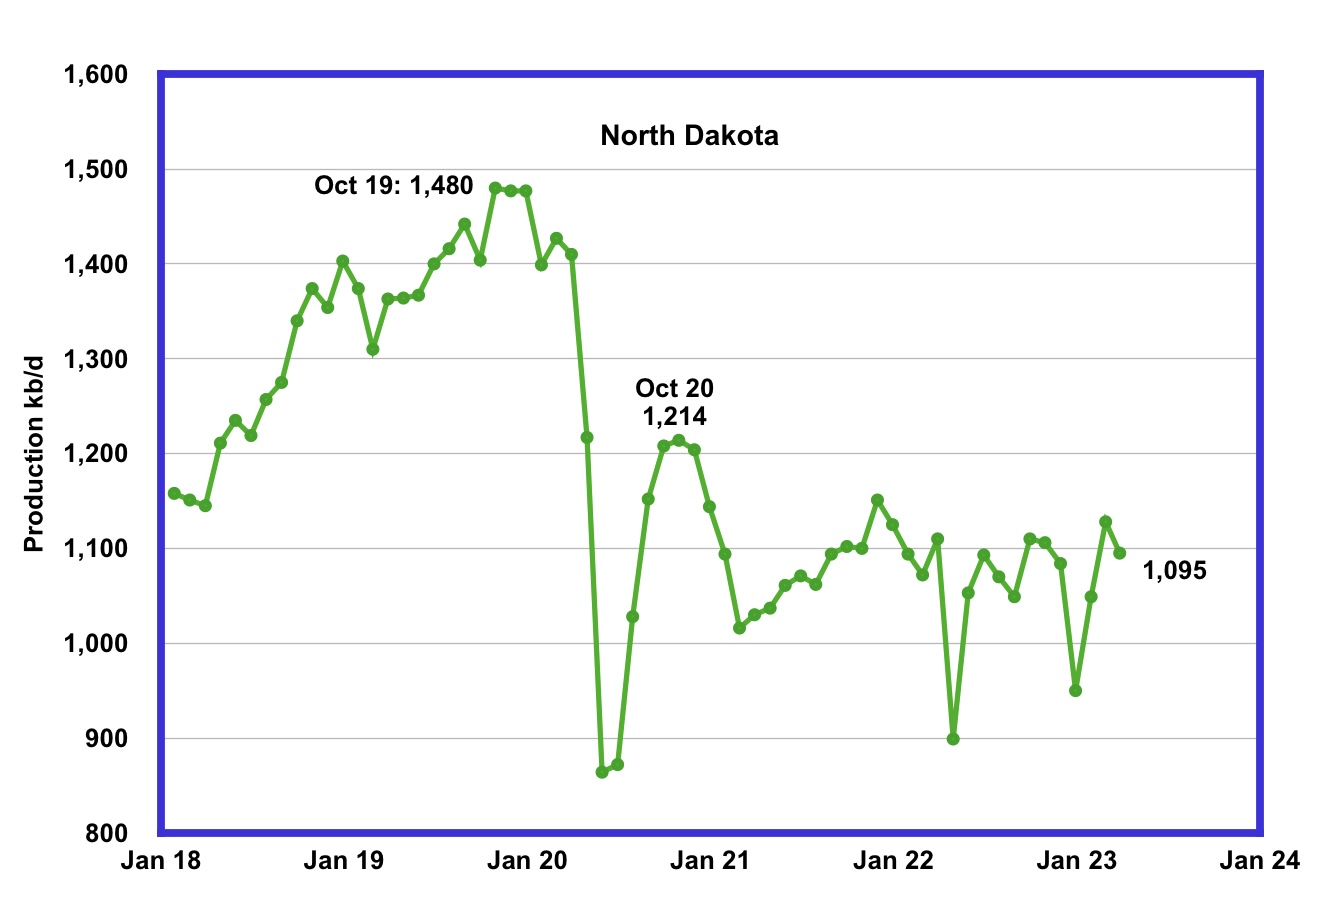
North Dakota’s March oil production has recovered from December’s extreme cold weather impacted production. However March’s output decreased to 1,095 kb/d, a drop of 33 kb/d from February. Current production is unchanged from January 2021 and production over the past two years is showing signs of being on a plateau.
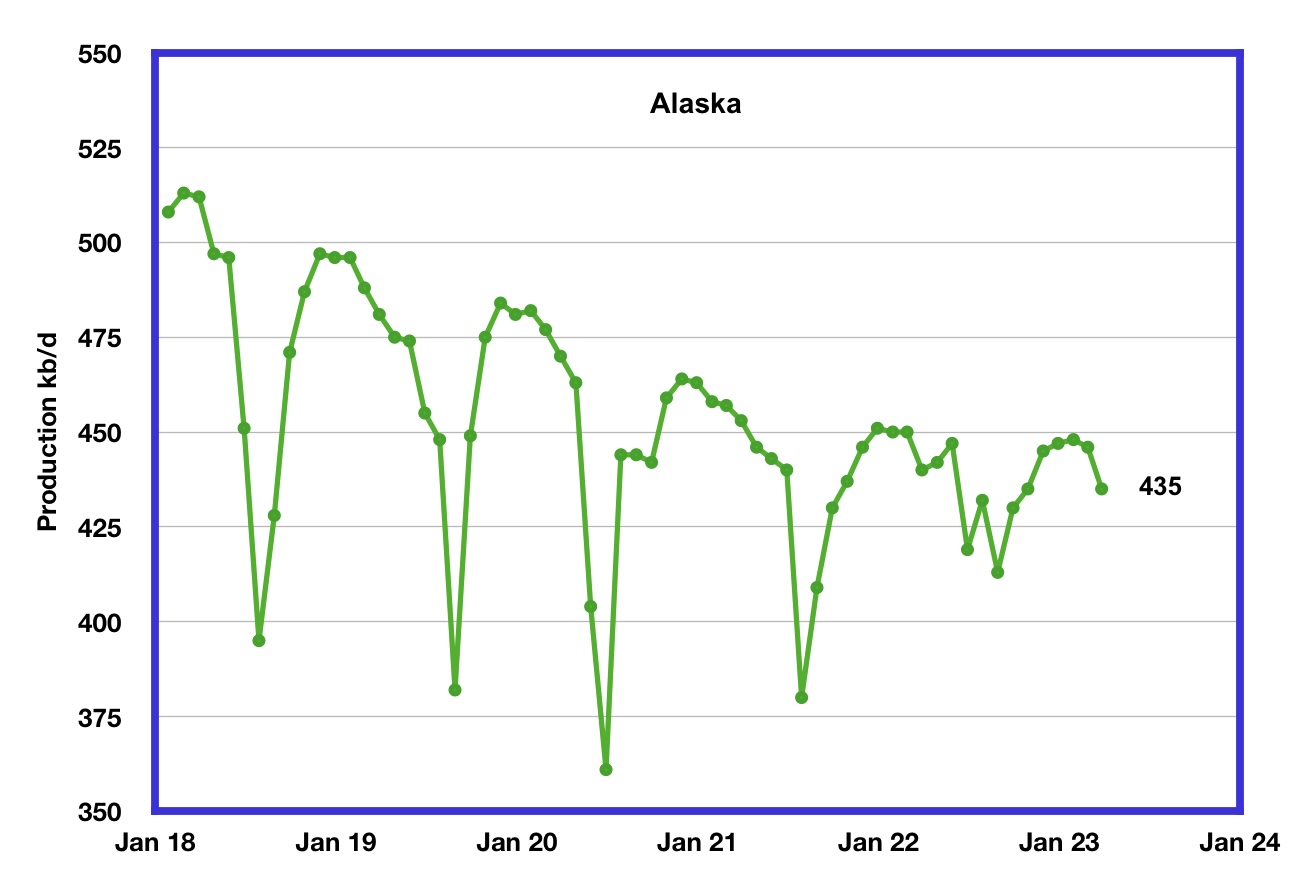
Alaskaʼs March output decreased by 11 kb/d to 435 kb/d. February/March is the beginning of Alaska’s annual production declining phase.
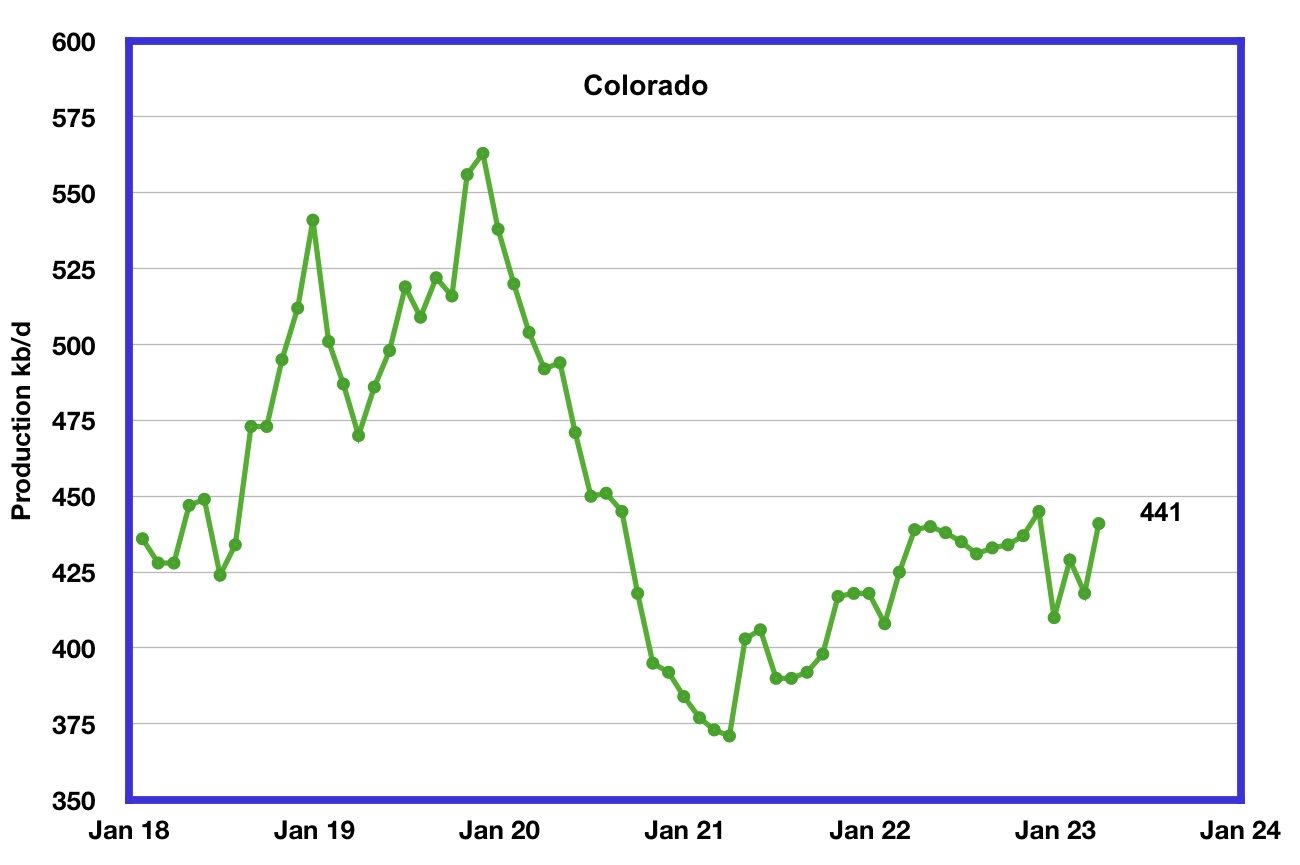
Coloradoʼs March production increased by 23 kb/d to 441 kb/d.
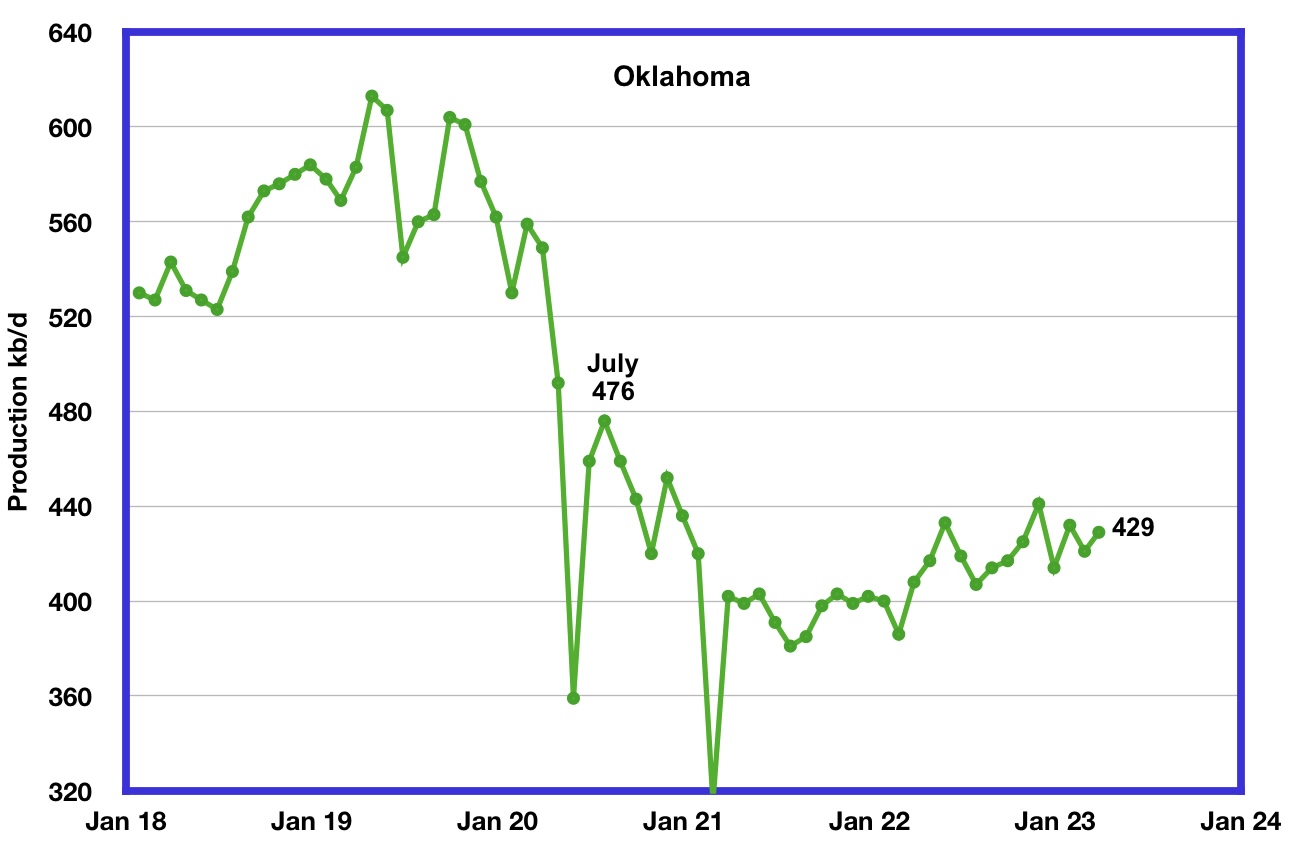
Oklahoma’s output in March rose by 8 kb/d to 429 kb/d. Production remains 47 kb/d below the post pandemic July 2020 high of 476 kb/d.
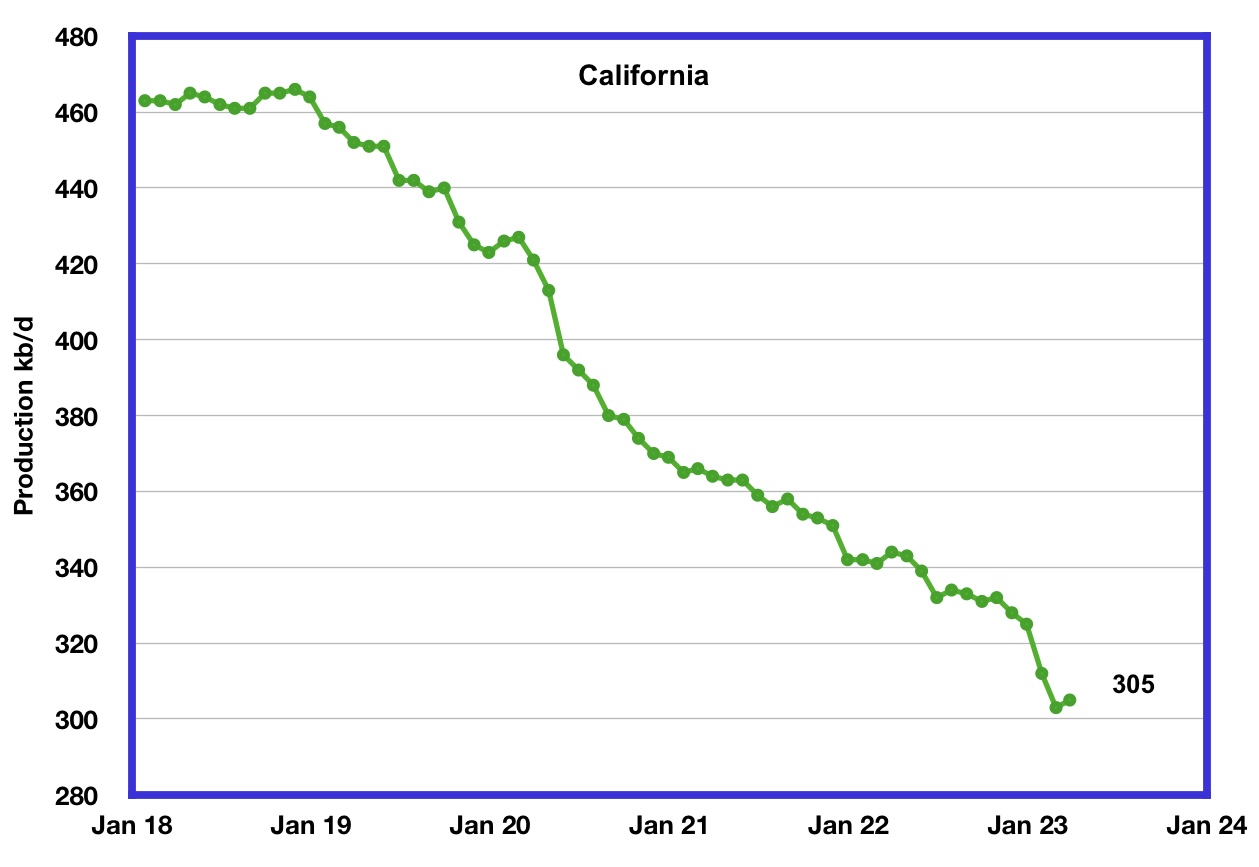
Californiaʼs overall slow output decline trend accelerated in January and February. However for March production rose by 2 kb/d to 305 kb/d.
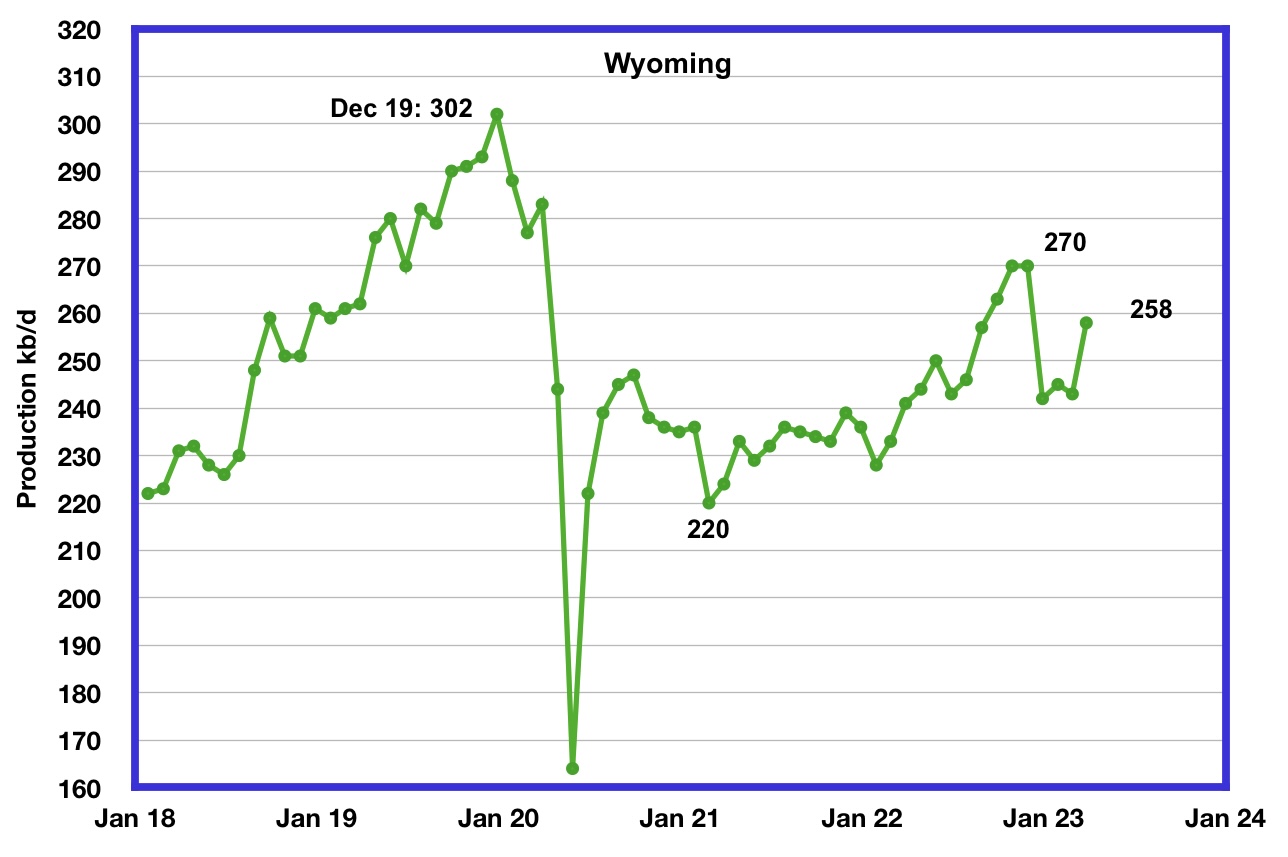
Wyoming’s oil production has been on a slow unsteady uptrend from the low of 220 kb/d in February 2021 due to increased drilling. October and November 2022 output reached a post pandemic high of 270 kb/d. March’s oil production increased by 15 kb/d to 258 kb/d.
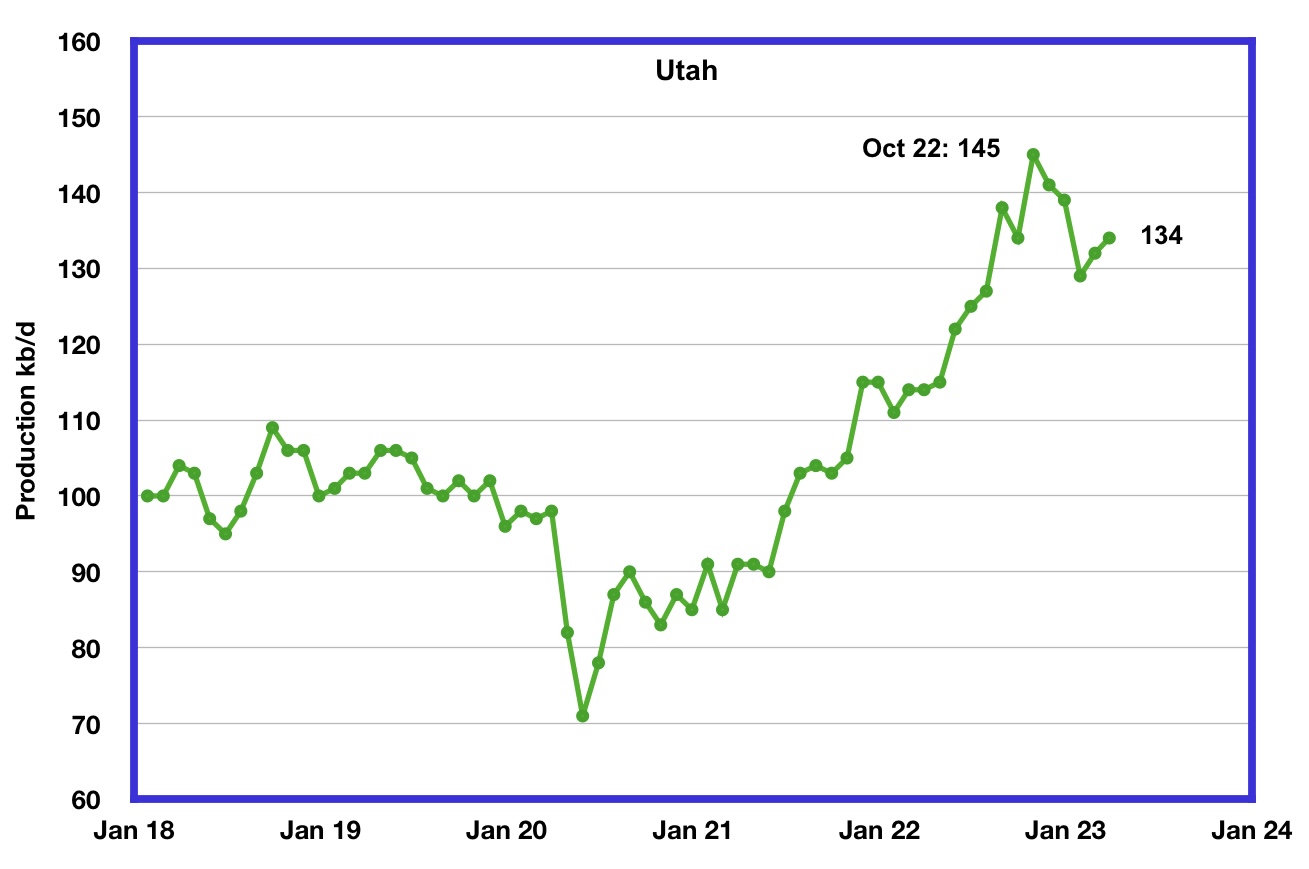
Utah’s oil production increased steadily since early 2021 and reached a new high of 145 kb/d in October 2022. However since then, production has declined by 11 kb/d to 134 kb/d in March.
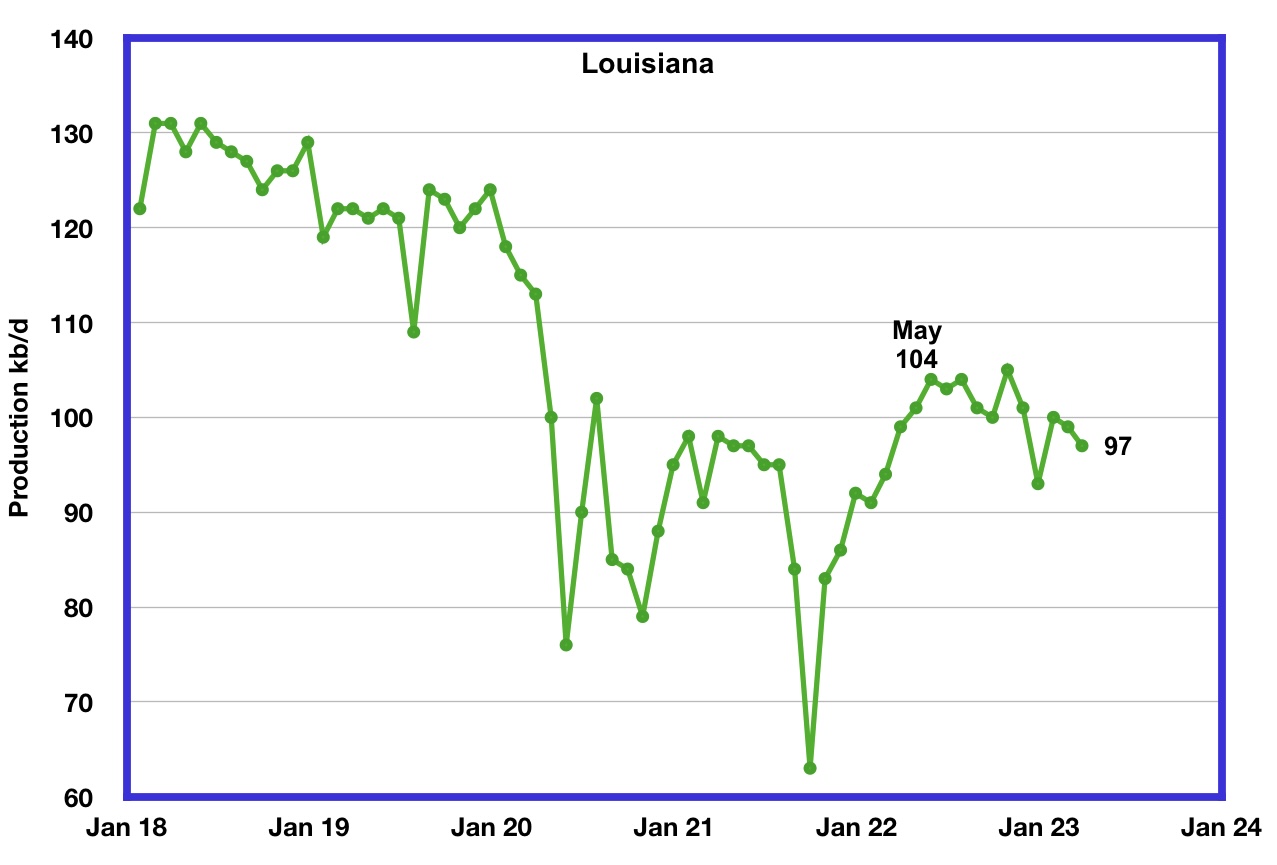
Louisiana’s output rose from the low of 63 kb/d in September 2021 to 104 kb/d in May 2022. Since then output has entered a slow decline. March’s production dropped by 2 kb/d to 97 kb/d and is 7 kb/d lower than May 2022.
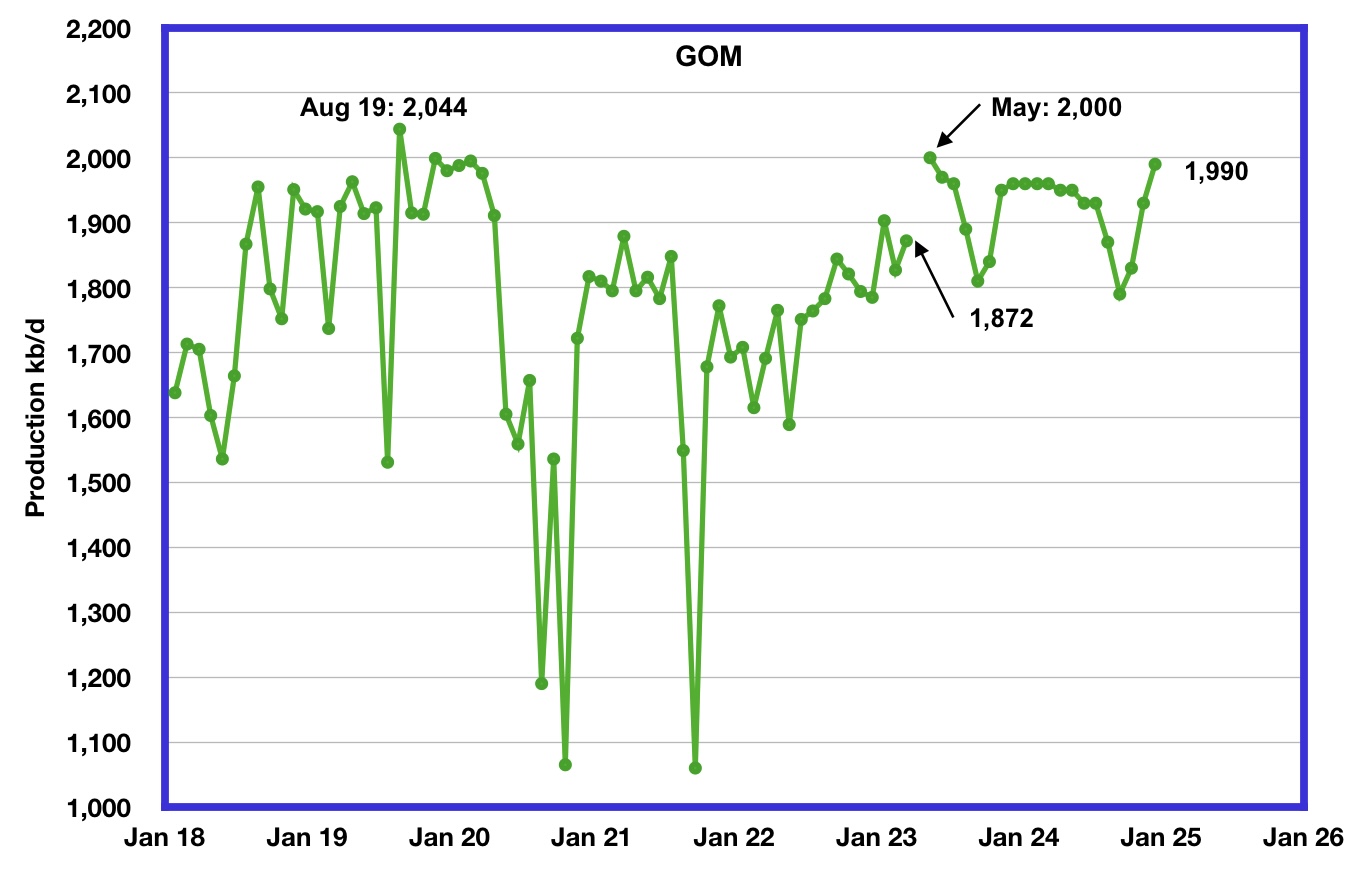
GOM production increased by 45 kb/d in March to 1,872 kb/d. If the GOM was a state, its production would normally rank second behind Texas.
The May 2023 STEO projection for the GOM output has been added to this chart and projects that output in May 2023 will rise to 2,000 kb/d. This could be a reasonable estimate since Shell announced that the Vito platform had begun production on February 15, 2023.
According to this source, GOM production is expected to reach 2,000 kb/d in 2023. “Annual GOM production fell from an all-time high of 1.9 MMBpd in 2019 due to the pandemic and hurricane-related interruptions, but production should be setting new records soon. For 2023, the Bureau of Ocean Energy Management (BOEM) expects a 14.7% increase in oil production from 2022 levels to 2.0 MMBpd. As shown in the chart below, (Note: Chart is shown in the link) production is forecasted to increase to 2.1 MMBpd in the middle of this decade and then level off at 1.9 MMBpd in 2030.”
It is not known if the GOM decline shown after May 2023 is related to extensive maintenance.
A Different Perspective on US Oil Production
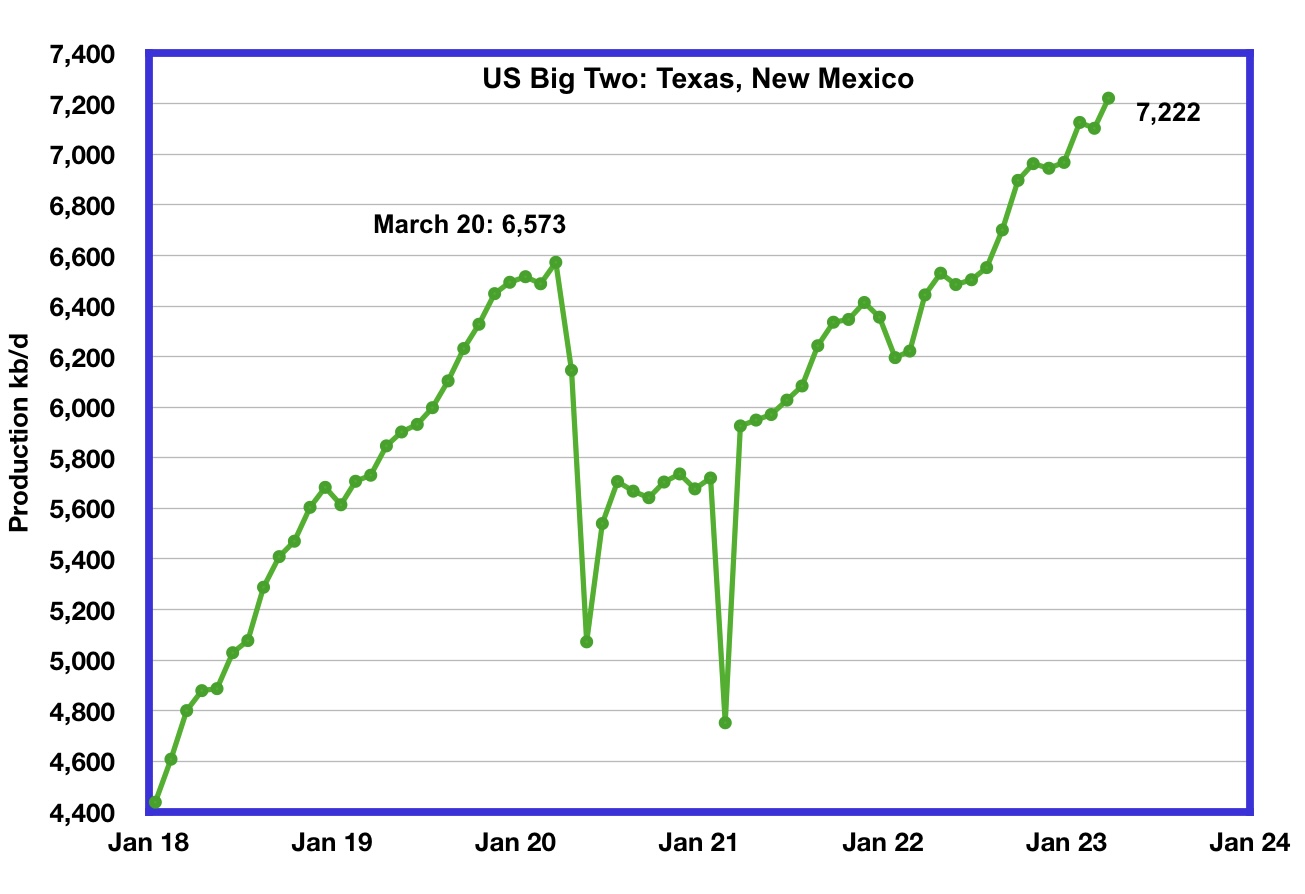
The Big Two states’ combined oil output for Texas and New Mexico.
March’s production in the Big Two states increased by a combined 119 kb/d to 7,222 kb/d with Texas contributing 97 kb/d while New Mexico added 22 kb/d.
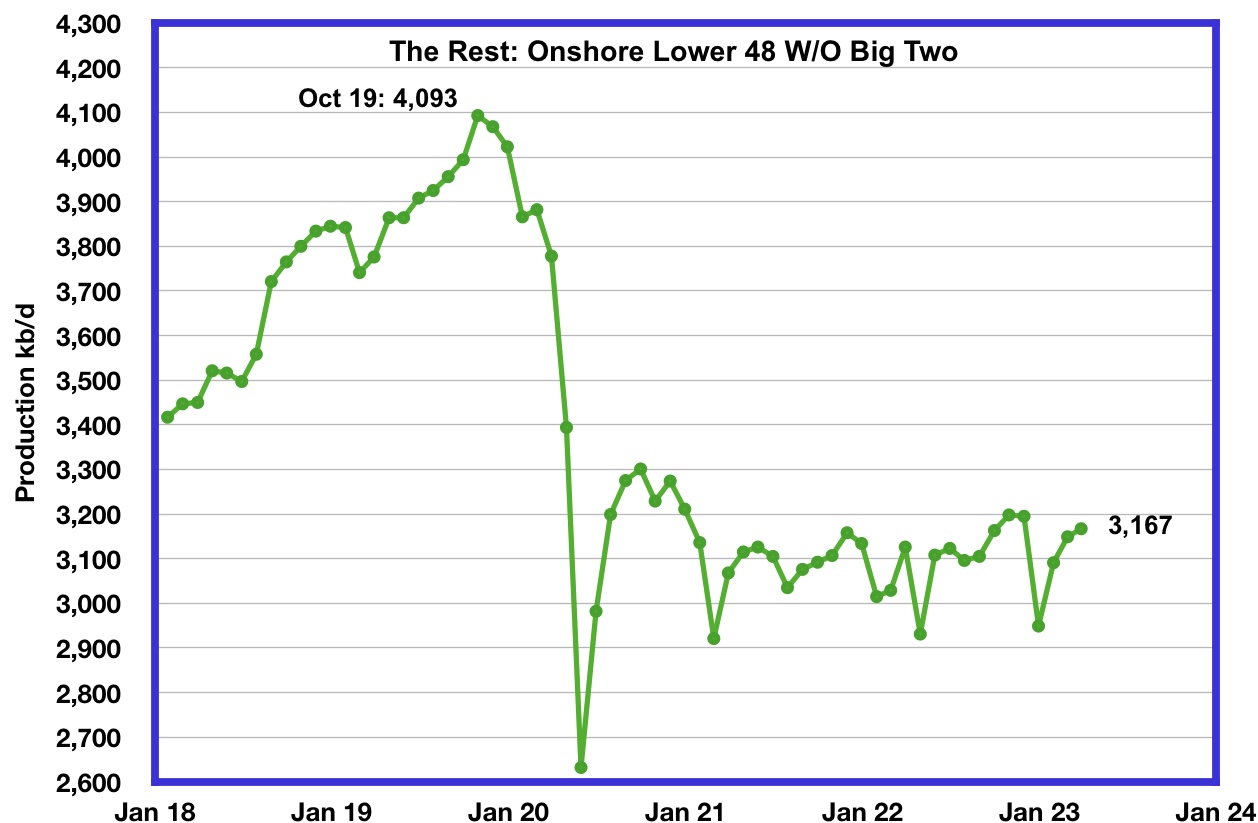
Oil production by The Rest
In March production in The Rest rose by 18 kb/d to 3,167 kb/d. From May 2021, oil production in The Rest has been range bound between 3,000 kb/d and 3,200 kb/d and has not given any clear indication of being in decline or rising.
The main takeaway from The Rest chart is that current production is 926 kb/d below the high of October 2019. The question we need answered is “Is this a permanent loss that will never be recovered?” All indications continue to be that this is a permanent loss.
Frac Spreads
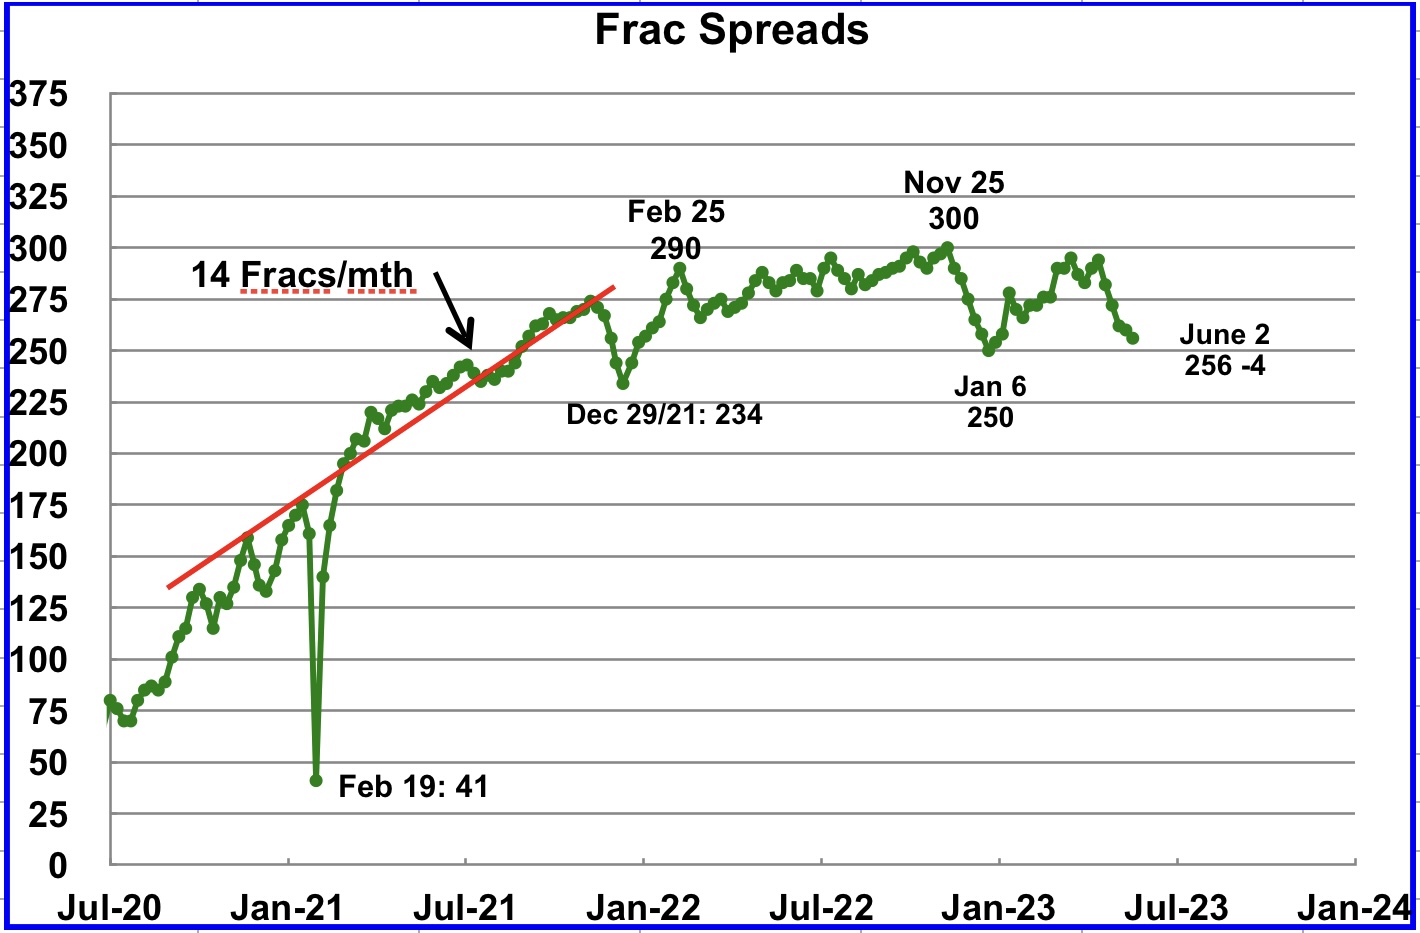
For frac spreads, the general trend since the week of January 6, 2023 can best be described as recovering from the slow down associated with the 2022 Thanksgiving and Christmas holidays. This trend is a repeat of what happened last year. However there is one difference. Last year the recovery took place over 9 weeks while this year it took 16 before the current plunge started.
Frac spreads have dropped by 10 for the last two weeks to 262 and are down 26 from a year ago and down 38 fro the high of 300 in November 2022. Note that both Hz oil rigs and frac spreads hit high in November 2022.
For the week ending June 2, the Frac count decreased by 4 to 256 and down 44 from the high of 300 in November 2022. When will the decrease in frac spreads result in a reduced oil production rate?
Note that these 256 frac spreads include both gas and oil spreads.
Drilling Productivity Report
The Drilling Productivity Report (DPR) uses recent data on the total number of drilling rigs in operation along with estimates of drilling productivity and estimated changes in production from existing oil wells to provide estimated changes in oil production for the principal tight oil regions. The May DPR report forecasts production to June 2023 and the following charts are updated to June 2023. The DUC charts are updated to April.
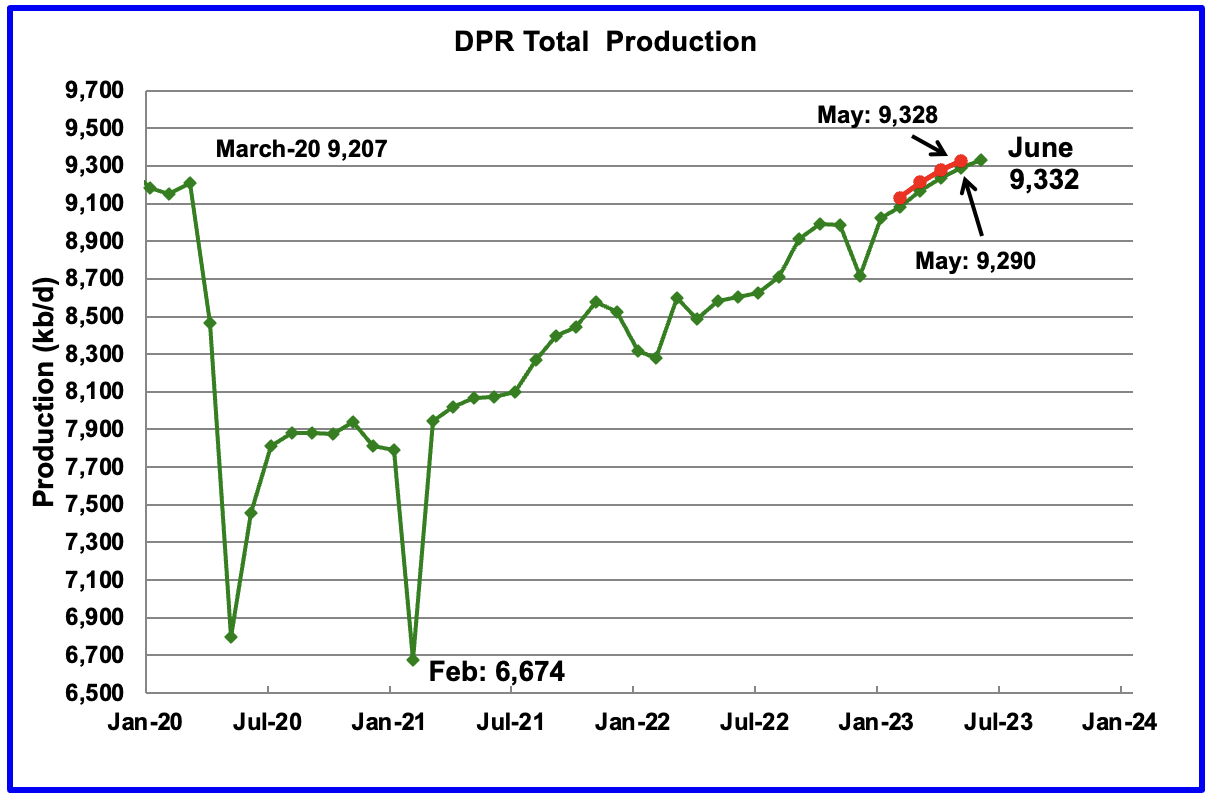
Above is the total oil production projected to June 2023 for the 7 DPR basins that the EIA tracks. Note that DPR production includes both LTO oil and oil from conventional wells.
The May DPR production report is essentially the same as the April report with minimal changes, due to downward revisions to the April report. For instance, May output, red markers, was revised down by 38 kb/d from 9,328 kb/d to 9,290 kb/d. The DPR is projecting that oil output for June 2023 will increase by 42 kb/d to 9,332 kb/d, a new all time high but still just 4 kb/d higher than was forecast in April.
Note the rolling over production trend over the past five months. See next chart.
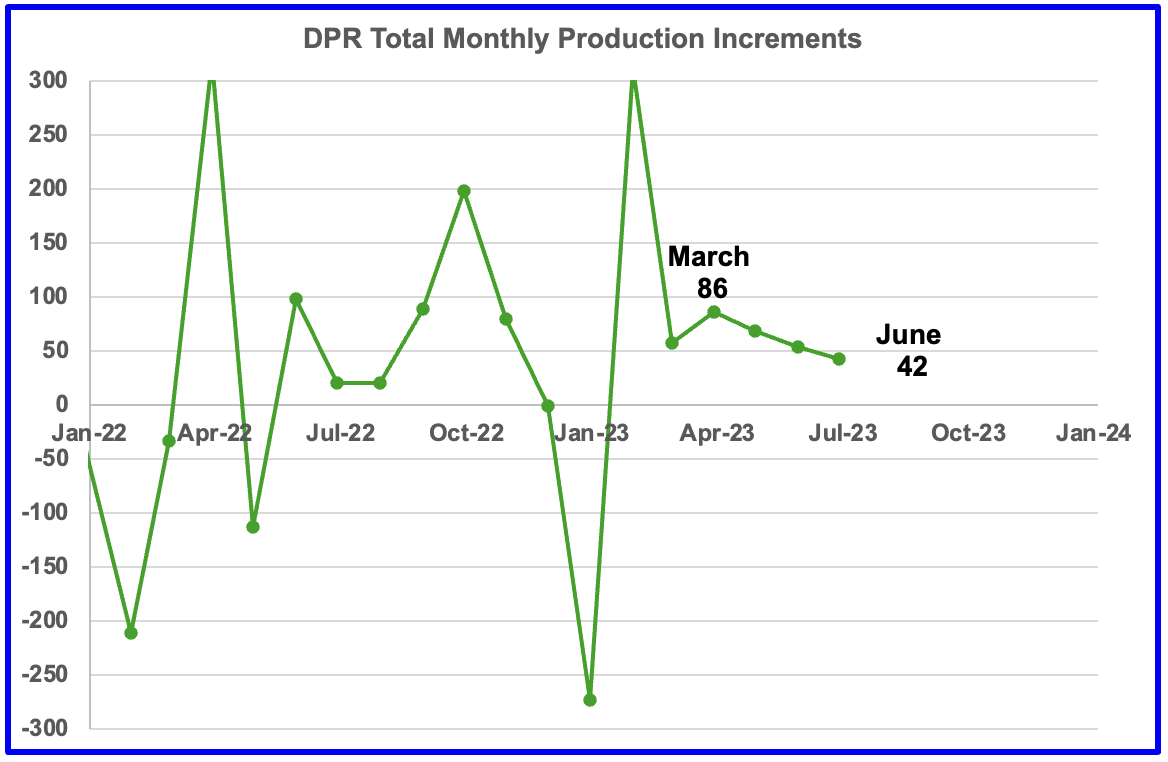
This chart shows the DPR total production increments tracked on a monthly basis. What is notable is the reduced month to month volatility since February 2023. The January 2023 spike is due to the weather related December oil production drop.
The more interesting trend to notice is the declining monthly changes in the production rate. March’s production increase was 86 kb/d/mth while June’s increase dropped by 44 kb/d/mth to 42 kb/d/mth. This short term trend is hinting at an upcoming plateau in Permian production, since it is the dominant producer. Even output at 42 kb/d/mth translates to 504 kb/d/yr, which is high.
The issue is whether this slowing trend is the result of management’s decision on how to deploy its revenue, investors vs production, or is it related to geology, fewer Tier 1 locations along with the Permian gassing out?
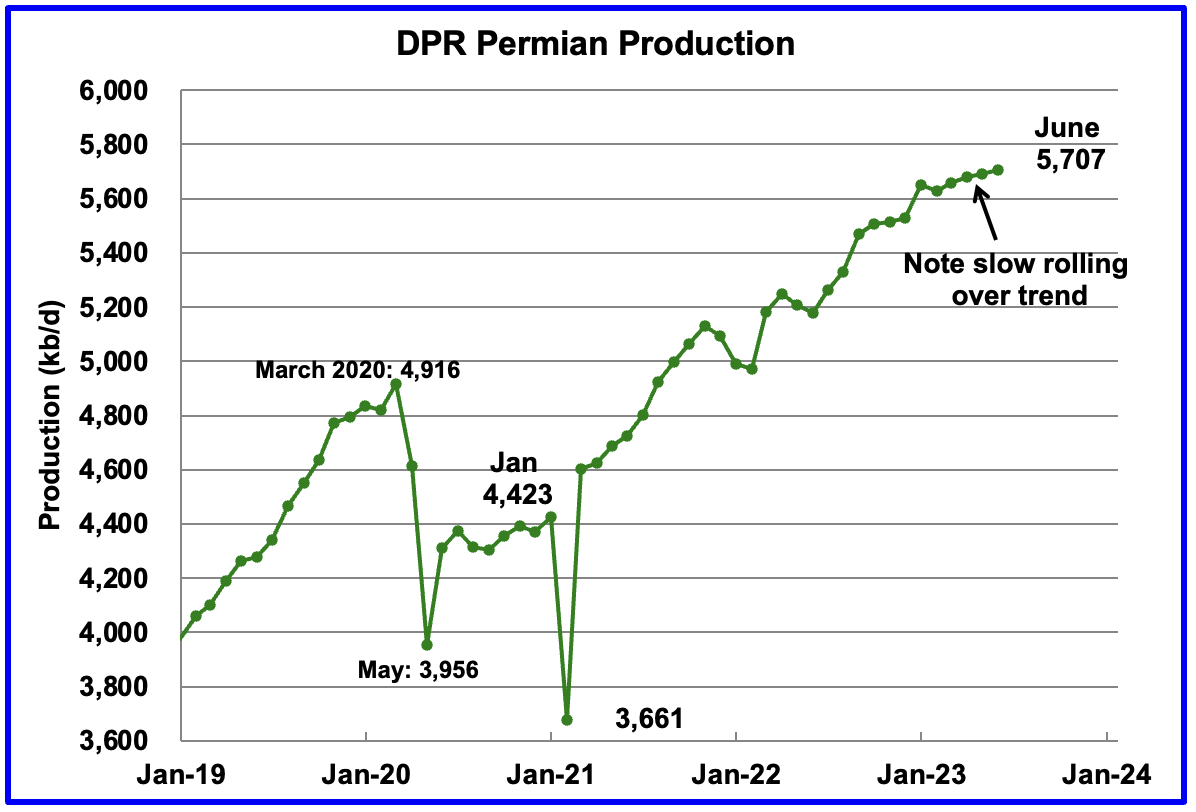
Permian output continues to rise in June. It is expected to increase by 15 kb/d to 5,707 kb/d.
If the Permian were part of OPEC, at 5,707 kb/d it would be the second largest producer after Saudi Arabia. June’s output is 791 kb/d higher than the pre-pandemic high 4,916 kb/d.
In March, the monthly production increase was 31 kb/d/mth. In June it drops to 15 kb/d/mth. This plateauing trend in the chart is very visible over the last four months, which is similar to the overall trend for the combined production in all of the DPR basins.
During April, 474 wells were drilled and 510 were completed in the Permian. (Note that April is the latest month for DUC information). The completed wells added 372 kb/d to April’s output for an average of 730 b/d/well. The overall decline was 350 kb/d which resulted in a net increase for Permian output of 22 kb/d. Of the 510 completed wells, 479 were required to offset the decline.
Note the increased use of DUCs to maintain production. For June, well completions exceeded drilled wells by 36 while for May, it was 32.
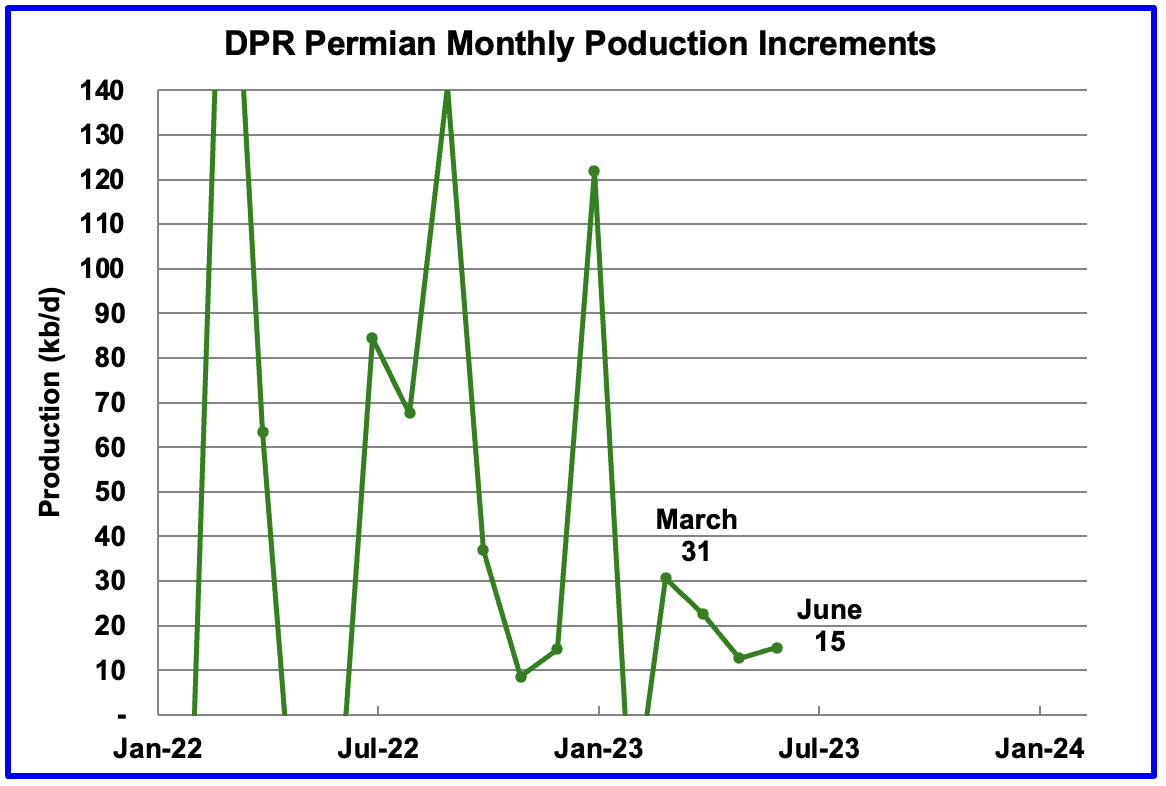
The DPR monthly increments for the Permian have been very volatile over the past year and a half but have settled down over the past 4 months and indicate that Permian production appears to be slowly rolling over as noted in the previous chart.
As can be seen in March, Permian production increased by 32 kb/d. In June it is expected to increase by 15 kb/d, 1/2 the March rate. May’s rate was 13 kb/d.
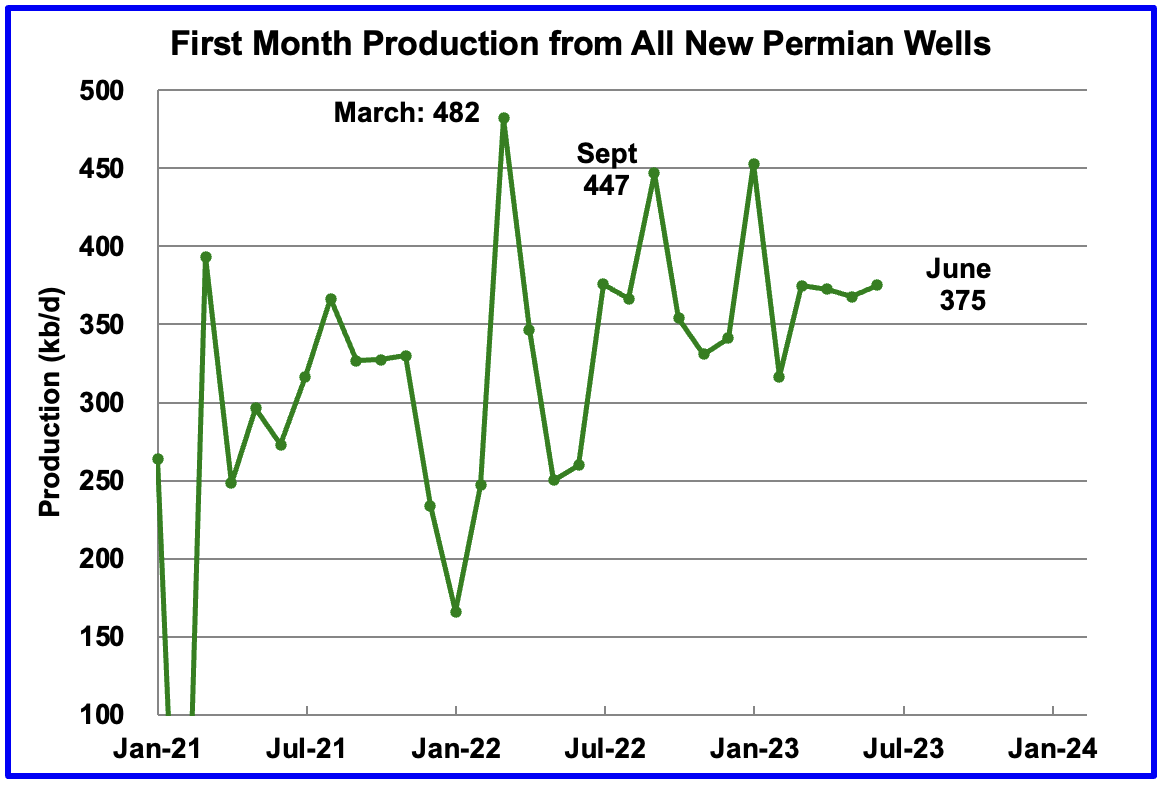
This chart shows the average first month total production from Permian wells tracked on a monthly basis. The total monthly production from the newest Permian wells in June continues to be at the 375 kb/d level. To achieve that production level in June, drillers completed 36 more wells than were drilled. In other words the Permian DUC count dropped by 36 and more DUCs are required to maintain production at a steady rate.
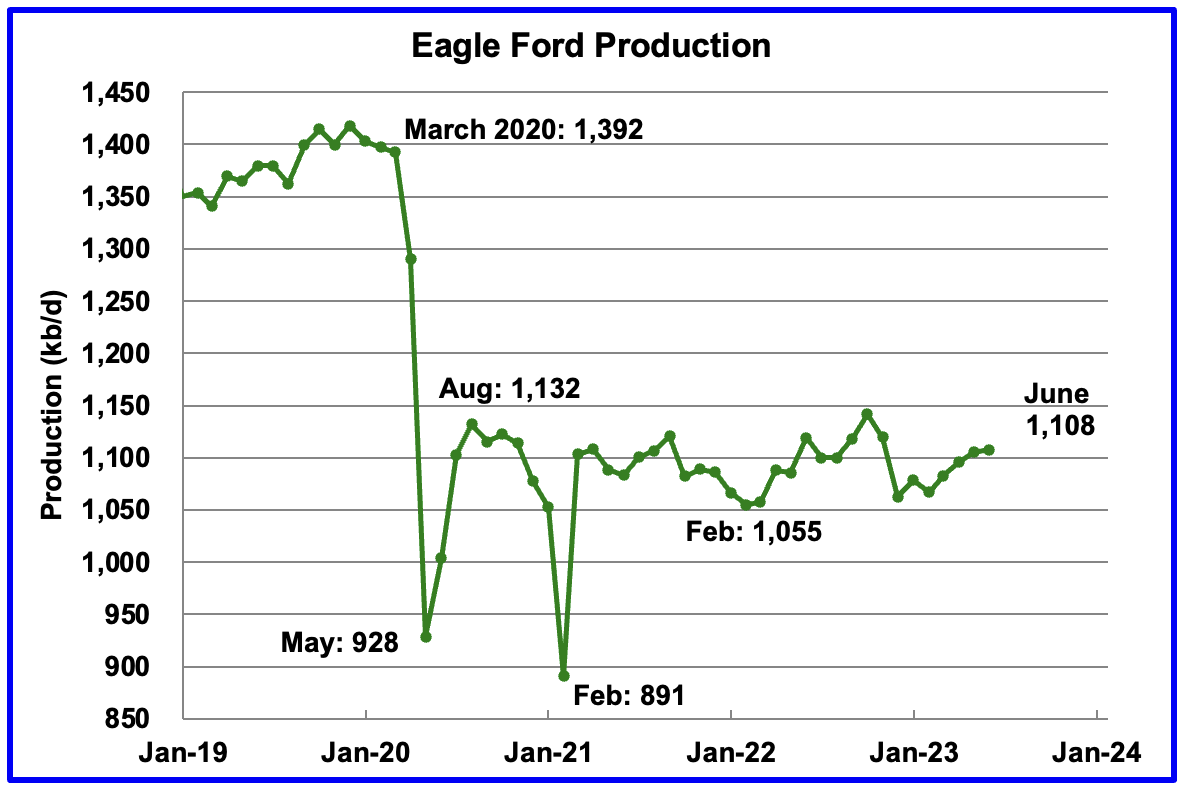
Output in the Eagle Ford basin has been in a generally flat trend since March 2021, fluctuating over a range of between 1,050 kb/d to 1,150 kb/d . Since the December 2022 weather induced production drop, production has been recovering slowly. June’s output is expected to increase by 2 kb/d to 1,108 kb/d. Revisions to May’s report has led to June’s output being 33 kb/d lower than the reported 1,141 kb/d in the May report.
At the beginning of the year 2023, 68 rigs were operating in the Eagle Ford basin. The rig count began to drop in mid March to 60 and dropped further to 59 in Mid May.
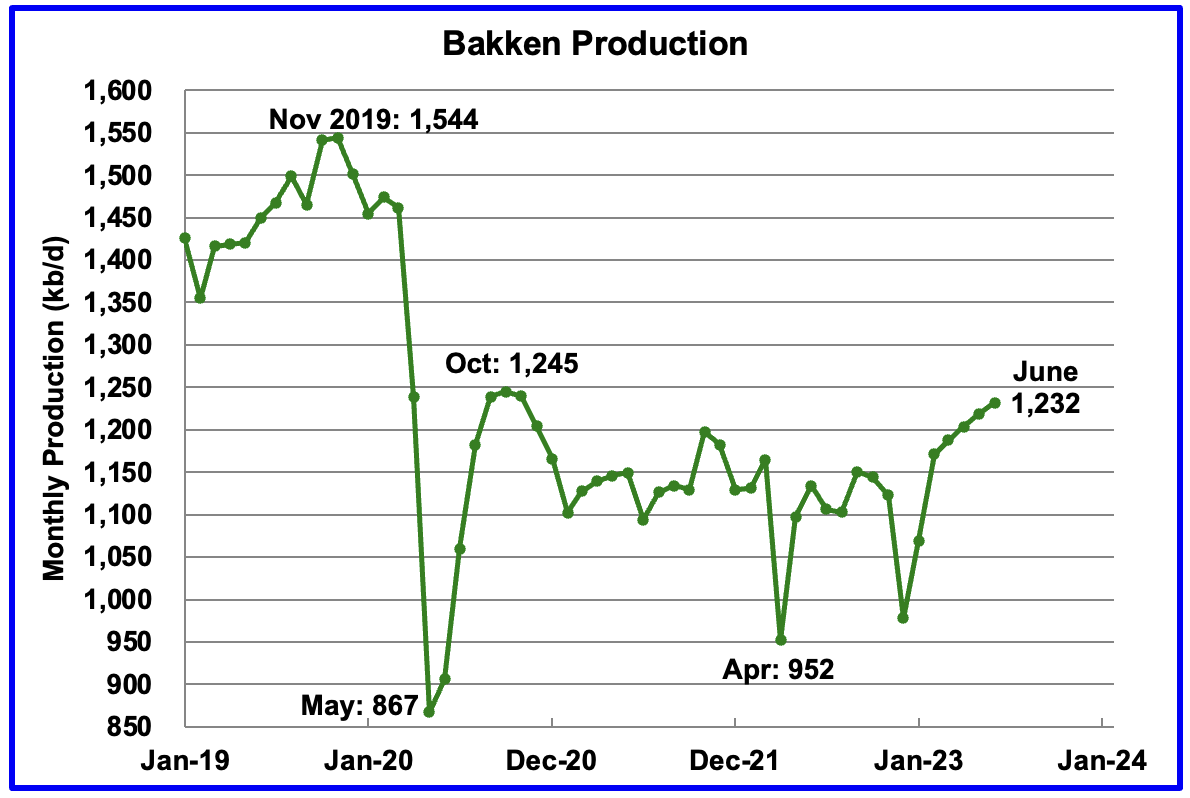
The DPR forecasts Bakken output in June will be 1,232 kb/d an increase of 13 kb/d over May.
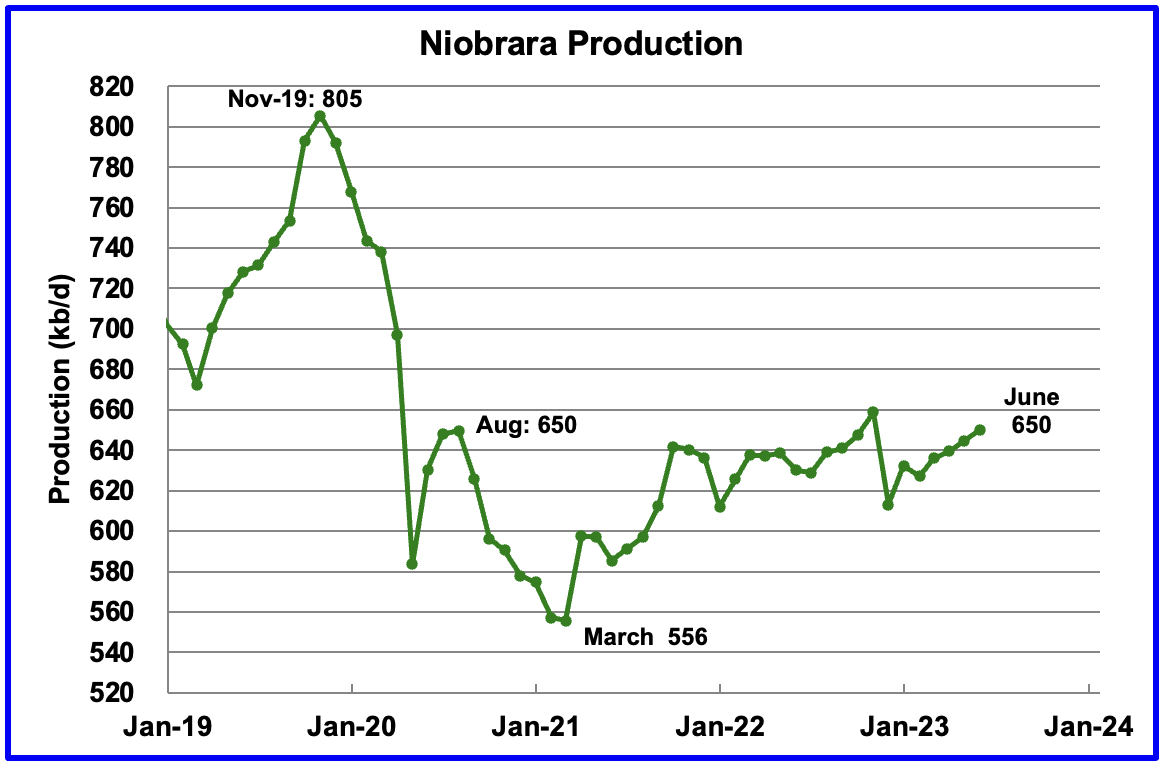
Output in the Niobrara continues to increase slowly. June’s output increased by 5 kb/d to 650 kb/d.
Production increased due to the addition of rigs into the basin but now has stabilized at 16 ± 1 rigs in April and May.
DUCs and Drilled Wells
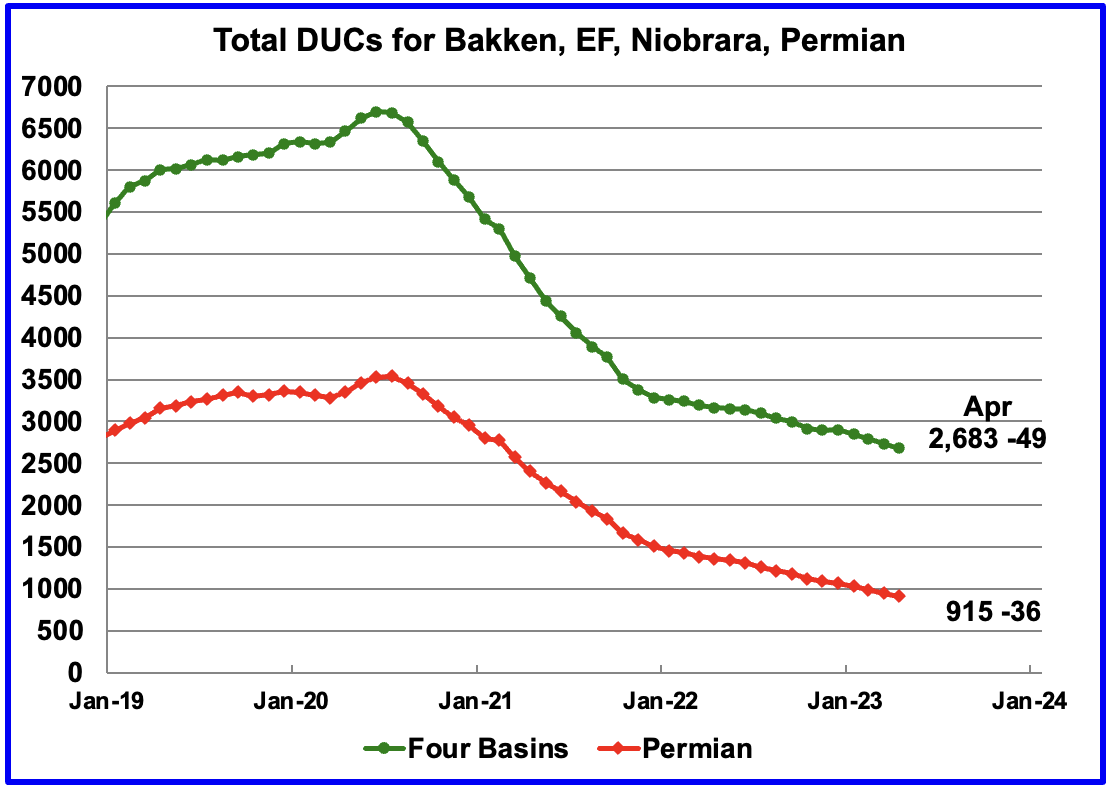
Again there has been a significant revision to the DUC data. In the May report, the total number of DUCs over the last five months were reduced by approximately 200. In the June report the DUCs have been revised back up by approximately 150.
The number of DUCs available for completion in the Permian and the four major DPR oil basins has fallen every month since July 2020 and continued to decrease in April. April DUCs decreased by 49, 21 more than in March. The biggest decrease came from the Permian where DUCs decreased by 36 while Bakken DUCs dropped by 12 and the Niobrara added 7.
The Permian basin had the similar revisions as the four basins. Permian DUCs were revised down in May and up in June. In June Permian DUCs were revised up by 150 and the monthly trend reverted to decreasing. April Permian DUCs decreased by 36 to 915 because 474 wells were drilled and 510 were completed.
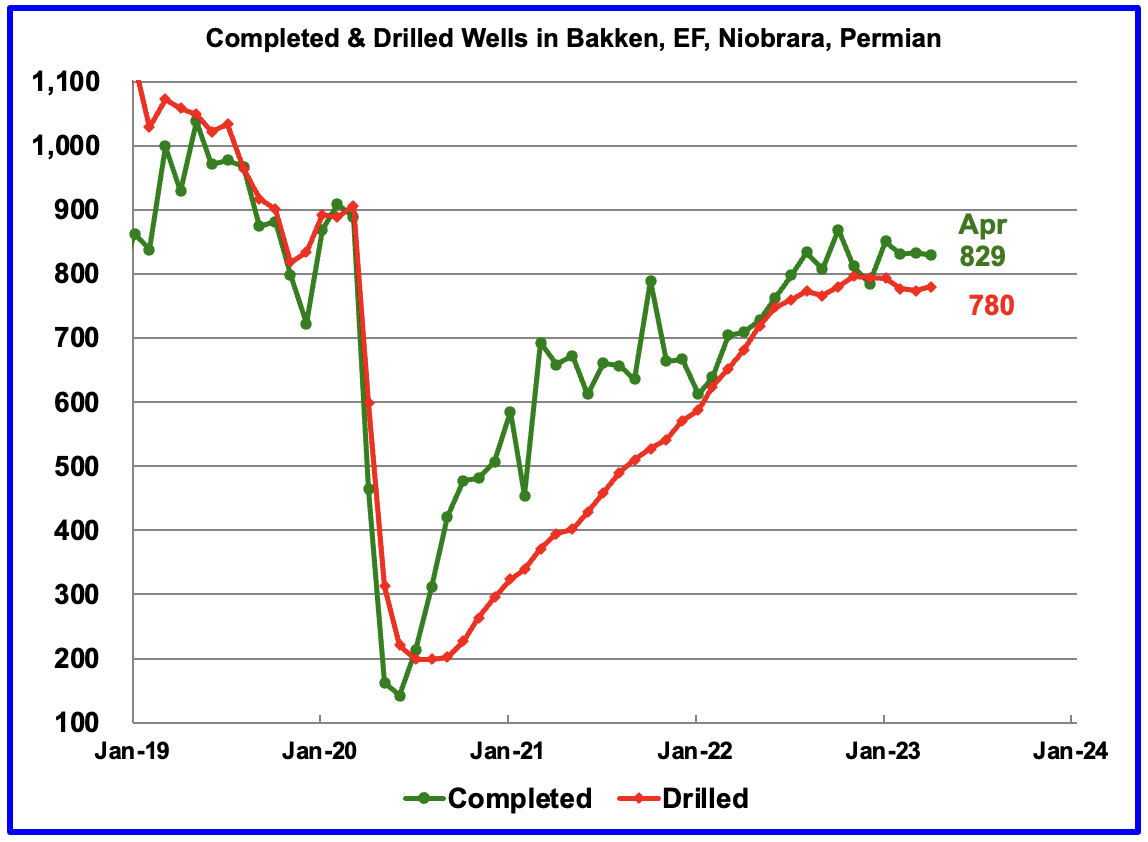
In these 4 basins, 780 wells were drilled while 829 were completed for a net decrease of 49 DUCs in April.
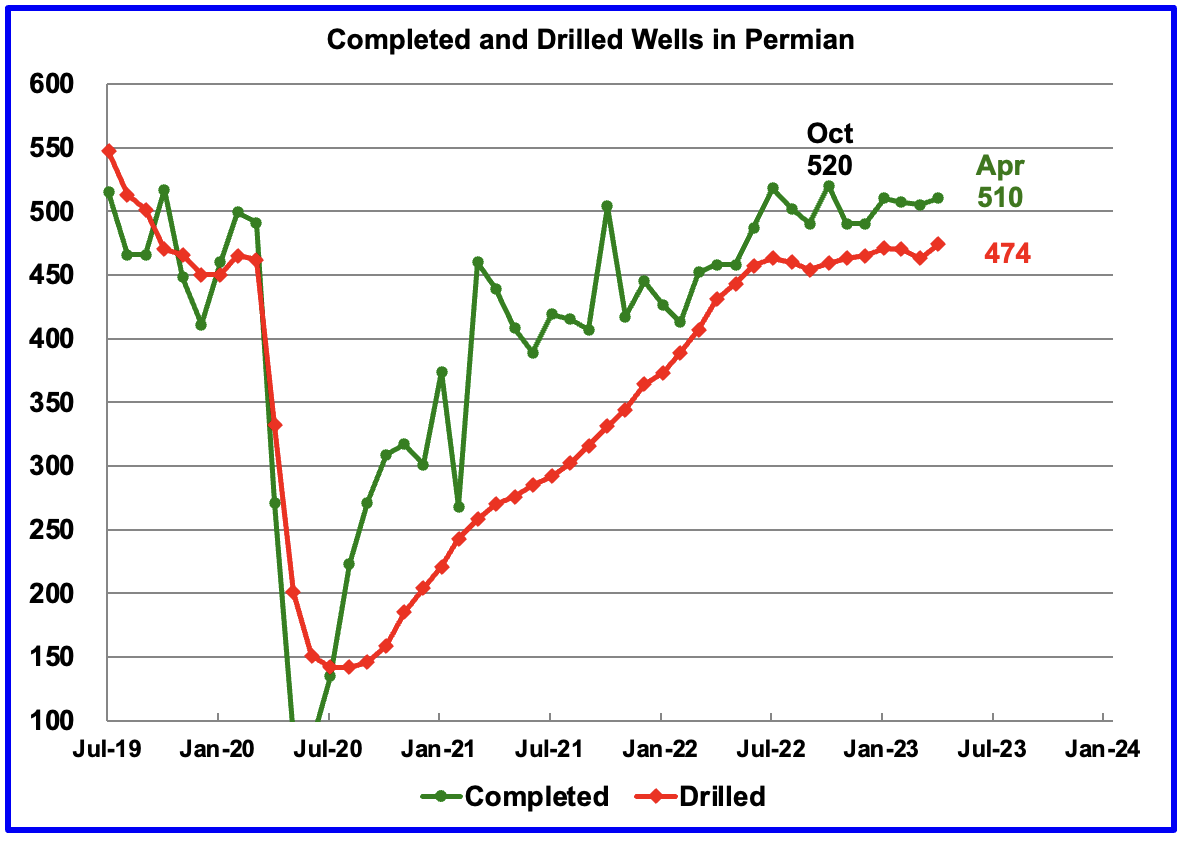
In the Permian, the monthly completion rate has been showing signs of stabilizing since the October high of 520. This is consistent with the frac spread chart shown above where there has been slow growth in frac spreads since February 2022. The number of wells drilled in the Permian is now showing signs of plateauing at the 475 level.
In April 510 wells were completed, an increase of 5 over March. During April, 474 new wells were drilled, an increase 11 over March February. The gap between completed and drilled wells in the Permian has now opened up to 36.
The Permian, as of April had 915 DUCs and the completion rate was 510 wells/mth. This means that the current cycle time between drilling and completions is 1.79 months or 55 days.
154 responses to “US March Oil Production at Post-Pandemic High”
Thanks for the update Ovi , it appears the US can be said to have “lost” 5 years (??) , from now on it gets interesting baecause the gains are not much . As for RoW and OPEC we shall see .
Forbin
Forbin
Thanks for the support.
The U.S. Rig Count and U.S. Frac Spread Count are out.
The rig count was down 15. They were all oil rigs. No change in gas rigs. The frac spread count was down 4. The frac spread count is not broken into gas or oil but they were likely all oil spreads as well.
Over the past 5 weeks oil rigs have dropped by 36 rigs while gas rigs were down 24. Total frac spreads have dropped by 38.
My two cents worth. The drop in rigs and frac spreads indicates that US shale production is about to drop.
With the number of rigs removed and assuming about two wells per month per rig I make it production in June, would be about 40 kbpd less than it would have been without the cuts, rising to 350 to 400 after a year. Given that the Permian seemed to be about to roll over from adding production to a plateau, and the other three were in slight but accelerating decline then LTO production could be down about 500 for the next year (assuming rig numbers stay constant from here, which is not going to happen, but I don’t think companies will add rigs until they can see prices consistently close to $90 for a few months and more likely is continual falls, despite KSA best efforts so decline to 750 kbpd might be more likely).
Ovi , 12,.696 mbpd is still lower than 13.00 mbpd . So peak USA is still Nov 2019 . That has been my mantra for the last three years . The projections of EIA ( Energy Inaccuracy Agency) to 2024 are BS as much as the employment figures of the BLS ( Bullshit labor statistics ) .
Acknowledgements :
Definition of EIA to Mike S .
Definition of BLS first seen in 2002 .
Ovi , you might get bored but ” what would we do without you ” . Just repeating myself . Be well .
HIH
Note my qualification: “a new post pandemic high.”
Ovi , I noted that . I was only lining up the ducks , as they say . 😉
Hole in head,
Note that the May STEO underestimated March 2023 output by about 100 kbpd.
All predictions of the future are BS, yours and mine included.
Also note for the April DPR, they had Permian completion rate at 465 in March 2023, the May DPR revised this to 508 completions for March and April 2023. That’s about a 9% increase in the estimate.
The DPR guesses after March 2023 are model based and depend only on rig counts, the model is flawed and the estimates after March 2023 are not very useful.
Dennis , I don’t know about your forecasts but my mantra ” Peak oil USA 2019 ” will hold . Take it to the bank . As they say ” the trend is your friend ” .
Not aware if this was posted here earlier , but still . Goehring and Racknowiz are serious analysts .
https://blog.gorozen.com/blog/podcast-peak-shale
interesting interview, back in the peak oil days there was the so called the bumpy plateau, we look to be into one at the moment
Hole in head,
First, one month of output means little, I focus on the centered 12 month average output of C plus C.
I also disagree that the STEO is worthless, it is imperfect, just like all forecasts, but it is as good or better than I can do.
For the US C plus C centered 12 month average, the peak was October 2019 at 12565 kb/d. If the May STEO forecast is accurate (it is likely to be revised higher on June 6 , 2023) the old CTMA peak will be surpassed by September 2023 and by July 2024 the CTMA will be 12687 kb/d, about 132 kb/d above the old CTMA peak.
So as usual I disagree.
The US peak is not worth arguing over. While there is no doubt that US oil production is slowing down, it may surpass the previous 2019 peak. But if it does, it will not be by much. The important thing is the world peak, not the US peak.
The World C+C peak was in November 2018 at 84,583,000 bpd. The world 12-month average peak was in January 2019 at 83,004,000 bpd. Neither of those peaks will ever be breached. And again, the US peak is not important.
We will see, I expect the 2018/2019 peak (depending on whether one prefers centered or trailing averages) will be surpassed in 2025, and perhaps in 2024.
Matt Mushalik is the “go to ” guy for info on Australia . His post on OFW is here . Aussies should fret more about this than China and the nuclear submarines distraction . Don’t take your eye away from the ball .
“The contribution of renewables might be small but without it, there would be load shedding. The situation will be different from State to State and country to country.
On the East Coast of Australia, the power supply is getting tight as unreliable, 50 year old coal fired power plants have to be shut down albeit without proper, timely replacement (e.g. wind plus pumped hydro, additional gas peakers)
Vivid Sydney 2023: Power price spikes during lack of reserve condition
31 May 2023
http://crudeoilpeak.info/vivid-sydney-2023-power-price-spikes-during-lack-of-reserve-condition
This lamentable state of affairs has come about due to a general energy blindness or energy illiteracy of the “system” comprising of governments, the private sector, the media and the uneducated public.
Electricity prices have gone up and this has become a political issue. The government blames the Ukraine war for higher gas and coal prices. But this covers up the supply capacity limitations.
This problem has grown to such an extent now that it is beyond academic debate. Demand must be reduced but the opposite is happening. New energy guzzling projects are approved and built: a 2nd Sydney airport plus aerotropolis and 100s of apartment towers to house new immigrants who have caused a housing crisis. This has also become a hot political issue. But the energy demand implications are not on the radar (yet)
I expect action will only be taken when the lights start to go out.
It will take years to fix:
Snowy Hydro 2.0 pumped-hydro battery project faces a further two years of delays
3 May 2023
https://www.abc.net.au/news/2023-05-03/snow-hydro-delayed-for-further-two-years/102295662
It also takes time to repair coal fired power plants
The never-ending (horror) story at Callide C … more long delays in expected Return-to-Service
20 May 2023
https://wattclarity.com.au/articles/2023/05/20may-the-never-ending-horror-story-at-callide-c/
A hydrogen explosion at Callide C4 in May 2021 had resulted in price spikes at the time:
14/6/2021
NSW power spot price spikes May 2021 become regular (part 2)
https://crudeoilpeak.info/nsw-power-spot-price-spikes-may-2021-become-regular-part-2
‘Structural failure’ at Callide C3 Power Station near Biloela leaves unit offline
1 Nov 2022
https://www.abc.net.au/news/2022-11-01/structural-failure-at-callide-power-station-c3-unit/101602444
The financial implications:
Callide C co-owner Genuity goes into voluntary administration
29 March 2023
https://www.afr.com/companies/energy/callide-c-co-owner-genuity-goes-into-voluntary-administration-20230324-p5cv4u
On my website on oil, I have recently done several posts on power supplies. This is because it is generally assumed that EVs will easily replace petrol and diesel vehicles. But this will be harder than people think due to power supply problems. ”
Thanks Matt or is it ” Mate ” . 🙂
Just for fun Tendulkar is better than Don .
You forget, Australia is the “LUCKY COUNTRY”
Its “No Worries Mate” for a reason
Andre , you are lucky till you ain’t .
Great job Ovi.
Thank you.
Not clear that completion rate dropped in May, probably too early to tell. I think the STEO may be revised higher in June. Were there significant revisions to the US crude data in the May PSM report?
Dennis
Thanks.
I think the biggest revision was with the Texas data. February was revised up by 37 kb/d which accounted for most of the overall revised up US February total of 42 kb/d.
Thx,
Only Jan and Feb were revised, all other months were unchanged from the April PSM, the revision for Jan was a bit less than Feb, about 35 kbpd.
Tight oil estimates were revised higher quite a bit from Oct to March close to 100 kbpd for Jan to March 2023, so a bit of a disconnect between PSM and official EIA tight oil estimate.
Good 5-minute video about Russian Oil and other energy-related subjects with Dan Yergin.
Russia cut oil production ‘but not as much as they say they have, says S&P Global’s Daniel Yergin
Horizontal Oil Rig Count from Baker Hughes for Permian Basin and US minus Permian Basin.
For most recent week (6/2/23) Permian 331 and US minus Permian 171, for week ending Nov 23, 2023 Permian 331 and US minus Permian 241.
Horizontal Oil Rig count for Bakken, Eagle Ford, Niobrara, and Other Basins (all except Permian Bakken, Eagle Ford, and Niobrara) Rig count shown for week ending November 23, 2022 and most recent week (June 2, 2023).
This last Chart for Horizontal Oil Rigs Combines Bakken, Eagle Ford, and Niobrara rigs together and compares with “Other Basins” from outside the major 4 basins (Permian, Bakken, Eagle Ford and Niobrara) and with the Permian Basin.
One year earlier (June 3, 2022) Permian Horizontal Oil rigs were 326, Bakken, Eagle Ford and Niobrara were 108 and “Other Basins” were 94. All of the decrease in the past 12 months was from the “Other Basins” group with a drop of 26 horizontal rigs. For the 4 major basins there was no drop in Horizontal oil rig count in the past 364 days (June 3, 2022 to June 2, 2023).
From EIA DPR, completion rates for Permian and sum of Bakken, Eagle Ford, and Niobrara. Last data point is April 2023, data is monthly rather than weekly as in rig count data.
US tight Oil Output for Permian, sum of Bakken, Eagle Ford and Niobrara (Bak, EF, Nio), and other basins besides the big 4. Data from May 2021 to April 2023.
Other basins tight oil, tight oil not produced in Permian, Bakken, Eagle Ford, or Niobrara.
Four Permian Basin scenarios with the completion rate currently at around 500 per month in April 2023. One scenario assumes the completion rate remains at 500 per month until the end of 2030 and then completion rate gradually falls to zero by June 2036, the other scenarios have the completion rate falling by 20 wells per month until reaching 450, 400, and 350 wells per month with the completion rate then constant until Dec 2030 and then with completion rate falling to zero by 2036.
My guess is the 450 completion rate scenario is most likely with the likely range between the 400 and 500 completion rate scenarios. I doubt the lowest of the 4 scenarios will be correct unless we have a very severe World recession that is long lasting (5 years or more).
The 500 well scenario has a URR of 47 Gb (USGS F95 TRR estimate is 45 Gb for Permian basin) with a total of 112.5 thousand wells completed from Jan 2010 to Dec 2036 (no completions after that date).
Using USGS estimates for Wolfcamp A and B, lower Spraberry, and 2nd and 3rd Bonespring Formations and assuming 293 acres per well (10k by 1320 feet) there are about 136.7 thousand potential well locations in those 5 formations, plus other formations that have already had wells completed through Dec 2022 (I assume no futher completions in those less productive formations in the future.) Even the highest of these scenarios might be a bit conservative, especially if oil prices remain at $80/bo or higher for the next 8 years or so and natural gas prices rise to $3/MCF with NGL at $27/b or so. Note that about 40500 horizontal tight oil wells had been completed in the Permian through Dec 2022, with about 96 thousand remaining locations in these 5 formations (Wolfcamp A and B, Lower Spraberry, and 2nd and 3rd Bonespring.)
There is significant variation in different sub-basins and formations in the Permian Basin. Generally wells have higher productivity in the Delaware basin for the Wolfcamp A formation particularly the Wolfcamp A (XY), the Wolfcamp B (both in Midland and Delaware) and Spraberry Formations tend to have lower productivity.
The chart below does not divide the Midland form Delaware basin but selects these formations (Wolfcamp A and B) and 2nd and 3rd Bonespring Formations (Delaware basin only) and Spraberry Formation (Midland basin only). About 80% of all Permian horizontal tight oil wells completed to date were completed in these 5 formations.
Chart from Novilabs link below
https://novilabs.com/blog/permian-update-through-january-2023-1/
Saudi plans new oil cuts as part of OPEC+ deal, sources say
VIENNA: Saudi Arabia will pledge new voluntary production cuts as part of a broader OPEC+ output-limiting deal, sources told Reuters, as the group faces flagging oil prices and a looming supply glut.
The group, known as OPEC+, delayed the start of formal talks by over six hours due to members’ discussions of production baselines, from which cuts and quotas are calculated, sources said.
Two separate OPEC+ sources said the group was likely to agree a policy roll over for 2023 and make additional cuts in 2024 if new production baselines for members are agreed. It was not clear when Saudi cuts would begin.
Oil jumps 3% on US debt ceiling progress, OPEC+ in focus
OPEC’s most influential members and biggest Gulf producers led by Saudi Arabia were trying to persuade under-producing African nations such as Nigeria and Angola to have more realistic output targets, sources said.
“Talks with African producers are proving to be difficult,” one OPEC+ source said. Gulf producer, the United Arab Emirates, was meanwhile seeking a higher baseline to reflect its growing production capacity, sources said.
OPEC+, which groups the Organization of the Petroleum Exporting Countries and allies led by Russia, pumps around 40% of the world’s crude, meaning its policy decisions can have a major impact on oil prices.
More details on OPEC cuts
https://www.livemint.com/market/commodities/opec-reaches-agreement-to-extend-oil-output-cuts-into-2024-report-11685894147482.html
So, with that, what is the point of OPEC, still less OPEC+, anymore? UAE is going to add production, KSA is the only member who can voluntarily make cuts. Iraq may eventually add capacity as investment and expertise from TotalEnergie gets going, everyone else is at the whim of sanctions and other geopolitics or in long term decline with possible short term increases depending on a few new developments or how maintenance is scheduled. Russia is probably not choking back but its decline is accelerating because it has lost the west’s investments and development and engineering capacity (the loss of specialist expertise is likely to make more difference in long term recovery numbers than short term production, plus plant availability is likely to slowly degrade as specialist maintenance and spare parts become unavailable).
This is behind a paywall but I clicked on the link that it can be gifted to friends. I am not sure if it works.
https://www.wsj.com/articles/saudi-arabia-some-opec-members-clash-over-oil-production-quotas-87f43f0c
“The prospects of seeing Brent below $70 per barrel is much more frightening than the prospect of a less balanced market,” said Viktor Katona, a senior analyst at data-commodities agency Kpler.
RIYADH — Saudi Arabia will implement an additional voluntary cut in its oil production, amounting to one million barrels per day, starting in July for a month that can be extended, an official source in the Ministry of Energy announced on Sunday.
This will put the Kingdom’s oil production at 9 million barrel per day, and the Kingdom’s total voluntary cut will be 1.5 million barrels per day.
The source explained that the Kingdom’s additional voluntary cut comes to reinforce the precautionary efforts made by OPEC+ countries with the aim of supporting the stability and balance of oil markets.
“An official source in the Ministry of Energy in Saudi Arabia announced that, in addition to what was agreed upon in the OPEC+ meeting today, June 4, 2023, for the required production level for each country for the year 2024, and what the OPEC+ countries that previously announced in April voluntary cuts until the end of 2023 and extended their voluntary cuts until the end of 2024, the Kingdom will implement an additional voluntary cut in its oil production,” the statement read. — SG
Thanks guys, this just popped up a few minutes ago. I don’t know if there is anything new here or not.
Saudi to cut oil output in July, OPEC extends deal into 2024
VIENNA, June 4 (Reuters) – Saudi Arabia will make deep production cuts in July as part of a broader output-limiting OPEC+ deal as the group faces flagging oil prices and a looming supply glut.
Saudi Energy Minister Prince Abdulaziz said the cut of 1 million barrels per day (bpd) by Riyadh could be extended beyond July if needed. “This is a Saudi lollipop,” he said.
OPEC+, which groups the Organization of the Petroleum Exporting Countries and allies led by Russia, reached a deal on output policy after seven hours of talks and decided to reduce overall production targets from 2024 by a further total of 1.4 million barrels per day.
However, many of these reductions will not be real as the group lowered the targets for Russia, Nigeria and Angola to bring them into line with their actual current production levels.
By contrast, the United Arab Emirates was allowed to raise output.
OPEC+ pumps around 40% of the world’s crude, meaning its policy decisions can have a major impact on oil prices.
OPEC+ already has in place a cut of 2 million bpd agreed last year and amounting to 2 percent of global demand.
In April, it also agreed a surprise voluntary cut of 1.6 million bpd that took effect in May until the end of 2023.
Saudi Arabia said on Sunday it would extend its portion of voluntary cuts of 0.5 million bpd into 2024. It was not clear if the July reduction of 1 million was on top of 0.5 million bpd or the latter would be included in the July reduction.
The April announcement helped to drive oil prices about $9 per barrel higher to above $87, but they swiftly retreated under pressure from concerns about global economic growth and demand. On Friday, international benchmark Brent settled at $76.
Western nations have accused OPEC of manipulating oil prices and undermining the global economy through high energy costs. The West has also accused OPEC of siding with Russia despite Western sanctions over Moscow’s invasion of Ukraine.
OPEC targets
Seppo
When I posted my few numbers, your post wasn’t there. Can’t figure out how that happens.
Ovi, I can tell you exactly why that happened. Seppo’s posts, along with several others’ posts, must always be approved. Seppo posted before you, but his post did not appear because it had not been approved. When I did approve it, it was placed before yours, where it belonged.
There are a few others who fall into this category, including Twocats. Also, any poster that has never posted before, their post must be approved. I have no idea why these folk’s posts must be approved and others do not. The posts from these people always go to the pending file, and there they sit until someone, either you, Dennis, or I, checks the pending file. However, it appears I am the only one who ever checks the pending file.
On some days, I approve up to six or more posts. On other days, none. If I were to die, or quit posting for any reason, these guy’s posts would never get approved, and there would never be any new posters either.
Ron
Thanks for the explanation. Thanks for checking the pending file every day.
Actually, I check it several times a day. I don’t want those guys to wait long for their posts to be posted.
But that is not a chore for me. That is because that is where I check everything. All new posts come up sequentially, no matter where they are posted. So I never have to scan anywhere for “new” posts.
I feel so special – thanks for the heads up.
Ron, it does not matter when the posts appear as long as someone manages to get the information.
Interesting .
Some new Production targets
Saudi Arabia 10,478
Russia. 9,828*
Iraq. 4,431
UAE. 3,219
Kuwait 2,676
OPEC 10 24,994
Based on this table Saudi Production in July will be 9,000 kb/d. This is roughly 1,000 kb/d lower than Saudi’s comfortable production level.
* This level was the required production level for the month of February 2023, as assessed by the average of the secondary sources, and is subject to revision by June 2023 as the country is currently working with the secondary sources to update production figures.
Ovi,
I looked carefully at the last two tables for OPEC production targets (the previous table was from the October 2022 meeting). When we compare the voluntary targets from the October 2022 meeting with the 2024 targets from the recent June 2023 meeting, many nations remain at the voluntary targets from the October 2022 meeting.
For OPEC the exceptions were Angola, Congo, Equatorial Guinea, and Nigeria that as a group had their target reduced by 622 kb/d ( basically to the level they were producing in February 2023). The UAE had its quota raised by 200 kb/d so the net decrease for all 10 OPEC members with quotas was 422 kb/d. For the non-OPEC members of OPEC plus Russia has the largest decrease of 650 kb/d (basically where they were producing in Feb 2023) and Azerbajain, Brunei, Malaysia, and Sudan had their quotas reduced by 321 kb/d (again to line up quotas with recent output which was below the target). In total the OPEC plus group with quotas saw an overall decrease of 1393 kb/d, but note this is not really a cut in output it just lines the quota up with what is already being produced by OPEC.
The only real cut revealed at the meeting was the pledge by Saudi Arabia that they would cut output in July by 1000 kb/d, the World oil market may not believe that the Saudis will actually make this cut in output.
The “cuts” were really no cuts at all, they just lined up the quotas with actual output by the smaller OPEC producers that have not been able to produce at the level of their quotas and Russia which has also not been able to produce at the level of its quota (10478 kb/d of crude as of October 2022).
The oil market may have digested this information and realized that there were no OPEC plus cuts, the whole thing was a nothing burger. Thet market may also think the Saudis are bluffing on the 1000 kb/d July 2023 voluntry cut and their bluff is being called.
See charts in next comment below.
OPEC tables from October 2022 (left) and June 2023 (right).
Click on chart to pull up in browser and then zoom for better view.
Crude Oil futures 24 minutes after open and has dropped $0.25 in the last 10 minutes.
74.26 2.49
The open was $75.03.
something to watch
https://oilprice.com/Energy/Energy-General/ExxonMobil-New-Fracking-Technology-Can-Double-Oil-Output.html
I don’t have any personal experience with refracs but doing research on our on going development in the oklahoma woodford, the early vintage (circa 2011-2014 wells in our area have made around 300,000BO and 3BCFG and it does not matter if the laterals were 5000′ or 10,000′. This suggest the early extend laterals were under stimulated. As we do more development it will be something to watch.
I still think oil is going to $90 and inflation will maintain a 4 handle. The SPR will never be refilled.
OPEC didn’t get much of bang for their buck so to speak with this cut. Prices will be back under $70 fairly soon.
TTT , Mr Shellman has a rebuttal to the oil price article .
https://www.oilystuffblog.com/forumstuff/forum-stuff/and-the-lies-they-just-keep-on-a-commin?origin=notification
Maybe people paying more attention can help me here.
The article is a summary of two articles. The ExxonMobil article in Bloomberg is totally devoid of specifics. So it tells me nothing. It isn’t about refracs, I don’t think.
The JPT article discusses two types of refracs. A bullhead frac, which I assume uses no new casing, and a frac that does use new casing.
The bullhead frac costs $1.5 million /-. But no discussion on what to expect in the way of production response.
The frac with a new liner costs $4 million /-. With this frac EUR could be as high as 170k BOE. I think BOE, I’m not clear if this is BO, or BOE, which is very important.
One thing I caught. Standard casing used on these wells is 5 1/2”, “because the operators didn’t intend on using liners for refrac at the time.” Therefore special 3 1/2” or 4” casing is being manufactured to use in these.
I wish I knew how much that casing costs. I’m sure it’s higher than a kite. I know a little bit about specialized tubing. The lined stuff we use in injection wells is 2 3/8” and costs $14 per foot. 1 1/2” we have used to slim hole injection wells costs about the same. I have heard new 4 1/2” casing costs over $40 per foot. That is why nobody is drilling in our field. The one drilling rig left based in our county is currently stacked. It sits right across the blacktop from our North tool house.
Do just a little math folks. .75 x $75 per barrel x 170k barrels is $9.6 million rounded. I assume that 170k EUR is over 30 years. I’m giving the benefit of the doubt this is all oil.
Who here would invest $4 million up front to return $9.6 million over 30 years? Before LOE of course. And before production taxes of course.
We are paying $6.06 per foot for used gas storage 2 3/8” tubing. The price has finally stabilized, a little over double what we were paying pre-2021. Doing anything now in our field, other than just trying to keep stuff running is cost prohibitive.
Refrac’s might make sense at WTI over $125 sustained? $150?
I’m with Mike. He’s on the ground in EFS. This refrac stuff appears to be fluff.
What analysts are saying about Saudi Arabia’s latest oil output cut
The last line says it best.
Rystad Energy
The Norway-based consultancy said the move would boost oil prices in the short term, with the long-term pricing trend depending on macroeconomic factors.
“The pure possibility of the Saudi production cut extending beyond July will limit downside price pressure for the rest of 2023,” said Jorge Leon, senior vice president at Rystad.
Julius Baer
Swiss wealth management bank Julius Baer said Saudi Arabia’s additional efforts are “somewhat of a surprise”, but are aligned with the country’s leadership role.
“Saudi Arabia was quite outspoken in seeing the market biased by speculators in previous weeks. Oil market sentiment, indeed, looks rather bearish, to a large extent influenced by China’s loss of economic momentum,” said Norbert Rucker, head of economics and next-generation research at Julius Baer.
“The seemingly lengthy and intense discussions point at the various opposing interests within the group. Some members could take compliance less seriously in the slipstream of Saudi Arabia’s leadership.”
Politics will add to the volatility in oil prices but is not expected to change established trends meaningfully, he said.
“These trends remain dominated by stagnant western world oil demand, growing shale production and maintained flows from Russia.”
https://www.thenationalnews.com/business/energy/2023/06/05/what-analysts-are-saying-about-saudi-arabias-latest-oil-output-cut/
The below chart is the EIA’s data for all OPEC+ nations. That includes all OPEC 13 nations and the ten non-OPEC nations. The Data is through February 2023 and is C+C, not crude only as OPEC reports.
An interesting tweet , Add to this the falling rig count .
https://twitter.com/econ_713/status/1665748795538243584
Having read a number of articles, it appears that most African countries and Russia opposed further cuts proposed by Saudi. In the end KSA decided they would take the hit themselves.
Part of the problem was that MBS threatened the shorts and he had to deliver. After WTI opened at $75/b, it settled today at 72.15/b up 41 cents. After settlement it continued to drop to below $72/b.
So the big question is: is it “Over Supply” or a “Slowing Economy with Low Demand? I think it is more of the latter.
What do the experts think?
Ovi,
Oversupply is in relation to demand as in more supply at price P than consumers want to purchase at price P. If OPEC follows through with more cuts in July we may see stock draws and at that point prices may rise IMO.
Dennis
That is generally true in a normal market. The oil market may be different in that Russia and Iran are prepared to pump as much oil as they can and hope that someone will buy some of their floating excess. I have read that there is a lot of Russian and Iranian floating oil looking for a buyer.
They turn off their transponders and transfer their oil at sea.
Only recently I have read that oil leaving Russian ports has started to decline. Russia may have been selling oil from inventory and if they are now bottoming that may help the over supply.
From the Financial Mirror.
“Which begs the question, how unified is the alliance at this point, with Saudi Arabia seemingly more price obsessed than others?
On Monday, its energy minister reportedly claimed to be “fed up” with other members not meeting output goals when speaking to Al Arabiya in another sign of some division within the group.”
https://www.financialmirror.com/2023/06/06/services-pmis-point-to-broader-weakness-opec-not-as-unified/
Ovi,
I do to disagree that the market seems adequately supplied or perhaps a bit oversupplied with oil, it is a bit difficult to judge as World stock levels are very murky (in part from the smuggled oil that you mention). Even without that problem, outside of the OECD the stock numbers are not very good and more than half of World demand and all of the growth in demand comes from the OECD. If this is abnormal, then it is the new normal.
Dennis
In the current futures market, the front month July is in contango with August. This equates to the refineries telling the producers to keep their oil for another month, you can get a better price a month from now, we don’t need your oil now.
Contango is not considered to be a normal price environment, backwardation is. This to me implies a well supplied market at this time. The futures market Backwardation starts in August.
Let’s see if the oil price strengthens near the end of June, in anticipation of backwardation starting in August.
Ovi,
Some typos in my comment, I should have said that I agree the market is well supplied (instead of I do not disagree which was misstyped and double negatives are not helpful in any case). The market may be oversupplied in fact.
Note that aside from adjusting quotas to reflect actual output for the producers that have been producing less than their quotas the only cut at the recent meeting was by Saudi Arabia which claims it will reduce output by 1000 kb/d in July. Judging by the price of oil they have lost credibility, the oil market thinks this is a bluff, we will need to wait for a few months to see (we won’t know until late August).
Interesting to look at weekly supply and disposition information in the US, supposedly there was a 1258 kb/d stock build for week ending 5/26/23, but also a 1945 kb/d adjustment (this essentially adds extra oil to balance the books, it is pulled from thin air).
This suggests if all other numbers are accurate, that there was a 687 kb/d stock draw. The output estimate looks low by 400 kb/d so it might only be a stock draw of 287 kb/d, but the EIA numbers on supply and disposition are not very good with monthly adjustments (in March) of 32 million barrels (about 1000 kb/d) so we don’t know what’s going on with US stocks, the data is not accurate at all.
They going to have to cut a whole lot more to even have a prayer of holding prices at $70 as we move in second half of 2023.
OPEC is losing the battle with global recession.
Equinor delays Bay du Nord Canada oil project up to 3 years over rising costs
https://www.reuters.com/business/energy/equinor-delays-bay-du-nord-canada-oil-project-up-3-years-over-rising-costs-2023-05-31/
I think Bay du Nord could end up like SW Bongo for Shell in Nigeria. The EROI is just not high enough to be able to find a design solution that has sufficient margin and, in increasingly volatile markets, certainty (i.e. low risk) no matter what.
Saudi output cut unlikely to lift oil prices to high $80s-low $90s, Citi says
June 6 (Reuters) – Top crude exporter Saudi Arabia’s one million barrel per day (bpd) oil output cut is unlikely to underpin a “sustainable price increase” into the high $80s-low $90s with weak fundamentals pointing to lower prices by year-end, Citi analysts said in a note on Tuesday.
Citi analysts cited factors such as weaker demand and stronger non-OPEC supply by year-end, potential recessions in the U.S. and Europe, and lower growth in China which could see prices end up lower rather than higher this year and in 2024.
Other analysts said a global shortfall in supply is set to deepen in the third quarter following the kingdom’s output cuts and could push Brent towards $100 a barrel by year-end.
It is pretty clear from these three paragraphs that even the best experts don’t know what is really happening with the world demand/supply situation.
WTI is down to $70.50/b this morning, not what MBS was expecting
https://www.reuters.com/business/energy/saudi-output-cut-unlikely-lift-oil-prices-high-80s-low-90s-citi-says-2023-06-06/?rpc=401&
Another article on oil price pressures
“The market remains focused on the risk to demand with recession concerns mounted on a broad-based miss in U.S. services PMI giving room for a Fed pause on rates,” said Ole Hansen, head of commodity strategy at Saxo Bank.
The U.S. services sector barely grew in May as new orders slowed, and market participants are waiting to see if the U.S. Federal Reserve will hike or hold interest rates in June.
Higher interest rates could curb energy demand.
The mood was further dented by data that showed German industrial orders fell unexpectedly in April.
https://www.reuters.com/business/energy/oil-prices-tick-down-with-opec-meeting-rear-view-2023-06-06/
EIA has corrected some of its 2023 GoM production numbers to be closer to those reported to BOEM, though its 2022 numbers have been left too high. There’s a big gap between EIA and BOEM estimates for March, I think BOEM is about 120 low. EIA estimation for April and May look a bit high to me and I don’t see why it then has such a big drop, I still think added production from Vito and Mad Dog II (Argos) will produce a local peak in July/August of 1900 to 1950 before decline takes over. Two tie-ins to Appomatox are through FID, for Rydberg and Dover, and will add 35 to 40 kbpd over the next year. Appomatox and Vicksberg have not done as well as expected, didn’t reach nameplate capacity and have just about started decline so there is growing capacity on the platform.
There’s no March data reported yet to BSEE for BP’s Atlantis – that’s 80 k or so of the difference. Also, no data yet for Shell’s Vito, which was supposed to have come on line in February. There may be a few other smaller fields as well where the March data hasn’t been reported yet.
Bob,
George may have known that, but probably only him and you (on this blog), so thanks for the clarification.
World C+C production was up 524,000 barrels per day in February.
I will have a full report on World C+C production in a few days. This will be, in my opinion anyway, a very revealing post.
Thanks Ron, I look forward to your post.
The plateau-
82 mpd +/- 3 mbd (3.6%)
How long can humanity keep it going?
What preparations are you and your country making for the way down?
The population of the world is already about 10% larger than it was in 2014.
You wrote that as if you really believe there is anything we can do to head off the drastic results of human beings breeding like rabbits until we run out of liveable habitats. It’s just the drastic results of our human nature. We have brains that evolved in our hunter-gatherer days. We take all the territory and resources for our tribe and damn any animals or other tribes it destroys.
I hear you Ron.
I was talking about oil production.
Yes…People and countries can do things/make decisions that can make them more or less
extremely vulnerable to a decline in oil production.
Or they can go on generally pretending its not going to happen.
Regarding the gist of your point…I agree with the idea that human population will be forced lower by hitting up against hard constraints, after using up all of the good earth that we can accomplish first.
On energy, an example of one the big constraints,
Peak Global Combustion Day [all fuels] will be happening in just about a decade from now.
It is highly likely that overall human population will decline along with energy availability
with something like a 20 year lag.
None of us know the pace of the trends, or specifically how the mob will react.
The Tragic Story of Human Success.
Hickory,
Consider that the useful energy from fossil fuel is about 40% of natural gas, 35% of coal and perhaps 30% (at best) from oil. As we transition to wind and solar the large quantity of energy which becomes just wate heat will be reduced substantially and overall energy use will decrease. Of the primary energy provided by fossil fuel in 2021 about 65% created waste heat which was put to no use.
We waste a ton of energy and can do much better.
Dennis, you write as if we can beat the Carnot limit. Exergy analysis shows that matching a source to the right application reduces exergy destruction. One great way to optimize is to use combined heat and power, as we all know, but it bears repeating.
Seppo,
I am aware we cannot do better than the Carnot limit for heat engines. The point is that thermal sources of power are not the only ways to produce energy, particularly electric power. In addition for heating of buildings and water heat pumps are a better use of energy. Where combined heat and power are practical it is an excellent solution, though from a climate change perspective it would remain a better option to minimize the burning of thermal fuels especially fossil fuel unless it is combined with carbon capture and storage.
SEPPO KORPELA
The Carnot Limit applies to heat engines. The worst, most useless forms of energy are heat and hard radiation.
Carnot showed the limits to converting heat to energy available for doing mechanical work.
Much of current energy production starts by producing heat, then slogging uphill to convert that into something useful. It is an inherently wasteful process. Solar and wind don’t work that way, so the Carnot Limit is irrelevant.
Incidentally, in the fifties there was the hope that hard radiation could be converted into something useful, but that hasn’t been found (yet). That was the idea behind ideas like the “nuclear battery”.
” Of the primary energy provided by fossil fuel in 2021 about 65% created waste heat which was put to no use….We waste a ton of energy and can do much better.”
Yes indeed. And we certainly need to.
The window of opportunity is getting smaller with each passing day.
We have been burning fossil fuels for the last 200 years, and have not figured out how to get much energy from them by other means. World primary production is 86% from fossil fuels. Wind and solar account for 1.6%. It seems that we have a large hill to climb and not much time left.
On the inflation vs deflation and demographics debate . Copy/ paste from OFW .
“Demographics and inflation/deflation:
We are witnessing the first effects of ChatGPT and the like evidenced(perhaps correlated may be a better choice of words) by declining office building prices(offices are basically information processing centers) and mass layoffs in the tech sector.
This has serious implications for us old folks, the kids have no jobs and ChatGPT as of yet pays no payroll taxes and…. if you think offshoring of jobs was a problem, where is the “Chat” located? Hmmmm. Houston, SS has a problem.
So we have deflation in commercial/office space which in part supports various pension/insurance programs the demise of which is a deflation of assets the demise of which leads to decreased cashflow of recipients which leads to decrease in discretionary spending which leads to further decline in the value of commercial real estate, und so weiter.
So why is the cost of frozen pizza increasing?
HOLE,
So why is the cost of frozen pizza increasing?
Not enough AI Pizza makers? 🙂
steve
Huntingtonbeach,
Tone it down please.
Governments and central banks around the globe are still solely focused on inflation even though all the indicators they use are backward looking.
Meanwhile China is like inflation? What the hell are you guys talking about inflation?
All the forwards looking indicators are projecting deflation ahead. China, Europe and USA all going into deep recession at same time.
Just saying $25 oil might be too high.
Mr. Huntingtonbeach: I have watched you rave and insult people for a year now. You with your cavalier attitude and your poor knowledge of anything at all to do with any topic on this site. You have become emblematic of many things that are wrong with the world today, and with this site specifically. With all deference to Mr. Coyne and Mr. Patterson, there are no bullshit police patrolling these pages, so high and mighty self-important people such as yourself seem empowered to try to put other people down. I have despised bullies like you all the years of my life. You make me sick to my stomach!
Gerry,
Do you read the non-petroleum thread at all?
Sometimes arguments that occur there bleed through to the Oil thread. I think the main point was wrong thread for the comment, it should have been in the non-petroleum thread.
The insults were indeed over the top. Note that we don’t have time to approve each comment, when one comment is approved other comments can be posted, most behave, if not they are banned.
I believe Huntingtonbeach finds the comments in support of Putin annoying, a lot of those in the other thread by Hole in head.
To get a flavor see link below and read a few of the comments up to Huntingtonbeach’s comment (or skip that).
https://peakoilbarrel.com/open-thread-non-petroleum-june-3-2023/#comment-758092
I personally don’t understand the Putin worship by some of these guys, some find it irritating.
FIRST THEY CAME
By Martin Niemöller
First they came for the Communists
And I did not speak out
Because I was not a Communist
Then they came for the Socialists
And I did not speak out
Because I was not a Socialist
Then they came for the trade unionists
And I did not speak out
Because I was not a trade unionist
Then they came for the Jews
And I did not speak out
Because I was not a Jew
Then they came for me
And there was no one left
To speak out for me.
Sincerely good luck,
We’re all going to need it
Huntingtonbeach,
Better IMO. You are not the only one annoyed by the cheering section for Putin, I try not to take the bait.
Gerry, you are 1000% correct. And you had the balls to use your own name saying it. Goodonya.
Mike and Gerry,
Huntingtonbeach deleted his comment as it obviously offended Mr Maddoux.
His response had to do with comments on the other thread by Hole in head which suggest strong support for Putin’s invasion of Ukraine. Not sure your take on that, but some find it annoying.
Gerry – I share your feelings, but envisioned Mr. (or Ms.?) HB as a transient smoking crack in huntington beach most days with occasional public library internet access, so I just took his antics with a grain of salt…there are the odd times however where HB has some valuable input, but then again that’s the power of smoking crack!
Great Ken, the library doesn’t open until 9am PT, but I’m here now. Hey, next time I make a “crack” comment. Please don’t “not speak out” and be prepared with facts to back up your response. Looking forward to our future exchange. I’m always interested in bettering myself when I’m wrong. It’s how we grow. You won’t hurt my feelings. BTW, it’s “Mr.” HB for you if you like.
I actually lived in Huntington Beach for a while.
In 1967
Now it is a rightwing mess.
Still a great beach break.
My first intro into Owsley and his wares.
China’s exports plunge by 7.5% in May, far more than expected
Exports fell 7.5% in May from a year ago, far worse than the 0.4% decline predicted by a Reuters poll.
Imports for May dropped by 4.5% from a year ago — less than the 8% plunge forecast by Reuters.
I wonder if the imports were lower than expected because of the extra import of cheap Russian oil.
Just found this quote confirming my speculation above.
Wednesday’s data also showed that crude oil imports into China, the world’s largest oil importer, rose to their third-highest monthly level in May as refiners built up inventories.
A JP Morgan note said forward crude cover in the country has climbed, indicating refiners have not increased processing rates but are instead storing oil.
Ovi, two things. Imports into China are lower because China is undergoing a severe recession. They just don’t need more imports. The second thing is, why are they storing oil? Well, hell, I can only speculate. But I won’t speculate. But I would love to read others’ speculative comments. 🤣
China’s economic recovery loses steam as factory production contracts further
Factory activity in China has slumped to its weakest level since the country ended its zero-Covid policy in December, as its economic recovery continues to lose steam.
Asian markets tumbled following the release of the May data, even as a tentative agreement brokered by US President Joe Biden and House Speaker Kevin McCarthy to raise the US debt ceiling cleared a key hurdle on Tuesday evening. Hong Kong’s stock index dropped the most among regional markets Wednesday and is poised to enter bear market territory, which is defined as a decline of at least 20% from a recent peak.
China’s official manufacturing Purchasing Managers’ Index (PMI) dropped to 48.8 this month, down from 49.2 in April, according to data released by the National Bureau of Statistics on Wednesday. It was the second contraction in as many months. A reading above 50 indicates expansion, while anything below that level shows contraction.
” The second thing is, why are they storing oil? Well, hell, I can only speculate. ”
They are students of history and they know what happened to Japan when the oil embargo was placed on them during WW II .
An update while Jake ” the jerk ” and Tony ” the blind” go poking the dragon .
https://www.zerohedge.com/commodities/china-crude-stockpiles-hit-two-year-high-us-strategic-reserve-drops-40-year-low
For those interested, attached is a youtube blogger reporting on the dam being blown up
This video explains a lot.
https://www.youtube.com/watch?v=t-HLyoSD5lg
Ovi,
Seems the discussion of Russia’s invasion of Ukraine mostly occurs on the non-Petroleum thread, perhaps move your comment there?
Dennis
I did post it there to rebut some comment/disinformation but thought I would also put it here without comment
Thank you very much Ovi for your great and precise work and your reports. We are always glad about it. I will be happy to put this report on our site again.
Best regards from Switzerland
Michael
http://www.peakoil.ch
Michael
Thank you.
It is always nice to know that one’s work is appreciated.
Spending some time away from POB and currently close by in Trier for a few days.
@ Ovi
Thank you very much for your kind reply.
We are happy to say big thanks to such responsible people who work as hard as you do.
We live between Zurich and Zug and follow the worldwide scenario of the oil peak very closely. Especially since Europe as a resource poor country is heading for big problems.
Best regards and thank you again.
Michael
I almost put this in the non-petroleum thread, but no, it’s definitely petroleum!
Petro-masculinity: Fossil Fuels and Authoritarian Desire
As the planet warms, new authoritarian movements in the West are embracing a toxic combination of climate denial, racism and misogyny. Rather than consider these resentments separately, this article interrogates their relationship through the concept of petro-masculinity, which appreciates the historic role of fossil fuel systems in buttressing white patriarchal rule. Petro-masculinity is helpful to understanding how the anxieties aroused by the Anthropocene can augment desires for authoritarianism.
https://journals.sagepub.com/doi/full/10.1177/0305829818775817
Social factors fuelling the fossil fuel industry…
John, this is an argument for a “petro-masculine authoritarian.” When referencing a government leader, authoritarian is another word for “dictator.” So if we had one of those, how would we know he/she would act wisely concerning climate denial, racism, and misogyny?
Come to think of it, Venezuela has one of those; his name is Nicolás Maduro. Russia has one also; his name is Vladimir Putin. And the US had a wannabe dictator; his name was Donald Trump.
Hey, looks like I answered my own question, didn’t I?
Thanks John , This is called collateral damage . The rise of authoritaniasm or totalarism due to energy poverty was not anticipated by even the experts who have been at the job for over 20/30 years . The problem is that the erosion of our fundamental civil rights are being done in a creeping manner . Nobody is noticing this , until they do . Will it be too late by then ? I don’t know . As an observer I see is the majority of the public zombified with their eyes or their ears on the smartphone . I have lived long enough to observe the difference and have reference points , right from the Vietnam war , Pentagon papers , Watergate etc .
A comment by Norman Pagett , author ” The end of more ” on the subject .
At the start of the industrial revolution, (1709) we lived in a totalitarian autocratic system, then the Industrial revolution itself created the need for workers. People were making ‘stuff” and competed for those workers . Suddenly the workers realised they had economic muscle–so a gradual rise in workers rights began this led to universal suffrage (eventually), about 100 years ago.
This could only go on as long as worker were in increasing demand . We have now reached the end of that particular line . As the need for workers goes, so will the rights of those workers which is why we are slipping back into autocracy and fascism . “
Pagett is someone I follow, even his posts on Gail’s blog.
He has quite a kickback from the idiots there.
We are going to have the need of more worjker to make stuff because there will be less oil (energy) to feed machines which are replacing workers.
There are many factors favoring a drift back to authoritarianism/fascism.
-Resource nationalism feeds the flames of political nationalism.
-The end of easy economic growth (or contraction) feeds the flames of political nationalism.
-And the perhaps the biggest factor is global warming. This will result in huge migration pressures that we have only just glimpsed thus far.
I’ll add that centralized control of media, and other mechanisms of manipulating truth for political purposes are big tools that grease the skids for political nationalism. Trump got almost 1/2 of the US voters to believe the big lie about the 2020 election. Watch out, because much of the worlds population is extremely easy to manipulate and has extremely poor skills at judging truth from fake.
China slowdown drives Saudi oil production cut
The most significant feature of the decision by Saudi Arabia to cut its production of oil by 1 million barrels a day in July, with a possible extension, is what it says about assessments of the prospects for the world economy.
The driving force of the decision, announced following the OPEC+ meeting in Vienna on Sunday, is that the much-touted “recovery” of the Chinese economy after the lifting of anti-COVID heath measures is not taking place, leading to a further slowdown in the world economy and sending down the price of oil.
The meeting was held two months after the cartel, which includes many of the world’s major oil producers, announced production cuts to try to sustain prices. But these measures have proven largely ineffective, and the oil price has fallen by 12 percent since the middle of April, touching $70 a barrel at one point last week.
The Status of Global Oil Production: 2023 Update by Roger Blanchard. Bold mine.
In 2022 I wrote a report titled “The Status of Global Oil Production”. Annual global oil production data are now available from the U.S. Department of Energy/Energy Information Administration (U.S. DOE/EIA) for 2022 so it’s time for an update on my 2022 report.
All the data in this report comes from the U.S. DOE/EIA except for Texas Permian Basin oil production data which is from the Railroad Commission of Texas.
The data in this report applies to crude oil + condensate, what is typically identified as oil. I am not including natural gas liquids, alcohols, refinery gain or other organic liquids which along with oil I classify as total liquid hydrocarbons.
Figure I is a graph of the historical annual global oil production rate from 1973 through 2022:
The global oil production rate in 2022 averaged 80.628 million barrels/day (mb/d). The global oil production rate in 2022 was better than the previous two years (2020 and 2021) because oil demand during those two years was down due to the COVID-19 pandemic.
When compared to 2018 and 2019, the global oil production rate in 2022 was not particularly good because the rate in 2018 was 82.986 mb/d and in 2019 it was 82.170 mb/d. The global oil production rate in 2022 was less than the 2018 rate by 2.358 mb/d and less than the 2019 rate by 1.542 mb/d.
One might have expected that the average global oil production rate would have been higher in 2022 when compared to 2018 and 2019 in-as-much as the price of oil was considerably higher in 2022. In 2022, the average price of West Texas Intermediate (WTI) was $94.53/barrel whereas in 2018 it was $65.23/barrel and in 2019 it was $56.99/barrel.
I don’t expect the 2018 global oil production rate to be exceeded in the future irrespective of how high the price of oil gets. The easy oil production increases due to high oil prices that took place in 2022 are unlikely to be duplicated in the future.
There is a lot more to this article including comments on the Russian/Ukraine Conflict and OPEC+. He states that it may be impossible for OPEC to ever reach its 2016 level of production ever again. Of course, I agree.
Hi Ron,
Here is where Blanchard will be wrong.
He says:
I think it’s realistic that the U.S. oil production rate could decline by over 5 mb/d for the 10 year period from 2023 through 2032.
It is more likely that US C plus C output will be higher in 2032 than it was in 2022 using annual average output. Certainly it will be higher than 6887 kb/d in 2032, which is 5000 kb/d below the 2022 annual average US C plus C output and would coincide with Blanchard’s prediction for 2032.
Global average annual C plus C output is likely to exceed the annual average level in 2018 by 2026 with a final peak in 2028 plus or minus 1 year.
Dennis, I would bet 2023 will be the peak for shale oil. It could go a little higher in 2024, but I double it. At any rate, Blanchard and almost every oil man on this blog are saying that shale oil is at or very at its peak today. You, on the other hand, are saying it will go onward and upward for another decade.
I am putting my money on the oil guys.
Ron,
Probably only another 8 years maybe less, perhaps the oil guys will be correct. Here is a revised model with 450 Permian completions per month until 2030, other tight oil plays also have a steady completion rate in this scenario, note that this is a slight decrease in Permian completions from the April 2023 rate of about 510 wells completed.
If the US bans crude exports as some oil guys advocate for (I agree with this position, but doubt it will become law), then output would be lower because we lack the refinery capacity to handle current tight oil output, though I imagine we could write a law that requires a swap of heavier imports for the lighter tight oil exports which would likely be preferred by many in the oil industry.
In any case nobody knows the future and there are no doubt many in the oil industry that don’t agree with the oil men here. My scenarios are quite conservative, the Permian scenario has a URR of 41 Gb, only 55% of the mean TRR estimate from the USGS. In contrast, the likely Bakken URR is about 83% of the mean USGS estimate for the TRR of the North Dakota Bakken/Three Forks play.
We will see how things play out, the oil guys have been saying we will run out of locations in a couple of years for a couple of years, by 2028 or so they will be right and it will be a couple years (2030 or so) when we run out of decent locations to drill in the Permian basin.
Peak for tight oil for scenario is June 2030 at 9314 kb/d, at my expected World peak in 2028, June 2028 tight oil output is shown at 9289 kb/d. I expect there will be decline by 2032, but not the 5000 kb/d that Blanchard expects. In fact in 2032 tight oil output in my scenario remains above the 2022 tight oil average of 7890 kb/d with average annual tight oil output in 2032 of 8990 kb/d.
With regard to US shale oil, nobody with an ounce of oilfield experience has EVER said here on AOB we will ” run out of locations” to drill. That is a lie and yet another effort to make one appear smarter than they actually are, at someone else’s expense. In this example, other oil men.
Some of us IN the business, that spend our own money IN the business, have said now for several years we will be running out of Tier 1 and 2 locations in the Permian to drill soon, in the next several years, and indeed we are. Depletion is all around us, one must simply look up and use common sense.
Most of Coyne’s past prediction performance is actually not based on science, or statistics, but rather entirely on the tight oil sectors ability, and willingness, to use other people’s money, on America’s willingness to get deeper and deeper in debt.
Mox nix, by having no experience, no skin in the game whatsoever, by not having a clue how the oilfield actually works and resource plays deplete, the arrogance of Mr. Coyne’s stoopid, definitive predictions have effectively run everybody off that would argue with him, or debate him. To those of us WITH skin in the game, and it is a VERY difficult game to win, it is actually quite offensive. Judging by other comments it appears to be offensive to numerous others. But, I suspect, all part of the plan. The one-eyed Jack, is King.
Good luck, Mr. Patterson. You’ve done big work over the years regarding declining oil and gas resources, from the TOD days onward. You were relentless. It is a proper message to want to deliver.
Mike’s blog – https://www.oilystuffblog.com/forumstuff
Thanks Andre,
I agree with Mike that we do not know the future. My charts do not represent what will happen, they are models based on a set of assumptions. Based on the information I have available on prospective acres in the best (highest productivity) formations in the Permian basin there were about 31 million acres to develop at the time the USGS assessments were completed. There were about 50 million acres were covered by the Permian assessments, but I ignore the 19 million acres in the less productive formations and assume those do not get developed, this reduces the TRR to about 60 Gb from 75 Gb. I assume only about 67% of the prospective acres get developed so this reduces the URR to about 40 Gb, about 100k total wells with about 40k wells completed as of the end of 2022. I have shown a range of potential Permian scenarios with a low of 300 wells per month and a high of 500 wells per month. Clearly I don’t know what will happen, the 450 well per month scenario is my best guess (50/50 odds IMO that output will be either higher or lower.)
This argument is always so ridiculous. I guess the famous physicists that explained the operation of the solar system (or fill in the blank) should be discounted because they never traveled to outer space (or fill in the blank). Geologists and others who work in the field, so to speak, seem especially prone to this as they deem those that haven’t got their hands dirty haven’t sufficiently paid their dues. Just wait until AI starts figuring everything out 😉
And it’s always so ridiculous that people like you think you know so much about… (fill in the blank).
You are not a brain surgeon. I would not allow you to cut a tumor out of my head. If you were to analyse all the brain surgeons in Minnesota, and grade them based on death to survival rates, it would be worthless to me, and anybody else. I mean really, who the hell are you to be predicting the success rate of brain surgeons?
Why people that could not even describe the stuff on their driveway, under their car, ten years ago now feel they are experts, based on numbers, is absurdity. Oil Shock Model? Gimme a break.
If I held you upside down and you knew which way to turn the end of your garden hose to get it hooked up to the bib, first try, I’d be impressed. Otherwise, I sort have no use for people that feel they hold the intellectual high ground over others, because of a fucking degree. Your a dime a dozen.
Credibility is not based on education, or academia, nor is it based on published white papers. It has to do with experience, with what you have actually accomplished in life. What’d you build, or make, who’d you help, what did you find that made a difference, how many jobs did you provide?
Arrogance is a “silly” emotional tool for people to cling to. A life plan based on “ifs” is a poor plan.
I have nothing negative against your analysis on oil topics.
Yes Mike,
When I say “run out of locations to drill”, I take it as obvious that those locations will be profitable on average (clearly there is variation from well to well). I try not to insult my audience by covering every detail, by not doing so I get accused of lying, which is absurd. I generally assume oil men are smart and only drill wells that they believe will turn a profit.
On the science and statistics see
https://agu.confex.com/agu/fm18/meetingapp.cgi/Paper/446221
The wells profiles fit a simple hyperbolic well profile to data provided by shaleprofile.com (now Novilabs), the tail of the well profiles have exponential decline after the average annual decline reaches 12.5% per year. The future is unknown, we don’t know either the completion rate, well costs, or prices in the future, we can only guess. That poster was completed before the 2018 Delaware basin assessment was released and underestimated the Permian basin mean TRR by a factor of 2.
In the future we will run out of tier 1 and tier 2 locations, I agree on that point. How soon we reach that point will depend in part on how fast we complete new wells as well as how many potential profitable well locations exist. That in turn depends on our assumptions about future prices, I assume $80 bo or higher for crude at refinery gate, $3/MCF for natural gas, and $28/b for NGL (all prices in 2023 US$) over the 2023 to 2030 time period for average prices.
We will not run out of tier 1 and tier 2 locations in the Permian basin in the next few years, which has been claimed for several years.
Can you suggest when you expect tier one and tier 2 locations in the Permian basin will become scarce? When that occurs I would expect we will see the completion rate of horizontal tight oil wells will decrease. Chart below shows Permian well completion rate based on EIA estimates, my scenario has the completion rate decreasing to about 450 wells per month and remaining at that level from August 2023 to about June 2030. I assume wells are spaced at 1320 feet between laterals with average lateral length of 9500 feet (288 acres per well). At the time of the USGS assessments for the Permian basin there were about 31 million prospective acres in Wolfcamp A and B, Lower Spraberry, and 2nd and 3rd Bonespring, that results in about 108 thousand potential well locations available after the assessments were complete. Since the assessments about 23 thousand wells have been completed in these formations (these completions comprise 80% of all Permian horizontal tight oil wells in all formations). That leaves about 85 thousand potential wells in these higher productivity formations. My scenario assumes only 58 thousand of these 85 thousand potential locations are completed (about 68%).
Perhaps that is too optimistic, note that the average lateral length of wells completed from 2016 to 2022 was probably less than the 9500 feet I have assumed, so the potential area left to develop might be greater than I have assumed, I think the estimate is conservative. If the completion rate falls more than I have guessed, say to 300 wells per month then the plateau might be extended further and if the completion rate was higher then the completion rate would drop sooner. My guess is there will be about 60000 more wells completed in the Permian basin after December 2022. At 300 wells per month we could maintain the rate for 16 years and at 500 wells per month it would be about 9 years (these assume a rapid ramp down to zero completions over about a year.)
Igor Sechin’s USA Shale Peak prediction
https://www.reuters.com/article/us-oil-sechin-idUSKCN0VJ0RB
Igor Sechin, Putin’s hand picked inner circle oligarch and CEO of Rosneft and informing him regularly.
looks like he was a bit early too. But not by much.
Look at the timing of the 2 Ukrainian invasions..
1st – 2014 Crimea – Many were predicting Peak Oil 2015 (including the US Military)
2nd – 2022 – a year or so behind Sechin’s USA shale predictions.
Coincidence??????
Or was Putin trying to time a decline in global oil as he knew the USA shale patch is what is preventing it…
Ron,
What do the oil guys say?
What I remember was LTO Survivor suggesting that tier one and tier 2 locations in the Permian basin might run out in about 4 years and I remember that being back in 2020 or so. If I am remembering correctly that would be by December 2023. Is that where you are placing your bet? Do you remember differently? At least through April 2023 there is not much sign of a drop in completions in the Permian basin.
Dennis, I don’t remember specific details, but I remember almost all of them disagreeing with you. And also, they are all quite pessimistic about the future of US oil production.
But no, I do not remember specific details.
Ron,
Yes they always say I am wrong and imply the peak for tight oil will happen soon. If WTI is at about 75 or higher and natural gas is around 3 per mcf amd NGL around 28 per barrel as I assume between 2023 and 2030, then I think the peak for tight oil is around 2030. Seems the oil guys think the peak is now or perhaps 2025, when asked they don’t make a guess.
So far tight oil continues to rise.
Certainly it will be higher than 6887 kb/d in 2032
And by “certainly”, he means “I think”.
This certainty reminds me of Son of Sam, whose dog (Sam) told him to kill a bunch of random people in the Bronx. He had that feeling of certainty we all so desire. Later he figured out his dog wasn’t as smart as he had thought, and started claiming Jesus was god.
Maybe some of this sounds a bit nutty, but at least Son of Sam was open about his sources.
Andre,
My analysis is my source. US tight oil alone is likely to be over 6687 kb/d in 2032, based on a moderate rate of development in the tight oil basins from 2023 to 2032. See Novi Labs Q1 report (free download) with supply projection through 2025 and EIA’s AEO for other analyses. The oil guys may be right, but note that pretty much every projection of future output, including my own will be incorrect. Infinite possible projections only one is correct, odds of success are exactly zero.
I say this quite often, but many don’t hear it.
Better link for Blanchard article, I had trouble with figures on my browser with link in Ron’s comment.
https://www.resilience.org/stories/2023-04-19/the-status-of-global-oil-production-2023-update/
I agree that OPEC might not ever exceed its previous average annual output peak. My expectation is that OPEC will be able to maintain the 2022 average level of output for another 8 to 10 years. Likewise I expect Russia to b e able to maintain about 10 Mb/d for another 6 to 10 years. Canadian, Brazilian, and US output will rise more than the declines elsewhere in the World up to 2028 in my view as long as demand continues to increase by as much as the increase in supply, it may be that demand is the limiting factor over the 2025 to 2028 period which could result in an earlier peak in 2025 or 2026 due to lack of demand.
My expectation is that OPEC will be able to maintain the 2022 average level of output for another 8 to 10 years. Likewise, I expect Russia to be able to maintain about 10 Mb/d for another 6 to 10 years.
Dennis, that comment deserves no reply, just wild laughter.
😀 😃 😄😁 😆 😅 😂 🤣
Ron,
Note that OPEC might dip below the 2022 level when they are trying to support oil prices. In 2022 average annual OPEC C plus C output was 30745 kb/d and crude only was 28856 kb/d, I think that level will be maintained on average over the next 9 years. Russian output averaged 10278 kb/d in 2022 and in Feb 2023 was 10477 kb/d according to EIA. I think Russia may be able to maintain 10000 kb/d for another 7 years (2023 to 2030). Perhaps optimistic, but my expected peak is 2028, so only 6 years needed, I think combined OPEC and Russia may be able to maintain 40745 kb/d plus or minus 500 kb/d for 6 years at least, we will find out in time, if demand is strong enough to require that level of output.
Note that OPEC might dip below the 2022 level when they are trying to support oil prices. In 2022 average annual OPEC C plus C output was 30745 kb/d and crude only was 28856 kb/d, I think that level will be maintained on average over the next 9 years.
Dennis, 2022 OPEC crude only was 28,876 kb/d. Your figure is 20 kb/d too low. The four-month 2023 average is already 109 kb/d below that level at 28,767 kb/d. And that average is scheduled to drop further when the May data comes in Tuesday. “May drop a little”??? No, it will definitely drop a lot below their 2022 average.
Every OPEC nation was producing flat out in September 2022. At that point, they were 2,094 kb/d below their level when the world peaked in November 2018. In April 2023 they were 3,185 kb/d below that 2018 level.
Ron,
My 2022 estimare comes from most recent MOMR secondary sources chart. Yes OPEC has cut output, though through March there has not been a big change in crude output based on most recent MOMR.
OPEC is cutting output to support oil prices. By later in 2023 they may increase output as oil prices rise.
I will include my calculation for OPEC that also includes 2022 and one can compare it to what Roger Blanchard has.
Seppo, stick around another 10 years, and you can do the same thing with Dennis’ charts. 🤣
Seppo,
So about a 5 Mbpd drop in OPEC output from 2022 to 2030. I am skeptical. We will see. What are annual output levels from 2023 to 2030 for your model?
Seppo,
What is the significance of the blue vs the green line?
Dennis . “I don’t expect the 2018 global oil production rate to be exceeded in the future irrespective of how high the price of oil gets. The easy oil production increases due to high oil prices that took place in 2022 are unlikely to be duplicated in the future. ”
Peak oil world 2018 . Been saying it since 2020 .
Hole in head,
We will see, my scenario has tight oil output rising slowly from 2023 to 2030. It is possible there will be a lack of demand, it will be interesting to see if your $25/bo in 2025 proves correct, I remain skeptical.
hint:
“ANYONE who believes that exponential growth can go on forever in a finite world is either a madman or an economist,”
remarked (the economist) Kenneth Boulding
Do I remember you being an economist?
Hightrekker to Dennis: Do I remember you being an economist?
If you do it’s more than I remember. No one knows what Dennis does, or what he did, or even what part of the country he comes from. I think it’s the USA but I am not even sure of that.
As for myself, I spent my entire career as a computer hardware mechanic. I worked on large mainframes, dinosaurs now. But it was fun, I really enjoyed my job because I never had to work hard and I just loved chasing problems on those big monsters. Everyone should be so lucky.
I took care of 360’s at the University.
You didn’t want to get too stoned.
It was incredible they let a student have access to the ability to change any grade in the University. They probably didn’t even know it.
I’m not a Republican, so that was never an issue.
Hightrekker,
Yes I studied economics. Note that my scenarios are pretty far from exponential growth forever and in many cases my past scenarios have in fact been too low. See the chart below from a scenario I did about 11 years ago.
Details at link below
https://oilpeakclimate.blogspot.com/2012/07/further-modeling-for-world-crude-plus.html
I am a madman, not an economist.
There was an even earlier scenario with a high case for the 2800 Gb URR scenario, I later threw this out as being unrealistic when I did the post where the previous chart was posted
See https://oilpeakclimate.blogspot.com/2012/07/an-early-scenario-for-world-crude-oil.html
Note that the high case did prove too high with output at 86 Mb/d in 2020, it had World output at 83 Mb/d in 2016 (two years before the current peak year of 2018) and obviously I did not predict the pandemic.
In that post I said:
The high scenario attempts to ramp extraction rates to 1973 levels over a 30 year time frame, this seems quite unrealistic when considering that Saudi Arabia and other middle east OPEC members were aggressively ramping up production from 1960 to 1973 at the some of largest oil fields discovered to date.
I doubt that such world wide extraction rates will be seen in the future, but included it to illustrate that even if it were accomplished the peak would only move by a few years (to 2021 from 2019 in the medium scenario). Even the medium scenario is somewhat unrealistic as it ramps to 1990 extraction rates over just a 5 year period, the reality is likely to fall between the plateau and medium scenarios.
At the time I did not consider the rapid increase in US output that would occur from 2012 to 2019, I would not have believed such a scenario at that time.
You sound like a typical economist—
But I enjoy your analysis.
Know so much more than me on that topic.
Hightrekker,
Economists might tend to forecast continued growth in tight oil output forever, does that seem like any forecast that I typically heve presented? Most of my scenarios rise to a peak and then decline.
As to when the peak occurs that is based on my expectation of future prices and information on average well productivity, historical completion rates, and resource estimates by the USGS. Future prices and completion rates can only be guessed. My guesses for prices are based in part on forecasts by the EIA in the STEO, and AEO.
@ Madman- That’s a big drop in the early 80’s. Record high interest rates, recession, increase in oil price, beginning of CAFE and Reaganomics. Maybe it helps explain todays demand.
It would be interesting lying GDP over the graph and future GDP outcome.
Huntingtonbeach,
Sometimes such an exercise gives very bad results. The correlation between real GDP and oil output had an R squared of 0.9943 from 1960 to 1972. If we use the OLS trend from that period to project future real GDP (called model real GDP on chart) and compare with actual real GDP from 1973 to 2021 we get an estimate of future real GDP from the model that is roughly 3 times too small by 2021. Often these relationships change unexpectedly and we might see real GDP rise as oil output decreases due to lack of demand for oil as the World transitions to electric transport.
Real GDP is in trillions of 2015 $
https://data.worldbank.org/indicator/NY.GDP.MKTP.KD?most_recent_value_desc=false
Interesting analysis on Natural gas by the EIA for Haynesville
https://www.eia.gov/naturalgas/weekly/archivenew_ngwu/2023/06_08/
Thanks to Reservegrowthrulz for pointing this out to me.
It would be very interesting to know such a relationship for the Permian oil, or world oil.
Of course any such analysis would be based on big error assumptions.
Hickory I agree.
Unfortunately I have not seen that.
New Posts are up.