By Ovi
All of the Crude plus Condensate (C + C) production data for the US state charts comes from the EIAʼs Petroleum Supply monthly PSM which provides updated production information up to March 2025.
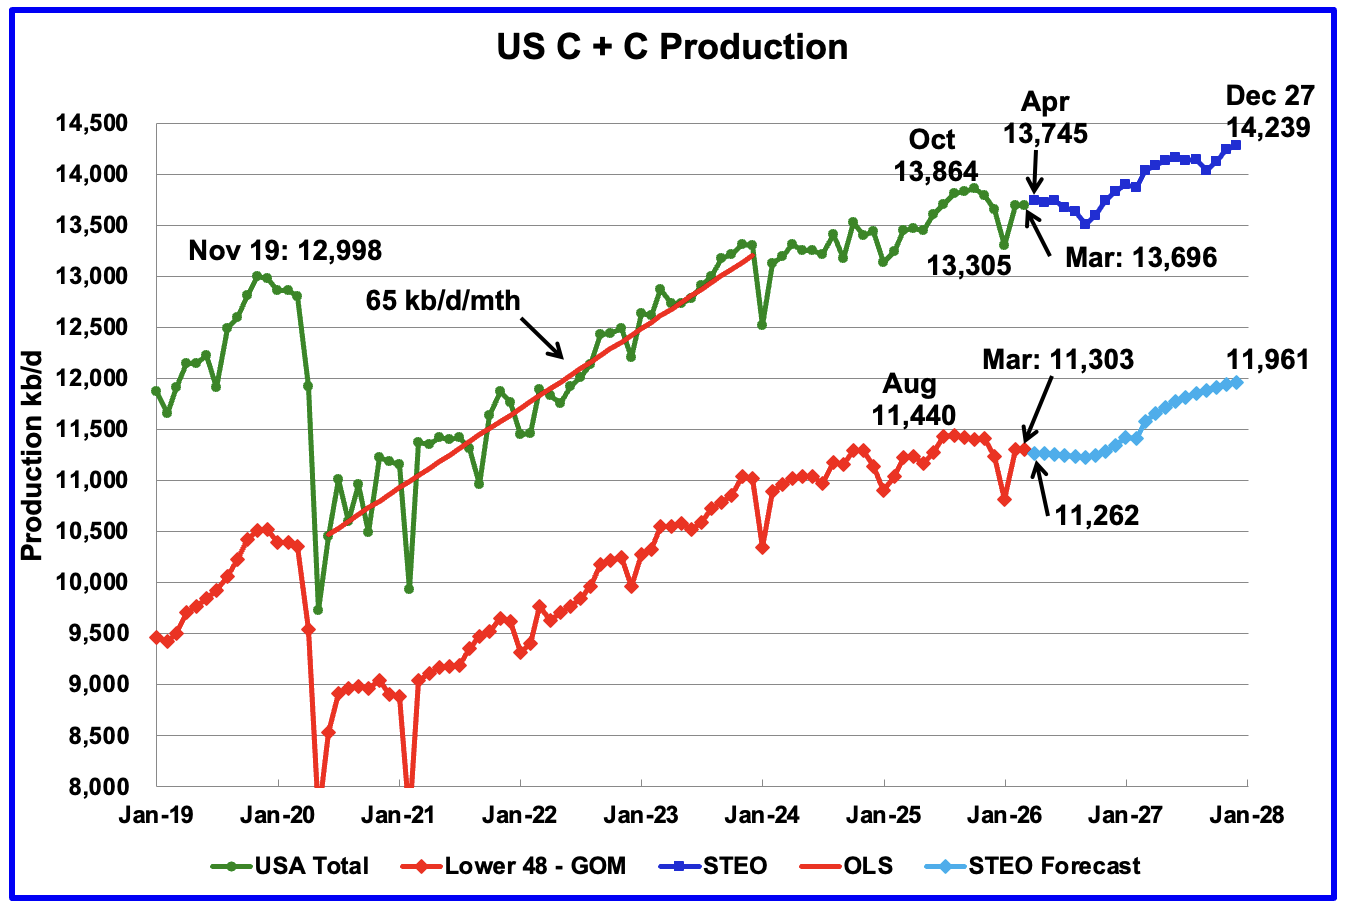
U.S. March oil production decreased by 1 kb/d to 13,696 kb/d and is down by 168 kb/d from October 2025. The largest decrease came from TX. April production is expected to rise by 49 kb/d to 13,745 kb/d according to the May STEO. Peak US oil production occurred in October 2025 at 13,864 kb/d but may be exceeded in early 2027, according to the STEO forecast.
The dark blue graph, taken from the May 2026 STEO, is the U.S. oil production forecast from April 2026 to December 2027. Output for December 2027 is expected to rise to 14,239 kb/d, upwardly revised by 82 kb/d from last month. From April 2026 to December 2027 U.S. oil production is expected to increase by 494 kb/d.
The light blue graph is the STEO’s forecast for the Onshore L48 output to December 2027. March Onshore L48 production increased by 2 kb/d to 11,303 kb/d. From March 2026 to December 2027 production is expected to increase by 658 kb/d to 11,961 kb/d, upwardly revised by 69 kb/d. The rising production starting in Octoberber 2026, according to the EIA, is due to expected higher prices for WTI and more NG pipelines being built. Note how production is essentially flat out to November 2026.
U.S. Oil Production Ranked by State
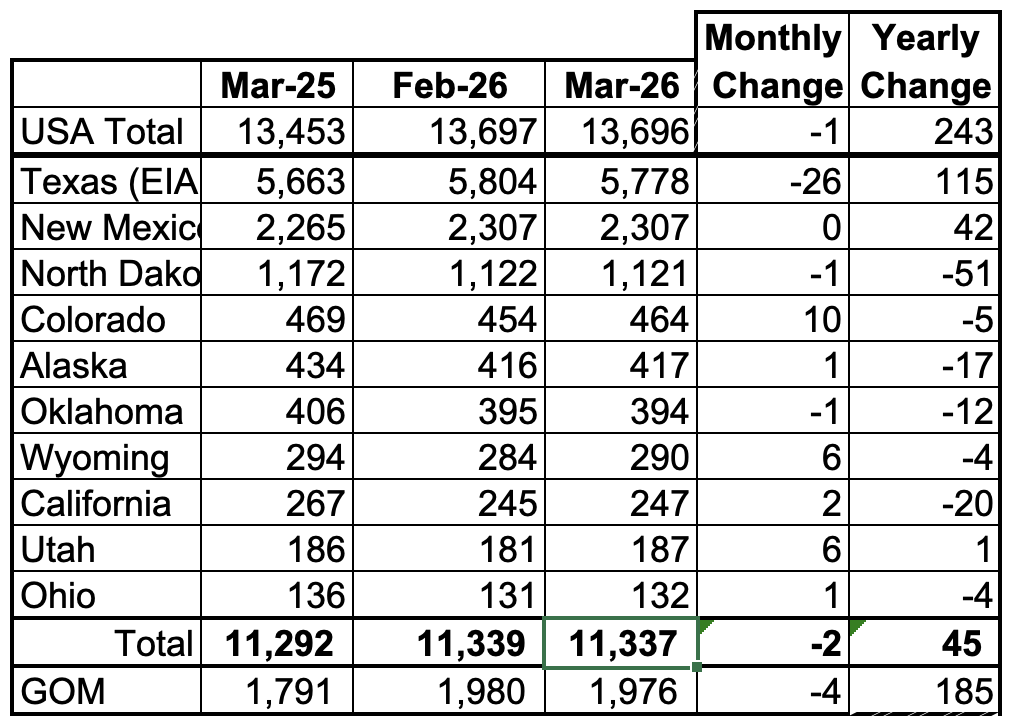
Listed above are the 10 US states with the largest oil production along with production from the Gulf of Mexico.
These 10 states accounted for 82.8% of all U.S. oil production out of a total production of 13,696 kb/d in March 2026. On a MoM basis, March oil production in these 10 states dropped by 2 kb/d. On a YoY basis, US overall production increased by 243 kb/d with the largest contributors being Texas and New Mexico and the largest decliner being North Dakota.
State Oil Production Charts
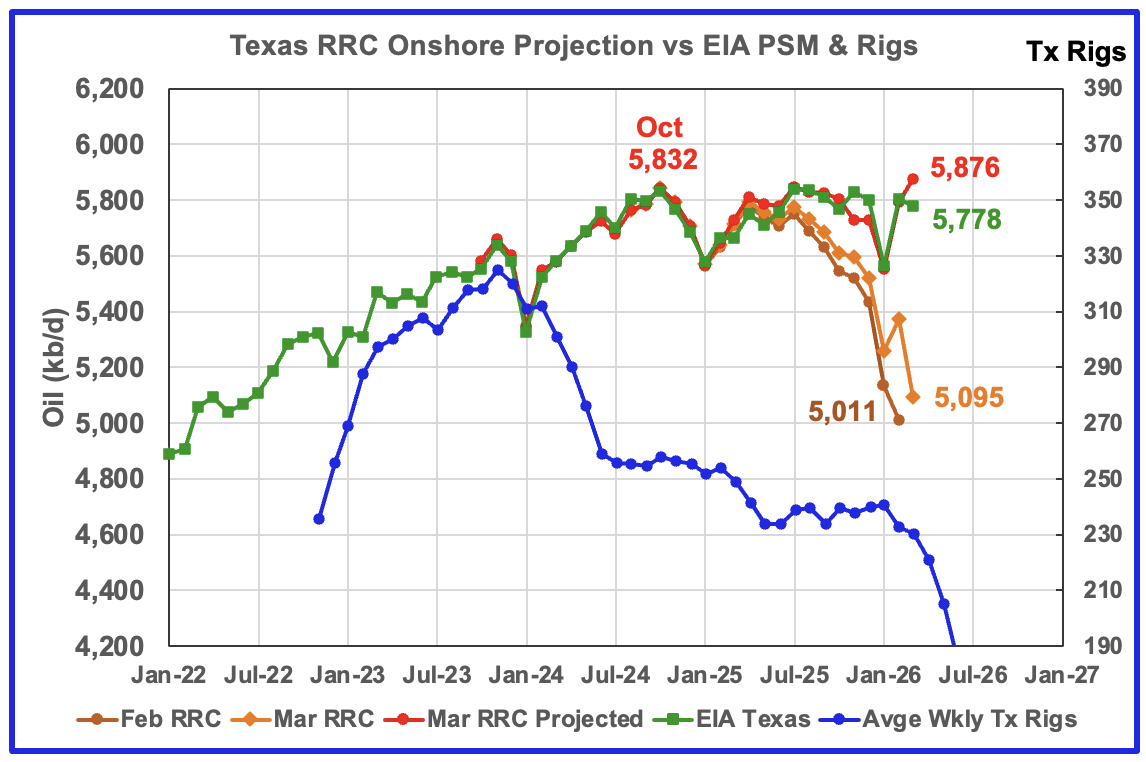
Texas’ March oil production decreased by 26 kb/d to 5,778 kb/d according to the EIA. YoY production rose by 115 kb/d.
The Texas’ RRC initial production for March dropped by 279 kb/d from February to 5,095 kb/d. The projection added 781 kb/d to raise March projected production to 5,876 kb/d. While the projection is very close for January and February, the March projection is showing an increase. The divergence is due to large upward revisions to February production in the March report which results in an optimistic projection.
The red graph is a production projection using the preliminary February and March Texas RRC data.
The blue graph shows the average number of weekly rigs reported for each month shifted forward by 10 months. So the 276 rigs operating in July 2023 have been shifted forward to May 2024. From February 2024 to July 2024, the rig count dropped from 312 in time shifted February 2024 to 256 in July 2024. That drop of 56 rigs had little impact on production up to July 2025. August 2025 appears to be the first month when the impact of the start of the flat rig count results in essentially flat production. Will the dropping rig count starting in time shifted February/March 2026 result in dropping Texas production going forward?
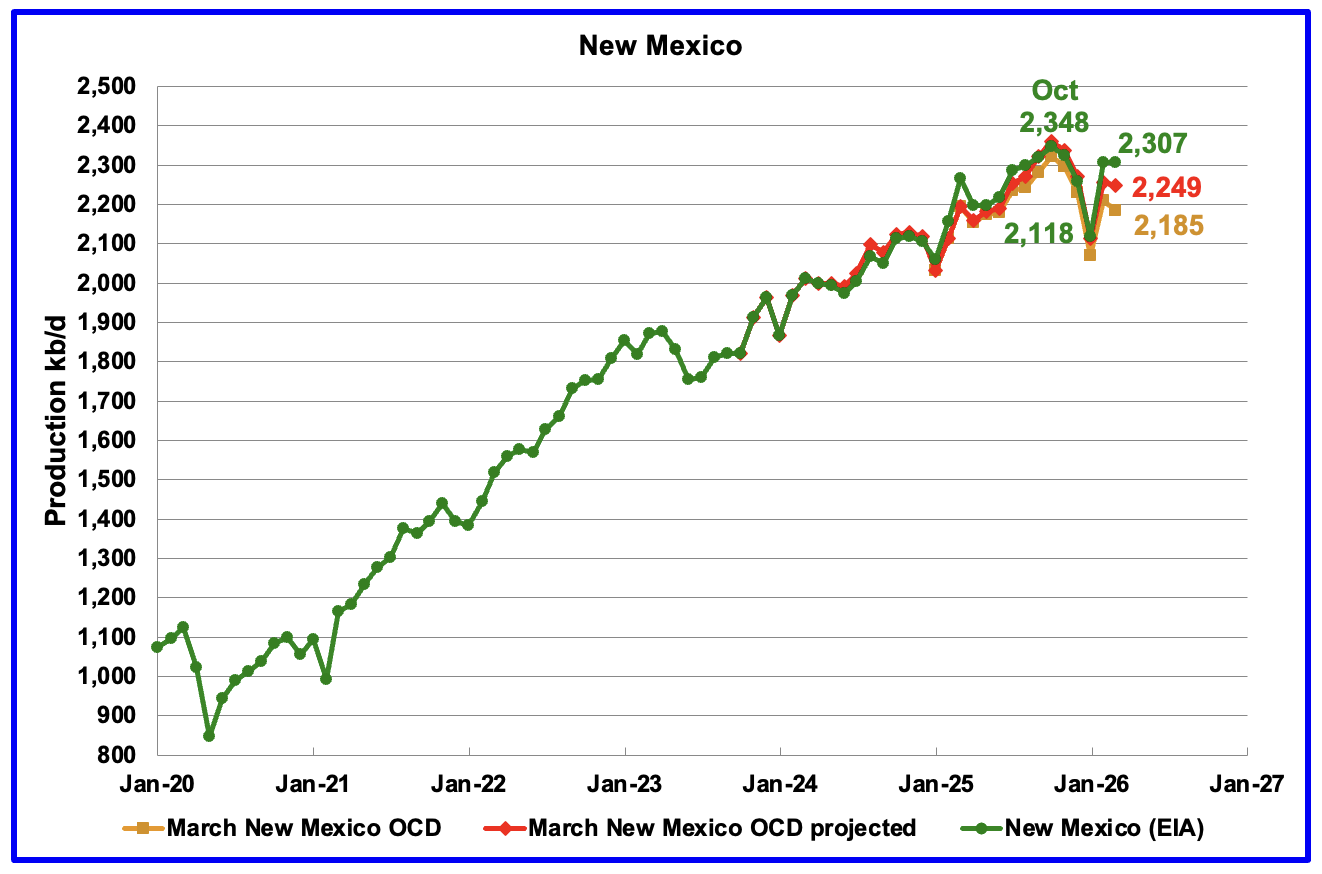
According to the EIA, New Mexico’s March production was unchanged at 2,307 kb/d. YoY production rose by 42 kb/d, second only to Texas.
The red graph shows the projected output up to March and is calculated using the preliminary February and March NM OCD data. March’s projected production decreased by 8 kb/d from February to 2,249 kb/d and is 58 kb/d or 2.5 % lower than the EIA’s reported March production. While the EIA and projection numbers are slightly different, the trend is the same.
Production in Lea County and Eddy County offset each other with Lea rising and Eddy dropping. See Permian section further down.
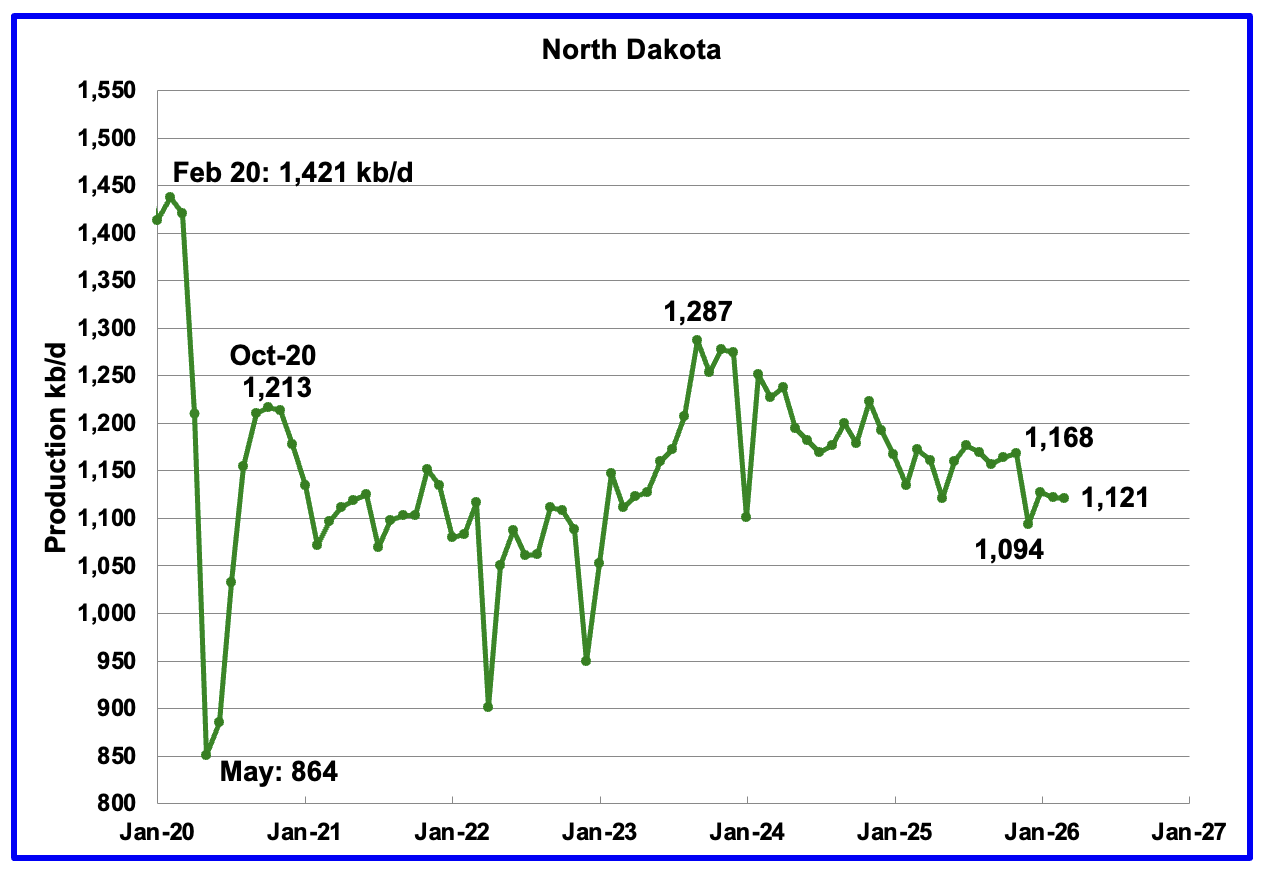
Production in North Dakota dropped by 1 kb/d in March to 1,121 kb/d, according to the EIA. March 2026 production is 51 kb/d lower than last March.
The North Dakota Department of Mineral resources reported March production increased by 9 kb/d to 1,143 kb/d, which is 22 kb/d higher than the EIA’s estimate.
According to this Article, U.S. oil operators in North Dakota are moving cautiously on ramping up drilling despite a sharp rise in oil prices.
“U.S. oil operators in North Dakota are moving cautiously on ramping up drilling despite a sharp rise in oil prices driven by the Iran war, as companies wait to see if higher prices will last long enough to justify new investment, the state’s regulator said on Friday.
While elevated prices have improved near-term fundamentals, most producers are sticking to budgets set at the end of last year, limiting any immediate jump in drilling activity, Mark Bohrer, assistant director of the Oil and Gas Division at the state’s Industrial Commission, said. However, output could edge higher in the near term as more wells are completed and some drilling activity picks up.
Harold Hamm, chief executive of Continental Resources, which helped pioneer fracking in North Dakota’s Bakken basin, plans to put drilling crews back to work after a temporary pause announced in January, local media reported. ConocoPhillips COP.N, EOG Resources EOG.N and Diamondback Energy FANG.O are also diverting resources to drill new wells or expand existing ones, mainly in the Permian basin, to take advantage of the price environment.”
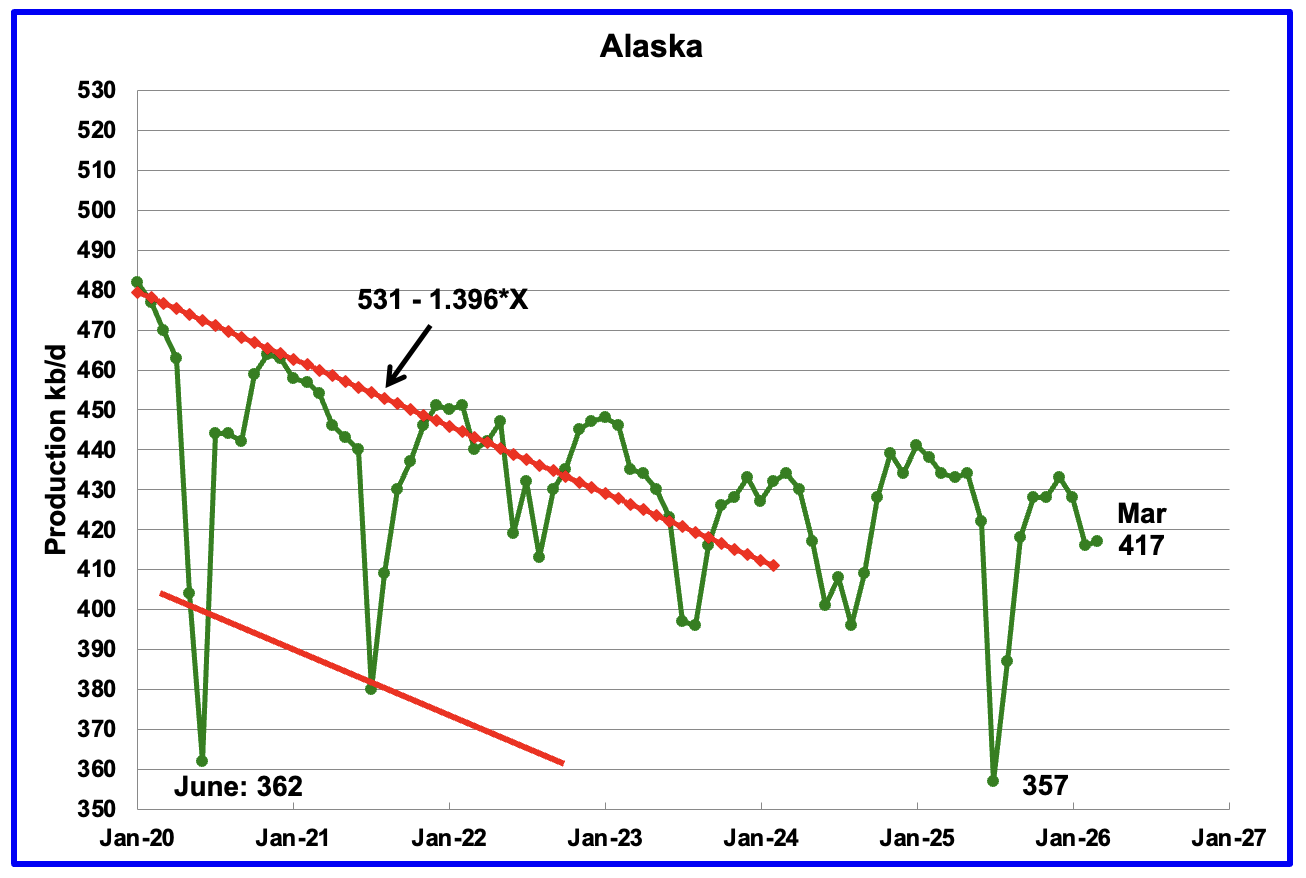
Alaskaʼs March output rose by 1 kb/d to 417 kb/d while YoY production decreased by 17 kb/d. The EIA’s weekly report for March indicated that March production would average close to 420 kb/d.
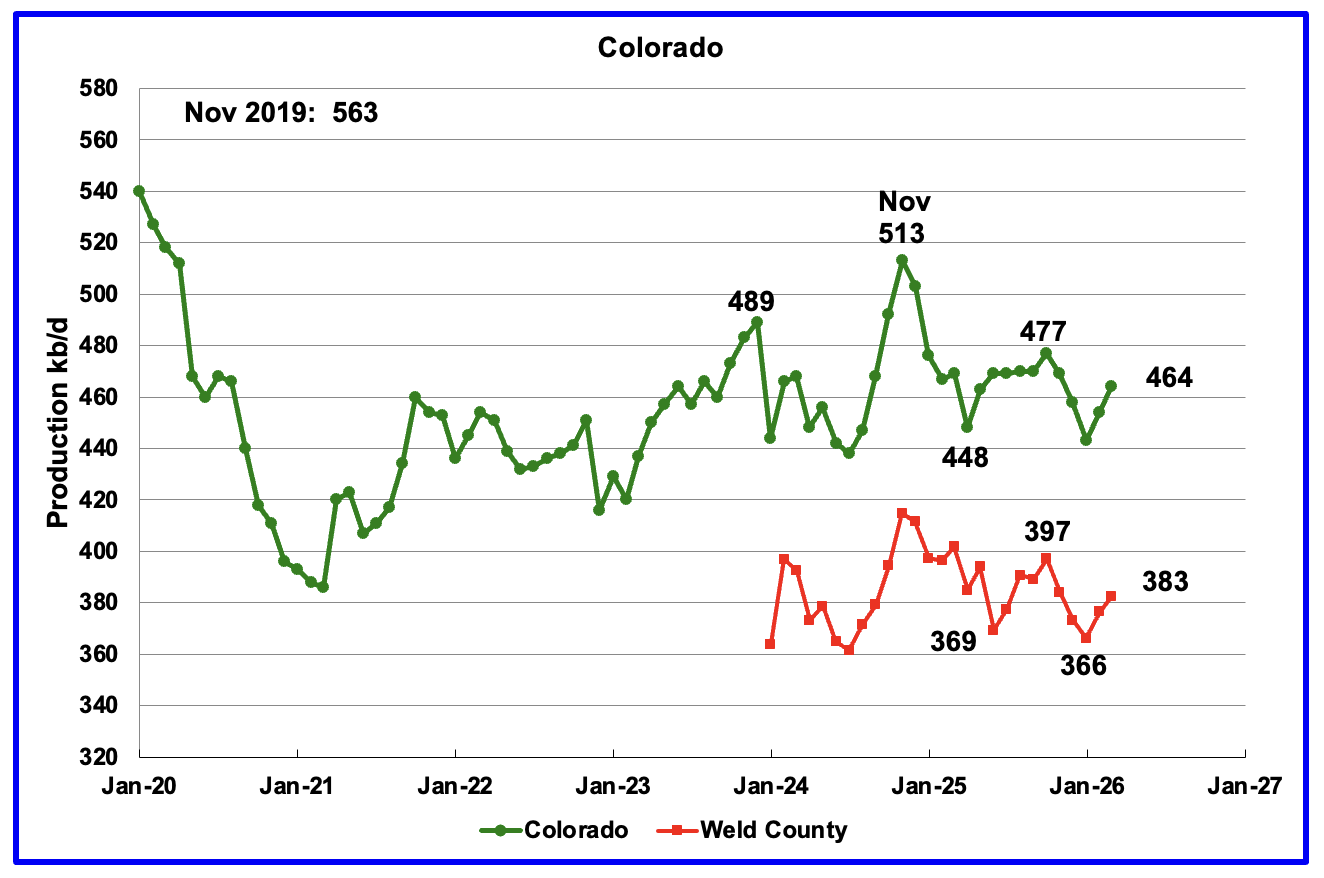
Coloradoʼs March oil production rose by 10 kb/d to 464 kb/d.
The biggest oil producing county in Colorado is Weld County and its production has been added to the chart. The two graphs have almost been parallel over the last six months. Weld’s production rose by 6 kb/d in March to 383 kb/d.
Colorado began 2026 with 7 rigs in January and they rose to 8 rigs in late May. Of the 8 rigs, 6 were stationed in Weld county.
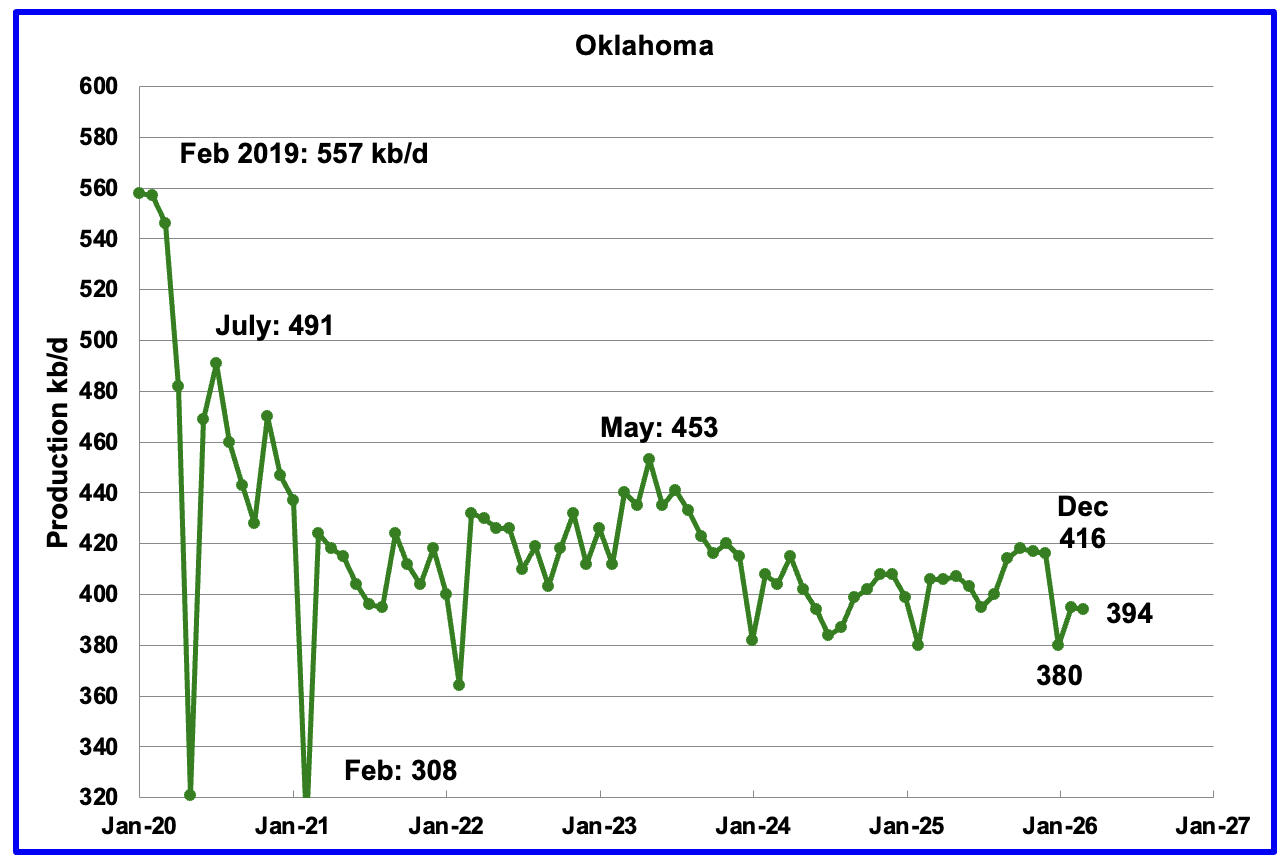
March oil production dropped by 1 kb/d from February to 394 kb/d.
Oklahoma’s January output dropped by 36 kb/d to 380 kb/d. Production remains below the post pandemic July 2020 high of 491 kb/d and is down by 59 kb/d since May 2023. The large drop out of the 400 kb/d ± 20 kb/d range may be due to the late January extreme weather.
Oklahoma had 51 operational rigs in May 2025 which slowly dropped to 41 rigs in July 2025. The rig count has been fairly steady around 41 from July 2025 to May 2026. The steady rig count since July 2025 may be showing up in the steady oil production around 400 kb/d.
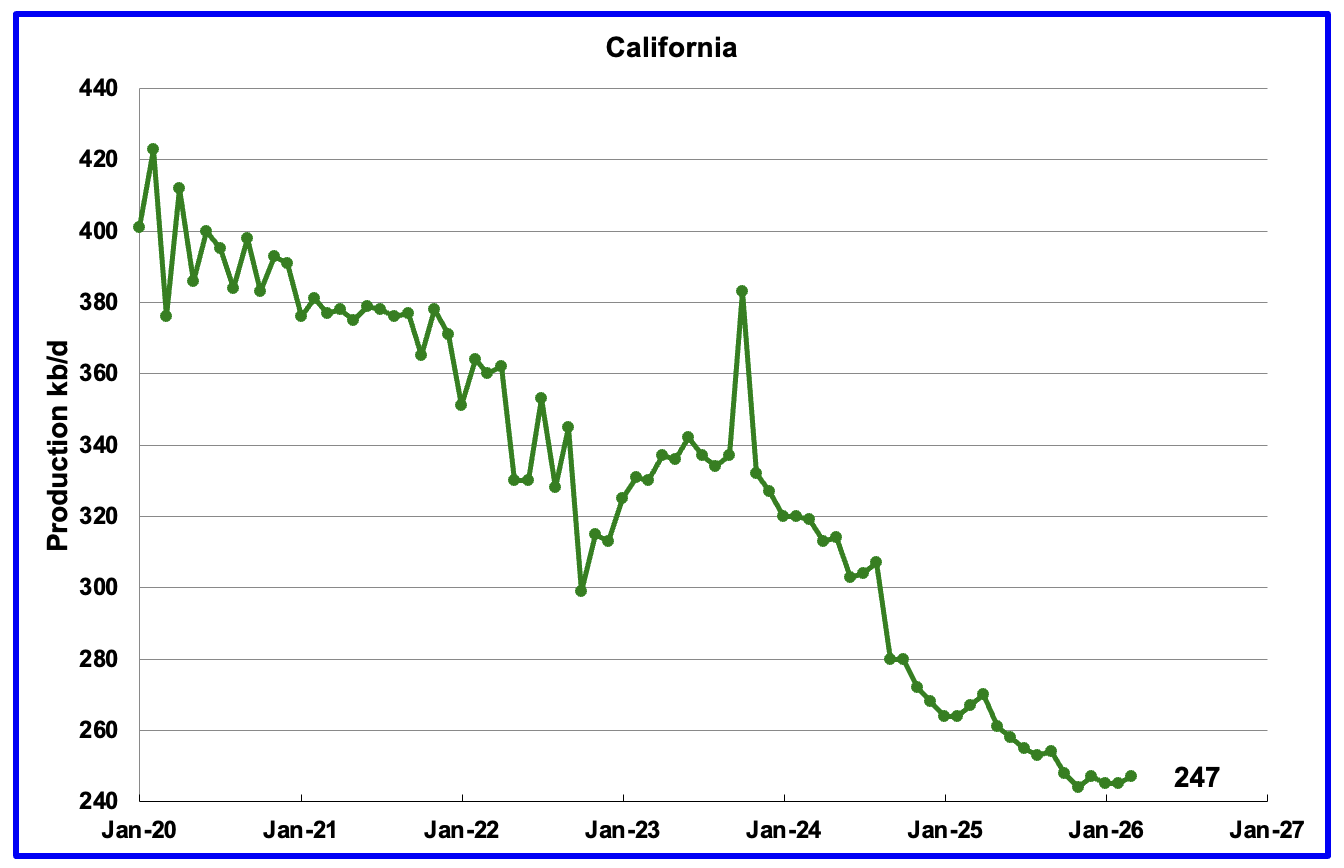
California’s overall declining production trend continues. However March production rose by 2 kb/d to 247 kb/d. YoY production dropped by 20 kb/d.
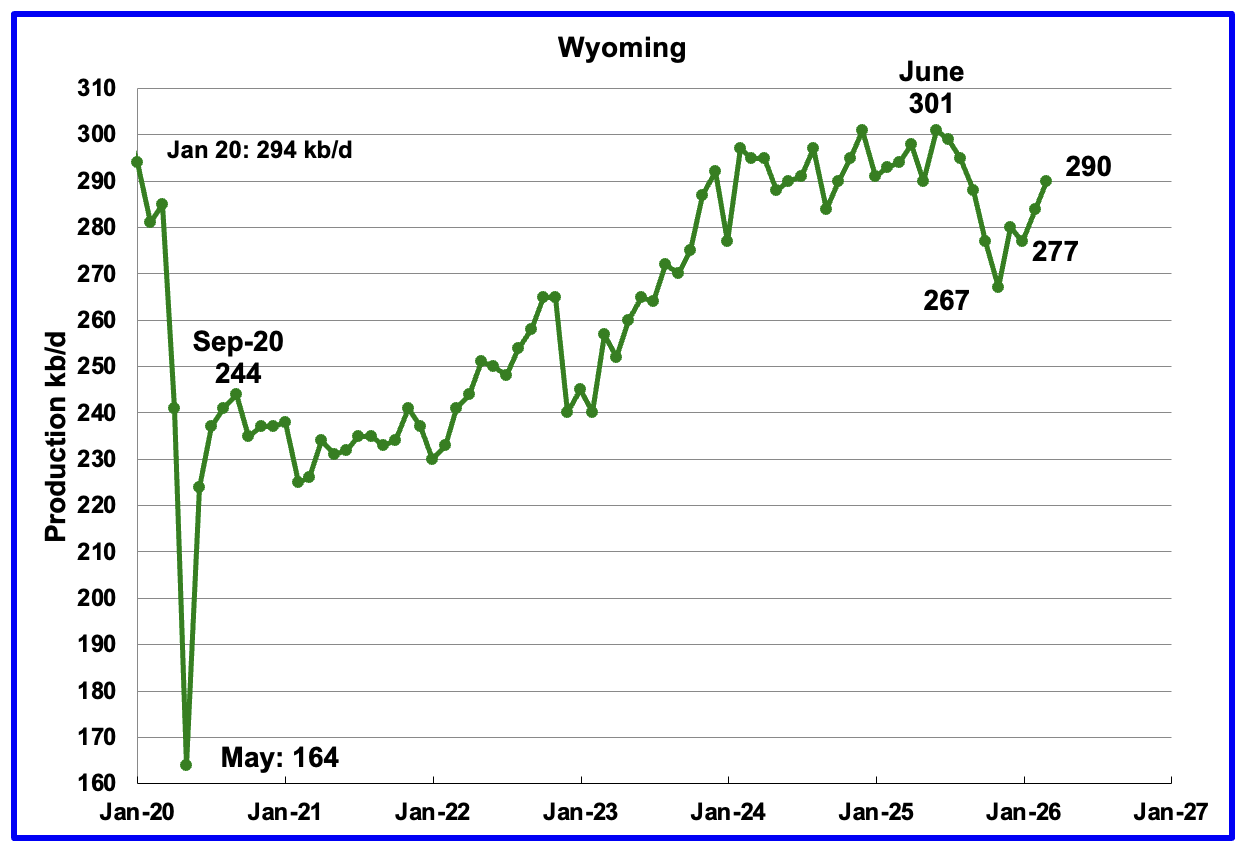
Wyoming’s oil production reached a post pandemic high in June 2025 of 301 kb/d. Production dropped in each of the subsequent 5 months before rebounding in December. March production rose by 6 kb/d to 290 kb/d.
Wyoming started the year with 13 rigs and in May also had 13 operational rigs.
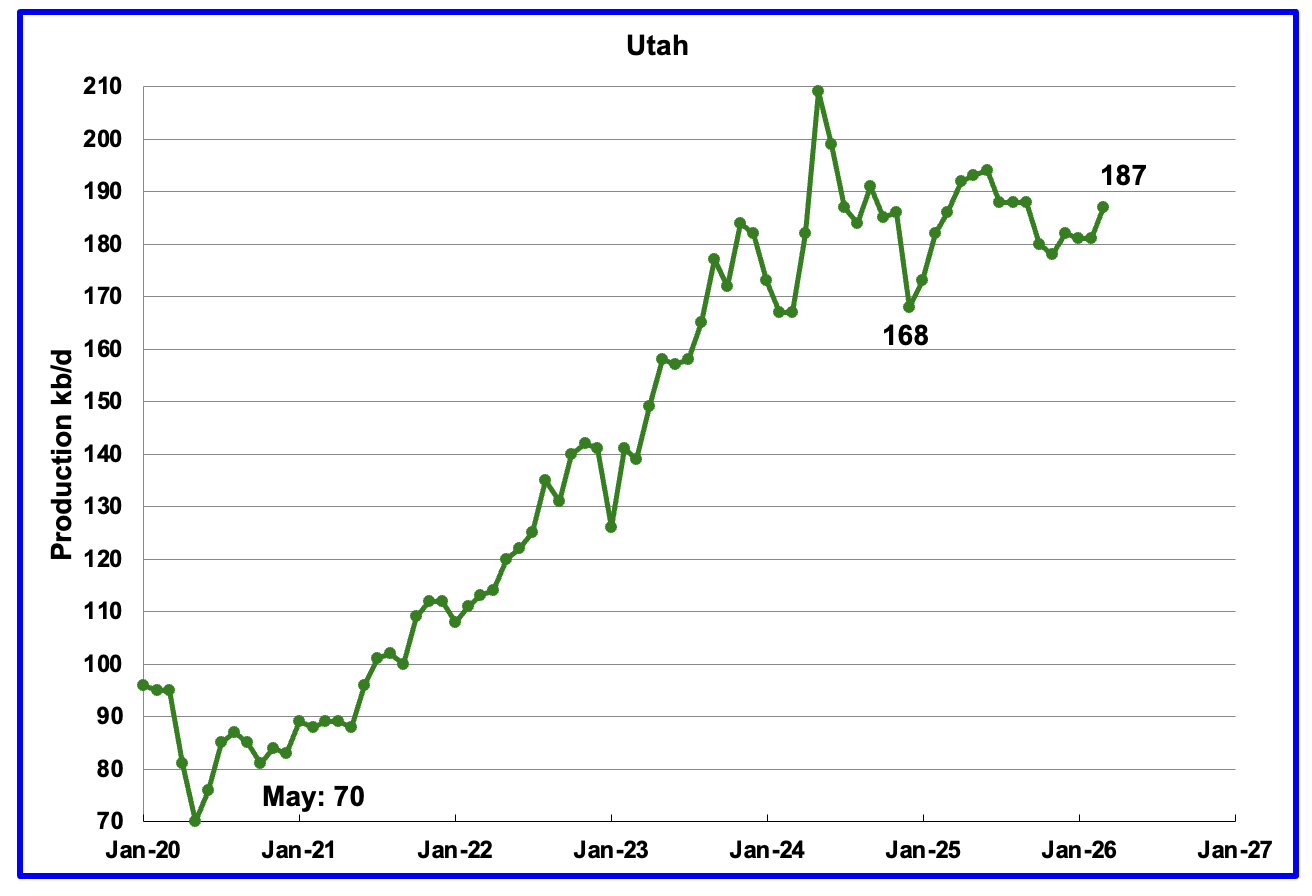
March production rose by 6 kb/d to 187 kb/d. Utah had 11 rigs operating in late January. In May, the number of operational rigs had dropped to 8.
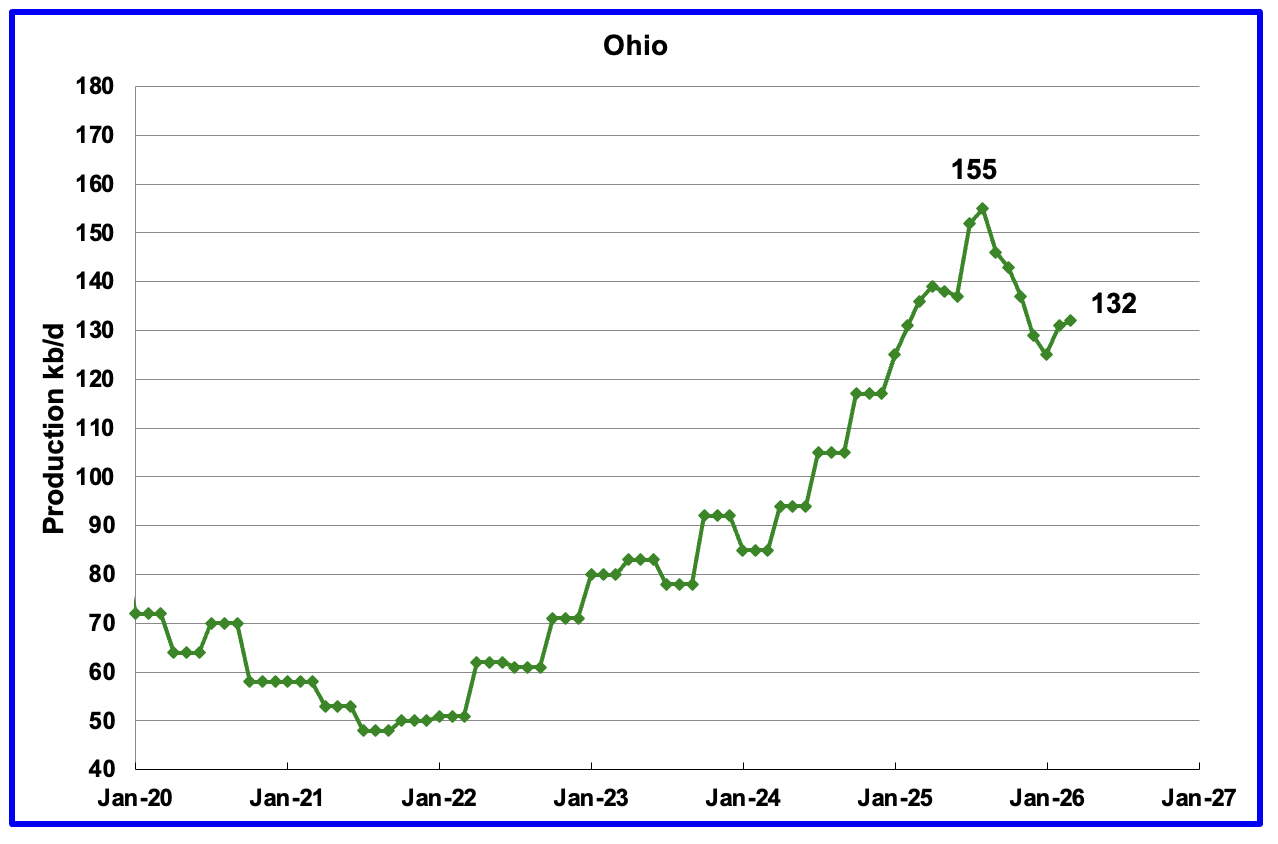
Ohio’s March oil production increased by 1 kb/d to 132 kb/d and was 23 kb/d lower than the August peak of 155 kb/d. In January 2026 Ohio had 12 NG rigs operating. At the end of May, nine NG rigs were operational along with one oil rig.
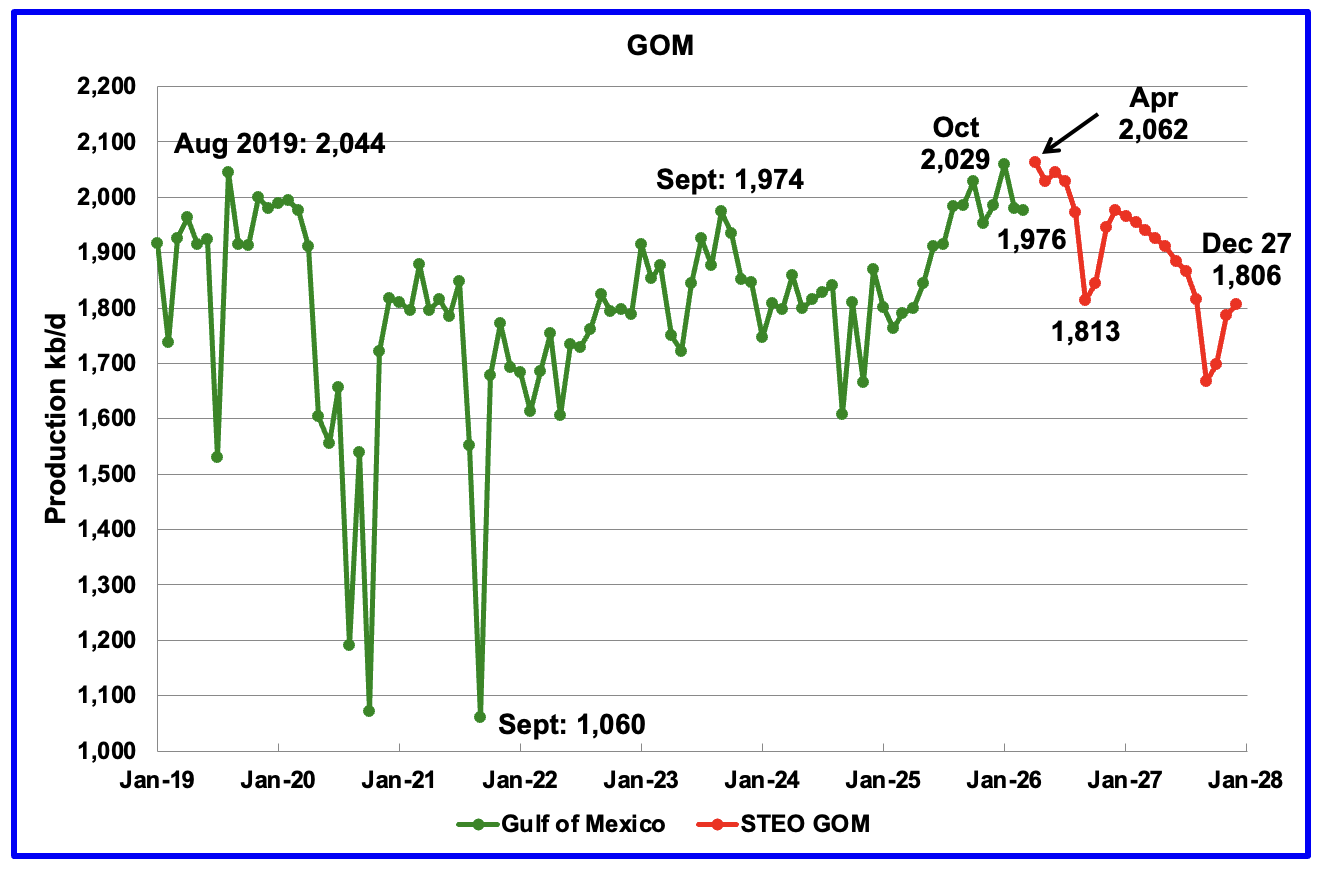
GOM production dropped by 4 kb/d in March to 1,976 kb/d. It is up by 185 kb/d YoY.
The May 2026 STEO GOM projection has been added to this chart. For April production is projected to increase to 2,062 kb/d. If the projection is correct, April production will be a new high, exceeding the August 2,019 high by 18 kb/d. It also projects production in December 2027 will be 256 kb/d lower than April 2026 at 1,806 kb/d.
A Different Perspective on US Oil Production
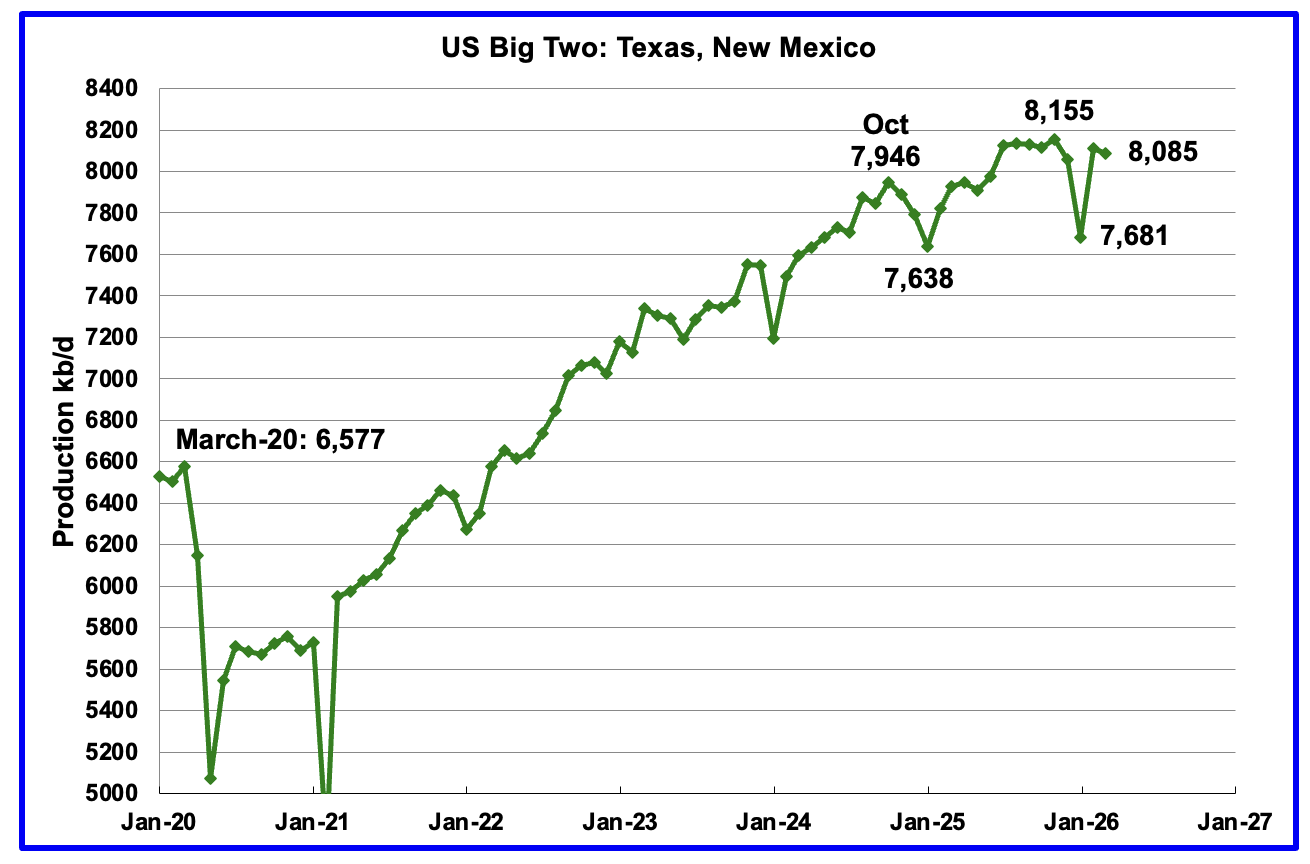
Combined Oil output for the Big Two states Texas and New Mexico.
March production in the Big Two states decreased by a combined 26 kb/d to 8,085 kb/d. The decrease was all due to a production drop in Texas while New Mexico production was flat. Clearly these two states were the drivers of US oil production growth up to July 2025. The essentially flat production starting in August 2025 was the first sign that production in these two states was close to peaking. The next few months will determine whether these two states have reached peak production.
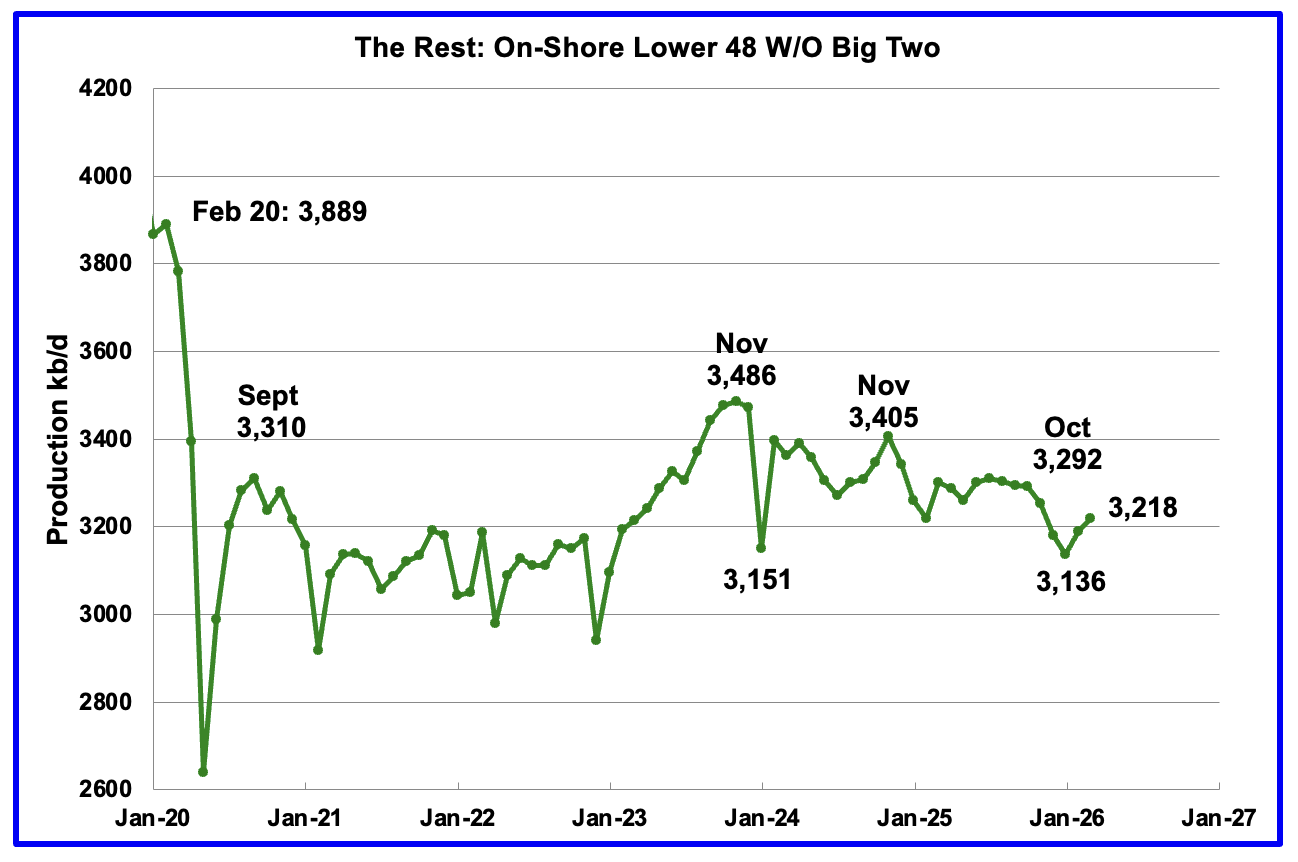
Oil Production by The Rest
March oil production by The Rest rose by 28 kb/d to 3,218 kb/d and is 268 kb/d lower than November 2023. The remaining states may have entered a slowly decline phase.
Permian Basin Report for Main Counties and a District
This special monthly Permian section was added to the US report because of a range of views on whether Permian production will continue to grow or will peak over the next year or two. The issue was brought into focus many months back by two Goehring and Rozencwajg Reports and Report2 which indicated that a few of the biggest Permian oil producing counties were close to peaking or past peak.
A more recent report was issued and can be reviewed Here. In this report they state:
“For years now, we have outlined with what we hoped was clarity, and what we now submit was prescience, the view that U.S. shale oil, that great source of modern supply, could not grow forever. It would mature, crest, and begin its long descent. That moment, by our models and measures, has arrived: shale has plateaued, and 2024 appears to be its high-water mark. And yet, investor sentiment has scarcely been more downbeat.”
This section will focus on the four largest oil producing counties in the Permian, Lea, Eddy, Midland and Martin. It will track the oil and natural gas production and the associated Gas Oil Ratio (GOR) on a monthly basis. The data is taken from the state’s government agencies for Texas and New Mexico. Typically the data for the latest two or three months is not complete and is revised upward as companies submit their updated information. Note the natural gas production shown in the charts that is used to calculate the GOR is the gas coming from both the gas and oil wells.
Of particular interest will be the charts which plot oil production vs GOR for a county to see if a particular characteristic develops that indicates the field is close to entering or in the bubble point phase. While the GOR metric is best suited for characterizing individual wells, counties with closely spaced horizontal wells may display a behaviour similar to individual wells due to pressure cross talking . For further information on the bubble point and GOR, there are a few good thoughts on the intricacies of the GOR in an earlier POB comment and here. Also check this EIA topic on GOR.
New Mexico Permian
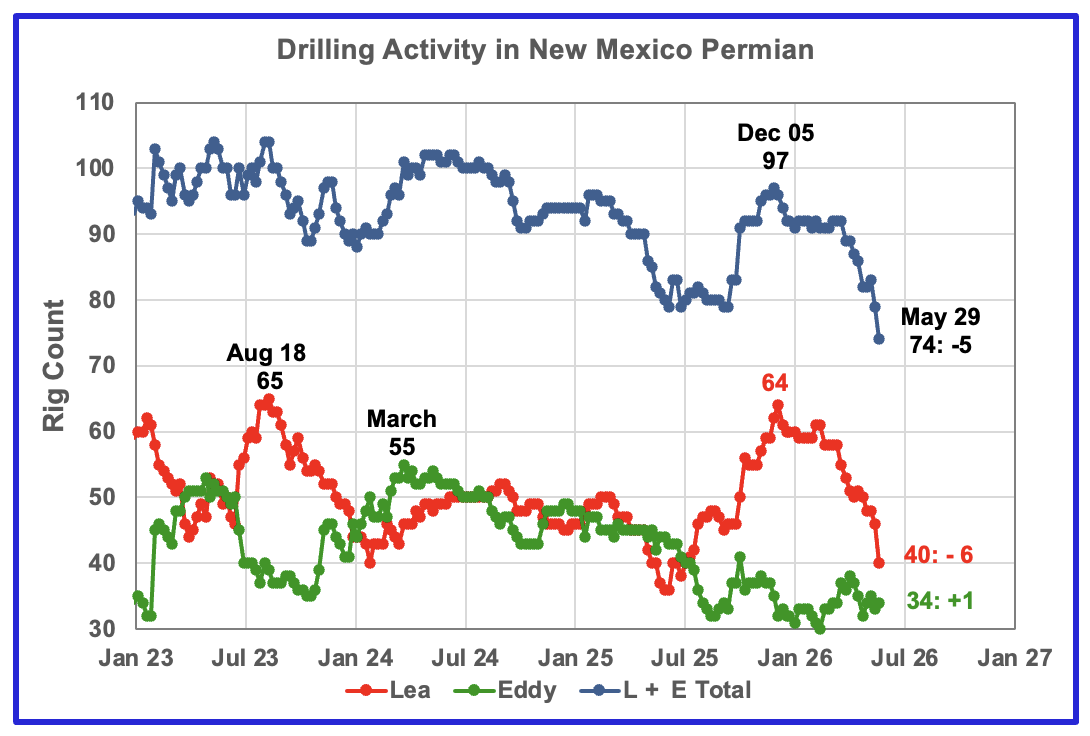
The rig counts in both Lea and Eddy counties have started to decline over the last 8 weeks. Over the past five months Lea County dropped 24 rigs to 40 while Eddy dropped 4 rigs from 38 in April to 34 in May. Overall NM dropped 23 rigs to 74 from December 2025 to late May 2026. Will the dropping rig counts show up in dropping production in a few months?
Oil Production in New Mexico’s Primary Permian Counties
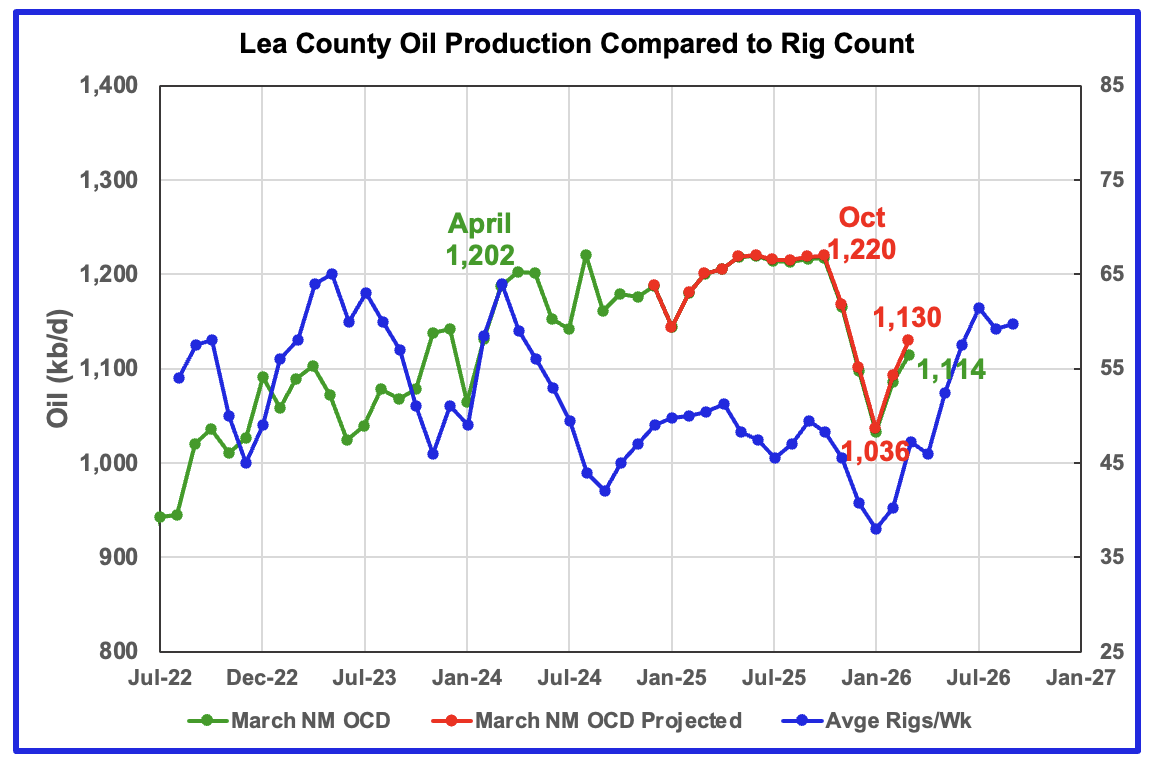
Lea County’s oil production started its plateau phase in April 2024 at 1,202 kb/d and it continued to October 2025. November 2025 to January 2026 have seen steady production drops in both the projected and NM OCD’s preliminary production. However the majority of January’s projected production drop of 65 kb/d was due to the severe January weather. February projected production rebounded and came in at 1,093 kb/d, revised down from 1,123 kb/d in the previous post.
March projected production increased by 37 kb/d to 1,130 kb/d. It now appears more likely that the projected production increase in February and March are related to the time shifted increasing rig count and to some storm related recovery. The question/issue here is whether production will exceed the October 2025 peak of 1,220 kb/d or peak at a new lower level?
Preliminary March data from New Mexico’s Oil Conservation Division (OCD) indicates Lea County’s March oil production rose by 28 kb/d to 1,114 kb/d, green graph.
The blue graph shows the average number of weekly rigs operating during a given month as taken from the weekly rig data. The rig graph has been shifted forward by 7 months. So the 64 Rigs/wk operating in August 2023 have been time shifted forward to March 2024 to show the possible correlation and time delay between rig count, completion and oil production.
Note that rig counts are being used to project production as opposed to completions because state completion data is not available. Completion data from the Drilling Productivity report below indicates that the number of completed DUCs slightly exceeds newly drilled wells in the Permian basin.
According to this Article, Devon Energy has recently acquired land in Lea and Eddy counties. The acquisition cost $2.6B or $161,500 per net acre and adds approximately 400 net locations normalized to 2-mile laterals, with expected strong well economics and low breakevens.
The cost for each of the 400 wells is $6.5M. Is this a good deal? According to this Article: “The price is “eye watering compared to historical M&A in the Permian,” RBC Capital Markets analyst Scott Hanold said in a note. The leases are mainly in three sections of the basin that have no existing development, and one is near Devon’s best-performing asset, Hanold said.
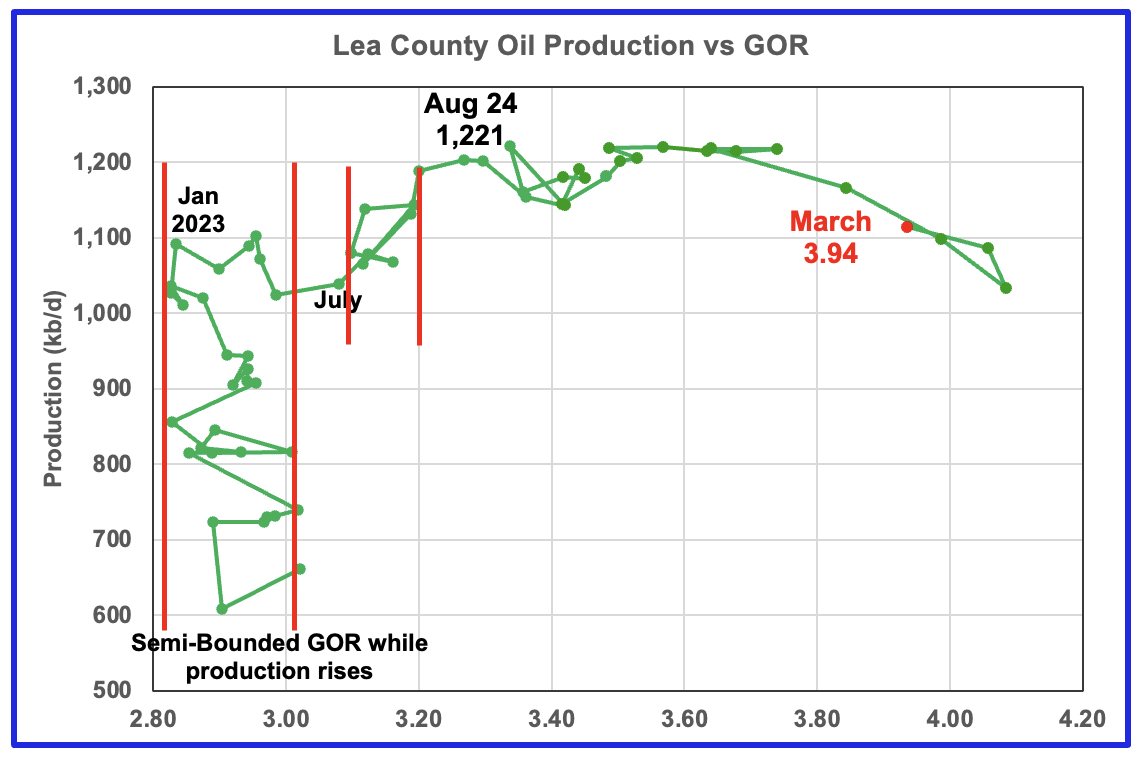
After much zigging and zagging, oil production in Lea county stabilized just below 1,100 kb/d in early 2023. Once production reached a new high in January 2023, production appeared to be on a plateau while the GOR started to increase rapidly to the right and first entered the bubble point phase in July 2023.
Since July 2023 Lea County’s production continued to increase as the GOR remained within a second semi-bounded region. This may indicate that additional production was coming from an oilier part of a layer since the GOR’s behaviour since August 2023 to March 2024 time frame appears once again to be in a second semi bounded GOR phase accompanied with rising production.
The GOR moved out of the second semi-bounded GOR region in April 2024 and production hit a new high of 1,221 kb/d in August 2024. From August 2024 to February 2025 the GOR was range bound between 3.34 and 3.53 but starting in June 2025 the GOR started to rise every month, except for one, to hit new highs. February and March saw a double change in direction, both a production increase and a GOR decrease to 3.94, which may be consistent with rising production.
This zigging and zagging GOR pattern within a semi-bounded GOR while oil production increases to some stable level and then moves out to a higher GOR to the right has shown up in a number of counties. See a few additional cases below. The rising GOR to new highs and dropping oil production in Lea county is an early indicator that production may be entering a declining phase.
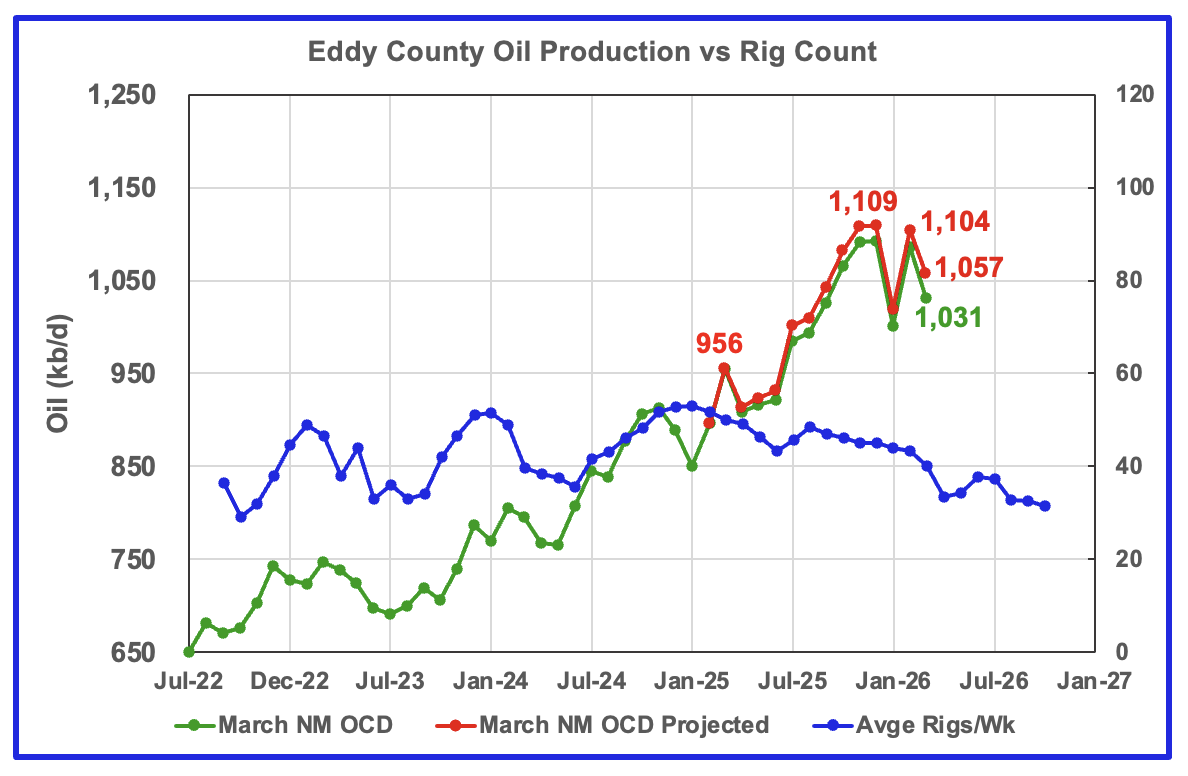
Eddy’s March projected oil production decreased by 47 kb/d to 1,057 kb/d while preliminary production from the NM OCD decreased by 55 kb/d to 1,031 kb/d. Most of the February production rise was due to a rebound from the severe January weather. If the storm had not occurred, January production would have been closer to 1,100 kb/d.
March production along with upward revisions to previous months indicates that Eddy county may have peaked in December 2025. The dropping rig count starting in time shifted September 2025 may have finally shown up in falling production in March. November, December and February projected production formed a plateau. The March production drop by 47 kb/d to 1,079 kb/d may have ended the plateau.
The blue graph shows the average number of weekly rigs operating during a given month as taken from the above weekly drilling chart. The rig graph has been shifted forward by 8 months to roughly coincide with the increase in the production graph starting in October/November 2023.
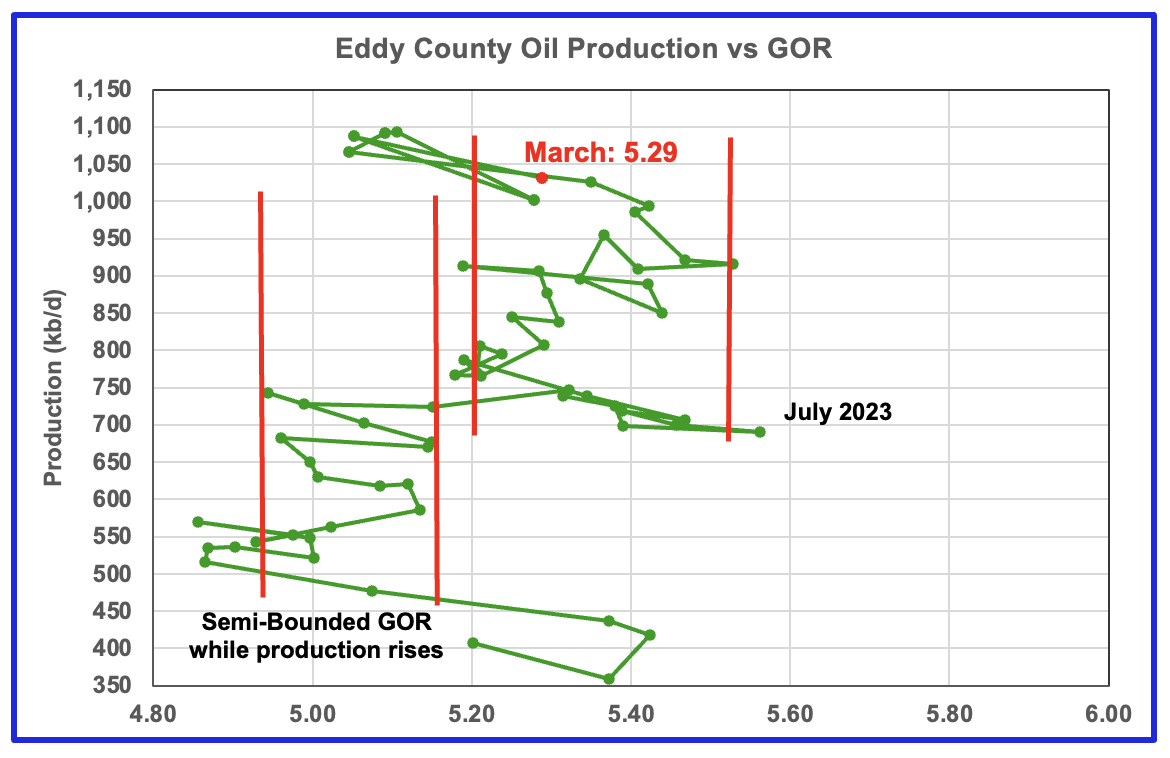
The Eddy county GOR pattern is similar to Lea county except that Eddy broke out from the first semi bounded range earlier and then added a second wider semi-bounded GOR phase.
For March New Mexico’s Oil Conservation Division (OCD) reported preliminary oil production decreased by 55 kb/d to 1,031 kb/d while the GOR rose to 5.29 and moved back into the second Semi-Bounded GOR range.
Texas Permian
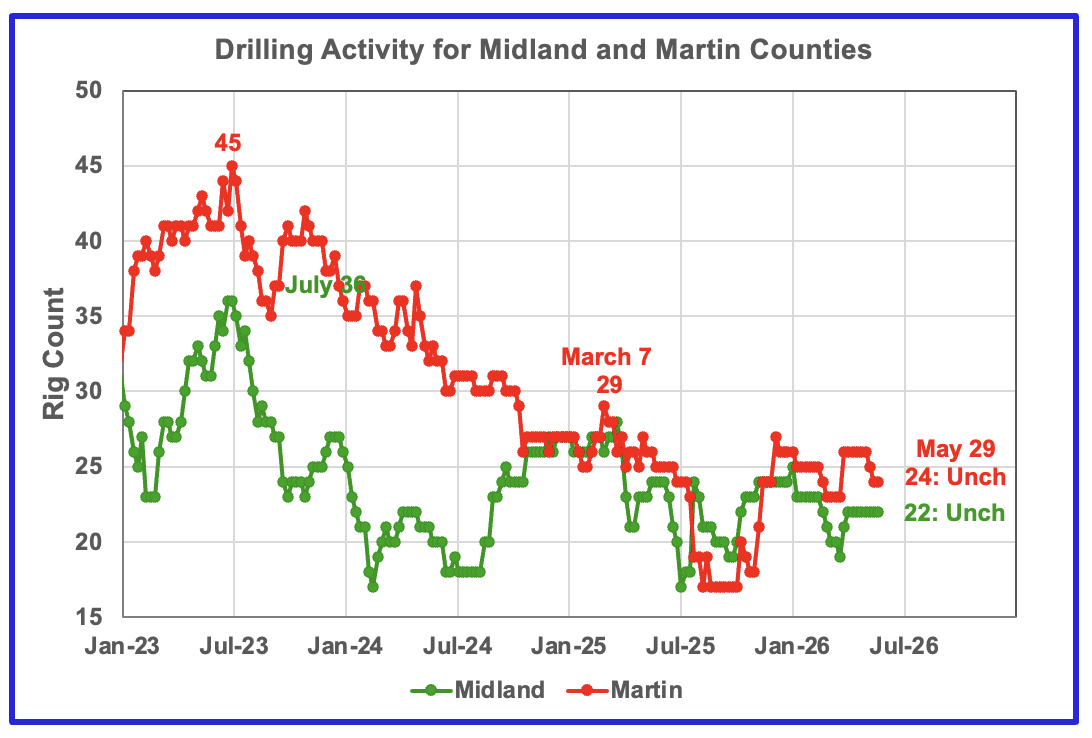
The rig count in Midland county has remained unchanged for the last seven weeks while Martin county reduced its rig count from 26 to 24 over the last few weeks in May.
Oil Production in the Two Primary Texas Permian Counties
Comparison Chart from previous post.
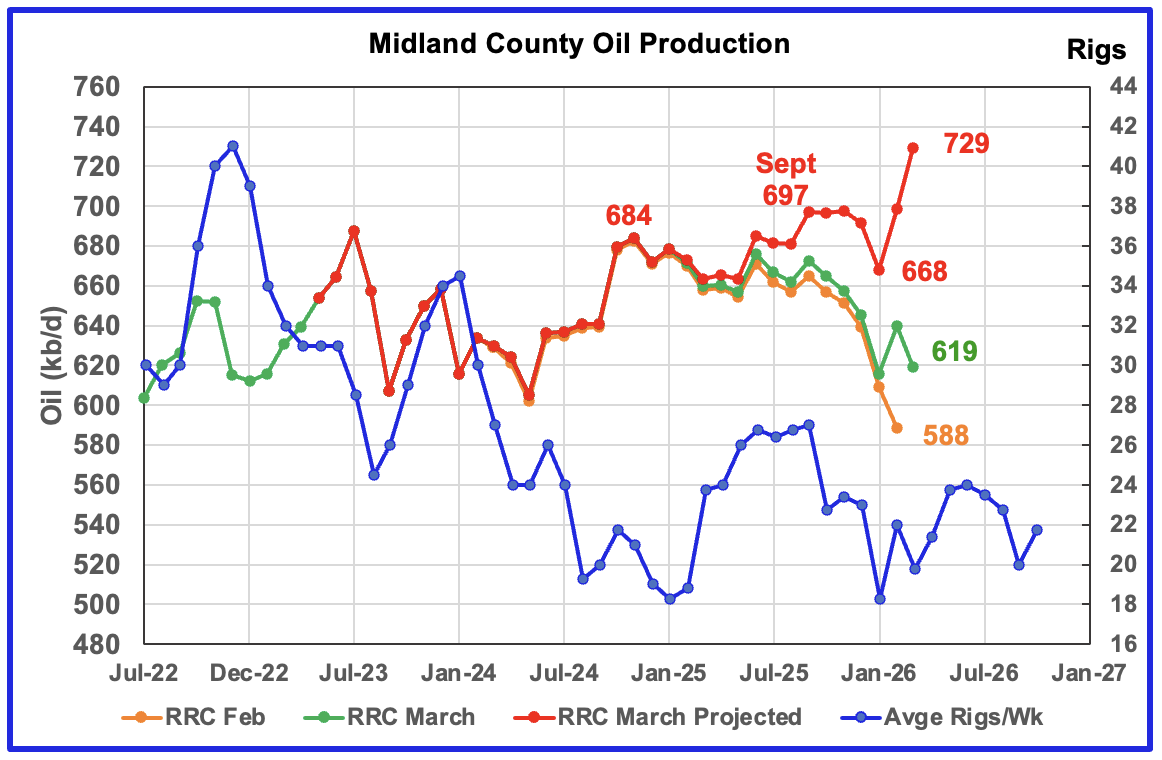
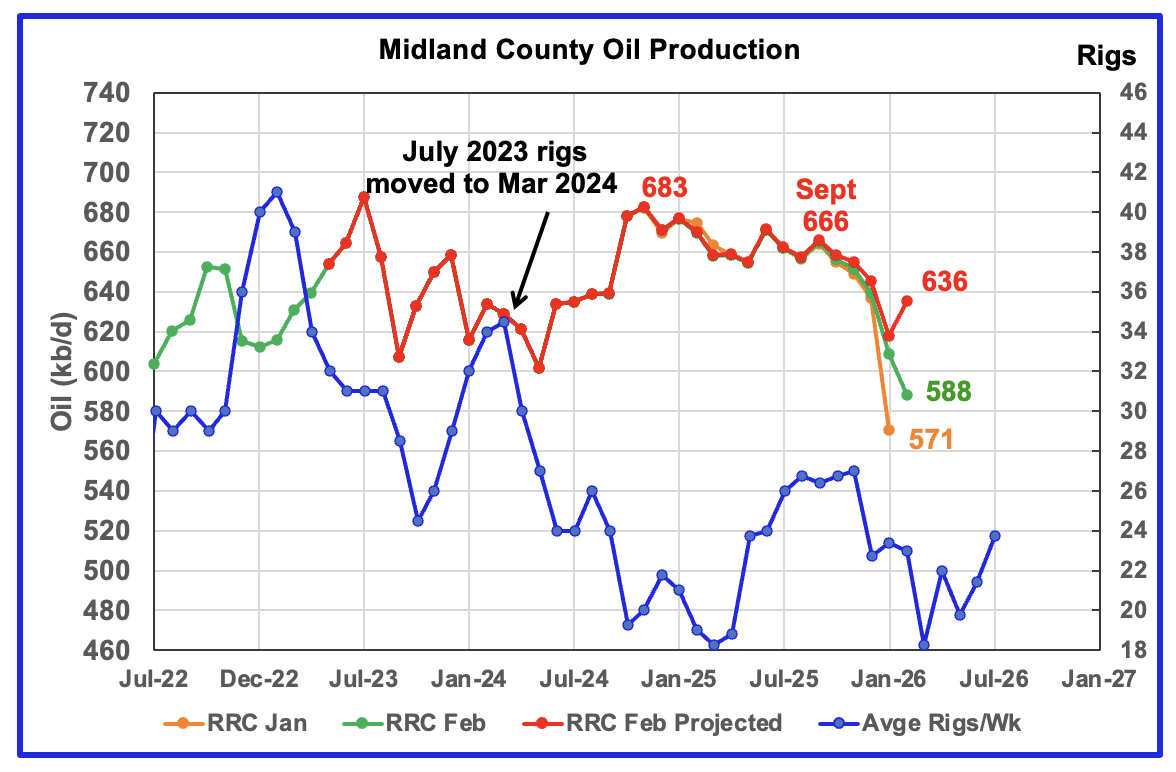
March projected production rose by 30 kb/d to 729 b/d. The February rise is due to the production rebound from the severe Texas winter storm in late January. With the rig count rising in time shifted February and March from the January low, the February and March increases may be directionally correct. However combining the sharp drop in the time shifted October 2025 to January 2026 rig count along with the dropping preliminary RRC March production along with the large February gap between the orange and green graphs makes me think that Midland’s March oil production is Overly Optimistic.
Compare the projected production for September 2025 in the preceding comparison chart with the current one. Production has increased by 31 kb/d from 666 kb/d to 697 kb/d. The increase is due to the atypical large upward revisions to the February production in the March RRC report. Hopefully April will clarify Midland’s production trend going forward.
The orange and green graphs show preliminary oil production for Midland County as reported by the Texas RRC for February and March, respectively. The red graph uses February and March data to project production as it would look after being updated over many months.
The blue graph shows the average number of weekly rigs operating during a given month as taken from the weekly drilling chart. The rig graph has been shifted forward by 6 months to better align with the latest production.
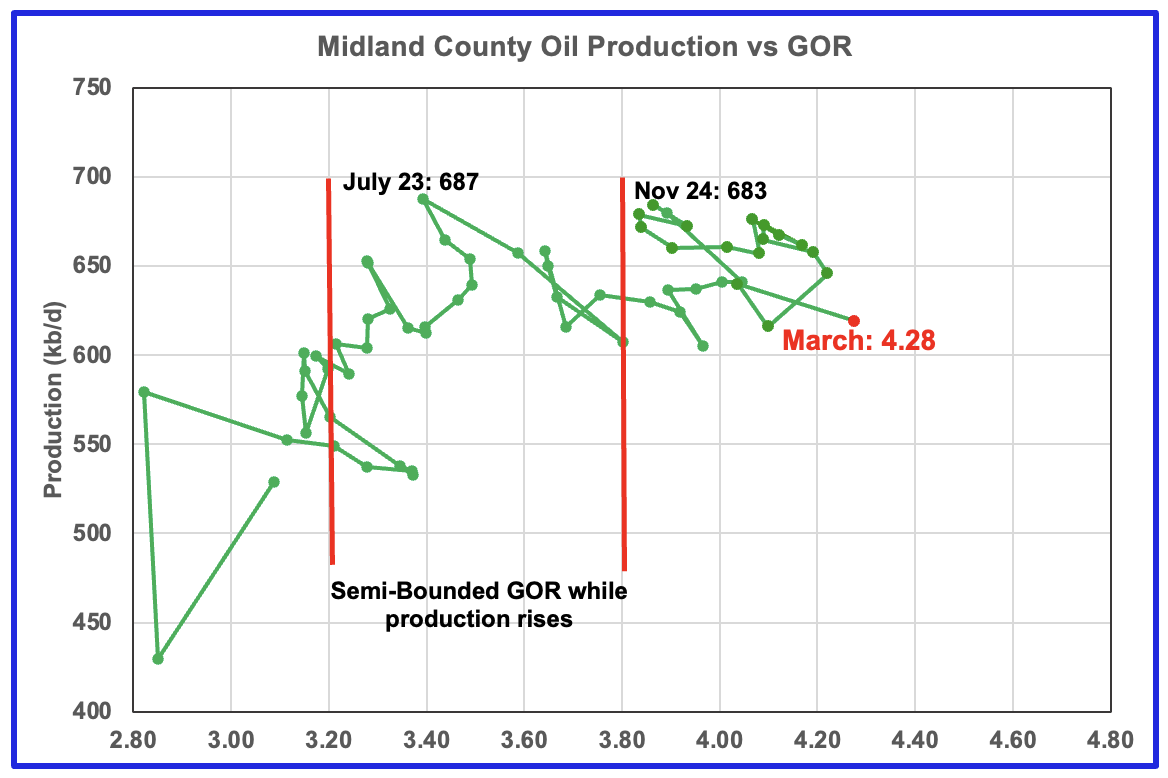
For March the Midland GOR ratio rose to a new high of 4.28 while the reported preliminary oil production dropped by 21 kb/d to 619 kb/d.
When the Midland county GOR initially moved into the bubble point phase, oil production and the GOR stayed within a narrow GOR range of 3.8 to 4.2 outside of the initial Semi-Bounded GOR region from March 2024 to November 2025. For March GOR rose to a new high of 4.28, which is an indicator of dropping production.
The oil production and GOR data shown in this chart are based on the RRC’s March preliminary production report.
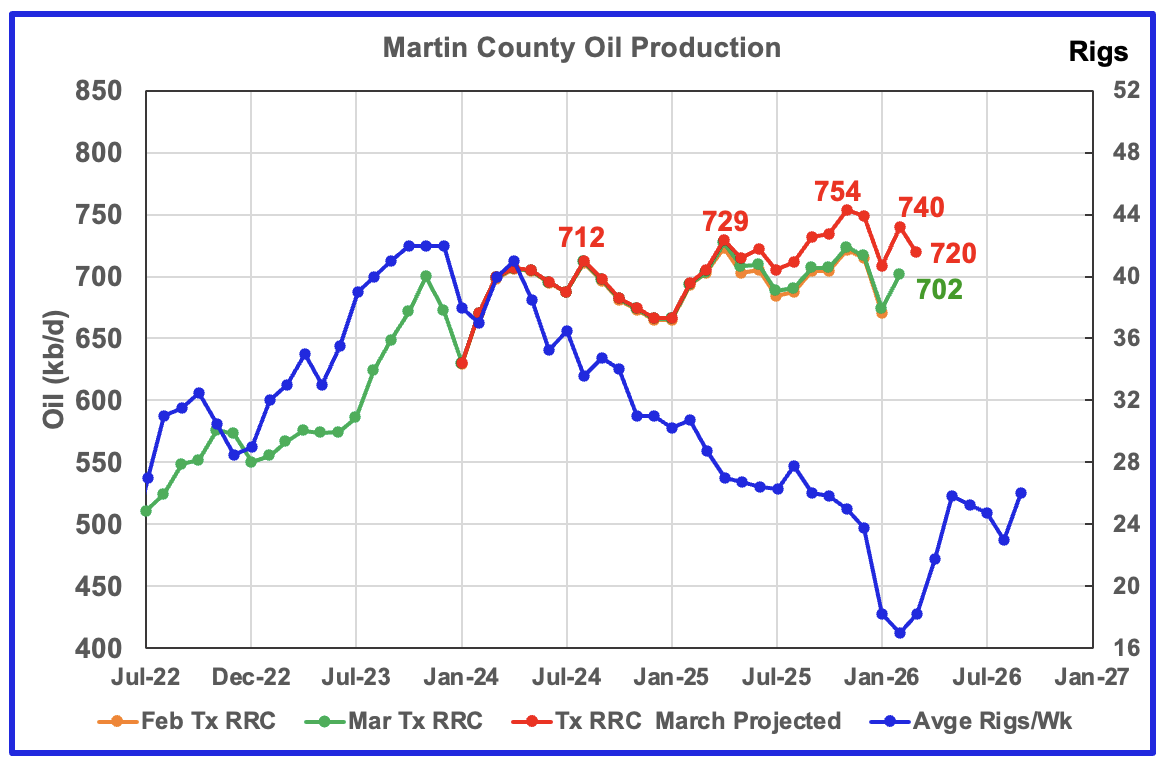
Martin county’s projected March oil production dropped by 20 kb/d to 720 kb/d. Production has been essentially flat since August 2024 even though the rig count has been in a steady decline. Will the rising rig count starting in time shifted April affect production?
The red graph is a projection for oil production as it would look after being updated over many months. This projection is based on a methodology that uses preliminary February and March oil production data.
The orange and green graphs show production for Martin County as reported by the Texas RRC for February and March. The blue rig graph time shifts the rig count forward by 5 months.
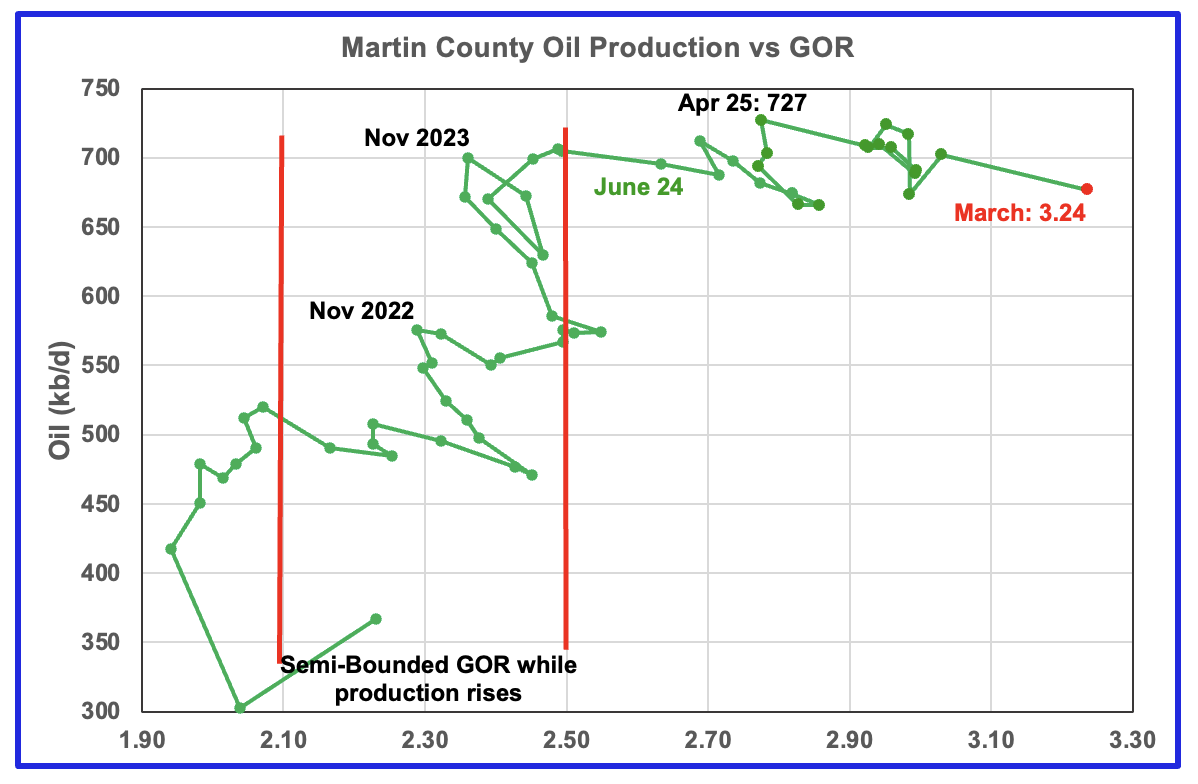
Martin county’s oil production after November 2022 increased and at the same time drifted to slightly higher GORs within the semi bounded range. However the June 2024 GOR saw its first move out of the semi bounded region.
The RRC’s preliminary March 2026 production for Martin County shows a 25 kb/d decrease to 677 kb/d accompanied by an increase in the GOR to a record 3.24.
Martin county has the lowest semi-bounded GOR boundary of the four counties at a GOR of close to 2.50. The March GOR is now clearly out of the semi-bounded region. Martin County has now entered the bubble point phase that should result in a plateau phase that should shortly turn into a slowly dropping oil production phase.
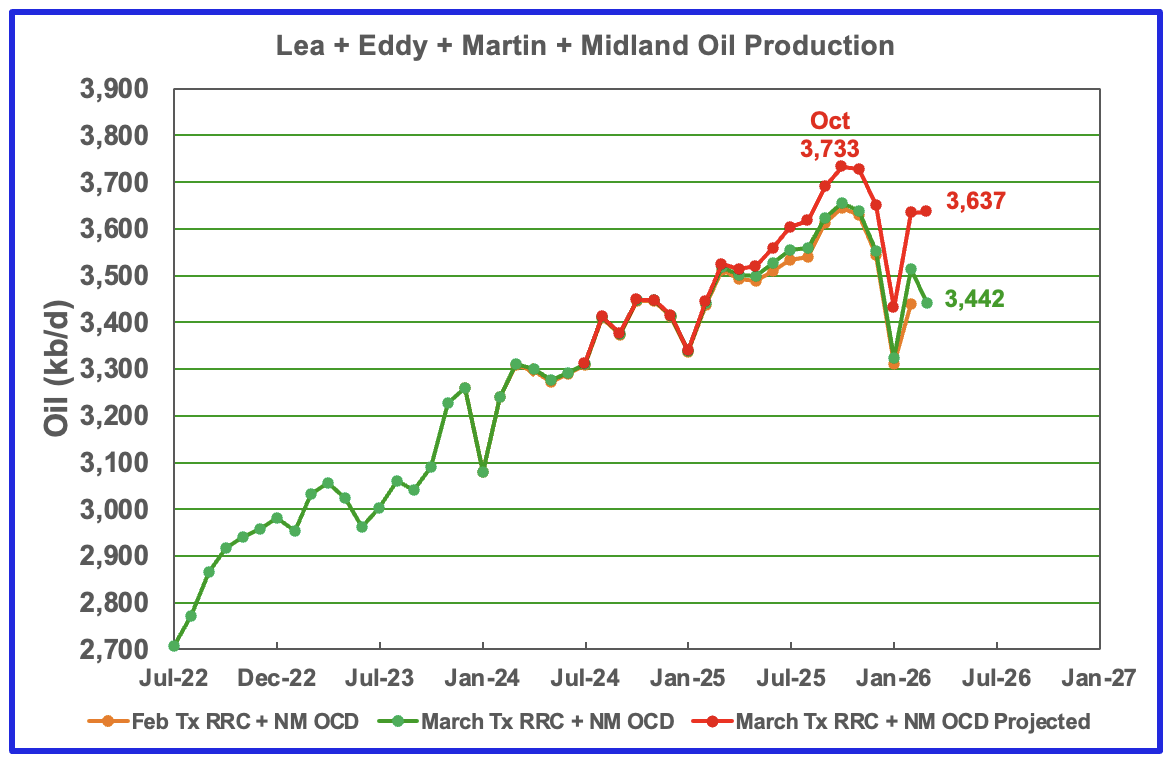
This chart shows the total oil production from the four largest Permian counties. Assuming the total current Permian production is close to 6,600 kb/d, these four counties account for 55% of the total.
March projected production increased by 2 kb/d to 3,637 kb/d. Increases in Lea and Midland were offset by drops in Eddy and Martin. February and March production being flat and lower than October 2025 is an early indicator that the Permian is in either a plateau phase or in its initial declining phase.
The February and March initial production data are shown in the orange and green graphs respectively. The red graph uses the February and March production data to project a final updated production for March.
Findings
– March projected production increases for the Texas counties are possibly a bit optimistic. The optimistic projections are mainly due to atypically large updates to February production in the updated March production data. Need to wait for April production to clarify February/March production and the trend going forward.
– Lea county entered its plateau phase in May 2024. While oil production is not following the rig count graph directly, the dropping rig count has resulted in Lea County production being in a steady flat plateau phase up to October 2025. However the November to January production drops may indicate Lea County has entered a declining phase. February and March production has risen and is currently tracking the time shifted rig count. It is not clear whether the current rising production could enter a lower level plateau phase in 2026 as the time shifted post January rig count begins to increase.
– July to December production in Eddy County saw a steady increase to 1,109 kb/d. February projected production fell to 1,104 kb/d and March dropped further. The March production drop along with upward revisions to previous months indicates that Eddy county may have peaked in December 2025. The dropping rig count starting in September 2025 may have finally shown up in falling production in March.
– Midland’s March oil production is overly optimistic due to atypical upward revisions to February production in the March report. Midland county may actually be in its declining phase.
– Martin’s projected production has been essentially flat since August 2024. Martin’s March projected production decrease indicates that its oil production is still in its plateau phase of approximately 725 kb/d and may be close to entering its declining phase.
Texas District 8
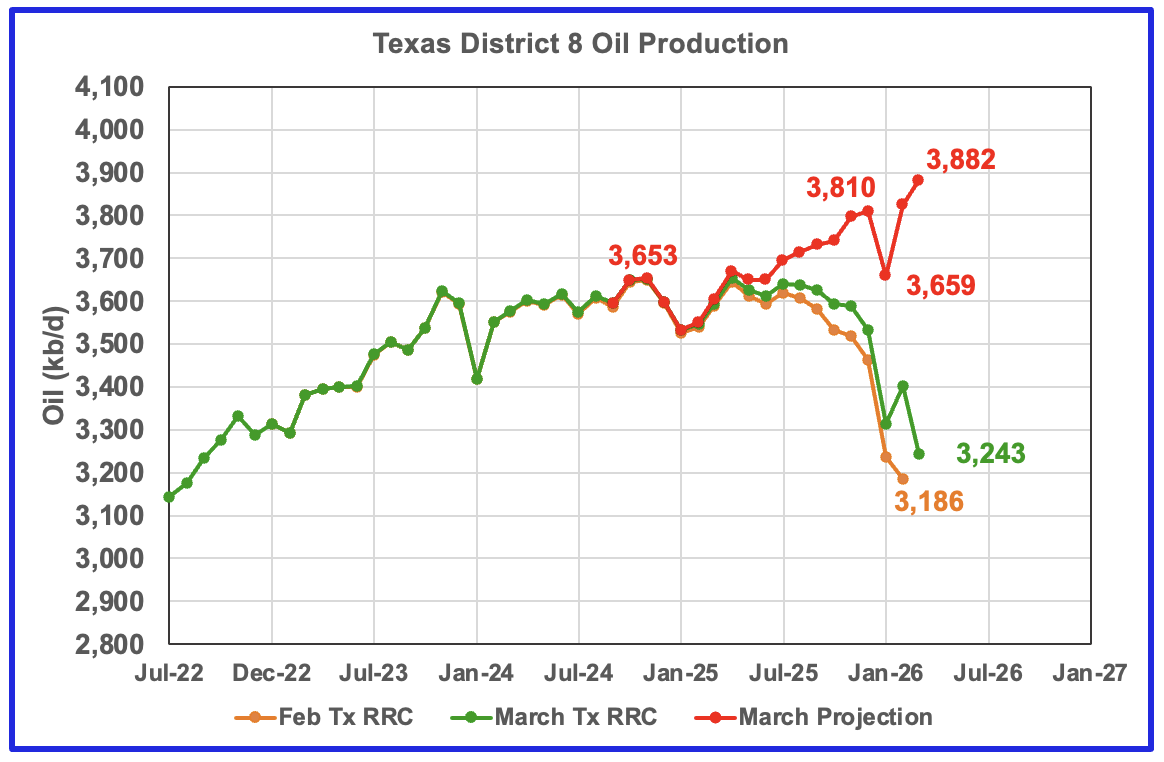
District’s 8 projected production rose by 57 Kb/d in March. This is an overly optimistic projection that is being affected by a number of atypical upward revisions to many counties in District 8.
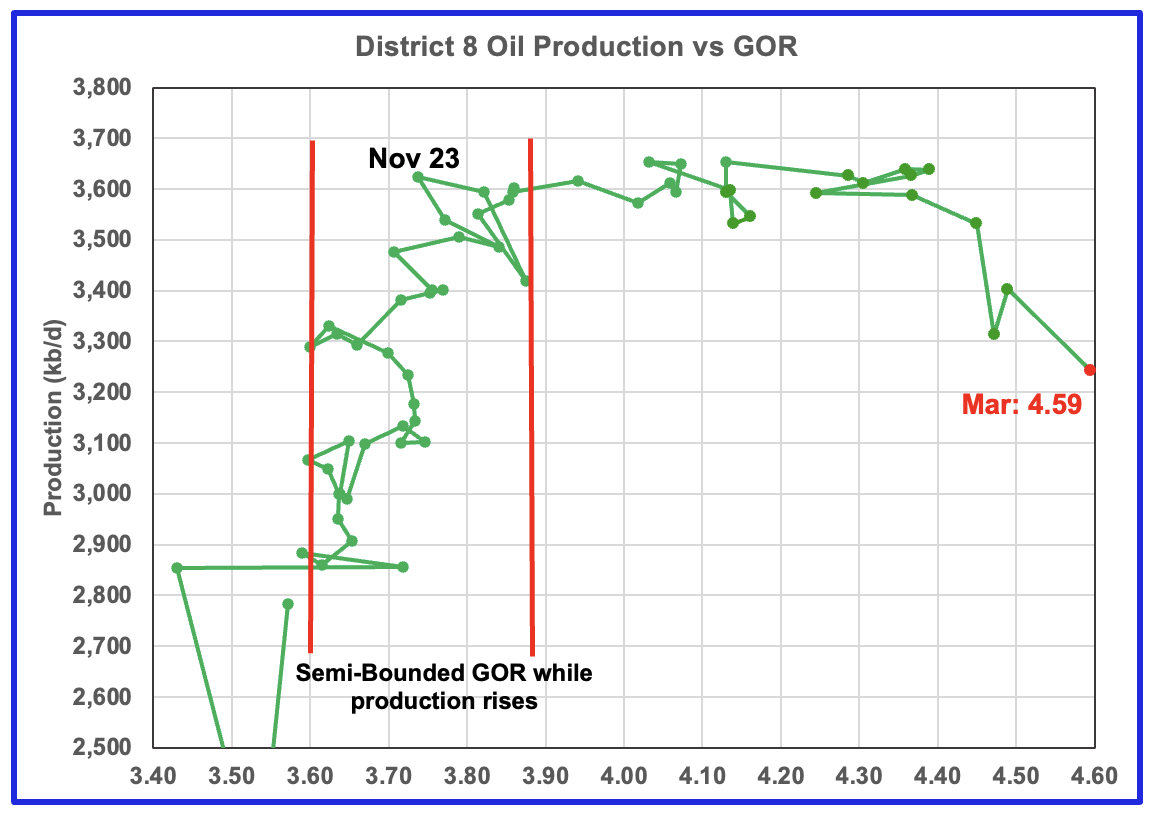
Plotting an oil production vs GOR graph for a district may be a bit of a stretch. Regardless here it is and it seems to indicate many District 8 counties may well be into the bubble point phase. The March GOR increased to 4.59, a new high, as preliminary production continued to drop.
Oil Production and GOR Charts for Four of the Next Larger Texas Oil Counties
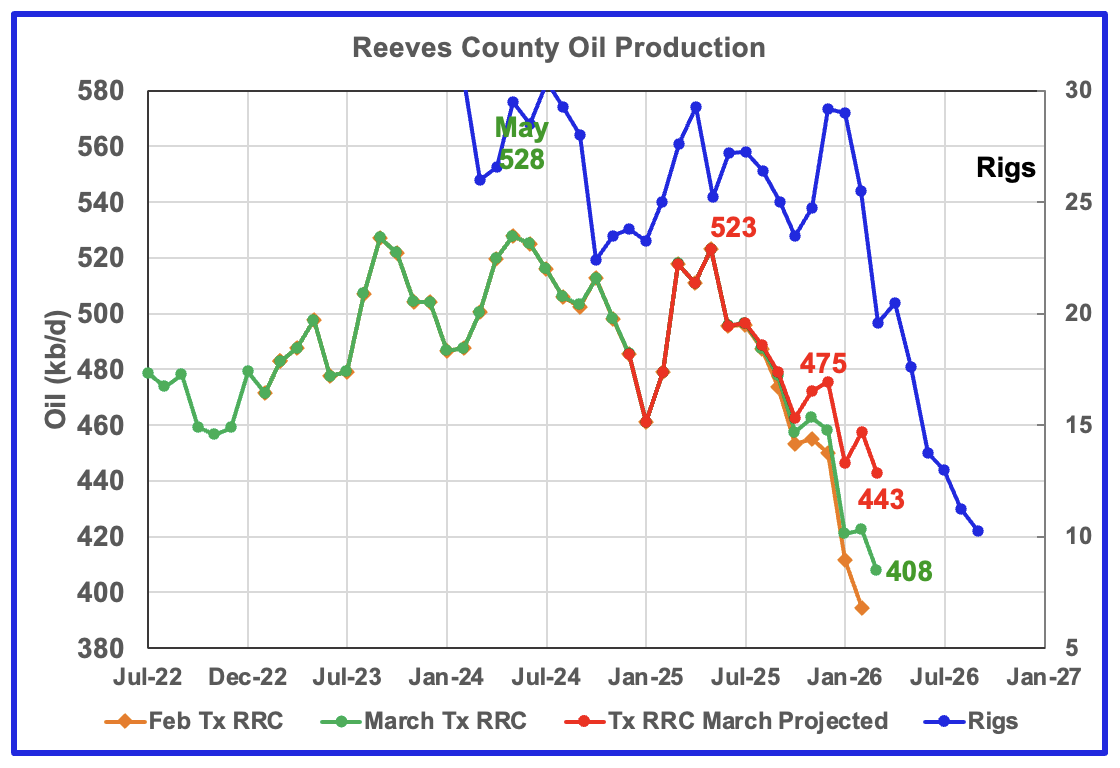
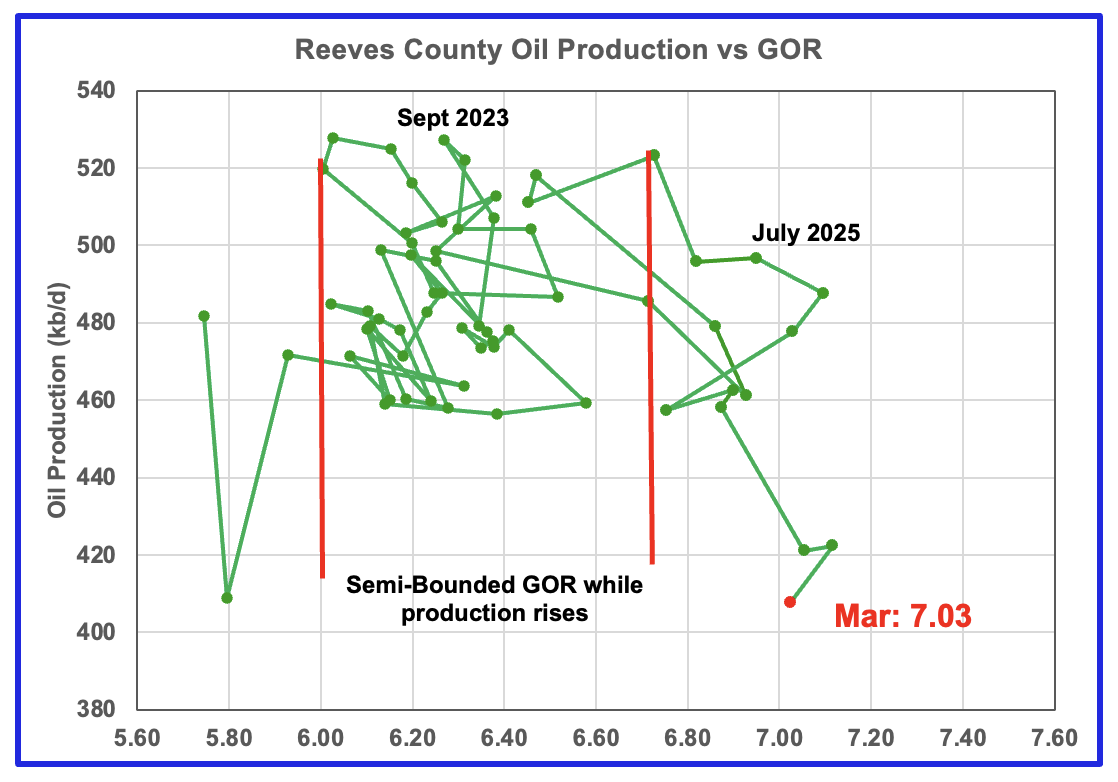
Reeves County GOR is high because it is the number one Texas county ranked by gas production. The current C + C production is almost evenly split between crude and condensate, with condensate about 17% higher than crude.
Reeves County GOR first moved out of the Semi-Bounded region in June 2025 and in March 2026 fell to 7.03 while initial production dropped to a new low of 408 kb/d. Reeves county is in its declining phase.
The rig count is time shifted forward by 7 months.
In real June 2025, 29 rigs were operational in Reeves county. By late May 2026 the rig count had risen to 16 from a February low of 10. Regardless of the current increase, 29 rigs to 17 rigs is a large drop in 11 months. The large drop shows up starting in time shifted Febuary 2026
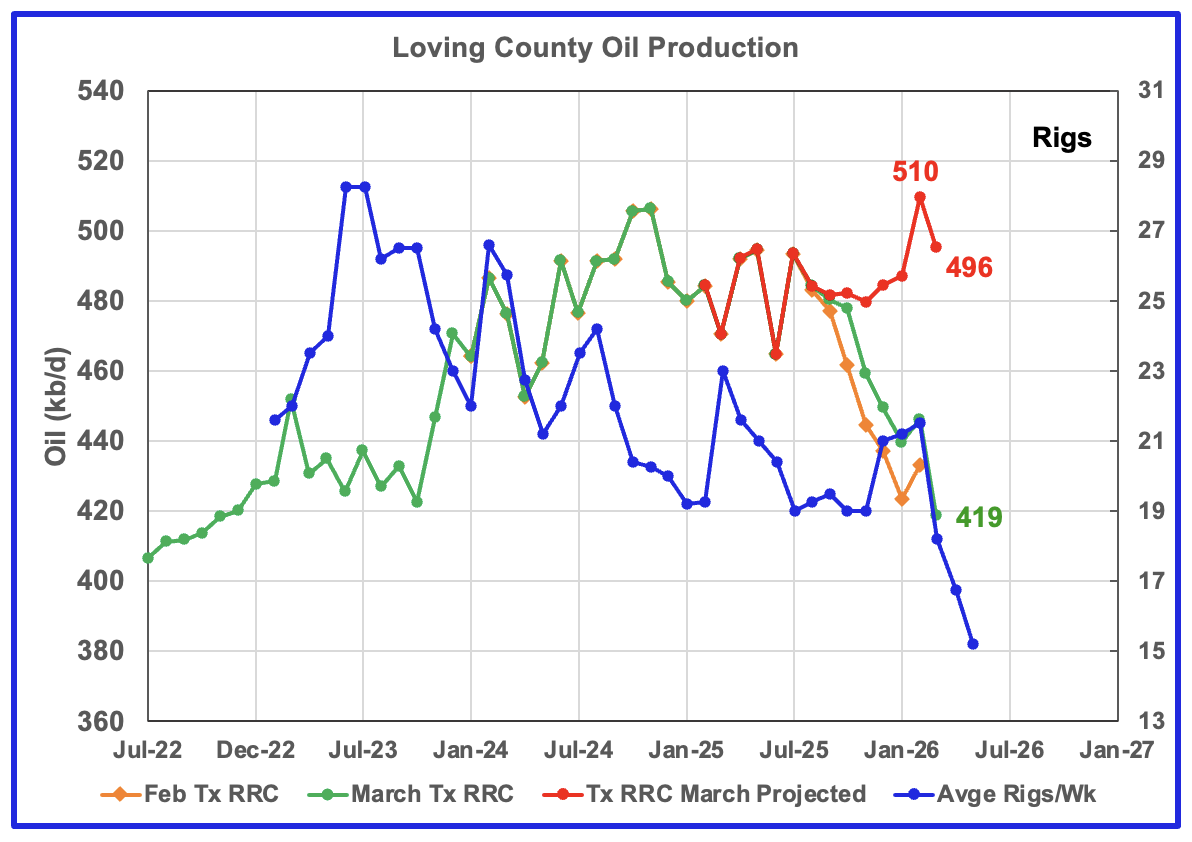
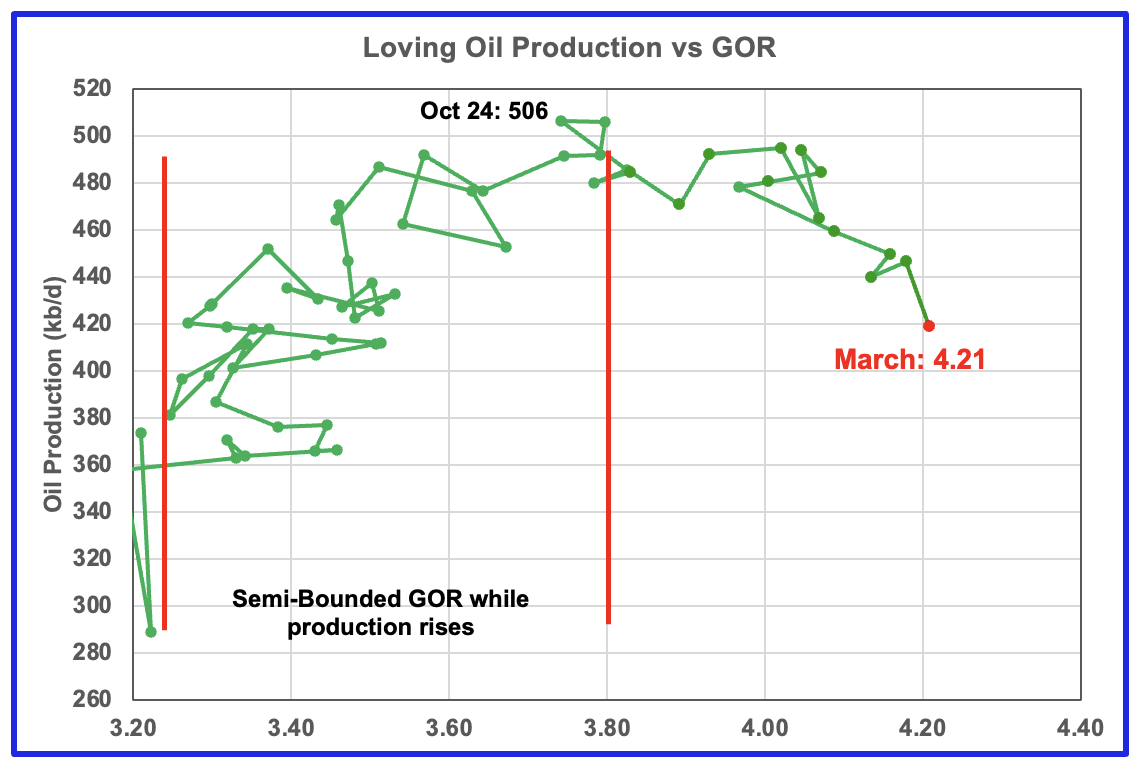
Loving’s projected production dropped by 14 kb/d to 496 kb/d in March. For March, the GOR increased to 4.21, a new high, while preliminary production dropped to 419 kb/d. Loving’s February and March projected production is a bit optimistic due to overly upwardly revised February oil production. It will be interesting to see if production continues to fall in April as it follows the dropping rig count.
Loving’s rig graph is time shifted forward by 5 months.
Loving had 17 operational rigs in late May 2026.
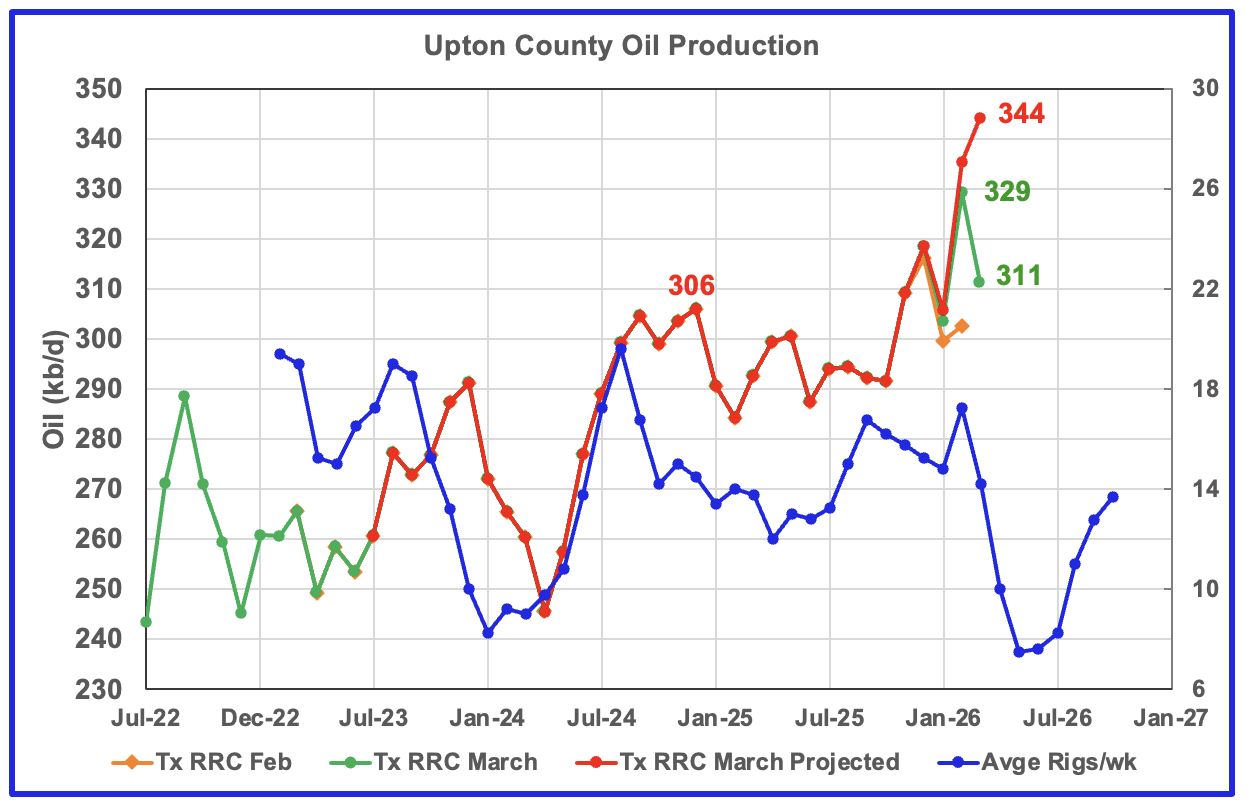
Upton’s projected March production rose by 9 kb/d to 344 kb/d.
For the next few months Upton County may see a production decrease associated with the dropping rig count which started in time shifted March 2026. The March increase is due to the large revision in the February production, the large gap between the orange and green graphs in February, and is a bit optimistic.
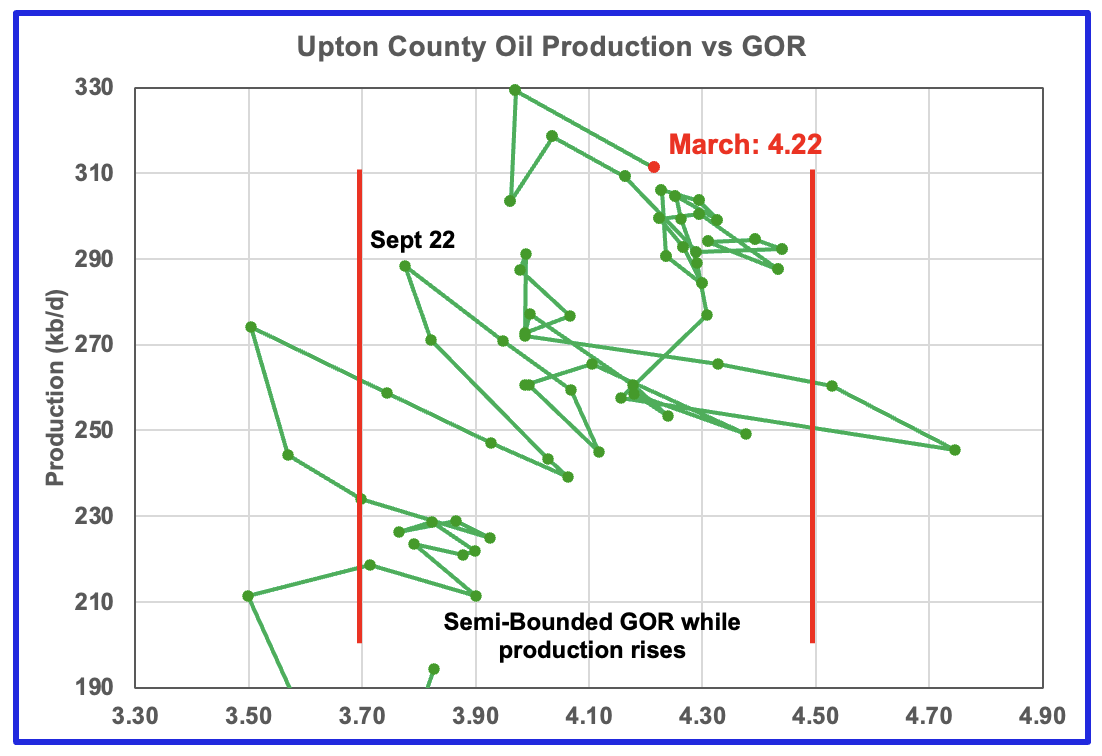
Upton’s GOR continues to stay within the Semi-Bounded region but rose to 4.22 in March.
Upton’s rig chart has been time shifted forward by five months. Upton began 2026 with 7.6 rigs, time shifted to May 2026. In real May 2026, the rig count had risen to 14.
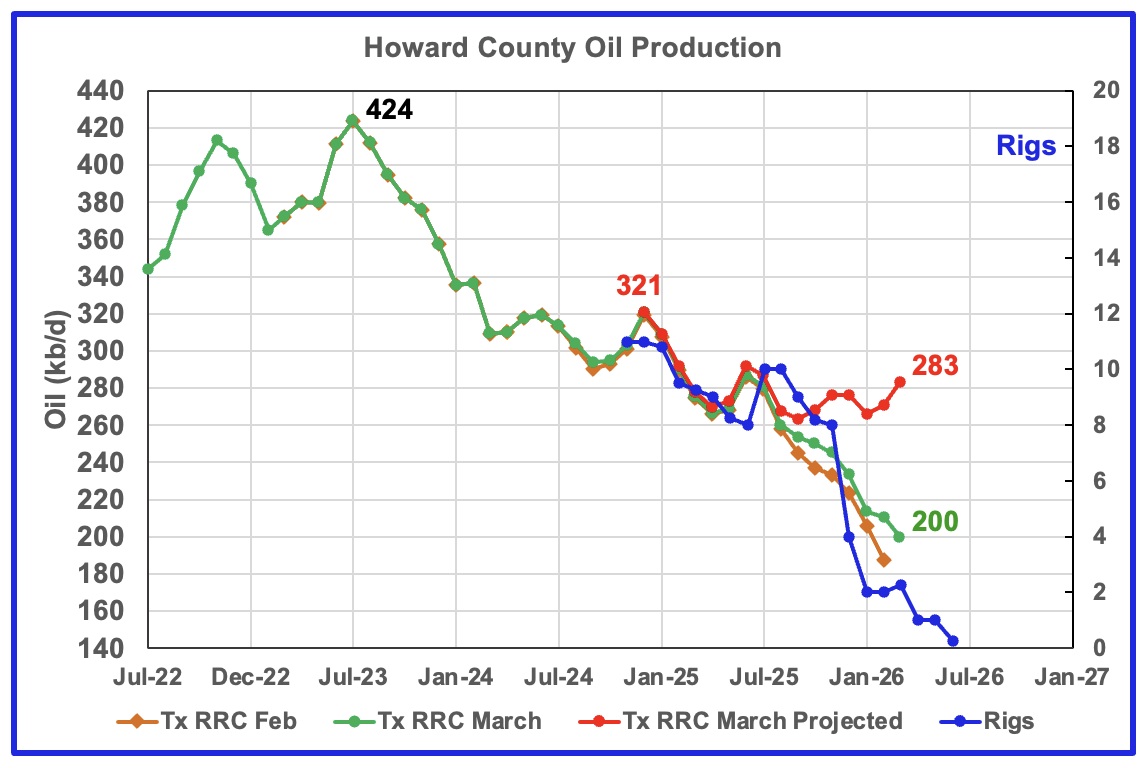
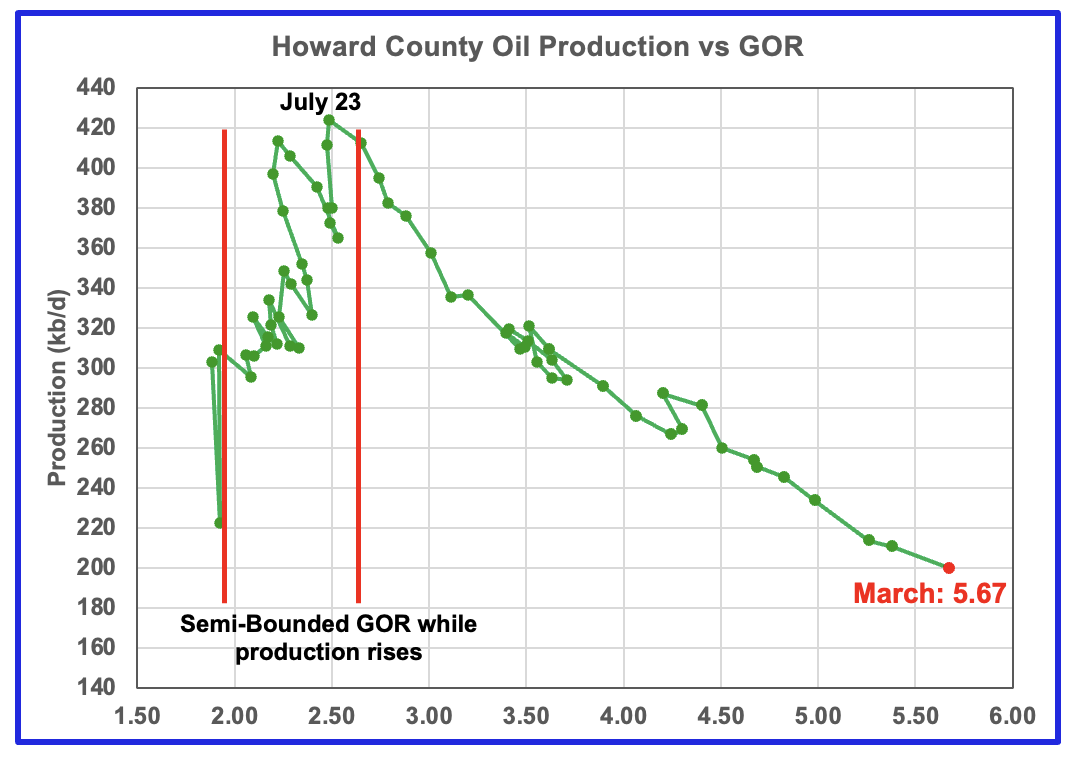
Howard County oil production peaked in July 2023 and has been in a slow decline ever since.
March’s projected production rose by 12 kb/d to 283 kb/d. This may be an optimistic projection due to the atypical upward revisions to February production.
Note the rig count in time shifted June 2026 is 0.25, i.e. 1 rig for one week in real January 2026. The rig graph is time shifted forward by 5 months. In real April 2026, Howard added one rig for a total of one operational rig.
For March the GOR rose to a new high of 5.67 as the initial production dropped to 200 kb/d.
Drilling Productivity Report
The Drilling Productivity Report (DPR) uses recent data on the total number of drilling rigs in operation along with estimates of drilling productivity and estimated changes in production from existing oil wells to provide estimated changes in oil production for the principal tight oil regions. The new DPR report in the STEO provides production up to March 2026. The report also projects output to December 2027 for a number of basins. The DUC charts and Drilled Wells charts are also updated to April 2026.
The DPR has made been significant upward changes to the oil production forecasts for the three tight oil basins, Permian, Eagle Ford and Bakken reported here. It is not clear if the increases are related to the sudden rise in the WTI oil price from $65/barrel in February 2026 to over $100/b in March 2026. While production starts to rise in October 2026 all the way to December 2027, the price of WTI slowly drops back to $64/b in December 2027.
The forecast seems be model driven whereby increases in the oil price brings on new drilling and the associated increase in oil production. Also interestingly there appears to be the typical six to seven month delay from February 2026 before production begins to rise. The only flaw in this possibility is that oil prices fall steadily from March 2026 to December 2027. Also there has been no reported significant increase in drilling rigs in March and April 2026.
For the Permian, production was expected to increase in October 2026 because there was an expectation that new gas pipelines were being built that would permit more high GOR oil wells to be drilled. However the projected increase has been increased further.
So at this time, it is not clear if the sudden production increase starting in the September/October time frame is simply a partially driven model forecast or related to pure Hopium.
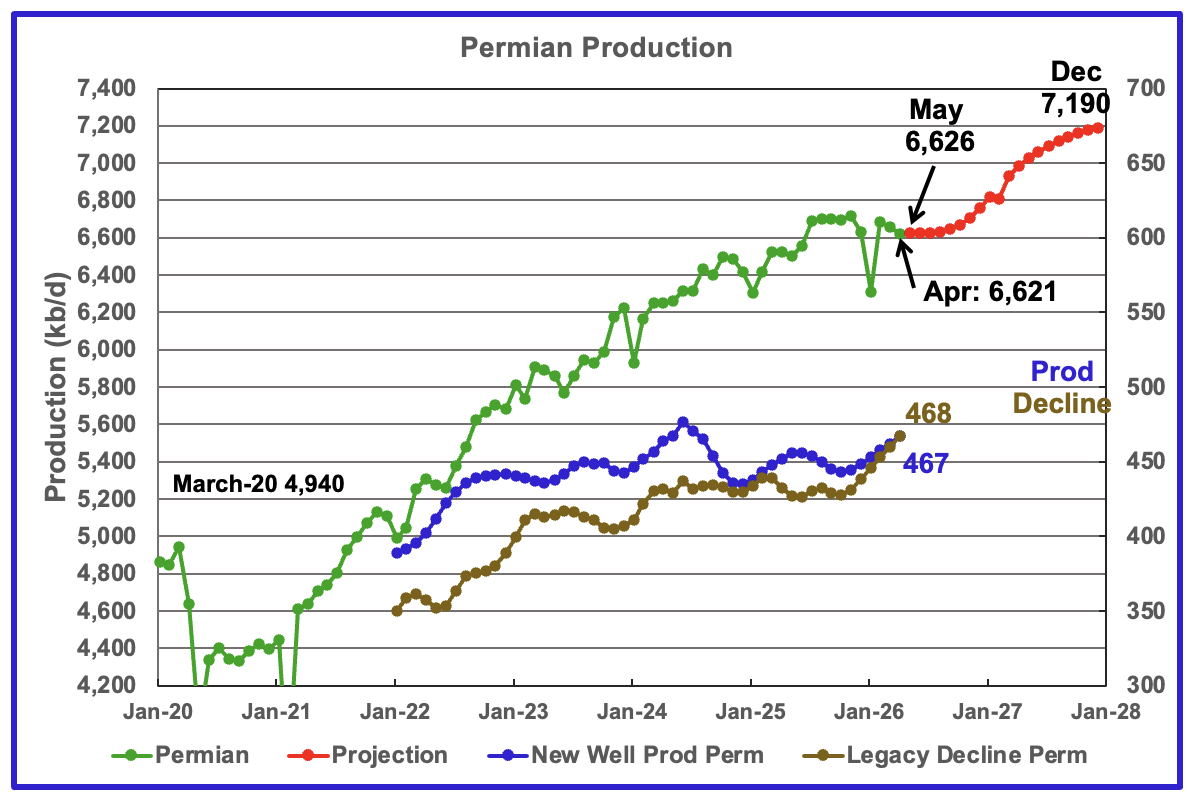
The EIA’s May STEO/DPR report shows Permian April output dropped by 36 kb/d to 6,621 kb/d. May production is expected to increase by 5 kb/d to 6,626 kb/d. From April 2026 to December 2027 output is expected to increase by 569 kb/d to 7,190 kb/d. December 2027 production has been revised up by 69 kb/d from the previous report.
Note that production begins to rise steadily from September 2026 to December 2027. According to the EIA, this is due to higher prices for WTI and more NG pipelines being built. The gas pipelines are needed to capture the associated flared gas coming from new oil wells.
Production from new wells and legacy decline, right scale, have been added to this chart to show the difference between new production and legacy decline.
These numbers reflect a one year production trend and provide the production contribution from new wells over a rolling 12-month period to determine if the rate of new production is increasing or decreasing compared to previous periods. The averaging process approximately adds a six month delay.
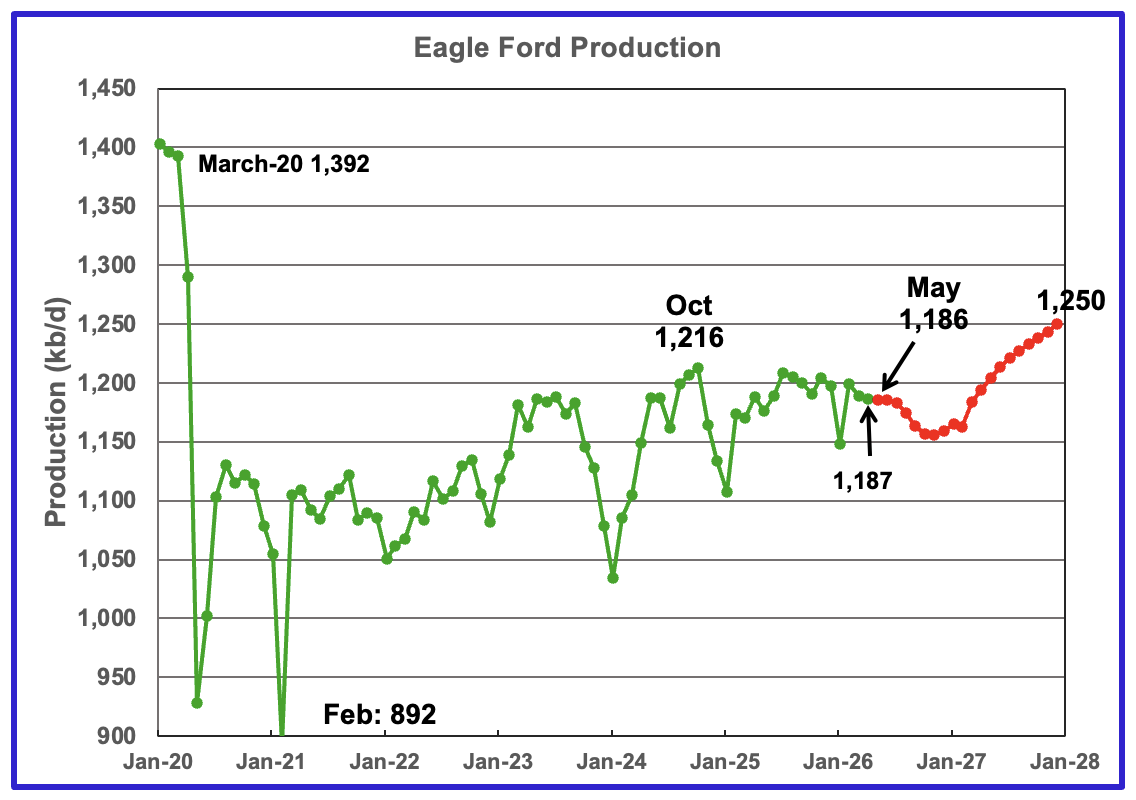
April output in the Eagle Ford basin decreased by 2 kb/d to 1,187 kb/d. May 2026 production is forecast to drop by 1 kb/d to 1,186 kb/d.
Output in December 2027 is expected to be 1,250 kb/d, revised up by 9 kb/d from the previous report.
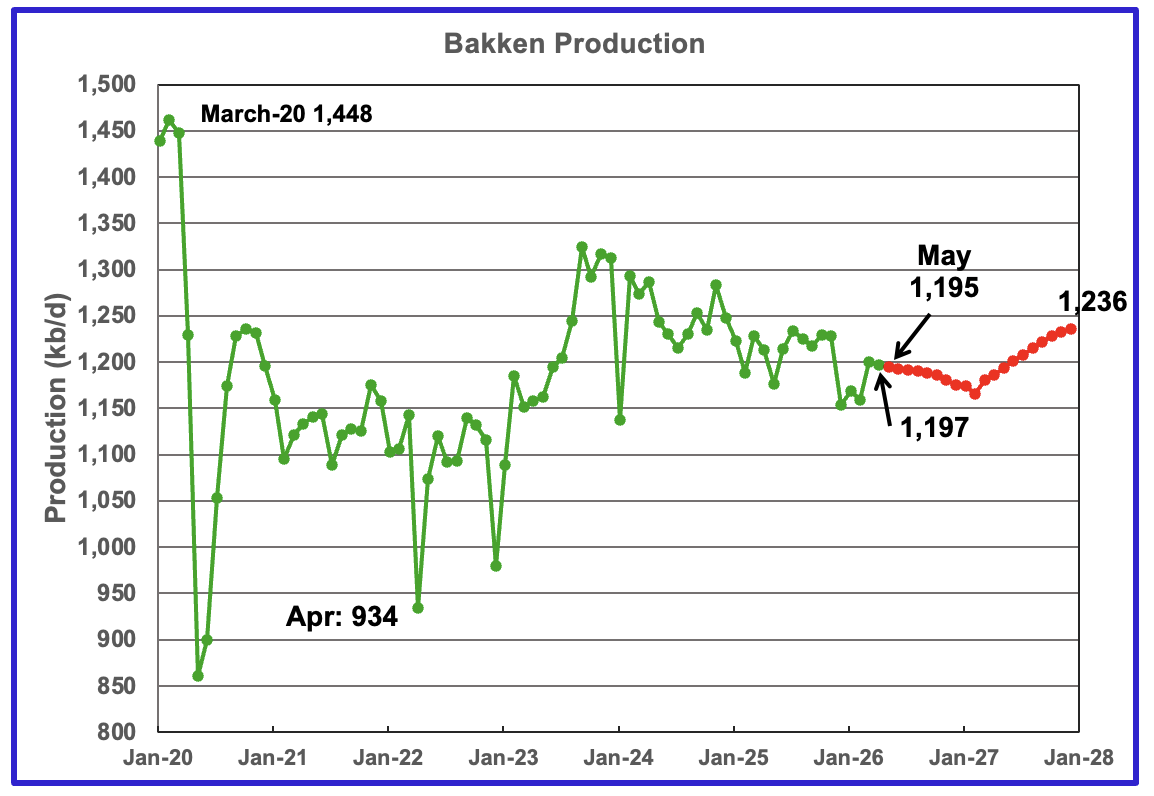
The DPR/STEO reported the Bakken’s April output dropped by 3 kb/d to 1,197 kb/d. May 2026 production is expected to decrease by 2 kb/d to 1,195 kb/d. The STEO/DPR projection, red markers, shows output rising to 1,236 kb/d in December 2027.
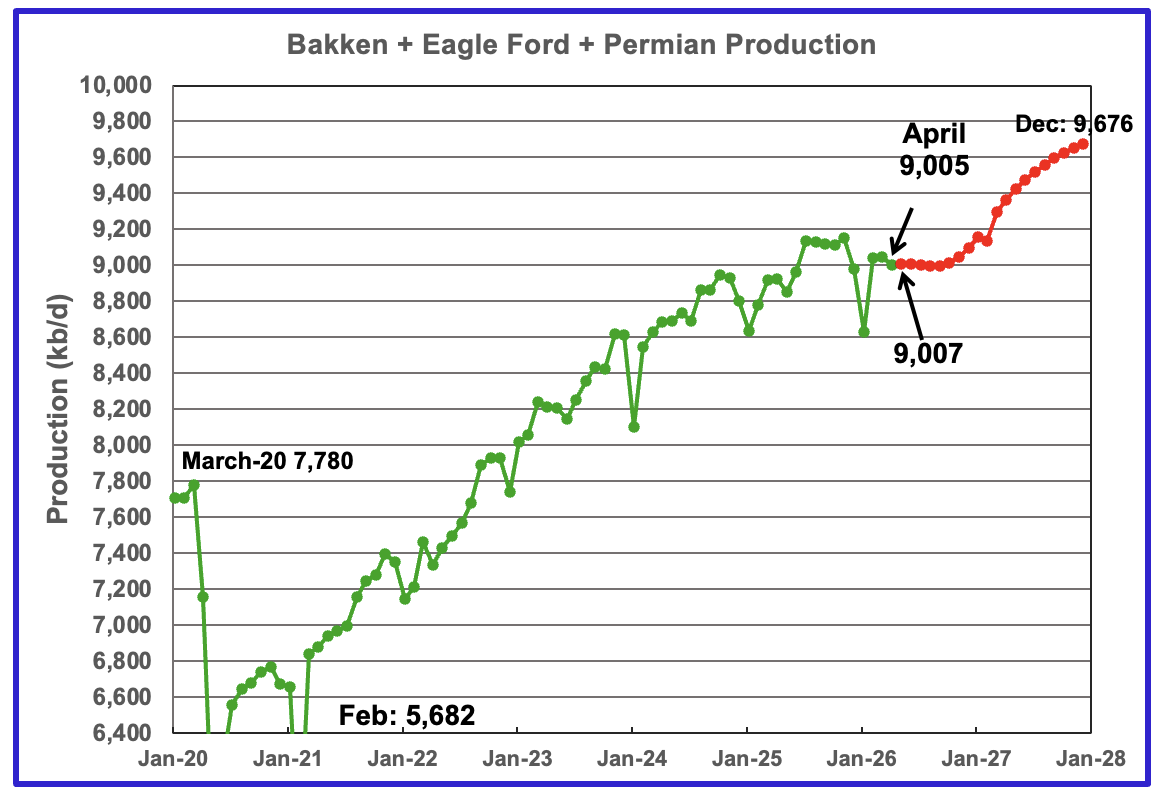
This chart plots the combined production from the three main LTO regions. April output decreased by 41 kb/d to 9,005 kb/d. May is expected to add 2 kb/d to 9,007 kb/d. Production for December 2027 is forecast to be 9,676 kb/d.
DUCs and Drilled Wells
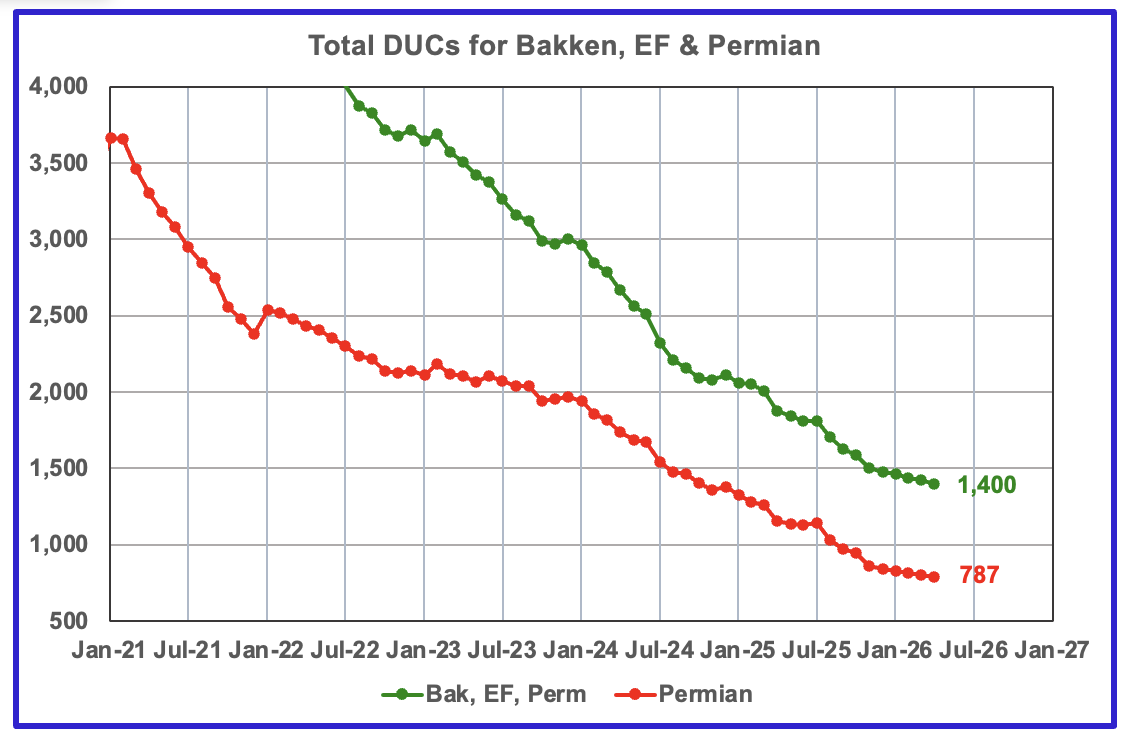
The number of DUCs available for completion in the Permian and the three major DPR regions continues its dropping trend. The April DUC count for the three basins dropped by 21 to 1,400. In the Permian the DUC count dropped by 13 to 787.
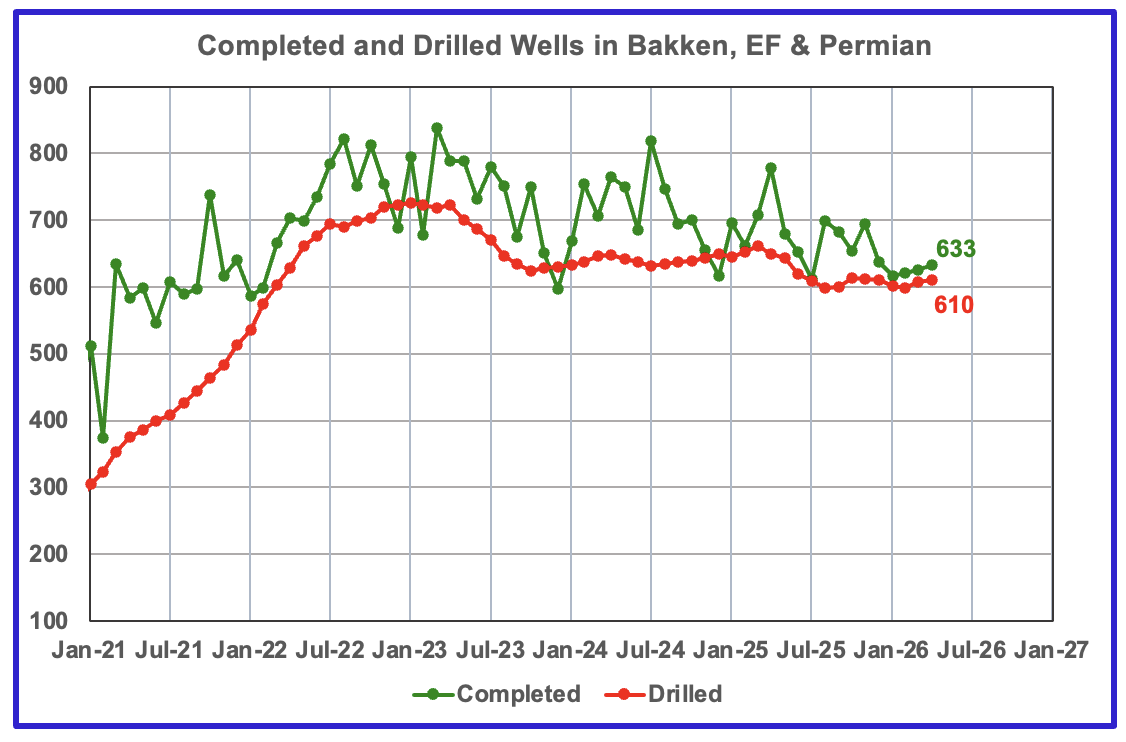
In the three primary regions, a total of 633 wells were completed in April, 8 more than in March. There were 610 wells drilled in April 2026, up 2 from March 2026.
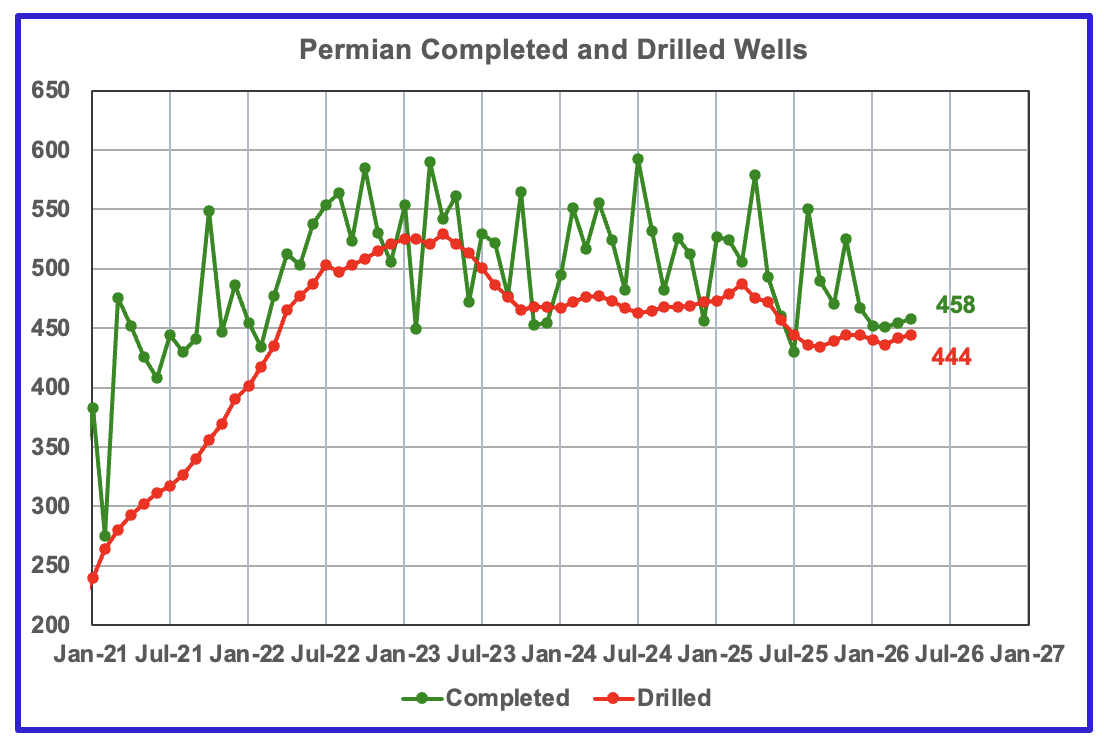
In the Permian, 458 wells were completed in April and 444 were drilled.
166 responses to “US March Oil Production Flat”
So can we all agree that Permian has entered a plateau phase? Appears to be nearly 12 months since peak Permian…
Kengeo,
In April 2026, Permian tight oil output was 6.13 Mb/d and in April 2025 Permian tight oil output was 5.91 Mb/d, so the peak is April 2026, might be a plateau going forward. Depends in part on the price of oil, at $180/bo we might see output rise. For US tight oil data see
https://www.eia.gov/outlooks/steo/xls/Fig42.xlsx
Kangeo
The only fly in the ointment is the DPR projection for the Permian in the DPR section above. Is that projection based on a model that says higher prices bring higher production or is just plain Hopium?
US tight oil output trailing 12 month average (TTMA). In past 12 months the TTMA for US tight oil output increased by 100 kb/d (from 9.23 Mb/d to 9.33 Mb/d), in the past 6 months the TTMA has increased by only 10 kb/d (from 9.32 Mb/d to 9.33 Mb/d). The DPR forecast is likely optimistic from May 2026 to December 2027. See chart linked below.
tight ttm 2606
why they dont drill in Upper and Lower Bakken shale to make “shale oil real shale oil”?
https://oilprice.com/Energy/Crude-Oil/North-Dakota-Chases-A-Second-Bakken-Boom-Through-Enhanced-Recovery.html
Sheng Wu,
Probably because those formations are more difficult to frac and the results of wells that have been drilled in Upper or lower Bakken have had very low productivity.
EOR is expensive, and would result in even lower profits, tight oil EOR is a pipe dream.
From the piece you linked:
North Dakota oil producers have yet to determine the most efficient and cost-effective EOR technology to deploy in the Bakken. Additionally, oil and gas executives have warned that EOR is far from a silver bullet due to the many unknowns.
Ovi,
Great job, thank you.
Permian DUC count is about 1.72 months of supply at the most recent month’s completion rate. For the Bakken and Eagle Ford the DUCs are equivalent to 3.5 months of supply at the most recent month’s completion rate. At some point the DUCs run dry unless the drilling rate increases or the completion rate decreases.
Dennis
Thanks. Much appreciated.
Do you have any idea or way of cross checking the sudden addition of 11 directional rigs to Eddy county. I wonder if it could be related to the article under the Lea oil chart that reports that Devon Energy has recently acquired land in Lea and Eddy counties.
In a way I am assuming that Devon would use a directional rig to drill a 4 mile U well.
Ovi,
My knowledge on the actual practices in the oil field are limited, your guess sounds reasonable. Chart below considers HOR for the US compared to horizontal plus directional rigs (H+DOR). Since March 6 a big jump in the number of directional oil rigs operating. (see link at endof post for chart.)
As far as the Devon aquisition, when we look at the total cost of these wells when this lease aquisition cost is added, the wells are likely to need $180/b oil prices sustained over 5 years in order for the well to pay out.
See
https://www.oilystuff.com/group/gassy-stuff/discussion/8358eb16-210d-4945-b411-83c889e31baf
This expert says the following about this lease aquisition:
Devon yesterday paid $161,500 per acre to the government. On a standard 10-11,000 foot lateral layout Devon will be able to drill 400 locations/benches on this new acreage, theoretically…that works out to $6.5 MM per location, or roughly $ $17 MM per well. I promise you, however, you will never hear about these actual full cycle well costs nor will you ever get the corresponding truth whether this lease acquisition worked economically.
It won’t. Not based on liquids and gas EUR’s in Lea and Eddy Counties and not unless oil prices go to $150 a barrel and stay there.
Mr. Trump I believe whacked RI on BLM tracts from 3/16ths back to 1/8th but you can just about be assured they’ll go back to 3/16ths, or more, in 2029. What oil prices will be in just six months is anybody’s guess.
oil rigs 2606
Rig Report for the Week Ending June 5
The dropping rig count that started in early April 2025 when 450 rigs were operating dropped this week. Drilling continues at a steady rate of 368 ± 6 rigs per week since August 2025 while WTI closed at $90.54/b, up from $87.36 from last Friday.
– US Hz oil rigs rose by 2 to 373, down 77 since April 2025 when it was 450. It was also up 11 rigs from the low of 362 first reached in the week ending August 1, 2025. The rig count is down 17% since April 2025.
– The New Mexico Permian Hz rig count dropped by 1 rig to 73. Eddy dropped by 1 to 33 while Lea was unchanged at 40. As noted last week, the Rig report showed that 11 directional rigs were added to Eddy county for a total of 14. The same number 14 is being reported this week. Will this show up as increasing production seven months from now.
– Texas added 4 to 196. Midland and Martin were both unchanged at 22 and 24 respectively. The biggest change occurred in Reeves county where 3 rigs were added.
– Eagle Ford added 1 to 33.
– NG Hz rigs dropped by 1 to 105.
A Rig
Frac Spread Report for the Week Ending June 5
The frac spread count dropped by 2 to 190. From one year ago, it is up by 4 spreads but is still down by 25 since March 21, 2025. This is the first drop since the rise started 6 weeks ago.
A frac
Hi Ovi,
Thank you for the update!
Hey, I haven’t verified this data, but if it is correct the fuel oil situation is getting rather dire.
https://x.com/HFI_Research/status/2062988811735560219?s=20
Japan stopped reporting around week 11/12, which is probably not a good sign.
Brent futures chart from
https://oilprice.com/futures/brent/
also see link below (chart snipped from site at link above)
brent futures 2606
At post linked below there is a great chart showing the decrease in Permian productivity per foot of lateral length. Click on the second chart for a larger view, great stuff. Thank you sir.
https://www.oilystuff.com/group/operational-stuff/discussion/af141534-8e4c-480e-8f19-71f7ee66f29b
yes, DC and Mike,
because they drill longer laterals, and larger fracs, the IP for each lateral barely drop, or might even increase, operators/investors are not that pessimistic.
but decline is certainly faster, but only obvious after 1-2 years, and that is too late, and the final statistics bite them badly.
Sheng Wu,
It is the cumulative well profile that is important. When normalized for lateral length average new well productivity in the Permian Basin has been decreasing since 2017. They are not creating any new tight oil formations, if there are a potential 100,000 wells with lateral lengths of 10,000 feet, increasing the lateral length to 20,000 feet simply reduces the potential number of wells to 50,000. Note however that as the lateral length increases, the productivity per 1000 feet of lateral decreases, so actual basinwide URR tends to decrease as average lateral length increases to more than 10 kft for newer wells.
INTERVIEW: Mercuria shipping head says fuel shortages could **idle 10% of global fleet**
https://www.spglobal.com/energy/en/news-research/latest-news/refined-products/060326-interview-mercuria-shipping-head-says-fuel-shortages-could-idle-10-of-global-fleet
“The shipping sector is fast approaching a fuel crisis that could paralyze a tenth of the global fleet, Larry Johnson, global head of freight at commodities trading house Mercuria, said in an interview.
Since the Middle East war erupted, markets have been preoccupied with potential shortfalls in the diesel and jet fuel traditionally exported in large quantities from the Persian Gulf.
However, as refiners strain to capture soaring clean product cracks, residual fuels have suffered. Increasingly, feedstocks have been held back from the marine fuel market to kept for further processing, leaving the shipping sector at risk of crippling shortages, Johnson said.
“My view on marine fuel oil is there will be regional stock-outs by July and that there are potentially outages in the major hubs by August, September, at the latest,” Johnson said.”
It sounds to me like marine fuel oil is low price, low profit, so it’s being de-emphasized in favor of more expensive “clean” products. If the shipping sector is afraid of shortages, they probably need to be willing to pay more for their fuel. If they’re not willing to pay more, than it’s not really a shortage, it’s more that they’re being out-competed by people who need it more than they do and are willing to out-bid them.
It reminds me of the trucking sector complaining about not enough drivers. If they’re not willing to pay enough to attract drivers, then it’s not really a shortage of drivers, it’s a shortage of shippers willing to pay what it takes to run their business.
The good news is that the ships that used to sail through the Straits of Hormuz aren’t burning a lot of fuel these days.
Hi Nick,
Yes, given that the Hormuz has been closed so long and is unlikely to normalize, users will have to start bidding up to access available supplies/refining capacity.
From the article:
“Singapore, the world’s largest bunker hub, saw residual fuel supplies near one-year lows in April, but has pulled additional stock from Europe and Russia to slow losses. Inventories in Northwest Europe have continued to slide, however, and stocks in the UAE’s Fujairah have launguished at record lows.
“For marine fuel oil, there’s no buffer. There’s nothing. So once you’re out, you’re out. And then ships will have to try to buy diesel fuel, for example,” Johnson said.
The sector would then be forced to compete with other end-markets for limited gasoil supplies, which already command a premium to conventional fuel oil.”
“Should trade disruptions last another month, Johnson says mass fuel shortages could trigger trade congestion on the scale of the Covid-19 pandemic – shutting down as much as 10% of marine traffic.
As vessels jostle for limited supply, lower-margin segments like dry bulk are most likely to be caught short, he said, potentially exacerbating challenges for agricultural sectors relying on fertilizers for next year’s crops.”
Yes. The highlights:
“ once you’re out, you’re out. And then ships will have to try to buy diesel fuel, for example,” Johnson said. The sector would then be forced to compete with other end-markets for limited gasoil supplies, which already command a premium to conventional fuel oil.”
Commercial/industrial consumers will become more efficient – water shippers will slow down* – and then bid supplies away from low-value uses like single passenger SUVs and pickups.
—————————-
*Ship fuel consumption is the cube of speed – reducing speed by 10% can reduce fuel consumption by 1/3.
https://www.opec.org/pr-detail/604-16-june-2026.html
Saudi Arabia, Russia, Iraq, Kuwait, Kazakhstan, Algeria, and Oman adjust production and reaffirm commitment to market stability
The seven OPEC+ countries, which previously announced additional voluntary adjustments in April and November 2023, namely Saudi Arabia, Russia, Iraq, Kuwait, Kazakhstan, Algeria, and Oman met virtually on 7 June 2026, to review global market conditions and outlook.
In their collective commitment to support oil market stability, the seven participating countries decided to implement a production adjustment of 188 thousand barrels per day from the additional voluntary adjustments announced in April 2023. This adjustment will be implemented in July 2026 as detailed in the table below. The additional voluntary adjustments announced in April 2023 may be returned in part or in full subject to evolving market conditions and in a gradual manner. The countries will continue to closely monitor and assess market conditions, and in their continuous efforts to support market stability, they reaffirmed the importance of adopting a cautious approach and retaining full flexibility to increase, pause or reverse the phase out of the voluntary production adjustments, including reversing the previously implemented voluntary adjustments announced in November 2023.
Just as Iran can shut down imports and exports from the other Gulf nations, those nations in turn can shut down Iranian shipping if they decide to retaliate in kind. Iran can shut down the pipelines and ports that are/can serve as alternative oil export, by targeting the pipelines, pumping stations, and port facilities.
So either there will eventually be some uneasy accommodation between these parties, or a long term period of disruption, or an imposed settled period. China could play a big role in this, but I don’t think they want involvement the problem. Rather they will more likely take the stance of ‘whoever wants the income (in yuan) send me the oil’.
Can the US impose a renewed settled period (regarding oil flows) from the Gulf, as it has done for many decades? I don’t see it, unless Iran has a wholesale shift in stance at some point. No one can impose that shift from the outside, as we are now fully aware.
https://www.youtube.com/results?search_query=young+turks
Trump to integrate US Military and Israel.
Israel will have access to US Military data and designs.
US found lots of 3He in Minnesota, no need to get it from moon
https://www.youtube.com/watch?v=NoxHubOdxIk
The YouTube says $30 million per kg of Helium. So a semi-trailer full weighing 5000 kg would be worth $150 billion.
YouTube also shows the bugs out in force in northern Minnesota — gnats, mosquitos, black flies, deer flies, horse flies, moose flies.
Gulf of Mexico: little to no hurricane activity last 4 years.
As a result, 2025 was a record year for GOM oil production at 1.94 mmbopd. The previous high was right at 1.9 mmbopd in 2019, another pretty quiet year. If 2026 is a quiet year, it should exceed 2025.
I only learnt this past week that the ultra-deep sub-salt GOA has not only black oil with low GOR, but also heavy oil like bitumen or Venezuela heavy.
A USD 100 Million “Rock”: Bitumen in the Deepwater Gulf of Mexico SPE Drilling & Completion,
2010 https://sci-hub.st/10.2118/138228-PA
Only the drillers care about it because such heavy oil is causing trouble for drilling for the low GOR black oil below in the sand reservoirs.
No geologists seem to care how much & where such bitument come from?
during drilling, such bitumen could get to the wellhead with mud like they hit a lake of bitumen/tar, tons of it for weeks, and Chevron’s Big Foot had couple of drilling wells stalled and even abandoned due to this heavy oil deposit at the bottom of the salt, and just above the sand.
In my experience, this tar/bitumen came in 2 forms – mobile and immobile. The mobile version was more likely to be encountered right below salt, while the immobile version was encountered deeper in the subsalt section. The mobile version could enter the wellbore and completely mess up the entire system. The geologists spent alot of time in the planning process trying to predict if this material might be encountered because it was always a big headache. It often resulted in having to sidetrack the well.
Anyone care to speculate about what happens when Cushing commercial inventories drop below 20 million barrels?
05/29: 22.4 million barrels
https://www.eia.gov/dnav/pet/hist/LeafHandler.ashx?n=PET&s=W_EPC0_SAX_YCUOK_MBBL&f=W
And……Cushing now down another 1.4 million bbls according to Kpler’s drone data
https://x.com/HFI_Research/status/2063773153999061256?s=20
Cushing is not SPR
Cushing June 5: 21,640,000 barrels
Hi SW,
Not sure what you are referring to, could you clarify?
Data from EIA is “Weekly Cushing, OK Ending Stocks excluding SPR of Crude Oil (Thousand Barrels)”
Currently: 23,024,000 barrels
If I had a commodity hedge fund with capabilities to store/deliver/transport/market WTI in Cushing, I would probably consider ways to play the long side of it, including taking (forcing) delivery from the shorts who are increasingly unlikely to be able to deliver what they have sold.
“Inverse Covid”
US tight oil scenario in chart linked at bottom, tight oil output decreases at an average annual rate of 8.5% per year from 2029 to 2035 for this scenario, which may be on the optimistic side.
us tight 2606b
That is a dramatic decline. What price assumption does that projection use?
Does it assume decrease demand, or simply decline in production capability?
Thanks DC
Hickory,
It assumes the futures curve is correct. See chart below for recent Brent Oil Futures curve.
brent futures 260610
Thanks DC. I don’t give much credence to the long term futures market as being a legit predictor of Permian oil pricing/output.
But the two graphs combined does point out that lower price will lead to lower output.
Good morning,
I just took a peek at the WTI COT report:
https://www.barchart.com/futures/commitment-of-traders/interactive-charts/CL*0
In the disaggregated report (=more accurate representation of physical commercial players), the commercials are long 358,016 contracts.
If you click on the “max” button, you can see the historical data, and this appears to be the biggest long position the commercials have ever held.
In contrast, the swap dealers (the big banks and financial institutions like Goldman or JPM) are hugely short.
I wonder who is shorting via the banks?
The big banks and financial institutions (more likely their clients) are net short 546,125,000 barrels of oil……….
These paper barrels explain a lot about how the market price has stayed so comfortably low during the biggest disruption to supplies in history.
Dennis, Ovi,
Might a fairly simple model of our current Hormuz situation be helpful? Here’s a very rough draft:
Hormuz Estimates (MBPD)
World C&C prior to closure – 86 Source: “January World Oil Production Drops”
Shut in: 9 source: OPEC May 26 report per POB post
Net: 79
Current sources of reolacement for 9M shut in:
China reserves: 5
US SPR: .6?
Other reserves 1.4?
Consumption reductions: 2?
Estimated reserves duration:
China reserves: 1B
Daily output: 5M per day
1B/5M = 200 days (MOL?)
200 days from 2/28/26 would be roughly middle of September.
SPR starting reserves: 415M
Output: .6M per day?
MOL?
——————————
I’d think that there would be several tranches of reserves, whose life would be helpful to identify. As each reserve is exhausted we’d see a new level of scarcity.
HI Nick,
That’s a nice, practical way to follow the ongoing oil saga.
Seems like Cushing may be the first to breach the MOU (20 million barrels).
I looked at Nymex oil deliveries this year.
https://www.cmegroup.com/solutions/clearing/operations-and-deliveries/nymex-delivery-notices.html
The numbers have been low since the Iran war began. Largest delivery month since the war begain was 1.889 million barrels (1889 contracts) in May, and the lowest delivery month was 1.005 million barrels in June (1005 contracts).
According to AI, “Historically, in an ordinary, healthy market month, between 5,000 and 15,000 WTI contracts stand for physical delivery at Cushing.”
That would be 5 to 15 million barrels delivered per month.
All it would take is traders standing for an ordinary amount of deliveries to place Cushing commerical inventories WAY below MOL.
BUT conveniently delivery against Nymex futures have dropped about 80% since the war began.
I wonder if someone has warned oil traders NOT to take delivery of Nymex WTI?
Cushing is storing mainly domestically produced crude, not import?
The amazing mainstream media biased facts are:
1. US refineries could “only” refine “import light crude”. They keep on saying US (gulf coast) refineries can not process/refine domestic light tight/shale oil, and only process foreign import crude.
Art mentioned specifically these refineries are tailored to refine Venezuela and Mexico heavy, but only occasionally; and therefore let mainstream medias to bash Trump’s take-over of Venezuela. In China, this biased fact is becoming mainstream media — they claim that Trump has to beg/force India and China to buy Venezuela crude, because US can not process it (only China&India have the refinery capability and bear the pollution). This biased fact is even reaching quite a portion of US, and even some field oil roughnecks and oil refinery chemists/engineers believe so, and not to mention all the left-extremists.
2. The Venezuela heavy is the same as Canadian Heavy, hard/expensive to produce and hard to refine, and needs Billions $$$ and years to restart. This is created by US majors as well as China oil importers preying Venezuela crude at huge discount. They are ignoring the great heavy reserves in Venezuela and Canada have huge difference and shades across a large board.
The facts are that US refineries are tuned up for the Venezuela Orinoco heavy shortly after they developed it quickly in just over 5 years in late 1990s to early 2000s. The technologies were not there in China and India at that time. US majors still has Vz import all the time even small portion, and always dreaming of getting back their bounties. Once the Chinese importer started scaling up oil operations in Vz, they got mad and unleased fury accumulated over 20 years— who would not!?!?
Venezuela certainly added 0.8~1 MBOPD,
starting at 0.5MBOPD, right now close to 1.3MBOPD
Weekly U.S. Ending Stocks of Distillate Fuel Oil
https://www.eia.gov/dnav/pet/hist/LeafHandler.ashx?n=PET&s=WDISTUS1&f=W
05/29 102 million barrels
MOL = 85 million and 90 million barrels?
Sheng Wu,
Average Venezuela crude output was 937 kb/d in 2025 and in April 2026 output was 1031 kb/d according to May MOMR from OPEC using secondary sources. Venezuela itself reports 2025 average crude output was 1081 kb/d and in April 2026 crude output was 1136 kb/d, an increase of only 55 kb/d.
In 2019 Venezuela produced about the same as in April 2025 and disd fall to as low as 500 kb/d in early 2021 under sanctions by the US under Trump (in 2018) and continued by Biden through 2021. In 2015 Venezuelan output was about 2400 kb/d. It is unlikely we see a quick return to 2400 kb/b due to a deteriorated oil infrastructure in Venezuela, but perhaps by 2036.
Since April 2021 Venezuela has added about 530 kb/d to crude output.
Where are you getting your data?
Here is the latest data on Venezuela and other OPEC producers from the June MOMR. Venezuela at 1072 kb/d in May 2026 vs 943 k/d for 4Q25. OPEC output is down about 9.67 Mb/d in May 2026 from the 4Q25 level. The 5 main OPEC nations using SOH (Saudi Arabia, UAE, Iraq, Kuwait and Iran) produced 23280 kb/d in 4Q25 and in May 2026 output was 13406 kb/d, 9874 kb/d less due to Hormuz being closed.
opec2606
Venezuela’s C+C data from EIA at link below
https://www.eia.gov/international/data/world/petroleum-and-other-liquids/monthly-petroleum-and-other-liquids-production?pd=5&p=00000000000000000000000000000000002&u=0&f=M&v=line&a=-&i=none&vo=value&vb=173&t=C&g=none&l=249–243&s=94694400000&e=1769904000000&ev=true
Venezuela C+C data from EIA in chart linked below, last data point is Feb 2026.
venezuela 2606
DC,
Looks like this author agrees with your sentiments:
https://oilprice.com/Energy/Energy-General/The-Countdown-to-a-Major-Oil-Price-Surge-Has-Begun.html
Thanks, excellent piece.
WTI under $90 this morning, as it slowly keeps falling in price.
The investment world does not believe in any short-term or long-term oil shortage.
Asklepias,
Prices are low because the market believes Trump’s bullshit that an agreement will happen in 2 or 3 days, he has been saying this for weeks, at some point the market loses faith in Trump and then prices increase. In a month things will look very different if no deal with Iran is reached. It does not look like Iran is in any hurry and Trump doesn’t want to admit how weak his position has become so this could continue for months. Maybe when Brent spot prices climb back to $138/b, Trump will make a deal, in the mean time he will try to talk down oil prices by saying it will only be another few days until an agreement is reached. It will stop being effective very soon.
Also keep in mind that there can be a very large disparity between the futures price and the spot price for WTI.
We will have to wait and see what happens.
Read the piece linked above by Kurt Cobb, it is well written and explains quite clearly and concisely why the “investment world” has its collective head in the sand.
Wild times!
Perhaps once they load the public’s stock accounts and retirement funds with SpaceX (June 12?) the market’s price finding mechanism will be allowed to function.
In the past, about 4 years ago, I was chided here when I suggested that the situation for world petrol demand had changed over the last decade. After peak we at least now had a viable alternative to ICE transport, I had indicated.
Consider that
-“Every one of the top sixteen cars sold in China was an EV in May according to China Passenger Car Association data, as gasoline-powered cars continue their structural decline in the world’s largest auto market.”
-“Amazon hit a massive milestone, deploying over 50,000 electric delivery vans globally. This puts the company exactly halfway toward its goal of 100,000 zero-emission vehicles on the road by 2030.”
The capability to deploy a wide range of EV’s seriously blunts the dire repercussions of global oil production decline. Especially for those who get with the program.
IIRC, peak ICE was about 2018, caused almost entirely by China. Chinese domestic EV sales have grown to 62% of the market, and Chinese EV exports more than doubled year over year in May, spurred by Hormuz Nuz.
Hickory
China looked at the economic facts at the turn of the century and realized that their Achilles heal was the need to import more and more oil to support their economic expansion and as a side bar possible military expansion. They came up with a simple plan, let’s pivot to EVs and power them with coal powered electricity plants. They started by funding EV research and then Tesla and Chinese companies started producing serious EVs in the mid 2000 teen years and the rest is history.
Unfortunately that thinking has escaped another major power.
“ They came up with a simple plan, let’s pivot to EVs and power them with coal powered electricity plants.”
Well, by the time EVs became a big deal China had already started to deprioritize coal. They officially recognized air quality problems in 2006, and started really doing something about it in 2013 by closing old inefficient plants and reducing coal in central cities. Since then coal has become lowest priority and wind and solar are definitively replacing them as the primary source of new generation. Renewables have even started actually reducing total coal consumption.
Yes, China is probably better diversified than most nations.
And, if people want to follow their lead, they will find that china owns all of the major markets in this area:
*Solar panels
*Silicon wafers for solar panels
*Wind turbines
*EV batteries (incl. materials)
*EVs
*Rare earths
It’s way too late to turn this around.
Dagnnabit, China also owns coal-to-liquids now.
According to AI:
“Coal-to-Liquids (CTL): The Global Gold Standard
China possesses the most advanced, largest-scale, and commercially operational CTL infrastructure in the world, having largely surpassed South Africa (Sasol), the historical pioneer of the technology.”
“China has world-class technology and the world’s largest operating capacity. It uses CTL as a strategic defense mechanism to ensure its military and transport sectors can run on domestic coal if maritime oil imports are ever cut off.”
“China utilizes both primary chemical pathways for CTL at an unprecedented industrial scale:
Direct Coal Liquefaction (DCL): This highly complex process grinds coal and reacts it directly with hydrogen under extreme pressure and temperature to create synthetic oil. China Energy Investment Corporation (CHN Energy) operates the world’s premier commercial DCL plant in Ordos, Inner Mongolia. It remains a massive feat of chemical engineering that **few other nations have successfully replicated at scale**.”
“Indirect Coal Liquefaction (ICL): This process gasifies coal into synthesis gas (syngas) first, then converts it to liquid fuels via the Fischer-Tropsch (FT) process. China has optimized high-temperature and low-temperature FT catalysts to maximize the output of ultra-clean diesel, gasoline, and jet fuel.”
THC,
Your point is well taken – China has a big lead. OTOH, the rest of the world can certainly catch up, if they decide to. Will they decide to? FF billionaires seem to have enough political power at the moment to make it hard. They can’t stop the transition, but they can protect their home markets for a while…
The rest of the world still produces a lot of “electro tech”. Tesla still sells the most popular EV (the Model Y). European wind turbines are still doing well. The US actually has a good battery industry.
As for CTL – it’s very expensive and dirty. China is understandably interested in having it as an emergency backup, but it will never be a primary industry.
Ovi, Many years back you indicated (correctly in my eyes) that a plug-in hybrid electric/ICE vehicle that was well optimized (got plenty of electric miles prior to shifting to the ICE) would be important for wider deployment.
Well, there are now lots of good vehicles like that currently out, or shortly so.
I’ve got an early spot reservation for the Scout Traveler PHEV. Not sure if I’ll pull the trigger on the purchase, but I’m watching carefully. Projected to get 150 electric miles. In this vehicle the ICE will act as a generator for the electric drivetrain, once the batteries are depleted.
https://www.scoutmotors.com/traveler
note that Coal to liquid with F-T process can not deliver good yield in jet fuel.
Venezuela heavy has good yield in jet fuel.
One reason the Waffen SS lost the air in WWII in deep winter was due to lack of aviation fuel with lower freezing point. Germany FT process could even make butter from coal, but not high % of cyclic hydrocarbons.
Koch sold the process to refine aviation and other fuels to Stalin for 3 tons of gold.
One other important technology in electrification is the ultra-high-voltage transmission technology. China deployed 800kV DC and 1100KV AC lines, while rest world limited to 750kV AC at the best.
You hook a thorium reactor to a CTL Plant.
This is what China is trying to do.
There is thorium in the coal.
You get your electricity and liquid fuels.
Oak Ridge Labs built a working Thorium reactor and abandoned it.
China has built a very small one.
Germany FT process could even make butter from coal ー>
Hmm, butter from coal! Was it tasty??
Hehe.
Most of China’s electrical energy comes from coal, so while EVs will reduce their oil consumption somewhat, the cost is a very dirty energy. It’s not that CO2 coal produces, oil does that as well, but it is the particulates, which are dangerous to human health.
Note that only 18% of China’s primary energy comes from oil.
Hickory
Yes I recall I did say that. My thought at the time was its a good transition vehicle to full BEVs and it was cheaper to buy because of the smaller battery.
A friend a few years back bought a RAV 4 plain hybrid. She use 6.5 litres per 100 km while I use 10.5 litres per 100 km in my Mazda CX-5. Her driving and mine are almost 100 percent city driving. Can’t believe the savings with just a plain hybrid.
The Scout you are looking at must be a serial drive system. It would not be as efficient as a parallel drive system but possibly simpler mechanically. I assume the engine must operate over a very narrow RPM range near its most efficient operating condition.
Mazda had a similar serial system but it used a rotary engine to power the MX 30. Not sure how successful it was. I think it was a trial horse. They are now working on an upgrade.
https://www.youtube.com/watch?v=7VCRimXqxx8
True Ovi. The manufacturers are calling this serial setup Range Extended EV [EREV].
16 Range-Extender (EREV) vehicles expected in the U.S. (2026-2029)
https://topelectricsuv.com/hybrid-trucks/range-extender-models-upcoming/
Sheng Wu
Go back to your history books. The ‘Luftwaffe’ was the aerial arm of the Nazi German military.
Since peak conventional oil (2015), we’ve now witnessed the 10 year plateau provided mainly by U.S. unconventional.
We are now locked into 6-7% decline rate which will increase each year as production decline accelerates.
In the worst case scenario, worldwide oil production approaches zero in 2040s, with the unconventional supply gone in next 10 or so years.
This would match the 1P reserves scenario that Rystad has been publishing for over a decade.
While I consider it unlikely, it represents a significant hurdle for worldwide supply and demand.
U.S. Crude Inventories Drop 9 Million Barrels in Surprise Draw
(Suprising to who?)
The American Petroleum Institute reported a 9.119 million barrel decline in U.S. crude inventories for the week ending June 5, far exceeding the anticipated 3.4 million drop. Combined with a 7.9 million barrel release from the Strategic Petroleum Reserve, the total crude draw reached about 17 million barrels, while Cushing hub stocks fell 1.125 million to 22.4 million amid high refinery runs and strong exports. Traders highlighted the bullish signal amid Middle East tensions, though prices dipped slightly to $88.70 per barrel for West Texas Intermediate, with attention now on Wednesday’s official EIA report.
This story is a summary of posts on X and may evolve over time
Hmm. So in one week:
commercial inventories dropped 9.1M (1.3M per day),
SPR dropped 7.9M (1.1M/day), and
Cushing dropped 1.1M (.16M/day)?
And the US just launched a 3rd wave of strikes on Iran:
BREAKING:
*US launches a third wave of strikes on Iran, with a massive fleet of US fighter jets now airborne across western Iran, per N12.
*Iran launches 3 ballistic missiles from Isfahan towards US bases in the Gulf.
*US strikes now in Ahvaz, Iran’s main oil region, and in Zahedan, southeastern Iran near the Pakistan border.
And yet WTI front month still below $90 — guess we’ll have to wait for real shortages to see what price discovery looks like.
Maybe this SOH crisis revealed that CHina’s crude consumption has seriously dropped significantly, 3~5MBOPD.
If China SPR is really 1G BO, and CHina has stockpiled for 2 years, then each day China demand is 1.5MBOPD less. With China refined fuel export at 2MBOPD ramped up recent 2 years, China domestic demand is 3~5MBOPD less.
With the other 1.5~2MBOPD reduction comes from alternative switching due to higher oil prices.
China’s crude import % drops from 60+% to less than 50%.
That’s an interesting thought: whatever China was putting into it’s reserves up until the Iran war was counted as consumption when it really was not.
So if, for instance, China was putting 1M per day into reserves, that should be subtracted from pre-attack consumption estimates, and it reduces the shortage accordingly.
Hi Sheng Wu,
Is the relative weakness of oil prices, given the circumstances, caused by demand destruction or other factors?
We’ve seen the financial institutions drop 250 million barrels of paper oil (net shorts) in addition to their existing positions since the beginning of the year.
And we have governments committing to 400 million barrels of SPR releases.
Combined, that’s 650 million barrels. Divide by 100 days, and that’s 6.5 million barrels a day.
Then throw on top of that China’s use of inventories (a speculation) and inventory reduction elsewhere, and I don’t see why we need to argue for demand destruction.
But as an intellectual exercise, let’s look at your suggestion that China may be consuming as much as 5 mbd less of oil now.
According to AI, in 2025 China consumed the following amounts of oil:
Petrochemicals & Plastics 4.35 mbd
Commercial Transport & Logistics Diesel 4.15 mbd
Consumer & Passenger Travel Gasoline 3.61 mbd
Maritime Shipping & Heavy Industry Fuel Oil / Marine Lubricants 1.56 mbd
Aviation & Civil Aerospace Jet Fuel 0.87 mbd
TOTAL CONSUMED BY ECONOMY All Sectors 14.54 mbd
Out of these sectors, where do you think 5 mbd might have been removed from demand in 2026?
THC,
I think that it is possible to affect futures prices temporarily, but placing of contracts doesn’t replace physical barrels (in this case, we’re talking about a contractual promise to deliver something that doesn’t exist). If consumption is greater than production, at some point there is going to be a reckoning that manipulation of derivatives can’t prevent or even delay.
Hi Nick,
Yes, I agree, paper contracts cannot replace physical commodities, and *eventually* the market will sort that out. But in the short term (as in the 100 days of the Iran war), it can have a serious impact, especially when we are talking about that many barrels.
Remember, many of the barrels sold by the banks were bought by physical users/producers, who have the right, per the Nymex specifications, to take delivery should they decide to do so.
If they wait until real shortages start to appear to try to close their shorts, they make be in trouble…..probably some vassal state of the US (like Japan) was talked into managing “temporary” oil price volatility by shorting the futures as an alternative to sending troops to “help open the Hormuz.”
China increase refined fuel export significantly in the past 3 years, and especially diesel and especially aviation fuel. Aviation fuel production from CHina used to be less than Korea or Singapore, and just 20% of US ,and now already close or even surpass US this year — all with import from Venezuela and China’s Bohai bay, S China Sea, all with higher cyclic saturated compositions, or “rare earth crude”.
https://www.linkedin.com/pulse/orinoco-oil-rare-earth-crude-sheng-wu-eta1c
I did some search on “China SPR” and many claim that China SPR is ranging from 1.3 G to over 2 G BO.
In the months just before SOH crisis, China was stockpiling over 2MBOPD.
So it seems that China’s real domestic demand has caved in dramatically in the past 3 years.
https://gulfnews.com/world/americas/37-times-trump-claimed-an-iran-deal-was-near-what-s-going-on-1.500568358
“38 times Trump claimed an Iran deal was near. ”
At some point the investment world stops believing Trump’s lies.
I feel like we’ve reached that point, but with the insane volatility and the 500 million paper barrels they dumped on the market, people are hesistant to hold long positions.
Eventually it will sort out, but it’s been a tiring journey so far.
And just what ‘deal’ would be acceptable to both [Iran/Houti/Hezbollah/Hamas] and
the [USA, UAE, Saudi, Qatar,Bahrain,Oman, Kuwait, Iraq, Israel] governments.
I think back often to ‘Imagine’ by John Lennon…’no country to live and die for…no religion too’
https://www.youtube.com/watch?v=iOs9Osz3UFQ
Trump as
“The Boy who cried Deal”
Hickory,
Finding a compromise will be difficult and may not be possible, thus the Strait of Hormuz may remain closed for many more months.
Only a Fool Would Say That
https://www.youtube.com/watch?v=Hvz0TOm0zgI
The song is widely interpreted as a cynical critique of 1960s utopian ideals and, more specifically, a direct musical jab at John Lennon and his 1971 hit song “Imagine”.
The Meaning Behind the Song: Critique of “Imagine”: Steely Dan’s founders, Donald Fagen and Walter Becker, mocked Lennon’s peace-forward, “no possessions” utopian lyrics, viewing them as out-of-touch and hypocritical coming from a wealthy celebrity while working-class people struggled in the real world.
Lennon References: The lyrics target a “natural man wearing a white Stetson hat” who is “talking about a world where all is free,” a reference to Lennon’s signature fashion and the themes of his music.
The Everyman’s View: The song contrasts the dreamer on television with the “man in the street” who works a 9-to-5 job and has to live through the harsh realities of everyday life.
Hickory- Trump on the other hand, may have done more to advance the world away from oil transportation than the green revolution has ever accomplished. Who would have guessed.
Personally, I’m rooting for $12 gasoline and a U.S. depression to send a message to MAGA’s cult of Trump and his authorian ways are a lose lose situation. Just ask Putin how well his evil has done for his country. If you can find him in his bunker(ballroom). Slava Ukraine
“Imagine there’s no oversized pickup trucks with a bumper flag.
It isn’t hard to do
Nothing to kill or die for
And no religion, too”
Gary. I get that. Wake me up when religion and country are no longer things to fight over.
Gary,
One of my favorite Steely Dan songs! Never made the connection to Imagine, also a favorite.
Thanks.
According to Drop-Site News airlines spent 78% more on jet fuel in April 2026 than in April 2025 despite using less of it in 2026. It seems like the heavy transportation fuels: bunker fuel, diesel, and jet fuel are in shorter supply than the lighter (less dense) products.
An example of the geopolitcal ramifications of this conflict-
https://oilprice.com/Energy/Crude-Oil/The-Clock-Is-Ticking-Down-To-Iraqs-Economic-Disaster-On-27-July.html
Keep in mind that an unstable Iraq risks falling even further into Irans sphere of influence. About 2/3rds of Iraqi are Shia.
It is war. An economic war that diminishes American prospects.
“The US Department of War has declared that BYD, Nio, CATL, Baidu,..” on the Chinese Military list
There are now 188 companies on the list, including many premier companies that are leaders in their industry. Modern industrial industries.
‘The newly added companies include prominent names across several sectors. In addition to Alibaba, Baidu, BYD, and NIO, the list incorporates semiconductor firms such as CXMT and YMTC, robotics company Unitree, biopharmaceutical firm WuXi AppTec, lidar specialists Hesai and RoboSense, solar manufacturers JA Solar and Trina Solar, and networking equipment maker TP-Link Technologies Co.’
If you keep up with technology innovation industries you will recognize all/most of these names, and realize what a hobbling affect this will have on the US. When you don’t compete with cutting edge products you fall further behind, and you pay more that privilege.
https://www.yahoo.com/news/politics/articles/188-chinese-military-companies-now-110001042.html
Hickory,
Spot on!!!
abduction of Venezuela “rare earth” crude is to slow down China’s insatiable growth in aviation fuel production, which is a strategic war fuel supply; and ensure US dominance in aviation fuel production distribution and risk prevention.
China Unveils Nuclear-Powered Floating Hub for Zero-Emission Shipping-
‘Jiangnan Shipyard — a subsidiary of state-owned China State Shipbuilding Corporation — unveiled a nuclear-powered floating logistics hub at the Posidonia International Shipping Exhibition in Greece, designed to serve as a container transshipment terminal, energy production centre, and vessel charging station.
The platform’s core power source is a molten salt reactor, supplemented by solar and wind, capable of producing hydrogen, ammonia, and synthetic green fuels for both terminal operations and support vessels.’
https://oilprice.com/Energy/Energy-General/China-Unveils-Nuclear-Powered-Floating-Hub-for-Zero-Emission-Shipping.html
Hickory,
Like almost all nuclear news these days, it’s a concept, not a real product. Maybe in 10 years. Maybe.
————————-
Nuclear has 2 major problems: weapons proliferation and cost competitiveness with the moving target presented by renewables & batteries. I don’t see any sign that either is likely to be solved.
Another piece on World Stock draws
https://oilprice.com/Energy/Crude-Oil/Disconnected-Oil-Futures-Market-Could-See-Price-Spike-within-Weeks.html
By the end of June 2026, I predict daily Brent spot prices above $150/bo, if the impasse between the US and Iran continues to the end of July I expect Brent daily spot price will rise above $180/b. By the end of August perhaps $250/b unless demand destruction is rapid.
Dennis,
This article suggests that the supply loss is 12.8M. What do you think?
Any thoughts on whether the price spike might be more extreme in WTI or Brent?
From a conversation with AI:
“In an extreme product shortage, WTI is structurally primed for a violent, localized price explosion because short-sellers will pay virtually any price to avoid failing physical delivery at landlocked Cushing. Brent will rise sharply based on true global supply and demand, but its cash-settlement structure eliminates the risk of an artificial, panic-induced price squeeze.”
Nick G,
I have often heard estimates like 13 Mb/d for supply loss, but believe that includes crude plus products which often includes NGL. I focus on C+C and believe that supply loss to be on the order of 9 to 10 Mb/d due to the closure of SOH. If we use crude only as reported in the June MOMR and focus on the DOC, the output loss is 9842 kb/d from the 4Q25 average to May 2026 based on secondary sources used by OPEC. If that supply loss was maintained for 90 days, that would be about 886 million barrels of supply loss. If it continues another 90 days we are up to 1772 million barrels by the end of August. At some point crude oil stocks reach MOL and then all the jawboning in the World won’t keep oil prices down.
Looks like things might be kicking off again in the Hormuz area.
WTI futures up this morning.
Some unverified news headlines (ironically Iranian news is probably more reliable in terms of ongoing events than Trump’s tweets):
1. ” The IRGC Navy has released a new statement saying that approaching the Strait of Hormuz will be considered cooperation with the enemy:
Following repeated violations of the ceasefire by the American enemy, the Strait of Hormuz will be closed until further notice.
We warn that no vessel should leave its anchorage in the Persian Gulf and the Sea of Oman. Approaching the Strait of Hormuz will be considered cooperation with the enemy.”
2. “The IRGC Navy has announced that two vessels attempting to transit the Strait of Hormuz were struck by Iranian projectiles”
3. “Mehr News Agency reports that the U.S. has struck 7 coastal areas so far.”
https://t.me/GeoPWatch
(Re this source, according to AI: Like many prominent Open-Source Intelligence (OSINT) and military-tracking channels on Telegram, the Geopolitics Watch (@GeoPWatch) channel operates anonymously. Their raw information regarding the actions of Iran and Russia is often highly accurate and incredibly fast, but their interpretations, framing, and context are heavily biased.)
“But can U.S. citizens truly stop the madness their own empire imposes on them and on the rest of the world?”
hightrekker!
hightrekker,
“But can U.S. citizens truly stop the madness their own empire imposes on them and on the rest of the world?”
Good question — currently the answer appears to be “no.”
~~~~~
Trump: Iran deal reached
Tehran: no “final decision”
~~~~~
“They lie to us, we know they’re lying, they know we know they’re lying but they keep lying anyway, and we keep pretending to believe them.”
https://youtu.be/GbkTEpjtGwE?si=PCdQADH8vay094u3&t=261
now, Art constantly use “beer” and “whisky” to tell that US is not energy independent.
But, the if the Canadian and Venezuela Heavies are the same “whisky” and all have a huge discount, then why Trump or the refineries want to bash Canada and favor to take Venezuela which according to Art is even “worse than Canada”.
SW,
I too have noticed something is a bit off with Art these days.
He tends to be reasonable in long-format interviews, but in his tweets it sometimes feels like he speaks out of both sides of his mouth.
Not sure what is going on there…….
Maybe Art tweets when drinking beer and whiskey. 🙂
DC,
That’s quite possible.
Perhaps after a couple of drinks, someone’s response puts him in “tilt” mode!
NGL I’ve done the same way too many times.
Sheng Wu
I think the rationale for getting more oil from Venezuela is to reduce imports from Canada. By reducing imports from Canada, the spread between WTI and WCS (Western Canada Select) would increase. A few months back the discount was closer to $15/b. It used to be closer to $20/b to $25b/b before the TMX pipeline opened. TMX has really shrunk the discount.
Cdn oil companies are receiving an extra $US 9M each day on the 900 kb/d shipped through TMX, assuming the discount has been reduced by $10/b.
We here in Canada feel we are subsidizing US drivers to drive or maybe just enriching US refiners.
The war has resulted in TMX going from 80% full in January to 100% in June. See attached article. It is this increase in oil exports through TMX that has offset the extra oil imported by the US from Venezuela that has kept the discount in the $11/b range recently.
https://boereport.com/2026/06/10/discount-on-western-canada-select-widens-52/
https://oilprice.com/Latest-Energy-News/World-News/Trans-Mountain-Oil-Pipeline-Hits-Full-Capacity-as-Asian-Demand-Surges.html
yes, Ovi
Canadians also got a bargain chip with TMX up this year, and US refineries certainly want a backup and or alternative cheap source. Venezuela will be the quick solution if abducted from China successfully. For sure, TMX is a catalysis for Trump/US majors backing up the Vz abduction.
Ovi,
here is an AGI youtube claiming Canadian WCS is selling a premium after TMX.
https://www.youtube.com/watch?v=JeOLZ9KkxdM
Whitehouse correspondents speculate US Gov’t shorting oil
https://youtu.be/R966yCL1bww?si=hG5puSgCqwN9VXGH
Time stamp: 6:20
Seems war has resumed. See
https://www.msn.com/en-ca/news/world/trump-vows-to-seize-irans-oil-and-assume-total-control-in-new-truth-social-post/ar-AA25ofcR
If Trump decides to take Kharg as he threatens in this Truth Social post we might see oil infrastructure throughout the Persian Gulf hit by Iran.
This seems likely to backfire badly on the World economy.
That was this mornings spew. He changed his mind. His attention span or adherence to objective reality is a bit like a four year old.
https://www.theguardian.com/world/live/2026/jun/11/iran-war-news-us-strikes-donald-trump-stalled-peace-talks-middle-east-crisis
https://discoveryalert.com.au/chevron-vaca-muerta-investment-rigi-argentina-el-trapial/
Chevron plans to put in $13.8 Billion in Vaca Muerta El Trapial just to get 90KBOPD by 2035.
This amount could get Orinoco 1.5million BOPD by the end of this year.
The majority of shale industry still believe in light oil with high GOR is the only shale oil that is producible or prolific. Even the El Trapial in Vaca Muerta has the best eastern block producing 35deg API shale oil, instead of the more volatile 40deg API shale in the western part.
Continental Resources also started in nearby block, but recently decided to try the best low GOR & API (<27deg) block way East of Vaca Muerta in the Rio Negro province.
Sheng Wu,
I will believe that kind of increase in Venezuela when I see it in the Data. So far Venezuela is at 1072 kb/d of Crude output as of May 2026, YOY the increase has been 147 kb/d, an increase of 428 kb/d in the next 7 months is unlikely in my opinion.
The Chevron investment in Argentina has output increasing from 30 kb/d in 2025 to 90 kb/d in 2035, so an increase of 60 kb/d or 0.06 Mb/d, a pretty minor amount of oil.
The majors may not believe that Venezuela will remain stable so may be less inclined to make large investments there as they have been burned in the past. This is potentially a problem in Argentina as well.
Crude oil price collapsing, just above $86 for WTI. No sign of any shortage impacting prices.
It’s commonly assumed that the price of a commodity will go out before reserves run out. That’s what futures markets are for.
But it often doesn’t happen that way. Prices tend to reflect the current cost of supply. The market mechanism seems intelligent, but in reality, it doesn’t have a brain or any magical ability to predict the future.
We have heard many times that a deal is 2 to 3 days away. I will believe this when we start to see oil flows through Hormuz return to pre-war levels, everything else is the Trump family playing the oil market.
Gaslighting The Oil Market
The market has somehow convinced everyone that inventory draws can replace the ~11 million b/d of production shut-in. What a success story this has been.
https://www.hfir.com/p/wctw-gaslighting-the-oil-market
One interesting thought there: the reserves & inventories being drawn down aren’t just crude – they’ also products. That gives a bit more reserve than we’ve been paying attention to, no?
Nick G,
Product stocks are not as large as crude stocks, without the crude most transportation fuels (gasoline, diesel, jet and bunker fuel) run out pretty quickly, so the answer is no.
Lets look at the US, if we exclude NGL and asphalt and road oil, the total crude and petroleum stocks for week ending June 5 are 1295 million barrels, crude stocks including SPR were 776 million barrels (about 60% of the total). Stocks are indeed very low, we are likely to see a market correction soon. There is not a lot of excess stocks in the product categories, they run much closer to MOL.
THC,
Very nice piece, thanks.
it is quite interesting a controversial here between mainstream media and reality,
https://www.youtube.com/watch?v=bqjF49NWCdo
OpenAI and quite some US media Blames China for Anti AI Data Center Protests in USA
but I see firms from China got contracts for data center building here in US, and met engineers flying from Shanghai to Dallas with full designs based from China, from electricity integrating renewable, city grid and battery, to server rack power management and data center cooling, and of course all PCBs in Chassis ready for CPU/GPU, and even some GPUs are from China.
I met a well site colleague in US discussing this, and he told me that he was in Beijing 1995 to build the first 3G cellular tower there under US ACE, one trip paid $15k, excluding airfare and hotel.
Rig Report for the Week Ending June 12
The dropping rig count that started in early April 2025 when 450 rigs were operating dropped this week. Drilling continues at a steady rate of 367 ± 5 Hz rigs per week since August 2025 while WTI closed at $84.88/b, down from $90.54 from last Friday.
– US Hz oil rigs dropped by 1 to 372, down 78 since April 2025 when it was 450. It was also up 10 rigs from the low of 362 first reached in the week ending August 1, 2025. The rig count is down 17% since April 2025.
– The New Mexico Permian Hz rig count dropped by 2 rigs to 71. Eddy added 3 to 36 while Lea dropped 5 to 35.
– Texas dropped 1 to 195. Midland was unchanged at 22 while Martin dropped 1 to 23. The biggest change occurred in Reeves where 2 rigs were dropped to 17.
– Eagle Ford added 1 to 34.
– New for this week is the addition of the dark blue graph at the top which shows the sum of Hz and Directional Rigs. From the beginning of the year up to the middle of May, there were approximately 35 directional rigs operating. However from the middle of May to June 12, 20 additional directional rigs were deployed. Of the 20, 15 were added to Eddy county for a total of 18 and 2 were added to Reeves county for a total of 3. Are these directional rigs being deployed in Eddy to drill 4 mile U wells? Note above that Eddy also has 36 Hz rigs operating.
– NG Hz rigs dropped by 1 to 105.
A Rig
Hey Ovi,
Thanks for the update.
Ideally, with an obvious shortage of supplies for 100 days now, the invisible hand of the marketplace should raise prices to encourage producers to invest in more production and consumers to find ways to reduce/economize consumption.
But at $85 or so, the market is not sending the right signal.
Frac Spread Report for the Week Ending June 12
The frac spread count rose by 2 to 192. From one year ago, it is up by 10 spreads but is still down by 23 since March 21, 2025.
A frac
Some interesting thoughts from Bowtied Lobster, which hint at an alterative (conspiratorial?) explanation for the ongoing surreal, never-ending soap opera regarding the Hormuz:
“You want the largest oil shortages possible. Which is better?
Attack Iran so hard they block Hormuz and Bab el-Mandeb. Oil goes to $240 immediately.
Attack Iran enough to block Hormuz. Stop. Stall. Keep oil at $80. Run down all the world’s emergency reserves. THEN block BaM.”
https://x.com/BowTiedLobster/status/2065282031203086476?s=20
=====
The U.S. reserve drains are public. If the U.S. hoards their reserves, it signals to others that the U.S. thinks this will last longer than Trump claims in public.
Actions-words mismatch.
If you want to present the impression you think it’ll end soon you need to go all out.
https://x.com/BowTiedLobster/status/2065375886023815374?s=20
=====
Having asserted itself in Panama, Venezuela, Cape Horn, Greenland, and Malacca. The U.S. overarching geopolitical strategy is obvious.
Given its resource significance Hormuz would be a corner stone of such a plan and the U.S. Hormuz blockade is therefore obviously permanent.
https://x.com/BowTiedLobster/status/2065561415432446095?s=20
=====
I do not know who Bowtiedlobster is and have never heard of him before, but I was intrigued by his conviction that the Hormuz is being kept closed intionally.
I have had a feeling/intuition that the main players do not intend to reopen the Hormuz, and that the “deal negotiations” are just to keep the public hypnotized and asleep.
Why they are doing this is less clear to me, so I thought it would be worthwhile to subscribe to the Lobster’s substack and read his theories on the “why” this is happening.
I have made a summary from one of his recent paywalled articles on Substack.
I have trouble seeing Trump as a grand architect of any major strategy, but it is highly possible he is being used as a chess piece by others to implement a long-term strategy. Whether or not the Lobster is on point I do not know, but I share this as food for thought.
Replacing the word “Trump” with “They” (the unseen hand(s), whoever they are) might be another way to read the article.
~~~~~
Why Trump Wants The Strait of Hormuz Closed
A More Nuanced Explanation
Lobster
May 16, 2026
A conversation with a paid subscriber helped me realize that I have not articulated in a coherent way what I mean when I say “Trump wants the Strait of Hormuz closed.”
“Trump wants the Strait of Hormuz closed” is good marketing for my view in a public sphere because it’s jarring, contradicts common knowledge, and gets across an essential point that I can elucidate more precisely here. I’m going to talk about the forces outside of Trump’s control in more detail at the end, but I first want to paint the big picture and what Trump’s “desired endgame” looks like in a perfect world (for him) at the end of all his geopolitical “excursions.”
Time for the non-intellectual, straightforward explanation of how Trump sees this benefiting his plans to “Make America Mercantilist Again.”
Trump wants America to have companies that build as much stuff in America. If we go to war Trump wants America to makes the stuff America needs to prosecute that war. Right now America needs to build a lot of factories and supply lines that make that stuff. It will take a lot of time and energy to accomplish that, and those factories and supply lines will have to compete with factories and supply lines currently in place throughout the world that currently make that stuff and sell much of it at a conceivably cheaper price compared to a hypothetical future American factory.
Trump can’t get people to invest to make those factories unless they feel confident that the future factory will have buyers for the stuff. They want to know the future factory will be competitive with present day factories that create that stuff before they invest.
As I said in “Wargaming Trump’s Economic Strategy,” Trump wants this all to happen on his watch so he gets the credit and also so he can ensure through his own power that it happens. To do this quickly and to ensure that people invest to build the factories that create the stuff, he needs to rapidly make it obvious that the future factories that create the stuff will be highly competitive, and perhaps even necessary. The only real way to do this is with policy that sabotages non-American factories.
Tariffs are a “nice” way of doing this. By using policy which increases the relative prices of stuff being created by non-American factories relative to stuff being created by American factories, he incentivizes this investment. He also took the proactive step of negotiating all sorts of fixed direct investment from foreign nations into the United States specifically to build the sorts of factories Trump wants to be built.
This plan kind of worked, but not really. As described in multiple previous articles Trump ran into a lot of obstacles for effectuating this plan with the “nice” tools he had access to. In particular, the loss of his unilateral tariffs with the Supreme Court decision made it much more difficult for him to coerce foreign nations to make good on the investments that they had promised.
Why Negotiation Day Will Work
To see the full form of Trump’s Plan B, it helps to look around 3 years into the future and guess at some of the likely occurrences should the Strait of Hormuz be closed in all that time between then and now. Let’s talk about this even more simply.
Factories need energy to run and that energy comes out of the ground. Pending a tech advance in the near future this will remain true. The United States and Canada have a lot of this energy in the ground (taking Venezuela was obviously not coincidental). A huge amount of this energy in the ground comes from the Middle East right now. If all this energy in the ground in the Middle East is no longer going around the world, those factories can’t run anymore. They stop making stuff.
People want the stuff, so they look for other places that can make the stuff. But first they need that energy. So first America and Canada will do a lot of investment to build infrastructure to get that energy out of the ground. There will be people in North America who want that energy and lots of people outside of North America who want that energy to start making their stuff again. That demand guarantees that that investment will take place.
Next, all those foreign factories get set back decades because they no longer have the energy they could previously depend upon to make that stuff. So if anyone has ever wanted to invest to make a similar factory in America, all of a sudden it became a lot more appealing. Those of you who are familiar with Trump’s capex tax credit policies in One Big Beautiful Bill as well as bank deregulation and pressure on the Fed to lower the Federal Funds rate know that he has been greasing the wheels in advance of “Negotiation Day” to enable this investment to create these factories, as well as the oil infrastructure to take energy out of the ground.
The part people have not been able to come to terms with is the extreme degree of sabotage Trump is willing to commit of economies outside of North America to make that investment feasible. That sabotage is so destructive people still haven’t really come to terms with it, even though it already happened. The 7 week delay of transit of ships from the Strait to around the globe is the only thing standing in between common knowledge that a massive global depression is already baked into the cake. Exactly as Trump warned would happen in August. “It is 1929 all over again, a Great Depression.”
There’s another factor you need to keep in mind here, which is that there is much more oil sabotage going on today than just in Hormuz. Some of you may have heard about the fact that there have been dozens of explosions or other damages in oil infrastructure around the world. In particular, Ukraine’s drones have recently started to attack Russia’s oil infrastructure very aggressively. That all of these “coincidences” are happening without some sort of U.S. influence beggars belief.
It also makes it a lot easier to see why Trump is saying the Strait will be open every day and “playing dumb” as regards the fact that he isn’t taking this nearly as seriously as one would expect him to, given what’s at stake in the global economy. He needs to be seen as stupid or “manipulated by Israel” or any number of theories that those with “Doctor Donald Savior Syndrome” are willing to believe.
That’s because closing the Strait of Hormuz for this length of time is basically a war crime. The humanitarian damage to the world will be incalculable. We’re talking about mass starvation events here. I won’t delve too finely into these details.
The point is, in a scenario where Trump is impeached or falls out of political favor, he and his cabinet have some interest in not being put up on the stand for war crime charges after the entire world sees the full blowback of this event. He is creating a shield of plausible deniability and using apparent ignorance to deflect the notion that he is culpable. This has other side benefits like preserving the false image of “Doctor Donald, Savior of Stocks” for when he wants animal spirits to prevent a repeat of the 1930s decade (I think he may well succeed at that).
There’s one final conclusion from this straightforward explanation which I think is useful to articulate. That’s that this is not about China. China is the unlucky mercantilist power with many factories which make much stuff. So China is greatly affected. But Trump does not want to hurt China per se. He wants to sabotage the whole world indiscriminately to help America. This has altered my previous assessment of Trump’s plans, and helps us see why Trump is trying to be so conciliatory to Xi in their recent meeting. He knows how much damage his plan does to China in particular, and wants to maintain as friendly a relationship with Xi as possible, if only to forestall any World War III event. I would look for more overtures of friendship extended by Trump to China in the future.
There are several problems with this theory. First, it suggests that either the president or his backers are playing 7th dimensional chess. This is highly unlikely. Both the president and all of his visible advisers (including such geniuses as Peter Thiel and Musk, who are completely bonkers) are demonstrably incompetent at government and badly out of touch. Further, they are pursuing only their own narrow short-term interests, and really don’t care about the US.
2nd, it suggests that the presidents tariff regime has helped, or is likely to help US manufacturing. It hasn’t helped so far, in fact it’s hurt. The tariff regime is so chaotic that it hurts business planning, which needs predictability.
3rd, it suggests that reducing oil supply hurts China and helps the US. This is unrealistic. China is being greatly helped by the current oil shock – it is aggressively moving away from oil and FF, and the oil shock is giving this a big tail-wind. The US auto industry (a very important part of US manufacturing), OTOH, is being badly hurt by both tariffs and the effort to hold back EVs.
The presidents policies have hurt both the US and the rest of the world, but they hurt the US a bit more.
Nick G,
What you are missing is the psychotics in charge have enough belief, wealth and resources to implement their psychosis on the rest of us peasants.
Iron Mike:
I agree.
It’s worth asking if they can achieve their *stated* goals. If this president wants to help the US grow economically, he’s doing a terrible job. The tariffs have hurt the economy. So has the anti-immigration push, and so has the pro-FF push.
Do they really care about growing US manufacturing or overall GDP? Probably not. If they do, they’re spectacularly ineffective.
Mind-altering, sometimes the answer is simple and staring you right in the face. So I ask my friend Gimini a few questions below.
GL- What kind of person likes to destroy everything?
Individuals who exhibit destructive patterns are often categorized as having high-conflict personalities, often driven by deep-seated insecurity, a desire for control, or an inability to process intense emotions. Their behavior generally stems from specific psychological traits:
High-Conflict Personalities (HCPs): Defined by mental health and relationship experts, these individuals are frequently preoccupied with blaming others, lack self-awareness, and often exhibit “all-or-nothing” thinking where everything (and everyone) is seen as entirely good or entirely bad.
Narcissistic Traits: Many users on Quora agree that individuals with narcissistic or manipulative tendencies intentionally ruin experiences for others to maintain power, control the emotional environment, or alleviate their own insecurities.
Sadistic or Malignant Personalities: In more extreme scenarios, psychologists categorize certain individuals as psychopaths or sadists who explicitly derive twisted pleasure or satisfaction from witnessing the suffering, dread, and anxiety of others.
Deep Insecurity: Opinions are mixed on the role of insecurity, but many commenters on Reddit point out that deeply insecure people can be highly destructive due to their tendency to project their self-hatred outward and sabotage relationships.
Gimini- Is this a personal relationship, a workplace issue, or a general observation?
GL- President of the United States
The dynamic you are describing is a public leadership observation involving high-level governance, specifically the President of the United States. When analyzing destructive behavioral patterns at the level of a head of state, the psychological traits mentioned earlier manifest as systemic, geopolitical, and institutional disruption:
Institutional and Policy Sabotage
The “Burn It Down” Strategy: Leaders who display high-conflict or malignant tendencies often target established institutions, alliances, or norms. Instead of reforming systems, they prefer to completely dismantle them to consolidate absolute personal loyalty and power.
Chaos as a Tool: Destructive political leaders use chaotic decision-making, rapid policy reversals, and sudden public confrontations to keep subordinates, adversaries, and the public off-balance, ensuring they remain the sole focus of control.
Us-vs-Them Polarization
All-or-Nothing Splitting: In public leadership, this results in intense polarization. The leader frames society strictly into loyalists and enemies, with no room for neutral ground or professional disagreement.
Externalizing Blame: A destructive leader never accepts responsibility for negative outcomes. Failures are automatically projected onto political opponents, institutional “deep states,” or the media.
Managing Systemic Stress
If you are a citizen observing this from afar, the best approach is to limit media consumption to prevent chronic stress and focus energy on local community stability.
GL- Psychological breakdown of historical examples of destructive world leaders?
Historical analyses of destructive world leaders frequently identify a combination of malignant narcissism, paranoia, antisocial personality traits, and hubris syndrome as the psychological drivers behind their actions.Psychologists, historians, and political scientists often use retrospective psychological profiling to understand how these traits manifest in absolute power.
1. Malignant Narcissism and Sadism
Malignant narcissism is a psychological syndrome characterized by an extreme mix of narcissism, antisocial behavior, aggression, and sadism. Leaders with these traits view themselves as infallible and show a complete lack of empathy for the suffering of others.
Adolf Hitler: Retrospective psychological profiles, including historical reports commissioned by the U.S. Office of Strategic Services, frequently categorize Hitler as a malignant narcissist. His messianic self-image made him incapable of accepting error, leading him to demand the total destruction of Germany’s infrastructure (The Nero Decree) when he realized the war was lost, believing that if the nation could not win, it did not deserve to survive.
Idi Amin: The former dictator of Uganda exhibited extreme grandiosity combined with severe sadistic tendencies. Psychological reviews of his regime note that his destruction of Uganda’s economic and social fabric was fueled by an erratic, fragile ego that required absolute subjugation from his subjects to maintain his delusion of supreme power.
2. Clinical Paranoia and Systemic Purges
When a destructive leader possesses absolute power, personal paranoia transforms into deadly state policy. The leader perceives threats everywhere, leading to the preemptive destruction of real or imagined enemies.
Joseph Stalin: Historians and psychiatrists widely document Stalin’s severe clinical paranoia. This psychological state directly drove the Great Purge of the 1930s. His deep-seated fear of betrayal caused him to systematically destroy the Soviet Union’s own military leadership, intellectual elite, and millions of ordinary citizens, weakening the state to ensure his personal survival.
Nero: The Roman Emperor’s reign deteriorated into systemic executions and destruction driven by deep paranoia. Fearing conspiracies against his rule, he executed his own mother, wife, and dozens of senators, ultimately destabilizing Rome’s political foundation.
3. Hubris Syndrome and Reality Detachment
Hubris Syndrome is a disorder of the possession of power, particularly power which has been associated with overwhelming success, held for a period of years. It results in a complete loss of contact with reality and a belief that the leader is accountable only to history or God.
Muammar Gaddafi: Over his four-decade rule of Libya, Gaddafi exhibited profound detachment from reality, a key marker of hubris syndrome. His belief in his own infallible revolutionary ideology led him to dismantle all formal state institutions, courts, and military structures, replacing them with a chaotic personalist system that ultimately fractured the country upon his downfall.
I think I have found the explanation and he is mentally ill
Good discussion.
“ If you are a citizen observing this from afar, the best approach is to limit media consumption to prevent chronic stress and focus energy on local community stability.”
It would be nice to expand on that. We need all of the help we can get to cope with this stuff.
Nick, Iron Mike, GaryLittle,
Thank you for taking time to respond.
I’d like to ask a couple of quick questions:
Q1. After watching over 100 days of Hormuz closure, have you ever felt that perhaps those involved with the conflict either “have no intention to reopen the Hormuz” or “have no intention of restoring Hormuz traffic flows to pre-war levels at any time in the near future”?
Q2. If the answer to Q1 is “yes,” are you aware of any twitter accounts, blogs, substacks, etc. where these possibilities are being discussed?
As I watch the merry-go-round of false, confusing, and self-contradictory statements, the whole thing looks like increasingly like a cynical manipulation of the markets and public opinion.
I would be interested in learning more about what rationales might exist for keeping the Hormuz closed, but so far the only people I have noticed discussing this publicly are Michael Yon (depopulation theory) and BowtiedLobster.
I would be interested in looking at other angles, and I would appreciate any links you could share.
Hi Iron Mike,
I feel it is hard if not impossible for ordinary people to be sure who exactly is in charge here (pretty sure it’s not the geezers/freaks on the stage), but it does look indeed like they have enough wealth, power, influece/control, and resources to implement their psychosis on the rest of us peasants.
Hi Nick!
Thanks for sharing.
1. Who’s in charge?
(BowtiedLobster’s theory) “suggests that either the president or his backers are playing 7th dimensional chess. This is highly unlikely. Both the president and all of his visible advisers (including such geniuses as Peter Thiel and Musk, who are completely bonkers) are demonstrably incompetent at government and badly out of touch.”
I am relatively sure that Trump is not the Grand Architect of any kind of complicated strategy. He is likely someone who was put in place on the stage to be the US face of the strategy (for now).
Elon and Thiel as well were probably chosen for their public roles, and I suspect they have much less autonomy that we are led to believe. Elon in particular does not seem like a rocket science genius but more like an asset/tool for others behind the curtain.
Unfortunately I have no evidence of this or who might actually be pulling the strings.
2. Tariff regime
“it suggests that the presidents tariff regime has helped, or is likely to help US manufacturing. It hasn’t helped so far, in fact it’s hurt. The tariff regime is so chaotic that it hurts business planning, which needs predictability.”
Yes, as someone on the receiving end of the tariffs (Japan), it does not look to me like the tariffs were helpful in restoring American manufacturing greatness, but instead damaged its relationship with allies/vassals.
But if the goal was to turn historical relationships/alliances/trust upside down, it was quite successful. This does not match the thoery of Mr. Lobster, but it does match the theory discussed below that US dominance is to be replaced with a new China/BRICS centric global order.
3. China
“China is being greatly helped by the current oil shock – it is aggressively moving away from oil and FF, and the oil shock is giving this a big tail-wind. The US auto industry (a very important part of US manufacturing), OTOH, is being badly hurt by both tariffs and the effort to hold back EVs.”
Yes, if we look into it, China is highly diversified in terms of energy resources and technology. They are leading in EVs, solar, wind, batteries, hydrogen, coal to liquids, and eventually nuclear (thorium etc.).
There is a theory (The predators versus the people / Meeuwis T. Baaijen) that those pulling the strings (Baaijen refers to them as the “Glafia”), are engaging in a controlled demolition of the American Empire to replace it with a New Order with China at its center. I have no idea if this is true, but it does match China’s almost complete dominance of global manufacturing supply chains (which are essential for weapons manufacturing), as well as how China’s system of governance and culture lends itself to a high degree of central control.
A few snippets from “The predators versus the people”:
========
“China, Glafia’s fifth hegemon
To quickly recap: according to Giovanni Arrighi (1994), the world capitalist system
developed in four cycles, each led by a temporary hegemon, respectively Spain, Holland, England, and the United States. Each cycle was divided into three phases:
1. An accumulation phase, through trade (piling up of capital).
2. A phase of industrial expansion.
3. A period of financialization (investment, mostly foreign, of capital), dominated
by bankers (the earlier merchants lending out their capital).
This last phase is “burning hot and then fading away”, or as Braudel called it, “a sign of
autumn”. In it, not only the finance era runs its final course, but also the leader state itself.
The gradual demise of one cycle would become the gradual birth of the next, on an ever grander and more global scale.”
“When we take the recent developments into account, including the war in Ukraine (B28), there can be no doubt: China (B3), and Russia too (B4), will be the new horses pulling
Glafia’s chariot, this time not in a uni-polar, but in a multi-polar world (B33).”
THC,
Yes, if one asks what a president might do if he/she were an agent of a foreign power (let’s say…China), what would they do? It looks an awful lot like what we’re seeing from this president…
A couple of quibbles: I’m not aware of Spain having an industrial phase as a hegemon. As best I can tell they simply happened to steal a great deal of gold from the New World, which allowed them to act like a Great Power for a time. Also, Russia really doesn’t look like a candidate for a new multi-polar hegemon – it’s a weak, small power that depends on declining FF sales, which has a lot of low-value land and nukes.
—————————-
My candidates for role of malignant puppeteer are two who are not at all hidden: Charles Koch and Rupert Murdoch. They don’t need conspiracy theories: the enormous harm they do is mostly right out in the open.
Thank you Nick. Those last two lines certainly ring true, and the ‘puppeteer’ label seems particularly apt.
https://www.youtube.com/shorts/-KQEc7jUIwk
Houthis using underwater sea drones on commercial vessels in the Red Sea.
Nostradamus The Giant predicted this after Ukraine sanke a Russian docked submarine with one.
This is gonna be hard to stop
https://oilprice.com/Energy/Crude-Oil/The-Oil-Market-Could-Be-Weeks-From-a-Breaking-Point.html
ING estimates Brent could surge to $120–$130 per barrel this summer if Hormuz disruptions persist, increasing pressure on Washington to secure a U.S.-Iran deal and avert a deeper global supply crunch.
This estimate may be conservative in my view, I think prices over $150/b for Brent by the end of July and over $180/b by the end of August, if the Strait of Hormuz remains closed.
Despite hopeful rhetoric from the Trump administration about a Hormuz deal in a few days (claimed for the 40th time), a deal is not very close in reality.
Despite these warnings, WTI is down again and is at $85/b.
I checked the price of WTI 20 (10) years ago: $72.5 ($48.9). Inflation adjusted that is $120/b ($68/b). Oil is amazingly inexpensive, even given the wars in the Gulf and Ukraine.
Yes, oil “could” surge, but even Brent at $120 is not really expensive compared to the past when adjusted for inflation.
Correct that oil futures prices are low currently. Brent spot price went as high as $138/b on April 7, 2026. It went as high as 144/b in 2008 in nominal dollars. When we adjust to June 2026 dollars, the monthly Brent price was as high as $202/b in June 2008 and was over $150/b for most of 2011 and 2012. The April 2026 Brent spot price was around $118/b, most recent spot price had fallen to $97/b on June 8 (most recent data point I could find for spot price.)
If there is a deal between US and Iran, oil prices will fall, if not they will rise.
I agree oil futures prices are surprisingly low at present.
I expect this will change in a few weeks.
If there is no deal by September 30, 2026 we may see $200/b or higher for the average monthly Brent spot price in September 2026.
Hi Dennis, I don’t post much any more but I keep an eye out.
My guess, FWIW, is similar. The TACO game doesn’t wash here because Iran has been preparing for this very play by the US for 50 years. They know trump is in over his head and they have him by the short hairs just as they did Jimmy Carter back in the day, big election coming up. Word is at 4:30 CDT Sunday that they’ve rejected him again.
Discounting the supply shortfall because there are a few tanks still yielding sludge just shows how far the Drill Baby cheer-leading has infected the markets. Of course the final buyers, the refiners, are pleased as punch. Not just Peakers but lots of others were burned by the various gluts over the last dozen years. Pessimism is out of favor.
Neither trump nor the ayatollah can back down before real pain sets in. It looks like the minimum operating level is going to sneak up on us right out in the open and we’ll be too busy watching cage matches and betting on which AI takes over to notice.
ETA, The Pakistani PM just said there was a deal so perhaps I was premature.
Nice Pops, spot on!
U Turn Wells
In my rig report above I noted that there has been a significant increase in the use of Directional rigs in Eddy county.
I wondered if AI had any info on this. Here is what Google’s AI replied on which company was drilling U wells in Eddy county.
Matador Production Company (a subsidiary of Matador Resources) actively explores, drills, and operates unconventional horizontal wells in the Delaware Basin, including significant acreage in Eddy County, New Mexico.
Matador’s operations in Eddy County and the surrounding Delaware Basin focus extensively on the Wolfcamp and Bone Spring plays. Their activities in this region are characterized by:
Horizontal & “U-Turn” Drilling: Matador focuses heavily on drilling two-mile or longer horizontal laterals and has achieved major cost efficiencies through innovative drilling techniques like “U-Turn” wells and trimul-frac (three-well pad) completions.
Asset Areas: In Eddy County, Matador targets specific high-yield prospects such as Rustler Breaks, Arrowhead, and the Greater Stebbins.
I think we are entering the post-AGW age — that’s the time when climate change is a given, not much we can do about it, and that it no longer takes precedence over more pressing issues.
A few concurrent observations reinforce this idea:
1. There was a premise that climate scientists assumed called RCP8.5 which was a high-emissions climate scenario used in modeling. Recently it has been downgraded for obvious reasons — fossil fuel usage will not be as high as anticipated.
2. Iran war – the oil shock that has caused the media and politicians to face the reality of depletion and what will be in store in a shorter term than was anticipated.
3. The chemistry and thermodynamics of CO2. The CO2 that is now in the atmosphere will not go anywhere. It may continue to gradually go up but it certainly will never go down, just because it is almost impossible to permanently sequester without huge energy input.
The consequences of this will be that the energy transition will continue on pace but mitigating climate change will no longer be the primary incentive. Both climate change alarmists and climate change denialists will mootly cancel each other out.
I think you’re on to something – that’s definitely the latest FF industry argument: “Yes, climate change is real, but there’s not much we can do about it, and we’ll need FF for a very long transition.”
The problem: it’s entirely unrealistic, and any climatologist will tell you so. What we do now about GHG emissions is very important, and we can make a big difference now by speeding up the transition.
Fortunately the efforts that have been made in the past are bearing fruit in the form of plummeting costs for renewables, batteries and EVs, but the FF industry is still working desperately to slow down the transition, especially in the US. Whatever we can do to keep the transition going faster will be extremely valuable, especially for the US which is being hurt by staying with functionally obsolete products which will make the US uncompetitive.
Whoa, the US & Iran announcements nearly took WTI below $80!!!
The agreement to sign a MOU on Friday to begin negotiations for 60 days prior to final negotiations to think about…….endless word salad about things don’t seem likely to happen.
Here is the Iranian version of what is in the MOU:
Mehr News has released a short version of the 14-clauses of the MoU that will be signed on Friday, between Iran & US.
1. The permanent and immediate halt of war on all fronts, including Lebanon.
2. A U.S. commitment not to interfere in Iran’s internal affairs and to respect the sovereignty of the Islamic Republic of Iran.
3. The complete lifting of the naval blockade within 30 days.
4. A U.S. commitment to withdraw its forces from the areas surrounding Iran.
5. The reopening of the Strait of Hormuz within 30 days under Iranian “arrangements”.
6. The suspension of oil sanctions, petrochemical products and derivatives, and Iran’s full access to the financial proceeds from them.
7. The requirement for the US & its allies to present reconstruction plans for Iran worth at least $300 billion.
8. Sixty days of negotiations to reach a final agreement based on nuclear issues and the complete lifting of primary and secondary U.S. sanctions, as well as UN Security Council resolutions and resolutions of the IAEA Board of Governors.
9. Iran’s reiteration of its commitment under the NPT not to produce nuclear weapons.
10. During the negotiation period, the U.S. has committed not to add to its forces in the region and not to impose any new sanctions.
11. The release of $24 billion of Iran’s frozen funds during the 60-day period of final negotiations. Half of this amount must be made available to Iran before the negotiations begin.
12. The formation of a supervisory mechanism to implement the agreement.
13. The final agreement will be approved through a UN Security Council resolution.
14. Final negotiations will not begin before half of Iran’s frozen funds are released, Iran’s oil sanctions are suspended, and the naval blockade is lifted. The final agreement will be limited only to the fate of enriched materials and enrichment, sanctions relief, and the program for rebuilding Iran’s economy. Discussions about Iran’s missile program and support for Resistance groups have been definitively removed from the agenda.
Phases as per the Iranians:
The Iran-U.S. Memorandum of Understanding: Full Details
Phase 1 | Upon announcement of the MoU (effective immediately):
– Upon announcement of the MoU, both sides declare an immediate, complete and permanent end to all hostilities in the region, including Lebanon.
– Upon announcement of the MoU, the United States declares the immediate and complete lifting of the U.S. naval blockade against Iran.
Phase 2 | After Signing of the MoU (30-day period):
– Upon signing the MoU, the United States confirms its commitment to non-interference in Iran’s domestic affairs and respect for the sovereignty of the Islamic Republic of Iran.
– Upon signing the MoU, the United States affirms that it will not increase the amount of troops or military assets present in the region, nor impose any new sanctions during the negotiations.
– Upon signing the MoU, Iran reaffirms its commitment to the Non-Proliferation Treaty (NPT) and confirms that it will never produce, develop, or acquire a nuclear weapon.
– Upon signing the MoU, the United States declares that it will provide Iran with half of its frozen funds, amounting to a value of $12 Billion, to be made available in a non-reversible manner within 30 days, with a commitment to make the remaining half available during the subsequent 60 days.
– Upon signing the MoU, the United States will issue sanctions waivers for Iranian oil, gas, and petrochemical exports, effective immediately, with a commitment to extend these waivers permanently once a final agreement is reached.
– Upon signing the MoU, the U.S. will begin immediate consultations with Israel to present a short term timeframe for a full Israeli withdrawal from Lebanon, including points occupied following the 2024 Israel-Hezbollah agreement.
– Upon signing the MoU, Iran confirms it will reopen the Strait of Hormuz to commercial maritime traffic, according to certain specified arrangements determined by Iran, within 30 days.
Phase 3 | Negotiations on a Final Deal (60-day period + possible extension):
– The 60-day negotiating period will begin once all the terms of the MoU have been met in the previous 30 days.
– The 60-day negotiating period can be extended by mutual agreement of both parties.
– During these 60 days, the U.S. will make the remaining $12 Billion of Iran’s frozen assets available.
– During these 60 days, the U.S. will present plans for a reconstruction fund for Iran, amounting to a value of at least $300 Billion, funded partially by Gulf states.
– The U.S. and Iran will begin detailed discussions on a permanent solution to nuclear-related matters, including enrichment, the existing uranium stockpile, and the fate of the nuclear sites.
– The U.S. and Iran will begin detailed discussions regarding the lifting of all economic sanctions on Iran, including primary, secondary, U.S. and UN sanctions, as well as the withdrawal of all UN Security Council and IAEA Board of Governors resolutions against Iran.
– A monitoring mechanism will be established to supervise the implementation of a final agreement.
– The final agreement will be approved by a UN Security Council Resolution.
Basically, if this is the deal then the US just engaged in a massive blunder (we all knew that already), and admitted a massive defeat. A little late to realize that you had no credible plan.
No brains and no balls.
Really?
The US and Gulf states are going to fund $300 billion in reconstruction in Iran??
A U.S. commitment to:
** withdraw its forces from the areas surrounding Iran**
Sounds like they are expected to move troops out of the Gulf area?
I can’t imagine Trump would sign this and allow it to be made public. Maybe Bibi will bail Trump out of signing by blowing stuff up in Lebanon this week?
~~~~~~
BREAKING: Iran says the US has agreed to pay $300 billion in reconstruction funds directly to Iran as part of the deal Pakistan announced, alongside the release of $24 billion in frozen funds with $12 billion released before negotiations even start, per Mehr News.
This directly contradicts Trump’s & Vance’s claim that no funds will be transferred to Iran at all.
If Trump denies this is true, there never was a deal. If Trump confirms, the US has fully capitulated to Iran’s demands.
https://x.com/HormuzLetter/status/2066298569477231074?s=20
$300B in reconstruction seems like political suicide for this president. Hard to imagine.
This president likes to end wars by surrendering. That’s what he did in Afghanistan and in Ukraine. That’s what he’s doing in Iran.
But…he has to be able to claim victory that he can sell to his base and to independents. I find it hard to imagine that anyone outside of the narrowest core of his base will believe that an agreement that gives $300B in reparations and reconstruction is a victory.
So, while the Iranians have released a 14-point list of terms of agreement in the MOU, the US has for some reason not released a specific summary of what was agreed on (if you can find one, please post it here along with a link).
I asked AI, and it said:
“Has the US government provided any specific list of what has been agreed to?
No, the United States government has not provided or published an official, clause-by-clause specific list of the Memorandum of Understanding (MoU).
Instead of a formal text release, the U.S. government has only authorized high-level, broad policy statements—most notably through President Donald Trump’s announcements on social media and standard White House press briefs.
Furthermore, Iranian state media itself has explicitly confirmed that the full, finalized text of the 14-point agreement will not be made public until after it is officially signed by both parties this Friday, June 19, 2026, in Geneva, Switzerland. ”
“What We Actually Know
The only specific items the U.S. has openly verified are the immediate end of military operations, the lifting of the U.S. naval blockade, a completely open Strait of Hormuz, and a 60-day clock to negotiate the permanent dismantlement of Iran’s nuclear capabilities.”
~~~~~~~~~~~~
So
To summarize
The US and Iran seem to have agreed on nothing other than “agreeing to disagree”.
What a mess.
Could be that the US has not released anything because it doesn’t look at all like a good deal for the US. Need time to spin it better, if that can be done at all.
Our military looks like a paper tiger. Yes, we can bomb them, well at least until our smart weapons run out, which doesn’t take long, particularly when we use very expensive weapons to shoot down cheap drones. And we are reluctant to go on the ground to the nuclear weapons sites to seize the uranium.
It does appear however, that some Gulf states like Saudi Arabia, have realized that relying on transport through the straits is not wise and are busy building pipelines to bypass the straits.
Hi Asklepias,
If the WTI first month price drops down to $69.00, which is no longer very far away given the current momentum, everyone who bought on Mar. 2 or after and still holds the position will be at a loss.
That would probably be a nice ironic/symbolic place for the market to have completely cleared out all of the bullishness and set the stage for coming to terms with the low inventories and supplies (assuming that these numbers are real/accurate) by reprising upwards again.
Per Robert Pape:
“According to Iran’s Deputy Foreign Minister – the most senior to comment on the Friday signing after Trump’s announcement — Tehran expects three conditions before any long-term process begins: immediate release of $12 billion in frozen assets, an immediate and complete end to Israeli military operations in Lebanon, and significant movement toward reducing the American military presence in the Gulf. He also said Iran begins charging fees in 60 days.
Forwarded this email? Subscribe here for more
Uncertain Deal—And Iran Certainly Enters Its Period of Maximum Leverage
Escalation Trap This Week: Staying Ahead of the Risks that Matter
Prof Robert Pape
Jun 15
∙
Preview
READ IN APP
Despite the headlines, this deal remains highly uncertain.
President Trump announced that a memorandum of understanding would be signed Friday in Geneva. Initial reports suggested the agreement would reopen Hormuz permanently and begin sixty days of negotiations between Washington and Tehran.
Within hours, however, Iran’s view of the agreement is very different.
According to Iran’s Deputy Foreign Minister – the most senior to comment on the Friday signing after Trump’s announcement — Tehran expects three conditions before any long-term process begins: immediate release of $12 billion in frozen assets, an immediate and complete end to Israeli military operations in Lebanon, and significant movement toward reducing the American military presence in the Gulf. He also said Iran begins charging fees in 60 days.
Those demands tell us something important. Negotiations are no longer occurring because Iran fears defeat. They are occurring because Tehran believes time increasingly favors Iran. Iran is no longer negotiating to stop losing. It is negotiating to win more.”
Those billions trump doesn’t want to admit too.
But until they arrive no mines are cleared and nothing moves, the US has said that could take “months”.
Even then those ship’s insurers are not going to be rushing to be the first to underwrite—and they won’t be giving it away any time soon.
And the pipelines needs to fill, literally and figuratively.
And none of that accounts for damage to wells and facilities.
trump is looking for a quick out and I’m sure he’ll claim victory and try to change the subject but this is his albatross.
Lots of ifs/then-s and the MOL isn’t going anywhere.
I highly recommend this podcast on auto industry/China, in order to help keep in touch with how the is changing. Very informative.
How China is reshaping the Auto Industry.
https://podcasts.apple.com/us/podcast/catalyst-with-shayle-kann/id1593204897?i=1000772190892
If you haven’t learned how to say ‘Sodium Ion’ battery yet, it is a good time to stand in front of the mirror and start practicing.
I think there are a lot of people who don’t appreciate how many different ways there are to do just about everything. People worry about running out of specific elements, and don’t realize how many different elements can be used to do a specific task.
Batteries can be made out of a zillion different materials and chemistries: lead, iron, lithium, nickel, calcium, zinc, magnesium, silver, silicon, potassium, tin, sodium, carbon, aluminum, vanadium, etc., etc.
Sodium is a good candidate because it’s enormously cheap and abundant. IIRC, sodium batteries tend to be somewhat lower in energy density, but density doesn’t matter in a lot of applications, including some vehicles and especially utility load following,
An update to February World Oil Production has posted
https://peakoilbarrel.com/record-high-february-world-oil-production/
I came across a summary of Iranian concerns regarding the MOU.
Assuming this is reasonably correct, then the summaries made public by Iranian outlets/mouthpieces are not much more accurate than the vague statements from the Trump side.
The “fog of the Hormuz” is likely to go on for quite some time.
https://x.com/AlexanderKim120/status/2065948539050700805?s=20
Way too much to cut and paste here, so just the intro:
“Yesterday I wrote about the venue of the prospective agreement, the mechanism meant to enforce it, and the actors who will not sign it. Then I came across an SNN interview in which Mahmoud Nabavian, deputy chairman of the Iranian Parliament’s National Security Commission, read out the original text directly and launched a frontal attack on the negotiating team.
Nabavian is a hardliner opposed to the negotiations themselves, so his testimony carries its own bias. But on the strength of the fact that he was quoting the wording — and on the basis of the critique now coming from the hardline camp — yesterday’s piece needs correcting.”