World Conventional Oil output peaked at a centered twelve month average (CTMA) of 74193 kb/d in July 2016. This peak is unlikely to be surpassed in the future. I do not include an estimate of unconventional oil produced in Venezuela as this data is difficult to find. In the chart below, I compare World C+C output to World conventional oil, which I define in this post as World C+C minus the sum of US tight oil and Canadian oil sands. The units for most charts (figures 11 and 12 are exceptions) will be kb/d on vertical axes. Data for oil output in all charts that follow will be the centered twelve month average output. Data is from the EIA’s International Energy Statistics.
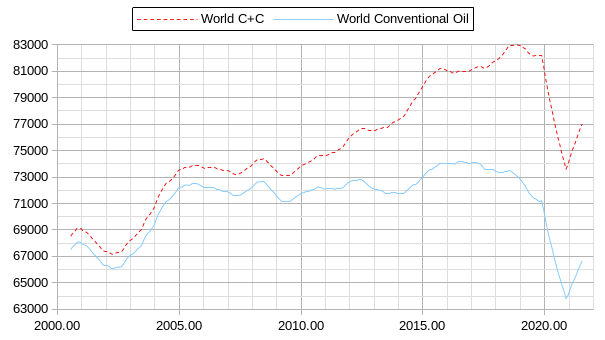
For comparison World Unconventional Oil output is shown in the chart below.
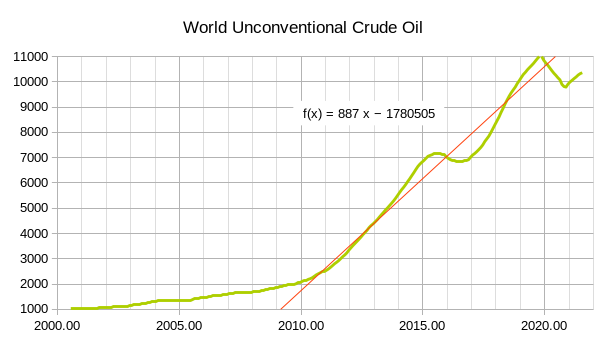
About 85% of the increase in World C+C output from 2010 to 2018 was from unconventional oil, the average annual rate of increase was about 887 kb/d from 2011 to 2019. Note that the annual rate of increase in World unconventional oil output over the 2017 to 2018 period was considerably higher at about 1649 kb/d.
The rest of this post will focus on World conventional oil output to attempt to find a likely decline rate for future unconventional World output, especially the period after the World unconventional CTMA peak in July 2016 up to July 2018 (where start of OPEC cuts in 2019 affects the CTMA after July 2018).
The chart below shows the overview of OPEC output and non-OPEC conventional oil output from Jan 2005 to Dec 2019
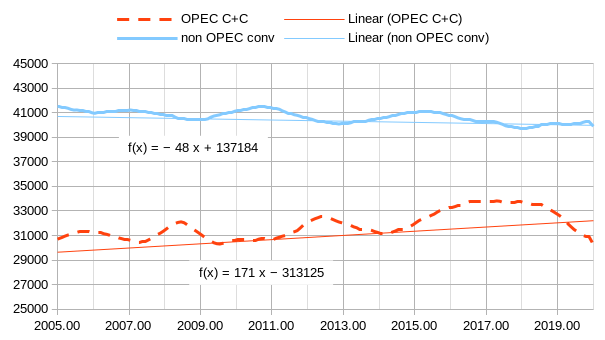
The general trend for non-OPEC conventional oil has been an annual decline rate of about 48 kb/d over this period and for OPEC output has increased at an annual rate of 171 kb/d over the same period.
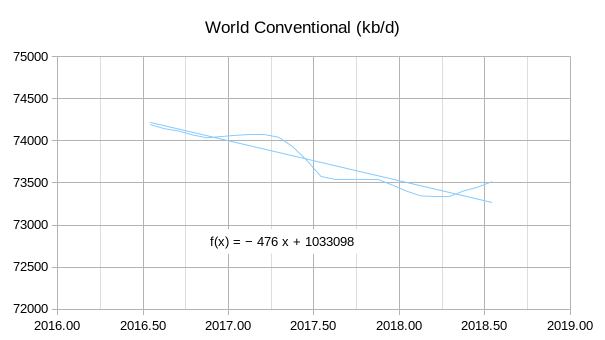
The chart below focuses on the shorter period from July 2016 to July 2018 for World Conventional output.
In the chart below note that much of this decline in output is from Venezuela, about 78% of the total.
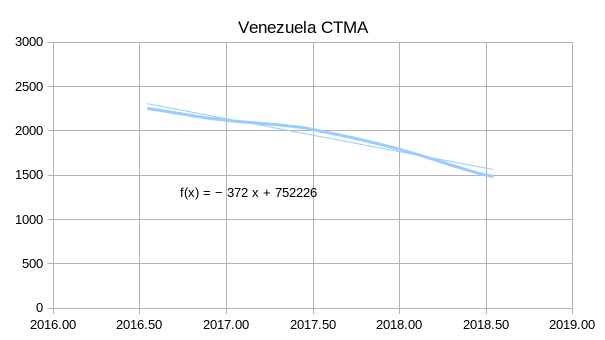
After July 2018 Venezuelan output has continued to decline reaching a low point for the CTMA of 458 kb/d in November 2020 and has since recovered to 595 kb/d by July 2021. My expectation is that Venezuelan oil output will stabilize around 700 kb/d and will cease to be a source of significant decline in World conventional oil output over the next 5 to 7 years. The chart below shows World conventional output minus Venezuelan oil output.
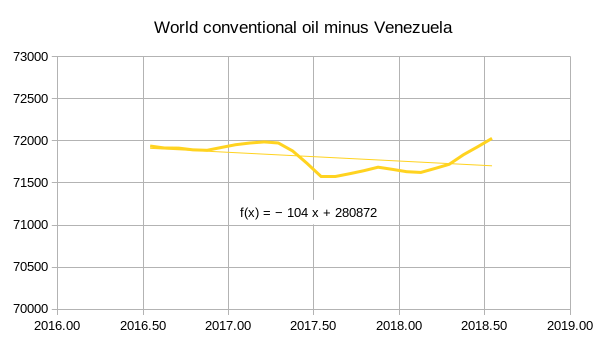
Output decreases at annual rate of 104 kb/d over the July 2016 to July 2018 period.
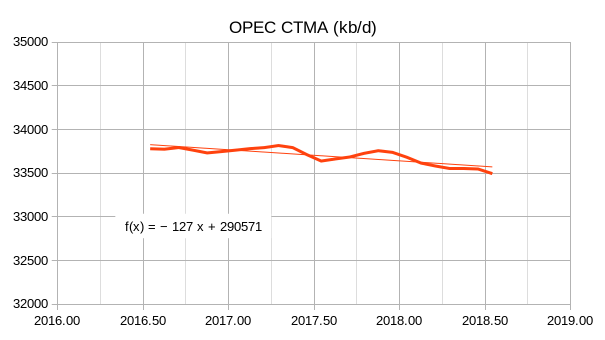
OPEC output decreases at an annual rate of 127 kb/d, but if we exclude Venezuela we get the following chart.
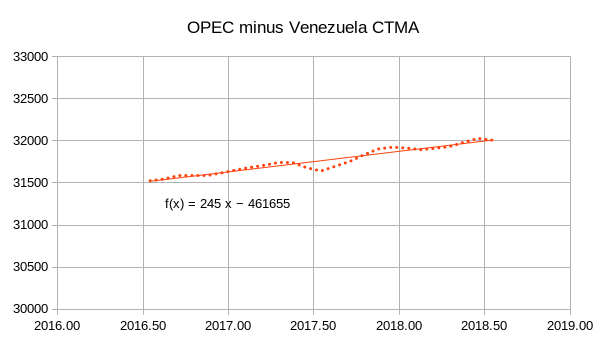
Without further future decline in Venezuela, we might see a rise in OPEC output as was the case from July 2016 to July 2018, especially while oil prices remain high.
Most of the Period from July 2016 to Dec 2017 was a period of low oil prices and may explain the steeper decline in non-OPEC conventional output in the period from July 2016 to July 2018, relative to the longer term trend (2005 to 2019 in figure 3 above). This steeper decline is shown below, an annual rate of 348 kb/d rather than the longer term trend of 48 kb/d.
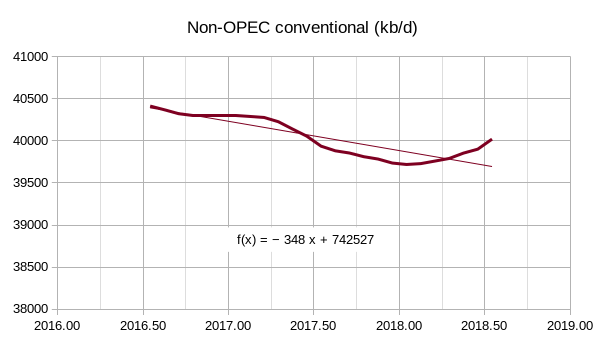
I expect that the high oil prices (over $90/b in 2021$) that are likely from now until 2030 may cause the annual decline rate to return to the 2005-2019 trend of 48 kb/d.
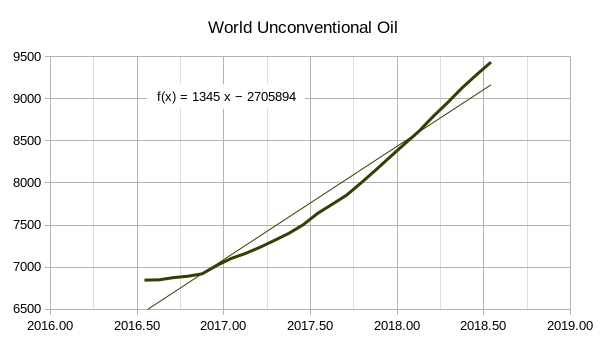
Chart in Figure 10 above shows the annual rate of increase in unconventional oil from July 2016 to July 2018, I expect future annual rates of increase will be significantly lower, on the order of 600 kb/d from 2022 to 2029.
It is unclear if conventional oil will continue to recover at the rapid pace we have seen over the past 18 months where the annual rate of increase in World unconventional output has been about 4384 kb/d, if that rate should continue, (doubtful due to Russian aggression in Ukraine and resulting sanctions) in 12 months World conventional output would reach 73324 kb/d, not far below the level when the World was at its previous peak in Nov 2018 (74132 kb/d and CTMA was 73051 kb/d). This is a highly unlikely result due to a permanent decline in Venezuelan output of roughly 1500 kb/d from July 2016 to December 2021, it is possible other OPEC producers might increase their output over the long term, but I doubt future World conventional output reaches a CTMA of 71500 kb/d or higher in the future.
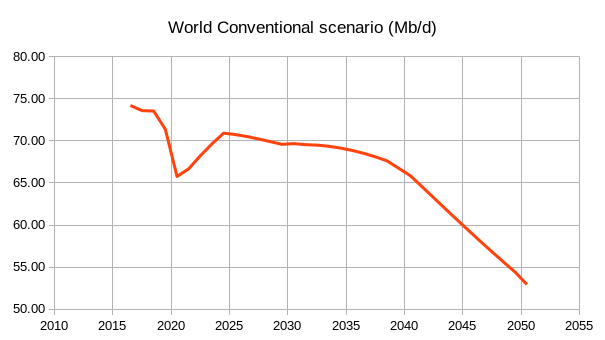
My scenarios for future World output assume conventional oil output recovers much more slowly as in chart below.
My expectation is the new peak will be due to an increase in unconventional oil, both tight oil and Canadian oil sands, with an increase from 10.5 Mb/d in 2021 to 15.4 Mb/d in 2029 as shown in the chart below.
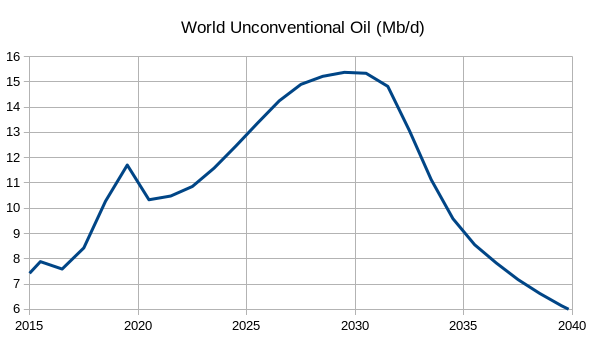
These two scenarios combine to give a scenario which peaks in 2030 at about 85 Mb/d.
218 responses to “Decline in World Conventional Oil Output and Peak Oil”
Dennis , thanks because unconventional is the” real thing” and it has been out of the picture for too long . Your effort and the work you put in is greatly appreciated .
Thanks hole in head. Note that tight oil and oil sands are the real thing. The notion that these cannot be used to produce gasoline, jet fuel, and diesel fuel is not correct. About 13% of the World’s crude plus condensate is unconventional oil as of Dec 2021 roughly 10500 kbpd of 80000 kbpd total. This increase in output of 9500 kbpd in unconventional output over the 2009 to 2019 took a lot of pressure off World oil markets, in fact it coused oversupply by the third quarter of 2018 and led to OPEC plus agreeing to cut output in 2019.
“The notion that these cannot be used to produce gasoline, jet fuel, and diesel fuel is not correct.”
Can anyone point me in the direction to quantify petroleum product output vs. API gravity? While *some* diesel fuel can be made from lighter liquids, surely we get less yield as gravity increases.
Who ever really claimed that tight oil wasn’t “real” in terms of hydrocarbons? The issue is general depletion of a finite resource. Tight oil will peak faster due to shorter plays and the more intensive drilling and/or tar sands mining needed. There’s also just a lot less of it vs. conventional supply history, regardless of ERoI factors.
Fracking saved us temporarily from the conventional oil plateau that preceded the 2008 recession, which people still naively blame on financial schemes alone. The curves in this article show no solid future for any type of oil. And “renewables” entirely depend on it, even if their landscape sprawl wasn’t a growing environmental problem.
HHH , As we see the Yen unravelling this comes in .
Hong Kong’s Hang Seng Index, where many Chinese companies are listed, plunged 3.7% on Monday and is down 31% year-over-year. At 19,869, the index has regressed to a level first seen in January 2007.
What will this do to the HKD peg ? Any additional info .
Hong Kong’s banking sector is the most over leveraged in the world. They are leveraged at 850%. Their real estate market is the most over leveraged in the world. They are pegged to the dollar. Rising interest rate in US are a major problem for Hong Kong.
A lot of dollar financing that flows into Hong Kong comes via Japanese banks. Any foreign outflows put extra stress on the Peg.
The trend for World C+C output CTMA from July 2000 to July 2019 is an average annual rate of increase of 795 kb/d as shown in chart below. As before the data is from EIA international Energy Statistics.
https://www.eia.gov/international/data/world/petroleum-and-other-liquids/monthly-petroleum-and-other-liquids-production?pd=5&p=00000000000000000000000000000000002&u=0&f=M&v=line&a=-&i=none&vo=value&vb=173&t=C&g=none&l=249–249&s=944006400000&e=1638316800000&ev=true
Hey ho , Steel ( Silver) away . For those who have read “The Lone Ranger ” comics .
Thanks Dennis, great data visualisation and interesting projection.
Just to clear things up for myself, can you please give a specific definition of conventional and non-conventional oil.
I was a bit confused, when you include and redacted Venezuela, is that from a conventional or non-conventional source, I am assuming Venezuela has both ?
A table of major producing countries and their respective source of conventional, non-conventional production or both might be handy here. I assume all OPEC+ is conventional?
Thank you Iron Mike,
Taking Venezuela out of the equation takes out mostly conventional oil and a bit of unconventional oil, in 2020 and 2021 OPEC estimates unconventional OPEC production at 100 to 110 kb/d (all of this is likely to be from Venezuela, but it is not stated explicitly in MOMR, see table 5-6 on page 44 of April MOMR).
So basically all of World non-conventional except 100 kb/d in 2020 and 110 kb/d in 2021 produced in the Orinoco belt of Venezuela is included in my estimate, non-conventional data for Venezuela for earlier years is difficult to find so for simplicity I just included the Venezuelan non-conventional (total for other years besides 2020 and 2021 is unknown) with the rest of the World’s conventional oil.
The short answer to your question comes from this line in the post:
…World conventional oil, which I define in this post as World C plus C minus the sum of US tight oil and Canadian oil sands.
I probably should have said that I define non-conventional oil as the sum of US tight oil output and Canadian Oil sands output, I apologize for not communicating clearly.
If I had a good estimate for Venezuelan unconventional oil output, I would include it.
Tight oil data comes from link below
https://www.eia.gov/energyexplained/oil-and-petroleum-products/data/US-tight-oil-production.xlsx
Canadian Oil sands data from link below ( sum Alberta upgraded and non-upgraded in HIST bpd tab)
https://www.cer-rec.gc.ca/en/data-analysis/energy-commodities/crude-oil-petroleum-products/statistics/estimated-production-canadian-crude-oil-equivalent.html
The chart below subtracts the OPEC estimate for Venezuelan conventional crude oil (using secondary sources data) from the EIA’s estimate for Venezuelan total crude plus condensate production to estimate Venezuelan unconventional crude plus condensate output. There is no way to know the ratio of unconventional crude to condensate in this estimate and thus I left it out of the analysis ( and thought it would tell us very little ). Even if we assume condensate output is zero, the amount of unconventional output seems to be fairly insignificant (even lower than the OPEC estimate, in 2020 it is 26 kb/d and in 2021 it is 38 kb/d, under the assumption that condensate output is zero. Chart below is the centered 12 month average for this estimate.
Great, thanks for the clarification. World C+C – (U.S tight oil + Canadian oil sands), seems like a very reasonable estimate of world conventional oil production to me.
I don’t think there will be further unconventional sources added to the mix from other parts of the world. The cost and technology is not there in my opinion, but that’s just my conjecture.
So if i am getting this correctly, you are asserting that world conventional c+c will not surpass the 2016 peak, but recover slowly through this decade. And the growth in overall world production of c+c will come from unconventional i.e. U.S and Canada.
Interesting and plausible assertion. I think two obvious obstacles that might stop your projection is bank funding and government policy towards fossil fuels (in Canada and U.S).
How high do you think (U.S tight oil + Canadian oil sands) production will go and peak?
Why don’t you think OPEC+ can surpass 2016 peaks ?
Iron Mike,
Note that the 2016 peak in the post is OPEC, not OPEC plus. Part of the problem is Venezuela which produced about 2255 kb/d at the 2016 peak, about 1500 kb/d more than its December 2021 monthly level, in addition other OPEC nations such as Algeria, Angola, Congo, Eq Guinea, and Gabon will continue to decline at about 100 kb/d per year. It is conceivable that OPEC returns to the 2016 peak, but there will be many nations in the World with declining conventional output which may offset any increases in output by the big 5 OPEC producers (Iran, Iraq, Kuwait, Saudi Arabia, and UAE.) Remember also that as Hickory points out below, that Russian output is also unlikely to recover to its previous peak which is another reaon that World unconventional output is likely to reach its 2016 peak in the future. Also keep in mind that US and Canadian conventional oil has been declining for many years, this is likely to continue. All of this is of course a guess by me, and my guesses about the future are very likely incorrect.
I use the Canadian Energy Future “Current Policies” scenario to estimate future Canadian oil sands output and my own tight oil analysis to estimate future tight oil. Note that my tight oil analysis looks at the economics of individual tight oil wells and only has a number of well completions that can be financed from operating cash flow after paying dividends and servicing existing debt. In short, no external financing is needed for the tight oil scenario, if oil prices remain above $75/bo in 2021$ through 2035 before dropping due to lack of oil demand.
Your general observation that my scenario may not be correct, both for the reasons you suggest and many others (wars, depressions, and things I have not considered) I agree with 100%.
Chart below gives , tight oil and oil sands scenarios and figures for unconventional oil output.
data in spread sheet at link below
https://peakoilbarrel.com/wp-content/uploads/2022/04/oil-shock-scenario.ods
Your posts state that you expect oil demand to fall faster than supply. I’m under the impression that peak (supply) oil was the main issue. Do you really believe we can replace that demand with renewables? Or are you thinking steady decline of our economy that kills the demand?
Would love to read any resources on the peak demand idea if you have em handy.
Tom,
I am focusing on crude plus condensate and it is not necessarily renewable energy, but the transition to battery electric vehicles and plugin hybrids that will reduce demand for oil. Note that my scenarios suggest that it is not so much a matter of peak demand, when output reaches a peak in 2030, it will be supply at a market clearing price that will be the limiting factor and oil prices are likely to be quite high, perhaps $150/bo in 2021 US$ or higher when that peak in the centered twelve month average occurs.
In the years between 2030 and 2035 oil prices may continue higher or might stabilize as the market will not believe that peak oil has actually been reached until 5 years or more after the peak. I expect the transition to electrically powered vehicles will cause demand to start falling faster than supply is falling, I have a range of scenarios with faster and slower transition to plugin vehicles with demand falling below supply between 2033 and 2037 with a best guess of 2035. Chart below has dashed line as supply with no transition to EVs with low high and average demand scenarios (depending on assumptions about the speed of the transition.
World Conventional Oil in chart below, with data.
People should really keep in mind that extrapolations that rely on eliminating a swing producer are extremely speculative. If US LTO had not stepped up, prices would have risen higher and stayed higher longer. That would have had a lot of impacts, and it’s likely that other supplies would have risen, including LTO in other countries and bitumen/tar sands, and that consumers would have switched more quickly to substitutes like more efficient ICEs, hybrids, EVs, telecommuting, carpooling, mass transit, local electric delivery, online shopping, etc., etc.
It’s like saying: what would the last election have looked like without a key state, like California or Texas? Well, a lot of things would have changed, long before the election, and we’d be in a very different world.
You can’t just pull out a key element, and do simple extrapolations…
Nick,
That is true, note that in my analysis I mostly eliminated a single producer to see what the output of the rest of the producers looked like. It is certainly true that without that output things would have been different, it is impossible to know what it would have been. Note that Venezuela was a major producer in 2014 and earlier with output around 2500 kb/d for many years, today it has fallen to 700 kb/d, a much less significant producer. As far as conventional vs unconventional, this is simply a useful division in my mind to see what output has looked like and the trends of each. Trends always change over time. Note also that the shock model uses past discoveries, past production, resource development rates in the past, and historical extraction rates. The model assumes discoveries in the future are constrained by geology (using USGS estimates) and economics (where eventually oil prices will fall in 2035+/-5 due to demand for oil falling faster than supply of oil) and that future development of resources and extraction rates are similar to the recent past. Past trends of output are not a part of the analysis.
An alternative view of unconventional oil
A picture is worth a thousand words!
Oil sands should be stacked at the bottom for clarity.
A transition to EVs (will require a new mining industry) can only happen when the economy is OK. But the economy is not OK since the oil price shock of 2008 which caused the financial crisis. The response was QE1 – QE3 which financed the shale oil boom, but also created a gigantic asset bubble which can pop any time.
Ukraine war will change everything as Russia is among the 3 big oil producers.
A transition to EVs (will require a new mining industry) can only happen when the economy is OK.
Investment in tractors increased sharply during the Great Depression. Farms were under much more financial pressure, and so in order to survive they spent more on the new high tech, rather than less.
By 1928 the first General Purpose Tractor was introduced, which allowed for planting and cultivating three rows at a time, Maybe that’s why investment in tractors increased so sharply. Maybe cuz they were newly available.
FWIW- 1930’s American farmer investment in general purpose tractors is a poor model for predicting global EV adoption rates.
Survivalist,
Tractors and combines substantially increased farm production and labor productivity, starting roughly in WWI.
“All during the war, Food Administrator Herbert Hoover exhorted farmers in this country to increase production. As the prices realized for their products rose, farmers began to borrow money to buy more acres and new machinery, especially farm tractors since labor costs were sky high.”
https://www.farmcollector.com/farm-life/u-s-farmers-during-great-depression/
1930’s American farmer investment in general purpose tractors is a poor model for predicting global EV adoption rates.
Why do you think so? Remember that the term EV’s applies to all classes of vehicles: light passenger vehicles, buses, trucks, trains, boats, etc. Think “electrification of transportation”. Of course, light vehicles account for almost half of all oil consumption, but Peak Oil concerns seem to generally focus more on commercial/industrial applications, where classic $-ROI will drive investment.
Although, really I don’t know why very high oil prices wouldn’t have the same impact on light ICEs. We can see that demand for hybrid-electric and plug-in vehicles is rising very quickly.
Remember that farmers were in desperate straits, and credit was very tight during the 30’s what with rural banks going bust, but farmers still increased their investment on new equipment.
“1930’s American farmer investment in general purpose tractors is a poor model for predicting global EV adoption rates”. – Survivalist
Why do you think so? – Nick
Because people today buying EVs aren’t 1930’s American farmers and EVs aren’t tractors. Duh! Why do you think it is a good proxy? Are tractors to farmers the same as cars to non farmers?
And just to clarify, you’re talking about American farmers and American EV buyers. You’re not making a global analysis of humanity and its future trends.
Will African & Asian consumers adopt EVs at a similar rate to American farmers adopting tractors in the 30’s? If so, Why? On what basis? Inquiring minds want to know. Lol
Maybe this is Nicks way of saying he forecasts EVs will be adopted rapidly and thoroughly, but has run out of reasons to say why that’s the case… so he pulls 1930’s farmers out of his ass, cuz a 1930’s farmer buying a tractor is just like a 2022 soccer mom driving around looking at show homes. Tomayto tomahto.
As it turns out, in reality, the adoption rate of tractors in USA in 1920’s and 30’s was pretty low as farmers feared bankruptcy.
The Diffusion of Tractor Technology
https://www.jstor.org/stable/3874881
A Note on the Real Cost of Tractors in the 1920s and 1930s
https://www.jstor.org/stable/3742205
Maybe Nick just makes shit up?
Survivalist,
My argument is in reply to this comment: “A transition to EVs (will require a new mining industry) can only happen when the economy is OK.”
My reply is that a transition can happen when an economy is not ok. And such an argument is helped by a counter example, of such a transition during such a time. Horses to tractors is such a transition, and the Depression is such a time.
Here’s one discussion:
The Depression did have an effect. During the early 30s, sales of farm machinery dropped dramatically. In 1930, there were about 200,000 tractors produced. By 1932, only 19,000 tractors sold. Some manufacturers went out of business or were sold to other companies, but those that remained continued to invent new machines or better parts. By 1935, over 160,000 tractors were being produced again. In some cases, farmers got their first government checks and bought machinery.
At every step in the process of growing crops, new machines were being developed during the 1930s.
Plows: For the first time in the 30s, plows were mounted directly to the tractor so they could be lifted out at the end of a row.
Planters: Grain drills and corn planters got better at distributing seeds accurately and quickly.
Mechanical cultivators: When the tricycle tractor was invented, it allowed allowed farmers to drive cultivators through closely spaced rows.
Harvesters: In 1935, the first wheat combine that could be operated by just one man was invented. The corn and soybean harvesters were not far behind.
https://livinghistoryfarm.org/farminginthe30s/machines_01.html
Another:
“Hanging On
Despite some of the worst times in history, farmers hung on with everything they had. They fought to stay on the land and to make a living. And what’s even more remarkable is that they fought to find the money to invest in some of the most revolutionary new agricultural technologies to come along.
Bigger and better tractors with new rubber wheels.
Combines that ended the era of threshing…”
https://livinghistoryfarm.org/farminginthe30s/farminginthe1930s.html
Here’s a nice chart showing numbers on the farm of horses vs tractors. We see a fairly uniform transition interrupted briefly by the Depression:
https://livinghistoryfarm.org/farminginthe40s/machines_13.html
This briefly says “The Great Depression brought further deleveraging in the U.S. agriculture sector as another collapse in farm profits during the 1930s slashed farm investments and triggered another wave of farm bankruptcies.”
https://www.kansascityfed.org/documents/1378/2013-Farm Investment and Leverage Cycles: Will This Time Be Different?.pdf
The two articles you provided seem to explain the sharp rise in sales in 1934, still well in the middle of the Depression. The first argues that tractor sales rose after tractor implements became more useful.
https://www.jstor.org/stable/3874881
This article argues that tractor sales rose after tractor prices dropped in the period 1923-1934.
https://www.jstor.org/stable/3742205
To summarize: farm investment in tractors dropped at the beginning of the Depression, but rose sharply in the middle as tractors became more and more attractive.
Depending on how long the Russian invasion and ‘western’ world displeasure/sanctions last,
Russian oil output might undergo a big decline. A decline that will be hard to recover from.
They have very limited ability to redirect oil output from established customers.
The pipeline capacity to elsewhere (the east) is already full, and is less than 20% of export volume.
Shipping will be unable/unavailable to take up much slack.
If wells get shut down for lack of off-flow capacity, many of the marginal ones (Russia has lots of these I have read) may never get restarted.
Its a new race to the bottom, as war generally is.
The oil charts will look different as a result.
So will the balance sheets.
So will the maps.
“While all EU states have taken steps to cut imports of Russian fossil fuels, there has been little impact on Moscow’s earnings from crude exports so far, as Asian countries continue to buy up cheap Russian crude that European buyers don’t want.
According to a Bloomberg analysis, crude oil exports from Russian ports have risen sharply in recent weeks, with the Kremlin’s revenue from crude oil export duty surging by 25 percent for the week ending April 22.”
https://www.bloomberg.com/news/articles/2022-04-25/russia-oil-flows-jump-to-four-million-barrels-a-day-as-asia-buys?sref=By7uNNel
Note Hungary Austria Bulgaria, Czech Republic, Slovakia have not signed onto any embargo. All EU votes to date have been non-binding. That list of countries adds to 945K barrels/day consumption. All embargo talk out of Germany has been of a stretched phase out schedule depending on solar to fuel trucks, one supposes. Germany consumption 2.2 million bpd. Numbers pre Covid.
Watcher , Eu is a bunch of morons .
https://www.theepochtimes.com/european-union-to-cut-russian-oil-and-gas-imports-to-zero-by-2027_4427794.html?welcomeuser=1
The Epoch Times is a far right mostly fake news outfit.
Check them out on wiki pedia.
However,
if the invasion is not quickly called off and the sanctions are upheld for a long period,
it will bite into Russian oil production simply for lack of materials, capital, and technical/human resource from external sources- such as Halliburton, Schl.., Baker-Hughes.
To what extent?- time will tell.
Won‘t happen, I think. The complete territory of the Donbass Republics will come under Russian control and Russia will maintain the land bridge to Crimea. The Asov Sea from now on is a Russian sea and will stay so, everything else are pies in the sky. Europe and the US better get along with that, because a long war of attrition will only be won by Russia – at a higher cost for all. Yes, everything could have been arranged in a much nicer context and this war is terrible for Europe. Bit things are how they are and not the way we wish they were.
I have suspected from the start that Russia will be able to take the east and as much of the south coast as they are motivated to take, including Odessa.
But it will be a very costly victory. They are now hatred in Ukraine and all of their neighbors to the west will be indefinitely on guard against them.
The economic pain for them is just starting and is not going to fade anytime soon.
Putin would have been wise to just keep earning oil and gas dollars for the decade without earning a mountain range full of hate, mistrust and hard economic push back.
He has motivated Europe back to a military preparedness stance, and to much more rapidly pursue a path of alternatives to Russian energy.
Foolish or delusional move he has made.
He has motivated Europe…to much more rapidly pursue a path of alternatives to Russian energy.
I agree. That’s a significant silver lining.
Vulnerability to cutoff supplies is a basic problem with fossil fuel, and this is a little bit like OFM’s brick upside the head.
Maybe Hickory. I see Europe going down much faster than Russia. The old continent doesn‘t have resources and they will be bankrupt within months. And then they will adapt the oldfashioned way: by collapse. Russia will be hurt, but they will always have energy and food. And China has already replaced Europe‘s factories and badly needs russian gas and oil. In short: WTF is Europe?
Could have been a cooperative world. Didn‘t happen.
There’ll always be takers of Russian oil, by sleight-of-hand or otherwise. What’s important is that it is consumed before the New World’s is. Someone’s got to be the last-man-standing – I prefer it to be US.
Iran, for instance, will in the long term benefit from their economic sanctions – they’ve still got their oil that will in later years be worth much more than the $20/bbl that the North Sea was depleted at. Iran will enjoy being the de-facto power of the Middle-East once the Saudi’s oil is all gone. Assuming there’s no invasion and occupation, of course.
Unofficial . Russia has cut off gas to Poland for not paying in Roubles . Friday was the date of settlement . As of today their storage is 75% full .
https://www.onet.pl/informacje/onetwiadomosci/onet-nieoficjalnie-rosja-wstrzymala-dostawy-gazu-do-polski-co-dalej/sf4jdzj,79cfc278
Translate using Google .
Hole,
It’s official already. Russia has cut off gas to Poland, Lithuania and Bulgaria. So far.
We did not in Poland extend the contract for 2023 anyway, so it does not impress us. Gas for next winter is contracted from Norway, the US and Qatar. But of course gas prices are going up.
Denis, how would the main graph look like if we consider deepsea also as unconventional? Would the blue line take another significant hit?
West texas fanclub,
Unknown, I do not consider deep water offshore or Arctic oil to be unconventional oil, I think in terms of continuous and conventional reservoirs, following USGS methodology.
The outages hit much of the Bakken oil patch, causing the phone of North Dakota Pipeline Authority Director Justin Kringstad to ring off the hook Monday as energy companies called in to report on how the storm had impacted their operations.
Kringstad estimated that the state’s daily oil output fell by as much as 60% relative to the start of April, due to a loss of electricity across the region and snowy roads making it impossible for trucks to reach energy infrastructure. North Dakota recently had been producing 1.1 million barrels of oil per day, a figure that he believed had already fallen 25% a week and a half earlier when another blizzard hit the state.
https://bismarcktribune.com/news/state-and-regional/blizzard-damage-unprecedented-montana-dakota-utilities-says-thousands-remain-without-power/article_12c58514-c49a-11ec-94f7-5f6103a0b6c9.html
Oil production: Nigeria leads Q1 shortfall, World Bank cites sabotage
The World Bank has said Nigeria has the largest shortfall among oil-producing countries due to sabotage within the oil production system and other factors, such as low investments and the COVID-19 pandemic.
SNIP
“At present, the largest shortfalls are in Nigeria (0.5 mb/d) and Angola and Russia (each 0.3 mb/d). Production has been affected by a variety of temporary factors including maintenance (Kazakhstan and Libya), protests (Kazakhstan), sabotage (Nigeria), and bad weather (Iraq, Libya).
It’s just one damn thing after another. When are these bad things going to stop happening in the oil patch? 😫
Lack of food in the Middle East later on this year has potential to be severe enough that social disorder disrupts oil flow.
HHH, in comparision, the previous color revolutions will look like a big love parade.
Dennis, your two last charts, conventional and unconventional oil production, leaves me speechless. You have conventional oil increasing by about 4 million barrels per day by 2024. Do you really believe that? I mean seriously???
Ron,
Yes I am serious. December 2021 World conventional output was 68940 kb/d as I have defined it in my post.
To reiterate I define conventional output as World C plus C minus the sum of US tight oil output and Canadian oil sands output. My future scenario has World conventional average output in 2024 at 70635 kb/d, about 1695 kb/d higher than the most recent data point (December 2021). Over the December 2020 to December 2021 period, World conventional output has increased by 3800 kb/d, over the next 30 months I am expecting an annual rate of increase of about 678 kb/d for World conventional output (1690/30*12). Chart below has monthly data for World conventional oil up to Dec 2021 and my scenario (annual data) from 2022 to 2030).
December 2021 World conventional output was 68940 kb/d as I have defined it in my post.
No Dennis, that number was not defined anywhere in your post. And your chart does not show that. I tried to line up December 2021 on your chart and I get about 66500 kb/d. And your 2024 point on the chart is at least 4 million bp/d above that point. That is what I was referring to. Your data in your comment above puts the increase at 1,695 kb/d. Your chart shows an increase of about 4,000 kb/d.
Your data of an increase of 1.7 million bp/d may be close but you just got overly ambitious when plotting your data. 🤣 However I would bet that March 2022 conventional oil data will not be surpassed. And it definitely has no chance of surpassing the 2018-2019 production data.
Ron I meant conventional output as I defined it in my post. I plotted average annual data, the annual average for 2021 is 66600 kb/d for World conventional oil output. We do not know what March conventional oil output is at present, we only have data through Dec 2021. We also do not know what future output will be, Russian output will decrease, high oil prices may lead to increased output elsewhere as new resources are developed. It is also possible we will see a change in where Russian oil flows over time. The oil which was exported to Europe may simply be diverted to China, India, and elsewhere (Africa and South America perhaps). The supply that is displaced with Russian oil may flow to Europe, all impossible to know in advance.
Did you mean March 2020, rather than March 2022? I agree that is not likely to be surpassed. My expectation for the annual average output is a maximum of 70.6 after 2019, the peak was 2016 at about 73.5 Mb/d for conventional oil. I agree the 2018 level (72.7 Mb/d) will also not be reached in the future for conventional oil, but unconventional oil may rise to 15.4 Mb/d about 5 Mb/d above the average 2018 level. At that point (2029) I expect conventional output will be about 70 Mb/d with a peak in World oil output at 85 Mb/d in 2029 or 2030.
Dennis, I know we do not have March 2022 data yet, I was just assuming it will be the high for the year. April will almost certainly be down from March and it will be all downhill from there for the rest of the year. So no, I meant March 2022, not 2020.
About Russian oil. All three of the big oil service companies as well as Shell, ExxonMobil, and BP have pulled out of Russia. And you don’t think that will affect their production? It simply doesn’t matter if they do find new routes to export oil, their production is going to suffer drastically when their equipment starts to deteriorate. Their new drilling of infill wells will drop dramatically also.
Prediction: Over the next 24 months Russian oil production will drop much faster than US production will increase. Wanna bet?
Ron,
No I have no insight about future Russian oil production, so not a bet I would make.
Oh my goodness Dennis. For a person with such an insight on world oil production, why would you have such a blind spot on Russian oil production? Is not Russian oil production part of world oil production? That looks like a little selective blindness to me.
Ron,
Difficult to predict how the politics will play out, the situation is highly complex from my perspective, even moreso than usual. I focus more on US tight oil output. I agree that Russian output will drop, whether is drops by more than the increase in US output, I cannot say. US output will likely only rise by 1000 to 1200 kb/d over the next 24 months, so I would agree Russian output is likely to drop by more than that at least in the short term, whether it rebounds after the war with Ukraine and how long that conflict lasts is difficult to predict.
According to analysts observing the intensity of light from Russian oil flares and taking into account other informations, Russian production fell from 11.1 Mb/d in February to 9.76 Mb/d in April (or 12% of decrease). They also mention the fact that production stabilized during the month of April. I suspect that the Russian oil companies used the Western sanctions as a pretext to decommission oil wells whose extraction had become unprofitable, especially in the Western Urals, knowing that it was in the air a few months ago. https://www.bloomberg.com/opinion/articles/2022-04-21/war-in-ukraine-the-second-wave-of-russia-s-oil-shock-is-starting?fbclid=IwAR1WNI-B9RwBnOniZodh81KtDp-VBGiwOHvGQbX3T8pel4akpI3cUwxxv7g
Russia was already in peak oil mode even before the Ukraine war started
28 Feb 2022
Russian oil production update Nov 2021
https://crudeoilpeak.info/russian-oil-production-update-nov-2021
Baker Institute for public policy
REROUTE, REDUCE, OR REPLACE?
HOW THE OIL MARKET MIGHT COPE WITH
A LOSS OF RUSSIAN EXPORTS AFTER THE
INVASION OF UKRAINE
Mar 2022
https://www.bakerinstitute.org/media/files/files/3bf292f2/ces-pub-russian-oil-040822.pdf
Dennis,
What do you mean by this ?
Remember also that as Hickory points out below, that Russian output is also unlikely to recover to its previous peak which is another reaon that World unconventional output is likely to reach its 2016 peak in the future
Did you meant to say conventional is unlikely to reach 2016 peaks ?
I added a couple of simple plots from the dataset you link, just for visualisation of already known facts.
First one is conventional vs unconventional as a % share of world production over the past 22 years.
The reason for conventional decline i believe is a geological one, not an oil price phenomena.
Some of the conventional oil output decline in the last 10 years has been due to the human factors-
Covid drop in demand with opec voluntary decrease output,
Libyan internal chaos,
Iranian imperialism and the ‘western’ pushback.
Agree, it could be a myriad of reasons including the ones you mentioned.
I just think the biggest factor is geological. I may very well be wrong.
Iron Mike,
Yes I do not think conventional oil output will return to the previous peak reached in July 2016 (for centered 12 month average output). I meant to say conventional and mistakenly said “Unconventional”.
I think conventional output has declined both due to geology and oil prices, but mostly geology. If you look at the centered 12 month average decrease in non-OPEC conventional oil output you will note the slope changes from positive to negative several times over a 15 year period. The changes in slope are due to changes in medium term oil prices in my view, but the overall long term decrease I believe is due primarily to geological and technological factors.
For OPEC conventional output, they very much respond to oil price as they often adjust output to affect the price of oil, that is why I focused on non-OPEC conventional which also responds to oil prices by changing their resource development plans in response to prices, thought there is a significant lag especially for new projects as lead time from FID to first output is typically 5 years or more for many large conventional projects.
Chart below is non-OPEC conventional C plus C output in kb/d, with OLS trendline from Jan 2005 to Dec 2019, data is CTMA.
Thanks Dennis, interesting analysis. Very reasonable forecasts there, unfortunately as you already acknowledged we don’t live in a reasonable world, and highly non-linear factors and unforeseen events will inevitably interfere with forecasts.
What do you have URR at 3200Gb? Do you also have an estimate of how much we have already produced out of the estimated URR?
Iron Mike,
Thanks. I agree completely that we do not live in a reasonable world, nor one where many use reason.
URR for conventional is about 2800 Gb and for unconventional about 200 Gb (75 Gb for tight oil and 125 Gb for oil sands), total World crude plus condensate URR is 3000 Gb. Up to December 2021 cumulative production of C plus C (starting in 1870) is about 1435 Gb. For the scenario I have presented cumulative production of C plus C is 2225 Gb in 2050, 2778 Gb in 2100, and 2977 Gb in 2200. In 2029 at the peak, cumulative output is 1681 Gb.
Interesting so around the peak in your model we would have exhausted just over 50% of URR.
I guess the ‘low hanging fruit’ so to say would have been all gone by then.
This one is of Dennis’s model of conventional and unconventional oil production projected into the future.
According to this, he sees a sharp drop off of unconventional oil production after 2030 and a steady decline in conventional around the same time.
Dennis I think based on first figure of % between conventional vs unconventional oil, I am not sure from a statistical point of view that downtrend could be consolidating or bottoming out. There is a possibility that downtrend will continue regardless of oil prices. I will make a simple forecast based on that thinking during the week if i get time to see how it would look.
Iron Mike,
An alternative stacked view.
Note I have updated the scenario a bit based on a comment by Ron.
https://peakoilbarrel.com/wp-content/uploads/2022/04/oil-shock-scenario2.xlsx
Note that output falls more steeply after 2035 due to a transition to electric power for land transport which reduces demand below supply and causes oil prices to drop, this leads to slower developmant of all oil resources (and likely an an end to most new development of unconventional and ultra deepwater offshore and Arctic resource development, only the cheapest oil resources will remain profitable (Onshore Russia and Middle east perhaps).
The assumptions behind this scenario may be wrong for many reasons and there are many assumptions, all of which are likely to be incorrect.
Yes much better visualisation.
So you think a decade will be suffice to reduce oil demand as electrification takes over. Interesting. You may very well be right. I honestly don’t know.
Regardless of electrification though, don’t you think geological factors will bite hard around or by 2035 ? I mean the oil energy cliff in your forecast seems to be around that year.
Also the conventional peak of 2016 is beaten in that particular projection.
Iron Mike,
In my chart the top is conventional plus unconventional, they are added, your chart puts the unconventional on top of the conventional. I will put another chart below in a new comment to clarify.
The conventional output peak remains 2016, but there is a new peak for total C plus C above the previous 2018 peak. In my scenario I assume extraction rates stop increasing after 2038 and time from discovery to first production decreases from 39 years on average (1918-2026) to a gradually decreasing level of 21 years from 2029 to 2039 and then increase to the historical level of 39 years from 2042 to 2050 (these two parameters apply only to conventional oil (tight oil is modelled separately and I use the Canadian Energy Futures current policies scenario for oil sands). After 2050 I assume resource development slows over time reaching 339 years by 2100. Discoveries (including reserve growth) are modelled separately as well and are an input into the oil shock model (a 2800 Gb model is used, see chart below). From discovery to production the discovered resources go through a fallow, build, and maturation stage until they reach the producing reserve stage where they are extracted at some annual rate e. Current extraction rate (2021 average) is 5.125% and producing conventional reserves at the end of 2021 were 476 Gb.
The model has steeper decline in conventional resources after 2040 due to the assumptions I have made as well as underlying geological resource constraints. The overall C plus C curve steepens in 2032 or so due to the steep drop in tight oil resources after 2031 which is also due to geological resource and technological constraints. So the short answer is yes, geological constraints will be a big factor by 2035, especially with the assumptions I have made. A different set of assumptions (say $300/b oil prices or some technological breakthrough I have not foreseen) could lead to plenty of oil supply even without an EV transition (or a Transportation as a Service transition). Click on chart for larger view.
Iron Mike , all of projections made by Mr Coyne are inaccurate . So here goes :
1. Conventional oil peak 2016
2. C+C peak 2018
4 . US peak 2019
This will not change and I don’t care what Dennis , Mckinsey or a Tom , Dick and Harry says .
Why ?
1. All reserves reported by OPEC ( main source of conventional ) are bullshit crap . Only some one with an IQ=0 believes those figures .
2. Conventional oil cannot/ will not grow because there have been very few ECONOMICAL discoveries onshore in the last 10 years .
3 . It takes 10 years from discovery to pumping and 8 years from FID( First Investment Decision ) . None were made .
4. Dennis does not make any space for decline rates and how / what will replace this . Sorry Dennis LTO is not a replacement .
5. He makes no space for geo political shifts . As total energy flows decline conflicts will increase . Libya , Sudan, Nigeria will be the new normal .
6. He makes no space for a financial meltdown which is a WIP ( Work In Progress) ‘ OPM is already declined .
7. He makes no space for a ” Black Swan ” . How about an unintended Houthi drone hitting Ran Tura ? How about events get so bad ( whatsoever the reason , Shia vs Sunni , JCPOA fails etc) and the Strait of Hormuz is shut off .?
All his estimates are ” if ” and ” but ” and nothing imperfect happens . His talk about EV’s has been shattered by Matt Mushalik’s post . Sorry Mike , we don’t live in a perfect world . S*** happens .
You can come to your own conclusions . The unravelling has began .
Last something about Mckinsey and the ” Big Three ” . My son and daughter in law are in the top posts at E&Y . He tells me that most of the companies they provide consultancy are in such awe of their reputation that they never question what they write about . They make reports ( I have seen many ) with ” if ” and ” but ” caveats etc that they cannot be held accountable . Anyway he says 95% of the reports provided to the customers are in file 13 ( wastepaper basket ) . This is from the horses mouth . Take care and be well .
Hi HiH,
Dennis acknowledges we live in a highly erratic world, and is just making simple statistical models based on the information at hand.
From what I’ve read, he also acknowledges and is fully aware that any model he/x/y or z makes about the future, is most likely incorrect.
Regardless, i think these models come in handy, if not for anything else purely from a mathematical forecast point of view.
That said, i totally agree with most of the points you’ve written there.
It is always healthy to have a spectrum of opinions/analysis’s and not live in an echo chamber. And we should give respect to this broad spectrum from the optimist to the pessimist. Whether the truth lies somewhere in between remains to be seen.
I am more on the pessimistic side, that’s my bias/conditioning, i tend to see the worse in humans, if history is any guide i see that as a fact or in other words as part of our genes or nature. Extrapolating that in the context of energy, we will do whatever it takes to maintain our standard of living, even if it means destroying half the world. We are figuratively the snake eating its own tail.
Mike . A pessimist is an optimist armed with the facts . 🙂
Iron Mike and Hole in head,
Despite what many think, I am also a pessimist and most of my past scenarios have proven incorrect on the low side. See for example
https://oilpeakclimate.blogspot.com/2012/07/an-early-scenario-for-world-crude-oil.html
where at the time (July 2012) I said:
The high scenario attempts to ramp extraction rates to 1973 levels over a 30 year time frame, this seems quite unrealistic when considering that Saudi Arabia and other middle east OPEC members were aggressively ramping up production from 1960 to 1973 at the some of largest oil fields discovered to date.
I doubt that such world wide extraction rates will be seen in the future, but included it to illustrate that even if it were accomplished the peak would only move by a few years (to 2021 from 2019 in the medium scenario). Even the medium scenario is somewhat unrealistic as it ramps to 1990 extraction rates over just a 5 year period, the reality is likely to fall between the plateau and medium scenarios.
The chart is updated with recent EIA data (the only change from the original models) below. At the time, Hubbert linearization resulted in a URR around 2600 Gb (this method does not give reliable results in my view). Currently Hubbert Linearization suggests a URR of about 2800 Gb using 1993-2019 data. Generally over the 1998 to 2019 period Hubbert linearization has tended to underestimate World C plus C URR.
Currently my estimate of World URR is 3000 Gb, with 1408 Gb of crude plus condensate extracted up to the end of 2020. This suggests at that point about 1600 Gb of resources remained to be extracted. According to BP there are 1300 Gb of oil reserves and note that there are no doubt contingent resources, possible reserves and reserve growth that might be added to these totals. Also note that my scenarios extend to 2300, if we assume all oil extraction stops by 2100, my scenario for the World Shock model have cumulative output of 2780 Gb by 2100.
There are many who would consider my scenario unrealistically pessimistic, most would also agree that black swan events by their nature cannot be predicted in advance. Future major economic recessions, major wars, pandemics, asteroid strikes, alien invasions, etc will tend to alter future projections.
Every scenario of the future is incorrect except one, there is an infinite set of possible futures so the odds of choosing the correct scenario is infinitely small, essentially zero.
For information on possible resources see following by Jean Laherrere from August 2018, nice table summary at end of report, he estimates World URR of about 2700 Gb.
https://aspofrance.org/2018/08/31/extrapolation-of-oil-past-production-to-forecast-future-production-in-barrels/
Hole in head,
All forecasts are inaccurate, I agree. Every forecast makes assumptions about the future, they are never correct. I will note that you also have ifs and buts in your forecasts, read your comment lots of “How abouts” as far as I can tell, just another form of if and but. My guess is that we have muddled through in the past and will continue to do so in the future, the exact path is unknown by all.
I say this again and again, maybe you haven’t been paying attention.
Dennis . ” My guess is that we have muddled through in the past and will continue to do so in the future, the exact path is unknown by all. ”
Exactly where we differ . You presume the past will /can be the future . I don’t . I have repeatedly said ” yesterday is not tomorrow ” . You are not paying attention . There are tipping points or what is called ” crossing the Rubicon ” . We are in ” phase change ” . There is no going back , just like a girl becomes a woman when she reaches puberty . Peak oil ( energy) is phase change and that is why you have no answers to my bullet points on why conventional oil has peaked and further growth in LTO is impossible . I have seen your response to Iron Mike and you start with ” presume ” , I don’t presume , I just state the reality on the ground . Of course there are ” black swan ” events that can change the outcome , but then that is why they are called “black swan” .
Hole in head,
You assert that we have crossed the Rubicon etc. I am not convinced by assertions.
I use peer reviewed papers to estimate reserves, see for example
https://royalsocietypublishing.org/doi/10.1098/rsta.2013.0179
See section 3b where they say:
Globally, BP [13] estimates 1263 Gb of conventional proved reserves in 2011 (slightly more than cumulative production to date) and 389 Gb of non-conventional proved reserves. The latter comprise 169 Gb of Canadian oil sands and 220 Gb of Venezuelan extra-heavy oil, but both estimates are disputed and only a fraction of this volume is likely to be recovered over the next 25 years. In principle, global 2P reserves should be larger than 1P reserves, but according to an authoritative industry source (IHS Energy) global 2P reserves are approximately the same as national declared 1P reserves—suggesting an overstatement of proved reserves by several producing countries.
Basically the conventional proved reserves reported by BP are equal to 2P reserves (which is the technical best estimate of reserves) in 2011, OPEC may be overstating reserves, but overall for the World total 2P reserves (which is the engineering best estimate of reserves) the BP proved conventional reserves are pretty close to this number.
I agree 2016 will be remain the peak for conventional, your assertion that tight oil and oil sands cannot replace some conventional oil is wrong. 2018 is not likely to remain the peak for World C plus C and 2019 is also not likely to remain the peak for US output. There are lots of oil discoveries that were never developed fully, World producing reserves are approximately 474 Gb at the end of 2020, about 2600 Gb of cumulative discoveries, and about 1400 Gb of cumulative production, this leaves about 700 Gb of resources to be developed along with the producing reserves already developed, there are likely to be future discoveries and reserve growth over time especially if oil prices are high. The decline in resources is built into the model, new resources are developed every year which replace those that are consumed, this is what oil companies do. And yes LTO and oil sands are a replacement, if this was not the case they could not be sold. Your 5, 6, and 7 are not events that can be predicted, there will be wars, and economic crises, these cannot be modelled in advance, the model is adjusted to account for these as they occur.
My lack of clairvoyance is a major shortcoming, I really need to get that crystal ball out of the shop. Hey that’s why I have you, so you can tell me what will happen in advance, though specific dates and perhaps changes in real GDP would allow me to model what might occur.
HInH- “all of projections made by Mr Coyne are inaccurate ”
What you and others who express this view continually and utterly
fail to comprehend is that
a projection is of course inherently inaccurate because it is an estimate of what will happen in the future.
Not a complicated idea. Grade school.
Nonetheless, the projections are very a useful attempt at fostering understanding and discussion of the factors at play.
The projections display what future production is theoretically possible based on current information and assumptions. Dennis is in constant search mode for updated information that may affect input assumptions. Hats off for the diligence and transparency.
As I see it, actual production is likely to be lower because of things like pandemics, wars, economic restraints (sanctions or trade wars), terrorism, depression for whatever cause, and other factors that cannot be accurately predicted or quantified.
I have great appreciation for the effort Dennis has put to this task, and as he has said he generally has underestimated actual production.
The biggest take home message i have gleaned from various projections of global output is just how much more oil and gas and coal is still underground, with a very long and fat tail of potential production after this peak plateau.
Just how much is affordable to bring up to the surface is an unknowable part of the equation.
What is clear is that we are grossly overextended on the fossil fuel reliance…
to the tune of billions and billions of people.
And yet most people approach the discussion and efforts at new energy production or energy efficiency as if infantile.
Hicks . ” Hats off for the diligence and transparency. ” Have I ever refuted that ? See the first message on this post , it is my appreciation of his work . Even Dennis will support that both of us” agreed to disagree ” but be civil . However as we stand today and all the data and info coming from the ” real oil men ” here and others whom I follow like Art Berman, John Kemp , Kurt Cobb, Kopits , Javier (Bloomberg) etc all his projections are inaccurate . His projections on LTO , world peak , US peak etc have all been inaccurate . His methodology has been commented on by many which is bottoms up . He uses data which is contaminated ( not his fault ) by EIA , IEA and USGS etc . Wrong hypothesis = wrong conclusion . GIGO . On the other issues we are mostly
in accord . We are now in the phase of ” energy poverty ” next is ” energy starvation ” . On the individual level as OFM stated ” I am prepared ” ( so am I) but ” I am ” is not the world . What would I do if I was the only one on this planet ? I don’t know what these billionaires like Theil etc are thinking buying real estate in New Zealand and Tasmania for doomsday . No man is an island . Living your life in a bunker or alone on 100,000 acres is not my idea of a life . Sorry , went of topic .
Hole in head,
Note that my scenarios take the ideas of the oil pros and include them in my assumptions. Things like pressure depletion rising water cuts and rising GOR are all expected. My scenarios have tended to underestimate not overestimate. As to future bad events, let me know when and how much real GDP decreases and it can be modelled, all else is simply hand waving.
Eni Prepares to Open Ruble Accounts for Gas as EU Warns Firms
Italian energy giant Eni SpA is preparing to open ruble accounts at Gazprombank JSC, allowing it to potentially comply with Russian demands that gas must be paid for in local currency, according to people familiar with the matter.
https://www.bloomberg.com/news/articles/2022-04-27/eni-prepares-to-open-ruble-accounts-for-gas-as-eu-warns-firms
Looks like companies are Breaking Rank with the EU stance on “NO GAS FOR RUBLES.” Eni is likely being logical here because Italy still imports 45% of its Natgas from Russia.
Also, while Mario Draghi has been scouring the globe for natgas, he believes Italy can ramp up imports from Algeria & Egypt. PHAT chance. Both countries have seen their net exports decline over the past 2-decades.
Will be interesting to see how many more companies-countries switch over to Rubles.
steve
Steve , all will pay left , right or centre . No exceptions . The alternative is freeze and starve . EU / ECB/ NATO/ IMF/ WB are a big club and as George Carlin said ” you ain’t in it ” . EU is the limit , kleptocracy + idiocrasy = catastrophe and that is what Europe is facing . Now another fight with Algeria . What could go wrong ? Morons to the left of them , morons to the right of them and into the valley of death charged the full EU . ( Parody on ” The Charge of the light brigade by William Tennyson )
https://www.bloombergquint.com/politics/algeria-threatens-to-cut-gas-flows-to-spain-in-spat-over-morocco
Thought you lived on Belgium Hole.
Steve , now Poland wants to get the taps turned on again . What happened ? Well, Germany refused reverse flow where upon gas would flow to Germany and then be re routed to Poland at a slight premium . Poland would pay Germany in Euro’s and Germany to Russia in Roubles . Germany said no , buy your own Roubles .
https://indianexpress.com/article/world/poland-seeks-to-restore-russian-firms-halted-gas-supply-7894143/
Iron Mike,
Chart for clarification. Uses same data as comment linked below
https://peakoilbarrel.com/decline-in-world-conventional-oil-output-and-peak-oil/#comment-739137
Yes i understand. So if the the unconventionals (U.S + Canada) don’t increase production (assuming various limitations) at the rate you anticipate, we might see higher oil prices as a result. Which will bring more motivations to produce unconventionals assuming no geological constraints.
You dont see a geological constraint for the unconventionals yet. More after 2030, as i understand.
My knowledge on unconventionals is very limited, but from reading the blog here, some people disagree with you, and some see geological limitations, or maybe ‘sweet spot’ constraints. This is an interesting puzzle which will probably be rectified in the next two years, regarding U.S tight oil production. If the 2018-2019 peak is surpassed then you will probably be right.
Regarding conventional, I believe the big four you mentioned can seem to increase production, but whether the peak of 2016 can be surpassed, anyones guess really. Whether there will be a cliff in production also remains to be seen, this decade will surely be ‘make or break’ for civilisation in terms of energy.
Iron Mike,
Note that the scenario I currently use for the Permian basin has a URR of 43.5 Gb out of a mean TRR estimate by the USGS of 75 Gb for 50 million prospective net acres in the Wolfcamp, Spraberry, and Bonespring plays of the Permian Basin. My scenario assumes only about 26 million net acres are actually utilized for completed wells spaced at 1320 feet and average lateral length of 9000 feet (273 acres per well). I assume slightly wider spacing in the Spraberry (1760 feet) and a total of 88,000 wells drilled after Dec 2017 and 70,000 wells drilled after Dec 2021, total wells completed for my Permian scenario are 103,750 from Jan 2010 to March 2034. Note that some people talk about 330 foot spacing, but LTO survivor has suggested that 1320 foot spacing works better, so I use that for my analysis. Obviously if tighter spacing was the norm, then more wells could be drilled, but EUR per well would decrease and costs per barrel recovered would increase (due to higher capital costs). I do believe there are geological constraints on tight oil, the constraints on oil sands are technological and economic more than geologic in my opinion.
There are definitely strong opinions on this that are different from mine, but looking at the data at shaleprofile, the analysis by the USGS, and the economics using discounted cash flow analysis, this is my best guess. Note also the the F95 TRR estimate by the USGS for the Permian basin is 44 Gb, that is about a 95% probability that the TRR will be at least 44 Gb. Peak output for the scenario is 8580 kb/d in 2029Q3. ERR=economically recoverable resources, which is also the URR.
Interesting analysis and modelling. Again sounds reasonable to me. What possible events do you think could curtail permian production ?
Mike , I presume that this question is for me .
1. OPM ( Other People Money ) is drying up .
2. All sweet spots are over .
3. The good DUC’s are over and out . What is left is tier 2 &3 all uneconomical .
4 . GOR / WOR are rising .
5. Pressure is falling .
6. Costs are rising , see my graph on steel tubing prices .
7. Experienced and intelligent labour is not available . LTO , SS , Mike S have lamented about this .
8. Shortages of sand . Posted links on this . Also many other inputs .
The issues posted have no solutions because they are geological mostly . Mother Earth rules . ” No way Out ” starring Kevin Costner , Gene Hackman .
Lol HiH,
I wanted Dennis to actually answer that question! But thanks anyways. Lets see what the future holds in store for us.
Iron Mike,
Tight oil producers could choose not to complete as many wells as I have assumed in this scenario either to keep investors happy by paying out big dividend checks or to pay down existing debt. The US could decide to not allow crude oil to be exported, this is a favorite of some people, this would tend to reduce completion rates as the US does not have the proper types of refineries to refine all the tight oil produced (that is the reason the export ban was lifted). There could be a crash in oil prices because OPEC ramps up output or due to a severe worldwide recession, if oil prices fall to under $60/bo (2021$) most tight oil well completions will cease. The scenario for the Permian I have used takes account of sweet spots becoming crowded and uses actual data from shale profile to model future output.
Also keep in mind the USGS did an assessment of the Bakken in 2013 using the same methodology as was used in Permian basin assessments in 2016 (Wolfcamp Midland), 2017 (Spraberry), and 2018 (Worfcamp and Bonespring formations of Delaware basin). The result for the North Dakota Bakken Three Forks was a mean URR of 11 Gb. My current best guess is a URR for ND Bakken/Three Forks of 8 Gb which matches very closely the proved reserves plus cumulative production at the end of 2020, this URR is about 73% of the mean TRR.
For the Permian 73% of the mean TRR would be about 55 Gb, my scenario is less than 80% of that (43.5 Gb). Below I have a scenario for Permian where completion rate is 400 new wells per month maximum vs a maximum of 650 new wells per month in previous scenario, in addition this new scenario has an oil price of $60/bo from 2027 to 2035 followed by decreasing oil prices reaching $30/b in June 2038 (30 months). URR is 40 Gb with 92,000 total wells completed. Note also that for both of these scenarios OPM is not needed, the future wells are financed entirely from cash flow.
Iron Mike and Hole in head,
On tier one running out, I have followed the Bakken since 2012, I expected by 2013 that we would see average new well EUR start to decrease in the Bakken as sweet spots ran out of room, in 2021 I was still waiting for this to happen. The Permian started really ramping up in 2013 as far as horizontal fracked well completions, the Bakken was at a similar level in 2007 and 14 years later we are waiting for new well EUR to show a significant decrease, maybe in 2027 we will see the same in the Permian basin, so far basinwide EUR decreases have been small in the Permian basin, we saw this over time in the Bekken where it looked like EUR was decreasing, then things turned around and it started increasing again. It could be different in the Permian, but so far I have not seen a basinwide chart for Permian EUR at 6 months normalized for lateral length that shows anything but minor decreases in EUR.
We no doubt can find individual counties or individual operators that tell a story of decreasing EUR, I contend that the basin wide average is the important parameter, and I have not seen convincing evidence of a basin wide decrease in 6 month cumulative output in the Permian basin normalized for lateral length.
https://www.linkedin.com/posts/ted-cross-8520b635_permian-permianbasin-oilgas-activity-6925809304935518208-oBxG?utm_source=linkedin_share&utm_medium=member_desktop_web
It might be time for a new hobby, Dennis. The E in EUR stands for estimated. As the folks that bought shaleprofile.com, NOVI, now suggest, well productivity IS declining. I’ve proved that numerous times. When the largest producer in the entire Permian has lost 22% of its IP180 production levels in 30 months, at $75 oil, man…that’s a BIG deal. And regardless of what funky DCA one uses, THAT translates to lower EUR’s.
Saudi America is poopin’ out ! You need to get “unstuck.” It might help the credibility thing.
Mike,
It is a big deal when the basinwide average decreases significantly. So far I have not seen much evidence of that.
Dennis,
Its a big deal now, if you cant see that then you will just arrive at the obvious conclusion late and be more of an oil statistical archeologist then analyst.
I remember when you me and Ron discussed the exaggerated reserves of saudi and opec. It was just in front of your nose but you refused to see it, i know you now have changed your opinion on that subject but i think it took almost a year to see what was obvious. I think this will play out the same way.
Sure you can always say numbers dont reflect x yet, but that also means you dont have any feeling for whats about to transpire and will always be limited to hindsight.
If common sense is applied to what Mike just posted the direction should be clear.
Be prepared to change your opinion in a year or so.. again 😉
“If common sense is applied”
Common sense says to estimate the trends computationally applying the existing data. You can hand-wave all you want and then give a qualitative guess if that’s the approach you prefer.
Mike said:
Anybody ask Enno Peters how much he made from selling ShaleProfile to Novi?
Smooth move 😉
Paul,
Sure if you always want to be late to the party and never arrive to anything else then just another update and yet another pointless projection before your next revision.
Some time its good to unglue those binoculars.
Given the fact that crude oil has been extracted on for at least 140 years, pinning down a peak oil date to within +/- 10 years counts for something.
The interesting part is applying novel mathematical concepts to the analysis. You are correct in that if one had all the data, it would be a bean-counting exercise to track current production. Yet, as we wrote in Chapter 5
We all know the limits to making useful predictions, especially in regards to economic forecasts where the elements of human game theory arise (and are likely intractable) but the aspects related to a finite and non-renewable resource are more tractable.
Baggen,
In the past my projections have been too peesimistic and always people like you and Ron say at the time that they are wildly optimistic, on many occasions I have called my scenarios on the “optimistic” side. Time revealed that they were in fact pessimistic.
I think you are remembering incorrectly about Saudi reserves, I have usually said we don’t know what they are, but if we take the 2P estimates from 1980 and assume reserve growth similar to the US from 1980 to 2005 we get a number similar to today’s reported Saudi “proved” reserves, I have long said the Saudi “proved” reserves were likely 2P (or technical) reserves.
What is your claimed Saudi reserves? I do not remember the details of the conversation you refer to. There is a lot of arm waving out there, but many don’t actually make any claim that can be falsified.
Interesting and detailed global energy report by McKinsey
(analysis completed before the Russian destabilization of the global energy situation)
They explore five scenarios, but offer a conclusion about oil demand that is of particular interest-
“Peak oil demand is projected to occur between 2024 and 2027¹ driven
largely by EV uptake—a development that is already underway.”
Take note that this statement does not necessarily imply a rapid demand decline.
Long plateau more likely.
https://www.mckinsey.com/~/media/McKinsey/Industries/Oil%20and%20Gas/Our%20Insights/Global%20Energy%20Perspective%202022/Global-Energy-Perspective-2022-Executive-Summary.pdf
“Peak oil demand is projected to occur between 2024 and 2027″
Well of COURSE demand is going to peak: you can’t “demand” what you don’t have, post-peak. Stupidest goddamned shit I’ve read…
Mike B,
The difference between peak supply and peak demand is the price of oil, currently oil prices are relatively high indicating a shortage of oil supply relative demand, thus oil prices are bid higher. When we reach a peak demand situation there will be excess oil supply at prevailing oil prices and the asking price for oil will need to drop in order to sell the oil on the market.
See https://www.britannica.com/topic/supply-and-demand
The chart below is from the executive summary of the McKinsey report linked above by Hickory.
Note that my expectation is that global oil demand will peak in 2035, about 10 years later than the McKinsey report.
Dennis, question? You said you did not agree with their demand scenario of the McKinsey Report. Do you agree with their supply scenario?
Ron,
I did not see their supply scenario, I guess the highest curve could be considered the supply scenario, not really sure about that as I do my scenarios as crude plus condensate. My rough scenarios have a peak of 99 Mb/d, but I do those in barrels of oil equivalent, not sure about the McKinsey report, but EIA does their forecasts for liquids in barrels, not accounting for energy differences between crude, NGL, biofuel, etc, so it is pretty useless from my perspective.
The supply scenario looks high to me, maybe that is the reason they see peak demand so early.
Mike B , you are one of the few who walks with his eyes open . None are so blind than those who choose not to see .
My personal take is closer to that of Dennis- demand for petrol is not going to peak so soon.
_________
Demand will be higher than supply in this decade, with high prices until the product can no longer be afforded.
Secondarily, plug vehicles will very slowly cut into demand.
Those (people, companies, countries) that have plug vehicles will have much cheaper transport miles than those who don’t.
Demand will be higher than supply in this decade,…
I understand what you are trying to say, but you are not saying it correctly. Demand always equals supply with price as the arbitrator. If the supply drops then the price will rise until demand drops to equal supply. When the supply rises, the price will drop until supply drops to equal demand.
When the oil prognosticators talk about peak demand they mean demand will drop so low that producers cut back on production. Production, and prices, will drop right along with demand… they believe. I seriously doubt it. I see it the other way around. Production will drop and prices will rise until demand drops to meet supply. That will be the story for decades. Production will keep dropping and prices will keep rising until… Until total collapse or renewables take over the world. I would bet heavily on the former, that is total collapse. But fortunately, I will be safely dead when that happens.
Ron,
We will see, EV sales are growing rapidly, prices of EVs will likely come down due to economies of scale as the World ramps up output and high oil prices will make ICEVs a poor choice from a total cost of ownership point of view. By 2035 demand will be falling faster than supply at 2034 oil prices and oil prices will start to fall, there will be a lot of oil that becomes a stranded asset because of lack of demand for oil, especially expensive oil like tight oil, oil sands, Arctic oil, and deep water offshore oil.
Dennis, I see things a lot differently than you. Of course, I believe peak oil is three years in the past. That is not new as I have stated that many times. But I see things as a lot more critical right now. I believe that the month of March 2022, just last month, will be the high production month for the year.
It could be close if Putin decides to give up on Ukraine. Or something drastic happens to his rule. But it looks like OPEC is near production capacity.
Nigeria Says OPEC Is Out of Spare Capacity
A one minute video: Goldman’s Currie Sees ‘Severe’ Oil Supply Constraints
I think it is likely that we will see supply constraints this year! Dennis, there is just not nearly as much oil out there as your charts seem to indicate.
Edit: Actually OPEC+Russia was flat last month, (down 11,000 bp/d), so it depends on what non-OPEC less Russia did in March. If non-OPEC less Russia was down in March then February will likely be the high for 2022. I do say “lilely” as I have no crystal ball, but that is the way I see things heading.
Ron,
I believe supply is currently short, that is why oil prices are over $100/b, it is possible March or Feb could be the high point for the year due to falling Russian output, higher oil prices might bring a supply response from somewhere, difficult to say, but it would take time so in 2022 output might be the same as 2021 for the annual average, currently the centered 12 month output (which is my focus) is 66.5 Mb/d and December output was about 70 Mb/d, I doubt the 12 month average for 2022 falls below the 2021 average, but we will have to wait to see how things play out. Oil at $150/bo might lead to higher well completion rates in tight oil basins, some projects that were waiting on FID may get those at higher prices (though there would be a 5 year lag until we saw first oil on new projects).
Dennis, I have no doubt that the 2022 average C+C output will be higher than the 2021 output. But that is not saying much as the 2021 average was just a fraction over 77 million barrels per day. 2022 average production should beat that by at least 1.5, and perhaps 2 million bp/d. But the high was the 2018 average at just a tad under 83 million bp/d. We will finish 2022 at least 4 million bp/d below the peak.
Sorry, but you will have to redraw your charts. 🤣
Ron,
When I have the annual total in April 2023, I will adjust my figures. Note that my current guess is 79.9 Mb/d for 2022, so perhaps about 1 Mb/d too high, an easy adjustment to make. Chart below assumes you are correct for 2022 World C plus C annual average output at about 79 Mb/d. This is also likely to be wrong, we will not know 2022 output for 12 months (in April 2023).
we will not know 2022 output for 12 months (in April 2023).
Of course, we will not know the exact figures until that date. However, we will have a ballpark figure months before that date.
Trends do matter Dennis. That’s why they call them trends.
Perhaps we will have a better guess than now earlier than April 2023, trends often change and we don not know in advance when that will be or how much they will change, even when the data is first released we don’t really know what future revisions will be, probably will not know the true number until August 2024 for average 2022 output.
Yes, Dennis, production numbers are often revised. But they are never revised by very much. So while we will not know the exact numbers until months later, we will know within a few thousand barrels per day. Not enough to make much difference.
We will know this year where future production is headed, we will not have to wait until 2024. We know $110 oil will cause some increase in US shale production, we just don’t know by how much. But we have very little idea what $110 oil will do th the rest of the world. But we will know later this year.
Where is all that electricity going to be produced when all the natgas dries up? I’ve read a ton of write-ups that wind & solar isn’t going to cut it.
Do you see us going all-in nuclear?
I’ve read a ton of write-ups that wind & solar isn’t going to cut it.
Those write-ups are unrealistic. You might want to go back to one or two of them and identify for yourself what their arguments are. If you understand their justification it will be easier to see whether they make sense, and to understand why others are saying that they don’t.
Nick,
The arguments basically boil down to : the earth has been strip mined of metals for the last 200 years with the help of energy dense oil burning equipment leaving low ore grades remaining requiring exponentially more energy to dig up and process.
Renewable tech requires a lot of metals (rare-earths and common).
To be able to dig up the needed materials to power our world with renewables (that need ongoing maintenance and can’t easily be recycled) we’re going to hit a wall when peak oil actually hits.
I’ve war-gamed out potentially using tactical small nuclear for mining equipment and/or potentially cover the demand via recycling. I don’t see that as realistic to replace oil, tough.
Would love to hear what I’m missing and why I’m wrong. Any excuse to bump optimism is very much welcomed.
Tom,
You’ve got a number of points there. I disagree that they make sense, but I’m interested to see if you have new info.
So…let’s start with something relatively narrow: Renewable tech requires a lot of metals (rare-earths and common).
What metals are you worried about? I’m not aware of anything that’s really rare or essential for renewable tech. Silver: not essential to PV. Copper: not essential to electric motors (convenient, but not essential) or electrical transmission, and not really rare. Cobalt and nickel: not essential to batteries: see LiPo battery chemistry. Lithium: not rare at all, and not essential to batteries (though very convenient) – see CATL’s most recent sodium chemistry announcements. Rare earths: not essential for electric motors or wind turbines, and not rare. Iron/steel and aluminum: not rare or increasing scarce or expensive to mine. And so on…
Nick,
I think me previous reply was lost somehow. I’ll summarize quickly here.
My worry is mining *all* metals. Ore grades have been going down for all metals, and will continue to get worse. I suspect that if peak oil has actually hit, we will continue to build renewables, using that energy to mine more ore to make/replace renewables in an inevitable EROEI negative spiral.
https://i.imgur.com/jriiuW0.png
Tom,
That’s an interesting trend: about a 50% decline in ore grade percentages over about 100 years, for 7 metals. But…
First, that’s a pretty slow decline – there’s no particular indication of a cliff in the next 20-30 years. 2nd, my understanding is that the quantity of ores increases very dramatically as ore grade percentages decline, so resource availability is still there. Finally, that doesn’t really tell us much about cost, or energy requirements. Mining and purification methods improve a great deal over time…
Ron,
It takes 5 years for new FIDs on major oil projects to start producing and this have an impact on output, so we will know in about 5 years time the impact of high oil prices, about the only exception to this of significance is tight oil which can respond in 6 to 12 months. We could see this in the horizontal oil rig counts before the wells start producing, there is about a 5 month lag between increases in rig counts and increases in tight oil output.
It takes 5 years for new FIDs on major oil projects to start producing and this have an impact on output, so we will know in about 5 years time the impact of high oil prices,
Dennis, that is just not the case. Yes, if you are talking about finding and developing new fields, yes it will take that long. But all large fields have already been found and only a few tiny fields are left to be developed. So don’t expect much in five years. But we are not talking about new projects. Most nations have already found and drilled all their reservoirs. They are now doing just infill drilling.
But largely we are talking about bringing online every barrel of oil they can possibly produce. OPEC calls it “spare capacity”. Non-OPEC nations don’t have a name for it but it amounts to the same thing. Googling “spare capacity” I get this, bold theirs:
EIA defines spare capacity as the volume of production that can be brought on within 30 days and sustained for at least 90 days. Saudi Arabia, the largest oil producer within OPEC and the world’s largest oil exporter, historically has had the greatest spare capacity.
If any nation, not just OPEC, has any spare capacity then $110 oil will bring it out. What happens five years from now will make little difference as far as peak oil is concerned. After all, by then we will be eight years post-peak.
Just curious, are you really depending on new projects to hold off peak oil until late in this decade?
If any nation, not just OPEC, has any spare capacity then $110 oil will bring it out.
That makes sense in the US, where decision making is decentralized and short-term. On the other hand, some in OPEC have long memories, and they remember previous booms and busts. They very likely don’t want to increase production and then see prices crash due to something unexpected: new supply, dropping consumption, etc.
I expect that they will make changes in output in relatively small, conservative increments.
They very likely don’t want to increase production and then see prices crash due to something unexpected: new supply, dropping consumption, etc.
I expect that they will make changes in output in relatively small, conservative increments.
Oh good God, If they have the capacity to increase production one month to take advantage of $110 bp/d oil, then they have the same capacity to shut it off next month if the price drops. That is just common sense Nick. Think about it. They have nothing to lose by taking advantage of high prices this month. Your theory implies that they would be locked into high production if prices fall. You should know that this is not the case. They can close the taps just as easily as they can open them. That is if they are not open to the maximum already. And that is already the case for 11 of the OPEC 13 nations. And for April, that is likely the case for all 13 of them.
We will know when the OPEC MOMR comes out on May 12th just how much spare capacity OPEC nations have. Because we know every damn one of them will be producing at maximum capacity.
If you look at a 5 year chart on oil prices it looks like oil price is currently in the middle of a heart attack. Its really quite dramatic. Looks like oil cannot figure out what its price is supposed to be. You’ve got supply uncertainty and demand uncertainty simultaneously. Looks like we’re going to need some new Laws lol.
“Russia may see its oil production fall by as much as 17% in 2022, an economy ministry’s document seen by Reuters showed on Wednesday, as the country struggles with Western sanctions. According to the document, Russian oil output may decline to between 433.8 million and 475.3 million tonnes (between 8.68 million and 9.5 million barrels per day) in 2022 from 524 million tonnes in 2021. Exports of oil and gas are also expected to decline this year, the document showed.”
https://www.reuters.com/business/energy/exclusive-russia-sees-its-oil-output-falling-by-up-17-2022-document-2022-04-27/
LG Energy’s Battery Investment Might Boost Commodity Suppliers — Market Insight
9:32 am ET April 27, 2022 (Dow Jones) Print
Commentary by Adria Calatayud
LG Energy Solution’s planned investment in boosting electric-vehicle battery production has positive implications in the short to medium term for its commodity suppliers, which include Sociedad Quimica y Minera de Chile and Zhejiang Huayou Cobalt, and might help to ease fears over a looming battery shortage that could constrain EV makers.
The South Korean battery maker said it will invest about 7 trillion won, equivalent to $5.55B, this year as part of its efforts to expand global production capacity to 520 gigawatt-hours by 2025 from 200 GWh in 2022. This expanded capacity should support demand for SQM, Huayou and other LG Energy suppliers like POSCO Chemical, Vulcan Energy Resources, Li-Cycle and Queensland Pacific Metals.
There have been concerns about whether EV supply chains will be able to keep up with increasing demand as EV makers rev up production. Rivian Automotive CEO RJ Scaringe warned earlier this month that the auto industry could soon face a shortage of EV battery supplies and UBS analysts wrote in an April 4 research note that battery supply will be the next limiting factor after the chip shortage. The EV market outside of China is expected to move into a battery cell supply deficit from next year, UBS analysts said.
LG Energy supplies batteries to Tesla, General Motors, Volkswagen and Hyundai, has recently announced a battery joint venture with Stellantis and is reportedly in talks for another JV in the U.S. with Honda Motor.
Wolfcamp is dying . Latest from Mike S .
https://www.oilystuffblog.com/single-post/hotel-wolfcamp?postId=995433c0-99b7-488e-a969-04d5552e430a&utm_campaign=d2b7c868-483c-4098-8abc-71100a8ee586&utm_source=so&utm_medium=mail&utm_content=aa45e859-2cc5-4595-ae14-0942bed2eb84&cid=fa335351-37bb-44a6-9899-f8c34b4a0f81
Reality .
https://www.oilystuffblog.com/chart-stuff
Myth of unlimited natural gas .
https://www.oilystuffblog.com/forumstuff/forum-stuff/a-tale-of-two-opinions
Exxon declares force majeure on Russian Sakhalin-1 operations
April 27 (Reuters) – Exxon Mobil Corp (XOM.N) said on Wednesday its Russian unit Exxon Neftegas Ltd has declared force majeure for its Sakhalin-1 operations due to sanctions on Russia that have made it increasingly difficult to ship crude to customers.
The Sakhalin-1 project produces Sokol crude oil off the coast of Sakhalin Island in the Russian Far East, exporting about 273,000 barrels per day, mainly to South Korea, and to other destinations including Japan, Australia, Thailand and the United States.
Exxon said on March 1 it would exit about $4 billion in assets and discontinue all its Russia operations, including Sakhalin 1, following Moscow’s invasion of Ukraine on Feb. 24.
The oil producer is taking steps to exit Sakhalin 1, which includes addressing contractual and commercial obligations, Exxon spokesperson Julie King said in a written response.
“As operator of Sakhalin-1, we have an obligation to ensure the safety of people, protection of the environment and integrity of operations,” King said.
Exxon has also significantly phased down its chemical and lubricant businesses in Russia, and suspended sales of all chemical and lubricant products into Russia and Belarus.
Great Expectations! Bold mine.
OPEC+ likely to raise June output by 432,000 bpd -sources
LONDON/DUBAI, April 28 (Reuters) – OPEC+ is likely to stick to its existing deal and agree another 432,000 barrel per day oil output increase for June when it meets on May 5, six sources from the producer group told Reuters on Thursday.
The Organization of the Petroleum Exporting Countries (OPEC) and allies led by Russia, collectively known as OPEC+, have been unwinding record output cuts in place since the COVID-19 pandemic took hold in 2020.
Major consumers, led by the United States, have been pressing the group to boost output at a faster pace, however, especially as Western sanctions hit Russian output.
Under the deal reached in July last year, the group is set to increase output targets by 432,000 bpd every month until the end of September, to unwind its remaining production cuts.
Beginning in August of last year, through September of this year, they are supposed to increase production, each month, by almost half a million barrels per day.
The group, however, has been struggling to produce at its agreed targets, a trend that is likely to continue.
That has to be the understatement of the decade.
German Energy Giant To Pay For Russian Gas In Rubles
Uniper set to pay for Russian gas imports in Rubles.
Uniper’s move comes despite calls from the European Commission to EU energy buyers to not pay for Russian gas in rubles.
https://oilprice.com/Energy/Natural-Gas/German-Energy-Giant-To-Pay-For-Russian-Gas-In-Rubles.html
Looks like another large European Energy company has decided to buy Russian Gas with Rubles. Another perfect example of how Companies realize there is no ENERGY TOOTH FAIRY. If Europeans want to have an economy and not FREEZE during the next winter, they will have to pay for Russian Gas in Rubles.
Or, they are free to choose to ban Russian Gas, fall into a Great Depression and Freeze during the Winter. But, it seems as if Europeans (not the governments) aren’t that STUPID.
steve
Steve . Your last sentence is right / wrong . I can’t say . Why ? The European public does not decide who is going to be in the EU commission which is an unelected body . The deals are made in the back room .This has the absolute power . The European Parliament is useless . It has no authority .It is a debating platform only . Yes , the Europeans are stupid or they would be out with pitchforks . Not only Europeans but the whole West is desensitized . Biden asked for $ 33 billion for Ukraine for covering 5 months = $ 70 billion for a year . Russia’s military budget for a year is $ 61.7 billion (2020) . Where are the pitchforks in USA ? This is when homelessness and food bank usage is the highest in USA . The West has a problem demographically — the young , absorbed with Facebook , TikTok etc drugs and their ” 15 minutes of fame ” phenomenon . The middle aged — all living on maxxed out credit cards and debt . They live everyday thinking how to make the next monthly mortgage payment . No time to learn , heck no time for wife and kids . Ever wonder about divorce rates and single mothers ? Pensioners — they don’t care what is happening as long as they get their pensions and meds on time . By the way if Europe is bad then USA is a disaster . Biden is a failure ( see popularity rating) . Problem is what happens if he goes ? Cackling hyena Harris . If she goes , incoherent Nancy Pelosi . If Nancy goes next in line is Patrick Leahey , this guy is 80 yrs old . With this line up pray nothing happens to Biden . The people get the rulers they deserve .
P.S : UKRAINE’S ENTIRE GDP IS $150B
US AID TO UKRAINE IN JUST TWO MONTHS IS ~33% OF THEIR ENTIRE ANNUAL GDP
But they are winning the war . 🙂
Thought you lived on Belgium Hole… Strange choice given your views.
Just like there are people in the US who have a strong affinity (and even vote for) those who lean hard towards autocracy and theocracy, and away from democracy,
there are those in Belgium and all other countries who do so as well.
I guess they dream of the benevolent dictator, or at least benevolent to them if they capitulate.
btw- Russian invasion forces are just 65 miles from Odesa, the only port city still under local control. Under local control, but under blockade.
Lightsout . Yes, I live in Belgium since the last 30 years but what has that got to do with my comment ? Are you implying that because I live in the West I cannot criticise the West ? The choice to move to Belgium was made 30 years ago . I would make the same choice today . Life in Belgium is good and my comment has nothing to do with Belgium . If you read my post carefully it is more about the monolithic International organizations like the EU/ NATO etc that have become self serving organisations . I know a lot about the EU F***up then many . I have a reference point when the EU was in its infancy and Jacques Delores( anybody know this name ) was its first commissioner and Wim Duisenberg ( nobody knows who he was) the first President of the ECB . I have seen immigration posts being removed and custom offices being dismantled , the introduction of the Euro . I have been to the EU office when it occupied a single building in Brussels . What I see today is a vast bureaucracy occupying street after street . Building after building . The same goes for NATO in Brussels . In my post I am not talking about Europe alone but also taking the US to task . To make it simple it reminds me of what my grammar teacher said ” When a master has too many servants , then instead of serving the master they serve each other ” . Perfectly applies to these monolithic organisations . Hope this clears the air .
Suggest you read my post on the other thread as to why the EU is past expiry date . The same applies to all monolithic organisations . They are unsustainable in an energy constrained world . The centre does not hold .
US February Output drops 50 Kb/d.
Texas -27kb/d, NM 64 kb/d, ND -23 kb/d.
Full update Tuesday Afternoon.
The big loser was the Gulf of Mexico, down 93,000 bp/d. It doesn’t look good. US production is just not taking off like it was supposed to. Looking forward to the world data, hopefully, next week.
Click on image below to enlarge.
Ovi , thanks . Also please post what excuse they have this time for the decline . 🙂
HIH
As Ron notes above, the big drop occurred in the GOM. The onshore lower 48 was up by 43 kb/d
Ovi.
Do you a chart showing EIA weekly versus EIA monthly?
Most recently weekly was 11.9. I know that’s an estimate but is it maybe off by quite a bit to the upside?
Shallow+Sand
Attached is the chart. February actual is coming in close to 300 kb/d lower than the weekly numbers. Part of the problem appears to be the STEO. They are projecting that output starts to increase in February, whereas it dropped. We may see a drop in weekly production next week.
Thanks Ovi!
Shallow sand,
The weekly numbers are based on the most recent STEO, sometimes the STEO is a good guess, most times it is not. The weekly data simply reflects that fact.
Dennis.
Yes, I know weekly is a guess.
Just speculating maybe the recent guesses have been too optimistic on the high side?
Nobody should pay much attention to weekly. But I’m not sure that MSM has figured that out. I do read too much MSM financial news. I should ignore more than I do.
At least the TV MSM talking heads aren’t saying as much stupid crap about oil as they used to. Then again, I haven’t watched CNBC in a long time. Bloomberg TV is much better IMO. In fact, that’s about the only TV news I watch these days.
So maybe they still are, and I have just missed it.
Shallow sand,
Yes the STEO has been overestimating future output lately so weekly numbers have been too high as a result.
For the past 21 months (June 2020 to Feb 2022) the trend in US output has been an annual increase of 578 kb/d.
STEO currently estimates 12 Mb/d for average annual US output in 2022 and 12.95 Mb/d in 2023. If the trend of the past 21 months continues until Dec 2022, annual output for 2022 will be 11.66 Mb/d and if it contuinued through Dec 2023, annual average output in 2023 would be 12.25 Mb/d. Perhaps the trend will change, this is often the case.
Looks like those guys at the EIA are going to have to redraw their charts as well. 😂
Ron .
+ 1 .
Ron,
They revise every month.
Picked this from Tim Watkins blog . Simple to understand .
From 2011 to 2014 average Brent pice was over 110/b in 2021$, real GDP grew at around 3% per year for World over same period, the proportion of World income spent on crude is what matters.
WTI is still bullish and sentiment isn’t overzealous, so its hard to see oil crashing right here, esp. with actual supply shortages and esp. esp. Ukraine sitchuation. The Fed is absolutely determined to break something but it hasn’t disinflated energy and food a huge amount (unlike materials like metals and lumber). Housing and the Nasdaq have been among the first victims but they certainly won’t be the last. And we’ve actually only had ONE rate hike! Only 9 more to go!!
Nothing in stone in regards to those $ numbers on the vertical axis.
Crash band is probably quite a lot higher than depicted.
Someone posted a link to a very good interview last week, I think.
The guy being interviewed knows his stuff on the oil market very well- sober and realistic.
I recommend it, and he addressing the pricing levels relevant to this chart topic at around 14:46 of the presentation. [Mike Rothman of Cornerstone Analytics]
https://www.youtube.com/watch?v=6bfddBRDxXw
Thanks Hickory. I like the graphic showing price range that kills supply, OPEC target range and prices that kill demand.
Conventional was on a bumpy plateau since 2005, the date predicted for peak oil by a select few, until the definitive decline Dennis highlights. But looking back over a century of data, 2005 will stand out as the turning point. It kicked the price up, kicked unconventional into life, which in turn kicked a million old 10-barrels-a-day rigs into life with economic output, with a little maintenance and assistance, more or less all of this in north America, where the infrastructure existed.
Mr Mason . You are correct . 2005 was the inflection point . Now my question to you . Where were you hiding ? Please post more . This forum needs informed individuals like you to separate the chaff .
Hey, this decline in US oil production may be more serious than many believe.
US oil production is going the wrong way
The Department of Energy released its monthly oil production report Friday, highlighting lower US volumes in February. Weekly estimates of US production have shown flat volumes year-to-date; however, the much more reliable monthly figures have shown declining production for three months in a row, with February production down a full 450kb/d from November 2021 levels.
And production trends may not reverse as quickly as some hope. Hess (HES) recently reported earnings and guided the street to lower Bakken production in Q2, on weather-related outages. Pioneer (PXD) pre-announced earnings details Thursday and also guided production lower sequentially. SM Energy (SM), largely a natural gas producer, reported earnings this week, telling the street production would likely fall in Q2. And perhaps most surprisingly, Chevron (CVX) guided to falling Q2 production, though largely related to LNG maintenance outside of the US.
The weak performance in prior months varied between regions, and likely between operators. Lowered Q2 guidance has come on the back of unrelated issues. However, the base-case expectation is for US production to increase in 2022, and increase by ~750kb/d-1.0mb/d. The market will want to see DOE reports for March, and whether any producers can point to rapidly rising US production in Q2. However, several months of weak performance, paired with reduced near-term production expectations, does not bode well for oil market supply / demand balances in 2022.
“this decline in US oil production may be more serious than many believe.”
The decline in global oil production is indeed much more serious than most believe.
Its only a matter of when and how fast, but it is a certainty.
What i don’t have a good grasp on is why so many of those who do understand the pending decline in oil
don’t embrace some of the obvious steps to attempt adapting to the decline scenario.
I do understand denial, and also that some are too old to give a damn.
Maybe there is some kind of subconscious apocalyptic fantasy cult?
Hell if I know, that’s not in my field of expertise.
Hickory.
An example of the disconnect is the absolute lack of interest by almost everyone in lower 48 conventional production.
Despite $90-100 well head prices, it seems to me auction results for anything outside of Texas are abysmal. It’s as if nobody thinks this will last, and oil prices will be back below $60 WTI in no time.
Part of the problem, is that to buy lower 48 conventional production, you better either have cash or other non-upstream assets to use as collateral. The bankers that loaned us money in decades past say they wouldn’t take a lease as collateral now from us, even though we have never missed a payment and are cash flowing great guns now.
It’s surreal. The denial of or indifference to peak oil astonishes me. This phenomenon has been discussed for almost 20 years. It’s like everyone thinks shale will grow forever, and COVID was merely a hiccup.
Any comments SS , etc . No insurance from 2023.
1. As of January 1, 2023, Allianz will not issue new single-site and stand-alone P&C insurance coverages (plus not renew existing contracts as of July 1, 2023) and will not provide new funding for projects in
exploration and development of new oil and new gas fields (upstream)
construction of new midstream infrastructure related to oil,
construction of new oil power plants,
practices relating to the Arctic (as defined by AMAP, excluding operations in Norwegian territories) and Antarctic, coal-bed methane, extra-heavy oil and oil sands, as well as ultra-deep sea. This pertains to both new and existing projects/operations.
https://www.allianz.com/en/press/news/commitment/environment/220429_Allianz-reinforces-its-commitment-to-net-zero-strategy.html
HIH.
If nobody will write insurance for worker’s comp, liability and environmental, I’d say that would shut down oil and gas production in a hurry.
Not sure what we could do?
A lot of small producers have insurance through BITCO, which is a subsidiary of Old Republic International, (NYSE: ORI).
SS and all whom I respect ( strawberries 24/7/365 for me ) , you guys are going to need a lot of luck and grit . All forces are pitched against you and you are being demonized for bringing ” the good life ” to the world . There is nothing I can do but wish you best of luck in your endeavors and hope you prevail . Take care and be well .
not too surprising – even on this website DEVOTED 100% to peak oil, we are inundated with hundreds and hundreds of counter-claims to any conceivable chance peak oil has ever had or will ever have a meaningful impact on society other than a slight speed-bump on the way to EV-PV-turbine utopia. D. Coyne alone has probably stated hundreds of times how the end of peak cheap oil had little to nothing to do with the popping of the housing bubble, that the high prices of 2011-2014 can be repeated as often as needed with little impact on growth, that oil doesn’t matter for growth, and that a transition will collapse demand to the point PO won’t matter. If you’re looking for a reason why this stuff hasn’t had a huge impact on the broader society you need look no further than those sentiments. The pro-status-quo people only need to muddy the water, they don’t need to actually win the argument.
Educated people will deny the reality until the very moment when the gas station is dry and the shelves are empty. For the average person, they are simply too overwhelmed with daily life to care too much. With their (justifiable) loss of faith in institutions, few can even begin to understand what is actually going on in this world. And even if they do, they fully realize they are powerless to have any effect on the outcome. Again, even on this website it would be hard to imagine coming to a consensus of reality for anything important – from Ukraine/Russia to Covid. Life is already so crappy, telling people its only going to get worse is not a huge shocker, but all you’ll elicit is a shrug.
we are, like you said, 20 years into the phenomenon, and I would say, the dynamics of peak oil as a limiter to global growth, and yet, almost non-existent in the zeitgeist. That’s it, that’s basically the end of the story. might there be a last-minute revelation? Whose interest in power would that serve? No one. Not when you can beat back demand with a pandemic, or a recession, or a war. Not to say the pandemic was intentionally released from Wuhan lab, but it wouldn’t surprise me either.
Twocats a nice comment on OFW .
Collapse denialism manifests itself in two forms:
1) It will happen right, but far from where i live
2) It will happen right, but only after I’m gone (like in 2100)
Nothing bad happens till it happens to you .
reminded me of this
stage one we say nothing is going to happen.
Stage two, we say something may be about to happen, but we should do nothing about it.
stage three, we say that maybe we should do something about it, but there’s nothing we *can* do.
Stage four, we say maybe there was something we could have done, but it’s too late now.
thats how the UK government handles things 😉
Idk about where COVID originated. Nor that initial lockdowns had anything to do with a coordinated attempt to stifle oil demand. After all, oil prices weren’t high in 2019.
But I have questioned China’s recent lockdowns, given all we know about the lack of effectiveness of that strategy, given China is the largest importer of crude oil and given it has the ability to make people comply.
“It’s like everyone thinks shale will grow forever”
Saudi America is what they’ve been told to expect by everyone from Diane Sawyer on up. That puts the consumer in the position of deciding if and when to cut back, whether to save the planet, or not. I think people intuit the ramifications of peak supply whether they research the details or not, which is why peak demand gets such traction. It fits our narrative of being in control, proactively changing to a new “renewable” norm when we want.
Wkiki says normalcy bias can be thought of as negative panic, a great description. Imagine the hysterical panic reaction some people have to adverse events, now imagine the exact opposite as they *don’t* react to PO. People are unreasonably (or maybe very reasonably) hostile to even contemplating a situation that will eliminate their entire way of life.
Shallow sand,
Tight oil will not grow forever, it will stop growing soon and total URR for tight oil will be in the range of 75 to 100 Gb, the US consumes about 6 Gb per year and about 17 Gb of tight oil has already been extracted. So that leaeves 58 to 83 Gb for future tight oil, or enough for 10 to 14 years of current US consumption, if none of it was exported.
The main issue will be peak demand for oil, I realize that most here are skeptical that such a thing is possible. Perhaps many banks foresee a future where demand for oil is limited and prices for oil start to drop. I expect this will not occur for 10 years at the earliest, and possibly not until 15 years in the future.
Whatever happened to Michael Lynch? Are we still experiencing an oil flood?
He is still writing and posting for Forbes. His articles don’t seem to be getting the attention they used to be getting. The below link list 12 Forbes articles by Lynch. Not one of them mentions peak oil, however. If you click on “show more” at the bottom of the page you will get a couple of dozen more or so. One of these mentions “Peak oil demand”.
Articles by Michael Lynch
Diesel will be the straw that broke the camel’s back .
https://oilprice.com/Latest-Energy-News/World-News/Diesel-In-Crisis-Mode-As-Prices-Break-Records.html
https://www.reuters.com/business/energy/rosneft-cuts-diesel-exports-key-russian-port-zero-2022-04-29/
How to Make Sense of Russia’s Contradictory Oil Data
Production is falling yet seaborne shipments have jumped
Russia’s refineries are slowing, diverting crude for export
Bloomberg News
April 29, 2022, 4:18 AM CDT
Data on Russia’s oil industry can be downright confusing.
The country has been entangled in a web of restrictions since the invasion of Ukraine, from outright import bans to shipping problems and buyers’ strikes. The real impact of these overlapping measures is hard to gauge, with key statistics pointing in different directions.
This month, Russia’s daily average seaborne oil flows are set to jump by some 450,000 barrels from March, reaching a three-year high of 3.67 million barrels a day, according to estimates from market intelligence firm Kpler. At the same time, the nation’s production dropped by more than 900,000 barrels a day, down to levels last seen in early 2021.
If Russia is pumping less oil, how is it able to export more? The answer lies in the facilities that process crude into fuels.
“The April hike in exports is largely attributed to lower refinery runs,” said Viktor Katona, head of sour-crude analysis at Kpler.
While Russian daily oil production so far in April has been about 8.8% below pre-invasion levels, the amount of crude processed by refineries has slumped 15.3%, according to data from the Energy Ministry’s CDU-TEK unit seen by Bloomberg.
Bad weather in North Dakota is causing serious problems in the Bakken.
Extreme Weather Leads To Sharp Drop In North Dakota Oil Production
A recent bout of bad weather has slashed oil production in North Dakota by almost 80 percent, and restoring the lost output could take several days. North Dakota, home to part of the Bakken shale formation, is the third-largest oil-producing state in the United States, with a daily production of 1.1 million barrels.
The situation is temporary, but today’s volatile market is acutely aware of any production outages, particularly in the United States. North Dakota’s loss of roughly 800,000 bpd has caused oil prices to climb even higher at an inopportune time when global oil prices are already high. The U.S. oil industry has come under fire recently for its slow post-covid production increase.
According to Katie Haarsager, spokesperson for the North Dakota Oil and Gas Division, the extreme weather has caused road blockages with snow and ice. This has hindered the ability of oil companies to reach their production sites and has damaged their electrical infrastructure.
Ron Ness, president of the North Dakota Petroleum Council, is hopeful that most of the production can resume by this weekend. “The situation is improving quickly each day,” Ness said, according to Reuters.m
Prior to the storm, the EIA expected North Dakota’s production from the Bakken to rise to 1.2 million bpd next month.
In February of this year, North Dakota was producing 1.09 million bpd. The final numbers for April’s production will not come in until June, but the industry expects it to be a bad month. North Dakota’s pre-pandemic peak oil production was 1.5 million bpd.
By Gandhari Cooray for Oilprice.com
Helms said the April 12 storm dropped production to 750k BOPD. It had recovered to 950k when the April 23 storm hit and dropped production down to 300k. By April 29 it had recovered to 700k per Helms.
April won’t be a good production month at all for ND. Big impact on US in April.
Extreme weather:
https://pbs.twimg.com/card_img/1518645411447193601/Brm-9N1M?format=jpg&name=small
You should see the youtube channel ”deciphering weather”. You, in USA, you have, since this winter, harsh weather conditions : one nor’easter per week bringing heavy snow, blizzard condition, freezing rain and so on and since end of March-April, one multiday severe weather outbreak per week. This is caused by continued La Nina condition in equatorial Pacific and above average sea surface temperature in Gulf of Mexico and in near Atlantic East coast of US, the latter two being caused by climatic change.
Where I live the price of diesel this morning was $5.19 and gasoline was $3.79. The spread has widened to $1.40
When abundant or cheap oil is no longer locally available, what will you do differently?
There may come a time when getting more than 5 gallons of fuel a week is either too expensive or simply not covered by your ration card.
If you are fortunate among the worlds people, you will still have personal mechanized transport options to choose from however. But to expect that things will be the same as prior to peak oil supply, and peak prosperity, is unlikely to mesh with the coming reality.
One option that people may have to seriously consider is a vehicle that is electric, and only has a limited range. Perhaps 120 miles per charge. Why low range? Simply, such a vehicle can be much less expensive, use less minerals, and be less heavy since it has a relatively small battery capacity. Cost per mile will be low compared to every other option, except walking or pedaling.
And while it will be a different reality, it will enable work, family life and leisure travel to go on, after all the average US vehicle miles traveled per day is just 29 miles. A smaller range vehicle is not the ‘end of world’ when it comes to personal transport.
To me it is not the most desirable outcome, but ‘most desirable’ may become a fantasy from the past.
I bring this up to point out that the time to think beyond when oil is readily available has come, if to not your neighborhood right now its just a matter of time.
I agree: there is a serious danger of a disastrous shortage of oil.
Now, I’m not so worried about PO due to depletion. It will certainly be painful for some vulnerable importing countries, but the world will have time to adapt: high prices would slow the rate of decline, and dramatically speed up efficiency and substitution. In general I’m much more worried about climate change.
But…oil related systems are not resilient (not like distributed renewables would be): all it would take is a war between KSA and Iran that blocked the straits of Hormuz, and suddenly we’d be short a lot of oil. THAT would be very, very painful. It would require a WWII style response, which is very, very painful.
Bottom line: I agree, we need to dramatically speed up our transition away from oil and FFs. That would require national and international action, rather than personal action.
As far as personal action goes, I’d say buying an EV, plugin or hybrid would be a good idea. I’d also learn how to carpool: it’s a very easy way to slash oil expenses. Heck, carpooling with just one other person would cut expenses in half. Smart phone apps should make this easy for most people, unlike 40 years ago when only large employers had the data and communications to make it work.
Telecommuting, zoom meetings and online shopping can eliminate almost all practical car and plane travel (as opposed to recreational travel), at least for knowledge workers (which very likely account for a majority of light vehicle travel).
I’m with Dennis, when it comes to his models, because he’s quite open about their limitations, and would never argue with the rule that all models are wrong but some are nevertheless useful.
The biggest problem with his models, as I see it, is not the geological or economic unknowns or variability inherent in this kind of modeling, but rather the various potential events that can upend every day business as usual reality.
If Old Man Business As Usual manages to stay on his feet, we can deal with peak oil, because peak oil is going to be, is, more of a chronic disease sort of problem than a heart attack sort of problem.
Hickory is right, we can learn to live with a new normal, with small short range electric cars, etc, and after four or five years, we will be USED to this adaptation.
Nick is right, there are lots of ways to cut back on consumption and still be prosperous.
Dennis is right, it’s the percentage of our total income that goes to oil that matters, rather than the price of oil, over any extended period of time.
But the doomsayers are right too, if there’s any sudden and long term shortfall in oil and gas production.
Russia isn’t at all likely to quit exporting oil on the grand scale, so long as doing so is possible, and while sanctions are hurting both Russia and Russian customers in the West in general and NATO countries in particular…………
Well, that oil is still out there on the world market, it’s still being burnt, and NATO countries can buy and burn the oil formerly bought and burnt by China and India………..
So sanctioning Russian oil probably isn’t going to break European backs.
I don’t see Old Man BAU staying healthy. The odds are against it. There are too many things that can go wrong……. for instance a hot war involving Iran and Iraq or Saudi Arabia.
We have collectively been too lucky too long, as a gambler would put it. The current industrial and economic system based on oil is like an old ship in a stormy sea. Such ships don’t just sail on one minute and sink the next. They gradually break up, with one critical part after another failing, so that the sailors frantic efforts to keep them afloat eventually fail.
The Russian invasion of Ukraine will not be the last unpredictable shock to the oil market.
OFM,
It is never clear to me what would cause the sudden drop in oil output, yes we could have a World War, but in that case dropping oil output is the least of our problems, ditto Great Depression 2.
If some bad thing happens in year x and lasts for y years, I can easily model it.
Someone just needs to be brave enough to create the hypothetical.
OFM,
Hypothetical scenario with Great Depression 2 from 2029 to 2033 followed by recovery (similar to Great Depression) except we will assume no WW3. Extraction rates fall by 33% from 2028 to 2033, bigger that the 25% decrease from 1980 to 1985 (and the biggest 5 year decrease since 1945).
Doubtful that the World could do as poorly as the disastarous policies of 1929 to 1933 as some have learned from Keynes’s work. So this hypothetical is more speculative than normal.
I view YT and others on the EU energy crisis and response . When the ” expert ” says ” EU must look for new sources of supply to end it’s dependence on Russia ” . I switch off . The ” expert ” is an idiot who knows nothing about peak oil . gas ,coal and Peak Energy . Like they say ” Too many generals , not enough soldiers ” . 🙂
If anybody here who is paying fairly close attention to federal energy policy over the last couple of years would summarize it for us, that would be great.
The main thing I would like to see discussed is what the Biden administration has actually DONE, or not done, to influence the production of oil in the USA, and world wide. There’s so much misinformation out there it’s hard to sort thru it.
OFM.
My two cents is that the Biden administration, like the Trump administration, doesn’t understand the oil and gas industry and how vital it is.
Example A. Biden says fracking should be stopped during primary debates and goes about as far during the general debates, then complete 180s when prices rise and demands shale producers drill more wells.
Example B. Trump complains repeatedly about $60 oil, claiming the industry can make strong profits at $40. Or the energy powerhouse comments.
I’ll even throw in Obama, who crowed about how great it was when oil prices dropped below $30 in 2016 (more like he pointed to gasoline below $2, I think). And his eliminate big oil tax breaks rhetoric, which was either a lie or a very smart man who was very uninformed about a hugely important topic.
We have such short memories of the time the USA was struggling to produce 5 million BOPD. For some reason no USA President could likely tell you how much oil the US produces and consumes a day, I know the current energy Secretary couldn’t recently.
So if they don’t know that, they also have no clue about the topics discussed on the board about future supply in both the US and the world.
One demonizes the industry. The other buys everything it says.
I don’t know that a whole lot has happened yet to curtail oil production in the US in practical terms. There have been a lot of threats, which don’t help morale.
The USA is going to drill, even the most left wing elected official has his/her gasoline price limit.
And, if somehow the price of gasoline goes back down, the left wing “keep it in the ground” will flare up again. And I don’t see conservation becoming something the right will ever be in favor of.
I am overly focused on these issues, but I believe the pols are way under focused. They really know very, very little about energy.
OFM, we don’t operate on federal lands. So what happens there, I cannot tell you.
I will say this, though. I have been following methane regulation extremely closely because one proposal would be very onerous for my family, and would do nothing to lower the tiny amount of methane our operations emit. The big debate has been how to regulate marginal wells, which make up over 90% of those in the US lower 48 onshore.
The DOE has been conducting an in depth study of this by going to wells throughout the USA and actually measuring methane emissions from marginal wells. The DOE issued a preliminary report of its findings, which showed that over 75% of the wells studied emitted no detectable methane, and over 95% emitted less methane than would be required to be captured under the stringent proposed regulations.
For some reason, however, this study has been stalled, and there is no clarity when the final report will be released. Now, an environmental group has come up with its own study, and is hammering on the Biden Administration to utilize it instead of completing the DOE study. The result of course, being that every well in the US, no matter how marginal, would need to be monitored periodically by an $85,000 camera. And large amounts of reporting would be required of each operator annually.
Hope the above example supports my notion that the US government leadership is clueless about energy.
Just remember they are playing to their bases. If they can receive more votes from the environmentalists, they will say they want to stop fracking. If the economy starts to tank due to high oil prices, they’re all for more drilling saying producers can make money at $40/barrel.
Or they trust oil producers claiming they can make benefit at $40/barrel 🙂
Shallow+Sand
Just an opinion. The objective of the environmental group to cover all marginal oil wells with methane monitors is not to monitor methane emissions. Their objective to is shut down the marginal wells by making them too expensive to operate.
These are very clever people at getting good press while at the same time achieving disastrous results.
OVI take a look in the mirror and see “disastrous results”. For the last 30 years the industry has been lying to the world that climate change wasn’t happening. Spending 100’s of millions of dollars spreading the lie and buying politicians to protect their industry and profits.
I’ll bet you can’t find 3 members of any environmental groups that even knows that a methane camera even exists. What environmentalist want is to stop burning up planet earth and keep it a livable habitat for life in the future. Your just a parrot who is repeating the lies of the industry and playing the victim.
Instead of crying like an abused so called expert. Produce a viable solution to the reduction of leaking methane and climate change. Otherwise you are part of the problem and demonizing is warranted.
PEAK NATURAL LUBRICANT
Maybe you should look in the mirror and face the facts and look at what the govt report states. Your comment appears to be conflating too many oil and pipeline issues with marginal oil wells.
“The DOE issued a preliminary report of its findings, which showed that over 75% of the wells studied emitted no detectable methane, and over 95% emitted less methane than would be required to be captured under the stringent proposed regulations.”
Why else would this environmental group produce a report asking for methane monitors to be installed on oil wells that literally do not produce any detectable amounts of methane.
Time to wake up and smell the roses.
P.S. Make sure that you read my Monday post tomorrow so you can see more of the industry information I parrot.
Ovi. I just want the DOE study to be completed. Worried politics will keep that from happening. I’m pretty sure this study was approved many years ago.
Lots of small businesses affected.
Mike posted an article written by a petroleum engineer tasked with finding assets for a PE firm which wanted oil weighted assets, conventional wells, but no stripper wells.
The engineer could hardly find anything which fit that description. Something like 97% of lower 48 vertical oil wells produce under the 15 BOPD threshold.
It’s a big deal IMO.
“Maybe you should look in the mirror”
Does Paulie want a cracker ? To go along with his wine. What’s the point of reading your copy and paste post of all the greatest hits of denial and strawman fallacies from the oil industry ? The atmosphere isn’t the oil industry to use as dump. I’m sure you would be the first person to call the police if I started dumping 5% of my trash in front of your door everyday.
Take some responsibility, it should be .5% or less. If the industry can’t police it’s self. Than $85K punitive camera purchases seems fair. Do you throw all litter out of your truck window too or just 5% ?
It’s time to put on your big boy pants
What is your background to post it should be .5% or less?
Or are you just a troll?
Just because you can’t see the methane with your eyes or to cheap to pay for a camera doesn’t mean your not polluting. Why do you feel you have the right to pollute ? It’s all about the will to solve the problem. Clearly you feel you are entitled to pollute for personal profit.
Texas knows how to solve the issue. It’s really very simple. Since your to cheap to buy a camera. Just let anyone in the public buy a camera and check the wells for you. Then any well that leaks is fined $10K per day and paid to the camera owner until it’s stopped.
If you throw 5% of your trash out the window of your truck it’s wrong. It’s no different. You just think your entitled and don’t want to solve the issue. Cars are smog checked annually and required to be fixed if they are out of specs. Cars owner don’t have to buy the machine that does the smog check.
PEAK NATURAL LUBRICANT, quoting you below, this is about the dumbest comment I have seen in years.
Instead of crying like an abused so called expert. Produce a viable solution to the reduction of leaking methane and climate change. Otherwise you are part of the problem and demonizing is warranted.
That’s like saying: “If you see a crime being committed, do not report the crime, produce a viable solution to end such crimes.” Reporting the crime is part of the solution. To think that we posters here, can simply produce a solution that anyone in Washington, or the oil industry, would listen to, shows an unbelievable naivete.
Perhaps you should just remain silent and be thought a fool, rather than open your mouth and remove all doubt.
“Just an opinion.” Is it really necessary to start a comment with this phase ? It’s a blog.
Just because the human eye can’t see the methane doesn’t make it acceptable and entitle the industry to do it.
“this is about the dumbest comment I have seen”
Ron, you have been parroting this a lot lately when you attack.
Yeah, that’s because comments are getting dumber and dumber. And I was attacking your stupid attack on Ovi. That is that we should come up with a solution to the methane problem. Gad, do you have a solution? Do you think we should have a solution for every problem we posit on this blog? How about solving the population problem. I have a solution: Everyone please stop having babies. Yeah, that should do it.
Now do you see just how stupid it is to suggest instead of discussing a problem, we should come up with a solution?
Instead of crying like an abused so called expert. Produce a viable solution to the reduction of leaking methane and climate change. Otherwise, you are part of the problem and demonizing is warranted.
PEAK NATURAL LUBRICANT, please try not to make such a stupid comment again. It is embarrassing.
Ovi, the origin of methane level increase in the atmosphere is complex as there are different sources of methane (one important is the activity of the cyanobacteria which is not taken into account but which is important with a high level of confidence) and different mechanisms in the atmospheric chemistry which are competing between destruction of methane and increase of its concentration. The recent increase is probably due to a change in atmospheric dynamic according to this publication. By the way, it seems that the extraction and the use of coal is emiting more methane than the extraction of natural gas. https://acp.copernicus.org/articles/16/3099/2016/
Peak , you are getting carried away . Ovi is not a Congress or a Senate member and it is not his responsibility to do legislation on methane and CC . You have a problem take it up with the guy you put into office . No , he is not the part of the problem and his effort ( as of many here ) is to educate and understand the predicament called ” Peak Oil ” . “The lady doth protest too much, methinks” Hamlet from William Shakespeare .
The clock is ticking. Six months until heating season in Europe. Wood and coal resurgence likely.
Russian reputation as decent neighbor or partner set back a century.
” Could Europe withstand a wholesale ban on Russian oil and gas? Europe may be hurtling toward a sudden halt of Russian gas, a scenario that would trigger energy rationing, higher inflation and a deep recession. A showdown over payment terms has already led Moscow to turn off taps to Poland and Bulgaria. With supply already tight, it won’t take much more to send energy markets into shock. Europe’s natural gas balance is “fragile and it remains just one supply disruption away from completely falling apart,”
________________________________________
Pretty good summary on the shifting energy scenario related to the Russian invasion here-
https://daily.energybulletin.org/2022/05/russian-threats-redraw-the-global-energy-map-the-washington-post/
Oh, don’t be ridiculous. Peak oil will be dramatic but everyone will not die. There will be survivors.
Renewables , you said “Dennis of course keeps deleting my posts, ” . That is an accusation I find hard to believe . Dennis is rational and does not censor without reason . Were/ are you too toxic ? I ( We) will never know , however your first two posts that have gone thru his ” censorship ” are acceptable . However that all will die now that we are at PO is far fetched and I am in agreement with Ron . There will be survivors as Ron has said . Humans are like cockroaches , you can kill them but not exterminate them . Interesting observation on the Ethanol issue , but you provide no backup for your statement . Talk the walk . Alsublijft ( Please ) .
1) Didn’t know coal consumption was at an all time high. The dangers of paying attention to MSM. You burn what you have. India has coal. China (North Korea) has coal. Also in the same context, didn’t know the US is the #3 coal consumer on Earth.
2) Germany makes the top 10 list, produces less coal than consumption and the deficit comes from Russia. Coal has been off the radar screen. Did it get sanctioned?
3) Iran has been shipping oil north on the Caspian for years to blend with Russian oil, get sold, and get paid. Sanctions dodged. That flow includes Kazahkstan and Azerbaijan. No real reason Russian oil can’t similarly blend with those for sale. To Europe.
4) Sakhalin-I is up to about 350K bpd. Exxon as operator withdrew, but development work there is done. That is legacy flow and change of personnel is not likely to affect the output. Big gas production there, too. Russia’s first LNG export terminal is there (Sakhalin-II)
Thanks Watcher . Issues we were not aware of or were off the radar . When the world is in ” energy poverty ” mode then every penny counts .
Dollar has been trading in a range since about FEB 2015. Between about 88.35 and 103.80. I’m expecting a breakout move higher that ultimately test the 120.00 handle. Because chart wise there just isn’t much resistance between current price and 120.00
Eurodollar market is under stress and finding dollar funding just isn’t as easy as it was.
I get everybody’s argument of why oil prices will remain elevated. But in my opinion the current price of oil won’t last as dollar funding blows up in a major way globally.
While the Chinese yuan isn’t really connected to the dollar index. Asia currencies have their own index against the dollar. The fact that the yuan is falling sharp against the dollar is a sign things are tight in Eurodollar funding. Global dollar shortage.
I’ve been talking about this for a year and a half or so and it’s now starting to unfold.
88% of China’s imports and exports are settled in US dollars. Lack of dollar funding blows up China demand.
HHH , the Eurodollar stress is showing by the way of the Euro and Yen devaluation . Another indicator is what China is doing to its vassals . Sri Lanka needed $ 3 billion to avoid default and Pakistan $ 5 billion , short change for Beijing but refused to help and now they are at the door of IMF . China lent $ 500 million to Tajikistan but it is in lieu of some exclusive mining rights . Some money shuffled to Kyrgyzstan to keep the lights on . They are in hoarding mode . In the meanwhile Nepal is having it’s dollar problem . No USD’s to pay for fuel .
https://abc17news.com/news/2022/04/27/cash-strapped-nepal-bans-imports-of-cars-cuts-work-week/
The weak nations are hitting the wall .
The dollar breakout to the upside is interesting, if something like that can be said about the less than optimal state of the economy as of now.
In the lens of demand destruction for oil; the US will be the last country to “fall” if this trend continues. A lot of countries around the world would be begging for a weaker dollar and that the interest rate for dollars does not go too high. Low inflation and low interest rates thank you very much. Or more of the current trend? Meaning developing economies or economies with a high trade deficits are going to get increasing problems, fast approaching a breaking point. I guess the world is addicted to easy money.
Oil prices (and more critically diesel prices as of now) must probably rise slowly for the world to be able to adapt. Due to the inflationary effect on everything. Demand destruction over time needs to happen one way or another. Any sudden chock to the upside, if sustained, would break the current financial system. Or so it can be speculated that Russia and China believed – but this trend of a strong dollar and a strain on most dollar reliant economies (especially the weakest ones) in addition to falling stock markets is an “unfortunate” turn of events. Because the US is the least affected nation.
https://mishtalk.com/economics/warren-buffett-blasts-stock-market-gambling-casino-loads-up-on-energy-shares
Uncle Warren plows into oil stocks.
Berkshire loves its oil stocks, but Goldman thinks another one is a better buy
As for Chevron, Buffett’s Berkshire Hathaway reported over the weekend it holds roughly $25.9 billion in Chevron’s stock. Chevron marks Berkshire’s fourth largest stock investment as Buffett bets on a future of higher oil prices.
“I think it’s going be very precious stuff over the next 200 years,” Berkshire Vice Chairman Charlie Munger said at Saturday’s meeting.
https://finance.yahoo.com/news/berkshire-oil-stocks-goldman-sachs-105459252.html
Gulf of Mexico Oil Drilling Makes Too-Little, Too-Late Comeback Bold mine
(Bloomberg) — A new wave of oil platforms is sweeping into the U.S. Gulf of Mexico as crude prices are riding historic levels and demand for barrels is higher than ever. But don’t count on the new production to close the oil-supply gap that has plagued the world’s economies since the pandemic. Even with the new platforms coming online, Gulf oil production won’t grow substantially in the coming years as mature fields decline, according to analysts.
BP Plc’s Argos and Shell Plc’s Vito — floating production platforms that are taller than 20-story buildings and have decks the size of football fields — will start pumping crude off the Louisiana shore later this year. They will join Murphy Oil Corp.’s King Quay, a behemoth that started producing oil in April, also April, also off the Louisiana coast. Others from Chevron Corp., Shell and Beacon Offshore Energy are expected to start production in two years. Once all six platforms are online, they could produce up to 560,000 barrels a day.
The timing for these new Gulf projects couldn’t be better. The offshore sector has been battered by back-to-back busts and a pandemic that forced mass layoffs and bankruptcies. But even with oil at $100 a barrel, a big comeback is unlikely. After a decade that saw one of the worst oil spills in U.S. history, shale’s ascendance and mounting climate-change concerns, some experts believe that the sun may be setting on the Gulf.
There is a lot more to this article, along with a chart.
I find the debates on this site regarding future fossil fuel production among Dennis Coyne, Ovi, Ron Patterson and many others fascinating and buttressed by thoughtful research. Yet, huge uncertainty remains. I’ve been following energy and resource sites since the early 2000s, and don’t remember well informed discussants having any inkling of the enormous increase in production with the advent of shale oil. And, except in hindsight, who was talking about the potential impact of a pandemic on global oil production/demand? It sure “feels” like we’re at a turning point, especially if Russia is willing to fight in the Ukraine for 10 or 20 years, emulating the United States in Afghanistan. Still, I’m sure there are wild cards no one sees coming.
Brian , “and don’t remember well informed discussants having any inkling of the enormous increase in production with the advent of shale oil.”
Did you know about something called QE and ZIRP in 2008 when shale took off ? Shale was/is nothing but a ” burn paper dollars to scrap the bottom of the barrel” . If you knew QE and ZIRP in 2008 then you should replace Powell . Yes, there are wild cards but there are also trends that are clearly visible .
“I’m sure there are wild cards no one sees coming.”
Indeed Brian.
I suspect human population will be peaking sometime around 2050.
It will take that long for the economic pressures of decline in prosperity related to the energy /capita decline
to slow down the human bulldozer.
Some countries much sooner than others.
“Until about 1800, the vast bulk of people on this planet were poor,” Joel Mokyr, an economic historian at Northwestern, once noted. “And when I say poor, I mean they were on the brink of physical starvation for most of their lives…
That pattern started to break down in the 17th through 19th centuries, a process sometimes shorthanded as the “Industrial Revolution,” but including a wide variety of cultural, scientific, technological, and economic changes.”
____
All of the growth and advances in the past 200 years are the result of what can happen if humans have access to more than just manual labor (human and other animals) and wood for energy.
Oil at $200 bucks a barrel is still cheap.
The availability of cheap energy is an aberration in the history of homo sapiens [past and future]
And we have utterly wasted most of it.
A photo from The Oily Stuff .
A new thread on US February Oil Production has been posted.
https://peakoilbarrel.com/us-february-oil-production-surprises-to-the-downside/
A new Open Thread Non-Petroleum has been posted.
https://peakoilbarrel.com/open-thread-non-petroleum-may-2-2022/
[…] Decline in world conventional oil output and peak oil Tight oil market myth becoming reality […]
[…] in North Dakota) are already in irreversible decline due to depletion. The world as a whole saw its peak output of conventional petroleum in 2016, following a long plateau that began in 2005. Oil importers, therefore, are largely out of options […]