A guest post by Ovi
All of the oil (C + C) production data for the US state charts comes from the EIAʼ’s Petroleum Supply monthly PSM.
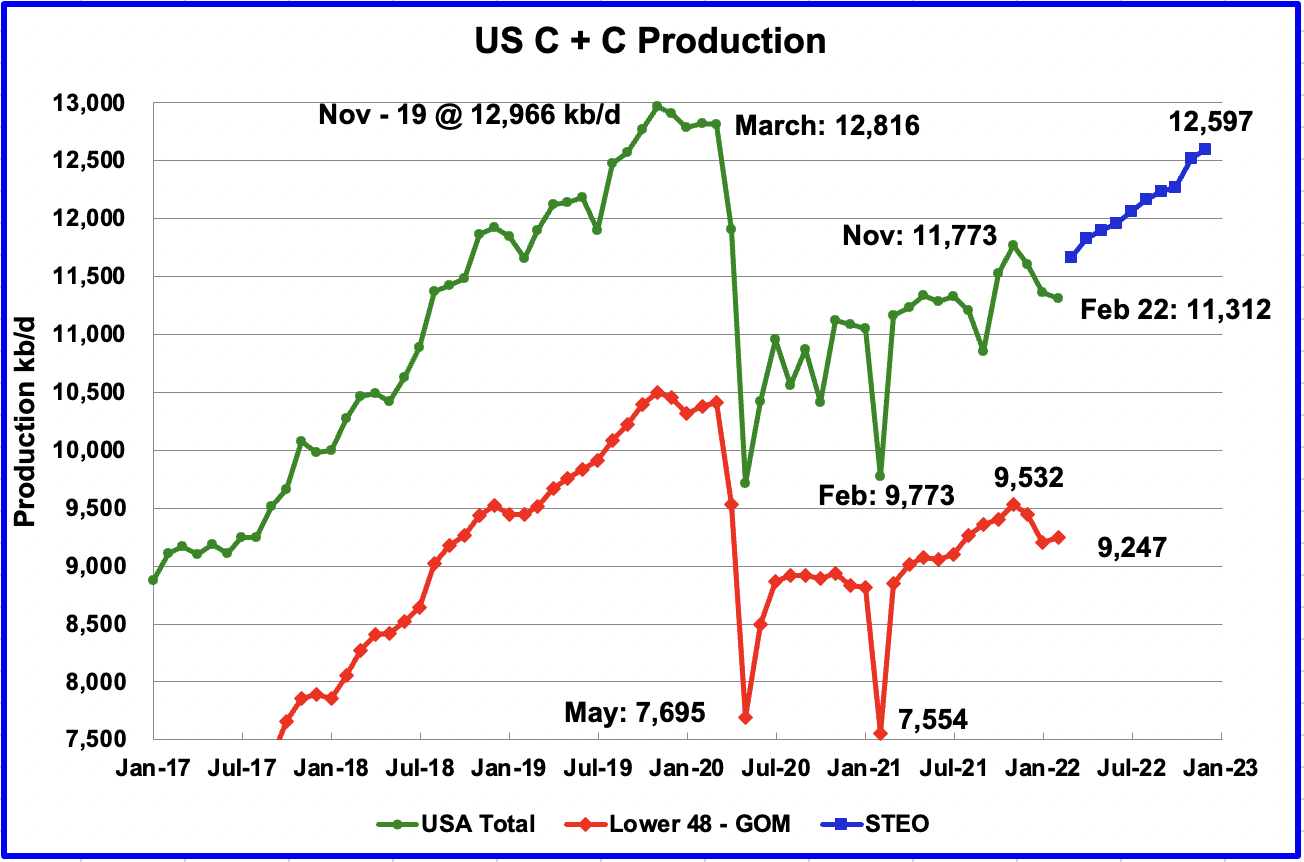
U.S. February production decreased by a surprising 50 kb/d to 11,312 kb/d. Relative to November 2021 production of 11,773 kb/d, it has dropped by 461 kb/d. The main declining states were Texas 27 kb/d and ND 23 kb/d. The major decliner was the GOM which dropped by 93 kb/d. Of the top 3 states, only New Mexico increased its production.
While overall US production was down, a clearer indication of the health of US onshore oil production can be gleaned by looking more closely at the On-shore L48 states. In the On-shore lower 48, February increased by 43 kb/d to 9,247 kb/d.
The blue graph, taken from the April 2022 STEO, is the production forecast for the US from March 2022 to December 2022. Output for December 2022 is expected to be 12,597 kb/d, a revision of 38 kb/d lower than was forecast in the March STEO report. From March 2022 to December 2022, production is expected to increase by 931 kb/d or on average 103.4 kb/d/mth.
Looking at the production trend from July 2020 to February 2020, the slope/trend of 103.4 kb/d/mth of the blue graph looks optimistic. It appears to be an economic forecast based on oil price that does not reflect current management thinking and investor demand for reduced spending and increased investor returns. Also the DPR and LTO reports below do not confirm the optimistic STEO production projection.
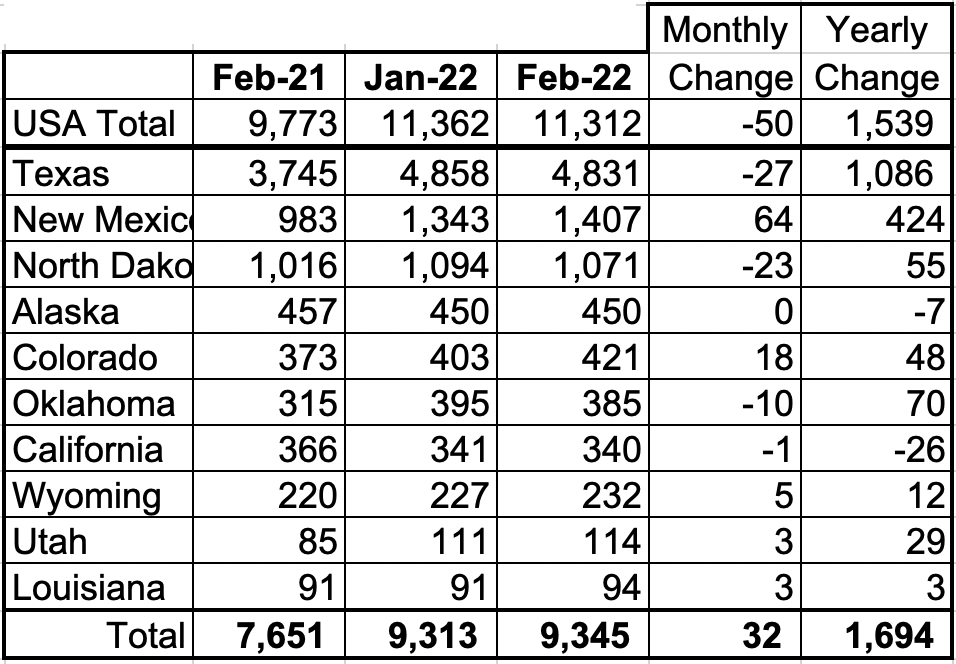
Listed above are the 10 states with the largest US production. These 10 accounted for 82.6% of all US oil production out of a total production of 11,312 kb/d in February 2022. Note that all of the above states, except Alaska and California were producing more oil in February than one year ago.
On a YoY basis, US production increased by 1,539 kb/d.
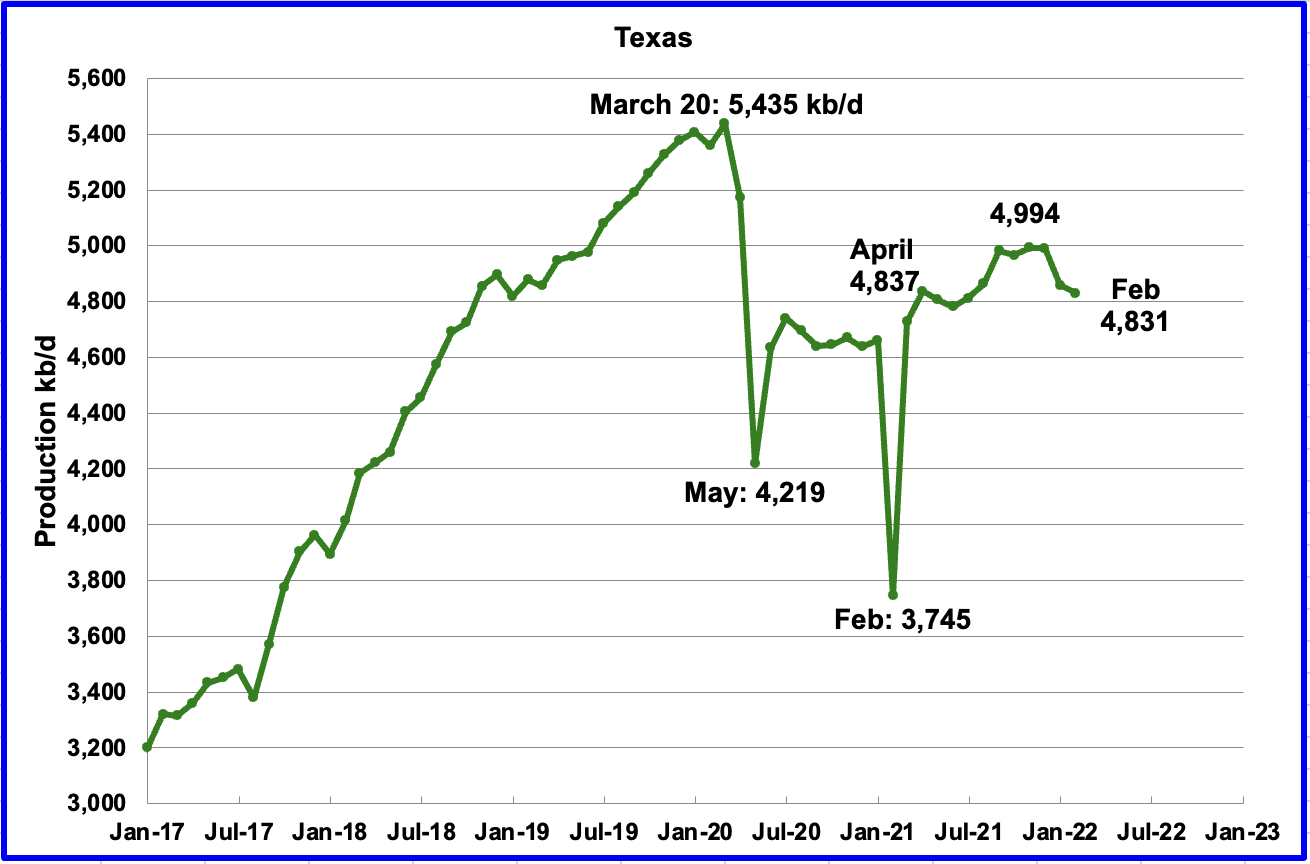
Texas production decreased by 27 kb/d in February to 4,831 kb/d from 4,858 kb/d in January. The decrease could be weather related.
In April 2021 there were close to 185 Hz oil rigs operating in Texas. By the last week of February 2022, 263 oil rigs were operating, an increase of 78 rigs and production is back to the same level as April.
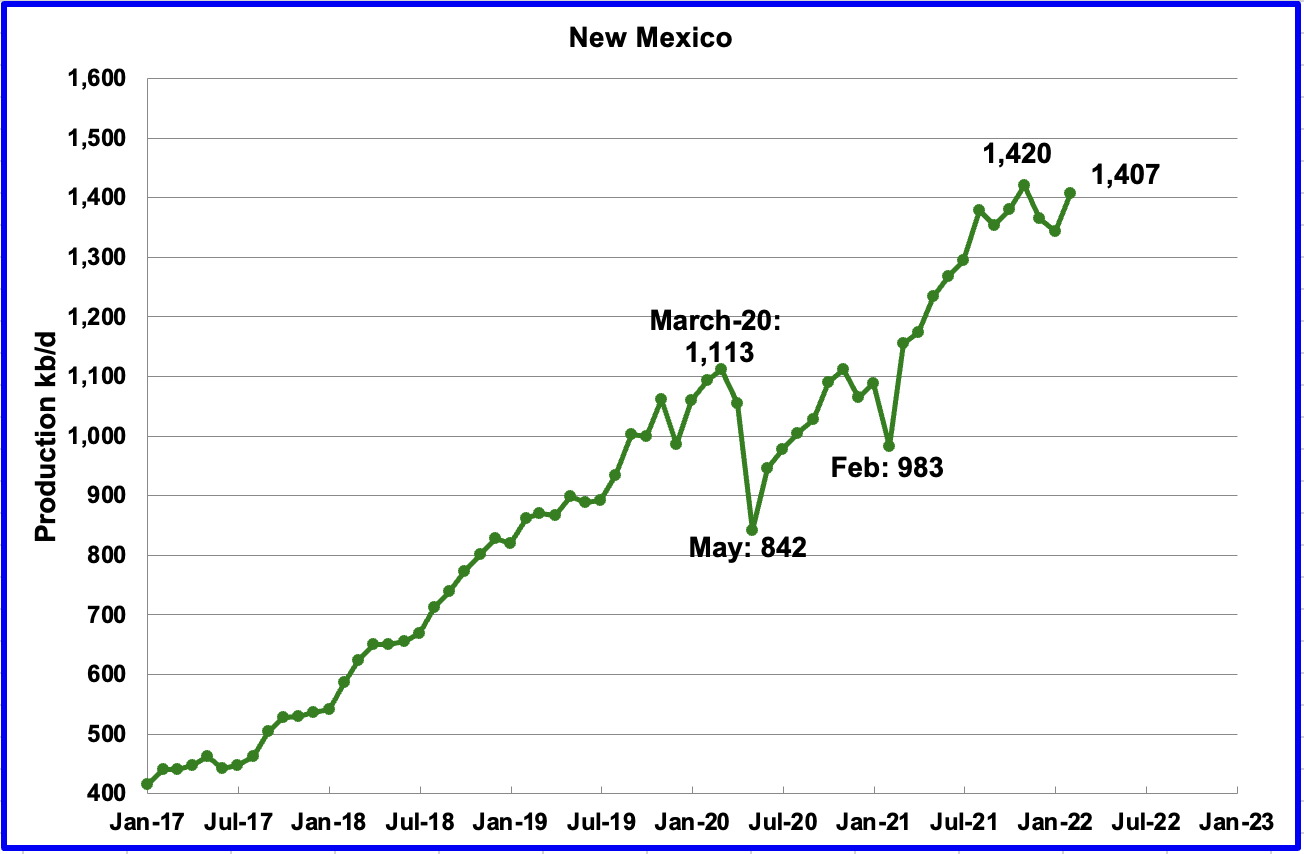
February’s New Mexico production increased by 64 kb/d to 1,407 kb/d.
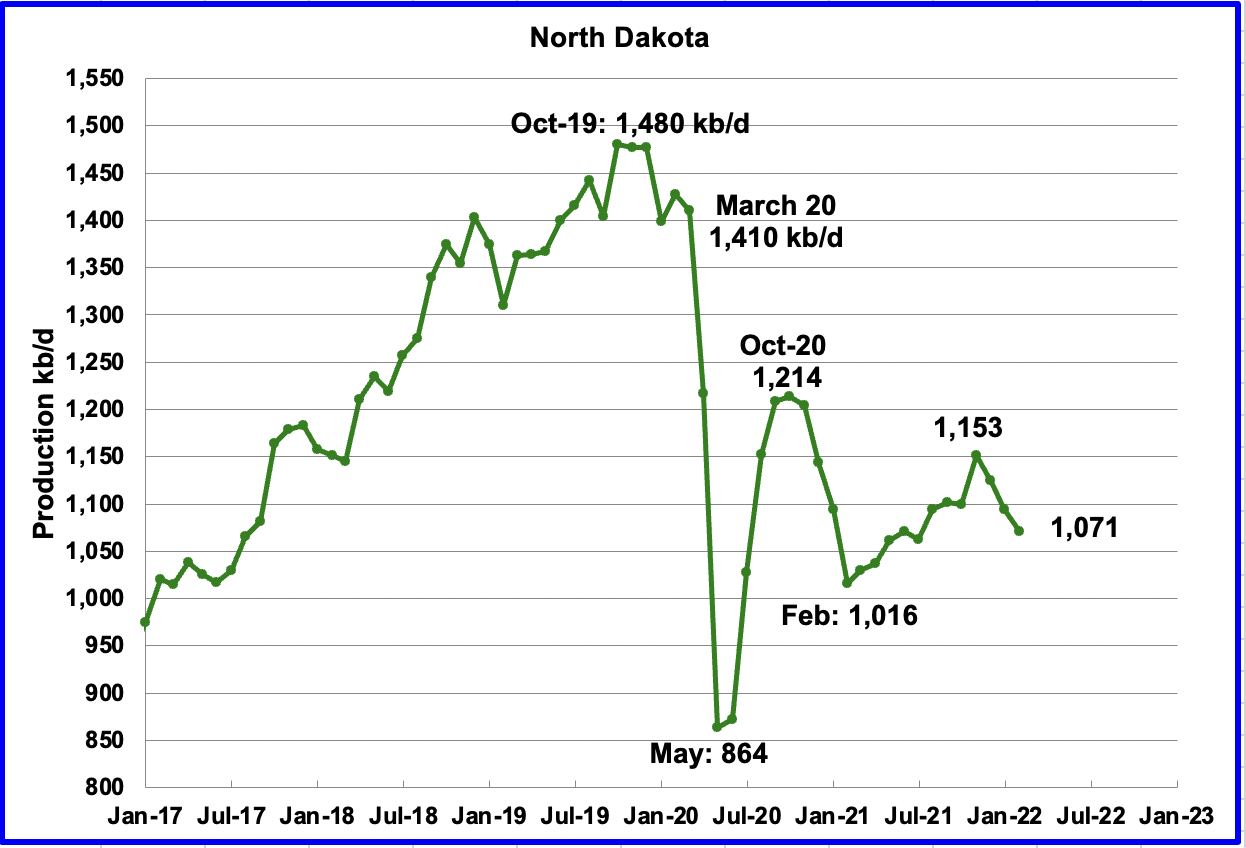
North Dakota’s February output was 1,071 kb/d, a decrease of 23 kb/d from January.
According to this source, ND’s April oil production was hit hard by two winter blizzards.
“State officials say a pair of blizzards that smacked North Dakota in April caused a dramatic reduction in oil production. The Bismarck Tribune reported that State Mineral Resources Director Lynn Helms provided state regulators updated production estimates Friday. He said the state’s oil industry had been producing about 1.1 million barrels daily until the blizzards hit. The first storm began on April 12 and lasted three days. Helms says it caused production to fall to about 750,000 barrels per day. The industry had rebounded to 950,000 barrels per day when the second storm hit on April 23. That blizzard caused production to drop to just 300,000 barrels per day. Production has since increased to about 700,000 barrels per day.”
I made a rough estimate of what North Dakota production could be in April using the above information. The projected production is expected to be close to 860 kb/d, a loss of 240 kb/d.
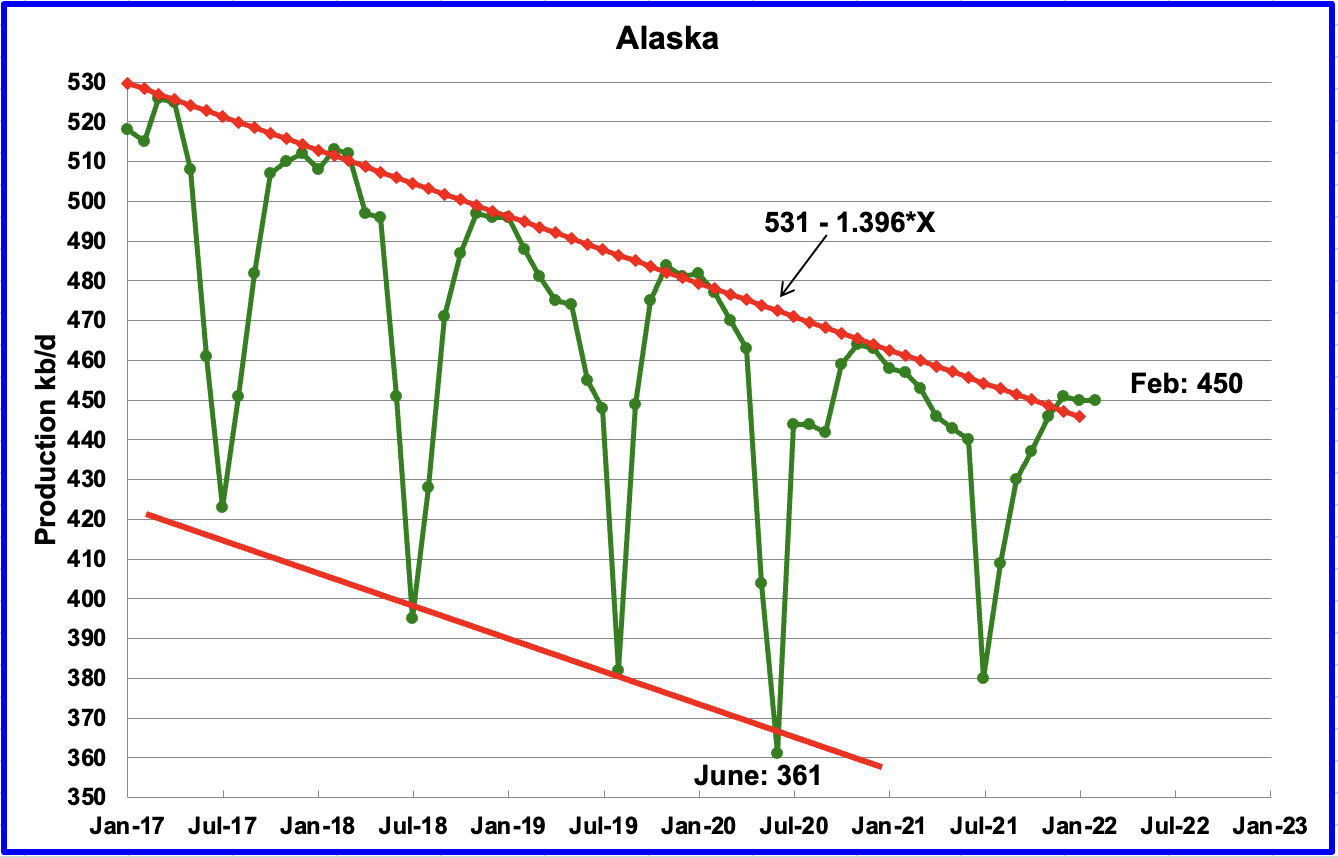
Alaskaʼ s February output was unchanged at 450 kb/d.
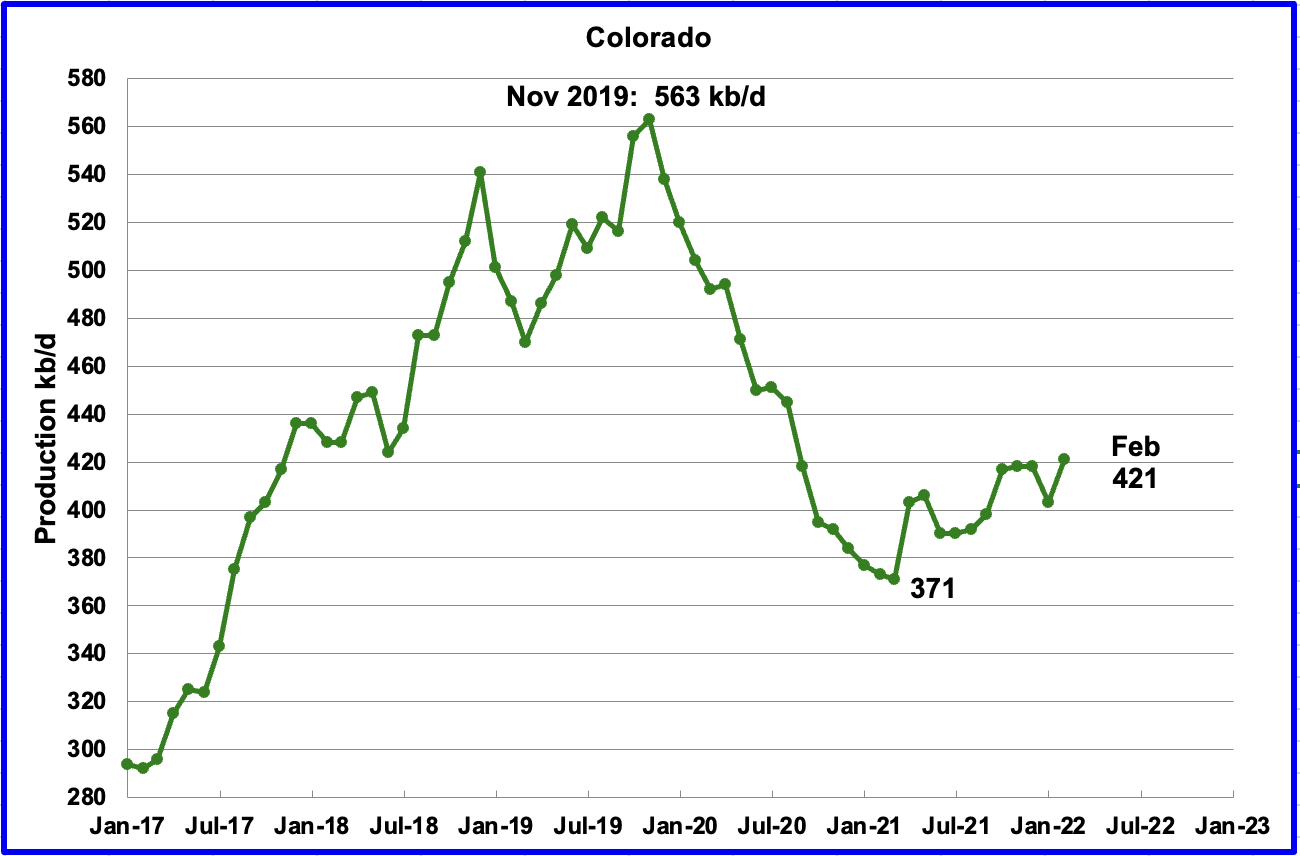
Coloradoʼ s February production increased by 18 kb/d to 421 kb/d. Colorado has had 10 hz oil rigs operating since November and added 2 in late February.
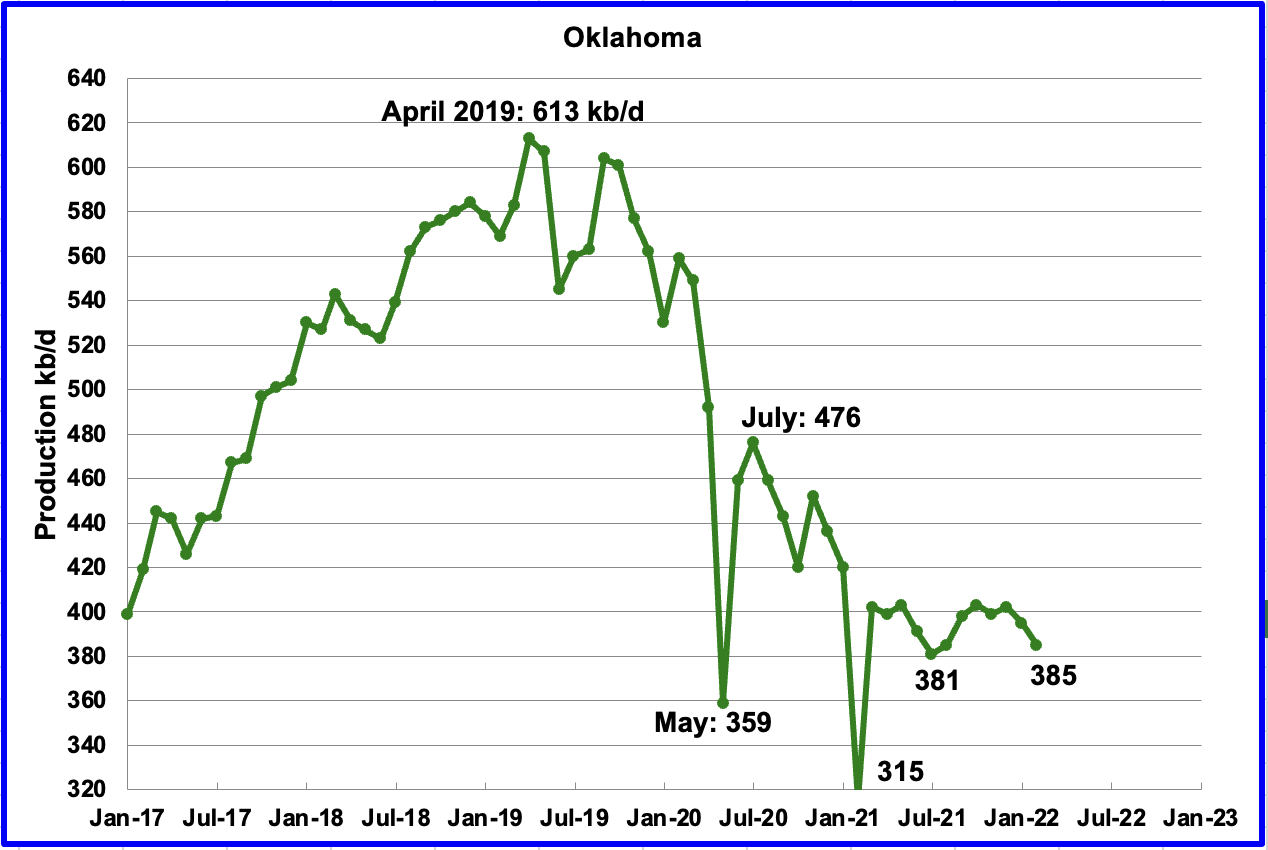
Oklahoma’s output in February decreased by 10 kb/d to 385 kb/d. Its output has remained between 380 kb/d and 400 kb/d since March 2021 even though its rig count increased from 17 in March 2021 to 53 in February.
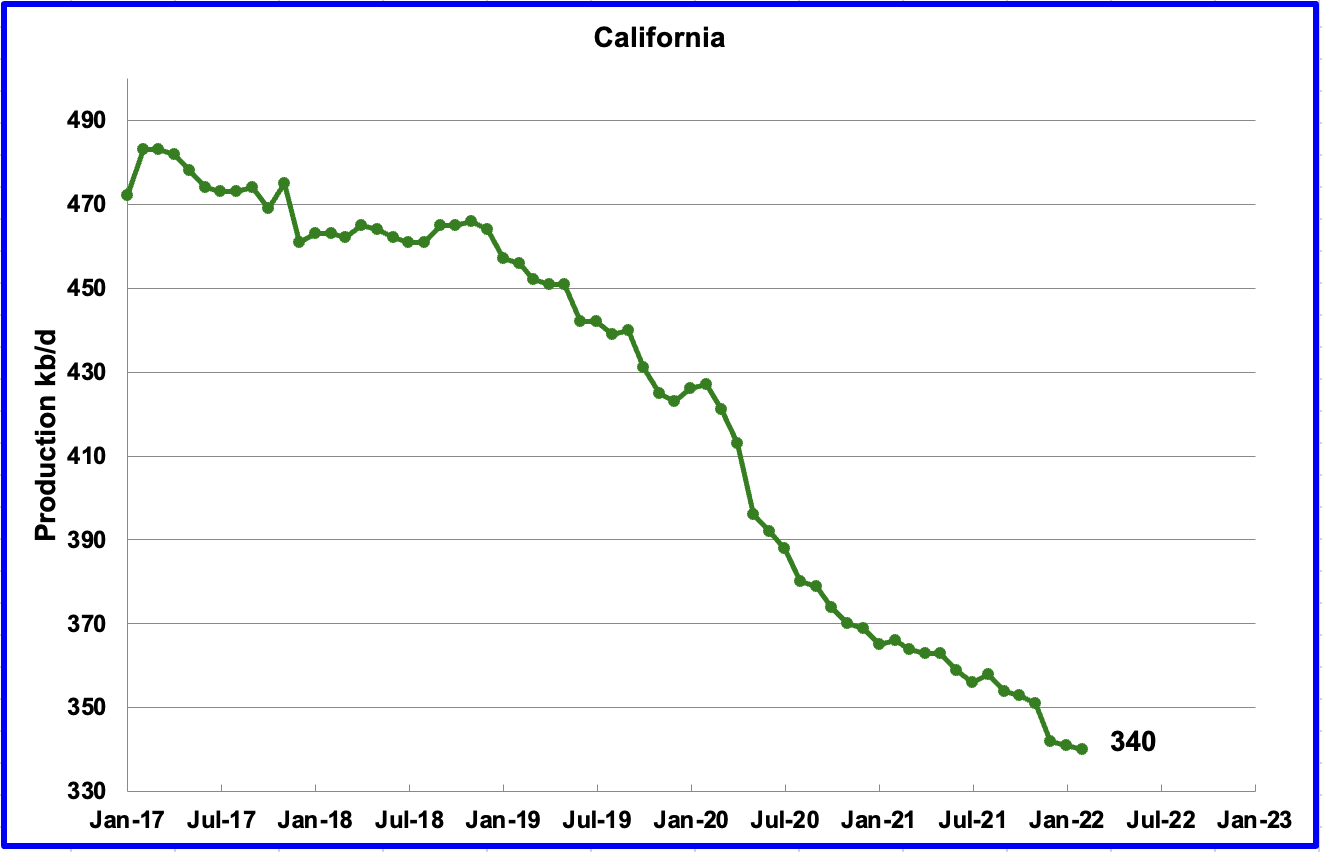
Californiaʼ s slow output decline continued in February. Output decreased by 1 kb/d to 340 kb/d.
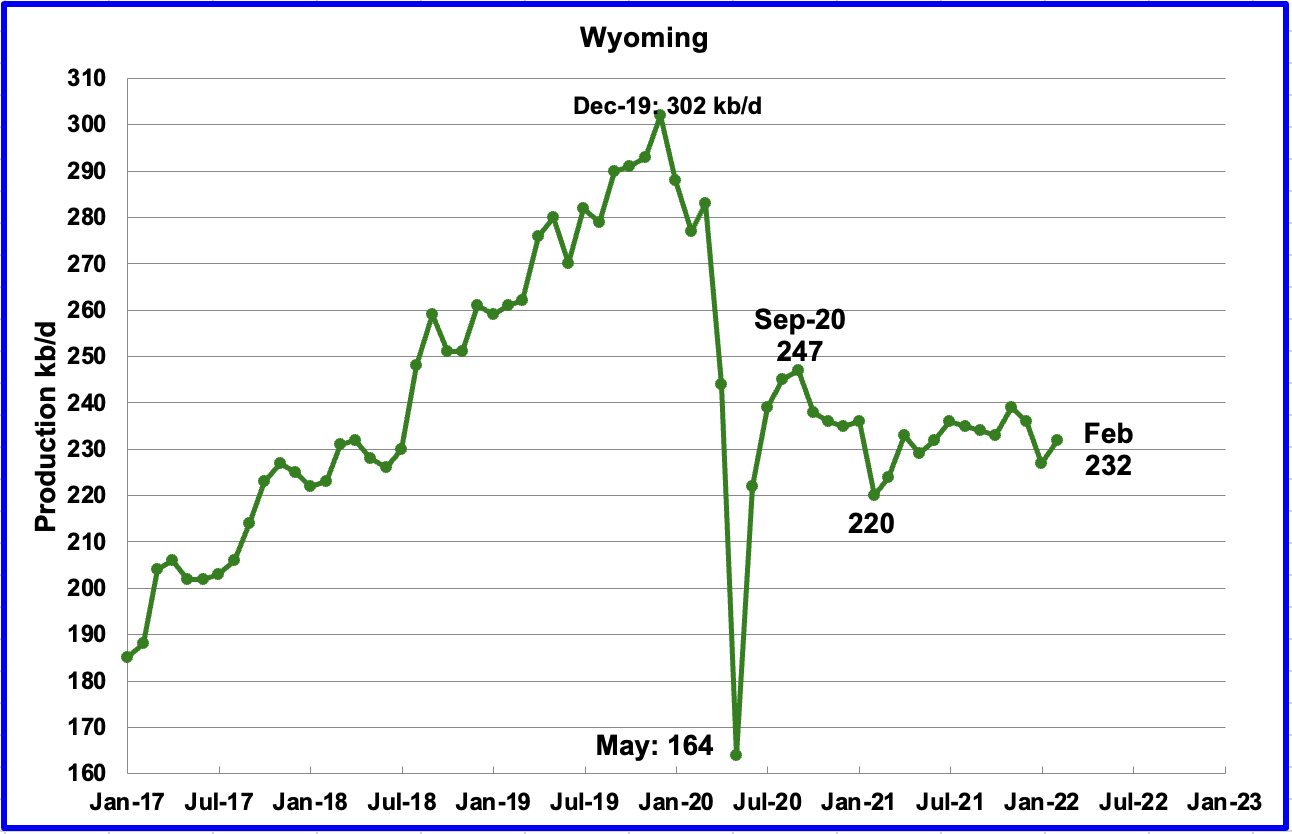
Wyoming’s production has been in a slow unsteady decline since September 2020 when output reached 247 kb/d. In February 2022 output increased by 5 kb/d to 232 kb/d, down 15 kb/d from September 2020.
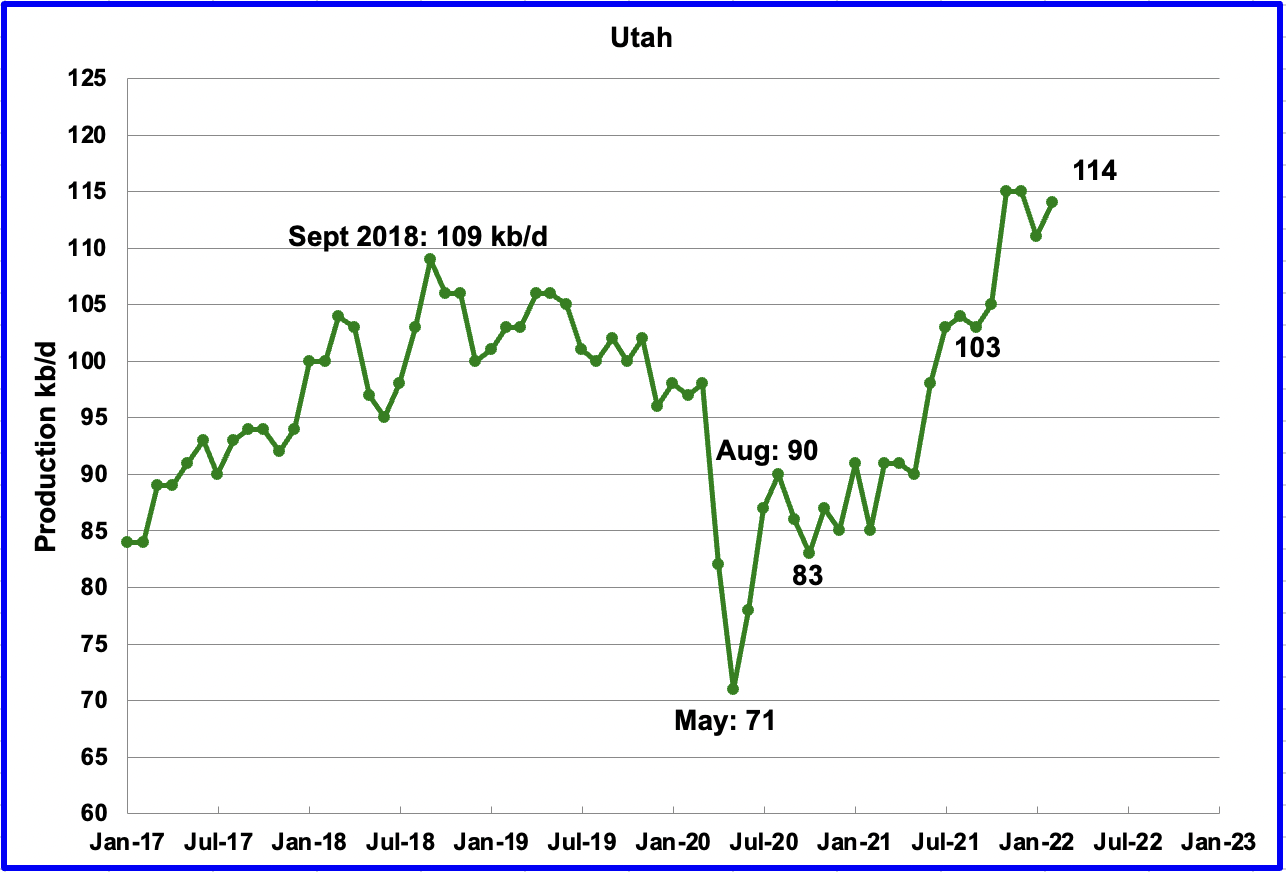
Utah’s production increase from the low of May 2020 appears to have stopped in November 2021. February’s production increased by 3 kb/d to 114 kb/d. However note that the preliminary January output record of 120 kb/d in the April report has been revised down to 111 kb/d in this report.
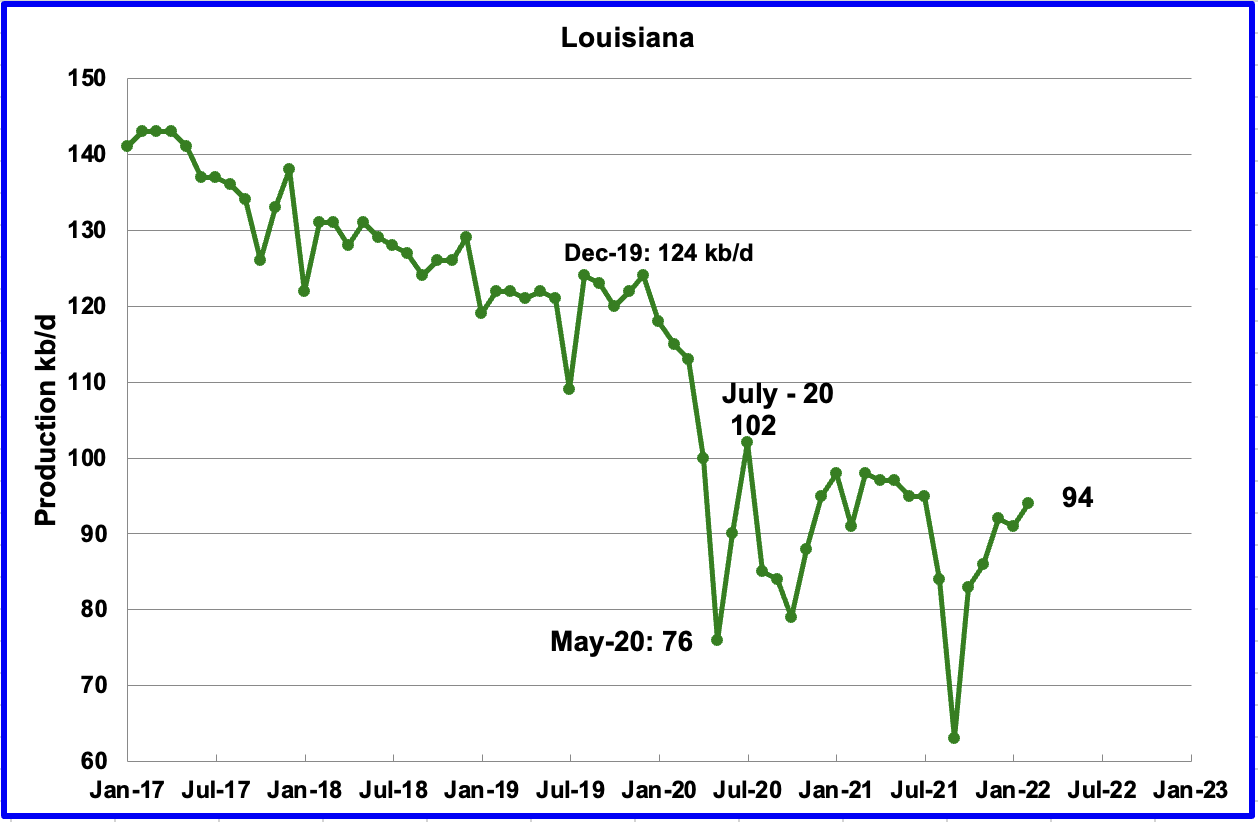
Louisiana’s output increased by 3 kb/d to 94 kb/d in February. Louisiana was one of the hardest hit states by hurricane Ida in late August. February’s output increase indicates that Louisiana’s slow recovery is continuing.
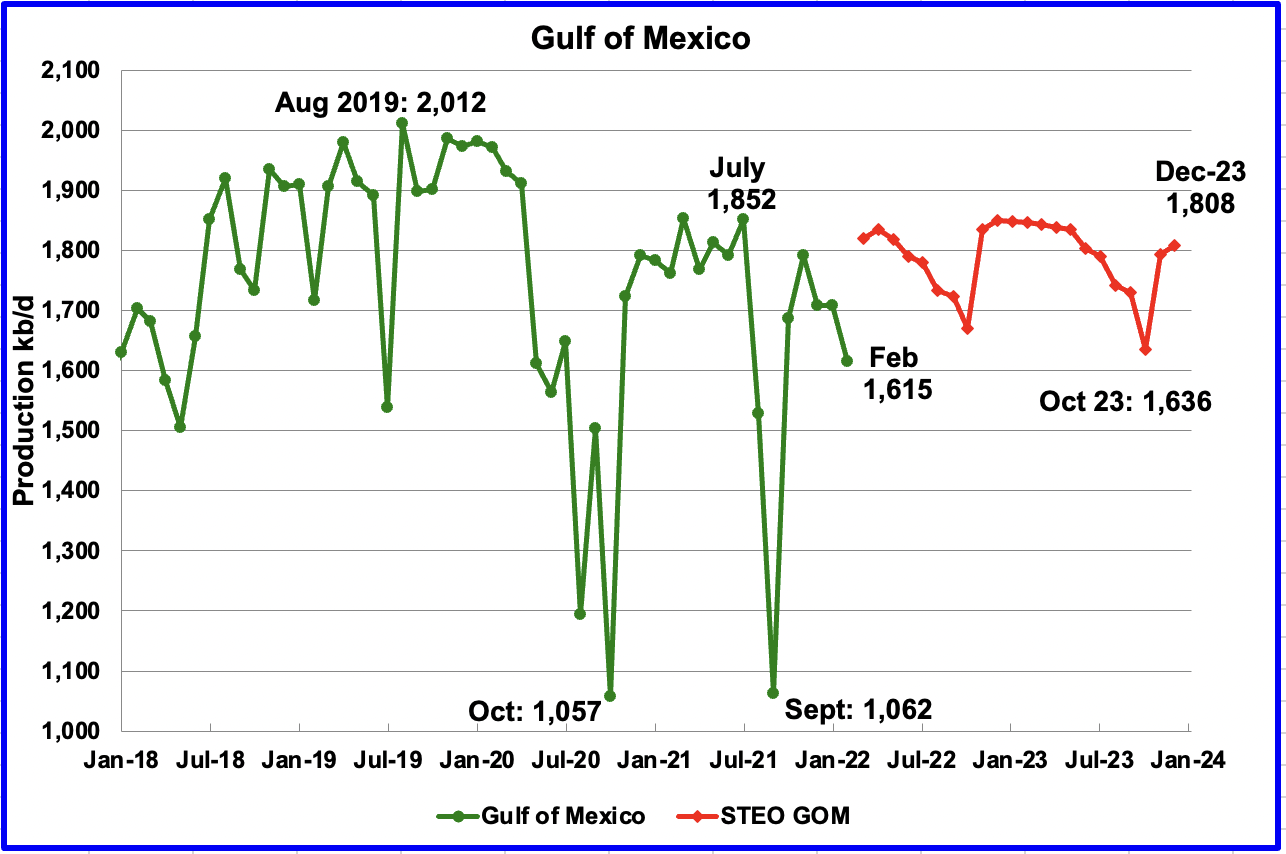
GOM production took a sharp drop in December 2021 and continued to February. Since November it has dropped by 176 kb/d from 1,791 kb/d to 1,615 kb/d in February. February’s drop was 93 kb/d. If the GOM was a state, its production would normally rank second behind Texas.
The April 2022 STEO projection for the GOM output has been added to this chart and projects output will be 1,808 kb/d in December 2023. This is 42 kb/d lower than projected in the March report and 204 kb/d lower than the high of 2,012 kb/d in August 2019. For March, the STEO is projecting a 205 kb/d increase to 1,820 kb/d.
A Different Perspective on US Oil Production
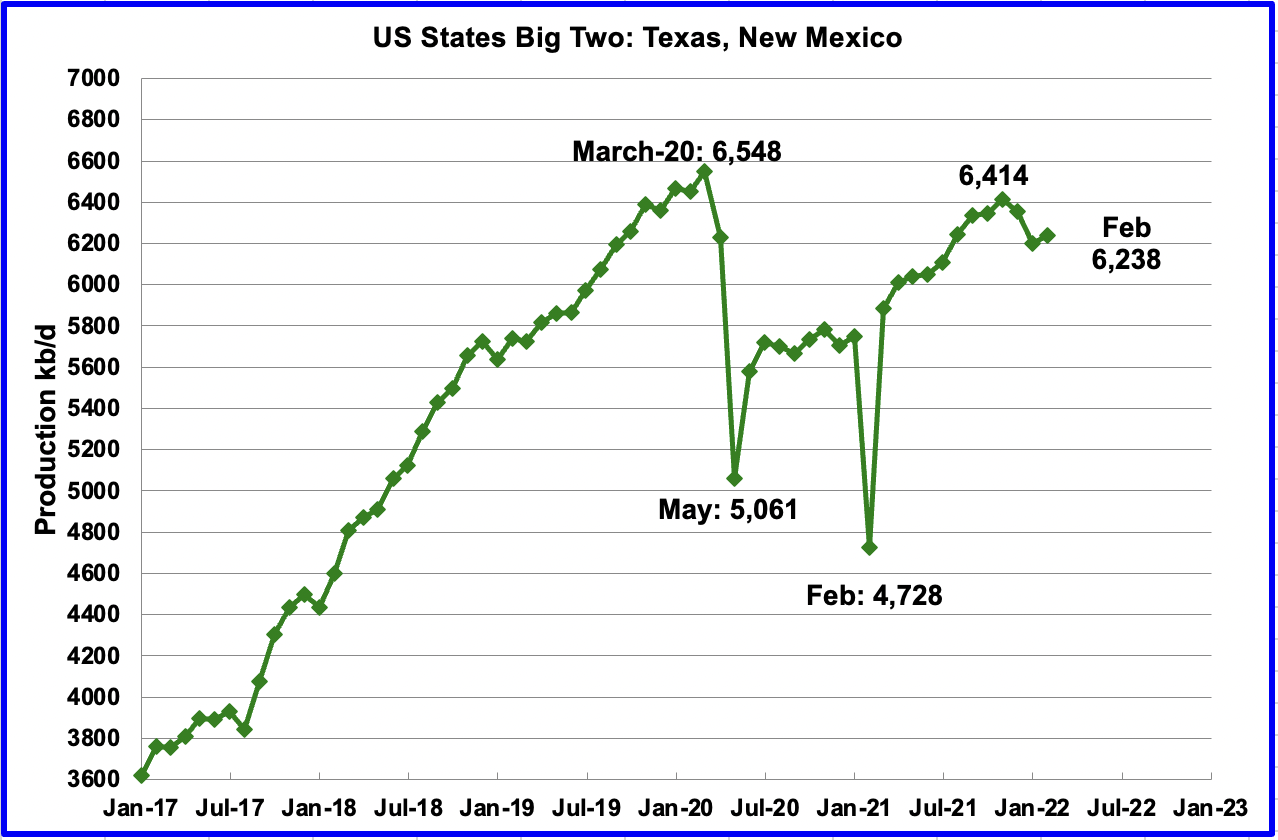
The Big Two states, combined oil output for Texas and New Mexico.
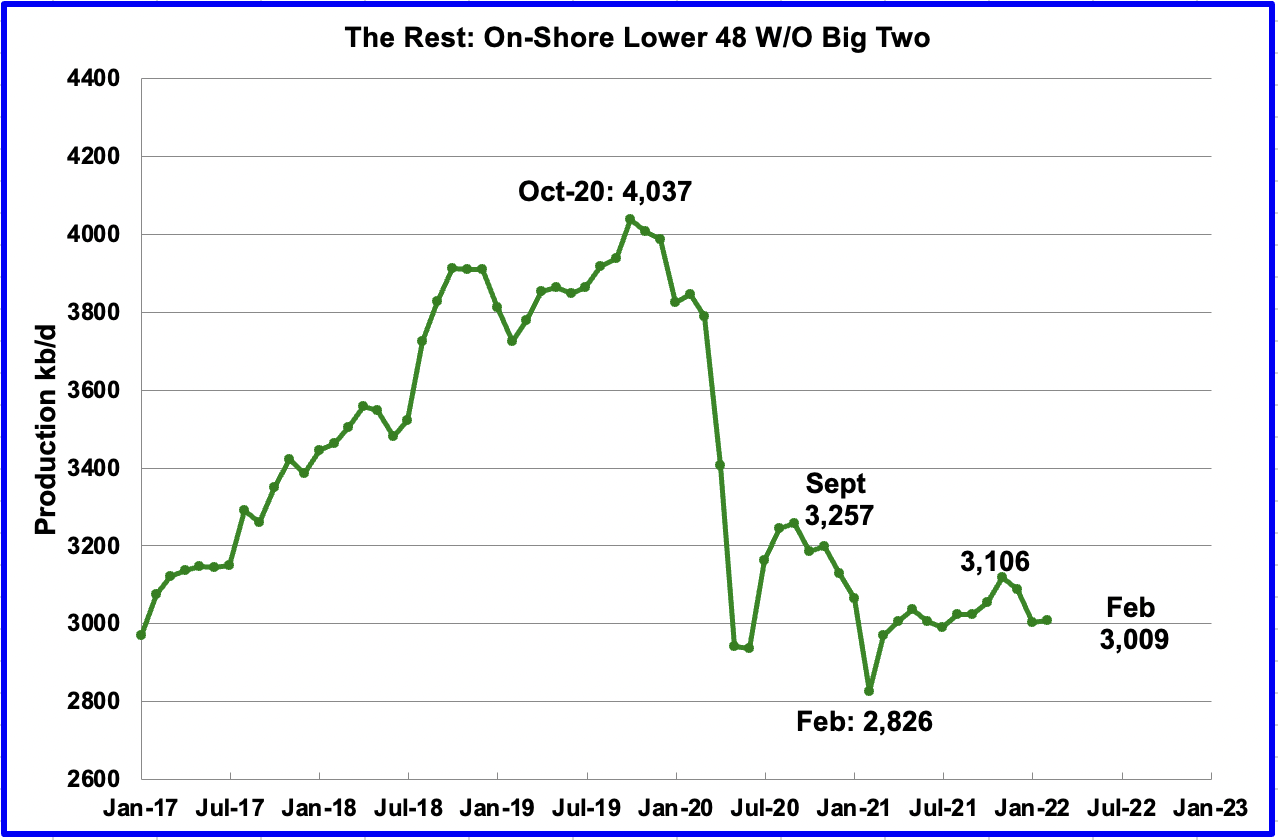
Oil production for The Rest
To get a different perspective on US oil production, the above two charts have broken US state production into two groups, “The Big Two” and the “On-Shore L48 W/O Big Two” or The Rest.
February production increased in the Big Two states. Output increased by a combined 37 kb/d, with New Mexico adding 64 kb/d and Texas dropping by 27 kb/d. From June 2021 to February 2022, production has increased by 658 kb/d or on average 32.9 kb/d/mth.
Over the last year, the Rest appear to be holding steady at close to 3,000 kb/d.
Rigs and Fracs
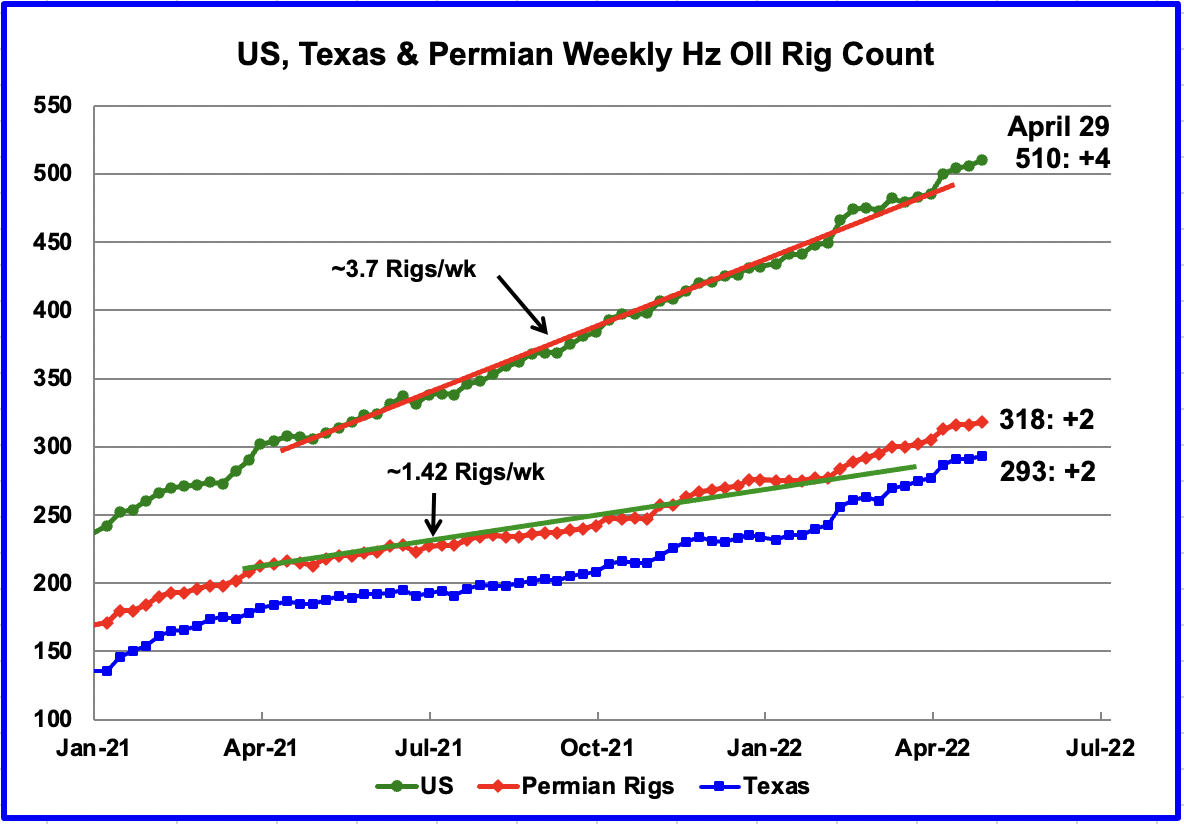
The US total Hz oil rig count for the week ending April 29 was 510, an increase of 4 over the previous week. The latest rig data appears to continue the earlier trend of the addition of 3.7 rigs/wk, on average.
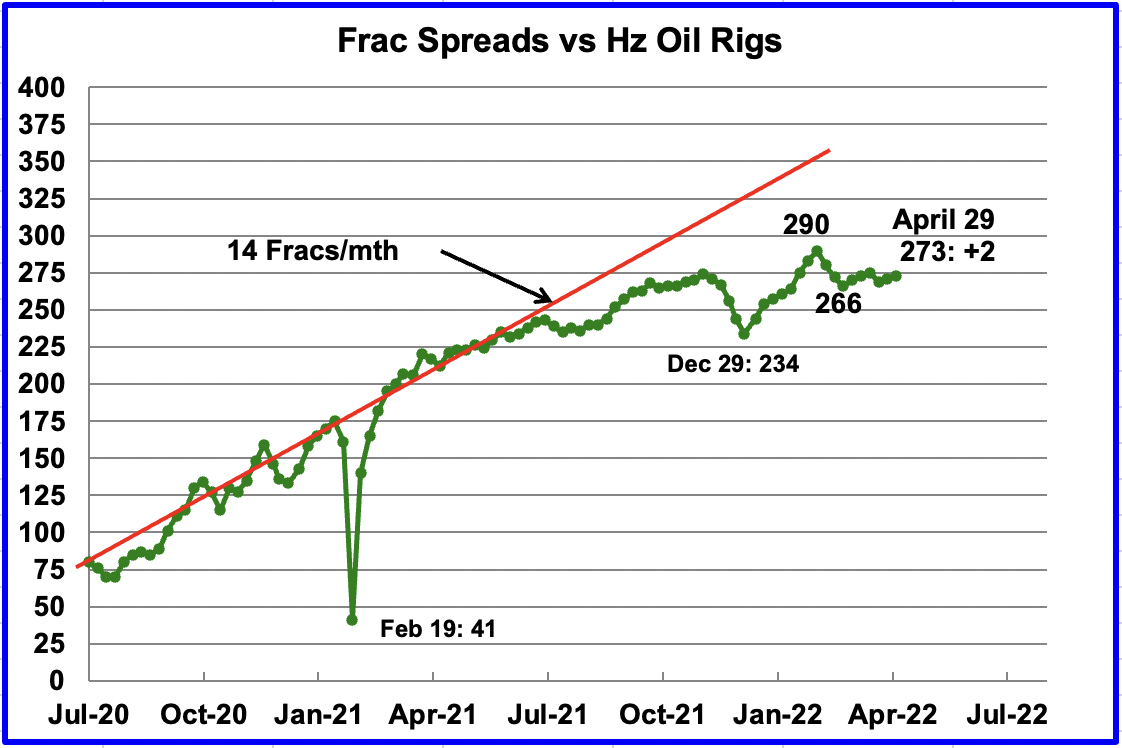
During December 2021, 37 frac spreads were decommissioned primarily due to the holidays and the total dropped to a low of 234 at the end of December. During the month of January, 27 frac spreads were reactivated and in February an additional 29 were added for total of 290.
In the week ending April 29, the frac spread count increased by 2 to 273 and was down 17 from the high of 290 at the end of February. During April, 25 Hz oil rigs were added while the Frac spread count remained unchanged at 273.
Note that these 273 frac spreads include both gas and oil spreads, whereas the rigs information is strictly Hz oil rigs.
WTI
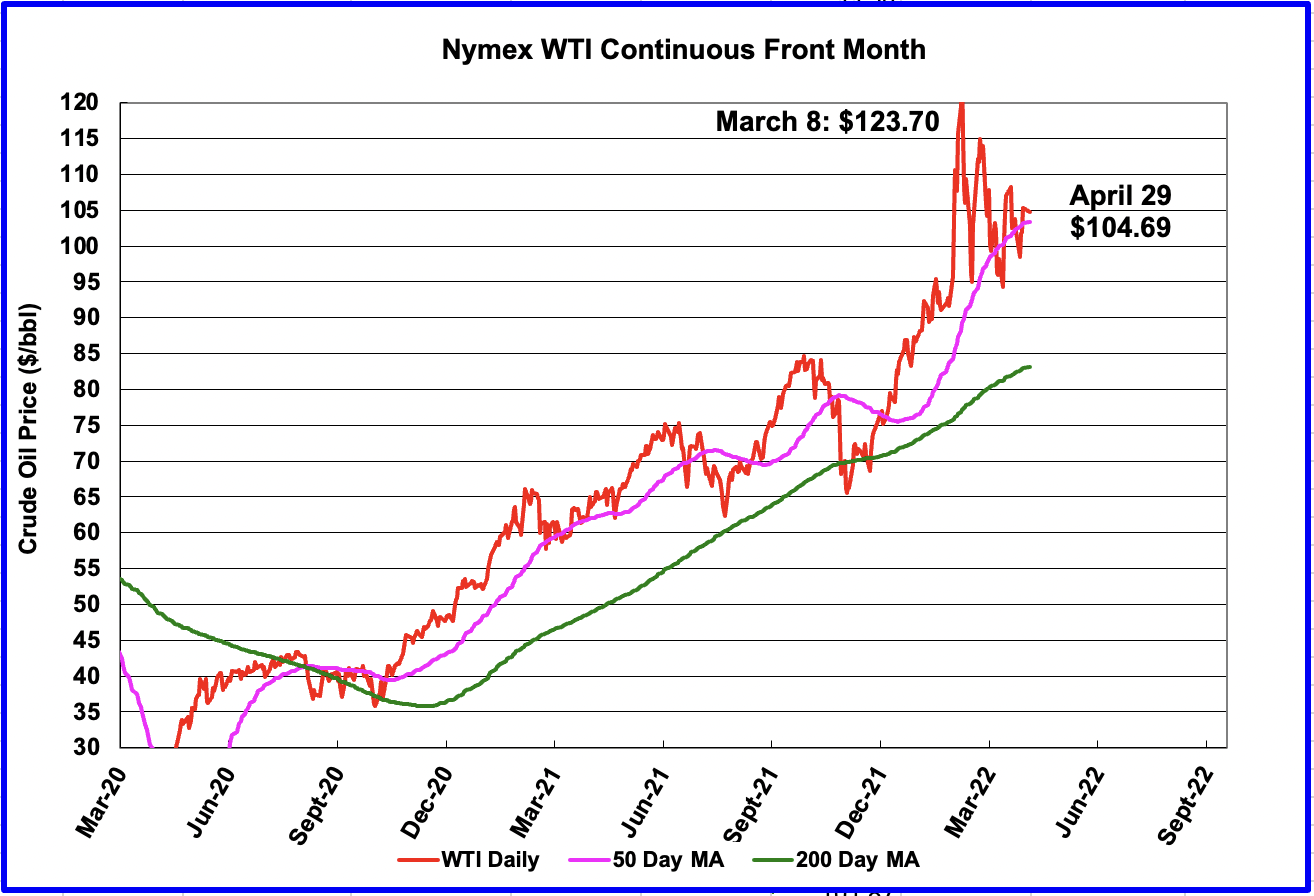
The WTI June contract settled on April 29 at $104.69/bbl. The price has been bouncing around $100/b for the past few weeks due to the release of SPR crude and Beijing lockdowns, offset by supply concerns.
1) Short Term Energy Outlook (STEO)
The April 2022 STEO provides projections for the next 23 months, starting with February 2022 to December 2023, for US C + C, OPEC and other oil production related parameters of interest.
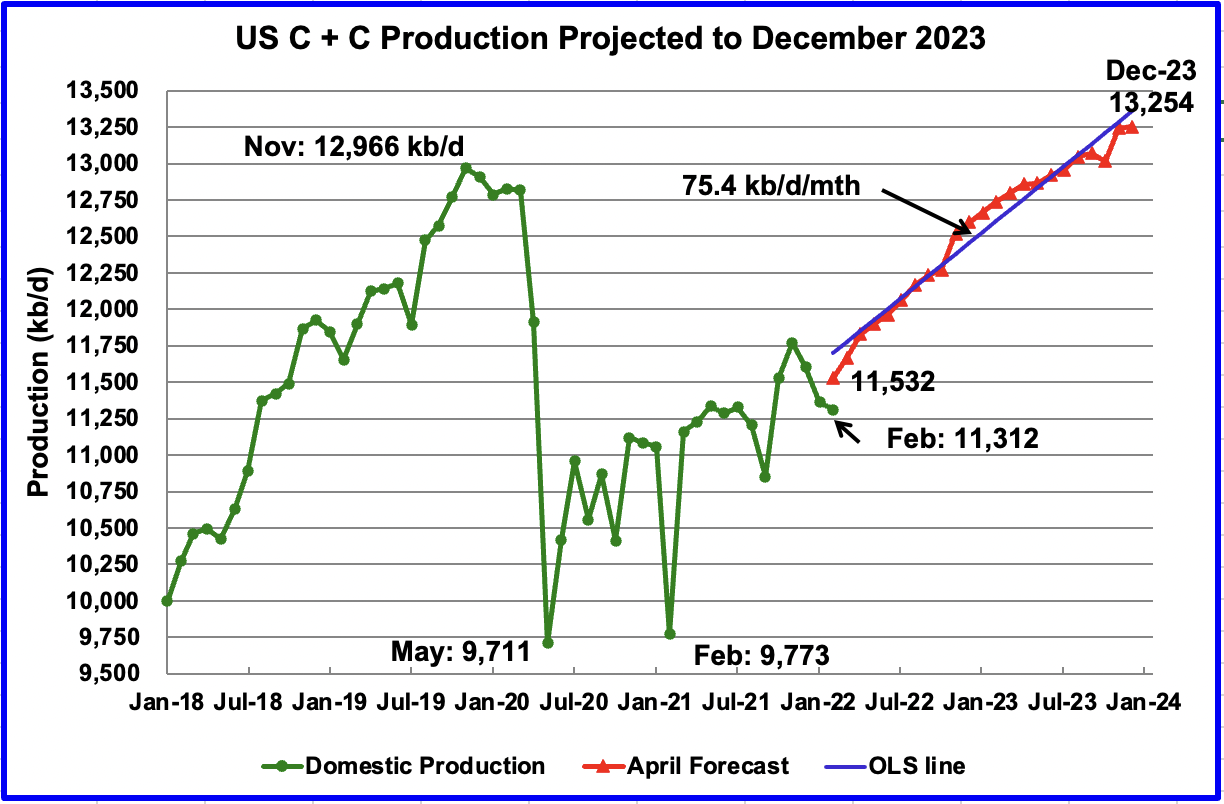
The April 2022 STEO has revised downward its projected US oil output from February 2022 to December 2023. December 2023 has been revised down by 88 kb/d from the previous March 2022 STEO. In December 2023 output is expected to reach 13, 254 kb/d. Output does not exceed the previous peak of 12,966 kb/d till late 2023.
Using only the projected data and fitting an OLS line through the February 2022 to December 2023 data, the STEO is forecasting production will increase at an average rate of 75.4 kb/d/mth, down from the average rate of 79.0 kb/d/mth in the March report. If the December 2023 output is achieved, it will be 288 kb/d higher than the November 2019 record.
Note the discrepancy of 220 kb/d between the actual February US oil production of 11,312 kb/d vs the STEO forecast of 11,532 kb/d.
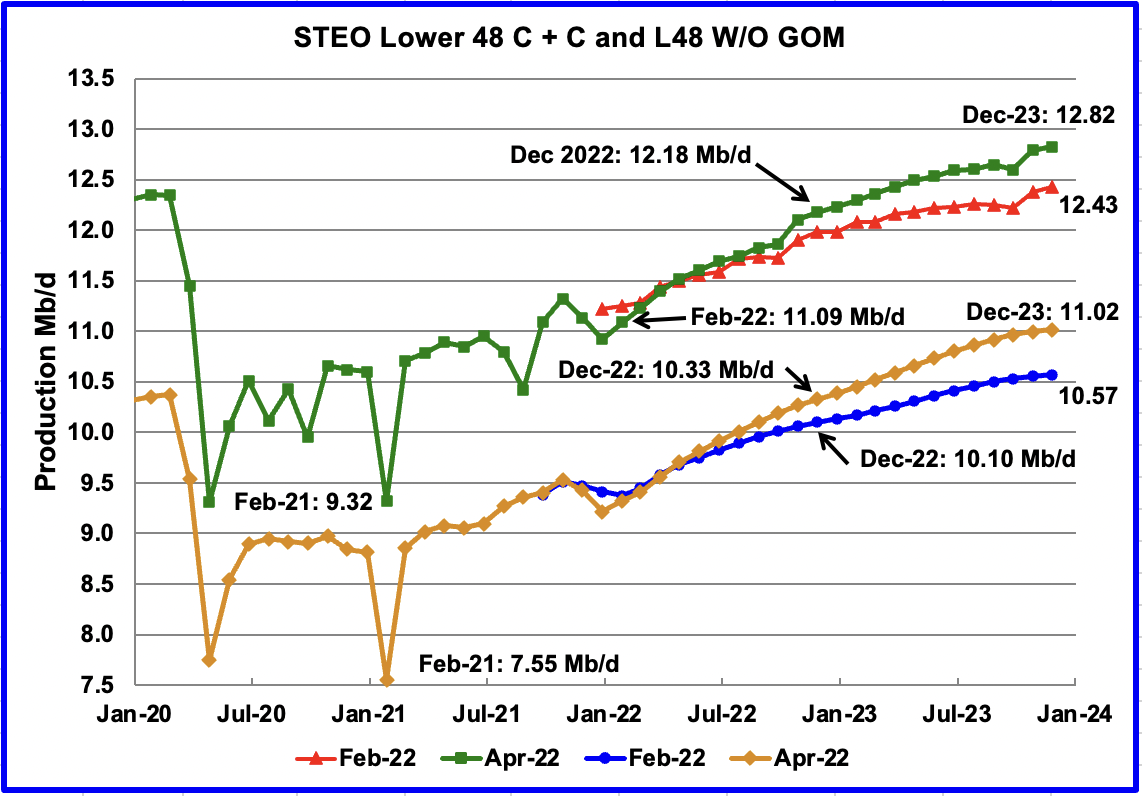
This chart compares the STEO’s forecast for the L48 states from the February report with the current April 2022 report to better illustrate changes in the EIA’s forecast. For the Lower 48, the December 2023 output has been revised downward by a modest 100 kb/d compared to the March increase of 490 kb/d.
The April STEO output projection for the Onshore L48 states has also been revised down to show decreased production in 2022 and in 2023. The output projection for December 2023 has been decreased by 50 kb/d to 11.02 Mb/d from the previous forecast of 11.07 Mb/d.
From the orange graph, one can notice a definite slowing in the production rate in the later half of 2023. Is this a hint of possible further slowing in monthly production increases in the Onshore L48 beyond 2023?
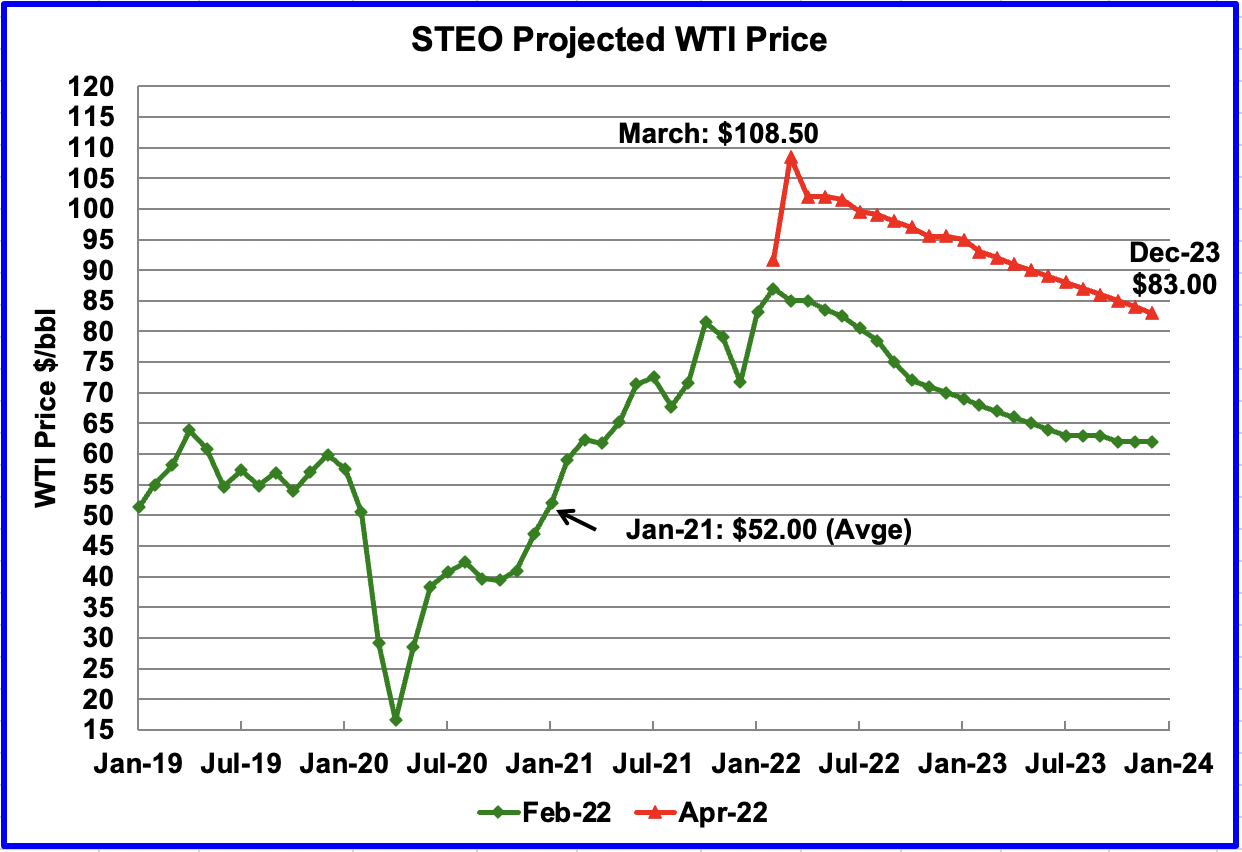
The April 2022 STEO oil price forecast continues to show a steady decline from the EIA’s new March peak of $108.50/bbl to $83/bbl in December 2023. Essentially the EIA is continuing to forecast that the only direction for the price of WTI going forward is down to $83/bbl. However it should be noted that the December 2023 price has been increased over the last 3 months. In the January 2022 report, the December 2023 price was projected to be $62/bbl.
The June contract settled at $104.69 on April 29, $3.19/bbl higher than the EIA’s forecast of $101.50/bbl average for the June contract.
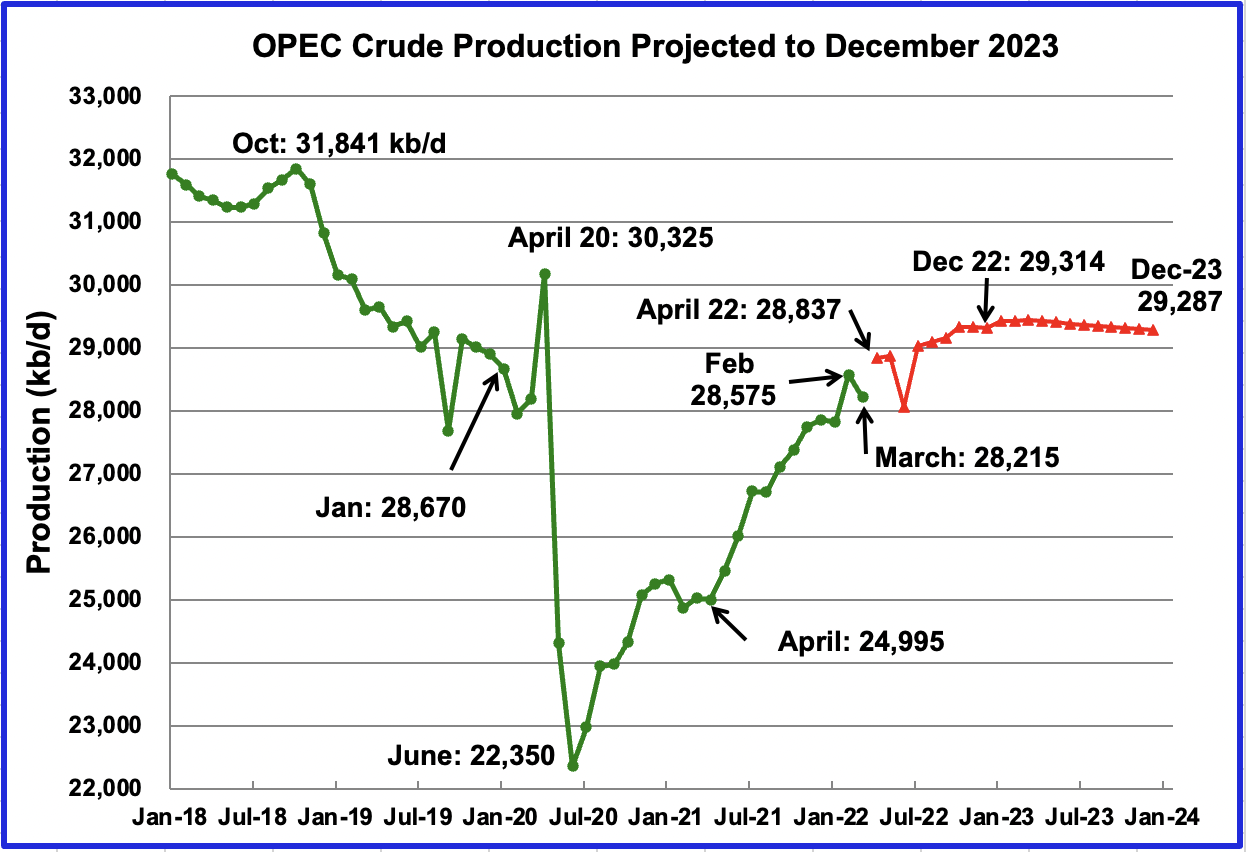
This chart shows the STEO’s April forecast for OPEC crude output from April 2022 to December 2023. OPEC’s output is projected to increase from April 2022 to December 2022 by 477 kb/d to 29,314 kb/d. After December 2022, production remains essentially flat at 29,300 kb/d out to December 2023.
For March 2022, the EIA STEO forecasted OPEC production to be 28,215 kb/d. Actual March production as reported by OPEC was 28,557 kb/d, higher by 342 kb/d. It is not clear why the EIA estimate was so low.
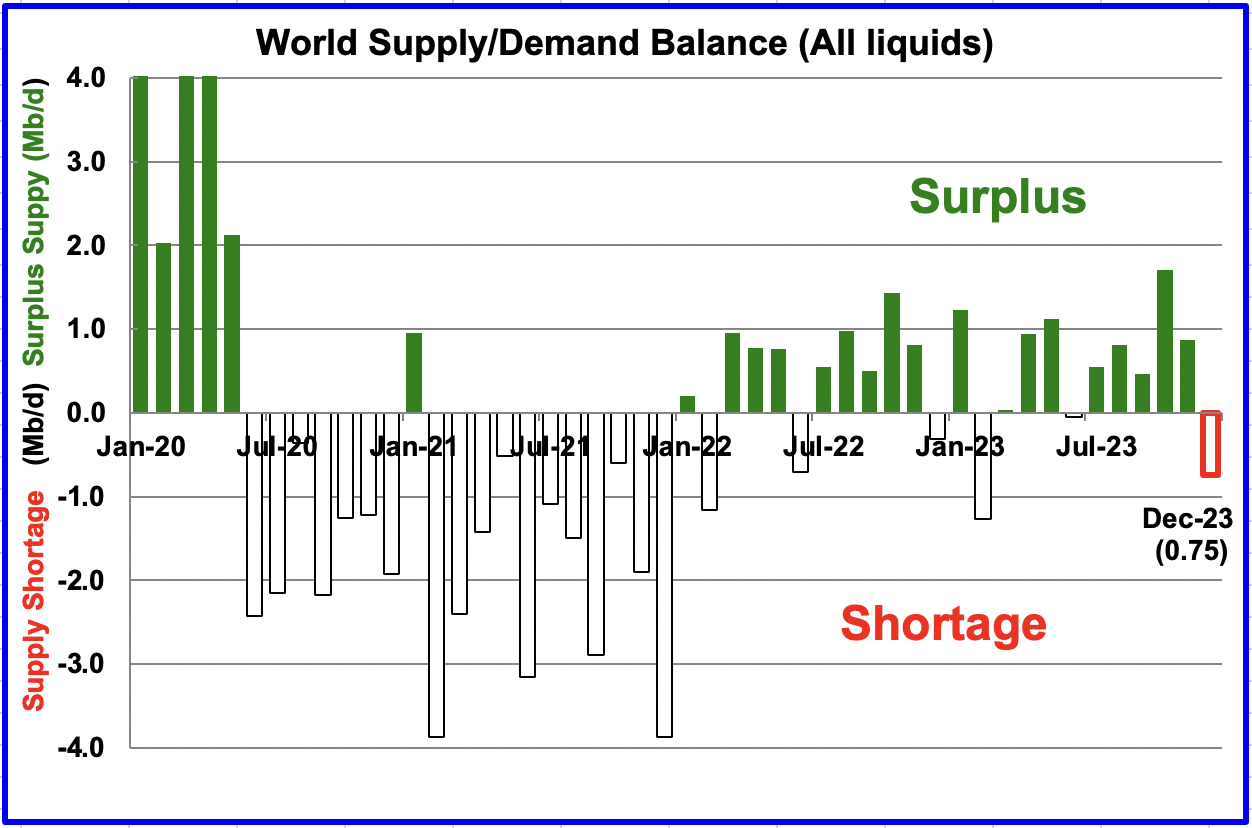
This chart shows the historical world supply/demand balance up to February 2022 and after that, the EIA’s forecast out to December 2023.
From March 2022 to December 2023, the STEO is forecasting an average monthly surplus of close to 518 kb/d. The sanctions on Russian oil and increased prices could see a big revision to this forecast next month.
2) Drilling Productivity Report
The Drilling Productivity Report (DPR) uses recent data on the total number of drilling rigs in operation along with estimates of drilling productivity and estimated changes in production from existing oil wells to provide estimated changes in oil production for the principal tight oil regions. The April DPR forecasts production to May 2022 and the following charts are updated to May 2022.
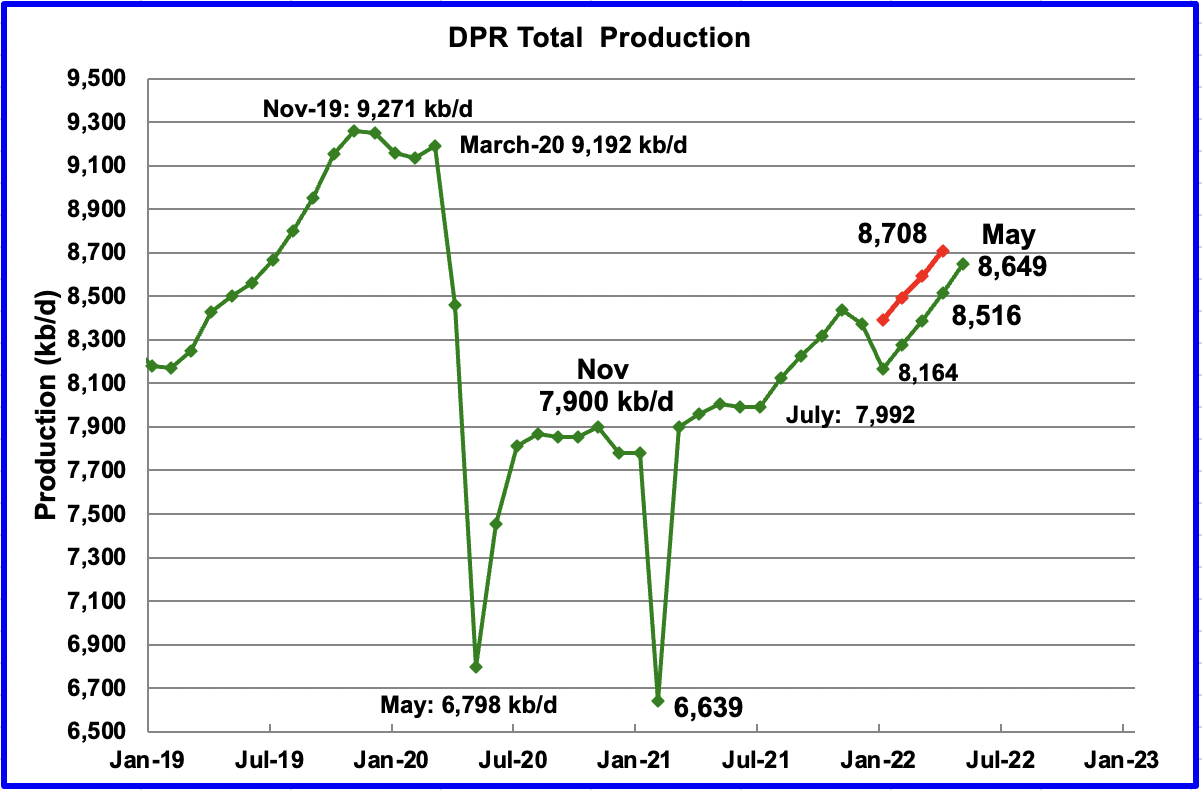
Above is the total oil production projected to May 2022 for the 7 DPR basins that the EIA tracks. Note that DPR production includes both LTO oil and oil from conventional fields.
After the EIA reported lower than expected US production for December and January, the DPR revised its output forecast down.
The DPR is projecting that output for May 2022 will increase by 133 kb/d to 8,649 kb/d. From January 2022 to May 2022, output in the DPR basins is forecast to increase by 485 kb/d or by an average of 121 kb/d/mth. Note that this monthly production rate is much higher than the STEO rate of 75.4 kb/d projected for all of 2022 in the STEO section above.
Did May production really increase? In the March DPR report, April output was projected to be 8,708 kb/d (Red markers). The current April report revised April output down to 8,516 kb/d and May is now 59 kb/d lower at 8,649 kb/d than last month’s April forecast.
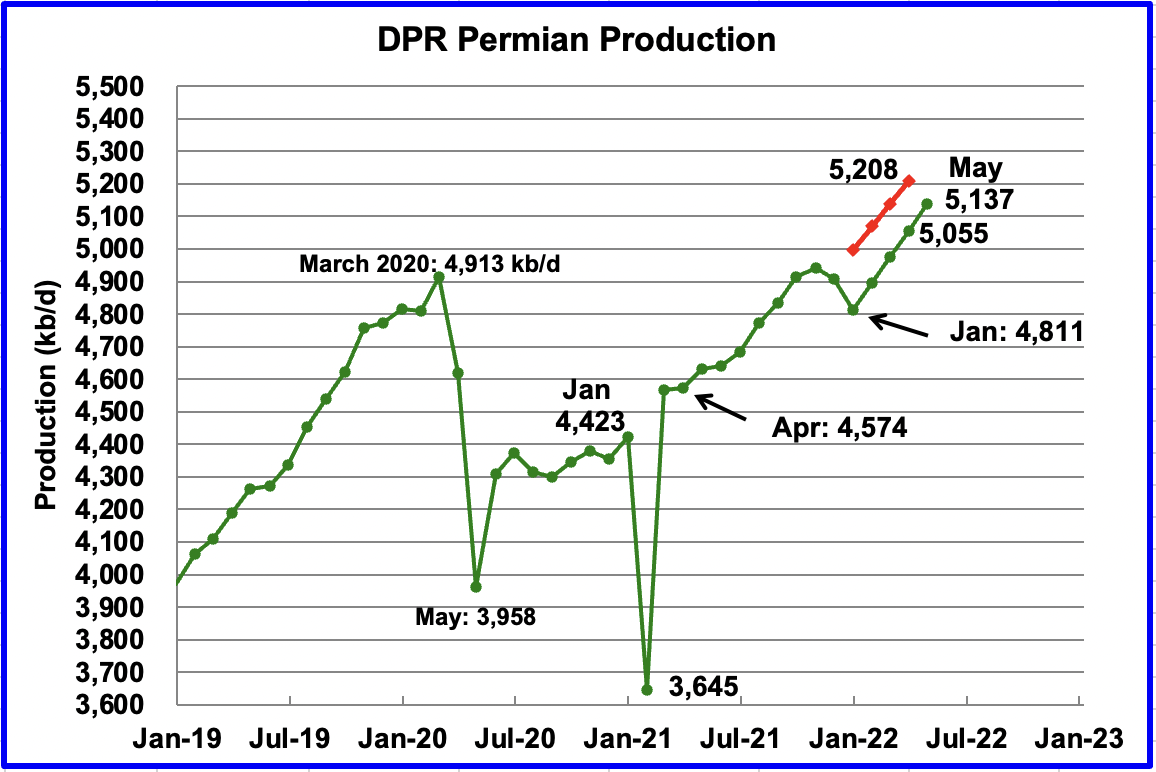
Permian output exceeded 5,000 kb/d in March 2022 and continues to increase. In May, production is expected to increase by 82 kb/d to a new high of 5,137 kb/d. From January to May, production is forecast to increase by 326 kb/d or at an average rate of 81.5 kb/d/mth. If the Permian were part of OPEC, at 5,137 kb/d it would be the second largest producer after Saudi Arabia.
Due to revisions, May’s Permian output is 71 kb/d lower than the DPR’s April’s production forecast of 5,208 kb/d reported in the previous March report. (Red markers). April was revised down by 153 kb/d to 5,208 kb/d from the April report forecast.
During March, 362 wells were drilled and 433 were completed in the Permian. The completed wells added 343 kb/d to March’s output for an average of 792 kb/d/well. The overall decline was 264 kb/d which resulted in a net increase of Permian output of 79 kb/d. Of the 433 completed wells, 333 were required to offset the decline. It is the completion of the additional 100 DUCs, over and above the drilled wells that accounts for the increase in the production in the Permian.
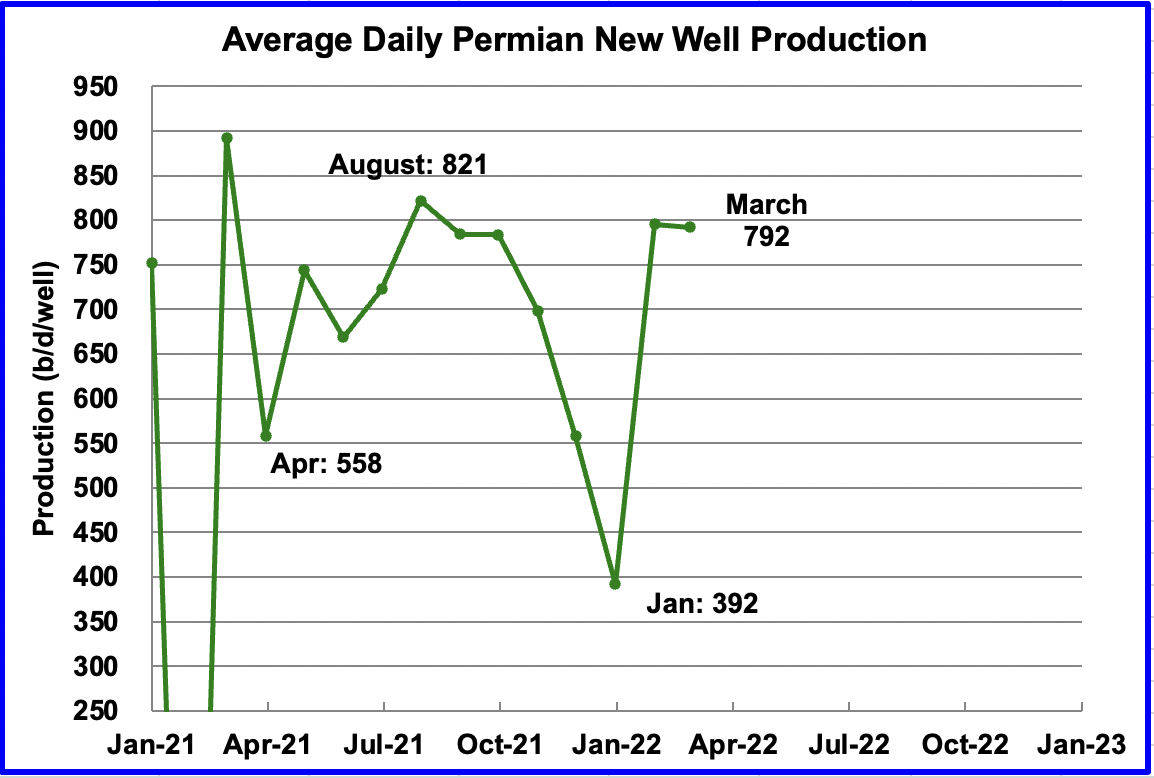
This chart shows the daily production from the average new Permian well tracked on a monthly basis. The daily output for new Permian wells was divided by the number of completed wells, as reported in the DPR and DUC reports.
It appears that the average first month output is close to 800 kb/d. January dropped due to bad weather in Texas. March was essentially unchanged from February at 792 kb/d.
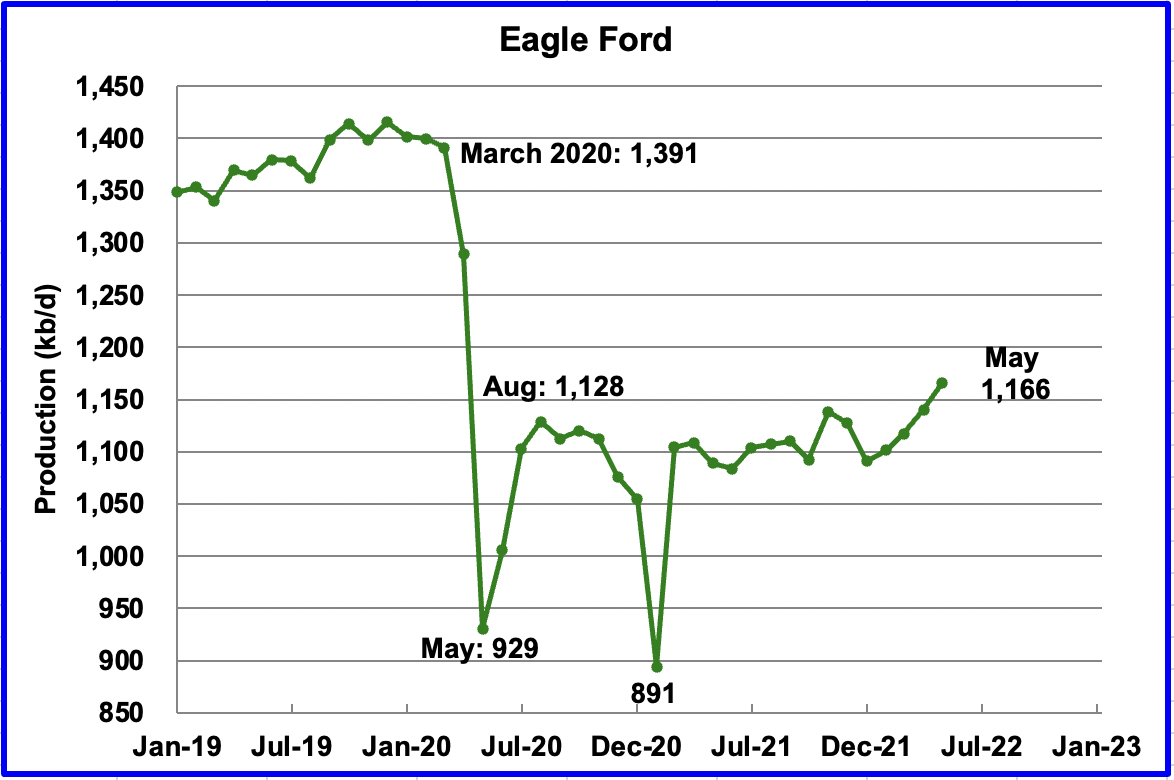
Output in the Eagle Ford basin has been showing an increasing trend since January 2022. For May, output is expected to increase by 26 kb/d to 1,166 kb/d. Since the beginning of the year, 13 rigs have been added up to the end of April for a total of 51, which explains the increasing output.
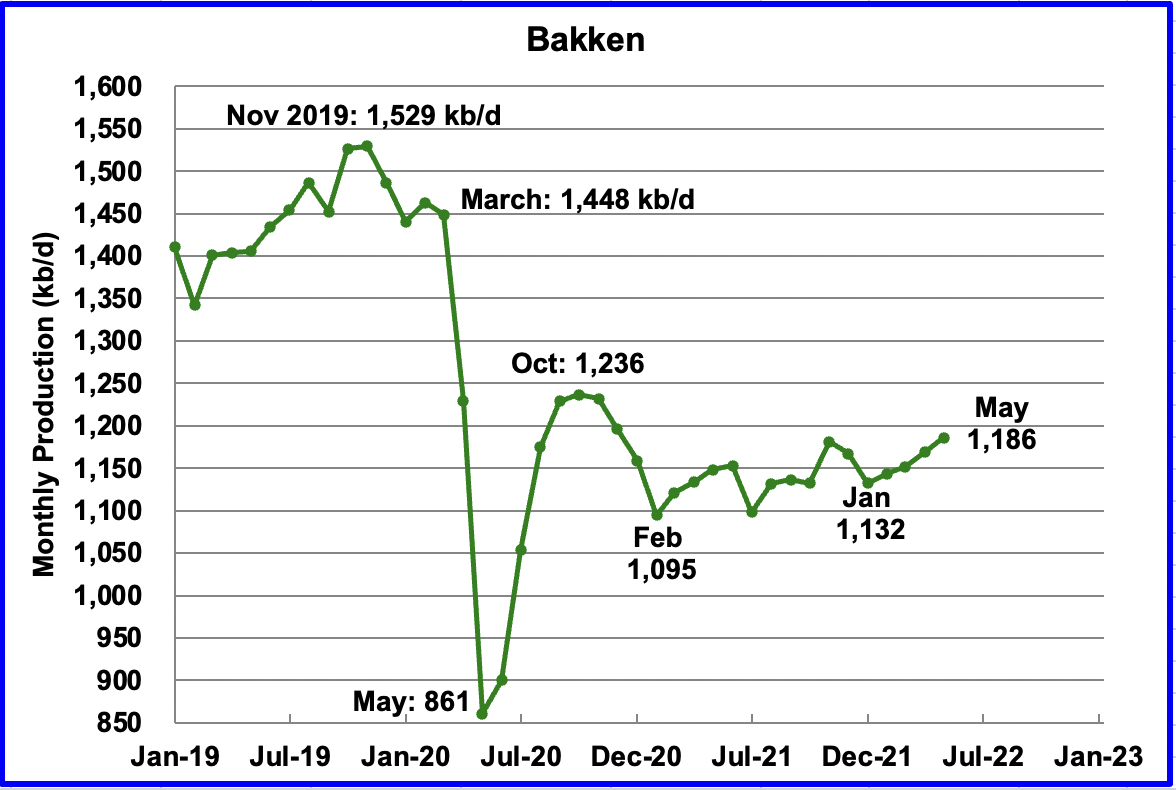
The DPR forecasts Bakken output in May to be 1,186 kb/d an increase of 17 kb/d over April. However after revisions, May production is 2 kb/d lower than was forecast for April in the previous report.
As noted above, April production was hard hit by severe winter weather and this could be reported in the next DPR update.
Output in the Niobrara is now showing signs of starting to plateau at 611 kb/d.
DUCs and Drilled Wells
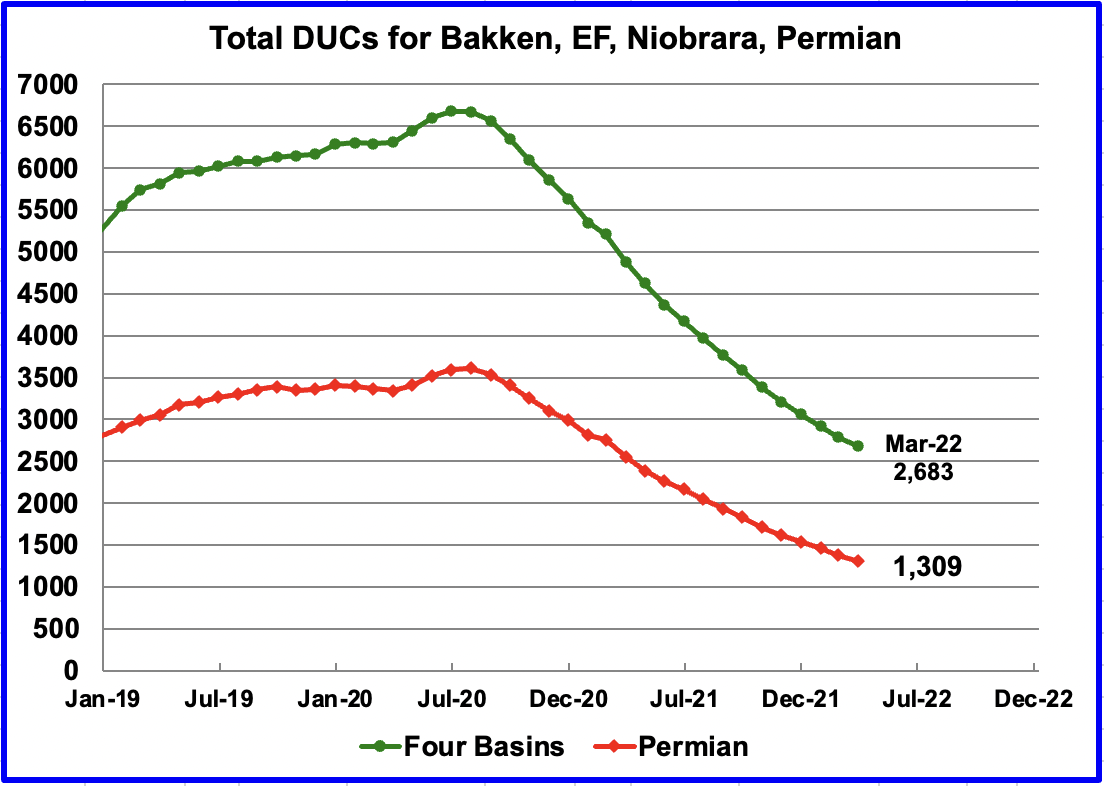
The number of DUCs available for completion has continued to fall every month since July 2020. Prior to July more wells were drilled than were being completed. Note that the current March gap between the two graphs is much smaller than in July 2020.
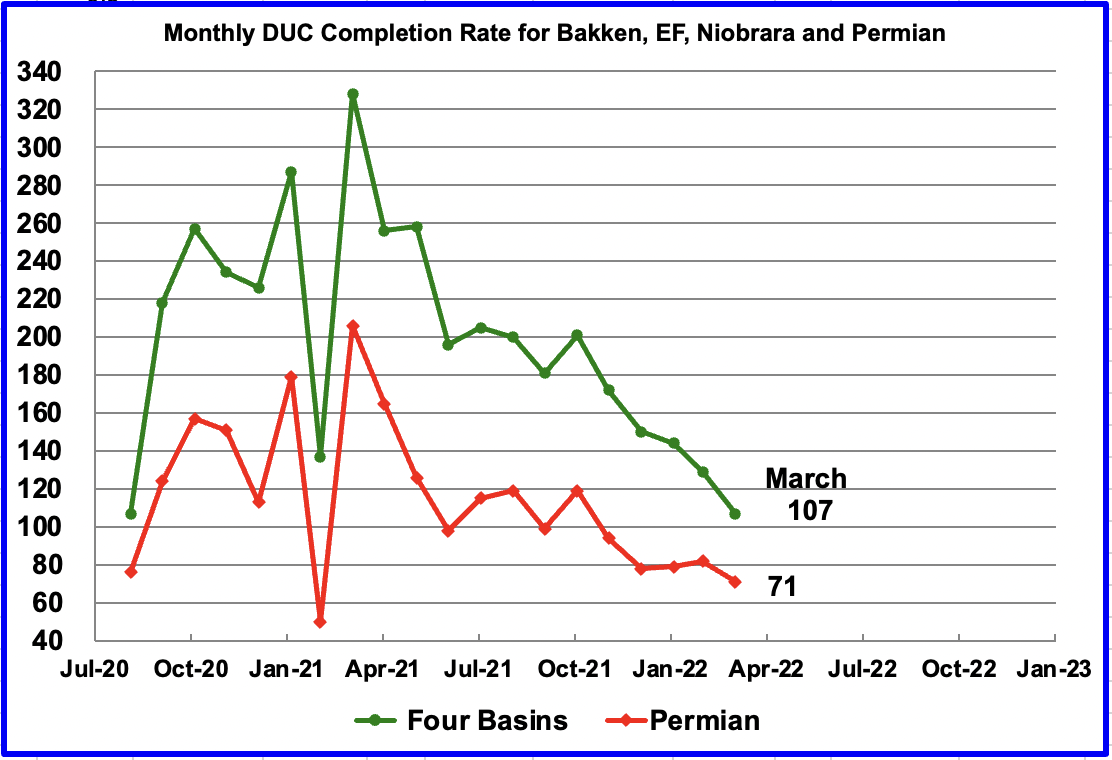
In these four primarily oil basins, the monthly completion rate of DUCs started to slow after peaking in March 2021. For example, in March 2021, 329 DUCs were completed. In March 2022, 107 DUCs were completed. Similarly the monthly completion rate for DUCs the Permian continues to fall.
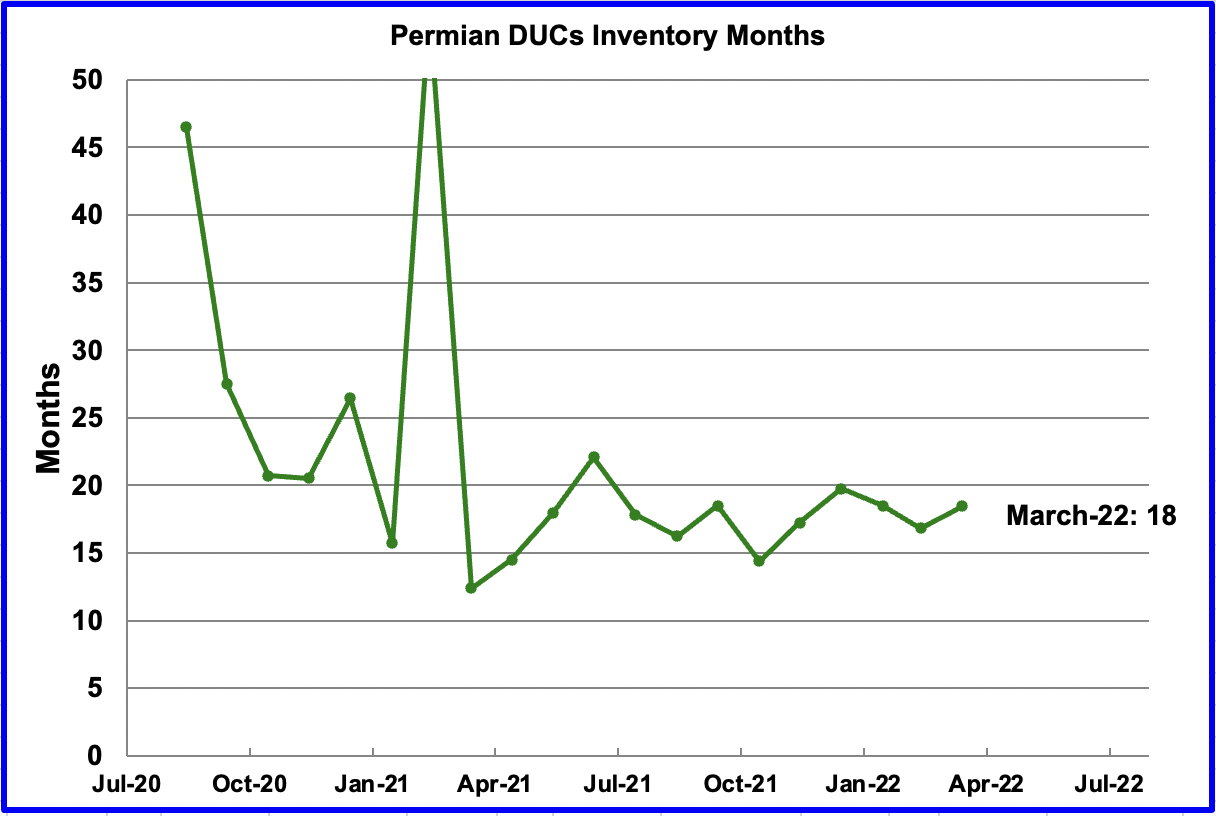
If Permian DUC’s were to be completed at the latest rate of 71 DUCs/mth, that converts into 18 months of DUC inventory, assuming the remaining 1,309 are all commercially viable. Interestingly, this 15 to 20 months supply of DUCs has remained fairly constant since July 2021 as the number of DUC completions continues to drop every month.
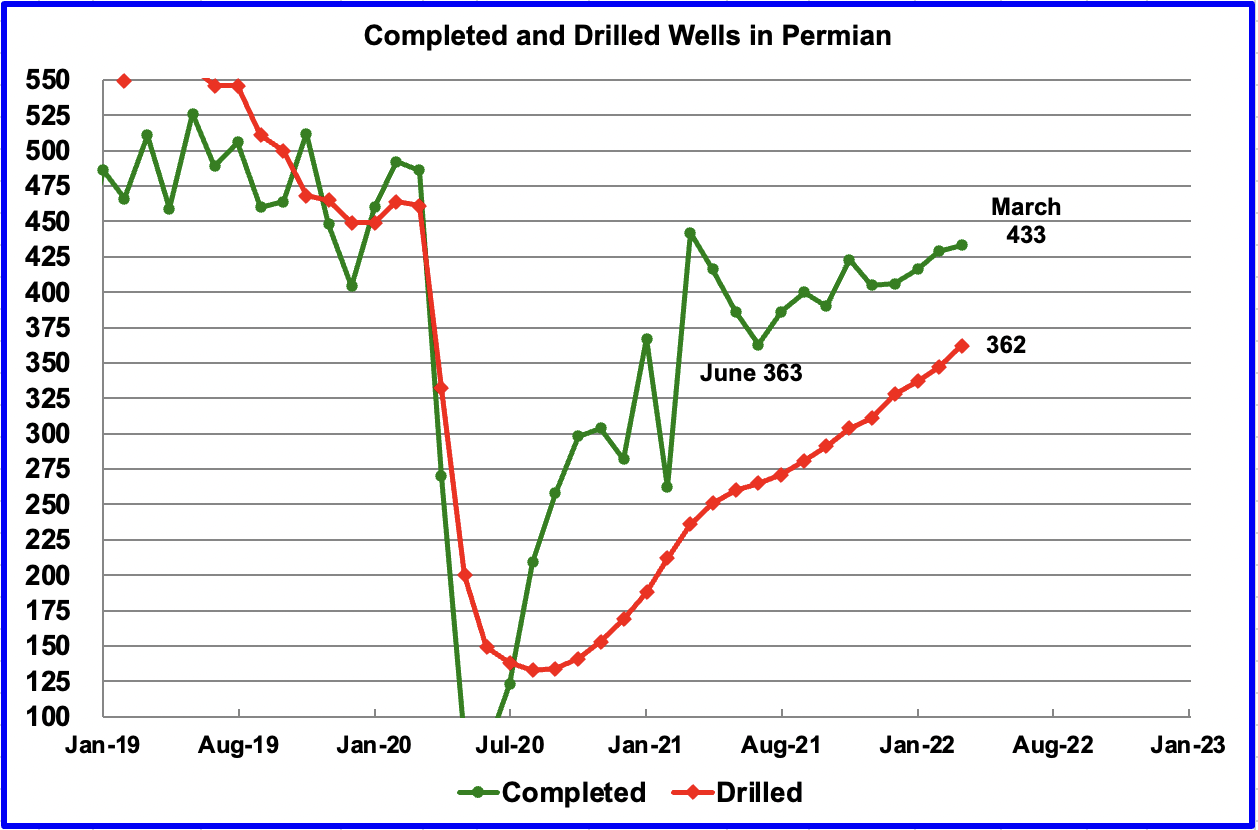
In the Permian, the monthly completion of wells has reversed direction since the low of 363 in June 2021. In March 433 wells were completed, 4 more than in February. During March, 362 new wells were drilled, an increase of 15 over February. To counteract the slowing completion rate, drilling has been increased. See next chart.
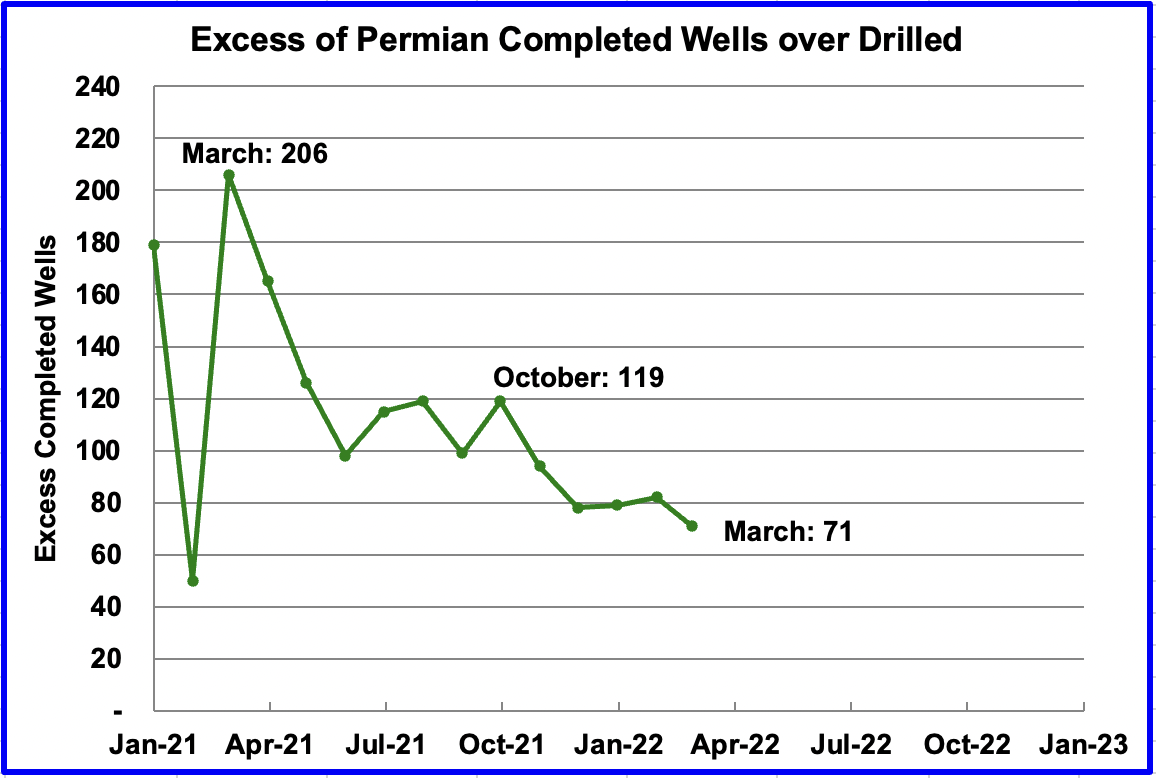
In October 2021, 119 more wells were completed in the Permian than were drilled. In March the number of excess wells completed was down to 71 since the drilling rate was higher than the completion rate.
DPR Production Decline Rates
The DPR reports monthly on the past and future production of tight and conventional oil in the seven basins it covers. Typically the DPR is four months ahead of the EIA’s monthly production report.
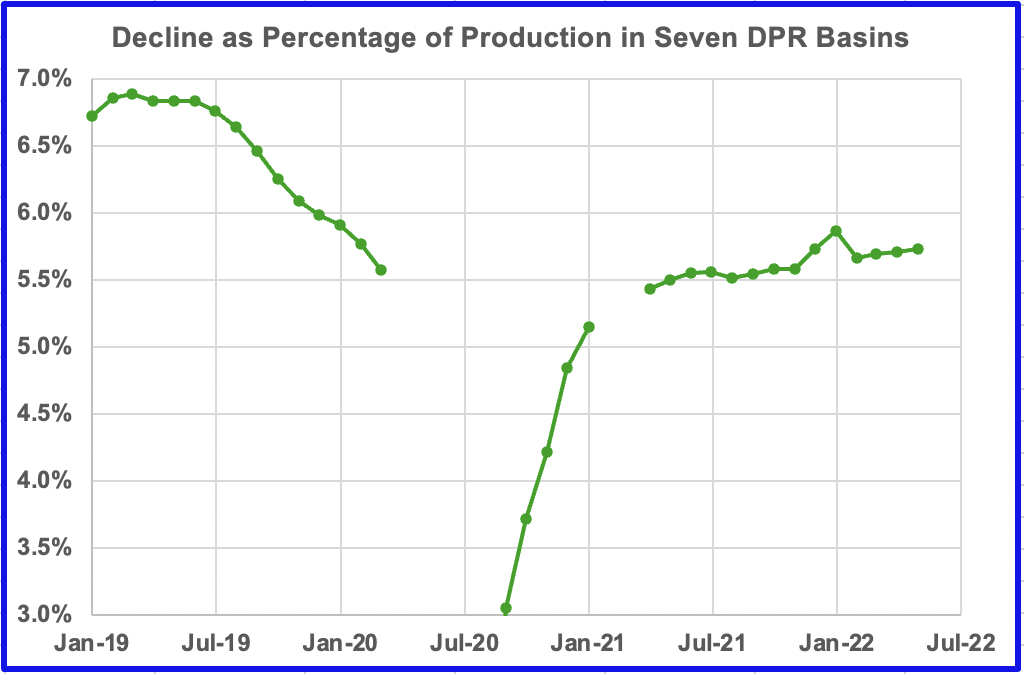
This chart shows the overall decline rate as a percentage of production. It peaked in early 2019 at 6.9%. In early 2020 as production plunged, decline followed suit. No data is shown between March 2020 and August 2020 because of the variability in the data associated with the varying production levels. The decline data stabilized in April 2021 and it is that data that will be used going forward to correlate decline rate with production.
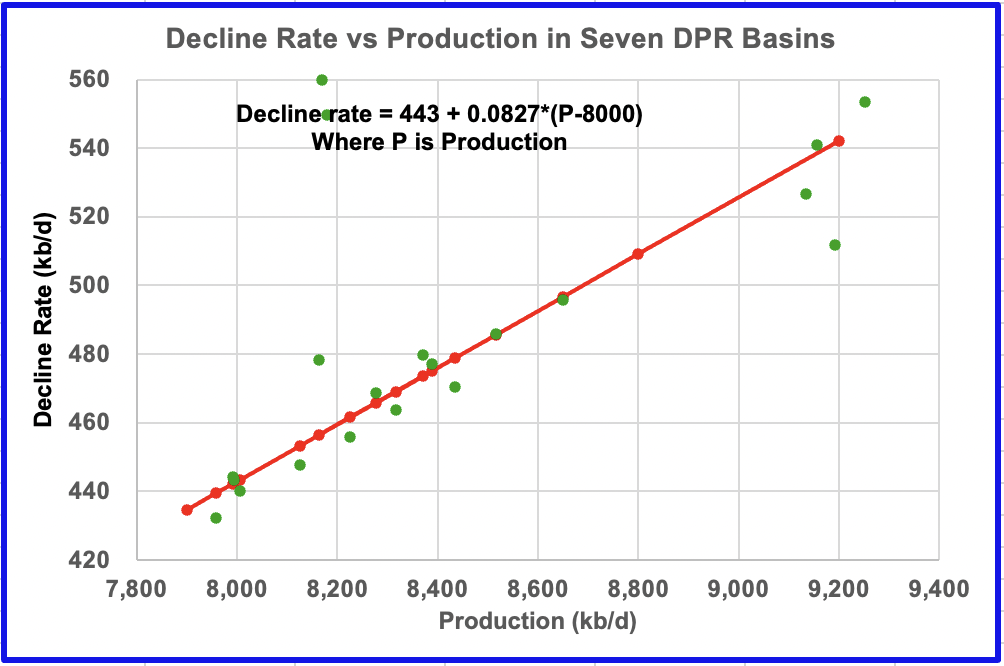
This chart shows the relationship between the decline rate and production rate using only the latest combined data for the seven DPR basins. The OLS line only used the most recent data between April 2021 and May 2022. However the chart includes some data from the time when production was higher, i.e. the four markers around production at 9,200 kb/d. Their position close to the OLS line may be purely accidental since they are from a different dynamic production period.
The equation says that for every 100 kb/d of production increase, the decline rate increases by 8.27 kb/d, on average. That makes sense since the newest wells have the highest decline rates.
3) LIGHT TIGHT OIL (LTO) REPORT
The EIA’s LTO database provides information on LTO production from seven tight oil basins and a few smaller ones. The April 2022 report updates tight oil production to March 2022.
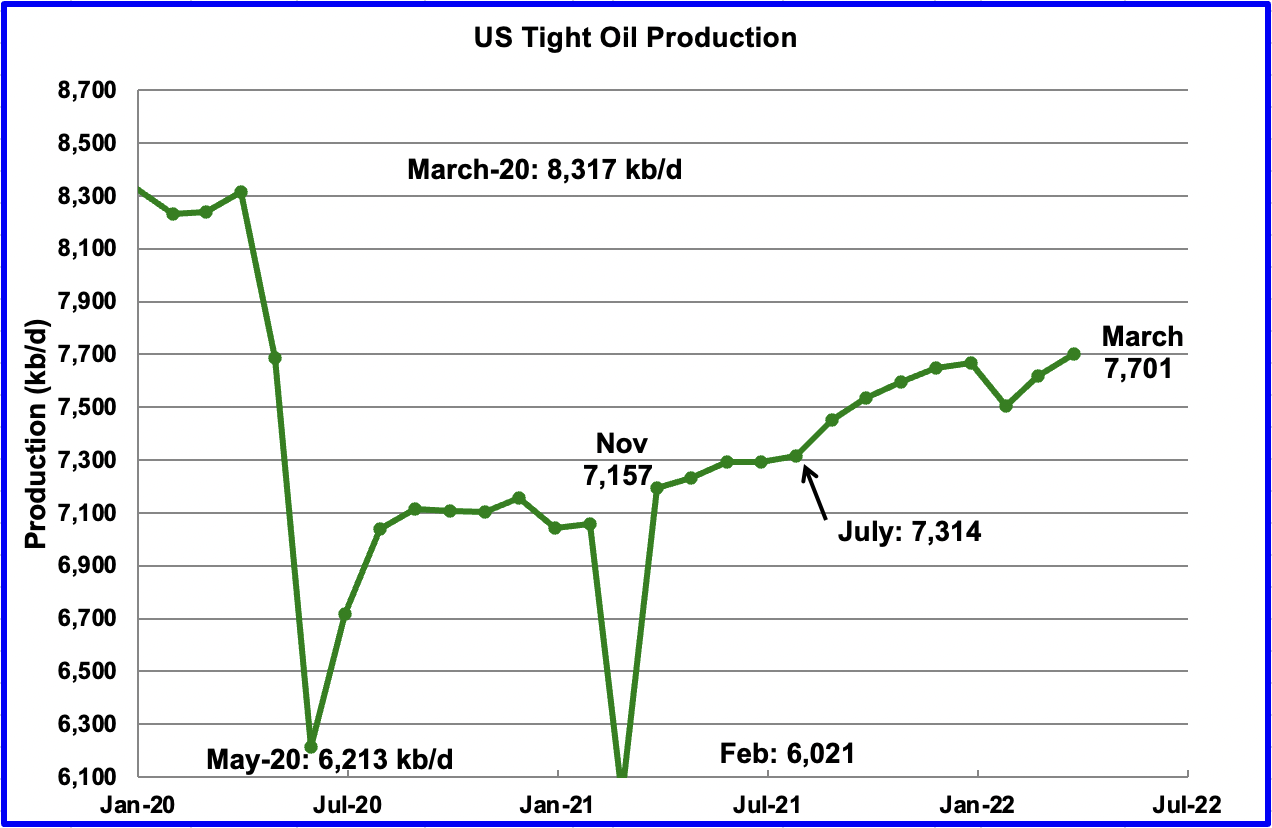
The April LTO report has made downward revisions to their production forecasts in the previous March report. In most cases March output is lower than the previous February ones. This follows the same trend reported in the DPR report.
March’s LTO output increased by 84 kb/d to 7,701 kb/d. However, it is 61 kb/d lower than the February output of 7,762 kb/d reported in the March report.
To get a better indication of the overall trend in LTO growth, it is better to look at the growth from July 2021 to March 2022. Over that period, output increased by 387 kb/d or at an average rate of 48.4 kb/d/mth. This is 64% of the expected US oil production growth rate reported in the STEO section above.
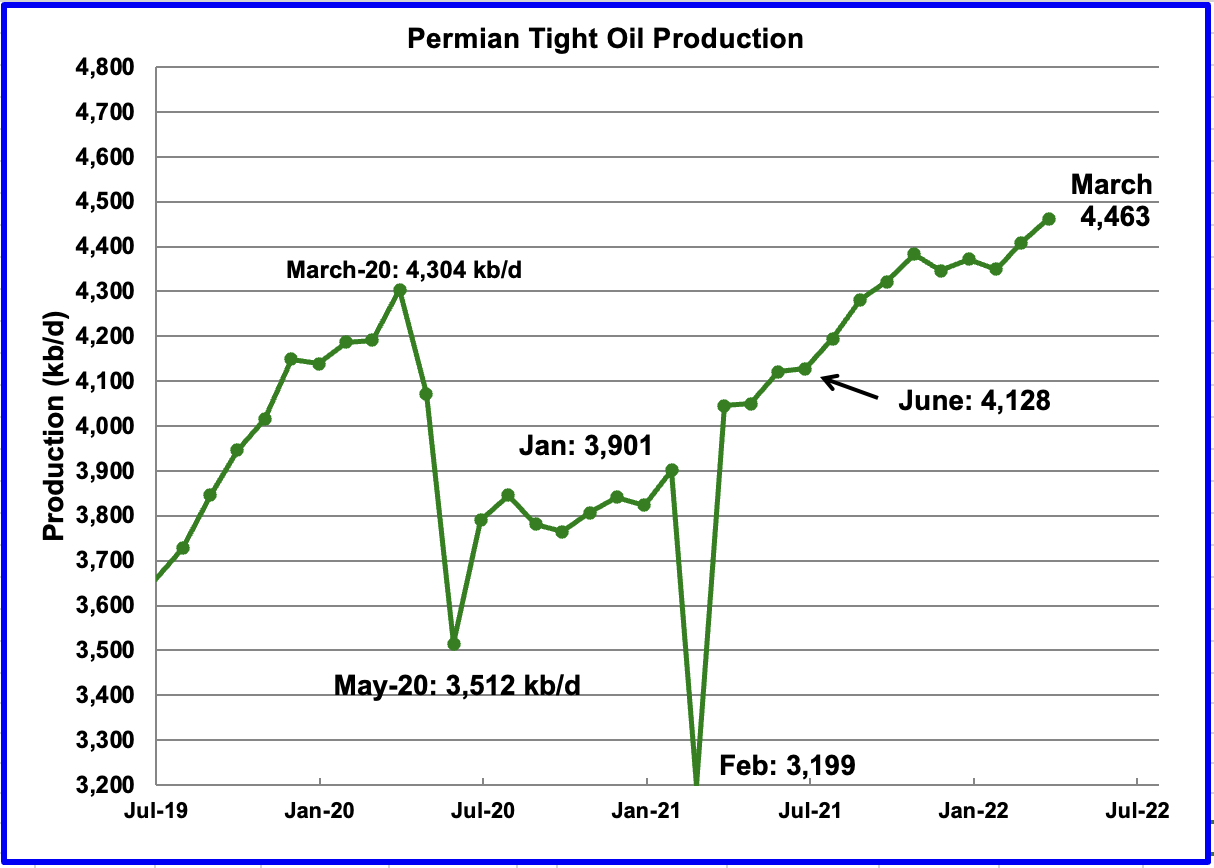
Permian LTO output first reached a new high of 4,322 kb/d in September 2021. March’s output increased by 55 kb/d to 4,463 kb/d and is 159 kb/d higher than the high of 4,304 kb/d recorded in March 2020.
Note that the March output is 71 kb/d lower than the February output of 4,534 kb/d reported in the March report.
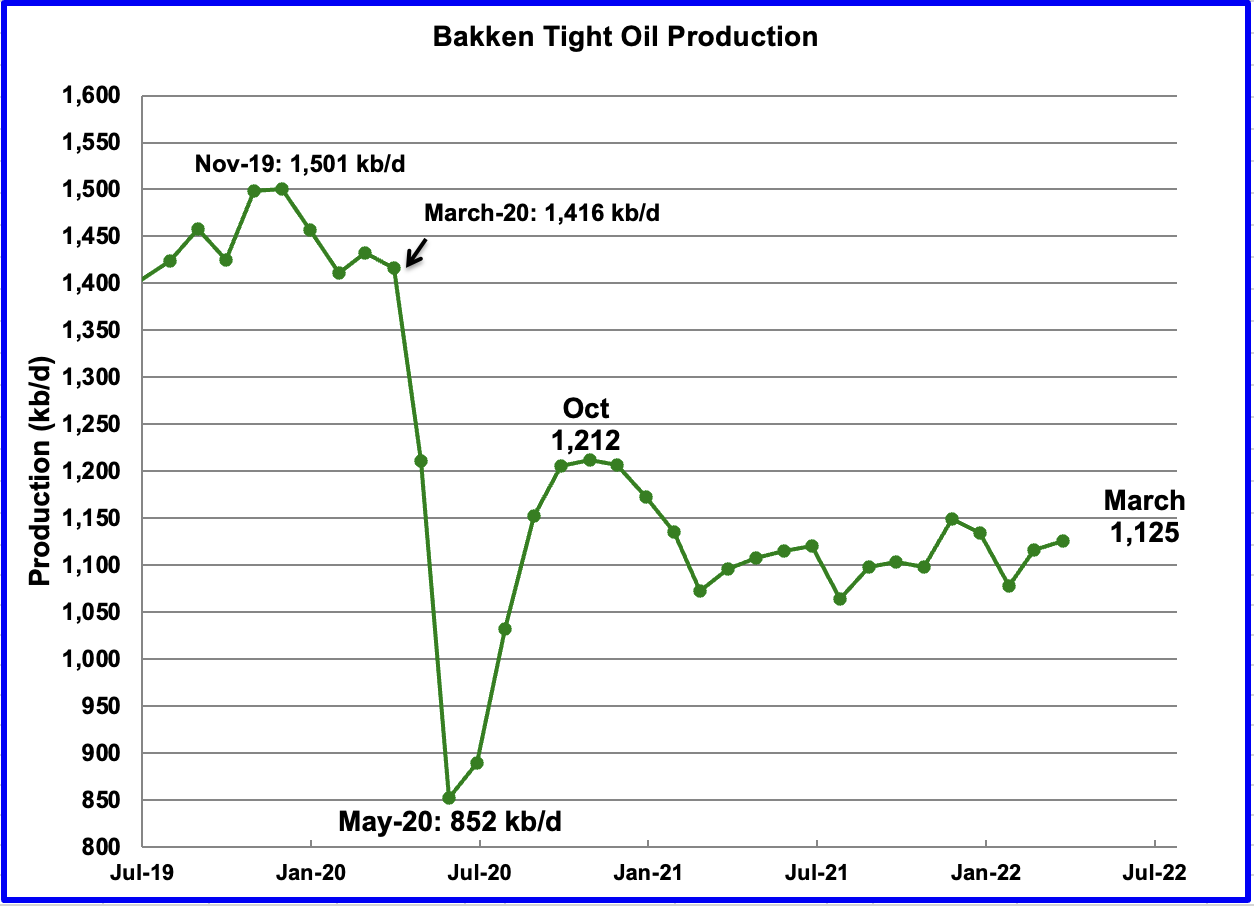
The Bakken’s March output increased by 8 kb/d to 1,125 kb/d. Note it is still below the October 2020 level of 1,212 kb/d.
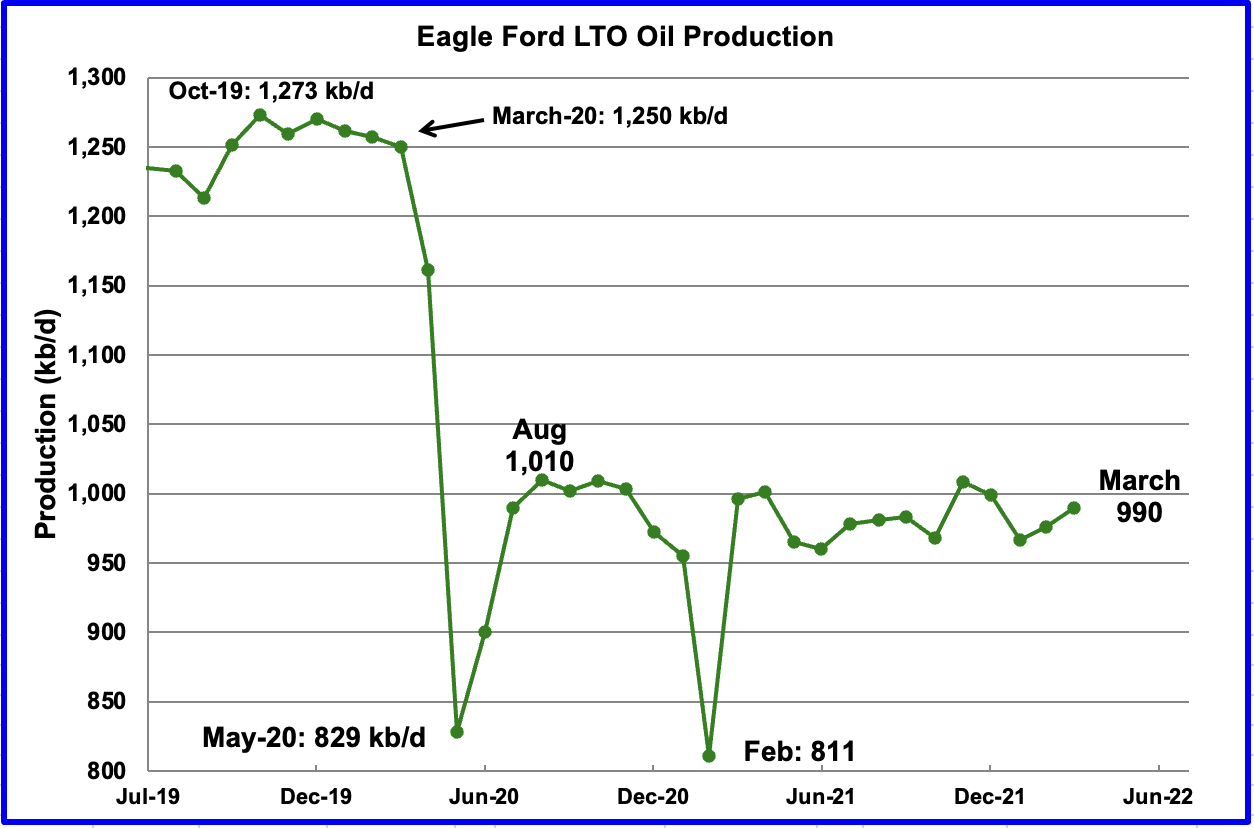
Production in the Eagle Ford basin since August 2020 has been essentially flat. Are the drillers doing this intentionally or is it just accidental?
The Eagle Ford basin produced 990 kb/d in March, which is lower than the August 2020 output of 1,010 kb/d.
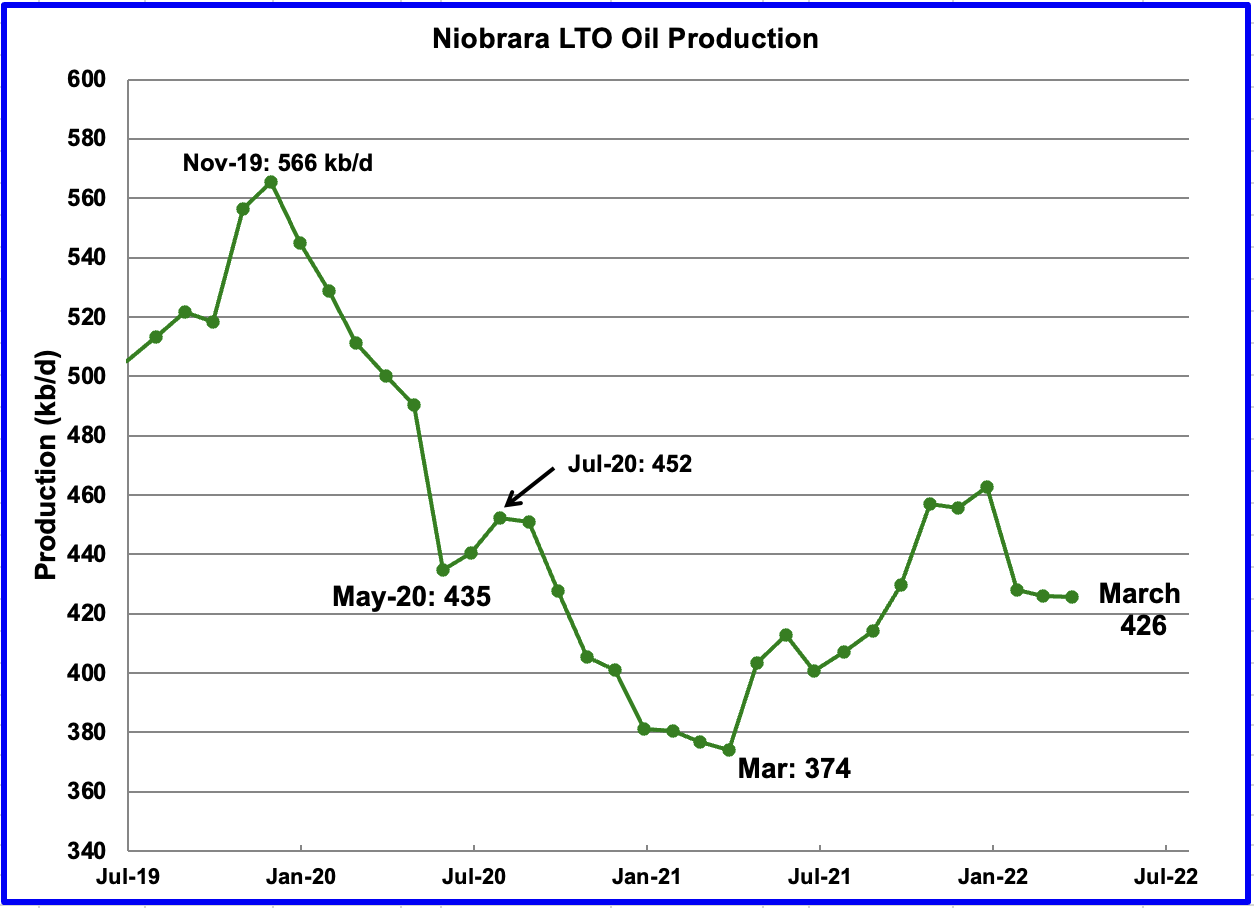
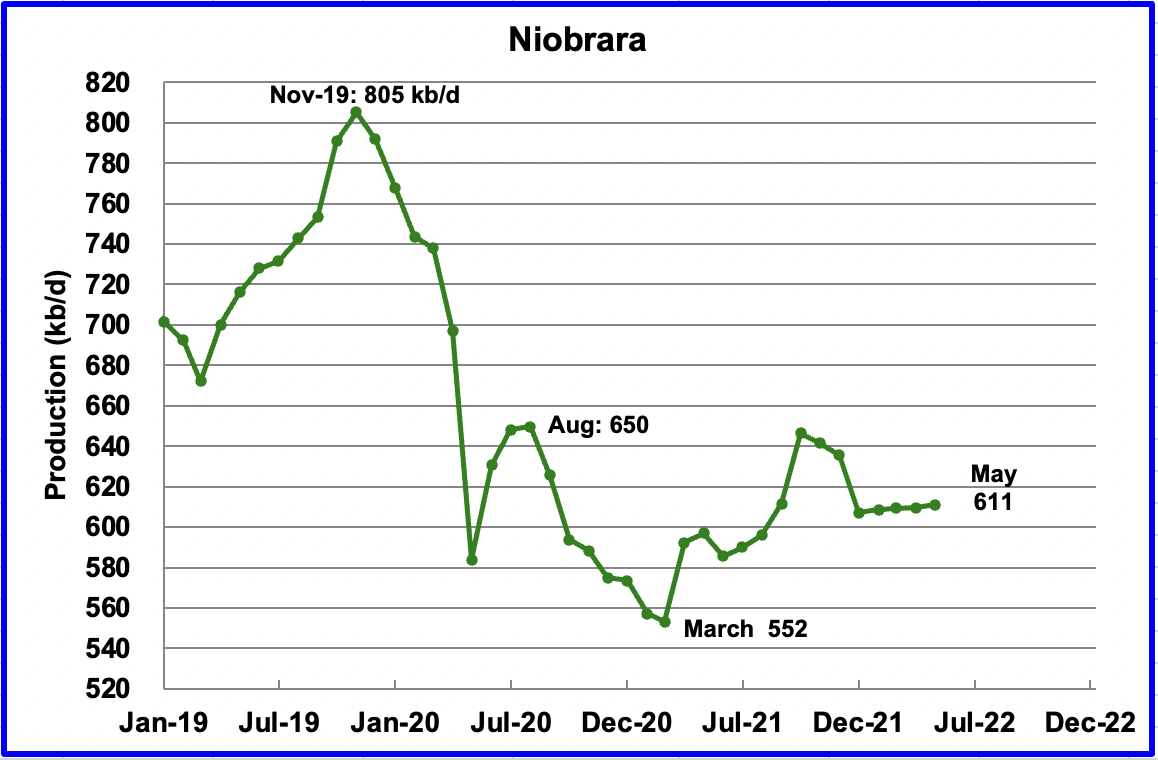
After increasing production from March 2021 to October 2021, output in the Niobrara began to drop in January 2022. March’s output was essentially flat at 426 kb/d.
On-Shore L48 Conventional Production
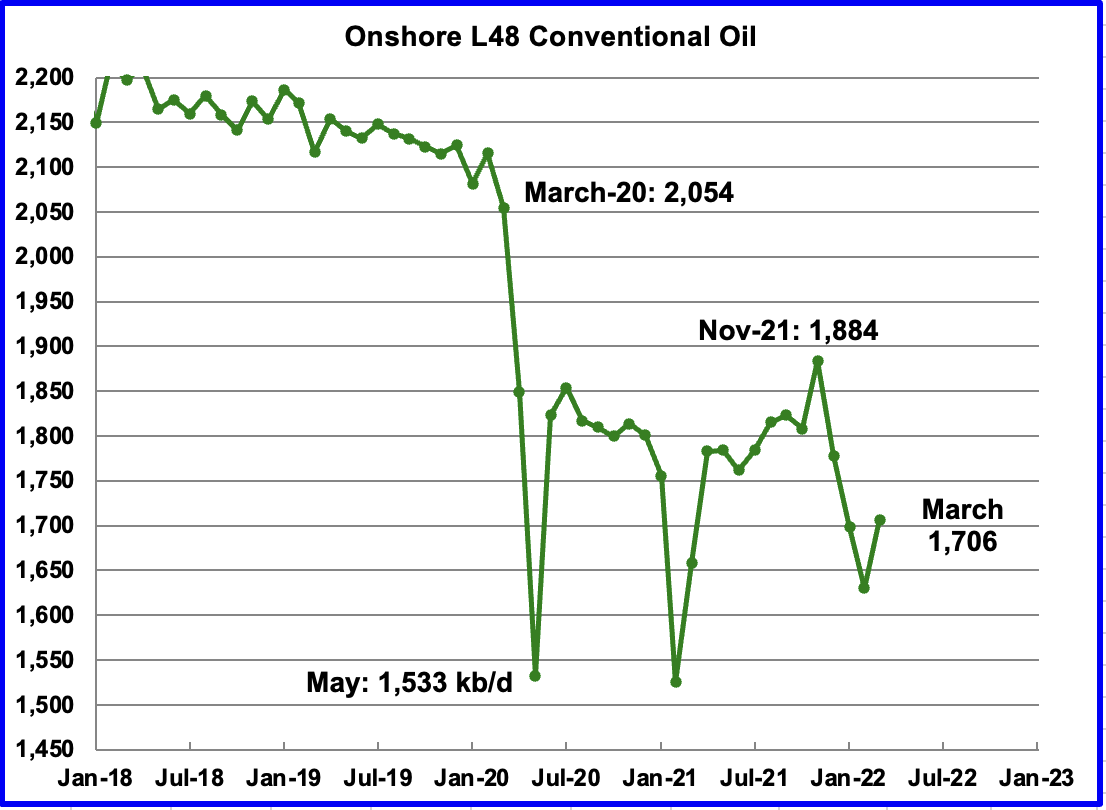
Conventional oil output in the Onshore L48 rose by 76 kb/d in March to 1,706 kb/d. This estimate is based on a combination of the expected March LTO output and the April 2022 STEO report that has a March 2022 forecast for the US On-shore L48 output. Data from January to March in the STEO has been replaced by the actual EIA production data from the current April report.
A note of caution is in order. This chart is derived by subtracting two large numbers which are subject to revision, particularly the last two months, February and March.
World Oil Production Without the US
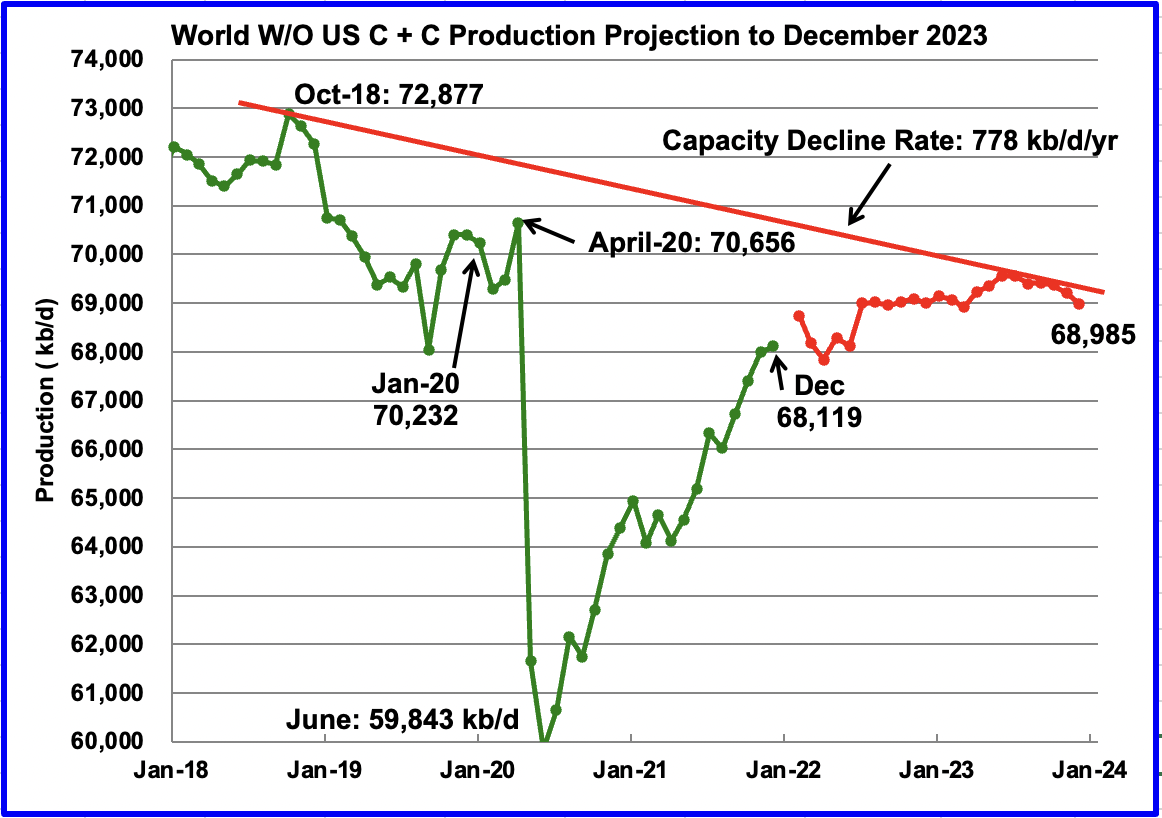
World W/O US oil production increased by 122 kb/d to 68,119 kb/d in December 2021 according to the EIA.
This chart also projects world production without the US to December 2023. It uses the April 2022 STEO report along with the December International Energy Statistics to make the projection. (Red markers). It projects that World crude production W/O US in December 2023 will be close to 68,985 kb/d. Note this projection estimates that output will be essential flat from June 2022 to December 2023. In other words, starting in June 2022, World oil production without the US will be close to 3,900 kb/d lower than in October 2018.
Note that the chart also shows a Capacity Decline Rate line of close to 778 kb/d/yr over the years 2018 to 2023. Capacity decline encompasses natural decline and decline associated with reduced investment for drilling and exploration.
231 responses to “US February Oil Production Surprises to the Downside”
The Inevitable Decline Of Russia’s Oil Industry
While Russia’s oil and gas industry may have both been hurt by sanctions and boycotts, it is still set to see its tax revenue increase this year.
In the long term, however, Russia’s oil industry appears to be entering a terminal decline, with Europe set on moving away from Russian energy.
Russia will attempt to find customers for its oil and gas in the East, but it won’t be able to replace the losses it sustains from the West.
Rystad had Russian oil production entering terminal decline next year even if the invasion had not happened.
Dennis does the above chart trigger any revisions in your peak oil predictions. Or, perhaps it doesn’t because you just don’t believe a damn word of it. 😂
Ron,
Yes I don’t have much faith in any predictions about future output, even my own. Potentially high prices due to low Russian output triggers faster than expected development of resources in Saudi Arabia, Iraq, and UAE and those nations make up the difference between the yellow and black lines above. In the past high oil prices resulted in higher output than I had expected, that could occur again. Also, the Russian oil can be put on ships and sent to Asia instead of going to Europe or this certainly seems possible.
Dennis, I agree, partially, with what you are saying. However high oil prices cannot extract blood from a turnip, or oil from a dry hole. The problem is geology, not the price of oil.
As I recall, you insisted that Russia be included in the nations that would increase world oil production. Rysted says they would be part of the problem, not the solution, even before the Ukraine invasion. Of course, Russia will find many ways to sell its oil in spite of sanctions. And you seem to think that finding buyers for their oil fixes their problem. Finding buyers is not their problem. All the oil service companies and other major oil companies pulling out of Russia will cause their falling production to become even more severe. They had serious problems before the sanctions. Now those problems are seriously aggravated.
However, The world is slowly waking up to the seriousness of the problem, even if you have not. 🤣
Oil: ‘Something far more serious is going on,’ says analyst
Ron,
Part of the Rystad article tou posted said Russia won’ tbe able to find buyers for their oil, perhaps the Big service compaies pulling out of Russia will be a problem, but a smart Russian entrepreneur could hire the talent needed and form their own oil service company, these might already exist in Russia, but if not there is no reason such companies could not be developed with State support. We will see how it plays out, tight oil would not have been developed in the US if oil prices had remained under $40/bo long term, even at the high oil prices of 2011, most of us were saying that tight oil would not amount to much. Oil prices change the equation, despite what you assert.
See what I thought in Dec 2013 at link below, at the time I thought this scenario was too optimistic, in fact it was far too pessimistic.
https://oilpeakclimate.blogspot.com/2013/12/when-will-us-ltolight-tight-oil-peak.html
but a smart Russian entrepreneur could hire the talent needed and form their own oil service company, these might already exist in Russia, but if not there is no reason such companies could not be developed with State support.
Oh, that is a real stretch Dennis, I mean a real stretch. And if such talent exists for the hiring, what might be their reward? You must know they would be far more rewarded if they emigrate than if they stayed in Russia. And you must know that such talent if it exists, would not dare to immigrate to Russia.
Dennis, I think you are totally forgetting the political implications here.
Thanks for he exchange.
Ron,
People are willing to work in a foreign country if the pay is high, if they pay enough they will find people.
Really Dennis? Russia is not just another foreign country. Who would go to Russia today, risk their lives to work in Siberia or some other cold dark place in Russia? And for what price?
Oil service companies in the USA today are having trouble finding and keeping talented workers, and they are offering very high wages. To turn that down to go to darkest Russia, which is ruled by a madman. What kind of wages would that take?
Anyway, I am not prepared to argue with Rystad. They know far more about Russia’s future oil production prospects than I do. I know no one can see what the future holds, especially in a country ruled by a madman, but nevertheless, I trust their predictions far more than I trust my own…. or yours. 🤣
For those not interested in my link, I expected a peak in US tight oil at about 3250 kb/d for all US tight oil in 2020 in my December 2013 blog post linked above. Average US tight oil output in 2020 was about 7300 kb/d, more than double my estimate from 7 years earlier. At the time my focus was on Bakken and Eagle Ford output as these were the biggest tight oil plays, the rest of US tight oil (Permian, Niobrara, and Anadarko basins mostly) I expected to peak in 2020 at about 2000 kb/d. The reality was that the “rest of US tight oil” (everything except Bakken and Eagle Ford) produced about 5100 kb/d in 2020 for the annual average with a peak monthly output of 5380 kb/d.
Here is what I said about my scenario in December 2013:
This scenario is indeed optimistic, but not nearly as optimistic as the EIA’s scenario for LTO in the 2013 Annual Energy Outlook. For comparison I computed the ERR for 2013 to 2040 for my US LTO scenario, it was 17.6 Gb over that period, the EIA scenario has a total output of 24.5 Gb over the same period, 40% higher output than an already optimistic scenario. My guess is that reality will lie between the blue curve and the green curve with the most likely peak around 2018+/- 2 years at about 3.1+/- 0.2 MMb/d.
I was in fact far too pessimistic in my prediction. For other US LTO besides Bakken and Eagle Ford I was too low by a factor of 2.7, in my “optimistic” estimate.
Ron,
I expected Russia would return to roughly their precovid level of output once they were no longer bound by quotas, clearly the situation has changed with the Ukraine invasion and sanctions, I imagine Russian output will be lower than I had anticipated, how much lower is difficult to say. I think you are wrong about serious problems before the invasion based on the research I have read by experts in the Russian oil industry. I have yet to see any peer reviewed research on the effects of the current situation. Rystad might be right, but I would rather take a set of analyses from OPEC, EIA, IEA, etc and see the range of expected outcomes, I think it is a bit early to draw any conclusions.
I expected Russia would return to roughly their precovid level of output once they were no longer bound by quotas,…
Exactly what previous output are you talking about. The Russian oil Minister himself said he hoped to get within 200,000 bp/d of their pre covid level. They were within 50,000 bp/d of that level when the invasion hit. Are you talking about what the Russian oil Minister said or what their pre covid level was?
It is Rystad’s job to estimate the future production of different countries. Their clients depend upon it. On the other hand, OPEC, EIA, and IEA have no such clients. I trust Rystad far more than I trust any of them. I mean just look at what OPEC is projecting today. They said they would increase production by 274,00 bp/d in April and they managed a measly 10,000 barrels per day. Rystad could probably have given a far more realistic prediction. Hell, I could have given a far more realistic prediction. 🤣
Ron,
Output level of 2019 about 11252 kb/d is what I would call the Russian pre-covid output level, I expected they might come close to that, maybe 11000 kb/d, which they had accomplished by March 2022 (output was 11022 kb/d). Paper below has Russian output at about 11 Mb/d in 2023, that was my guess before the Russian invasion of Ukraine, I will revise my position when I hear an expert analysis on the matter.
https://www.oxfordenergy.org/wpcms/wp-content/uploads/2019/09/The-Future-of-Russian-Oil-Production-in-the-Short-Medium-and-Long-Term-Insight-57.pdf
Paper below has Russian output at about 11 Mb/d in 2023, that was my guess before the Russian invasion of Ukraine,…
Dennis, I really don’t think so. if I recall correctly you insisted that I include Russia in one of the nations that would increase oil production above their previous peak. I called them “Dennis’s big 10.” You then insisted that I include Russia. So I changed it and called them “Dennis’s big 11”. However that is not that important.
I will revise my position when I hear an expert analysis on the matter.
I doubt there is any kind of expert that can predict what is going on in Putin’s brain. But regardless Russian production will never reach 11 million bp/d again. It will drop below 10 million bp/d either in May or June. After that, It will never reach 10 million bp/d again. Putin has already done that much damage.
Dennis, peak oil was in 2018-2019. End of story. Russia is now forever part of the problem, not part of the solution.
Ron,
You have often called peak oil, Russia may not return to 11 Mbpd due to sanctions etc, clearly things have changed since Russian invasion of Ukraine. Difficult to know how it plays out, high oil prices may increase output elsewhere more than you estimate.
Certainly that has been the case in the past.
I have posted what I have been seeing for many months. There is a shortage of trained oilfield personnel from Roughnecks to Geologists. There is a shortage of capital to support the oilfield service industry and not just in the United States. The ESG mandate has destroyed the concept of investing in dirty industrieswith the fossil fuel industry being at the top of the list. Finally we are running out of quality locations in the Permian. The publics wont say it and instead tout production maintenance accompanied by dividends. While it appears sexy it has never been the mantra of growth companies and it is more like a long dated death sentence for these companies. If you don’t replace reserves and grow then one is better off to pay down debt, slash staff and produce out the reserves.
We have the example of the 1970s where high oil prices drove gas guzzlers off the roads and our consumption of oil declined. Maybe this will drive the Hummers and SUVs off the roads
Ron and Dennis,
if you have a chance, take a listen to the public discussions on energy during the SOTU. Especially, the “discussion” with Borrel and Stub. The goal is not only for the EU to stop importing crude oil from Russia, but to prevent Russia from exporting altogether. What is taking shape is an embargo similar to those imposed to Iran or Venezuela.
At this moment Orban is managing to block this course of action, but he is very isolated. He will eventually fold, or will just be left behind.
A few more details:
https://markets.businessinsider.com/news/commodities/eu-oil-ban-russia-global-shipping-insurance-exports-tankers-2022-5?op=1
Luis,
Interesting thx.
If 7 Mbpd were removed from the market it will be a big problem. I doubt they will be successful blocking all Russian exports.
My question is: Where does “peak oil” stand now? From a geophysics standpoint, peak oil is simply an inevitability. Oil ‘production’ is a misnomer, as all ‘production’ is essentially an extraction (barring the necessary refinement processes that may justify some aspect of using the word, ‘production’). And this extraction is reliant upon a resource that takes millions of years to emerge, while all available extraction can deplete it faster than this rate of renewal. I understand that nat gas and fracking have innovated beyond these projected limitations, and perhaps even more aspects of exploration have also led to new discoveries for extraction that also left the ‘peak oil’ theory in the dust. But that is only for now, am I correct? Are we facing a situation where the inevitabilities of climate change actually become paramount for their consequences sooner than the peak oil limitations of extracted energy?
Evan, this thread is stale. It was posted on May 2. If you expect anyone to see it or read it, then you should post it on the latest thread.
Go here: http://peakoilbarrel.com/ then click on “Read More”.
Evan
As Ron mentions, you should post on the latest blog.
With regard to your comment “even more aspects of exploration have also led to new discoveries for extraction that also left the ‘peak oil’ theory in the dust.” NO.
Recent discoveries have been very low. In 2021 only 4.7 B barrels of oil and gas were discovered and of that only 3.1 B barrels were oil. Appreciate that the world currently consumes close to 30 B barrels of oil a yearl. See attached chart
As for where we stand, many of us think that peak oil in in the rear view mirror and that as demand increases the second lower peak could occur in the 2023 to 2024 time frame. It depends on demand increasing to the pre-pandemic level and oil prices staying in the range $100/b to $125/b that doesn’t cause a world wide economic collapse. Oil above $125/b begins to have an increasingly negative affect on the economy.
Ovi , haven’t gone thru the post ( late here in Europe ) but why ” surprisingly ” . It should be ” unsurprisingly ” . Many have been following the trend and said it will fall . As they say in Wall Street ” The trend is your friend ” . 🙂 . Tks for the effort and work .
Hole in Head
I thought that the December and January drops were related to weather and expected output to increase in a warmer February. Also the STEO had February heading back up.
Also it was down due to big drop in GOM.
OPEC oil output in April barely rises as African outages weigh-survey
LONDON, May 2 (Reuters) – The increase in OPEC’s oil output in April undershot the rise planned under a deal with allies, a Reuters survey found, as declines in Libya and Nigeria offset supply increases by Saudi Arabia and other top producers.
The Organization of the Petroleum Exporting Countries (OPEC) pumped 28.58 million barrels per day (bpd) in April, the survey found, up 40,000 bpd from the previous month and short of the 254,000 bpd increase called for under the supply deal.
OPEC and its allies, known as OPEC+, are slowly relaxing 2020 output cuts as demand recovers from the pandemic. OPEC+ meets on Thursday and is expected to confirm a previously agreed output hike despite the surge in oil prices after Russia’s invasion of Ukraine.
“Probably the view is to maintain the plan,” an OPEC delegate said of Thursday’s meeting.
The deal called for a 400,000 bpd increase in April from all OPEC+ members, of which about 254,000 bpd is shared by the 10 OPEC producers the agreement covers.
OPEC keeps over promising and under preforming. OPEC + Russia will be down for a second month in a row.
Thank goodness for China’s Zero Covid policy or we would all be screwed right now lol
Lol 100% only thing keeping a lid on oil prices.
HHH , for a change ” the Japanese did it ” . 🙂 . Not Putin .
https://www.zerohedge.com/markets/japan-emerges-biggest-driver-behind-recent-surge-treasury-yields
I call BS on that. The Japanese are selling 60bn of treasuries, which is a drop in the bucket vv the total treasury market, or the amount of debt the US issues every year
https://fiscaldata.treasury.gov/datasets/historical-debt-outstanding/historical-debt-outstanding
Rgds
WP
WP , . Japan has been the largest buyer of treasuries as far as my my memory goes . Flipping from a buyer to a seller is significant , the amount is not important . Markets look for indicators and move on sentiment .
ELM in the treasury market ? 😉
That zero hedge article doesn’t really tell the whole story. Keep in mind if Japanese pension funds are selling then there is a buyer on the other end of that. Somebody bought those treasuries from them.
There is high demand for treasuries because they are the collateral used in the REPO market. Which is where all the financial engineering in the world takes place.
I expect as this global dollar shortage becomes more severe that there will be a lot more selling of US treasuries. People will sell them to get the dollars they need to service their dollar denominated debts.
When there is plenty of dollar liquidity outside US foreigners tend to buy US treasuries because they have the dollar surplus to do it. And they tend to sell when dollar liquidity is in short supply.
This is exactly why Hong Kong and eventually China’s currency pegs are going to break. I expect the selling in China to far exceed that of Japan over next 24 months. Their stockpile of FX reserves which are mainly US treasuries is going to shrink drastically.
China’s currency is going to implode.
Zero hedge article paints this as a problem for the US when in actuality it’s a problem for everyone outside the US.
Dollar liquidity is created in the REPO market and if you don’t have the collateral you can’t play. Dollar shortage is very much a systematic collateral shortage.
The dollar liquidity that bid oil to $100 was created in the REPO market.
The importance, and what repo markets actually do in the financial system is quite grossly underrated. In many instances it is the dog, not the tail, but for some reason it doesn’t often make it to the front page of the WSJ.
In 2007 it was the repo markets that signaled quite clearly that Lehman ( and later on Bear and Citi) also, were in trouble even when the headlines were still positive. For the same GC (General Collateral i.e. on the run treasuries) on a triparty repo (the safest type there is) LEH and BS (such an aptly chosen ticker) had to pay more than Goldman/JP morgan etc for the exact same underlying collateral risk. That spread kept creeping up and up and up until the whole thing blew apart.
Rgds
WP
Also – it is quite possible that Japan needs to / chooses to intervene in the USD/JPY market by buying yen and selling dollars. In order to have dollars to sell you first have to liquidate your treasuries. It may be as simple as that… but who really knows.
rgds
WP
HHH , isn’t the inflow of dollars into USA inflationary for the US public ? I never knew what a Eurodollar was until I learnt it from you . Underrated issue until you go into detail just like the REPO market . Kuroda asked Yellen to intervene in the currency market but she refused . I found this article interesting regarding the Yen . I have long maintained that before we have an oil crisis we will have a financial crisis . The same asset rehypothecated gives an illusion of wealth but it is what Bernanke called ” wealth effect ” . This is coming unglued .
https://brucewilds.blogspot.com/2022/04/higher-interest-rates-and-inflation-are.html
The U.S. Shale Patch Is Facing A Plethora Of Problems
https://oilprice.com/Energy/Energy-General/The-US-Shale-Patch-Is-Facing-A-Plethora-Of-Problems.html
From your link:
The U.S. government appears to believe that the country’s shale production can be raised simply by throwing enough money at the problem.
This assumption fails to understand that not all the problems currently faced by drillers are financial, with some drillers simply unable to get their hands on the material they need to boost production.
These companies are also suffering from a lack of high-quality acreage and, in some cases, are struggling to secure financing.
It appears that oil from the shale patch might not be rising as fast and as far as some folks assume. 😫
Given the high rate of decline of other fields, a lot of fields need to come online to offset the difference
Svaya , not only new fields we need the grade of oil that will give us diesel . Diesel is king .
US LTO,
Using DPR minus conventional in DPR regions for April and May 2022 estimate (687 kb/d).
https://www.ogj.com/general-interest/companies/article/14275872/diamondback-staying-disciplined-on-production-growth?o_eid=1079H7861712I7P&rdx.ident%5Bpull%5D=omeda%7C1079H7861712I7P&oly_enc_id=1079H7861712I7P
Citing market volatility and an ongoing shortage of parts and people, the leaders of Diamondback Energy Inc., Midland, Texas, are sticking to the in-line-with-2021 production targets they laid out early this year.
“Increasing activity today would result in capital efficiency degradation and would not meaningfully contribute to the global supply and demand imbalance in the oil market today,” Chairman and Chief Executive Officer Travis Stice said in a statement accompanying Diamondback’s first-quarter earnings report. “Therefore, we are focused on maintaining our operational excellence and producing one of the lowest-cost and environmentally friendly barrels in the world.”
In the first 3 months of 2022, Diamondback averaged production of 222,800 b/d and a little more than 381,000 boe/d. For the second quarter and the rest of the year, Stice and his team expect those numbers to be 218,000-222,000 and about 370,000 boe/d, respectively. Their plan calls for Diamondback to add a net 248-267 wells this year and for capital spending to still come around $1.75-1.9 billion. In first-quarter 2022, the latter number was $437 million, just above the low end of the company’s quarterly guidance.
Thanks Seppo,
At 1.9 billion in capital spending on 267 wells, that would be about 7.12 million per well. Note that in my analyses I use 10.3 million per well in 2021$ to evaluate the economics of the wells in the Permian basin, I assume an average lateral length of 9500 feet and a well spacing of 1320 feet for about 290 acres per well. At the end of 2018 there were about 50 million prospective net acres in the Permian basin for the USGS mean estimate. I assume the most prospective half of these 50 million acres are developed (about 25 million acres) enough for about 86000 wells. About 21000 horizontal tight oil wells had been completed in the Permian by the end of 2018 (according to shaleprofile.com), so my scenario has roughly 107,000 wells completed in the Permian basin from 2008 to 2033. As of Dec 2021 (again from shaleprofile.com) about 34,000 horizontal tight oil wells had been completed in the Permian basin. If my scenario is correct (it is not) that would leave roughly 73,000 horizontal wells to be completed from Jan 2022 to Dec 2033.
Your scenario is not correct. I suspect with pressure depletion very real and increasing daily, I predict no more than 5 more years of development in the Permian at this rig rate.
Mr. Survivor, on the five years, I’ll take the under, thanks.
Two halves of just two Counties in the New Mexico part of the Delaware Basin account for all tight oil growth in the Permian. Two benches in the Bone Springs and one in the Wolfcamp produce that growth. Texas provides most of the frac source water for those two counties in New Mexico and then receives the bulk of the produced water back from New Mexico for re-injection. That can’t go on much longer, nor can New Mexico operators, like EOG, continue to high grade those 3-4 benches in those two Counties on 330 foot spacing. Well quality is headed for the toilet.
When New Mexico rolls over, so will the Permian.
https://www.oilystuffblog.com/forumstuff/forum-stuff/the-big-dog-in-the-delaware-basin
Here is the history
Mike,
Estimating cumulative output at 12 months in Permian New Mexico and Permian Texas using charts from Enno Peter’s latest Permian update on the shaleprofile blog I get an increase in output per 1000 feet of lateral from 2019 to 2020 for both New Mexico and Texas, I am reading from charts so the numbers may be a bit off, but I get:
state–Year–output (kb/1000 feet)
TX—-2019—-17.65
TX—-2020—-17.98
NM–2019—-25.33
NM–2020—-28.13
Blog post at link below, see well productivity section
https://shaleprofile.com/blog/permian/permian-update-through-december-2021/
Mike,
I was being over optimistic to hedge my bets. It has been brutal in every way in the Permian. I signed AFE’s to drill 13 wells as a non-op in Eddy county and the AFE’s are rising daily. I don’t anticipate we will be able to get these wells drilled within 2 years. Without the completion of DUcs in the Permian, production will be falling.
LTO Survivor,
In the past you suggested a 5% rate of annual growth in Permian output might be feasible. Has your thinking changed?
Also if we assume 430 new wells per month (current completion rate) for 60 months, that would be about 25,800 future wells completed. At roughly 300 acres per well that would be roughly 7.7 million acres left to be developed, does that sound about right to you?
Dennis,
I just dont see 430 wells completed every month once we roll through the DUCs. The Permian will be fortunate to stay flat over the next 5 years.
LTO Survivor,
I am fairly sure rig counts will rise to a level that allows DUC count to stabilize and allow 430 completions per month, what completion rate do you expect?
The number of wells spud has been increasing at about 10 per month on average in the Permian basin for the past 12 months, if that continues, by October 2022, there will be 430 wells drilled per month and DUC count stops decreasing if completion rate remains constant. A scenario with constant completion rate at 430 wells per month (it was 433 wells completed in March 2022) until Dec 2026 would look like the chart below, we would need to see a lower completion rate for the flat output scenario you envision.
This extremely conservative scenario has a URR of 23 Gb (about 5.2 Gb of cumulative production to the end of 2020) with about 59,000 total wells completed from Jan 2010 to Dec 2026, about 34,000 wells had been completed from Jan 2010 to Dec 2021, roughly 25000 wells are completed from Jan 2022 to Dec 2026 in this scenario. Proved reserves in the Permian were about 11.9 Gb at the end of 2020, and 2P reserves were likely about 20 Gb, so it is likely that at least 25 Gb of Permian tight oil will be produced, it seems likely the possible reserves and contingent resources will be added to 2P reserves over time at high oil price levels.
LTO Survivor,
Scenario below assumes flat output in the future for Permian, we would need to see completion rate decrease as shown on dashed line on right axis in chart below. URR about 24 Gb, roughly 50% of USGS F95 TRR estimate. Completion rate needs to fall to about 310 wells per month over time for output in the Permian to remain flat as you suggest.
I doubt this will be correct.
Recent shaleprofile supply projection for Permian, 6420 kb/d in Dec 2026 with constant completion rate from July 2022 to Dec 2026 at 436 completions per month. Click on chart for larger view.
Dennis, according to one of your charts below, and the one from ShaleProfile, you have the Permian increasing by about 1.8 million bp/d between now and 2027, and dropping after that. Assuming the rest of the USA declines by .3 million bp/d by then, that leaves the USA increasing by about 1.5 million bp/d by 2027.
I would not argue with those figures but we would still need almost another 2 million barrels per day to reach the high 12-month average of 2019. It would be entirely left up to the OPEC big 5, Saudi, Kuwait, UAE, Iran, and Iraq to make up the difference. The rest of the world, that is World less OPEC big 5 and the USA is clearly in decline and will decline. They are declining by about 400,000 barrels per day per year. If that trend continues then by 2027 they would be down by another 2 million barrels per day.
And since Russia recently joined the big decliners, there is absolutely no doubt that this trend will continue.
That means the OPEC big 5 alone would have to increase production by at least 4 million barrels per day per year by 2027. I just checked my chart of the OPEC big 5. They reached their 12-month average high in May 2017 and that average was down over 2 million bp/d by February 2020, just before the covid collapse.
Given that OPEC is already showing serious signs of being unable to increase production, do you really believe that they can actually increase production by 4 million bp/d by 2027?
Click on chart below to enlarge.
Ron,
My best guess scenario for Permian has output peaking at about 4 Mbpd higher than the most recent shaleprofile estimate in 2028. So US output increases but about 2200 kbpd more than you have estimated. Iran has another 1300 kbpd they could add to output if sanction were removed. That gets us to 3500 kbpd more than your estimate, also the proper level to look at is not the previous OPEC CTMA peak, it is OPEC CTMA output at the previous World peak for CTMA in Nov 2018.
Do I think the big 5 OPEC producers can raise output by 800 kbpd by 2028?
Yes.
OPEC decline in 2019 was due to quotas.
Three problems with your scenario Dennis.
1. You overestimate Permian future production.
2 You underestimate the decline in the rest of the USA if you even consider that at all.
3 You vastly underestimate the decline in the rest of the world’s oil production.
It is my opinion that not that world production will just not breach the 2018 high, but world production will never even reach the pre-covid level. OPEC is within half a million barrels per day of that level right now, but the world is still 2 million bp/d from that point.
I just don’t understand why you never mention the declining production in the rest of the world.
Click on the below graph to enlarge.
Ron,
Chart below has World minus (OPEC big 5 plus US plus Russia plus Venezuela), the trend line is an ordinary least squares linear regression on data from Jan 2015 to Dec 2018 (blue squares), average annual decline is 232 kb/d or about 0.67% per year.
Despite your claim that my Permian scenario is too optimistic, this is a claim you have often made in the past about my scenarios and for the most part the scenarios I have produced have been very conservative. This is also very likely to be the case for my 43.5 Gb Permian basin scenario despite claims to the contrary by many here, especially if oil prices remain high from now until 2030 as I suspect will be the case.
We will see if conventional oil resources get developed more quickly than the 2016 to 2022 period when oil prices were low over the 2023 to 2030 period when oil prices may be very high ($100/bo plus).
Click on chart for larger view.
Dennis, your charts are really hard to read so I just made my own to try to figure out what you were talking bout. I think I see your point which was that Venezuela was a major contributor to the decline. That is true but they, that is the rest of the world, is still declining. And notice that in the last year they have done nothing.
However, that does not change the fact that World oil production is still 3 million barrels per day below the 2019 12-month average. That is about to change however as Russian oil production has tanked. OPEC production has stalled, or nearly so. That leaves the USA to make up that difference. Will they do it? Of course not.
Click on the below chart to enlarge.
LTO.
Guess it’s looking good we hung onto our production at this time?
Maybe someday if this labor and material shortage ever gets fixed, we might even drill a couple wells.
Dennis, Mike Shellman has shown repeatedly that drilling outside the core six counties in the Permian/Wolfcamp is unproductive. I’ve not seen you refute his analysis in any meaningful matter, but perhaps I missed it. If all that other acreage is so awesome, why the hell isn’t anyone drilling there?
https://www.oilystuffblog.com/single-post/oil-literacy
Indeed, Stephen, thanks. Its a good question. At $100/$6 why is there STILL so much high grading going on in core areas of both sub-basins in the Permian, on 330 foot spacing, when wells are getting worse?
Because all that goat pasture out there the USGS believed six years was productive is really not so productive after all. Those were USGS ESTIMATES of resource potential over hundreds of square miles based on multiple different benches that have since proven not to be so good. Since those assessments both sub basins are now almost fully delineated and whatever there is left to do will be within the confines of those productive boundaries.
Nothing in life much turns out like you think, or hope; multiply that reality x 30 in the oil and natural gas business.
330 foot spacing is suicide. I believe 4 wells per section is the absolute limit.
LTO Survivor,
I use 4 wells per section in my model for Wolfcamp and Bonespring and 3 wells per section for the Spraberry.
Mike.
As you and LTO also point out, who is physically going to do the work to drill all of these extra wells?
The shale boom happened partly because after GFC, we had nearly 10% unemployment and many who moved to work in the shale fields and other fields.
Not the case now. Heard this morning on Bloomberg radio there are more than two job openings for every unemployed person in the USA.
Our field still has a serious labor shortage, with less than 10 service rigs running and with no rigs presently drilling new wells, despite $100 oil prices.
Heck, there are still hundreds of wells here SI since the Covid collapse, although that is slowly being worked off.
In 2014, our field had over 100 new wells drilled and around 30 service rigs in the field.
I know our field is anecdotal. But figure it’s the same most everywhere else?
LTO Survivor,
Many Permian core areas have 3 or 4 benched to target. A section with 330 foot spacing in 4 benches would have 64 wells in a section, 16 wells per bench. Have you seen a lot of sections with 64 wells? Or even 48 wells ? If only 3 benches are targeted.
Stephen,
My scenario, focuses on the best benches of the Permian and the core areas, that amounts to approximately 25 million net acres out of 50 million prospective acres identified by the USGS.
Also my scenario assumes the average well is spaced at 1320 feet as has been suggested by LTO survivor. also note that if oil prices remain at $90/bo or higher until 2035 and then falls to $30/bo by 2040 (all prices in 2021 US$), if average new well EUR has decreased by 30% from the average 2020 well EUR by 2035 and natural gas is still selling for $6/MCF, then this lower productivity well will pay out in 28 months at today’s real operating costs if the capital cost of the well is $10.3 million in 2021 $. Net cash flow over the life of the well is $14 million, and at an annual discount rate of 10%, the discounted net cash flow over the life of the well is $12.3 million. If we raise the annual discount rate to 24%, then discounted net cash flow over the life of the well is equal to the well cost for the oil and gas prices I have assumed (NGL sells for 35% of the crude cost). The EUR of the 2035 well is assumed to be 333 kbo.
Note that I have been expecting decreases in average new well EUR since 2013, so far the decreases have been fairly minor in the Bakken, which is the most mature tight oil play.
Unfortunately I do not have access to recent data on well profiles normalized by lateral length for the entire Permian basin, only snapshots of individual counties or companies which does not tell the whole story in my opinion. I use that data that is available to me. The price for the full data availability is $3348 per year, more than I can afford.
Scenario with 104 thousand total wells completed in the Permian basin has a URR of about 43.5 Gb, similar to the USGS F95 TRR estimate of 44 Gb for the Wolfcamp, Spraberry, and Bonespring formations of the Permian basin (an estimate which has about a 95% probability of being at least as large as 44 Gb.
Reservegrowthrulz has hinted that my estimates are too conservative, so not all oil industry pros are in agreement on the future of the Permian basin.
Scenarios below have a 40 Gb scenario where 400 wells per month are completed from 2022 to Sept 2030 and then ramp down to zero by the end of 2034. After Dec 2021 56,670 wells are completed in the Permian basin in that scenario, I believe that scenario is too low, LTO survivor believes this is two times more than the wells he thinks will be completed (about 27000 wells for his scenario, I think). Mr Shellman thinks it will be lower than that.
It would be interesting to see what Reservegrowthrulz thinks, but my guess is that he thinks the 75 Gb estimate by the USGS would be about right for the prices I have assumed and that even higher prices (say $150/bo or higher) would make even a 75 Gb URR estimate for the Permian too low. I think the 45 Gb estimate is the minimum that is reasonable unless peak demand hits earlier than 2035 as I have assumed, lower oil prices due to peak demand in 2030 or so could lead to 40 Gb or less.
The shaleprofile.com supply projection which assumes a constant completion rate of 432 wells per month from June 2022 to December 2029 has Permian output at 6950 kb/d in December 2029, my “average” scenario (which averages the 40 Gb and 43.5 Gb scenarios) has Permian output at 7225 kb/d in December 2029, the average scenario has a maximum completion rate of 525 wells per month from March 2026 to Sept 2028 and completion rate falls to 495 wells per month in Dec 2029.
Yes but still the question: why is this area not being drilled at $106 oil and $8 gas? Is it because people in the oil biz don’t like money, or that there’s no money to be made outside of the area already being developed in the Permian?
I think it’s safe to assume that wells in this large area that is part of the USGS survey are not profitable at the current high prices or we would see a rush to develop them. What then does this say about their potential future development? IMHO it does not bode well. Yet for your models to be anywhere near accurate, these areas need to be developed…
Stephen,
Not sure what part you are missing here. The 43.5 Gb model above assumes only 25 million of 50 million prospective net acres are developed in the Permian basin (about 50% of the total). Every oil play has sweet spots, those get developed intensively, before less productive areas are developed. Currently there are shortages in man power, sand, steel tubing, and probably lots of other stuff that I am not aware of (pumps and frack spreads come to mind, maybe storage tanks, LTO Survivor and Mike could give us an extensive list no doubt). So we will not see everything developed all at once, the oil operators will develop the areas where they can make the most money.
There have been about 21,500 wells completed in the Permian basin since mid 2017 (when USGS assessments were completed) on perhaps an average of 250 acres per well, that is about 5.4 million acres. Lateral length has increased over time and now the average well is about 290 acres per well, on the 19.6 million acres in the core areas that remains we could fit perhaps 68,000 more wells.
I keep hearing output cannot increase any further, but output has increased at an average monthly rate of 35 kb/d over the past 13 months in the Permian basin ( an annual rate of about 418 kb/d). This is a slower rate of increase than 2018 and 2019, but it is not flat output, if oil prices remain high and supply chain issues and labor shortages get sorted over time we may see this rate increase.
Stephen,
My scenarios assume only half of all the net acres from the USGS mean assessments for the Permian basin get developed (about 25 million of 50 million net acres), I chose these numbers based on what I read at Mike’s blog, basically choosing the areas that had already been developed. So the “goat pasture” that Mr. Shellman often refers to is left for the goats and never gets developed in my 43.5 Gb scenario.
Note also this does not happen overnight, the wells are completed from 2022 to 2034, over a 12 year period in the scenario, which in my view is very conservative.
Also note that if producers wait and develop resources slowly, by 2035 oil prices are likey to be falling and any remaining tight oil resource will become a stranded asset and will never be developed.
That remaining tight oil that has not been developed by 2035 will be there not only for our grandchildren, it will remain in the ground our grandchidren’s grandchildren as well.
Stephen,
When I look at the map on the oilystuff post you linked I mostly see 14 to 16 wells per section width. Basically 330 foot spacing would be 16 wells per section, but note that these 2 dimensonal maps don’t show you that there are 3 or 4 benches in each section of the Wolfcamp and Spraberry, so the 16 wells shown are not really spaced at 330 feet, we likely have 4 wells per section width at 4 different vertical depths and have the 4 wells per section wdth (1320 foot spacing) that LTO survivor has said is optimal. Or that is my guess. I am sure that Mr. Shellman knows this, so it is not clear why he is claiming 330 foot spacing, in the map he shows most sections are not in fact spaced at 330 feet, that would require 64 wells per section width for sections with 4 viable benches. A minimum of 4 benches is true for most of the area of the 6 core counties of the Midland basin.
Mr. Coyne, the focal point of that post I wrote was to try and help people NOT in the oil business understand field rule spacing, how drilling units are formed and developed, regulatory restraints that affect development and how difficult it is to steer radiuses from single well pads, particularly in the Phantom Field of the Delaware Basin. Clearly in your regard, I failed: I should have used crayons.
The Field Rules for Phantom Wolfcamp and Bones Springs Fields ARE 330 feet between wells and there are numerous instances where that has been done in that fields development, here’s just one: https://www.oilandgas360.com/wpx-finds-success-330-spacing-wolfcamp/, there are others. If you had read the post you would understand the TRRC does not distinguish between benches in Phantom Field, that the Wolfcamp, for instance, is defined as a vertical correlative interval that is nearly 4000 feet thick. Same with the Bone Springs. Nothing is filed by operators with the TRRC in 3-dimensional form. The public has no way of knowing what “bench” has a lateral in it and which one doesn’t, nor do we know which benches within a correlative interval or interfering with each other or draining each other, all quite prevalent in real life.
I made no “claims,” about anything; I was trying to help. I am unclear what the point is you are trying to make in this comment other than to give credibility to your ridiculous models at my expense and the 50 plus years I have filing drilling permits in Texas. You are insulting to me, to everyone else on this forum actually IN the oil business trying to help, and to my entire industry.
Personally, I don’t even know why anyone gives you any benefit of the doubt with regard to analytical credibility. The data you live and breathe by you don’t even know it means or how to apply it in real life. You know, nor understand, absolutely nothing about oil and gas. You ask constantly for others to do your research for you, for their opinions, then pick and choose what information suits your beliefs. You really should find a different hobby.
I don’t post on anti-oil barrel anymore because I am tired of your shit. When other people do post my stuff, kindly just ignore it.
Mike,
You give the impression in your comments that 330 foot spacing is commonly used, just because that is the “rule” for allowed spacing doesn’t mean it is common practice. Yes I have read about companies trying very tight spacing for their wells, my understanding is that is was not a profitable practice and not many companies are using that approach.
Here is a quote:
Indeed, Stephen, thanks. Its a good question. At $100/$6 why is there STILL so much high grading going on in core areas of both sub-basins in the Permian, on 330 foot spacing, when wells are getting worse?
How were we supposed to interpret this comment by an oil field expert?
Are there a lot of wells spaced at 330 feet? I am sorry to insult you, I am simply trying to understand what you are talking about. I was under the impression you knew that a lot of wells were spaced at 330 feet, LTO survivor says this is bad practice (suicide was the term he used as I recall), I am assuming both of you know what you are talking about and am trying to reconcile the difference.
Perhaps you mean that most of these operators are following bad practice and are choosing 330 foot spacing? I tend to think oil operators are very smart and would choose the optimum set up, which according to LTO survivor is 4 wells per section (in a given bench such as Wolfcamp A). Do I have that wrong?
That post of yours was great, thanks. I used approximately the areas shown in your post to reduce the net acres in my model from about 37 million net acres for the most productive benches in the USGS assessments of the Wolfcamp, Spraberry, and Bonespring formations of the Midland and Delaware basins to about 26 million net acres and developed spearate well profiles for the Wolfcamp Midland wells, Wolfcamp Delaware wells, Spraberry wells and Bonespring wells using data from shaleprofile.com, that is the basis for the 43.5 Gb Permian scenario where I assume a maximum completion rate of 650 wells per month for the Permian basin as a whole is reached in September 2026 (ramping from 400 per month in early 2022) and taht level is sustained for 24 months and then the completion rate gradually falls to zero by April 2034. This cumulative output is similar to the USGS F95 TRR estimate for the Permian basin (44 Gb).
Dennis
Why is this chart different than the EIA’s LTO chart in Section 3 above?
Ovi,
In March 2022 the difference between DPR and LTO reports was DPR was higher by 687 kb/d. I assume in April and May 2022 this conventional output in the DPR regions remains 687 kb/d and deduct that amount from the DPR estimate in April and May to extend the estimate for LTO output to May (from your chart which ends in March), the monthly increase for the OLS trend is 48.5 kb/d, very similar to the estimate in your post, but with the estimate extended by 2 months to May (7962 kb/d), April 2022 would be 7829 kb/d, based on this estimate. The estimates will likely be wrong because conventional output may not remain at 687 kb/d for 3 months, and because the DPR estimates and LTO estimates will likely be revised in the future.
Dennis
Recall that the Bakken had a big production drop in April due to weather.
Two blizzards, not just one. Posted April 29.
BISMARCK, N.D. The first storm began on April 12 and lasted three days, causing production to fall to about 750,000 barrels per day. The industry had rebounded to 950,000 barrels per day when the second storm hit on April 23. That blizzard caused production to drop to just 300,000 barrels per day. Production has since increased to about 700,000 barrels per day.
Ovi,
Yes, just using the most recent DPR, as you know these projections are updated monthly. The April and May estimates in my chart are likely to be incorrect, also the data for Jan, Feb, and March from the LTO estimate are also likely to be revised in the future.
When will Mexico get in on the tight oil/gas ballgame.
Eagle Ford, for example, doesn’t stop at the Rio Grande.
I guess the longer they delay, the more they will earn from it.
Hickory,
I believe that I have read that the Eagle Ford formation in Mexico is mostly gas and not a lot of liquids. Though the price of natural gas is pretty high these days, not sure they have a lot of infrastructure in place for onshore oil output in Mexico.
I may have that wrong on Mexican areas being more gas prone, perhaps it will be developed.
OPEC fails to boost output as members face capacity woes Bold mine.
The OPEC cartel — which has struggled for many months to revive oil supplies halted during the pandemic — effectively failed to increase output at all last month, as members remained plagued by capacity constraints.
While Iraq made a substantial boost, countries such as Libya and Nigeria saw their production fall amid operational disruptions and diminished investment, according to a Bloomberg survey. Even group leader Saudi Arabia didn’t hike by as much as permitted by their agreed quota.
International crude prices are holding near $105 a barrel as OPEC’s struggle is exacerbated by a de facto embargo on Russian supplies by many refiners following the invasion of Ukraine. The lofty price levels are feeding into an inflationary spike that’s battering consumers and threatening growth, alarming policy makers around the world.
Key consumers such as the U.S. have grown exhausted with pressing the Saudis to fill in the supply gap, and taken to deploying emergency oil reserves. The kingdom’s refusal to open the taps more quickly reflects its belief that markets remain adequately supplied despite the war launched by Russia, with which it jointly leads the OPEC+ alliance of producers.
The coalition is likely to stick with its established plan, ratifying another modest addition of 430,000 barrels a day when it gathers on Thursday, according to delegates. But as the survey indicates, the group may struggle to implement much of the stipulated amount.
The Organization of Petroleum Exporting Countries added just 10,000 barrels a day in April, compared with a scheduled 274,000 a day, the survey showed. It pumped an average of 28.7 million barrels a day.
While Iraq bolstered output by 170,000 barrels a day to 4.46 million, Libya countered this with yet another stumble, slipping by 150,000 a day amid port and field closures.
Saudi Arabia added just 70,000 barrels a day, about two thirds of the permitted increment, leaving their production at 10.34 million a day — or roughly 100,000 a day below the kingdom’s target.
They wanted to increase production by 274,000 barrels per day, but they managed to get an increase of only 10,000 bp/d.
US Car Sales
To stabilize the sales numbers, either the FED must print fresh money or the oil price must fall below 50 USD.
Berndt , no need to stabilize . The industry is in a slow crash due to supply of semi conductors and other supply side issues . This is going the way of commercial aircraft manufacturing .
Many car companies are earning themselves golden water taps at the moment due to the chip shortage – here they don’t need to give any discounts most times anymore. Or they can hike prices by big amounts as for electric cars.
That’s keeping up profit. Normally you don’t buy a new car without at least 20% discount to list price here. That’s gone, and the companies pocket these 20%.
And for electric cars: VW ID.3, Tesla and Ford F150 Lightning: All sold out for this year. So big profits.
Eulen , yes the companies are creaming profits FOR THE MOMENT . It is not important how far they are sold out , could be 5 years but if they can’t produce cars then all those orders are nothing but fluff (BS) . The semiconductor problem is permanent . I will make it simple ” We cannot have resource depletion and increasing complexity at the same time ” . Here is a link and I can provide many more as to why semiconductor shortage is permanent and there is ”no way out ” . Peak car sales were in 2017 .
https://energyskeptic.com/2021/fragility-of-microchips/
Hug your car and make friends with a autoafbraak ( salvage yard ) to keep it running .
The FAO Food Price Index makes a giant leap to another all-time high in March
https://www.fao.org/worldfoodsituation/foodpricesindex/en/
Thanks for this Jeff, interesting to look at the break out numbers at the bottom of your link. Vegetable oils at 248 this month from just around 100 in 2020.
Diesel prices hit a nominal record of $5.51 this week. Interesting this is occurring without a big run up in crude:
https://wolfstreet.com/2022/05/02/price-of-diesel-spikes-to-wtf-record-5-51-gasoline-jumps-to-4-18/
Thanks Jeff,
I think the prolonged conflict will continue to inflate FAO.
In not already posted:
https://www.zerohedge.com/commodities/shale-producers-face-42-billion-hedging-losses
Looks like a lot of the money by the high oil price windfall goes to the banks.
Looks like a lot of the money by the high oil price windfall goes to the banks.
I don’t think so. Banks don’t usually deal in hedging options or oil futures. The other side of those hedges will likely be held by refineries and other purchasers of oil. However, a huge percentage of those betting on high oil prices will be just traders and speculators.
D. Coyne doesn’t believe hedging is a significant part of energy companies activities since its so speculative. So… I guess you can shove that fake news up your you know where /sarc I’m only miffed because I literally said this was going to happen like 6 months ago and Dennis absolutely shut that down, so I’m only paying it downward.
Twocats,
Actually I don’t operate in the finance world, I imagine like most of these transactions there are winners and losers. If one pays a lot of money to ensure protection from oil prices decreasing, and then oil prices increase, that is money wasted or lost when a bad bet is made. In other words if I set up a bunch of contrcts to sell my oil at $70/bo and the price goes to $100/bo, I lose $30/bo, if the price goes to $40/bo I am ahead $30/bo.
Some companies choose to not hedge and they just get the market price. Probably not many of these for large oil producers.
U.S. Domestic Oil Production: Verities And Balderdash
Summary
Shale production has plateaued and could actually be on the decline.
This contradicts expectations for substantial growth currently in place.
We discuss recent data from an industry expert that highlights reasons why these expectations simply cannot be met.
There is no such thing as a free lunch.
Looking for more investing ideas like this one? Get them exclusively at The Daily Drilling Report.
There are increasing signs that shale oil and gas production has plateaued, and may be on the decline. These facts are at odds with the EIA’s own expectations of an 820K BOPD increase in production over the next year. An estimate that’s already been shaved by 30K BOPD, and will be again. Soon, if this trend is sustained over the next few months.
This is a very long article but well worth your time. There is a lot of shale hype out there. This contradicts a lot of it.
HOLE IN HEAD
IGNORED
04/30/2022 at 6:20 am
Diesel will be the straw that broke the camel’s back .
https://oilprice.com/Latest-Energy-News/World-News/Diesel-In-Crisis-Mode-As-Prices-Break-Records.html
https://www.reuters.com/business/energy/rosneft-cuts-diesel-exports-key-russian-port-zero-2022-04-29/
I posted this . There is already rationing in Africa and Latin America . Don’t argue about crude production worry about diesel . Once the diesel goes it is full stop . Read Alice Friedman’s ” When the trucks stop running ” .
https://www.zerohedge.com/commodities/us-east-coast-diesel-stockpiles-hit-record-low-fuel-crisis-nears
Is there a highway or truck traffic trend indicator for Europe or particular countries that you know of, for following?
It will be interesting to see if the roads get quieter, like during peak Covid months.
Diesel is the one to watch .
https://www.freightwaves.com/news/the-world-is-running-short-of-diesel-product-tankers-could-win-big
I struggle to put gasoline in my car.
Yet I can figure out that Russia and the USA are in trouble regarding oil production.
The question, I have is What does Putin know about Saudi Arabia?. You know he knows more than we do.
Actions speak louder than words.
Russian oil exports outside ex-Soviet Union up 2% April 1-28
The source also said that, Russian oil and gas condensate production for the period declined by almost 9% to 10.05 million bpd, in line with an Interfax news agency’s last-week report.
Click on chart below to enlarge.
The only thing holding oil prices somewhat down now are the chinese COVID lockdowns – otherewise I think we would be already in the 150$ region.
10 year bonds topped the 3% now, junk bond index flirts with the 7.
Financing gets expensive – all the LTO companies still sitting on their hedges will have a hard time financing the new wells.
Sell low , buy high . Biden seeks to replenish the 60million barrels of the SPR . Good for higher oil price .
https://edition.cnn.com/2022/05/05/energy/spr-biden/index.html
Does he want 200$ oil? Or ration cards for everyone?
In fall he wants to refill – so instead of the +1 mbpd -1mbpd, together with the start of the european Russia boycot and higher US interrest rate (good luck financing a new shale boom).
Eulen , a great opportunity for the traders like Glencore and Trafigura . Buy discounted Russian oil at a $ 30 discount , relabel it and send it to Cushing . Washington will turn a blind eye but 10% for the ” big guy ” . 🙂
P. S : I am not joking . Remember Marc Rich of Glencore , fugitive from US living in Switzerland but was pardoned by Hilly Billy on his retirement from office . ” It is a big club and you ain’t in it ” -George Carlin .
Ron , what happened for this reversal ? We had a discussion on this and I said that when the ” men in uniform ” say to the POTUS ” enough is enough ” we can’t maintain our operational efficiency at this level of SPR , he will cave . Could be a reason ? Men in uniform matter .
HinH, once again, men in uniform do not tell POTUS what to do. He tells them what to do. The idea that the Generals could tell Biden what to do is just silly. You should know better than that.
The president does have many advisors that advise him on what might be the best course to take. But in the end he is the one that makes the decision.
Biden had raided the “rainy day” fund when it wasn’t raining.
to all experts
as we can see in the last two years, the production remains on a high plateau, respectively decreases. This is despite record high prices. One would think that maximum production would be necessary.
Now a question to all – should we set the official date for peak oil to 2019?
Best regards from Switzerland
Mike
http://www.peakoil.ch
I think 2019 is the obvious date for peak oil. 2018 for the monthly high. However, there are those who are so afraid of being wrong that they set the date toward the end of the decade. They set it far enough out so they can safely push it out a little further if the data support a later date.
But the data that supports a past peak of 2019 gets stronger every month. Even the cornucopians like Michael Lynch and Daniel Yergin have stopped proclaiming: “No peak in sight”, as they were doing just a couple of years ago.
Guys , what are we discussing ? When did the victim die ? 11.00 hrs or 11.01 hrs ? What is important is that he is dead . The dead cannot be returned to life . Accept the party is over . Peak oil never went away it was submerged under a lot of distracting issues . The monster is back .
https://economicsfromthetopdown.com/2020/11/16/peak-oil-never-went-away/
HIH,
What are you thoughts on John Michael Greer’s theory that as opposed to sudden-collapse PO is a long-term stair-case down? Conventional peaked back a few decades ago, we got the price spike but along came shale. Presumably when shale peaks (now?) we’re going to get that giant spike and somewhere another even more expensive source will be found. So on and so forth slowly stair-stepping down in sudden drops. And eventually in 100 yrs we’ll have adapted to a more de-industrialized world?
Coal to liquids will give us many more decades at around the current price. Power at 5 cents/kWh will make hydrogen at $7/kg. Add that to your coal slurry at 200 atmospheres and 400 degrees C and you are there. That wonderful world awaits us.
I wish more people would look into the inevitable Coal to Liquids future.
I think climate change is a HUGE problem, but I don’t care if it is 10 degrees warmer humans are not going to ride donkeys to work if they are sitting on coal reserves.
Australia and the US have 40% of the world’s coal reserves.
Australia has a population of 20 million (smaller than Florida) and is armed with USA Weapons.
Australia has Massive Uranium, Rare Earth Metal, Natural Gas, Coal, Shale, etc , etc reserves.
Shall I state the obvious…..
Australia’s future is to become part of the USA
for your viewing pleasure…it is already starting
https://www.youtube.com/watch?v=O9OSbXjuqUU
5 cents a kWh will make an EV get about 1.2 cents per mile. Why the hell would you turn it into hydrogen and then cook a coal slurry with it so you could then burn it in a combustion engine at 20% efficiency? Humanity is stupid, but we ain’t that stupid. Taint never gonna happen bro. Most of the remaining coal out there has the energy density of dried dog shit.
David,
I will take whatever you are smoking.
Coal to liquids are going to save the day?
LOL,
Steve
David , just because it is technically possible does not mean it is economically feasible . The only large scale CTL unit is SASOL in South Africa . It was built in the apartheid era when RSA was under sanctions . However it has been a money looser since inception . Qatar has some plans for GTL but no news about it . By the way are you aware that there is now shortage of coal . India can’t get it’s share mainly coming from Indonesia . Power production is ” back to coal ” . It is still the cheapest .
Aviation looks at Peak Oil as a ‘liquid fuels’ problem.
Coal to Liquid, Gas to Liquid are hopes to deal with it.
HIH,
150 – 200 a barrel is not going to halt Coal to Liquids when the alternative is much much worse.
Under normal conditions whether something is slightly uneconomic matters.
Under desperation, it will not matter.
Technically recoverable reserves (ones that are actually recoverable) and a proven technology (Hitler used CTL “successfully”) will be deployed.
There’s a lot of haters about the CtoL but if the LTO has taught us anything its that – if there is a source for new liquids it will be exploited. The Long Emergency – Kunstler was (in my mind) the first to really flesh out this idea of the long decline. Tom talks about the “step-down” and that’s the concept I’ve been floating for years now – Dot.com burst/Enron, Housing crash, Fukushima, Covid, now Russia-Ukraine. Periods of relative quiet interspersed with increasingly frequent catastrophes of one type or another. They may not be all even primarily peak-oil, but without the massive money printing by coordinated central banks, this system simply would no longer exist. That truth is being demonstrated as we speak with markets in basic free-fall with just two rate hikes. Peak oil puts a hard limit on growth, fake or otherwise, and the system needs growth to survive. So one way or another these step-downs will be imposed. I think the oligarchs would rather have “managed step downs” and so that’s why they are raising rates.
I tend not to listen to fiction-writing druids. Especially the one who back in 2009 said that all people who survive on medications were going to die.
Replying to Hole in Head, You have forgotten China which installed about 1 million barrels per day of coal to liquids capacity using Fischer-Tropsch. But now China has hit peak coal and polysilicon for their solar panels is now made from power from coalfields in Xiangang, 3,000 km from the coast. The Chicoms also installed a lot of coal to gas capacity – copying the technology from that plant in North Dakota. Theoretically more of the contained energy makes it to the consumer than in burning the coal in power stations. The Sasol plants have low operating costs and would be making plenty of money at the moment.
CTL talk . First what is the ” Liquid” at the end of the process ? How much cost ? How much diesel from this ? I have said earlier the energy must be ” cheap , abundant and affordable ” . All three criteria must be met . If it is not cheap it is unaffordable . Period . At $ 10 per gallon diesel the independent truckers cannot pay for their rigs and they will send the keys in the mail to the banks . They are already shedding tears of blood at $ 5.75 gallon . A CTL plant does not come cheap . It definitely costs more than drilling for oil and it takes time to construct , must be close to coal mines that have the required quality / quantity of coal to convert . Anything producing less than a million barrels per day is useless when we are already down 4mbpd today . 100000 mbpd plants do not even wet the beak . Learn from China (Dave’s post ) they ran into peak coal so now their installed capacity of 1mbpd is stranded asset . As to SASOL , as I said it has always been a money looser and their have been many times proposal for it’s shutdown . The problem is that the labor union of the plant is the voter base of the ruling ANC party so the can is kicked down the road . Sorry , it does not work economically . Not sure but on an EROEI calculation it would definitely fail the test .
Here are the top coal producers . All past peak or with quality problems . No govt or company even talking about taking the CTL route as of today .
Tom , I think CHS has a better scenario that corresponds with my line of thought on collapse . Instead of the staircase scenario it will be a mixture of Tainter’s complexity collapse and JHK ‘s ” The Long Emergency ” . Before we have lines at the pump we are going to have a financial collapse (Work in Progress ) that is going to force us to rethink and restructure our lifestyle . The Ukraine war has already started the process albeit slowly . Nations are now thinking not about buying treasuries but buying food and fuel with the surplus they have . A change in perspective . A good short read . Enjoy .
http://charleshughsmith.blogspot.com/2022/05/what-happens-when-complexity-unravels.html
I think we can safely say we are past peak at this point. Before the Russian invasion of Ukraine it appeared that we might get a lifting of Iranian sanctions and a high enough price for a surge of Permian light tight oil to get a possible new peak (at least for a brief time) around 2023-24 timeframe. Those hopes have been dashed. Even if the oil is there in the Permian it won’t get developed quick enough with so many bottlenecks, and Russia is now actively opposing the Iran agreement. Discoveries over the last few years have been pathetic. There is essentially nothing left of any consequence to extract. Hell, even the New York Times is figuring it out:
https://www.nytimes.com/2022/05/05/business/opec-plus-russia-oil.html
Stephen , LTO is not important . Diesel is king . Diesel is the marker . Watch for news on this . Yes , the world will now realize what POD means . All commenting here and the lurkers are lucky for at least they understand the predicament .
https://www.forbes.com/sites/woodmackenzie/2018/09/27/us-tight-oil-piles-pressure-on-refiners/?sh=79b4aaf77d28
Could the refinery yield shift cause a distillate shortage? In our base case, we simply don’t see it.
Although China’s diesel/gas oil yield falls, we still expect its exports of diesel/gas oil to continue to grow over the next five years reflecting the impact of ongoing investments.
Across Asia, refining investments result in the overall diesel/gas oil yield from the refining system staying at 33% of the total product supply.
European yields of diesel/gas oil remain broadly unchanged, as the growth in processing of US crudes is countered by the start up of the Johan Sverdrup field offshore Norway that provides a local supply of a heavier crude, along with the completion of various refinery upgrading projects currently underway.
Longer term, we are not expecting a distillate shortage as diesel/gas oil demand growth is projected to slow due to improving fuel efficiency and the onset of electrification of the commercial vehicle fleet.
Slightly lower yield of diesel from tight oil, but not a big deal.
Hole in head.
“Qatar has some plans for GTL but no news about it”
Pearl has been operating since 2011 so not sure why you are not aware.
Thanks Lightsout for the update . Not paying attention .
Stephen,
There is a lot of already discovered oil that has yet to be developed and as resources get developed, knowledge increases about the oil resource and estimates tend to increase (this is called reserve growth). From 1980 to 2005 (before tight oil was a thing), US reserves grew by about 63% (roughly 2% per year) see
https://peakoilbarrel.com/us-oil-reserve-growth-2/
Potentially the current bottlenecks in the Permian basin will never ease, but keep in mind that Shallow sand has mentioned that oil prices will need to stay high (over $90/b) for a year or so before oi companies start getting serious about raising capital spending, so it is pretty early in the game to judge what will happen. I expect we will see more growth from tight oil than many expect and I wiil again be saying that my so called “optimistic” tight oil models have again proven pessimistic .
We’ll see in a year or so.
Possibly so Dennis, but with Russia down a million or two for the foreseeable future and Iranian sanctions locked in place, the picture sure looks grimmer than it did at the start of the year. It seems a de-globalization process is starting to occur and this could lead to many more bottlenecks in all types of things, including the oil/gas sector.
Stephen,
I agree things have changed, it is the one constant, changes in circumstances. Makes future scenarios problematic and wrong approximately 100% of the time.
Bottom line, the future cannot be predicted.
Michael,
It takes time for high oil prices to have much of an effect on oil output, oil prices were increasing from 2005 to 2018, but World oil output was on a plateau. Average WTI oil price in 2021 was about $68/bo (which is not all that high). Oil prices were not consistently above $80/bo until 2022, it has been only a few months. High oil prices may lead to higher capital spending by oil producers and this is likely to lead to increased output. Overcoming lower output from Russia might be difficult, if so that just leads to even higher oil prices and even greater investment. It is possible all this disruption may lead to a recession, I expect that will not be permanent and as the World recovers we may see higher oil output. Difficult to foresee how it will play out, but my past experience is that the oil industry is far more resilient than many in the peak oil community appreciate.
Time will tell.
Looks like increased spending is gobbled up by inflation at the moment. Steel price, Diesel, Wages, China delivery problems, chip shortage for new equip – if you spend 20% more in construction you’re lucky to get the same as last year at the moment, at least here.
US output looks like to stall at the moment, still burning DUCs. Looks like a slow decline or optimistic a bumpy plateau for this year.
We would like to take this opportunity to thank everyone for their comments. Thank you very much !
New we have improved our site http://www.peakoil.ch and made it clearer. We think that in Europe we will soon experience the first effects of the worldwide maximum oil production. It will be exciting.
Best regards from Switzerland
Mike
http://www.peakoil.ch
“The government you elect is the government you deserve.”
― Thomas Jefferson
Europe is in ” harakiri ” mode and now the US also .
https://oilprice.com/Energy/Energy-General/US-Senate-Passes-NOPEC-Antitrust-Bill.html
Biden administration launches plan to refill emergency oil reserve
It will be interesting to see if they pay more than they are currently selling it for.
If they were smart they should slow their daily sales.
https://www.cnn.com/2022/05/05/energy/spr-biden/index.html
https://mishtalk.com/economics/u-s-senate-passes-antitrust-bill-targeting-opec-its-ridiculous-and-ironic
NOPEC – US bill to break up OPEC Passes
“Instead of buying US weapons, look for Saudi Arabia to turn to China and perhaps even Russia.”
Gulp!
Russia’s Oil Output Is Plummeting, And It May Never Recover
Russia’s oil output is plummeting, and the decline is expected to worsen in May.
OPEC recently warned that markets could see the loss of more than 7 million barrels per day of Russian oil and other liquids exports.
With many global producers constrained in their capacity to boost production fast, oil prices are likely to remain elevated for the foreseeable future.
This is very important. Russian oil production may never recover Production in Western Siberia and in the Urals was on the verge of collapse before the war. Now their collapse is certain. This was 60% of Russian production. This is far more serious than most people realize. If there was any doubt as to whether world oil production had peaked before this war, that doubt has been totally removed now.
Ghana will be no help in the attempt to keep peak oil at bay. While world production of oil increased slightly, 1.45 %, from 2020 to21, Ghana’s oil production went the other way, declining by 17.7 %.
Oil production falls by 17 % (Ghana) Bold theirs
Crude oil production in the country declined by 17.7 per cent from 66.93 million barrels (bbls) in 2020 to 55.06 million bbls in 2021.
A report released by the Public Interest and Accountability Committee (PIAC) cited flow assurance issues, inadequate pressure support for the Ntomme field, challenges in water injection on the Enyenra Field, increasing gas-oil ratio in the Ntomme field, as some of the factors for the decline in the period under review.
The below EIA chart looks a little suspicious. They have production data declining by exactly 2,000 bp/d every month from April 2020 through December 2021.
Click on chart to enlarge.
Apparently, they want to get a nuclear power plant. I don’t know how they would be able to finance this but I guess they are aware of the scarcity of their oil reserves.
World Car Sales
The diagram below shows the sum of car sales five areas as a proxy for the world. I used it to determine a function, how car sales numbers change with oil price.
The blue arrow is at about 4,8% of BOE, which is about 44 USD today. Six months after the arrow the car sales numbers turn negative. A fit resulted in the formula for the relation between oil price ($) and sales (N): N($)=71185-$*1602. The sales values have a delay of 6 months relative to the price.
Below an oil price of 44,43 USD the sales numbers increase, above it they decrease 6 months later.
So we can expect the following numbers for the months:
__________USD, relevant____Sales change
May______81,05___________-58657
June______74,17___________-47635
July_______86,51___________-67404
August____97,13___________-84417
September_117,25_________-116650
October____104,58_________-96352
Total_______________________-471115
The prices are known, they are from EIA (Brent) , for Nov.21 to Apr.22.
Lets see how good this prediction is.
Bulgaria, Hungary, Slovakia, Turkey are categorized as Europe consumption that have no plans to shut off Russian oil. Germany and Austria want at least a year. Hungary has suggested 5, provided the EU provides pipeline infrastructure from the west at EU expense.
There is talk about India refineries. India has 4.7 mbpd of refinery capacity, which was their national consumption in 2020. They import refined products. They export refined products. In fact, it’s a huge business for them. It has been more than suggested that Russian imports to India will go to Europe as refined product. This will undercut the embargo severely. Have seen no mention of exporters announcing they will abrogate long term customer contracts to shift output to Europe.
In 2020 Russia suffered a 1 mbpd production decline from Covid. I have seen nothing mentioned that these shutdowns became permanent because of . . . something. In fact there has been discussion over the years about how one might make production decline permanent. Some terrorist/Iran/Yemen attack on Ghawar would certainly be expected if permanent shut down could be created.
Don’t know why it is presumed Russian shut downs would be permanent.
OPEC and participating non-OPEC oil producing countries will adhere to plans for a gradual oil output increase, amounting to 432,000 b/d in June. The news follows the conclusion of the 28th Ministerial Meeting held via videoconference May 5. (Really) !!!
The decision was made amid the volatility of the markets caused by Russia’s invasion of Ukraine and new COVID-19 lockdowns in China. The meeting also came a day after the European Union (EU) proposed for new sanctions against Russian oil (OGJ Online, May. 4, 2022).
During the meeting, it was noted that continuing oil market fundamentals and the consensus on the outlook suggest a balanced market. It further noted the ongoing impact of geopolitical factors and issues related to the current pandemic.
OPEC now expects world oil demand to increase by 3.67 million b/d in 2022, down 480,000 b/d from its previous forecast. China’s lockdown measures are dampening demand for transport fuels and petrochemical feedstock.
https://www.ogj.com/general-interest/economics-markets/article/14276091/opec-to-increase-output-by-432000-bd-in-june
At this point I think it’s safe to just knock a zero off the end of whatever OPEC says it will increase, so maybe 43K next month
SEPPO,
I was listening to the Twitter Chat including Anas & you. I also saw the Twitter replies where Anas said that Colin was fired from his job due to Fraud and Theft. I thought this sounded a bit odd, so I reached out to Jean Laherrere and he replied today that he never heard of such a thing and didn’t have much good to say about Anas.
So, I looked up Anas Alhajji and found out he isn’t a trained Oil Geologist or Petroleum Reservoir Engineer, but rather a trained Economist or Energy Economist:
Prior to joining NGP, Dr. Alhajji taught economics at the University of Oklahoma (1995 to 1997), the Colorado School of Mines (1997 to 2001), and Ohio Northern University (2001 to 2008), where he held the George Patton Chair of Business and Economics. Dr. Alhajji taught courses in economics, energy economics and policy, and energy geopolitics.
Dr. Alhajji was educated in Syria, Saudi Arabia, and the United States. He holds M.A. in Economics, and a Ph.D. in Economics from the University of Oklahoma, with a specialization in energy economics and policy.
So, it seems to me that Anas is more of an Armchair Oil Geologist Wanna-Be rather than someone who understands oil in the ground.
I wouldn’t put too much credibility on Peak Oil, Oil Depletion, Falling EROI, or the Thermodynamics of Oil Depletion from Anas.
steve
Steve,
I looked at a couple of Alhajji’s publications and agree with your assessment.
Steve and Schinzy
I do not not know what to say as I am trying to avoid a “food fight”. By the way, Anas Alhajji’s source is no other than Michael Lynch. I still have emails from 2003-4 from Michael Lynch in which he admits that he does not know mathematics even at the level of solving the logistic equation, which is possible at the end of a years course of calculus. He made his name in the shadow of Morris Adelman, who also thinks that the resources in the ground do not matter, and believes like Julian Simon, that when the trouble comes and we run out of copper, we can just transform lead to copper. (I am not sure of the exact quote but in essence he said this)
No need to comment more on Michael Lynch as Ron Patterson well knows.
SEPPO,
Thanks for your reply and the info on Anas’s 90 variable model to predict oil. So, not only is Anas an Armchair Oil Geologist, but he also fails at the scientific principle of KEEP IT SIMPLE STOOPID.
Now, while I did not study high-level mathematics in college, I mastered the ability to know WHO to Listen to and who to IGNORE. This is much more important because I have come across a lot of very smart PhDs in mathematics that lack God-given logical common sense.
I see many ultra-smart people on Twitter who think Batteries, Solar, Wind, Geothermal and the new VUNDER-TECHNOLOGY of Hydrogen are going to save us.
Lastly, then there is the last group I call the “WISHFUL SUBSTITUTERS.” You know, the ones that think we are going to transition to Coal to Liquids, LNG, or something else when one energy source becomes problematic.
However, they fail to realize the SPECIAL CRUDE OIL is what allows the elevated production of coal and natural gas.
The world is not prepared for PEAK OIL or the coming ENERGY CLIFF.
steve
“You know, the ones that think we are going to transition to Coal to Liquids, LNG, or something else when one energy source becomes problematic. ”
Hitler was able to get Coal to Liquids working. Yet 80 years later we can’t?
Trim 100 billion off the US military budget and you could subsidise the whole industry.
Give me a break!!!
Peak Avocado is right. In the long term it is either nuclear or nothing. Ideally that will be plutonium breeder reactors, not U235 burning light water reactors. That technology hasn’t been optimised yet and we are running out of time. In the meantime there are enormous amounts of low grade coal that is too low grade to be taken anywhere. Just hydrogenate it and we are producing retail products on the spot. Conserve to convert. When that runs out it will be biomass – newspaper, corn stalks, grass clippings. The plastics have got to come from somewhere.
Regarding complicated models,
“Einstein is reputed to have said that every model should be made as simple as possible and no simpler.”
Further
Freeman Dyson was talking about his model with John von Neumann and von Neumann interrupted him and asked how many parameters does your model have. Dyson answered four. To which von Neumann answered, “with four parameters I can make a graph in the shape of an elephant, with five I can make is trunk wiggle”.
But people like Dennis here thinks that Hubbert’s logistic model is just curve fitting. Would they say the same about the Lotka-Volterra predator pray model. They would have a point if the parameters need constant adjustment to fit the data, over many periods, like many econometric models do. However, the logistic model has no adjustable parameters as there is a rigorous way to estimate them. To be sure the URR has kept moving to the future as new data has come in each year. Now do the following thought experiment. In 2005 you predict the peak oil to be in 2015 and you notice form past calculations that the peak moves 1/4 year into the future when you add each year’s result. When will the logistic model predict the peak to be. I will help with this algebra 🙂
p = 2015 plus 0.25 (y minus 2005)
(when I try to post this the plus sign disappeared, so I wrote it thus)
Now set y=p and the answer is p=2018.333. This is roughly what has happened since 2005. So I have managed to take care of the drift of URR into account.
By the way there is a claim also that Colin Campbell had used faked data.
Anas Alhajji @anasalhajji
May 6
The data that Colin used was faked.
Seppo,
If one makes a specific set of assumptions about how resources are developed, the logistic is a special case for a more general solution. It is clear when one looks at the data over time that the Logistic is not necessarily the best fit to the data. Also there is no physical justification for a logistic model, it simply a convenient heuristic with a relatively simple solution. Over the 1998 to 2019 period the solution for the URR has varied from 1750 Gb (in 1998) to 4000 Gb (in 2019) for World C plus C URR (using a trendline fit to the previous 11 years in a Hubbert Linearization simplified analysis.) So over 21 years we see a 2250 Gb increase in URR or about a 107 Gb per year increase on average. Note that I think the 4000 Gb estimate is likely wrong (too high by about 1000 Gb in my view), sometimes a model can be too simple.
Dennis, again I am responding to the thread that Steve started, as I cannot reply to your answer directly. This is what the exchange with Michael Lynch was in January 2003. (The > symbols are from the email chain where he quoted my email to him) when he said that the URR estimates are arbitrarily assigned and not estimated by the Hubbert’s method.
—————————-
> My point about the historical production curve is not that new > estimates or URR show up in the historical record, but that the > logistic model which is carried out today can be used to predict the > future production reasonably well and the model can be carried out > every year. If one does this, what happens is that the URR > increases slowly with time and the parameter ‘a’ decreases slowly in > time. Assuming that they are constant leads to a MODELING ERROR. > > > However, this is not fatal, and having carried out the analysis at > > the beginning of each year, with production data from previous 10 > years, and a cumulative at the beginning of the data series, yields > > peak production to be somewhere between 2004 and 2009, with peak at > > the end of 2006 as the latest analysis and URR 2060 Gb. If I take > account the increasing URR trend in the data, the best one can hope > for is peak at 2012. This is close enough for me to be worried > about the peak. >
—————————-
So we got the shale “revolution” and the prediction was wrong. I admit this, but Dennis you sidestepped my comment on how I have figured out how to quantify the drift to account for the move to a higher value of URR. Note that I saw already in 2003 that the URR keeps increasing when the logistic model is used. The task then was to quantify its yearly increase.
I have never claimed that the Hubbert’s model is based on geology and know that it is a model used to analyze the past data. I also know that there are many other models that attempt to do this including Gompertz, generalized logistic, Richards, von Bertalanffy and others. I have experimented in the past with Gompertz and found it completely unreliable. The trouble with these complicated models is that they have too many parameters and they can be criticized exactly by the fact that these parameters can be adjusted to fit the data. It is for that reason that I find the logistic model the best. It does not allow me to fiddle with any of the parameters except how many years include in the logistic extrapolation to determine the URR and the parameter “a”, the exponential growth rate and final decay rate. I do not try to predict the trajectory in countries such as Iran or Libya where political factors make the use of this model inappropriate. But if one lumps the OPEC minors together, the fit to the logistic curve becomes more reasonable, as I have posted before.
Dennis, you are hammering on the same issue time and time again and even told that this kind of analysis is like “astrology”. What is your purpose in saying that, please answer this to me, would you?
Dennis,
I read your answer above again and I see that you said this;
“If one makes a specific set of assumptions about how resources are developed, the logistic is a special case for a more general solution. It is clear when one looks at the data over time that the Logistic is not necessarily the best fit to the data. Also there is no physical justification for a logistic model, it simply a convenient heuristic with a relatively simple solution.”
I already addressed the fact that “the logistic is a special case for as more general solution”. But what do you mean that the logistic is not necessarily the best fit to the data? You must be referring to the past data, as that is the only thing we have. I am not fitting the past data, I only use the last 25 years to predict the URR and “a”. So whether logistic equation fits or does not fit the past data is irrelevant. By that statement you seem to be confused about how to model non-renewable resource exhaustion.
I have mentioned before about there not being a need to justify it by geology. But as I said, non-renewable resource exhaustion has to satisfy some criteria rooted in geology. (coal, oil, natural gas, copper, gold, etc)
What conditions does a model equation need to satisfy? The cumulative production must be a positive definite increasing function and asymptote to a finite value.
A derivative of such a function might have many maxima. One such was during the 70’s and one might emerge after the large drop during the COVID epidemic and Ukrainian war. So far the 2019 maximum holds and time will tell if a new one emerges. On a fine enough scale there were more of these but it would be pedantic to talk about them, even the ones associated with the Kuwait war and 2008 financial crisis.
Functions of this kind are found in probability theory. Many of them have compact support and many do not. This means that they are zero outside a certain interval i.e. support or not. Rather they drop to zero at plus and minus infinity as one moves away from the peak.
By experience and data fitting those who practice probability theory have decided to model various phenomena by certain functions, Poisson, Gaussian, etc here is a list
https://en.wikipedia.org/wiki/List_of_probability_distributions
Clearly none of the data in the world fits any of the models exactly. Even in the coin toss the possibility that it will land on its edge is ignored.
So when you talk about heuristic, I do not know how that term applies to this. As the term is used it does not fit into this discussion.
Seppo,
Sorry to offend, not really familiar with your past conversations with Michal Lynch, I don’t remember the astrology comment, if I said it I apologize, that’s a dumb thing to say, I am surprised I said it.
In any case, I use Hubbert Linearization to give me a ball park estimate for conventional, generally it seems to increase over time, when looking at conventional (excludes tight oil and oil sands) the estimate for URR increased from about 1740 Gb in 1998 to 2520 Gb in 2019. As I said in a previous post I expect 2016 may remain as the final peak for conventional oil. Based on the HL currently 2500 Gb would be the conventional URR, but I expect this may increase as has generally been true in the past.
Your estimate seemed roughly correct for peak year, what was the U estimate?
Dennis
I accept your apology and note that this sentence is in active sense, and not
“apology accepted”, and the difference means that I accept it sincerely.
This is what I have
Qlow = 2731.1 … Q_0 = 2816.9 … Qhigh = 2905.5 …
These numbers are based on 95 % confidence interval. What does this mean? It only means that when the last 25 years data are used there is a 95% confidence that all the data fall between the confidence interval. It does not mean that the above estimates satisfy this criterion, since these are extrapolated values. Be as it may, it appears that this is best we can do.
The corresponding peak years are:
Tlow = 2019.0 … Tpeak = 2019.7 …. Thigh = 2020.4 …
The corresponding “a” values are
4.17% …. 4.11% ….. 4.11% ….
The graph includes the peak years (they do not agree exactly with the numbers I have above, but close enough)
Seppo,
I was using heuristic in the computer science sense, see link below, especially the pitfalls section.
https://en.wikipedia.org/wiki/Heuristic_(computer_science)
I agree no probability model fits the data exactly.
Dennis
One more thing I meant to add. You use Laherrerre’s value for the URR for the world and his estimate is based on the Hubbert’s logistic model. How is that you use a value from a model that is no better than astrology? 🙂
Here is the graph of the peak years. Note how slowly the peak year and URR drifted before the shale revolution took hold. Also, there is a slight discrepancy with the values I posted above because the 2021 data is missing
Seppo,
Are you sure I said that, maybe you are thinking of Robert Rapier? Yes I use HL and get a result of about 2500 Gb in 2021 and this has grown from about 1700 Gb in 1997, I expect the result may grow to 2800 Gb in the future, basically I am taking the 2500 Gb estimate and averaging with the Geological estimate by the USGS which has a mean value of 3000 Gb (I round up to the nearest 100 Gb as the estimate is very rough). This is my estimate for conventional C plus C only, in the past I have presented a low model assuming 2500 Gb for conventional, a medium model with 2800 Gb of conventional and a high model with 3100 Gb of conventional oil. The dispersive discovery model I use for my discovery model fits backdated discovery data to an equation of the form:
Cumulative output=K*POWER(t,6)*(1-EXP(-U/(K*POWER(t,6))))
where the equation uses Excel notation, K is a constant (1.45E-6), t is years after 1869.5, and U is total ultimate discovery (2800 Gb). For the fallow, build, and mature stages of the oil shock model 13 years for average period using a maximum entropy probability distibution for each stage is used and actual production data is used to find historical extraction rates from mature producing reserves. That is my model in a nutshell for conventional C plus C (actually it is Paul Pukite’s Model, aka Webhubbletelescope). On top of this I add the Canadian energy regulator’s scenario for future oil sands output and guess at what this might look like after 2035 (not really much of a model there) and for tight oil I use the model I have presented here in the past for Permian, Bakken, Eagle Ford, Niobrara, and other US tight oil.
Seppo,
Your analysis seems excellent, but it always seemed frustrating that the fits seem a bit arbitrary because we can choose different years in the analysis, it is useful to give us some ballpark in my opinion, but it seems nice to combine the analysis with geology or geophysics coming from experts at the USGS. I will try to be better at not offending in the future, I sometimes try to be funny, but I am no comedian, I just get rolled eyes (or groans) from my family when I attempt humor, so I should refrain here.
OPEC+ is a joke. The ten nations that make up the Non-OPEC segment of OPEC+ peaked at about the same time as OPEC, 2016 for the month and the peak 12-month average was in 2017. They have done nothing since.
Click on the chart below to enlarge.
The OPEC+ nations, less Russia is basically nothing. Well, they are a drag on OPEC+ because they are well past their peak which was in 2014.
Click on the chart below to enlarge.
Ron , the world is still in the denial stage , what is surprising for me is that even some intelligent blokes here continue not to recognize the facts . If this is the state with the intelligent then what can we expect from the ignorant ? Makes me go hmmmm .
Ron,
That is an annual decline rate of about 112 kb/d for the OPEC+ nonOPEC nations less Russia from Jan 2015 to Dec 2018. Not really a very big decline rate. This group of nations without Russia is not really very important in the grand scheme of oil output,
Airlines in a major oil exporting nation shutdown because jet fuel is ” unaffordable ” . Yes it must meet the three criteria ” Cheap, abundant and affordable ” or else—-
https://simpleflying.com/nigerian-carriers-shut-down-rising-fuel-costs/
Post from Matt Mushalik from down under .
https://crudeoilpeak.info/will-the-world-ever-reach-peak-crude-production-of-november-2018-again-part-1
From SAF Group
https://safgroup.ca/vitol-absent-massive-oil-demand-destruction-the-supply-cushion-from-opec-will-be-at-a-point-which-is-alarming/
Diesel shortage should create a lot of demand destruction. When business start shutting down and jobs disappear due to lack of fuel. Demand is going to fall off a cliff.
Prices won’t stay high during a depression. But the thing is even when oil is half the price it is now a lot of unemployed people won’t be able to afford it at half price.
I don’t think majority of people can’t even remotely grasp how far life styles and quality of life will drop over next 5-10 years.
Welcome to energy poverty.
Diesel prices are unaffordable even today for the US trucker .
Germany and China have no export orders .
Something on rising interest rates . If we take off from current situation :
1% rise will mean $ 530 billion extra .
2% rise will mean $ 750 billion extra which is the defense budget .
3% rise will mean $ 1 TRILLION extra which is the Social Security budget .
Better to let inflation loose . HHH , a lot of dollar inflow from the EM’s to USA . All FII ( Foreign Institutional Investors ) cashing out . All EM’s are tanking .
A lot of the dollars that are in EM’s didn’t come from US banks or via trade. Those dollars were created outside US. European banks and Japanese banks lend dollars to EM’s all the time.
Dollars can flow to US from EM’s. But EM’s can also default on these European and Japanese banks.
China and lack of dollars flowing into China and outright dollar’s following out of China is very deflationary for the price of oil and commodities in general.
Germany and China have no export orders . Recession .
Sanctions have forced Russia to cut its oil output by 1 million barrels a day.
Sanctions against Russia have knocked 1 million barrels of crude oil off its production each day — but that’s just a “drop in the ocean compared to the intended impact,” according to Mike Muller, the Asia head of Vitol, the world’s biggest independent crude trader.
Russia was producing about 11 million barrels of crude oil a day until it invaded Ukraine in late February. Of that, it exported about 7 million barrels a day. But sweeping sanctions and boycotts of its products have disrupted trade and cut demand, forcing Russia to cut its supply. The European Union is also planning a total ban on Russian crude.
SNIP bold mine
“Many, many pieces of the world economy are sitting on the fence — and notably the two biggest countries population-wise in the world are continuing to find ways of accessing Russian oil,” he said, referring to China and India.
Despite the appearance of resilience, Russia’s energy sector is likely to come under further stress as the European Union plans to ban oil from the country. S&P Global expects Russia’s crude oil output to face “peak disruptions” in August, falling by about 2.8 million barrels a day.
Ron
Looks like Biden’s SPR release of 1 Mb/d for 180 days will offset Russia’s decline for a few months. And then what happens when the US proposes to start buying oil in September to refill the SPR?
Ovi , “If we assume the ‘natural’ y-on-y oil demand growth is now ~850k b/d (please, give me a bit of rope on the estimate), then DoE buying back 60m barrels over a year lifts demand by 20% to >1m b/d. And it would take DoE three years to replenish what it plans to release over 6 months ” Javier Blas Bloomberg .
Well, 1 Mb/d might do it for April and perhaps May but not for six months. And, in six months, oil production will very likely be well below the pre-invasion level. That means it will be a horrible time to start buying oil to refill the SPR. So it is most likely Biden will put off trying to refill it right away.
I have no idea what Biden will do then and I have no idea where oil prices will be then. But I strongly suspect oil prices will be much higher in September.
I read earlier (a few months before the start of the war) that Russian oil companies wanted to sort out between the unprofitable oil wells from the still profitable ones during the spring 2022. I suspect that Russian oil companies took the pretext of Occidental sanctions to close the wells that were more than half depleted and whose operating conditions worsened with their temporary closure during the oil production cuts period caused by the covid confinement. I write this because a group of experts said that after a decrease between February and April, Russian oil production has stabilized.
Russia update . We will see if they can increase .
https://oilprice.com/Latest-Energy-News/World-News/Novak-Russias-Crude-Production-Up-In-May.html
Yeah, I read this earlier. They produced 10.28 million bp/d the first three days in May. No one should get their hopes up.
I am reading the book World for Sale by Javier Blas who writes about the large trading companies such as Glencore, Transfigura, and particularly Vitol, which seems to get oil out from every sanctioned country. Mark Rich, whom Clinton pardoned was a central figure in these.
Seppo , The oil will flow . I have mentioned Marc Rich in my earlier post . So now the EU PLANS not to sanction tankers because they fly flags from Greece , Malta and Cyprus but will target insurance providers . F***ing idiots . This applies to only SEABORNE cargo but the oil to EU is mainly via pipelines . Hey , Iran and Venezuela are denied insurance from London but their oil still flows . EU is now useless . Too many Chiefs not enough Indians . 🙂
P.S : This a plan . Can they implement it ,? Now that is another matter .
Tycoon Says North Dakota Oil Field Will Yield 24 Billion Barrels, Among World’s Biggest
Billionaire Harold Hamm is convinced thereʼs 24 billion barrels of oil to be coaxed from the Bakken field of North Dakota and Montana. No one has more acres there than he does.
https://www.forbes.com/sites/christopherhelman/2011/06/27/tycoon-says-north-dakota-oil-field-will-yield-24-billion-barrels-among-worlds-biggest/?sh=39c67b684678
The Irony of Harold Hamm’s claim of 24 billion barrels is that being the largest producer in the Bakken, the company didn’t complete one well in the first two months of 2022 in the Williston. Instead, Hamm diversified into the lousy Powder River Basin and purchased some overpriced acreage in the Permain… LOL.
According to Shaleprofile, these companies completed wells in the Bakken during JAN-FEB 2022:
Grayson Mill Energy = 11
ExxonMobil = 11
Marathon = 10
Hess = 10
Crescent Point Energy = 5
Continental Resources = 0
Turns out that Harold Hamm was a Huckster
steve
My North Dakota Bakken/Three Forks URR estimate is 8 Gb, the USGS mean TRR estimate is 10 Gb and the USGS F95 estimate is about 8 Gb (this is based on the USGS 2013 Bakken/Three Forks Assessment). The Hamm estimate was always considered a bit dodgy, they were claiming average well EUR of 500 kb and the reality was more like 300 kb at the time and eventually new well EUR decreases. He also overestimated the number of wells likely to be completed (his guess was 48,000 wells) as I expect the total tight oil wells completed in North Dakota will be under 25,000 with an average EUR for all wells completed at about 320 kbo.
Dennis,
If you wish to learn just how wildly inaccurate you are regarding future Bakken/TF production, the short (9 page) presentation from Justin Kringstaad (ND Pipeline Authority) offers compelling info. March, 2022 release date, easily available online.
The brief audio/video version expands upon the presented data, with commentary upon early well production profiles explaining your (incorrect) assumptions of stable/deteriorating hydrocarbon potential. (Hint, choking back early production to facilitate gas capture. $6/mmbtu at Northern Border is a keen incentive, along with complyimg with state regs).
Coffeeguyzz,
We have had this conversation before, it is possible some new technology proves profitable, especially at $100/bo or higher. Currently capital tends to flow to the cheapest cost, most highly profitable area and that is the Permian basin for onshore L48 production. Keep in mind I use estimates for barrels of oil only for the Bakken, natural gas prices are not very good in North Dakota as transport costs to LNG terminals are too expensive. I think the 8 Gb URR estimate is reasonable at $75/bo, at higher oil prices perhaps 10 Gb is possible (again this is C plus C only and does not include NGL or NG).
One thing that stands out as a mistke in that presentation is the low scenario for WTI at $10/b, when oil prices are that low Bakken completions will fall to zero and output will drop like a rock.
Dennis,
” … output will drop like a rock”.
One of the main motivations of my decade long following this site is to continue to learn why people hold such wildly differing views on hydrocarbon scarcity/abundance than I do.
Your comment – buttressed by that 2011 Forbes piece linked above by Steve – is additional ‘fodder’, so to speak, on just why I continue to learn so much about this Shale Revolution.
The Northern Border pipeline feeds the US midwest, so your comment about LNG destinations and transport costs is a bit puzzling.
While many factors contribute to transport fees for producers to ship natgas, 40 to 60 cents per dekatherm (~1,000 cubic feet) is a frequently published price range.
For a good Bakken well producing 500 million cubic feet of natgas, $6/mmbtu throws off $3 million gross revenue.
Not too shabby when a typical Bakken well runs $6/$8 million to D&C.
Steve’s mention above about zero Continental completions during Q1 2022 (hello, North Dakota winter, anyone?) prompted me to go over their recent quarterly transcript
Turns out Continental did 301 Bakken workovers in the first quarter.
Production uplift over 50 bbld, with cost paid out in 2 weeks.
Of course, naysayers will continue to disbelieve.
That is fine.
The fact that many more operators are receiving Investment Grade status is both irrefutable as well as being ignored by skeptics .. along with demolishing the “unpayable” debt myth.
… and so it goes
Coffeeguyzz,
Doubtful that these wells will payout at $10/bo even with $6/MCF for natural gas. Also if natural gas prices remain at that level, natural gas will lose its hold on the electric power market as solar, wind, hydro, geothermal, and nuclear power expand and take market share from natural gas. When that occurs (perhaps around 2035 or so in OECD nations), natural gas prices will fall due to lack of demand and most natural gas will remain in the ground as it will no longer be profitable to produce.
Note that gross revenue is not important, it is net revenue that matters. The transport price varies from place to place, the cost in North Dakota will be higher than Pennsylvannia.
The comment about production dropping had to do with no new well completions. When that occurs production drops quickly. That is just a fact.
The main reason production is paltry in the Bakken is due to the absolute mania in the Permian basin. EOG is mowing down the Delaware. Occidental is moving at warp speed. Pioneer is more cautious. The infrastructure is much better in the Permian and so is the weather. The Permian has eclipsed everything else. They won.
Of those listed completions in the Bakken, those 5 wells by Crescent Point are on acreage where I own a few minerals and a couple of those Marathon wells are too. These are very good wells; indeed, a cut above your usual Permian well. And I’m not here to make a pejorative, or to cheerlead. Just to offer my opinion.
Before this so-called transition comes to be, we’re going to need to milk what we can from Mother Earth, in the friendliest way possible. I strongly suspect that by the end of hydrocarbons as we know them, the Bakken and the Niobrara and the Hogshooter in the Granite Wash are all going to be called upon. I think the terminal part of the future in oil and gas will be played by vertical conventional wells drilled into well delineated fault blocks that act as oil traps, and that fairly inexpensive wells capable of reliably producing 25-100 bopd will be the saviors of American energy.
But please don’t bury the Bakken before its time. With ethane re-injection, maintenance of reservoir pressure, longer laterals in shallow but oil dense benches, the Bakken has a lot more life in it. And there are some damn fine operators up there.
Gerry,
Not saying that Bakken/Three Forks is done, about 4 Gb has been produced from the roughly 16,400 wells completed to date, I expect another 6600 wells will be completed (at minimum) for a total of 23,000 wells, if the URR ends up being 7.6 Gb, with high oil prices it is possible that the URR will be higher.
Generally the oil men here say my scenarios are too optimistic, it seems you may be a bit more optimistic than me on the Bakken, or that is the impression I get from your comment, any guess as to the URR for the Bakken?
No guess about the # of Bakken wells, except to say that, in my estimation, before this massive energy transition is completed the world will have experienced stunning electricity shortages and even famine in some areas. As a desperation measure, I suspect that all the basins that have been labeled “mature” or “depleted” are going to be re-examined.
I grew up in such a basin. The sweet spots 30-40 years ago are, in many cases, still producing. There was very little infill drilling b/c of complex geology (granite slabs turned on their side by a deep upheaval), but with current GPS, directional drilling is now a reality and there’s a lot more down there. Plus, it has huge gathering stations and pipelines. There is a jet landing strip. It was a going Jesse and then the party moved on.
Other areas are niche spots: the NG of western Oklahoma and Kansas is relatively high in helium, which is scarce now. There is a guy with 2 rigs happily drilling into the Mississippi Lime. The Bakken also has niche NG: it’s rich in ethane, which is a far superior lifting gas than methane, as well as being a great scavenger to prevent clogs from the larger molecule naphthalenes and asphaltenes.
So yes, I’m an optimist about the Bakken. And the Niobrara and Eaglebine and Hogshooter and even the ancient Hugoton. There are a lot of places that contain oil. Drilling a vertical well into a fault block is relatively inexpensive. Chug-along wells are great assets. The Dunkirk rescue was done using mostly small boats. Therein is a lesson.
The terminal bit—to prevent chaos and collapse—will be production from any place with infrastructure in place, currently underutilized. There are a lot of these, and they have a great future. When the world begins to experience hydrocarbon scarcity before green energy is ready to take on the load, the “mature” Bakken will probably look pretty good. And so will many other basins not named Permian—though it will do its share.
Gerry , being not US based , what is the situation with the water in the oil patch with the mega drought I keep reading . What are the effects in the oil country ? Also need some info on waste water disposal .Thanks in advance .
Coffeeguyzz,
The scenario below is conservative, but well profiles will deteriorate in the future, sweet spots can increase a bit with technology, but geology always wins out at any given oil price level.
SRS, no offense, but I do not agree with your post and tone condemning Mr. Hamm. Whatever you say about his methods, he has accomplished great things in his life and created huge production gains for the U.S. One hell of an entrepreneur.
Further, it feels like the short Jan-Feb time frame smells of limiting stat time to prove a point…
For example. I recently received division orders on six new Continental Bakken wells in McKenzie County, ND. The Harrisburg wells. First production is Nov-Dec, 2021 and all still looking good on volumes so far on latest check detail through Mar 2022. Point is… I am real life proof of six recent Continental Bakken completions… who know how many others are out there you missed.
Remember, there is better and more authentic boots on the ground data out there than fantasy Shaleprofile can Algo.
Gungagalonga,
The shale profile data is from state agencies which is really the only publicly available information, there may be private data held by individual companies, but they only report what they must and tend to protect their intellectual property carefully. Mr Shellman suggests the shaleprofile data is excellent and on that point we are in agreement, I think Shallow sand may also agree that the shaleprofile data is very good.
Note that the supply projections available for free assume constant completion rate (currently 64 new wells per month) and no change in new well EUR, the current estimate is 1169 kb/d in Dec 2029. If I use similar assumptions for my model and assume completions fall to zero in Jan 2030 I get 925 kb/d in Dec 2029 and a URR of 7.8 Gb (cumulative output in Dec 2040). My average well profile is likely different from what shaleprofile uses, their well profile is likely more up to date, I have not updated my average Bakken well profile for more than a year so if average output per well has increased in that time my model does not reflect that increase.
Factoid: A typical military tank requires 10 gallons of diesel to start the engine, and about 2 gallons of diesel per mile travelled.
Reasonable estimate is 1000 total tanks in Ukraine, sum of both sides. Travel minimal — 10 miles per day.
Sum of fuel per day reqd — 714 barrels of crude/day only by the 1000 tanks. If you adjust for only a portion of
the barrel being diesel, it’s rather more than 714.
Nice calculations. I guess now the reason why Ukrainians are so dedicated to destroying and damaging the Russian tanks (361 on 641 tanks lost as of this writing) : they are dedicated to reducing of diesel consumption by the tanks.
Probably not why. But regardless, the 1000 estimate for total tanks in theatre still running . . . way too low. Russia’s MoD claims 2900 Ukraine tanks killed. I’m sure big numbers are claimed by the Ukraine side.
Both are wrong, but 1000 is almost certainly too low. Maybe a X4 to 4000. That’s a lot of diesel burned per day and carried point A to point B.
Crude Oil
102.86
-6.91(-6.29%)
Quite the hit—-
Hightrekker
You beat me by 8 minutes. Your reply wasn’t there when I first checked.
We are certainly not getting that much demand destruction when prices are kept reasonable. At least not in the US, and a bit more but not that much in Europe as well. Japan will cope (some temporary subsidies). For the rest of the world a bit worse due to the strong dollar. Lower oil prices give some relief. Mostly where consuming gasoline is most important, because diesel prices and jet fuel prices are sky high most places.
Producers on the other hand should be quite happy with the prices, as long as they stay over 100$ for a prolonged period of time.
WTI down by $7/bbl.
No obvious reason for such a sharp drop except for China slowdown, dollar strength and collapsing markets.
I think others have predicted oil price volatility, I agree with them. The stock market is also down sharply today and since Fed rate hike last Wednesday and expectations of future aggressive Fed action. The sentiment seems to be that we should expect a recession, which seems reasonable as the Fed seems to be taking aim at creating a recession to tame inflation. In the past week WTI went from 102 to 110 and back to 103, to me the moves usually lack rhyme or reason.
Hungary declared it wants to veto the EU deceision to boycott russian oil.
The head of EU diplomacy, Joseprel, in an interview with the Financial Times: “EU countries should consider withdrawing Russia’s frozen foreign exchange reserves and returning them to the reconstruction of Ukraine after the war.”
The Europeans announced this decision after it became known that the United States had already decided to confiscate the assets and assign them to Ukraine. The Americans have made a decision, but have not yet formalized and announced it. Previously, the US took control of the Afghan Central Bank’s enforcement of the prosecution’s assets to prosecute victims of terrorism. So what happened to the Americans worked out. Similar decisions are being prepared by Canada, as well as a number of other Western countries.
Everyone wonders why Ukraine gives such loans, and how Ukraine will repay these loans. Do not be surprised. Everything is pre-calculated. The West and lend-lease, and loans are going to be repaid at the expense of Russian money.
The Brif telegram channel, which often contacts insiders from the Kremlin, says that in the event of the transfer of gold and foreign exchange reserves of the Russian Federation for the restoration of Ukraine, even if only partially, gas will be cut off for 100% of European consumers. After that, the Ukrainian GTS will be destroyed, and the supply of oil and gas will be turned off because of the danger in Belarus. After the completion of the operation in Ukraine, users urgently need to launch the Nord Stream 2 gas pipeline, as well as renegotiate gas contracts at prices close to spot markets.
The information posted in the Brif is more like a blowout to prevent the transmission of the FRR (Foreign Reserves) signal. Assuming that it would have been voiced by someone in power, and not by an anonymous telegram channel. It is doubtful that such radical measures will be applied in Russia. The refusal to offer energy carriers will hit everyone hard, including Russia. If Russia had been ready to take this step, it would have taken it even at the moment of freezing the gold reserves.
Hi Alexander , thanks for the update . Hope all is ok at your end .
In the meanwhile Germany keeps shooting itself in the foot . They are building LNG terminals but they can’t get any gas .
https://dohanews.co/germany-qatar-disagree-over-lng-supply-conditions/
The refineries are making a killing .
That is for sure the case. Refineries are sure to optimise for the heavier molecules now (diesel/kerosene). The US refineries will work with a high utilisation to make more of the most requested products short term I would guess. But if the imbalance stays, and Russia, Middle East and China are holding back on their diesel refining for some reason. Questions would be asked about what is going on. The Middle East is at least for now exporting diesel to Europe, and most likely they would like to be somewhat neutral as to who gets their oil or products (my speculation). China is also exporting products to the US, but overall exports (to all) are trending down.
$ 136 billion gone baby gone in the shale patch . Bankruptcies galore .
https://www.oilystuffblog.com/chart-stuff
Only 2 billion of that was in 2021, tight oil companies are doing quite well in 2022 so far.
57 billion in 2016 and 53 billion in 2020 account for the bulk of these bankruptcies. This happens in capitalism, businesses fail.
Haynes and Boone believe the tide has turned and this will be their final report on oil industry bankruptcies.
Link to full report
https://www.haynesboone.com/-/media/project/haynesboone/haynesboone/pdfs/energy_bankruptcy_reports/oil_patch_bankruptcy_monitor.pdf?rev=e57d3129b7504ea190df5d33dbacae44&hash=F461E4FE13446BE821B8AE9080C349E6
Colombia, an oil exporter, will become an oil importer by 2026. Their oil production is dropping and will drop by another 47% unless they get a massive infusion of new CAPEX.
Colombia must promote hydrocarbons or face importing oil, says industry group
BOGOTA, May 9 (Reuters) – Colombia’s government must promote exploration and production of hydrocarbons or face the end of self-sufficiency in both oil and gas by 2028, the country’s private oil producers association said on Monday.
Colombia’s oil and gas industry is a major source of income and foreign exchange for Latin America’s fourth-largest economy. The government of President Ivan Duque – whose term ends in August – has pushed to grow the Andean country’s dwindling reserves.
SNIP
However, weakening exploration and production will cause oil and gas output to drop by 47% and 27% each during the next five years, as well as bring in 34 trillion pesos less in investments and income, and could make the country need to import gas from 2026 and oil from 2028, the association added.
Click on graph to enlarge.
Courtesy Mr Art Berman .
This graph doesn’t make sense- it appears base production drops from ~30bcf/d in 2020 to ~25 bcf/d if no wells are drilled (-16%). Likewise to get ~50% decline it would take 5 years —2016 production was ~20 bcf/day and 2021 would be 10 bcf/day if no wells were drilled after 2016.
OK Cowboy,
The data on the chart looks right, but the title looks wrong. The decline rate for all wells drileed through Dec 2020 looks to be 1-25/32=0.219=21.9%. Sometimes Mr. Berman gets things wrong.
On second thought his title may be referring to only the 2020 wells and how much they decline in the first year. It is difficult to approximate this from the chart, but for Permian basin natural gas, the decline for 2020 wells over the first year was about 35%, but for all wells completed from 2008 to 2020, the decline in output over 2021 for all wells completed over that 13 year period was about 22%, data from shaleprofile.com.
Thanks Dennis for bailing me out . You sir, are a gem .
Hole in head,
Not your chart, I usually assume the experts get things right and don’t note any mistakes, I do think the title on Art’s chart is far from clear. Maybe he should have said “wells completed in 2020 decline by 46% per year in 2021” he might have had text that said as much, I don’t read his stuff.
The OPEC Kingpins know oil production is headed down, but no one will listen. Politicians have told everyone that peak demand is about to happen, so everyone has stopped investing. Supply and demand pay little attention to politicians’ wish lists.
OPEC Kingpins Warn About World’s Dwindling Energy Capacity
The oil ministers of Saudi Arabia and the United Arab Emirates warned that spare capacity is decreasing in all energy sectors as producers slash investment, causing everything from crude to diesel and natural gas to trade at or near record highs.
“I am a dinosaur, but I have never seen these things,” Saudi minister Prince Abdulaziz bin Salman, who’s been attending OPEC meetings since the 1980s, said Tuesday at a conference in Abu Dhabi, referring to the surge in prices for refined products. “The world needs to wake up to an existing reality. The world is running out of energy capacity at all levels.”
The prince’s UAE counterpart, Suhail al Mazrouei, said that without more investment across the globe, OPEC+ wouldn’t be able to guarantee sufficient supplies of oil when demand fully recovers from the coronavirus pandemic.
“We’ve been warning about the lack of investment,” he said in an interview, also in Abu Dhabi. “That lack of investment is catching up with a lot of countries.”
Saudi Arabia and the UAE are among the few producers investing in greater output. They’re spending billions of dollars to raise their crude capacity by 2 million barrels a day between them by the end of this decade. Most others are struggling to get funding as shareholders and governments encourage a shift from fossil fuels to renewable energy.
Ron, here is a report on the same, if one does not have unlimited access to Bloomberg articles.
https://www.argusmedia.com/en/news/2329845-use-all-energies-amid-capacity-crunch-urge-saudis-uae?backToResults=true
Thanks, Seppo. From your link, bold mine:
“The world needs to wake up to an existing reality,” Saudi energy minister Prince Abdulaziz bin Salman told an energy conference in Abu Dhabi today. “The world is running out of energy capacity at all levels — be it upstream, midstream or downstream. We are running out of capacity in manufacturing… [and] in supply chains,” he said.
The term “running out of spare capacity” is code for “we are all producing flat out and nothing but decline awaits us.” Saudi and the UAE are spending billions in an effort to increase production by 2 million bp/d, between them, by 2030. I doubt they will make it but it should halt the decline. But even if they do increase production by that much that will not come close to making up for the decline in the rest of the world. Russia alone will decline by more than 2 million bp/d by 2030.
World C+C production was 3 million bp/d below the 2019 12-month average peak in January. They will very likely be 4 million bp/d below that peak in January 2023.
Ron uses a trailing 12 month average which peaked in April 2019, if we use a centered 12 month average the peak was November 2018, so for those of us that prefer a centered average, the peak was 2018 and those that like a trailing average would call the peak in 2019. I agree OPEC is pretty close to capacity, though in time they might increase their capacity with more investment, in addition unconventional oil from the US and Canada could increase by 4 Mb/d and we may see increased output from Norway, Brazil, and Guyana, the rest of the World (excluding OPEC big 5 and Russia) might decline by about 1.5 Mb/d over the next 6 years, if Russia drops by 2 Mb/d, the World would be down by 2.5 Mb/d from the peak. Note there is 1.3 Mb/d of Iranian capacity unavailable due to sanctions and that from Dec 2021 to March 2021 OPEC increased output by 680 kb/d, adding these gets us about 2 Mbpd, leaving us 500 kb/d below the peak. Can Norway, Brazil, Guyana, and OPEC big 5 raise output by about 500 kb/d over the next 6 years? This would amount to a 83 kb/d annual increase in output for these 8 nations or roughly an average annual increase of roughly 10 kb/d for each of these 8 nations.
Also see
https://a9w7k6q9.stackpathcdn.com/wpcms/wp-content/uploads/2022/04/Russias-invasion-of-Ukraine-and-global-oil-market-scenarios.pdf
This analysis by the Oxford Institute for Energy Studies has a reference case where Russian output falls by 1.1 Mb/d and they expect about 1.5 Mb/d of supply to be added to the World supply from OPEC+ from March to September 2022.
This analysis by the Oxford Institute for Energy Studies has a reference case where Russian output falls by 1.1 Mb/d and they expect about 1.5 Mb/d of supply to be added to the World supply from OPEC+ from March to September 2022.
Yeah, here is what they say:
In both cases we assume OPEC+ stick to their current agreement with producers gradually increasing supplies on a monthly basis by 0.4 – 0.432 mb/d till September 2
But with most OPEC+ producers already producing near maximum capacity, we expect total OPEC+ to be able to return only 1.5 mb/d between March and September 2022, versus the pledged 2.9 mb/d.
And if you look at the chart just below those words they show April 2022 production not up by the predicted .432 Mb/d but up by only about half that amount. Bullshit! You know and I know OPEC+ will be down by over half a million bp/d in April 2022. Dennis ???? words fail me. And by September, OPEC+ has a far greater chance of being down than being up. The + part of OPEC + will be down about 1.6 to 1.8 Mb/d by September. I do not believe the OPEC big 5 will be up by that much, therefore OPEC+ will be down by September, not up.
Oh, Guyana is in steep decline. You need to remove them from your “save the world from peak oil group.” And about Brazil, bold mine:
U.S. asked Brazil’s Petrobras if it could raise oil output; it said no
RIO DE JANEIRO, May 10 (Reuters) – U.S. government officials in March asked Brazil’s state-run oil company Petrobras whether it could increase crude output after Russia’s invasion of Ukraine sent global prices soaring, three people with knowledge of the matter told Reuters.
They came away empty-handed, the sources said.
Officials at Petrobras, formally Petroleo Brasileiro said output levels were a function of business strategy rather than diplomacy and also that a significant short-term production boost would not be logistically possible, the sources said.
Ron,
The analysis was published in early April, they couldn’t have known what OPEC output would be in April at that point. Guyana is not Ghana. Long term (over next 6 years Brazilian output will be higher. It is expected that output will be up by 1000 kb/d by 2025.
See
https://www.globaldata.com/oil-production-in-brazil-boosted-by-growth-of-international-oil-companies/
Interesting post from Novilabs, new owner of shaleprofile.com
https://novilabs.com/novi-presents-at-spe-permian-event-inventory-exhaustion-in-the-midland-basin/
We trained a machine learning model in the Midland Basin to analyze existing well performance and forecast production at undrilled locations around the basin. We analyzed breakevens for Lower Spraberry, Wolfcamp A, and Wolfcamp B wells at 880’ and 1320’ spacing, with 2000 lbs/ft proppant intensity. We binned drilled and remaining locations into five tiers based on forecasted EURs and NPVs. Using conservative assumptions of at least 1000’ spacing away from parent wells, we find that approximately 60% of Tier 1 locations have been drilled, 50% of Tiers 2-4 have been drilled, and 40% of Tier 5 has been drilled. These numbers compare favorably to older plays like the Bakken, where over 90% of top-tier locations have already been drilled. This suggests that availability of high-quality inventory should not be an obstacle to aggregate Midland Basin performance, though that may not hold true on the individual operator level.
This may suggest there is room for the Permian basin to grow.
Dennis , “We trained a machine learning model ” . Now . whom would you send out to bat if your life depended on it ? The machine learning model vs SS , LTO’s , Mike S etc . ? For me it would be the second part of the versus . For you , I don’t know . Best of luck .
Hole in head,
I like models and data over anecdotal evidence. Shaleprofile.com is now part of Novilabs, generally Mr Shellman has good things to say about shaleprofile and he has linked to work from Novilabs at his blog so I think he believes they do good work. Basically it is another data point, I think there are a variety of opinions in the oil industry on any given subject. A lot of the oil industry is moving to AI as there are a lot of variables to work with and the relationships are not always straightforward.
Dennis , so for you , posts and comments by SS , LTO’s , Mike S etc are anecdotal evidence ? Do me a favour . Next time you go to a restaurant ask your meal to be cooked by AI and when you go for a haircut ask that be done via AI . Try learning how to swim via AI , someone who tried this is buried six feet under . If you think technology will answer your problems , then you don’t understand technology — and you don’t understand your problem .
Hole in head,
Technology can be very useful, it does not solve all problems, but can offer insight.
Post below is an example
https://novilabs.com/complex-oil-well-spacing-optimization-completion/
Has anybody heard from Enno Peters lately? He has not responded to comments at the shaleprofile blog since April 4 and there was supposed to be a Permian update by April 22 and he never responded to a comment from April 19, last blog post was April 15. I hope he is ok.
The EIA’s Short-Term Energy Outlook is out. They have revised their non-OPEC outlook down. They now have December 2023 total liquids production .6 million bp/d below the November 2018 peak.
Click on the graph to enlarge it.
The EIA’s Short-Term Energy Outlook has Russia’s total liquids production dropping 1 million bp/d in April and another .5 Million bp/d in May then gradually dropping another .84 million bp/d by December 2023 for a total decline of 2.34 million bp/d.
Click on graph to enlarge.
What will Europe do now ?. It is action by Kiev not by Moscow .
http://thesaker.is/this-is-just-too-delicious-not-to-sitrep-quickly-ukraine-calls-force-majeure-and-halts-1-3-of-european-gas/
Confirmed
https://www.zerohedge.com/commodities/eu-gas-futures-jump-ukraines-grid-operator-halt-flows-key-entry-point
Hi HOLE IN HEAD.From Wednesday, the GTS operator of Ukraine (OGTS) stops gas transit to Europe through the Sohranivka gas distribution station in the Luhansk region. This is stated in the message of the operator posted on Tuesday on its website.
“OGTS informs that from 07:00 (coincides with Moscow time) on May 11, 2022, gas will not be accepted into the Ukrainian GTS at the physical point of the Sokhranivka junction,” the message says. “The operator reports the occurrence of force majeure circumstances that make it impossible for further gas transportation through the Sohranovka GIS and the border compressor station (CS) Novopskov, which are under the control of the Russian Federation.
The operator notes that “the Novopskov compressor station is the first of the compressor stations of the Ukrainian GTS in the Luhansk region, through which almost a third of the gas (up to 32.6 million cubic meters per day) is transited from Russia to Europe. The company added that ” in order to fulfill transit obligations to European partners in full, it is possible to temporarily transfer inaccessible capacities from the physical point of the Sohranivka connection to the physical point of the Sudzha connection, which is located on the territory controlled by Ukraine.
The company also added that currently its employees cannot “exercise operational and technological control over the Novopskov CS and other assets located in these territories.”
Sergey Kupriyanov, official representative of Gazprom:
Gazprom today received an official notification from the Gas Transportation System Operator of Ukraine that the Ukrainian side, citing force majeure circumstances, stops accepting gas for transit through the Ukrainian GIS Sohranivka from 07:00 on May 11, nominations for transportation will be rejected, gas will not be accepted. The GTSU operator proposes to transfer all transit volumes to the Sudzha GIS. At the same time, a notification was received from NJSC Naftogaz of Ukraine that in the event of continued gas supply from the Russian side to the Sohranovka GIS, the volumes at the points of exit from the GTS of Ukraine will be reduced accordingly.
In this regard, Gazprom declares that it has not received any confirmation of the circumstances of force majeure, does not see any obstacles for continuing work in the previous mode, Ukrainian specialists have been working calmly at the Sokhranovka GIS and the Novopskov CS all this time ”and continue to do so, transit through Sokhranivka was provided in full, there were no complaints from counterparties and there are none.
Gazprom fully fulfills all its obligations to European consumers, supplies gas for transit in accordance with the contract and operator agreement, transit services are fully paid.
The transfer of volumes to the Sudzha GIS, based on the Russian flow scheme, is technologically impossible, the distribution of volumes is clearly stated in the cooperation agreement dated December 30, 2019, and the Ukrainian side is well aware of this.”
A new thread Non-OPEC January oil Production has been posted.
https://peakoilbarrel.com/non-opec-january-oil-production-rises/
A new open thread Non-Petroleum has been posted.
https://peakoilbarrel.com/open-thread-non-petroleum-may-10-2022/