A guest post by Ovi
Below are a number of crude oil plus condensate (C + C ) production charts for Non-OPEC countries created from data provided by the EIA’s International Energy Statistics and updated to January 2022. This is the latest and most detailed world oil production information available. Information from other sources such as OPEC, the STEO and country specific sites such as Russia, Brazil, Norway and China is used to provide a short term outlook for future output and direction for a few countries and the world.
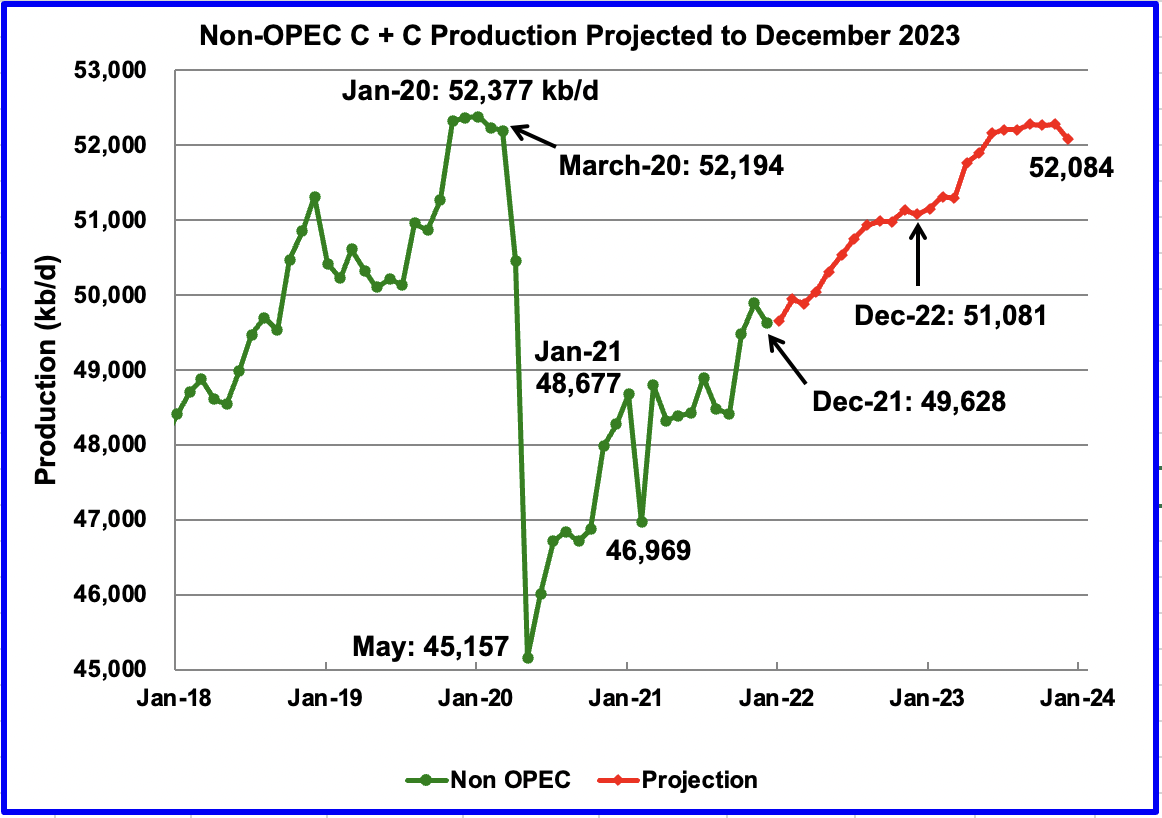
For comparison, December Non-OPEC chart posted in previous report. No Russian oil sanctions
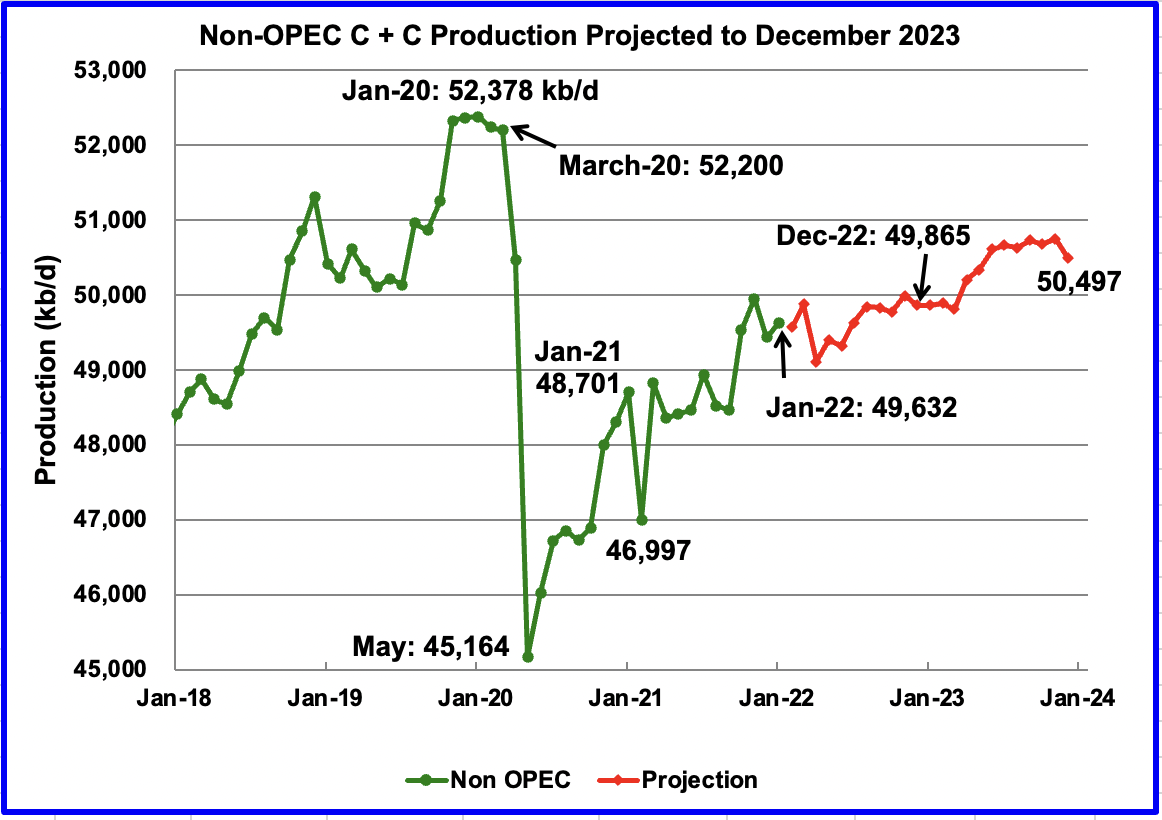
Updated January Non-OPEC chart with impact of projected Russian oil sanctions.
Since the last report, the sanctions on Russian oil production have shown up in the Russian April production chart. (See Russia chart below). The EIA has taken that information into account in their May STEO report. The previous December Non-OPEC chart (first chart) has been retained to better illustrate the change.
January Non-OPEC production increased by 198 kb/d to 49,632 kb/d. Of the 198 kb/d increase, the biggest increases came from the China 307 kb/d and Brazil 194 kb/d. Offsetting the increases were decreases from the U.S. 216 kb/d and Norway 114 kb/d. Note January’s output was 4 kb/d higher than the original December output of 49,628 kb/d, revised down to 49,434 kb/d in the current January report
The January 2022 output of 49,632 kb/d is 2,568 kb/d lower than the March pre-covid rate of 52,200 kb/d.
Using data from the May 2022 STEO, a projection for Non-OPEC oil output was made for the time period February 2022 to December 2023. (Red graph). Output is expected to reach 50,497 kb/d in December 2023, which is 587 kb/d lower than shown in the December report. Comparing December 2022 output from the December report (first chart) with the current January report, the current STEO is showing a production drop of 1,216 kb/d.
Note the production drop of 803 kb/d in April in the projected red graph associated with the drop in Russian production.
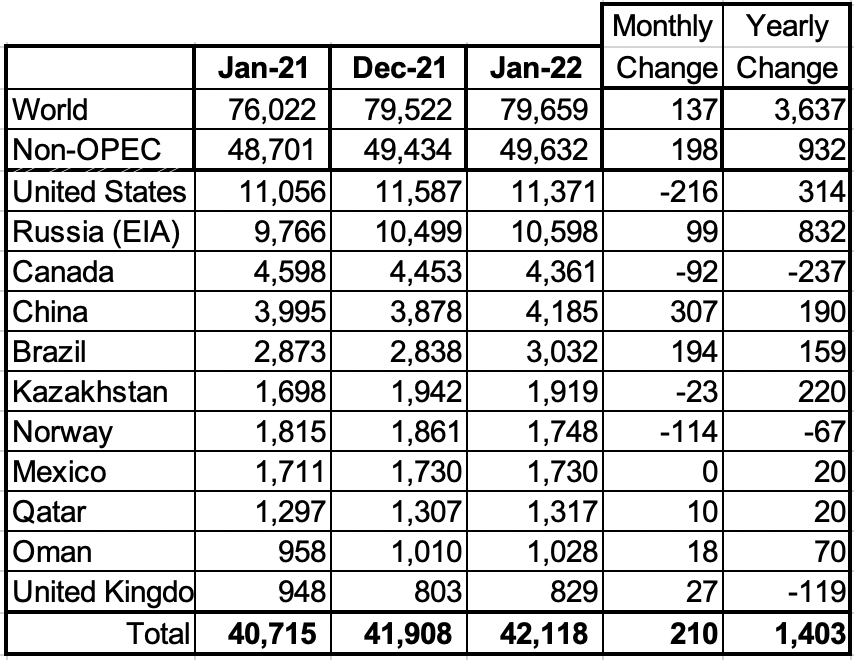
Above are listed the world’s 11th largest Non-OPEC producers. The original criteria for inclusion in the table was that all of the countries produced more than 1,000 kb/d. The UK has been below below 1,000 kb/d since January 2021.
In January 2022, these 11 countries produced 84.9% of the Non-OPEC oil. On a YoY basis, Non-OPEC production increased by 932 kb/d while on a MoM basis production, it increased by 198 kb/d to 49,632 kb/d. World YoY January output increased by 3,637 kb/d.
Production by Country
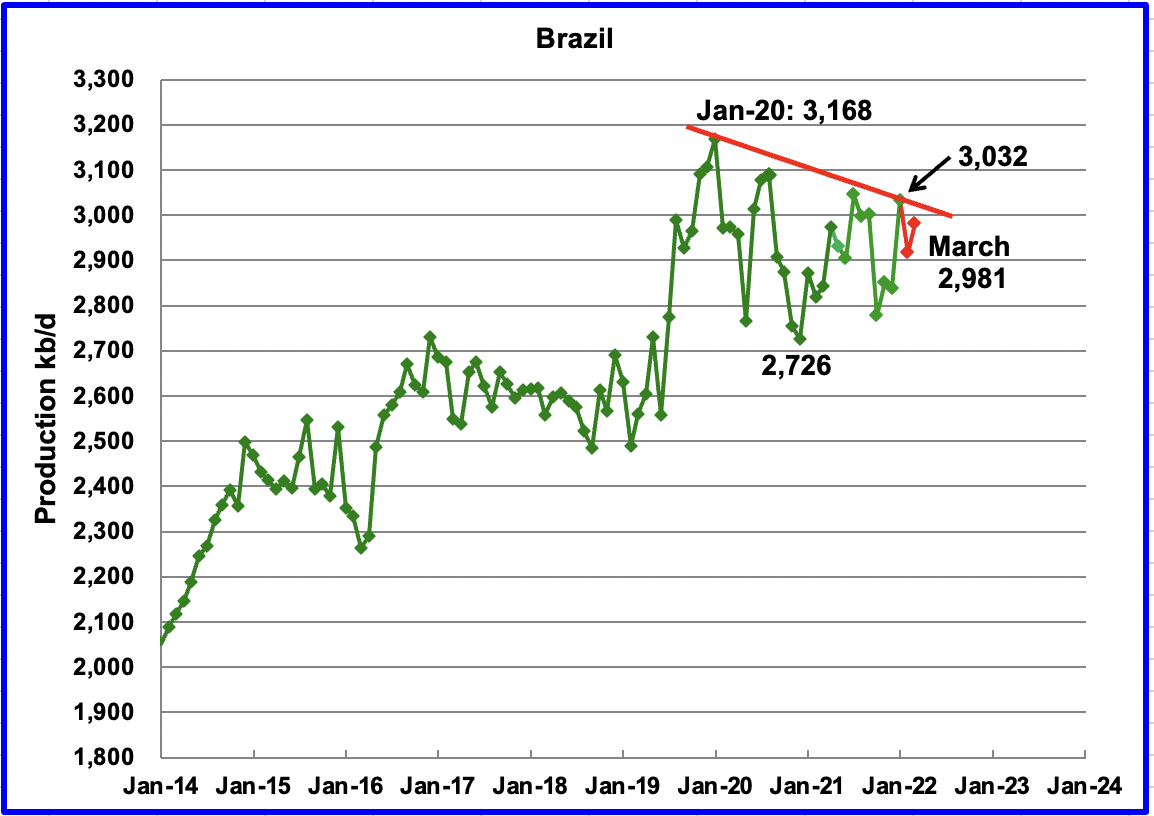
The EIA reported Brazil’s January production increased by 194 kb/d to 3,032 kb/d. Brazil’s National Petroleum Association reported that March’s output increased to 2,981 kb/d after February’s decline. (Red Markers).
Brazil continues to experience difficulties in increasing its yearly output. However according to the IEA, production in 2022 is expected to increase in 2022. “The main growth in 2022 will be driven by the continued ramp-up of the Sepia field which came online in August 2021, along with two start-ups of Mero 1 and Peregrino Phase 2. The Mero-1 (FPSO Guanabara) was planned for processing capacity of 180,000 b/d of oil and 12 MMcm/d of gas.”
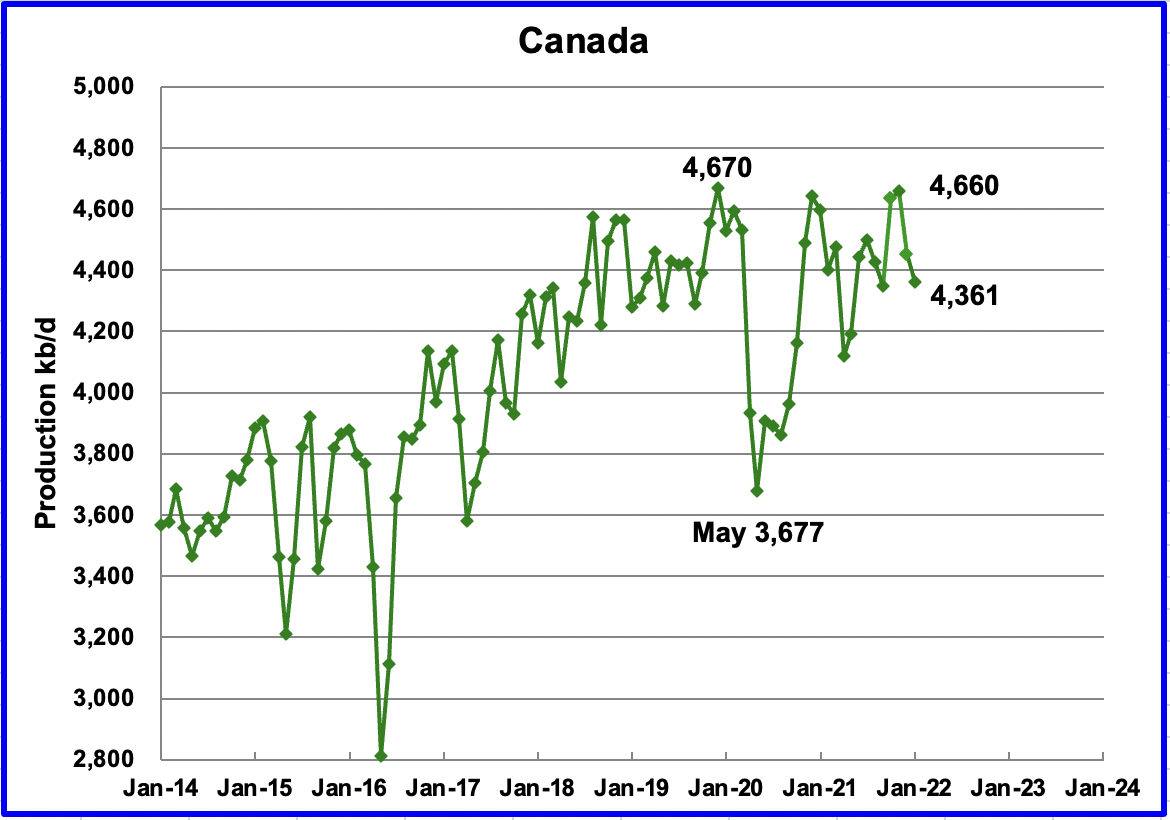
According to the EIA, Canada’s January output fell by 92 kb/d to 4,361 kb/d.
Rail shipments of crude oil to the US continue to slow. February shipments were 7.7 kb/d lower at 124.8 kb/d than January’s 132.5 kb/d.
Canadian Natural Resources CNQ (NYSE), Canada’s biggest oil producer, reported Q1 earnings. Below are some interesting operating cost numbers to compare with LTO.
- Thermal in situ operating costs averaged $14.35/bbl (US$11.34/bbl) in Q1/22, an increase of 26% over Q1/21 levels. The increase in operating costs was primarily due to higher energy costs.
- Operating costs in the Company’s primary heavy crude oil operations averaged $22.00/bbl (US$17.38/bbl) in Q1/22, an increase of 16% compared to Q1/21 levels, primarily due to higher energy related costs.
- The Company’s world class Oil Sands Mining and Upgrading assets continue to deliver safe and reliable production. Operating costs remain top tier, averaging $24.60/bbl (US$19.43/bbl) of SCO in Q1/22, an increase of 24% over Q1/21 levels, primarily as a result of lower production volumes at Scotford, together with higher energy costs, turnaround and maintenance related costs.
Line 5 is under another new threat. According to this source, Enbridge’s Line 5 pipeline faces a second shutdown risk in the Great Lakes area after an Indigenous band asks U.S. court for injunction
The Line 5 energy pipeline is facing another threat of shutdown: A Wisconsin Indigenous band has asked a U.S. court for a quick judgment on an application to evict the pipeline from its land.
The Bad River Band of the Lake Superior Tribe of Chippewa, which filed its application earlier this year, is asking a U.S. federal court for a permanent injunction that would require owner Enbridge Inc. ENB-T to “cease operation of the pipeline and to safely decommission and remove it.”
This latest risk to Line 5 is on top of an effort by Michigan Governor Gretchen Whitmer to cease the pipeline’s operations over fear of an oil spill in the Great Lakes. The Canadian government is trying to quash that attempt via negotiations with the United States.”
He noted that the Wisconsin band granted permission via a signed agreement 1992 for Enbridge to operate on the reservation until 2043.
Hi, my name is Canada. I’m an oil superpower
That was the headline editorial in one of Canada’s national papers on Monday May 9.
“Exports of all goods in March reached a new monthly record of $63.6-billion, Statistics Canada reported, surpassing the previous high of $58.7-billion, set in February.
The surge is powered by oil. Energy now accounts for more than a quarter of Canada’s exports, a level last hit in 2014, when crude prices were also on a tear. Back then, Stephen Harper was a vocal booster of the oil industry, and not much interested in talking about climate change. Today, Justin Trudeau is the opposite. Yet for all the Liberal government work to try to cut Canada’s carbon emissions, the economy remains as dependent as ever on pumping oil.“
The article notes the conundrum Canada faces, increasing oil production while meeting ever increasing climate change goals. “If and when the rest of the world starts aggressively pursuing policies to lower demand for oil, then prices for and production of Canadian oil will inevitably fall. Until then, Canada should have no qualms about allowing our industry to prosper and grow, with one major condition: That it heavily curtail its own emissions.“
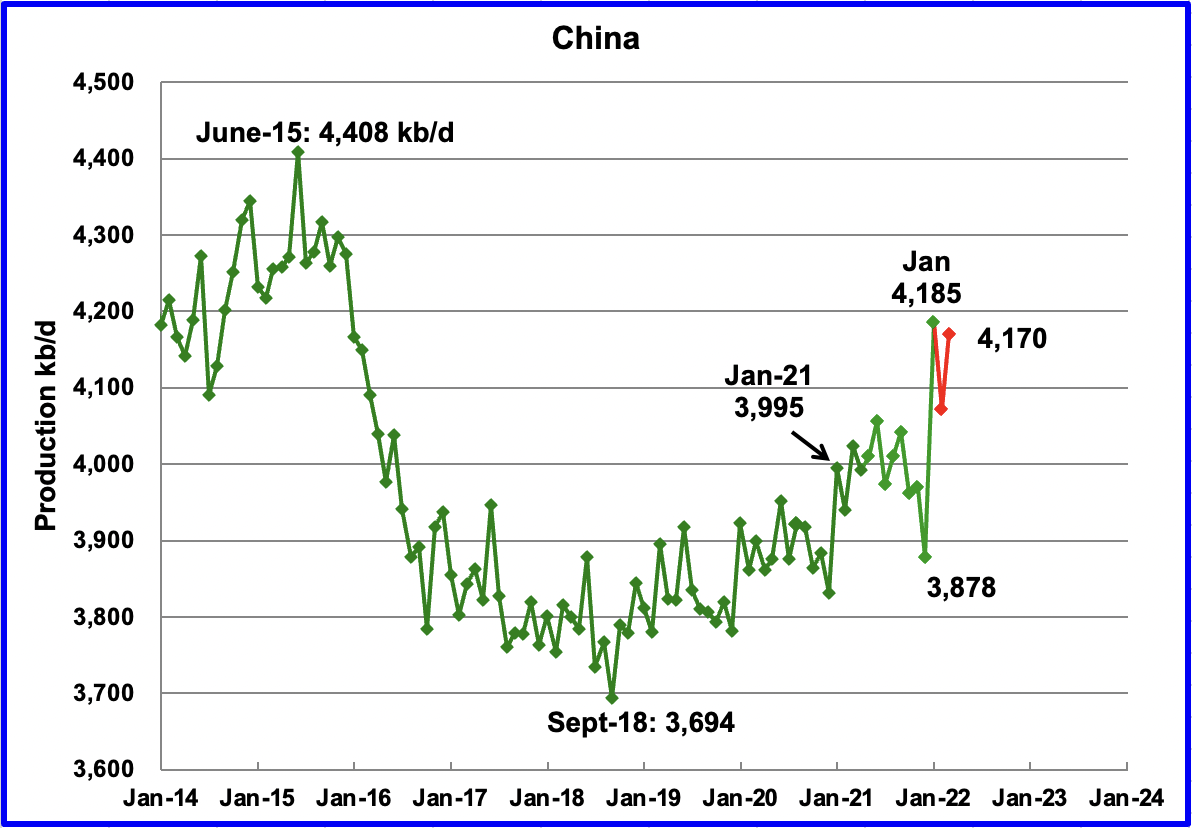
The EIA reported China’s output increased by 307 kb/d to 4,185 kb/d in January. China reported that its output dropped in February but rebounded to 4,170 kb/d in March. (Red markers).
Is this production increase since January 2021 due to the startup of new fields? China has reported the start of new oil production here and here. In related news, CNOOC revealed in early 2022 that, as part of its strategy for the year, it would increase oil and gas production in the next three years while advocating for and encouraging green energy transition initiatives.
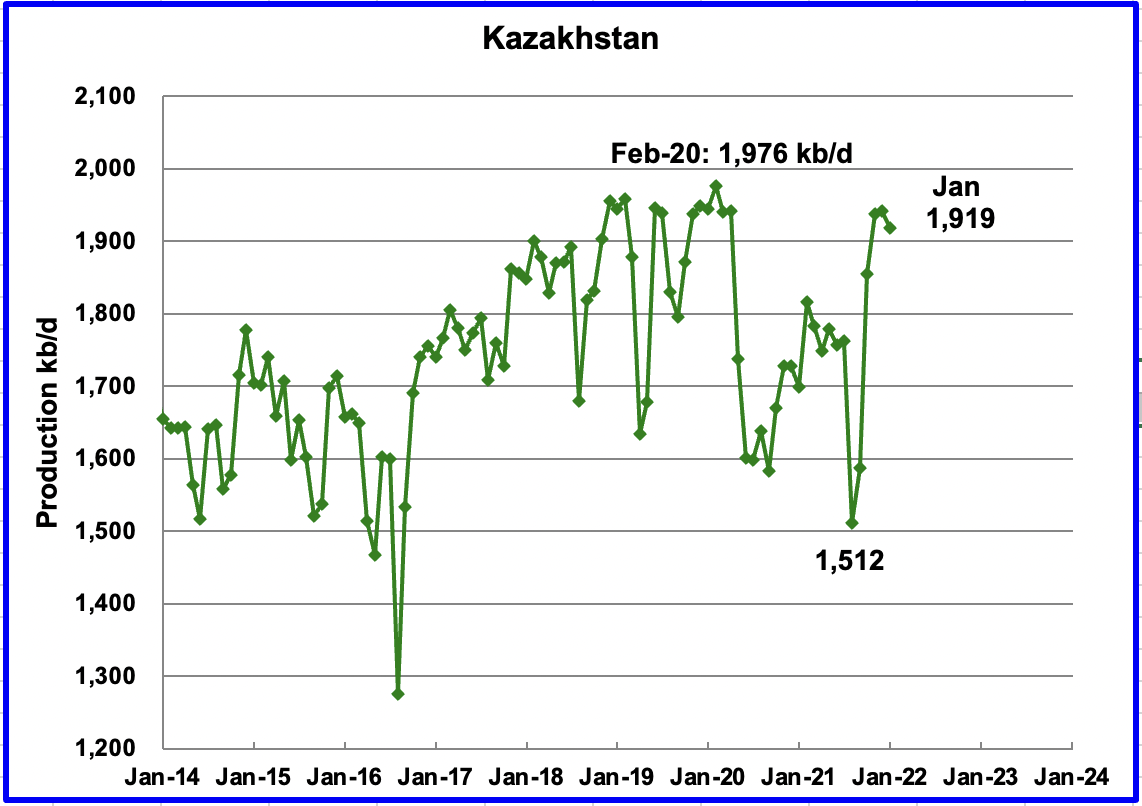
Kazakhstan’s output decreased by 23 kb/d in January to 1,919 kb/d.
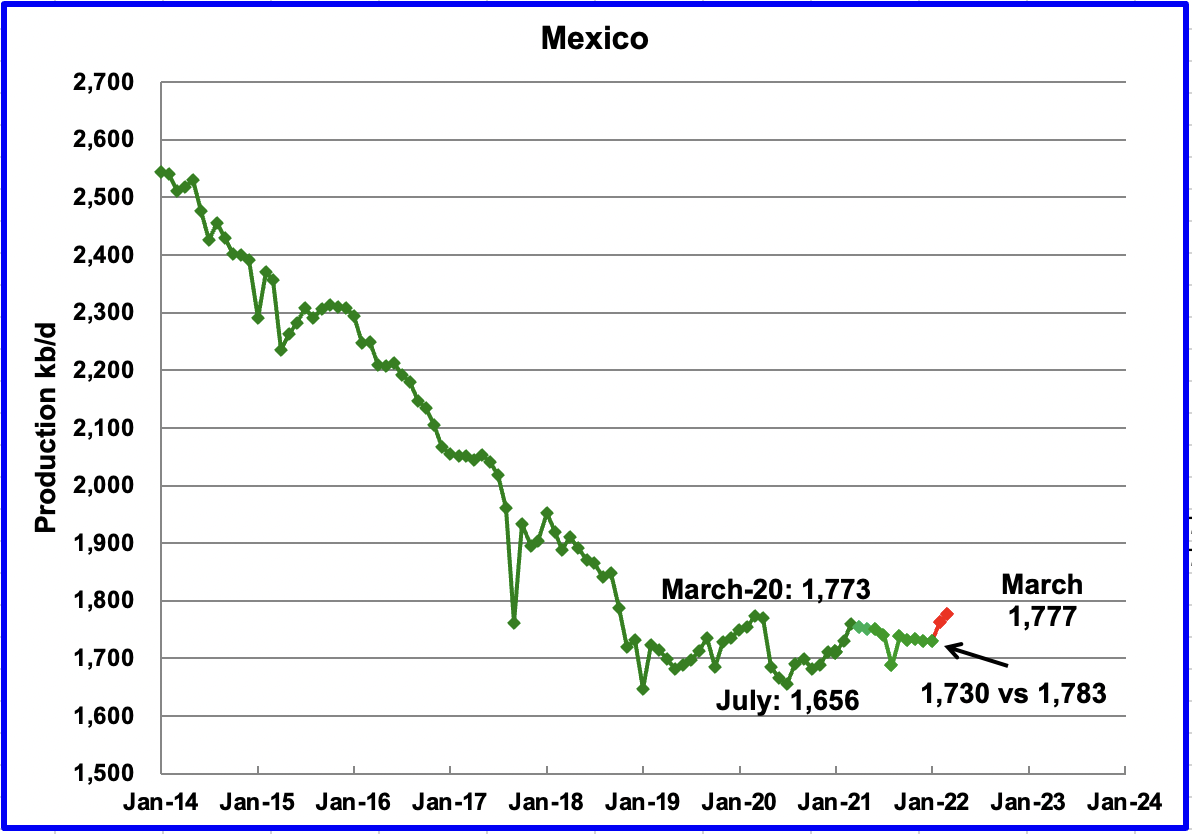
Mexico’s production as reported by the EIA for January was unchanged at 1,730 kb/d.
Data from Pemex showed that February’s output climbed to 1,763 kb/d and to 1,777 in March. (Red marker). However for some unexplained reason, the EIA reduced Mexico’s official January C + C production of 1,783 kb/d by 53 kb/d to 1,730 kb/d. A possible explanation is that Mexico’s definition of condensate may be different than the EIA’s.
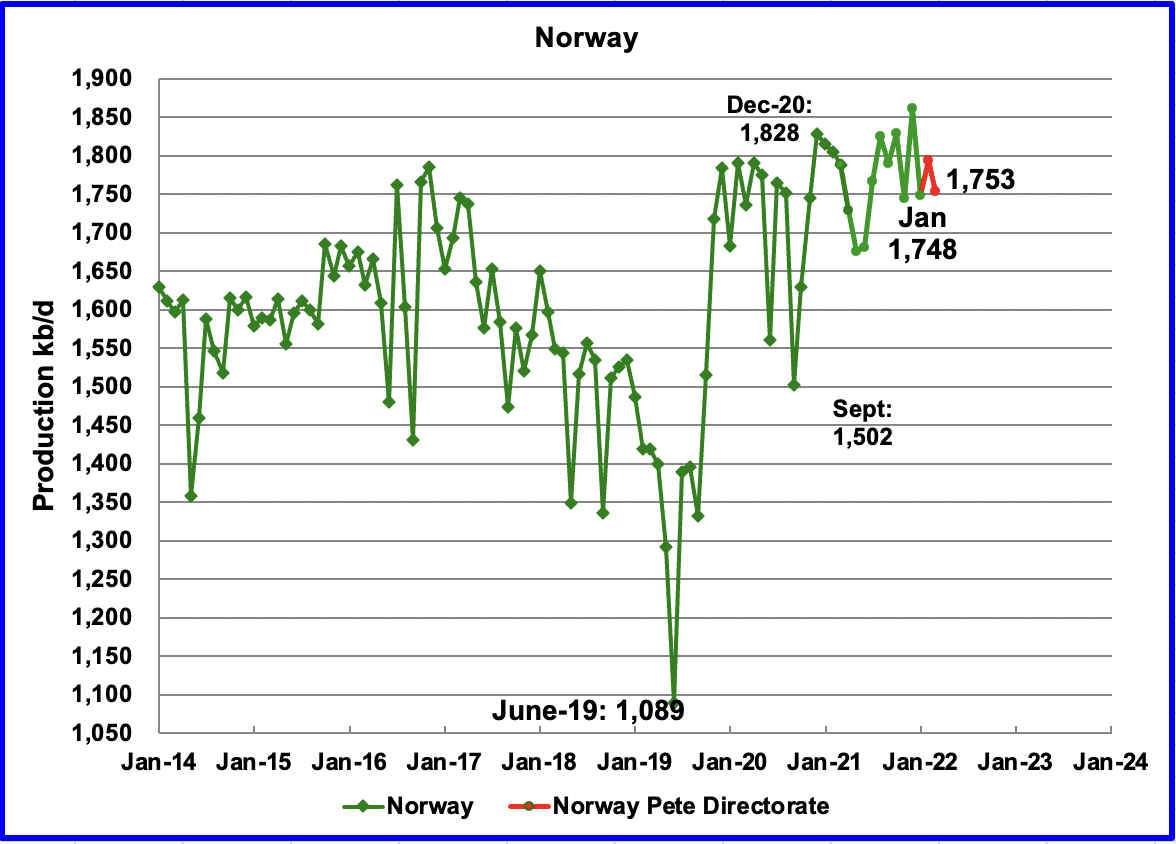
The EIA reported that Norway’s January production dropped by 114 kb/d to 1,748 kb/d. The Norway Petroleum Directorate (NPD) reported that production in February increased to 1,793 kb/d and then decreased to 1,753 kb/d in March. (Red markers.)
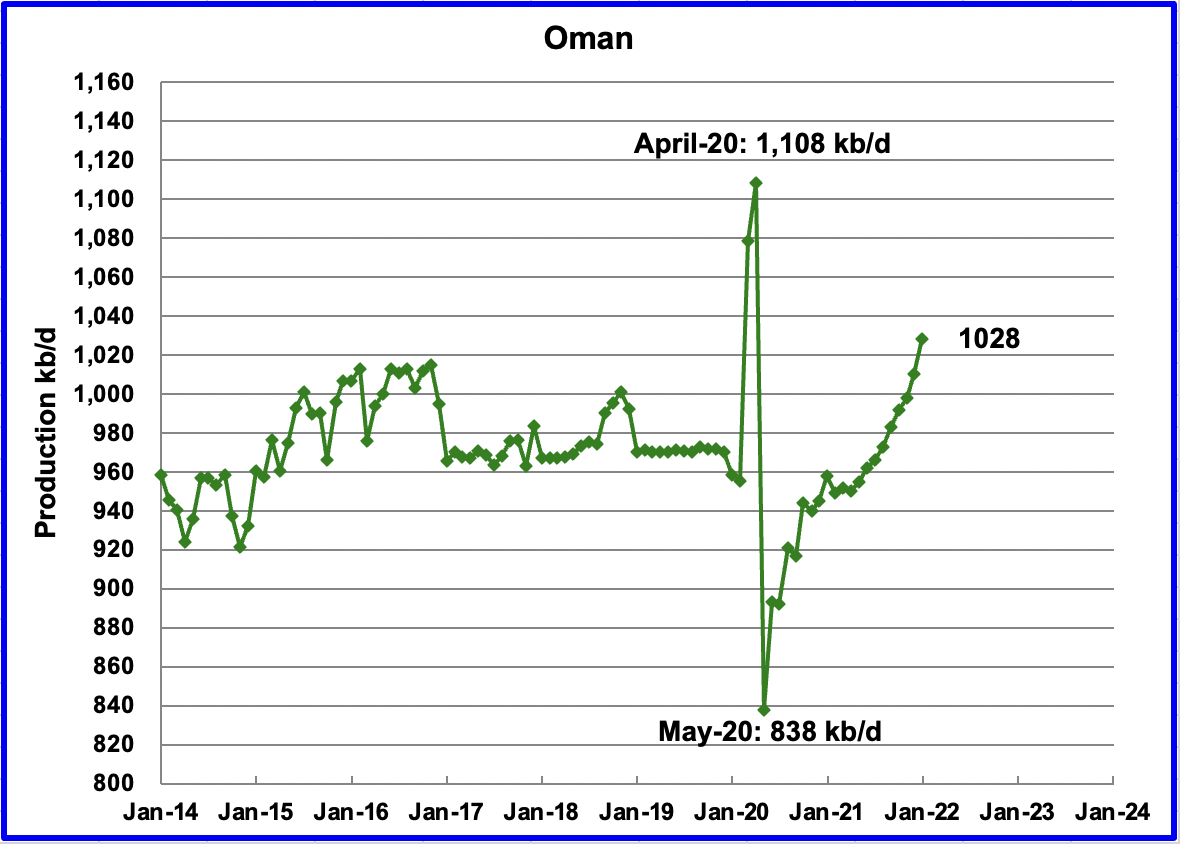
Oman’s January production increased by 18 kb/d to 1,028 kb/d.
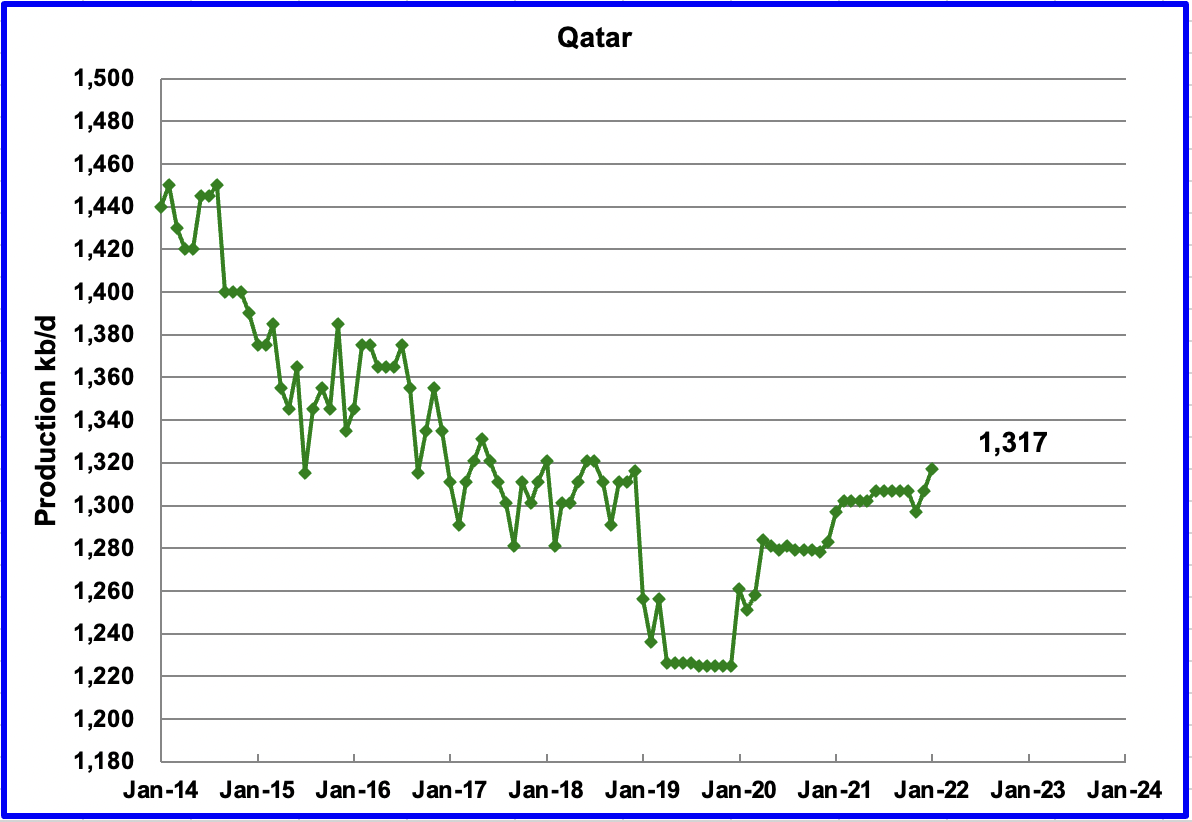
January’s output increased by 10 kb/d to 1,317 kb/d.
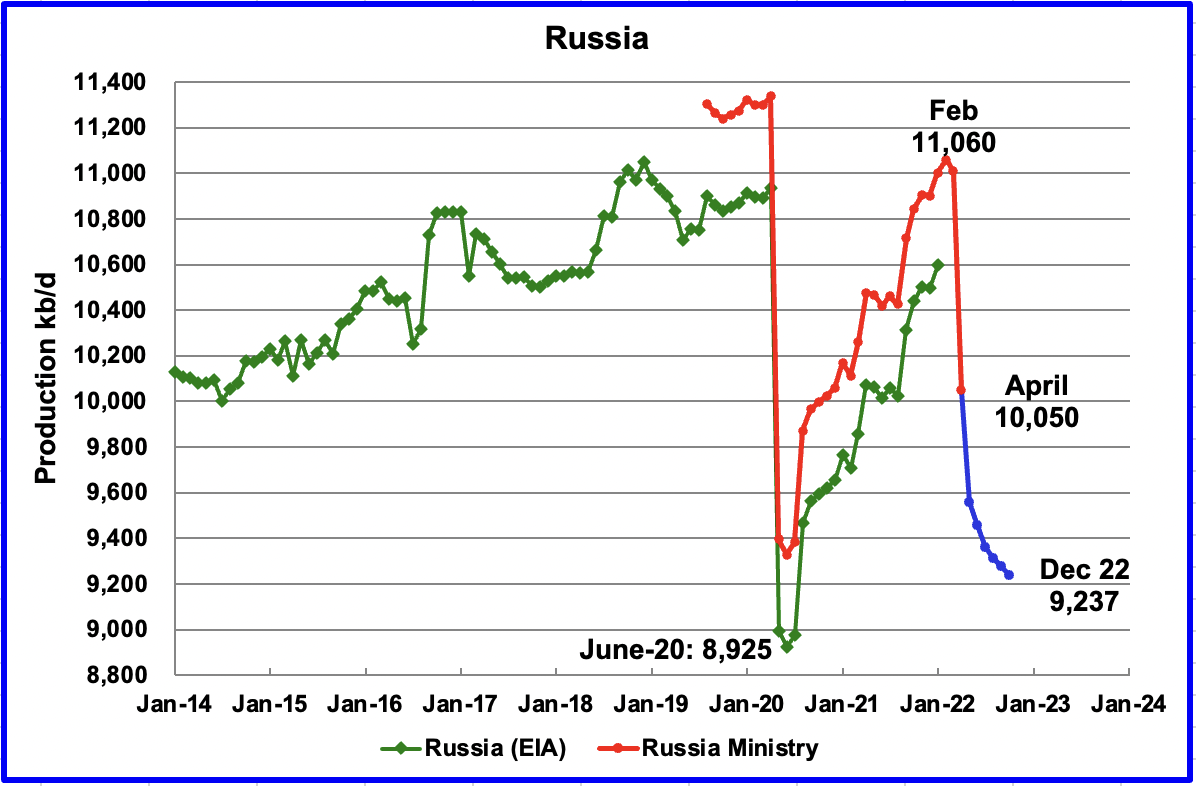
The EIA reported that Russian output decreased by 99 kb/d in January to 10,598 kb/d. According to this source, April’s production decreased by 1,010 kb/d to 10,050 kb/d. The blue graph represents the STEO’s forecast for Russian C + C production up to December 2022 due to the imposition of economic sanctions by the U.S. and many other countries.
The Rusian C + C forecast was made by comparing the ratio of the STEO’s all liquids output with the Russian Ministry C + C output over the period October 2021 to April 2022. Russian C + C production was close to 97.6% of the STEO all liquids data. That percentage was used to generate the Blue graph.
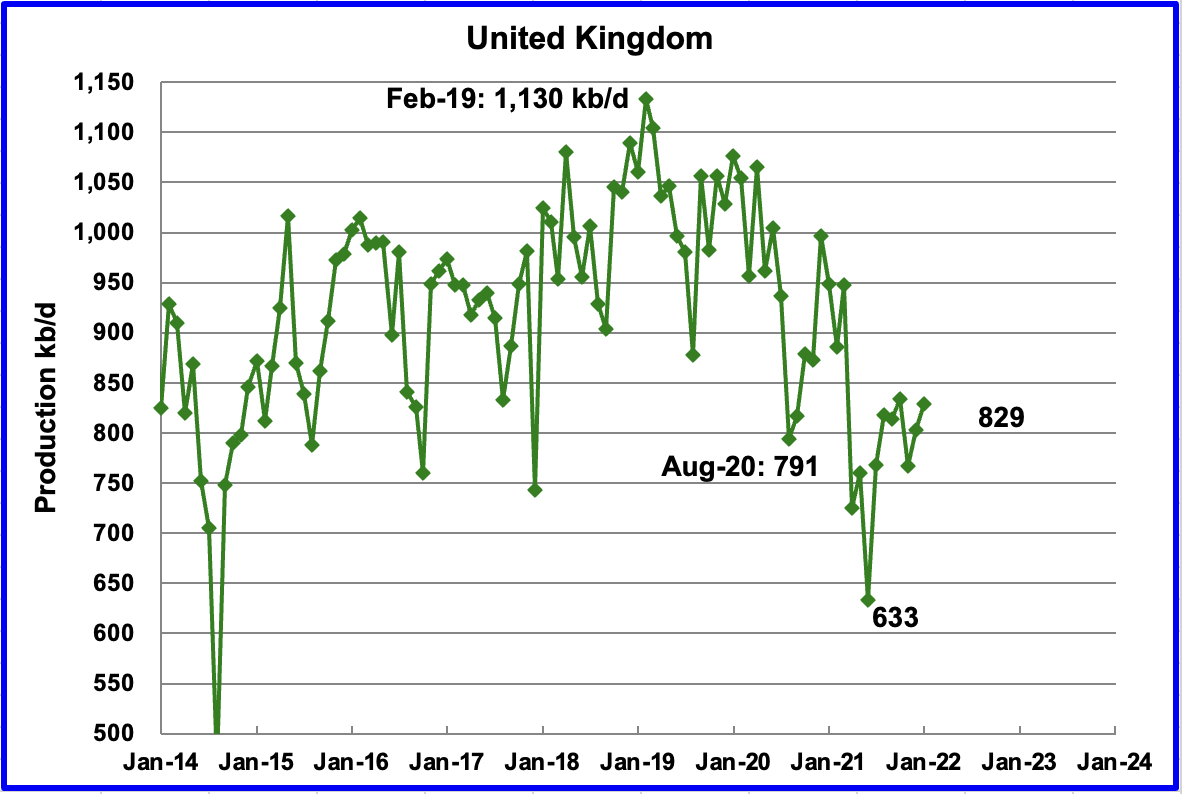
UK’s production increased by 27 kb/d in January to 829 kb/d. The chart indicates that UK oil production has entered a steep decline phase starting in February 2019.
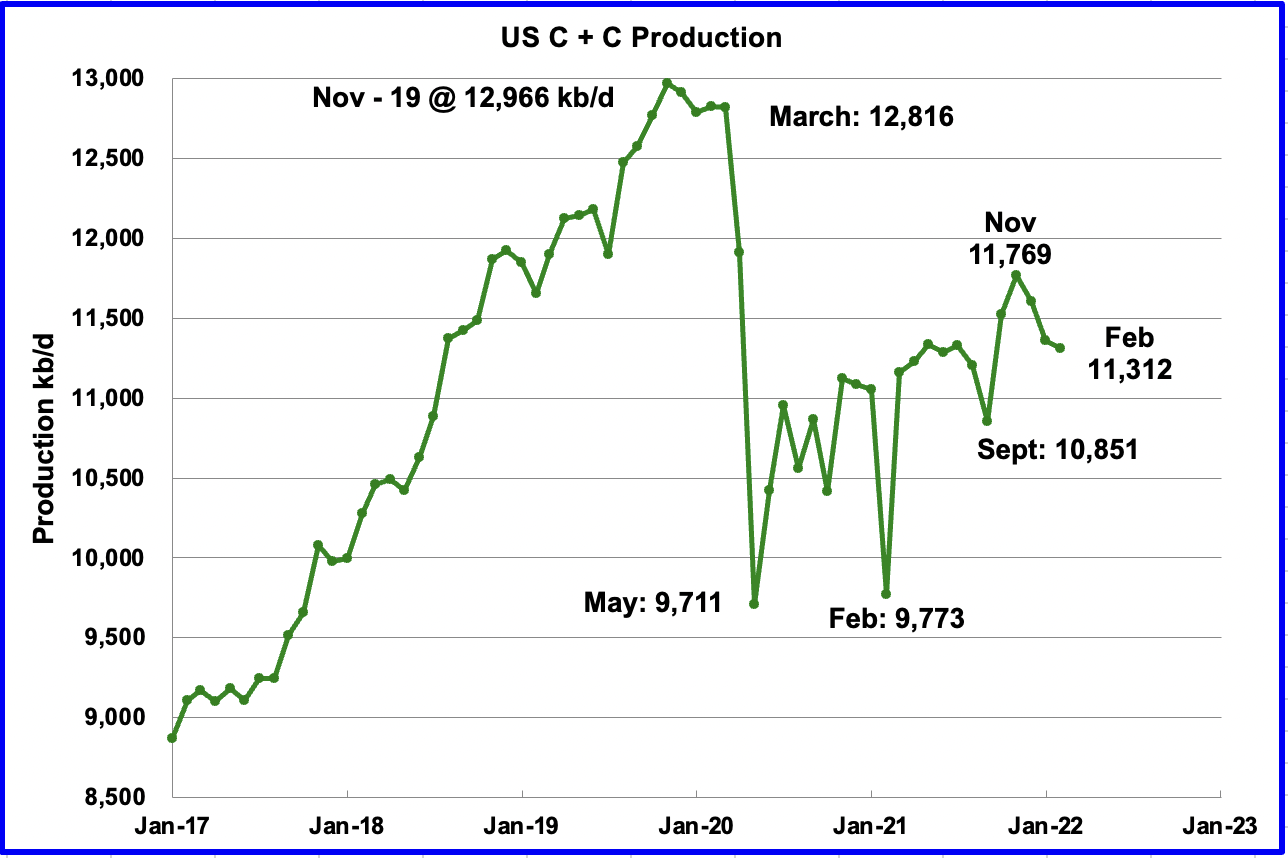
U.S. February production decreased by 50 kb/d to 11,312 kb/d. Relative to the November 2021 production of 11,769 kb/d, it has dropped by 457 kb/d. The main declining states in February were Texas 27 kb/d and ND 23 kb/d. The major decliner that made overall US output drop was the GOM which dropped by 93 kb/d.
In the On-shore lower 48, February’s output increased by 43 kb/d to 9,247 kb/d.
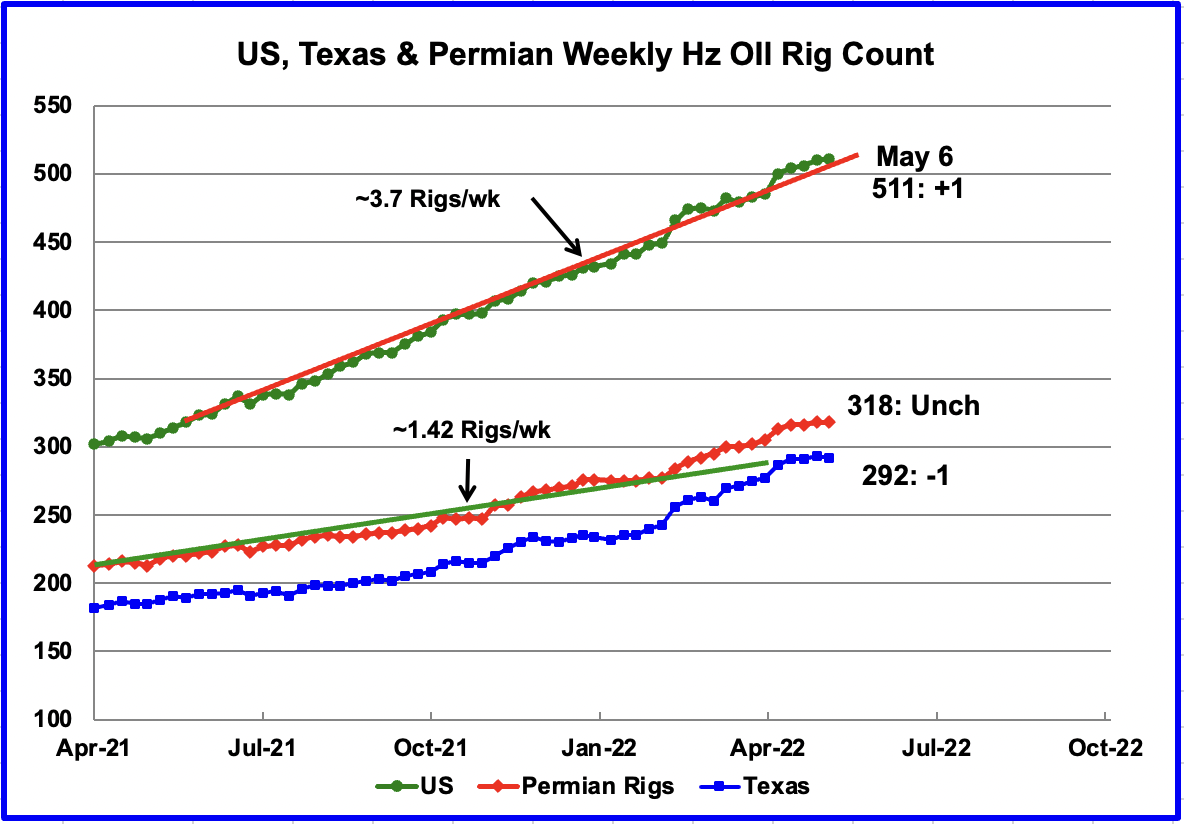
From the beginning of May 2021 to the end of April 2022, the US has been adding horizontal oil rigs at an average rate of close to 3.7 rigs/wk. However in the Permian and Texas, the addition of rigs has accelerated. This implies the rig count in the other states and basins is slowing.
For the week ending May 6, 1 horizontal oil rig was added in the U.S. for a total of 511. Permian rigs were unchanged at 318 and in Texas, the rig count dropped by 1.
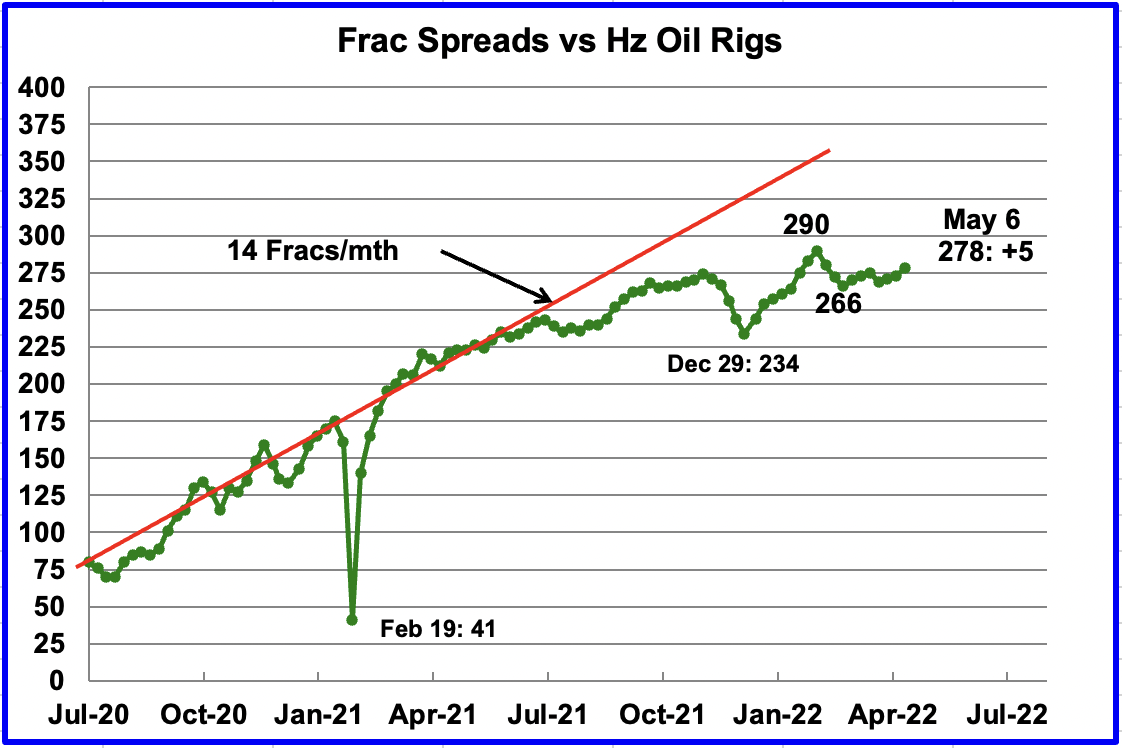
For the past few months, the growth in frac spreads has not been keeping up with the growth in rigs. However for the week ending May 6, 5 frac spreads were added. Could this be the beginning of a summer push?
Note that these 278 frac spreads include both gas and oil spreads, whereas the rigs information is strictly oil rigs.
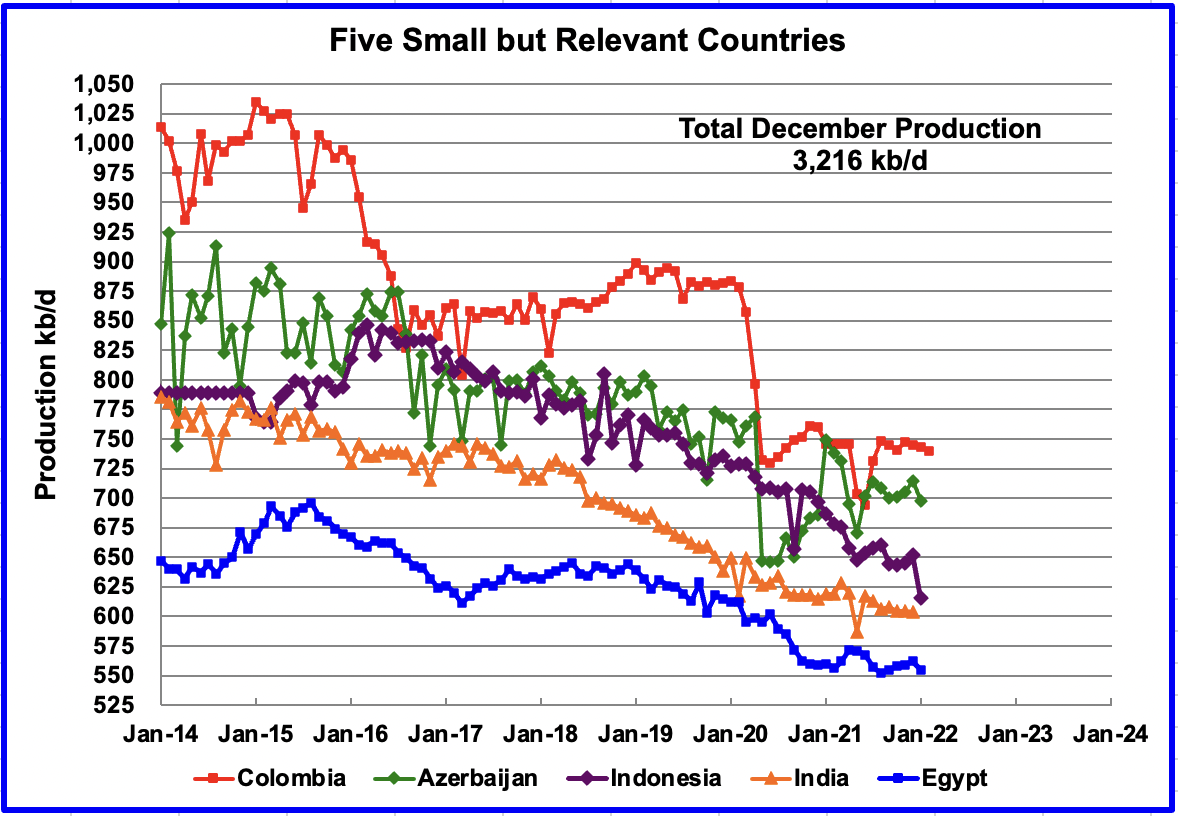
These five countries complete the list of Non-OPEC countries with annual production between 500 kb/d and 1,000 kb/d. Their combined January production was 3,216 kb/d, down by 62 kb/d from December’s 3,278 kb/d.
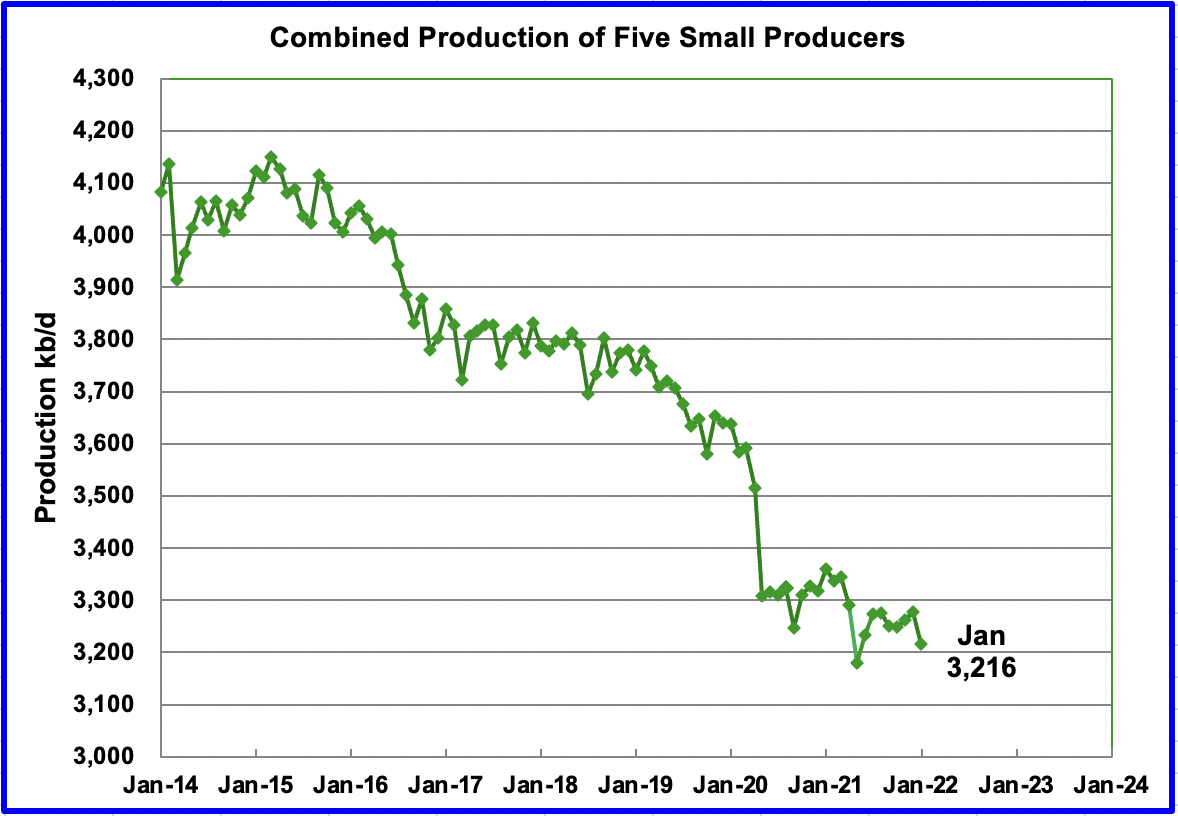
The overall output from the above five countries has been in a slow decline since 2015. The drop in May 2020 from 3,500 kb/d to 3,300 kb/d was primarily from Azerbaijan, 125 kb/d, which is a member of OPEC + and Colombia.
World Oil Production
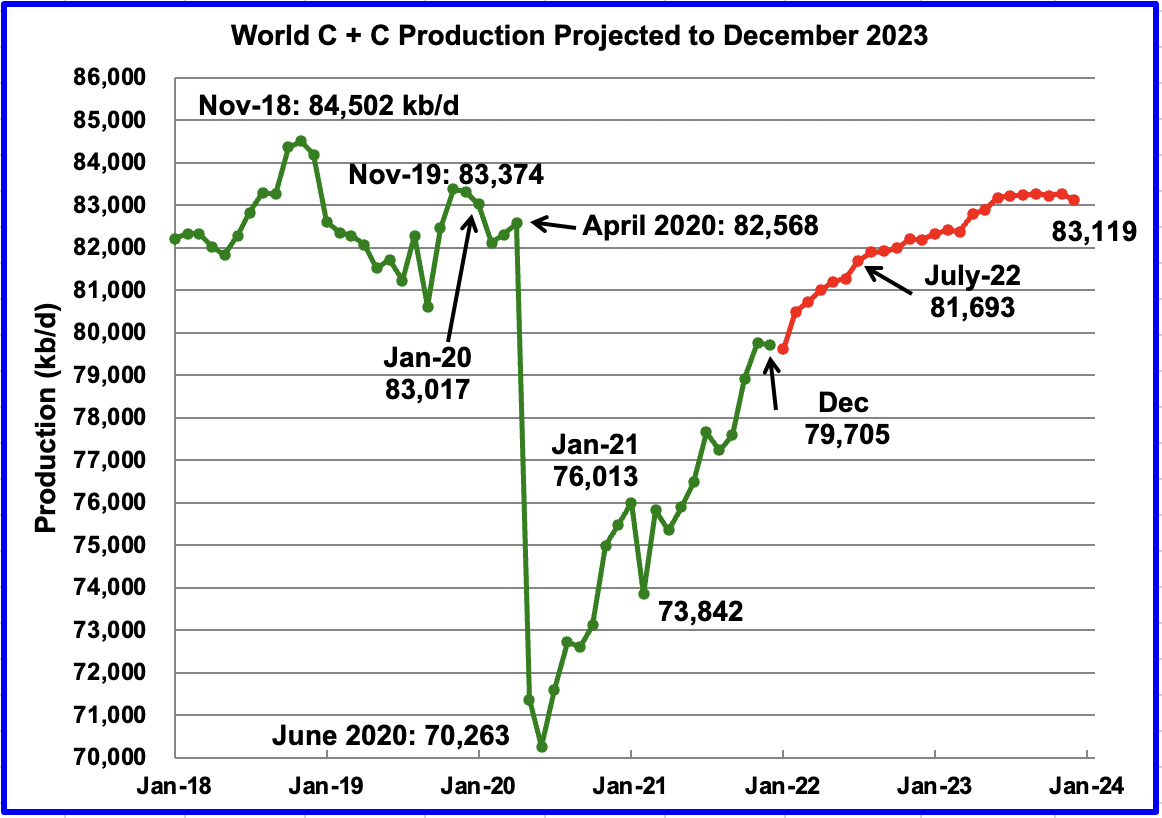
For comparison, December World oil chart posted in previous report. No Russian oil sanctions
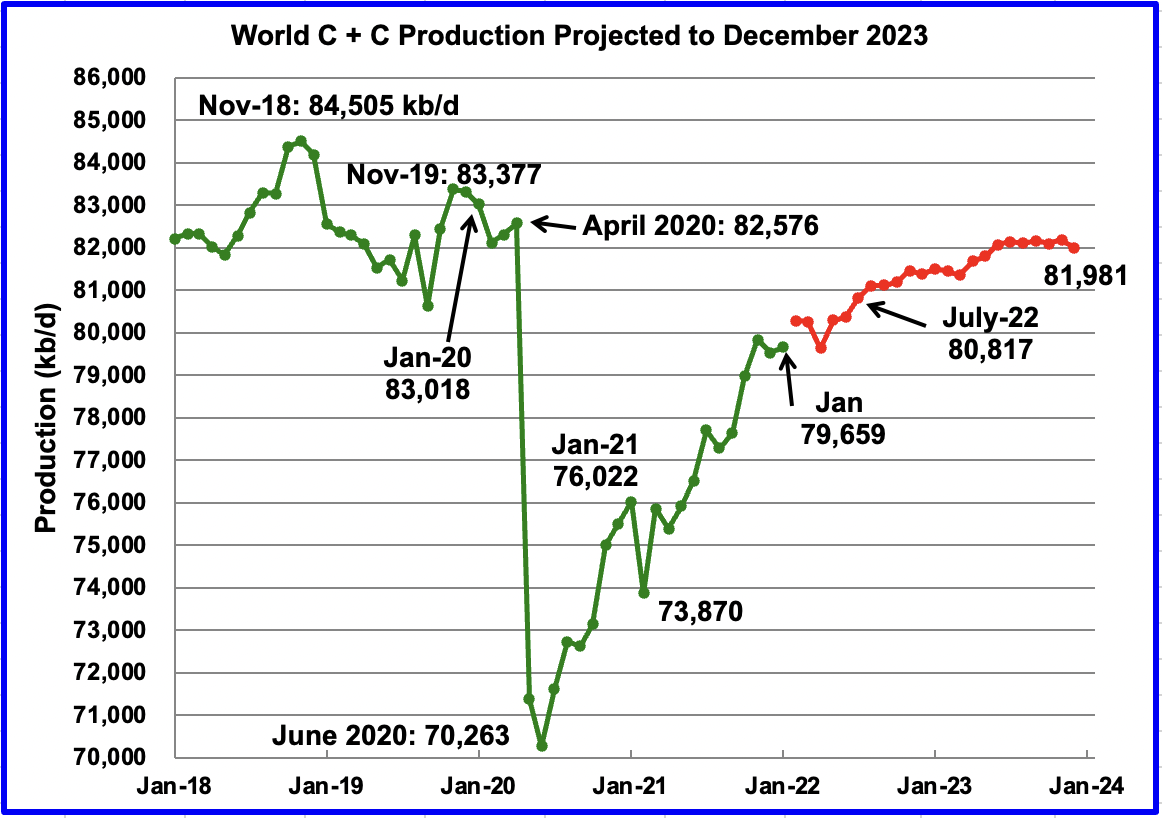
Updated January World oil chart with impact of projected Russian oil sanctions.
Since the last report, the sanctions on Russian oil production have shown up in the Russian production chart above. That information was incorporated into the current May STEO report. The previous December World chart (first chart) has been retained to better illustrate the change between the two reports.
January’s world oil production increased by 137 kb/d to 79,659 kb/d according to the EIA (Green graph).
This chart also projects world C + C production out to December 2023. It uses the May 2022 STEO report along with the International Energy Statistics to make the projection. (Red markers).
It projects that world crude production in December 2023 will be 81,981 kb/d, 1,138 kb/d lower than projected in the April report. It is also 1037 kb/d lower than the January pre-covid rate of 83,018 kb/d and 2,524 kb/d lower than the November 2018 peak.
Comparing the near term July 2022 production between the two charts, the updated May chart shows a drop of 876 kb/d over the chart posted last month.
Could the plateauing shown in the later half of 2023 be an early confirmation that peak oil occurred in November 2018 at 84,505 kb/d?
314 responses to “Non-OPEC January Oil Production Rises”
Thanks, Ovi. Fantastic post! Your last sentence: Could the plateauing shown in the latter half of 2023 be an early confirmation that peak oil occurred in November 2018 at 84,505 kb/d? Obviously it does.
However, referring to your final graph, I think the EIA’s estimate of world production in the latter half of 2003 is a wee bit optimistic. I think it is about a million barrels per day too high.
Why it takes so much now for the Non-OPEC data to appear, fudging comes to mind
Ron
Thanks. My quick scan of today’s STEO shows the EIA has big expectations for increasing US output for the remainder of 2022 and for 2023. We will have to be patient with the EIA to see how production really turns out. I still think they have an economic model that does not account for geology.
Ovi,
Great post!
I imagine you noted the high oil prices assumed for the most recent STEO. That might result in increased investment in US oil fields if it is correct, in Dec 2023 they now have WTI at $93/bo.
https://www.eia.gov/outlooks/steo/data/browser/#/?v=8&f=M&s=0&start=201701&end=202312&ctype=linechart&maptype=0&linechart=WTIPUUS
STEO US output expectation is 13.28 kb/d in Dec 2023 see link below for data and chart below.
https://www.eia.gov/outlooks/steo/data/browser/#/?v=9&f=M&s=0&maptype=0&ctype=linechart
Chart for US C plus C with data from STEO, I agree with Ovi and Ron this seems very optimistic.
The STEO has annual average increase in US C plus C output from March 2022 to Dec 2023 is about 910 kb/d. US C plus C output from July 2020 to Feb 2022 increases at an average annual rate of 550 kb/d.
Haven’t they written it up somewhere so folks can check?
Reservegrowthrulz,
Not clear what you mean. Do you mean has the EIA wriiten up their economic model? Yes they have, but the model is extremely complex with a whole host of sub modules with thousands of coefficients etc, so checking on their model would require a large team of economists to make heads or tails of the model.
Perhaps you have access to such a team, most of us do not.
Are you referring to the STEO or the AEO? I believe the AEO (run in NEMS) does include a basic prototype geology section, something I found out about during one of their last annual conferences. But I thought the question was about the STEO, and I haven’t seen any documentation mentioning geology included in that one.
Are all comments being pre-moderated now, or am I just special? 😉
Reservegrowthrulz,
Sometimes comments get moderated for no apparent reason, if you make a mistake on your email address when you post the comment the system thinks you have never commented before, so that is the key thing to make sure you use consistently. If a comment gets held for moderation, check that first and if you typed in the wrong email, just copy and paste into a new comment with the correct email address (that you have used in the past).
I am not sure, I thought they used the same underlying model for both STEO and AEO.
I was wrong though, short term model discussed at page below, thanks for heads up.
https://www.eia.gov/analysis/handbook/pdf/STEO_Overview.pdf
Basically the short term model uses an economic forecast based on an IHS Markit model and weather models to estimate future demand and future oil and natural gas prices.
Oil and natural gas output are determined as in quote below:
U.S. crude oil and natural gas production:
Using the crude oil and Henry Hub natural gas spot price forecasts as inputs, EIA generates crude oil and natural gas production forecasts using a linear regression model in Eviews. This model forecasts regional-level production using historical well-level production based on decline rate data
…
USSTEM contains nearly 600 equations to forecast variables representing different energy sources and market activities.
The model is a bit complex.
Hope springs eternal. Ghana was up 1,000 barrels per day in January 2022. However, they are still below their January 2019 level.
Click on the graph to enlarge it.
Ron
Why the sudden interest on Ghana?
My mistake Ovi, it should have been Guyana. That is one of the Nations on Dennis’ “save the world from peak oil list.” Hell, they are just as bad, producing even less than Ghana.
Sorry about that.
Ron
That is what I thought you were thinking. I look at Guyana every month but it hasn’t looked too exciting recently.
Attached is the chart for Guyana.
The situation in Guyana may be a little more complex than meets the eye. On the one hand XOM and partner plan to have capacity to produce with partners 1.2 Mb/d of oil and gas (boed) offshore of Guyana by 2027.
https://www.reuters.com/business/energy/exxon-raises-guyanas-long-term-oil-production-outlook-2022-03-02/
At the same time, the govt is trying to get a better deal now that it knows there is a lot of oil in those offshore fields. “Guyana is in “no rush” to draft a new production sharing agreement (PSA) for offshore oil development, its Natural Resources minister told Reuters, reversing a year-long drive to devise new rules for future output.”
“The original PSA reached with XOM has been criticized even by the current government for being too favourable to oil producers.”
So if you were XOM, would you be rushing to make more investments in Guyana to increase production while negotiating a new and probably not as beneficial PSA?
https://financialpost.com/pmn/business-pmn/guyana-in-no-rush-to-draft-new-oil-production-sharing-pact-minister
Four projects are in production or development (120, 220, 220,250 kbpd capacity respectively). The remaining ones will be smaller FPSOs or tie-backs as capacity becomes available. The terms for XOM are so attractive that it has leeway to make a lot of concessions and still make money (of course until the next recession and oil crash when it will suddenly be back again to hand wringing mode for the oil industry). Each major IOC only has a limited capacity to take on new projects, and for each that capacity is being degraded slowly, so I doubt XOM is in a position to do much more at the moment even if it wanted to.
George
Does XOM have commitments as to when these FPSOs must come online or is it up to them to decide how much capital to assign to each one each year?
The schedule and design for the vessels would have been agreed with the Guyana government when the FID was approved, along with the royalty and tax regimes and other requirements like allowance for local engineering and procurement. It’s usually then left to the operator to deliver and operate the project. Each production agreement would be different but there would be some clauses covering penalties for the operator company’s poor performance. Usually any such problems would be from the shipyards and engineering contractors; it’s in Exxon’s interest as much as the country’s to make things as efficient as possible. Very rarely do projects get cancelled or put on hold once they’ve passed FID, there were a few in the crash in the 80s and a couple in 2015, but none with economics as good as the Guyana fields.
Note the fifth FPSO is currently in pre-FEED. I’d guess it will transfer to FEED and then through FID as the second Liza vessel is completed and brought online.
The average annual rate of increase in Guyana’s output has been 37 kb/d since they started producing oil in Dec 2019. The average annual percentage rate of increase in output has been 43%. Let’s assume 30% growth in average annual output over the next 7 years. Then we see output increase to 776 kb/d by Dec 2029, see chart below and George Kaplan’s comment above that states that there are 810 kb/d of projects being developed.
Also on Guyana see
https://oilnow.gy/featured/guyana-oil-production-to-peak-in-2035-continue-up-until-2050/
where I found chart below.
Also found this piece on Guyana.
https://oilprice.com/Energy/Energy-General/Why-Guyanas-Oil-Boom-Cant-Solve-The-Current-Energy-Crisis.html
About 120 kb/d is currently operating with a 120 kbpd FPSO, a second 220 kbpd FPSO should be operational by mid 2022, a third FPSO with capacity of 220 kbpd is expected to be producing in 2024, the final 250 kbpd FPSO is expected to start producing by 2026 or 2027, and I have seen estimates of up to 1200 kbpd total output by 2030.
Why so much interests in Guyana’s fields? They are producing less than 130 kb/d. I read under that different PSO were to begin productions in next years. But, will they have the economic and the technical environments to do so? Esoecially, when oil companies even in US are struggling to have equipments and pieces of equipments at affordable prices.
Jean-Francois,
It is expected that Guyana’s output will increase to 1200 kb/d by 2030, they have been growing at a 43% annual rate since production began in Dec 2019, about 11 billion barrels discovered so far and low production costs of $35/bo are expected. The main producer is Exxon Mobil with various partners (Hess and at leat on other as I recall). These companies have the financial weight and technical expertise to do this, and it will be very profitable at $100/bo.
The work here is exemplary. Lots of hours have been entered and may sources have been accessed and their data captured and plotted. Still, I look at the Exxon View to 2050 graphs and I see a peak around 2040 where the curve is very very flat for almost a decade. I could even say that the peak is just after 2030.
Ref: https://corporate.exxonmobil.com/Energy-and-innovation/Outlook-for-Energy/Energy-supply#Liquids
Are we missing something in our analyses? I know I harp on this but Exxon is not a fly by night company.
Peter
Looking at the total up to oil sands, the graph looks almost flat from 2023 onward. So to exceed November 2018, it will depend on Tight Oil.
LTO/US production going forward seems to be the main point of contention on this board.
Peter, no nothing is missing except read “Liquid supply highlights need for new investments ” . That is the key point “new investments ” . All analysis is based on new investment which is not coming and will not come especially now with the ESG corporate boards calling the shots . So this analysis is only ” fill in the blanks ” . Some lines on new innovation techniques that are still to be devolped , heaven knows when . File 13 .
Reversal point. Essay on the original physical dimensionality and on the inevitable energetic collapse of industrial civilization
https://www.edizionipaguro.it/?g=Libri&goo=194
Hi Giorgio , welcome to the club . I clicked on the link and it takes me to a website selling books which are written in Latin . Anyway no problem . We understand what we are talking about . Can you provide the blog some info about Italy after the sanctions and Covid ? Especially because Italy imports 45 % of its gas from Mr Putin and also had the hardest lockdown due to Covid . I have been to Torino and Milano 30/35 years back to buy second hand CNC machines . Beautiful cities , food and culture but my old associates tell me it is not ” honky dory ” anymore . An update will be appreciated .
P.S : I am a fan of Prof Ugo Bardi the thinker of the Seneca Effect .
Translated the abstract via google. The same arguments as I made in my video and Harrison Brown made in 1954 in his book Challenge to Man’s Future.
https://www.britannica.com/biography/Harrison-Brown
The ultimate cause is rooted in thermodynamics, we all should understand that by now. https://www.youtube.com/watch?v=lGrZRFDHZOk
If anyone thinks I am trying to monetize my video, with now about 2000 views, I will be long dead before it gets to million, 🙂
Well done! Your presentation will not be a surprise to those that have been following energy and growth issues for many years, but your summary is very clear and the graphics are great.
Go Bucks
Thanks for your comments Joe and Twocats. It should also be clear right now, that we should concentrate as much as possible to lower usage, for then the remaining oil will last longer.
I just got the small book by Steve Keen entitled The New Economics, in which he discusses the work of Ayres and Kummel in Chapter 4 on the need of energy to be one of the factors of production, not explicitly like Kummel, but implicitly via K=K(E), L=L(E), capital and labor. He also prefers the Leontief production function over the Douglas-Cobb, both of these are special cases of the Constant Elasticity Substitution method introduced by Arrow in 1961.
My study these economic models is not of much use, as the realization of energy as a factor of production by main stream economists will come way too late. A simple reasoning using the Douglas-Cobb model suggests that once the cost of energy becomes a substantial fraction of labor cost, we will be some way toward the pre-industrial conditions, as physical labor in some situations is more effective than work done by machines.
It appears to me that the fundamental stumbling block of economists is the Cost-Share Theorem, and thus mispricing of energy. This reminds me of the Oscar Wilde quote that “people know the price of everything, but the value of nothing”.
Some past tight oil expectations from me, March 2022 LTO output is 7701 kb/d.
Dec 2013 (2016 at 3250 kb/d)
https://peakoilbarrel.com/when-wil-us-light-tight-oil-lto-peak/
March 2017 (2021 at 6500 kb/d)
https://peakoilbarrel.com/future-us-light-tight-oil-lto-update/
Feb 2022 (2030 at 12000 kb/d, note the last chart in post and that I call the scenario “unrealistic”)
https://peakoilbarrel.com/permian-basin-update-february-24-2022/#more-35754
Current best guess ( May 2022, 2029 at 11500 kb/d, see chart below).
Note that the Permian scenario used for the scenario below has a URR=43.5 Gb and that scenario assumes only 26 million net acres of 50 million prospective acres in the USGS mean TRR estimate are utilized, essentially only the core areas are developed in the Permian basin.
Shaleprofile scenario for future tight oil supply at link below
https://public.tableau.com/shared/8FJPC77NT?:display_count=y&:origin=viz_share_link&:embed=y
Only basins with significant growth are shown, March 2022=6300 kb/d, Dec 2029=9700 kb/d. Permian, Eagle Ford, Niobrara, Marcellus, Powder River and Other were the chosen basins, most others were relatively flat in output over the March 2022 to Dec 2029 period.
(Comment is indirectly related to oil)
The Car Enigma
The number of personal cars in the world inventory is known, as well as the yearly PC production. The list contains both numbers.
Year; PC, million, world inventory; PC Production;
1999; 585.174; 39759847;
2000; 595.065; 41215653;
2001; 621.942; 39825888;
2002; 656.124; 41358394;
2003; 672.816; 41358394;
2004; 687.664; 44554268;
2005; 704.977; 47046368;
2006; 732.666; 49918578;
2007; 758.574; 53201346;
2008; 786.128; 52841125;
2009; 807.081; 47772598;
2010; 835.848; 58239494;
2011; 851.272; 59897273;
2012; 887.335; 63081024;
2013; 919.028; 65745403;
2014; 972.450; 67782035;
2015; 1013.241; 68539516;
2016; 1056.010; 72105435;
2017; 1094.030; 73456531;
2018; 1125.360; 70498388;
2019; 1167.572; 67149196;
2020; 1196.706; 55834456;
2021; 1245.205; 57054295;
2022; ________; 54000000 est.;
If we assume the Personal Car Producing System (PCPS) is like coal or oil mining, and the PCs are „mined“, we can use a logistic function to calculate, how large the ultimate recoverable resource of PCs (URR) is.
Whats your result ?
My result is, the URR is about 2600 million of Personal Cars. About 2200 millions are produced today. For an annual production of about 50 millions of cars, eight years of production are remaining.
The starting value for the diagram is 800 million produced cars in 1998, and the column for production numbers has been used.
Berndt,
It will be interesting to see how accurate this scenario will be in the future, we will see in 2030 how many personal vehicles are produced. My guess, 70 million to 90 million, all of which are likely to be plugin hybrids or EVs.
Dennis,
my graph uses real numbers from the real world. It is unusual, because the hubbert linearization is used for mining applications. Your guess is a hope, without reference to any facts.
What is the reason that the car productions goes down ? There is no lack of steel, aluminium, plastics. There is even no lack of oil, natural gas or coal.
But there is a lack of net energy. That is the reason for the decrease.
EV production needs about the same amount of energy as ICE production. Because EVs are not cheaper, often more expensive, they need even more energy for production.
No, Dennis, your guess is wrong. In contrast, the decay will progress even faster in the next years.
Berndt,
How are you so sure the causation is lack of energy?
Maybe there is a lack of demand, or a whole myriad of causes. For e.g. better public transportation would reduce demand for cars. High cost of fuel would also dampen demand for cars.
Berndt,
Your hypothesis is flawed. We will see in a few years this may be so.
Certainly car production will not fall to zero. If self driving cars are perfected, we might see a big drop in production of personal transportation vehicles.
That is the only way your scenario prove roughly correct. Realistically it will not happen by 2030, but perhaps by 2040.
If it looks like a duck, swims like a duck, and quacks like a duck, then it probably is a duck
The diagram looks like the exhaustion of a resource, for example a coal mine. The curve has in 2009 a peak downwards. This was caused by demand. You see, demand driven effects look total different.
I know, on this forum, nobody (wants to) understand(s) the thermodynamic effects of oil production and the influence on the oil production energy. If thermodynamics is included, it swims and quacks like a duck.
Berndt,
We will see how accurate your scenario is in the future. Ducks have little to do with it.
I am very familiar with thermodynamics and statistical physics, very important stuff, but not everything is explained in those terms, there are other factors which are important.
Berndt , the problem is very few have read your paper . I acknowledged earlier that the maths was above my pay scale but the physics part was understandable . The second Law of Thermodynamics is immutable , just like 2+2 =4 . True from the time of Christ to Biden . However where I am in disagreement is the time scale . My frame is much shorter because of a financial collapse . When Letter of Credit’s are not made and trust vanishes , nothing gets shipped . It happened for a week or two in 2008 and it took $ 800 billion ( officially) and TARP to unlock the credit markets. This time it cannot be repeated , already too much debt in the system . Be well .
Berndt,
A rapid decrease in demand followed by a rapid rebound like was seen in 2008-2010 has a spike down as at 1300 on your horizontal axis. A secular decrease in demand for vehicles because of a change in the age structure of OECD nations (where the older population tends to drive less and needs fewer cars), as well as longer lasting better built cars that need to be replaced less often. In 2020 there was a big drop in demand for personal transport because many people were working from home and since the pamdemic many people have continued to work from home which again would amount to a structural shift in the demand for personal transport. In addition in urban environments fewer people are choosing to own a car and are using Uber, Lyft, and other TaaS types or choosing public transport, yet another sturctural shift in demand for personal transport vehicles.
If is far from clear that net energy is as much of a problem as you believe it to be.
Urbanization continues to increase around the world, and cars are a terrible way to get around a city. This image, for example, shows what a disaster allowing cars on bridges to Manhattan has been for transportation.
https://www.streetsblog.org/wp-content/uploads/2008/05_12/erb_capacities_small.jpg
Fewer cars are also likely in the future because they live longer. This trend will increase greatly with EVs.
Anyway they are mostly just prestige objects that spend 90+% of their lifetimes sitting around rusting in parking lots and less than 10% of their time being used.
If you ware worried about energy, you’ll be happy to hear that EVs use a lot less than combustion engine vehicles, which are mostly heaters on wheels that produce a bit of mechanical energy on the side.
I am interested Berndt.
Is there anything in English aside from your posts here where I could understand better? To me it sounds very plausible.
Thanks in advance
RL, the last article i wrote in English can be found on this blog: https://limitstogrowth.de/
There is some discussion on the thermodynamic theory, but all in german.
The article has the adresss:
https://limitstogrowth.de/wp-content/uploads/2020/01/Mar_2020_Thermo_EN_09.pdf
It is now more than two years old.
My most recent work is a book in German:
https://www.amazon.de/kurze-Endphase-Ölzeitalters-Autoproduktion-Thermodynamik/dp/3347487303
In it, formulas , derivations and graphs are newest and errors are elimated. Best is, you order the epub version and use a translation program like “deepL”. Graphs and formulas are understandable in most languages. The Hubbert Linearization is a new idea and not a part of the book.
No, Seppo Koppela does not follow me. He has written the article about the Hills Group article and found the errors of the HG. But he did not recognize the true core of the HG article. I discussed a lot with him. He still is good in finding errors, but still does not accept the core, despite he finds no errors.
Thanks Berndt,
Good to hear that Dr.Korpela has taken a look at your work. It would be interesting to hear in a nutshell by Dr Korpela why your argument in the post from March 2020 is not convincing.
I also do not find it convincing as the temperature change that would occur in the Earth is not something that would be utilized for exergy and note that the Earth system including the atmosphere is an open system with energy flows in and out and it is not clear you have taken account of that in your analysis.
As far as prices being determined by thermodynamics alone, one needs to consider all forms of energy, not just a single form such as oil. The prices of a good will be determined by the economics of the current social system that predominates on the planet (primarily market capitalism).
Physics alone does not determine the price of a good. The price of oil decreased from 2014 to 2020 because for most of the period supply of oil was higher than demand and the stocks of oil were increaseing above normal levels.
Do you have an expanation for why the price of oil has increased since 2020? Has there been some significant change in the physics?
Dennis,
all questions concerning physics and oil price have been answered – in my book.
Open systems – look at chapter 11.4.6
All forms of energy – look at chapter 11.4.9
To Seppo Korpela: Ask him. We did not discuss the post of March 2020, but we did discuss the steady state entropy rate balance, the resulting equations for oil production and we did discuss the limits of the control volume (see abbildung 12) to be used. And if you are impressed by his PH.D.: I too have a doctors title in engineering.
Berndt,
Sorry I misunderstood, you discussed the Hills Group work with Seppo which you believe has a key insight and Seppo does not.
I am impressed by his peer reviewed papers and the fact that he was a professor of engineering at Ohio State University for many years (37 I think), there are lots of PhD’s, but fewer professors.
https://scholar.google.com/citations?user=8RY9udUAAAAJ
I am not finding any peer reviewed papers under your name, but perhaps you are using an alias.
One question you did not answer is the recent increase in oil prices and its cause in terms pf physics.
Dennis,
yesterday i reread my article from 2020 to see where i was correct and where i made errors.
I did not see : a) inflation b) the war in ukraine. Both have a severe influence on the oil price.
I wrote that i expect an oil price conflict between OPECplus and the industrialized world. This is fulfilled. If i am honest, i expected that industrialized world will win and the oil price will continue to decrease. This did not happen. OPECplus is the winner, at least up to now.
They won because they are united. I expected, the west will divide them.
My expectation, that the peak of the oil production will not be surpassed, is fulfilled. Again, if i’m honest, i did expect a faster decrease of oil production. But because OPECplus is united, the are able to get higher oil prices and continue to produce.
My expectation, that the numbers of produced cars will go down, is fulfilled. And they go down faster than expected, especially in the EU.
The reason for differences between expectation and reality is the following: The people worldwide do not buy new cars, the spend their money (here = energy) to buy oil. Again, if OPECplus would be splitted, the price of oil could drop and more cars sold.
In total, i did not expect the unity of OPECplus.
Dennis,
Yes, you got it: “I also do not find it convincing as the temperature change that would occur in the Earth is not something that would be utilized for exergy”.
Any theory that relies on this cannot be rescued. That is the mild version of what is in my mind.
Seppo,
Thanks, I remembered you saying something to this effect in the past, though sometimes I don’t remember right or misunderstand. My last mechanical engineering class in thermodynamics (second semester undergrad) was in 1981, so I not an authority on the subject, pretty sure you have forgotten more about thermodynamics than I have learned.
From a review of your book
Nicht ganz verstanden habe ich, wie das mit dem 2. Hauptsatz der Thermodynamik zusammenhängt und damit, warum die höheren Temperaturen im Erdinneren als an der Erdoberfläche das bewirken.
Eigentlich ist nur zu einzusehen, dass Ölförderung ein vorhandenes Temperaturgleichgewicht ändert. An der Oberfläche wird es wärmer als vorher, im Erdinnern kälter als vorher.
Wenn ein Temperaturgleichgewicht geändert wird, kann man den zweiten Hauptsatz zur Berechnung des Energieaufwands nutzen.
Actually, the only thing that can be understood is that oil production changes an existing temperature equilibrium. It is getting warmer on the surface than before, and colder inside the earth than before. If a temperature equilibrium is changed, one can use the second law to calculate the energy expenditure.
Translation of Berndt’s response to Seppo’s comment.
The thing that Berndt seems to miss is that this energy expenditure that he calculates is of no consequence.
It is a bit like the energy expended by when solar energy melts a frozen lake.
It has very little affect on prices. Just a natural process that occurs.
It seems to me the professor’s intuition is correct.
I didn’t quite understand how this is related to the 2nd law of thermodynamics and why the higher temperatures in the interior of the earth than on the surface of the earth cause this.
Translation for English speakers of Seppo’ s comment in German
Dennis,
Change of a temperature equilibrium requires energy. Thats all.
If the sun melts ice, then the energy is delivered by the sun.
If mankind changes the temperature equilibrium of the earth crust, the energy has to be delivered by mankind.
The second law of thermodynamics is always valid. Even for oil production.
Berndt,
Nobody is claiming the second law of thermodynamics is not valid. The question is relevance. Does the solar energy utilized to melt the ice on a frozen lake in rural maine have any significant affect on the economy?
Not really.
Does the change in temperature that may occur to the earth’s crust have any engineering or economic significance in the oil extraction process?
No.
So determining this energy expenditure might be an interesting engineering exercise, just as determining how much solar energy would be needed to melt the ice on a frozen lake might be interesting, but from an oil production engineering perspective or an economics or business perspective we are none the wiser.
Seppo Korpela might agree, though he could put in more sophisticated engineering terms. There was mo important core insight of the Hills Group paper, that is the bottom line. If this energy change you are claiming is significant was never put to any useful purpose (performing actual work), then the whole exercise is a nothing burger.
Dennis,
if the required energy is small, it does not matter.
If the required specific energy (per kg) is as high as the specific energy content of the oil, it is a severe problem.
If its even higher, it can kill the world economy. And my calculations give numbers which are higher.
How to prepare for the potential downturn of the economy ? I don’t have a cooking recipe. Each one should find his own solution. But i believe, it is better to prepare if one knows whats coming than without that knowledge.
Rational Luddite,
Seppo Korpela could teach us all a lot on thermodynamics
https://www.linkedin.com/in/seppo-korpela-1bb13a11?original_referer=https%3A%2F%2Fduckduckgo.com%2F
I imagine he might have some thoughts on Berndt’s analysis.
Berndt do you have a link to your work?
Thanks Denis. I re-watched Seppo’s video just 2 days ago in fact
https://youtu.be/lGrZRFDHZOk
But I would like to examine Berndt’s “inertia”l net energy logistic hypothesis in greater detail too.
Thanks for the link Denis
Berndt-
“If we assume the Personal Car Producing System (PCPS) is like coal or oil mining, ”
Why start a mental exercise with a false assumption?
Its a good example of the fact that just because someone is good at math, doesn’t mean that they are good with reality.
Berndt,
What is the source of your data?
This source gives very different numbers (e.g., 2019 is 89M units):
https://www.statista.com/statistics/266813/growth-of-the-global-vehicle-production-since-2009/
As does this one:
https://ihsmarkit.com/research-analysis/2022-global-light-vehicle-production-outlook.html
I track the data from US, EU, China, India and UK. These countries publish monthly data. The sum of their data is about 75 % of world vehicle numbers.
For annual data, i use OICA.
https://www.oica.net/production-statistics/
If I read OICA correctly, they give 92.2M units for 2019 world production.
The number in your figure was 67.1M.
That’s a big difference.
Passenger cars 67.175M versus all motor vehicles 92.183M.
Ah. Well, two notes.
First, I think OICA is using a different definition of passenger car than that used widely in the US. The US term is “light vehicle” instead of “passenger car” (see the Federal Highway Administration), and includes SUVs and pickup trucks, as they are (at least in the US) primarily used for passengers.
So, I think that means that the OICA numbers for passenger cars are going to be lower than they should be, especially during periods where customer demand is shifting from sedans to SUVs and pickups.
Where demand is shifting away from sedans, OICA passenger car numbers will be misleading.
2nd, these numbers are for production, which will be different than sales. There will be significant timing differences which could be misleading.
3rd, except for the last two years, there is no evidence that I have seen that production is constrained (at least for ICES), and in the last two years it has been constrained by the availability of chips (which have been limited by planning errors, not by resources like energy).
Gasoline and diesel retail prices are hitting fresh record highs in the US (and several EU countries) this morning. In the US, gasoline climbs to $4.404 per gallon (up 48% y-on-y), and diesel rises to $5.553 per gallon (up 78% y-on-y)
Are you the real Javiar Blas from Bloomberg? I doubt it as he is too busy to visit this discussion group. But I am reading his/your book World for Sale. Fascinating account of the commodity traders in the world.
This article explains why Russian oil production will never recover. Bold mine.
The Inevitable Decline Of Russia’s Oil Industry
Russia’s oil production is already falling and will continue dropping in the coming months and years as Moscow will not be able to redirect to China and India all the volumes it is losing in the West. As the European Union tries to work out the details of a proposed full embargo on Russian oil imports by the end of the year – by potentially exempting Hungary and Slovakia for two years from complying with a ban – buyers in Europe and major international traders are increasingly shunning Russian oil.
Western sanctions on banking transfers and the expected EU embargo have forced Russia to reduce oil production. Russia simply doesn’t have enough storage, and its willing customers in emerging Asia are not expected to offset the drop in deliveries to Europe fully.
Sanctions and embargoes over Putin’s war in Ukraine will cripple Russian oil production for years to come. Restrictions, combined with the lack of access to Western technology to pump harder-to-recover oil and enhance production from maturing wells will hit Russia’s oil industry not only in the near term but also in the long term, analysts say. Many wells may never be revived to pump crude again, they add.
Podcasts from Oxford Institute for Energy Studies on Russia and Ukraine at link below (many of these focus on natural gas and LNG rather than oil.)
https://www.oxfordenergy.org/?s=russia ukraine
publication at link below is interesting
https://a9w7k6q9.stackpathcdn.com/wpcms/wp-content/uploads/2022/05/Russias-Invasion-of-Ukraine-New-Oil-Order.pdf
also
https://a9w7k6q9.stackpathcdn.com/wpcms/wp-content/uploads/2022/04/Russias-invasion-of-Ukraine-and-global-oil-market-scenarios.pdf
Thanks Dennis, interesting scenarios they are running. They make the case for an Iran return scenario which is also possible. Their projections regarding supply see a surpassing of the peak in 2019, which implies they believe ultimately that price of brent will increase short term but settle there after 2023, not sure where excess supply will come from though, i might have missed it in the document as a i was glancing through it.
Iron Mike , Iran is selling all the oil it produces since ages . Ages since I hear of tankers offshore storing Iranian oil . This is 40 years + of sanctions . How do you think they survived ? They have the trump card which is a nightmare for Washington ?? Shutdown the Strait of Hormuz . They know Washington is NATO ( No Action Talk Only ) 🙂 . So deal , then all they sell by ” off books ” becomes ” on books ” . No deal , no problem . Doesn’t seem they are in a hurry . Grab what so ever you are drinking and relax . 🙂
Hole in head,
The secondary sources estimate production and they do it fairly well. Iran might be exporting some oil on ships flagged under other nations. The output is as reported, that’s why they agreed to the JCPOA, if the sanctions had no bite, they would never have reached agreement. Currently they likely feel they are in the drivers seat as the World oil supply is very tight, so they are pushing for a better deal and Russia is trying to create roadblocks as well. In addition there is a lot of opposition to the deal in the US and from enemies of Iran in the Middle east. It seems unlikely a new deal will be reached.
The below chart is OPEC+ C+C through January 2022. They peaked in 2017 and at that time they were 63% of world C+C production. Today they are 58% of world production. Notice how round the hump is. Almost a bell curve. That is how production peaks for such a huge percent of the world’s production.
Click on graph to enlarge.
Ron , for some ” De Nile ” is a river in Egypt . 🙂
Ron,
Sanctions imposed on Iran in mid 2017 explains the very slight decline in OPEC output in 2018, also sanctions on Venezuela were imposed in 2019 and OPEC cut output in 2019, then there was the pandemic in 2020 to the present as well as sanctions on Russia, so this has more to do with politics than geology. Nice chart though.
Of course, that is correct Dennis. It is never just geology. It is always politics, money, and geology. It always has been and it always will be. Peak oil is still peak oil whether it is caused by politics, money, geology, or some combination of all three.
Ron,
I typically think of peak oil in terms of geology and economics, shocks like a war or a pandemic or a severe recession, or a cartel limiting output due to low oil prices (as occurred in 2019), I tend to put in a separate category, likewise a fall in output due to low oil prices and a lack of demand because the World has found an alternative source of energy for land transport (as might occur by 2030 to 2035), I would put in the category of peak demand (low oil prices being the reason for declining output) rather than peak supply (where oil prices would remain high and output would continue to decrease.)
It is difficult to know how it will all play out, a big drop in Russian output may not be able to be replaced short term, but eventually Russian output may stabilize at 9 Mbpd as they ship their oil to Asia and elsewhere rather than Europe and North America, this could take a few years for the market to adjust. High oil prices for a prolonged period may result in more oil supply than you imagine. It might also speed the transition to electric power for personal land transport, which will reduce demand. The future is particularly difficult to predict at this time, I realize that it is very clear to you, but not at all clear to me.
Dennis, there is no separate category for peak oil. Peak oil will be, or rather was, peak oil regardless of the category you place it in. You are not allowed to say: “This does not count because it was caused by politics.” Of course, you can say that but all it will show is that you do not understand what peak oil really is or what it means.
About alternative energy. I am all for it. But fossil energy, particularly crude oil, will decline way faster than alternative energy can replace it.
Dennis, this is far more important than you seem to realize. Fossil energy is collapsing while the world population, and the demand for cheap energy, are increasing. Almost every day I drive out on the highway and I see the massive amount of automobiles and trucks. And I think to myself: “They think all this is going away and be replaced by batteries or some other thing.” I know that is total absolute bullshit.” It is just not going to happen Dennis. I would be delighted if it did, but I do not live in that dream world.
Dennis, peak oil is in the rearview mirror. But there is a far more important factor in play here. Our survival depends on the energy we have to support our population which has far outgrown the ability to live off the land without the aid of massive inputs of fossil energy. Sunshine and wind, which I dearly love, will not come even close to replacing fossil energy.
However, Dennis, I will be 84 years old next month. I will, very likely, be safely dead when the shit hits the fan. And it tears my heart out that my children and grandchildren will still be around.
And no one seems to be preparing for the inevitable. They seem to believe that those windmills and solar panels will fix it all. Damn, they might as well believe that God will just not let it happen. Reality is just something that…. damn it, I quit for the night. Time for another toddy. 😂
Ron,
It will take time to replace the light vehicle fleet, but by 2035 close to 100% of light vehicle sales will be EVs, then it it just a matter of 14 years for most of the remaining ICEVs to be scrapped, as far as wind and solar, a highly interconnected widely dispersed set of wind and solar sites will require very little backup and some can be done by natural gas or synthetic fuels produced with excess supply during windy or sunny periods, the synthetic fuel plants would be located in areas with high wind or solar resources wher there would be frquent periods of excess power output which would be utilized for synthetic fuel production.
I agree the peak will be the peak, but it is easier to take when the peak occurs because there is a lack of demand, which you seem to believe is impossible, and I believe is likely by 2035.
Oil and coal will go first, and as natural gas depletes and becomes expensive, that too will see peak demand (probably around 2040 for natural gas).
By 2050 we will likely see peak population and the demographic transition will result in falling population as more and more families will choose a one child family. Population can fall pretty rapidly.
Your comment makes a clear distinction that is usually never brought up in discussion: There are proximate causes and ultimate causes. The proximate causes are many, but the unitary reality of peak looms behind it all.
Mike B,
We all agree oil output will peak at some point in time. Ron believes the ultimate peak will be 2018 or 2019 (depending on whether trailing or centered 12 month average output of C plus C is used). I think we will see a new peak in the 2027-2029 range at about 85 Mb/d. It is possible demand will fall due to high oil prices and people moving to electric transport, we can only guess how it might play out.
Some people, like me, are preparing for the inevitable and have been for decades. Admittedly, our numbers are very few, but the invitable end of growth and the end of industrial civilization has been obvious for a long time. Anyone who has children and grandchildren should have been preparing for their future in subsistence horticulture for just as long.
Anyone who has children and grandchildren should have been preparing for their future in subsistence horticulture for just as long
Yeah, I agree. The problem is my kids and grandkids don’t believe a damn word of it.
Here is my usual incremental C&C graph
3 May 2022
Will the world ever reach peak crude production of November 2018 again?
https://crudeoilpeak.info/will-the-world-ever-reach-peak-crude-production-of-november-2018-again-part-1
EVs require a new mining industry (dependent on diesel). Interesting demo from the Australian public broadcaster:
4 corners program 9/5/2022
Digging in: why powering a green future means more mines
https://www.abc.net.au/4corners/digging-in:-why-powering-a-green-future-means-more/13873540
Sorry for this late contribution. I am still not back on the mailing list
Matt,
I haven’t been doing the mailing list usually there is a new post weekly.
Ron, perhaps you have already mentioned this, but would you repeat it if you can. Why is there a discrepancy between what OPEC Monthly gives and what EIA gives for crude + cc for OPEC countries. Is it a matter of NGL’s for some countries? If so, which?
No, it has nothing to do with NGLs. It is simply condensate, nothing else. The OPEC MOMR reports crude only, no condensate. The EIA reports crude plus condensate. That is supposed to be the only difference.
Condensate usually runs anywhere between 6% and 10% of total production. However Qatar produces more condensate than crude oil, or used to anyway.
Thanks
Self explanatory .
https://www.rigzone.com/news/lng_supply_crisis_to_hit_hard_this_winter-11-may-2022-168954-article/
I notice that no mention is made of the continuing drop in drilling rigs in Canada. This will surely show as a drop in production into the future.
Jay Woods,
Canadian rig counts always drop in the spring (at least since Feb 2011), probably due to mud season. See chart below, every year rig count drops in the spring, in most years the peak is during winter, perhaps the frozen ground makes it easier to move rigs in winter.
https://bakerhughesrigcount.gcs-web.com/na-rig-count
Jay Woods,
A great chart by George Kaplan (far better than mine) at link below with an explanation.
https://peakoilbarrel.com/december-us-oil-production-unexpectedly-drops/#comment-736168
My wife and I recently purchased a Tesla Model Y. This replaced a Jeep Cherokee, which averaged around 25 mpg. The Cherokee was a lease and we put about 43K on it in 3 years. This got me thinking about the impact electric vehicles are currently having on oil demand.
If it is assumed that a BEV replaces an ICE which, on average, got 30 mpg and traveled 10K/year, (conservative compared to our mileage and usage) then it takes about 4 million BEVs to reduce about 100K barrels/day of oil demand. A quick Google search suggests about 4 million BEVs were produced in 2021 (another 2.5 million plug in hybrids). So last year at least 100,000 barrels/day of oil demand destruction–this estimate ignores plug in hybrids.
According to Statistica, there are 12 million electric vehicles on the road today. It is not clear how many of these are plug in hybrids. However, I think it can be safely assumed that, to date, BEVs have taken at least 200,000 barrels/day off the road.
A quick Google search shows that current estimates are for 6 million BEVs (excluding plug in hybrids) will be produced in 2022. So an additional 150,000 barrels/day will be taken off the market this year by BEVs. Thus, by the end of this year, 350,000 barrels of demand destruction/day.
These numbers are still very small but growing, and will only accelerate. This will be particularly noteworthy as pickups and other large vehicles start to hit the road. Rivian and Ford are now producing very low numbers of pickups, but the demand for these vehicles is extremely high–all that is missing is production. Telsa has a target of 2023 for their Cybertruck.
BEVs don’t need to replace all oil production–at least not in the near term. But keeping up with declining production is vital. Based on these numbers, I think a plausible argument can be made that this could happen.
Let the arrows fly.
Keep in mind gasoline is an inevitable part of a “barrel of oil.” While there is some flexibility in how a barrel can be cut – you can’t have a world where we still use diesel, jet fuel, etc. and no gasoline. It would have to be flared or disposed of somehow. BEV’s and hybrids replace gasoline demand with (all source) electricity demand. The most likely outcome I see is that gasoline will be relatively cheaper for other consumers, and other oil fractions more expensive, if BEV’s roll out in force.
Gasoline can, in some sense, be looked at like a “loss leader” or a subsidy for the remaining fractions.
Nice observation, BB. Your comment, “BEV’s and hybrids replace gasoline demand with (all source) electricity demand” is profound. There are no free lunches.
Maybe they could dump the gasoline into the rivers as they used to in Ohio back when kerosene was the main product of refining. (Two of my great grandfathers were “oil pumpers” in late 19th-early 20th century Lima oilfield of Ohio.)
This obsession with keeping cars on the road as resources deplete and the atmosphere warms is a uniquely western delusion, I think. It’s business as usual, with a green fig leaf covering its naughty bits (stress on grids, metals and rare earths depletion, slave mining, etc.).
By god, those cars better keep running. Who gives a shit that environmental destruction is already baked into the cake? I fully expect EVs to take off so the elite may smugly drive while the rest starve.
Yes, gasoline is a little less than half the cut of a barrel of oil, but it is significant. Gas and diesel together account for around 70% of a barrel. Both gasoline and diesel can theoretically be replaced with all electric. For instance, there are a lot of players looking to electrify class 8 trucking, from Tesla to Cummings. They will sell as many as they can make. Tesla has announced 2023 as their (latest prediction) for the start of their semi program. I am skeptical, given all the delays since they announced the program in 2017. But if they can deliver on the specs they announced, it is a game changer.
City busses is an area where the transition to electric is happening fairly quickly. Even heavy equipment for mining industries and ferry boats are slowly being electrified. All of this is happening now–it is not theoretical. The question is can the transition keep up with depletion. I think it is at least plausible.
Mining is the oldest part.
Deep mining is mostly electric since long – because of oxygen and poisoning. And some pit mining is electric, too, where big machinery can be supplied by flexible cables – because of low movement range.
Trucking – all big european constructors have already electric short range delivery trucks in their catalog. I’m seeing several of them already in town.
At Mercedes Benz trucks you can order everything electric from a delivery 7.5 ton to a 26 ton with up to 400 km range.
Order – not just a project as with the Tesla truck.
And 400 km is enough for many trucking tasks here. Just for the long distance hauling we will see Diesel engines for a longer time. But it’s ok to harvest the lower fruits first.
To Whom it may concern:
There is no question about intelligence of the people that regularly visit this site, really smart. When on the topic of EVs I think a large blind spot appears. With a little effort the change in the cost of the metals required for batteries can be found. In the past18 months they have exploded. Lithium carbonate alone has increased by 10X. Sure the battery manufacturers have supply contracts but in time, batteries that have $100s of lithium carbonate will now have $1000s of the metal. What doesn’t seem to be thought about is doing the math. To double the EVs on the road the metal supply chain has to lead the way. Where and how is this going to happen? China already processes 80% of the worlds lithium carbonate. By the way it’s an energy intensive dirty process. With the western world keying every major energy decision off of the carbon atom, an energy poverty existence will surely follow.
It’s just: Supply chains need time to be build. There is a lot of Lithium out there, it needs time to build up and develop all the infrastructure. It won’t go in a few years.
And the high prices help: Here around the corner they start building a geothermal heating plant for a big city. And they will extract the Lithium from the brine before pumping it back underground. With dirt cheap Lithium, this part wouldn’t be build I think.
Electric trucks and busses for application where they work today(hint: not long range hauling) it makes much more sense for them as for electric cars. They are much more on the road than private cars, lessening the pressure on Diesel consumption much more per KG lithium used.
Moving away from carbon is a good deceision for Europe at least – being completely dependend on the world market with little backup in the own country isn’t the best thing as you can see today.
With some aching the US could get oil indipendend ( small cars and pickup trucks only when you need to transport something for example). Europe can’t.
Eulen , “There is a lot of Lithium out there, it needs time to build up and develop all the infrastructure. ”
There is a lot of gold in the seabed . Go and mine it . All what is technically possible may not be economically feasible . Remember the Concorde airplanes ? Maybe the De Lorean car ? etc etc Obviously not .
P.S : Are the trucks bringing components to the Tesla factories also electric ? Are the customers who come to pick up their Tesla walking / cycling or coming in an ICE ? Oil is the master resource . As goes oil so goes industrial civilization . You can run but you can’t hide .
I was recently out in Napa valley and Big Sur on vacation and I was astounded at how many Teslas we’re on the road. I swear it was one in every ten cars. Coming from the Mid-Atlantic/Southeast US this was clearly a shock to me. I think it is genuinely possible that EVs will “save the day” for personal transport. Of course as an LNG guy I’m cognisant of where the electrons will need to come from to charge this EVs but either way it was an eye opening experience.
It probably helped that regular unleaded was $9.99/gal in Napa.
LNGuy,
Hope you had some nice wine while in Napa, beautiful vineyards.
I imagine in time that much of the charging will come from wind, solar, hydro, geothermal, and nuclear power. Eventually natural gas will deplete and become expensive (it is pretty darned expensive now, especially in Europe and some Asian nations), as this occurs wind and solar will look very cheap in comparison. It will not happen overnight, but maybe by 2040 we might be at 65 to 70% wind, solar, hydro, nuclear in OECD.
Gasoline can also be used in combined cycle power plants. I used to work at one that was permitted to burn diesel, naphtha and gasoline. It mostly burned naphtha because that was cheaper from the refinery than gasoline.
Any combined cycle plant that burns natural gas could quickly be converted to liquid fuels, including gasoline, with a simple turbine fuel nozzle change and addition of a high pressure fuel supply pump.
Mr Clarkson , easier said than done . This is not a light switch . Complexity killed the cat . 🙂
Cavebio,
I have created EV transtion scenarios that confirm what you suggest, light personal vehicle plugin sales growth was 108% in 2021 and the average annual rate of sales growth from 2014 to 2021 has been 40% per year. Assuming 39% sales growth from 2022 to 2027 and then a decrease in the rate of growth to zero by 2031 (when all new car sales are plugins), I get the scenario below. Note that I have assumed 70% of plugin sales are BEV and that 50% of plugin hybrid miles are on electricity with the other 50% using fuel at 30 MPG. By 2040 I assume the portion of plugin hybrids starts to decrease by 1% per year falling to a minimum of 1% of the personal vehicle fleet by 2068. Heavy trucks are assumed to start moving to EVs by 2026 and follow a similar trajectory as personal vehicles but delayed by 9 years.
This scenario is no doubt optimistic, demad falls below supply by 2028 for this scenario where demand for oil from uses other than land transport is assumed fixed at the 2019 level (this is a simplifying assumption which is likely incorrect).
Chart above is C plus C supply and demand in millions of barrels per day.
Thank you for sharing Dennis. It will be interesting to see if production of BEVs can catch up with global demand. We ordered our Model Y in August 2021–It was delivered in February 2022. Once in our driveway, two of our neighbors ordered one–they ordered within days of us receiving it and taking a test drive with us. Their deliveries are currently scheduled for February 2023. If our experience is typical, then there is an exponential increase in demand occurring. Lots of compelling new models from a variety of companies will come online in the next couple of years.
This is going to be a very interesting time to observe.
Cavebio,
Congrats on the MY, I have had the M3 since 2018, very nice, a MY is supposed to get here in July or August LR AWD Aero wheels, did you get your car when they promised or did you have to wait?
Agree it will be interesting to watch, most car companies are having trouble keeping up with demand, supply chain may be the limiting factor.
Cave bio,
My data shows about 17 million, plugin vehicles, perhaps 70% of these are BEV or roughly 12 million are on the road at the end of 2021. Let’s say each is driven 12k per year and each replaces a vehicle that had fuel economy of 30 mpg. That is a savings of 9.52 barrels per year for each BEV, times 12 million would be 114 million barrels per year or 313 kb/d of fuel saved. The plugin hybrids might save another 67 kb/d assuming 50% of miles driven are utilizing electricity, so a total savings of 380 kb/d. If we add the 6 million EVs expected to be produced in 2022, that adds another 156 kb/d saved or 536 kb/d. My expectation is that we will have 350 million EVs on the road by 2031 and this alone will reduce demand by about 4.5 Mb/d, the 150 million plugin hybrids might reduce fuel used by another 1.96 Mb/d for a total savings of almost 6.5 Mb/d, by this time there will be short haul trucks, and buses that will be battery powered, long haul trucking would be better replaced by electrified rail.
The key thing to remember here is that those who drive the most are the most incentivized to switch to an EV, as the price per mile is so much lower. So generally speaking you will replace the ICE cars that are sucking up the most gas off the roads. I don’t know what the numbers are, but my guess is that the top 10% of cars based on miles driven drive probably 25% of the miles. It’s exactly these folks who are now switching to EVs en masse. They save so much on fuel the vehicles literally pay for themselves.
Hate to butt in , but you guys think USA/ Europe is the world . There are 1,45 BILLION automobiles in the world and out of this 1.1 BILLION are passenger cars . What are you going to do ? Drive them into the sea ? You talk about EV’s having huge demand and they can’t supply . Yes , that is because they can’t produce . LTG is here , ignore it at your risk . I have said earlier that before we have lines at the pump we are going to have a financial crisis that will make 1929 like a walk in the park . Talking about EV’s is dumb when you can’t even provide baby milk powder (USA ) , cooking oil ( Europe ) , flour ( India) etc to your citizens . The future is here . Watch it on the link below . Don’t say later that this is a ” black swan ” because it isn’t . Nothing bad happens until it happens to you .
https://www.youtube.com/watch?v=p1uYeLg1UUQ&t=4s&ab_channel=PakistaniTrucks
Hole in head,
Cars get scrapped all the time, typical life is about 14 years. The scenario I use has the following for ICEV passenger vehicle fleet and plugin fleet in millions of vehicles. The transition happens gradually over a period of 25 years.
Dennis , 25 years . = 2047 . ROFL . 🙂 . Stretch it to 2077 = 50 years . Take your time , mankind is no hurry . What , me worry ? ( MAD magazine )
Hole in head,
1.4 billion vehicles will take some time to replace, they were not built in a day and they won’t be replaced in a day.
Feel free to create your own scenario, by 2044 there will be very few personal vehicles on the road that use fossil fuel in an ICE, if self driving cars are approved by 2030, this ice fleet curve will drop very quickly because most transport will occur in a robo taxi and very few people, except the very wealthy will choose to own a personal vehicle, they will simply use a robotaxi. Miles travelled per vehicle will increase to 30 to 40k per year and the number of vehicles produced will drop drastically, this will speed up the transition to electric transport by a factor of 3 to 4 because each EV built will take 3 to 4 ICEVs off the road a single EV travelling 40k will take 4 cars that travel 10K off the road).
For electric trucks see
https://chargedevs.com/newswire/heavy-duty-electric-trucks-start-to-appear-in-fleets/
Excerpt:
Research firm Wood Mackenzie estimates that just over 2,000 electric trucks were in service in the US at the end of 2019, and predicts that that number will grow to 54,000 by 2025. Most analysts say the transition is beginning, but that it will be a gradual process. “I think 2020 was the year of commitments,” Mike Roeth, Executive Director of the North American Council for Freight Efficiency, told Transport Dive. “If everybody [does] what they say will do, this will happen pretty fast.”
Note that in 2018 there were about 13 million heavy duty trucks on the road, so 54000 trucks is about 0.4% of the 2018 total. It will take time to ramp up production, just as it taking time in the passenger car space.
If we have 60% annual sales growth we get close to the 54,000 truck total in 2025 and if we assume this sales growth continues to 2034, we arrive at 5 million trucks by 2035 and by 2041 we get to 14 million trucks (no more sales growth after 2034, just linear increase.
Only 1% of the fossil energy that is spent in cars goes to moving a person around. Average person is 150 lbs in a 3000 lb car at 20% combustion efficiency = 1%.
Most electric vehicles will not be cars, they are too inefficient because of their crappy weight to payload ratio.
https://www.ebicycles.com/ebike-facts-statistics/
Raising the efficiency rate to 5 or even 20% will not be very difficult over twenty years timeframe if we include smaller EVs such as bikes, scooters etc
Stephen,
A Model Y costs 63k, a RAV4 is about 30k and gets about 28 mpg. Over 200k miles at $4/gal that is 28571 dollars, the cost for electricity would be about 3.75 cents per mile (assumes no supercharging which costs 2.33 times as much) which is about $7500 over 200k miles. So the savings is $21251 over 200k miles and note there is higher insurance cost for MY and the opportunity cost of the extra 32K spent on the Model Y up front.
This is not a particularly fair comparison because although a Toyota is nice, the Tesla is a much nicer car. If we compare the Tesla MY with the BMW X5x40i AWD, the price is the same and these cars are of similar quality. The BMW gets 25 MPG, so $24500 in fuel saving with no supercharging. If 25% of the 200k miles are powered with superchargers (35 cents per kWh), the savings in fuel cost would be about $22k over 200 thousand miles assuming gasoline at $4/gal and electricity cost at home at 15 cents per kWh and supercharging cost at 35 cents per kWh with 150k miles powered by home charging and 50k miles powered by superchargers. The electric range for the Model Y is 330 miles and it is AWD.
Just curious, how are the roads going to be paid for without taxes on gasoline? The EV vehicle owners aren’t paying for this, so the economics you are shamelessly touting for EV which is – just oh so wonderful – as EV drivers pay absolutely nothing to use the same road the ICE drivers have to pay for. Life is really great, and you can shill your battery ride to all the neighbors because hey! You aren’t paying for the road your driving on! Wonderful! And the much heavier weight of an EV compared to an ICE tears up the road that much more! But what do you care? You’re driving your EV for free on the same road paid by ICE gas taxes, and then bragging about how low your operating costs are compared to ICE vehicles!
Here in Europe we pay a yearly “car tax” so that could probably work for EV’s too.
It would have to be a bit higher than what we pay today, since as you say most is covered by taxes on fuel.
It’s a decent argument but it doesn’t hold up. Gasoline taxes only make a small dent in the funds needed to maintain roads. Taxes from federal funds, state fuel taxes, state weight-mile taxes from trucks, and state vehicle and registration fees are used to maintain roads. Some states (like Washington) have a extra registration fees for battery vehicles to make up for the loss in gasoline taxes. It’s been a political non-starter to raise gasoline taxes for a while now, although that is one of the better ways to encourage EV ownership.
Philip , your view is USA centric . Here in Europe and India ( I know) and I can presume also in ROW, Mike Sutherland is right on the dot . Take away the FF taxes , the EU and India will collapse even before you bat your eyelid . I can assure you of this .
A Tesla Model Y weighs 300 kilos less than a Ford Explorer.
As for gas taxes, many places have programs to subsidize electric car ownership: they encourage people to buy, and industry to manufacture. Lack of a gas tax is essentially part of this subsidy. Once they are firmly established, they roll back the subsidy. My guess is that they will also start some kind of usage tax once EV’s are more common.
Mike Sutherland,
This can be addressed, by having all vehicles pay road taxes when the car is registered based on gross vehicle weight and mileage, it doesn’t happen yet, but it will in the future. The current tax can be left on fuel as a carbon tax, note that not enough road taxes are collected from fuel taxes to maintain roads in any case, much of that is paid from local, state, and federal taxes.
See
https://www.instituteforenergyresearch.org/regulation/gas-tax-little-road-costs/
Here in North Carolina I pay $160 extra a year for road maintenance since I don’t pay a gas tax when I pay my property taxes on my car. I’m. It sure if that’s enough or not but it seems like a reasonable charge.
Stephen,
That seems like a good system, is it a flat fee or based on last year’s miles travelled?
It seems to me that all cars should pay in this way and the gas taxes should remain as a carbon tax that gradually rises to encourage people to switch to EVs, it could even be a fee and dividend approach where the money is placed in a pool and is shared equally among all tax payers as a rebate when filing taxes, or if could just go to general Federal and/or State tax revenue. Up to the voters in each state how to utilize the state portion of the fuel tax.
Just a couple of things. 20 US states currently charge EV owners an additional fee for road taxes. The Feds could do this also. Any fair fee charged doesn’t really change the economics of EVs versus ICE vehicles. Two states, Arizona and Missouri actually charge EV owners as if they had an ICE vehicle that gets only 9 or so miles per gallon.
The weight of a Chevrolet Suburban is around 6K lbs while a Tesla Model Y is around 4.6K lbs.
Hello Mike,
With my Model Y, I front pay $140.25 as an additional registration fee to offset what I don’t pay in state gasoline sales tax. I don’t want to hit any potholes and gladly pay the fee. With the state gasoline sales tax at $0.35/gallon, that’s 400 gallons of gasoline I’d have to buy if I owned an equivalent ICE.
Dennis,
So maybe the number I found of 12 million electric vehicles was for BEVs excluding plug in hybrids–that would make sense given the numbers you note. I like your estimate of half 536b/day by the end of the year much better than mine!
Regarding the wait time for the Y, our lease was up this past December, we ordered the vehicle in August–at the time the online estimator suggested delivery in December. Over the intervening months the delivery time vacillated between November and March. I have been following the construction of Giga Texas and Berlin closely. It will be interesting to see if they ramp at the same rate as Giga Shanghai. That should help alleviate backlogs, or at least make the delivery times a little more stable.
FWIW we absolutely love the car. I took my son and grad student on a collecting trip. I packed up all the collecting gear, tents, sleeping bags. My wife came outside and looked in the car and said, “what have you been doing out here?”. The car looked empty–she thought I had not started packing. All of that fit in the frunk and the rear well space!
Sounds great thx.
Cavibio , “According to Statistica, there are 12 million electric vehicles on the road today. ” Total vehicle population worldwide is 1.4 billion so 12 million = 1.16 % . Ever hear of ” Pissing in the pool to make it salty ” . Obviously not . You have anecdotes , I have the figures . Please tell some more .
Hole in head,
We are using the figures, sales for plugins have grown at 40% per year on average for the past 7 years, if that continues until 2028 and then fixed sales rate for plugin vehicles after that, we get to half the personal vehicle fleet as plugins by 2033 and 100% in 2044. This does not take account of the potential for self driving cars which if approved in 2030 could replace the rest of the fleet very quickly, as quickly as people choose to give up their cars which will be sitting idle because they are no longer practical to operate. Insurance and fuel would cost more than using a robotaxi so much of the existing ice fleet would become obsolete.
I’m sure you realize that everything that goes into an electric vehicle or a large wind turbine magnet is mined from the ground. And in most instances it’s not a pretty sight or remotely eco friendly.
Copper. Zinc. Nickel. Dysprosium. Neodymium. Oil. Cobalt. Lithium.
I’m not bashing, just pointing out that to make this transition, from start to finish, we’re going to have to dig like a dog for a bone. And the more we dig, the more these hard-to-get metals, minerals and rare earth elements are going to cost—because they all trade as commodities on an inelastic model.
No one has truly addressed the issues of the electricity hog: electronics and data storage of the (mostly) mundane. Or the fact that manufacture of semiconductor chips is both an electricity hog and one thirsty water hog. And no one has really done more than chuckle when the issue of 15% of methane on earth is burped from the multiple stomachs of cattle.
Lithium is everywhere the soil is sufficiently alkaline that a cactus won’t grow—it just requires moving a lot of earth and then treating it with huge quantities of hydrochloride acid. Nickel is in Indonesia and Russia. REE’s are mostly in China, with the exception of Cobalt, which is in the Congo. Pure nickel is now rare, so laterite must be smelted—if you haven’t seen that please do so, it is a filthy process that eats up vast quantities of (usually low-quality) coal and billows sulfur and carbon into the troposphere.
But at the end, we can take the lady out in a damn Tesla, as clean as the driven snow, running on electricity generated by harnessing the wind. Gee, I think I’ll go get one of those marvelous conveyances too! Maybe go have a steak, talk about saving the earth. Might make a toast to the poor kid feeding coal into the nickel smelter or the skinny one that died in the rathole bringing up cobalt in his pockets.
What a bunch of crap!
100% agree. It’s difficult to accept, but most seem incapable of seeing beyond the Narcissistically myopic horizon of proximate causes and proximate effects. A sobbering realization.
People have been thinking like that with gasoline and internal combustion engines since early 1900’s, so its no big change in attitude. Just an attempt at adaptation to the end of very cheap petrol.
Prediction- humans will work hard to keep up a mechanism of transportation even after affordable petrol is only available for the wealthy. Electric beats horses.
Gerry,
There are plently of problems in the World, they existed long before EVs were produced. The same argument can be made for every product produced. As far as methane from cattle, I am a vegan, the oil use will be reduced by developing EVs, and EVs are likely to last longer than ICEVs and require less maintenance. It is up to the nations whose childeren are allowed to work in dangerous industries to enforce laws to protect their citizens.
https://electrek.co/2020/06/16/tesla-secures-cobalt-deal-controversial-material/
There are several ways to improve the efficiency of our personal transport, which as I stated above currently stands at about 1% in the US. Because our system of personal transportation is so ridiculously inefficient, achieving great improvements of five- or ten-fold in a relatively short period of time such as one or two decades as oil depletes SHOULD be pretty straightforward. Will there be environmental effects? Definitely. But then I’ve also seen video footage of the Permian Basin and/or the Alberta Tar Sands from flyovers that don’t look like a cockroach could live there for many many square miles. In general switching to more efficient transportation as the older fleet is retired should be a good thing environmentally, but especially from a carbon-emitting perspective. I find it dubious that society will simply collapse rather than make some adjustments for which the technology is already available. Humans are very adaptable, especially young ones.
In no particular order.
1) Switch to electric cars. Electric engines are four times as efficient.
2) Ride in a smaller vehicle, which could be anything from a microcar to a scooter to an electric one-wheel to an e-bike. This may be the most effective as the ratio of payload (typically say 150 lbs) to vehicle is so much lower. Obviously combining this one with an electric motor magnifies the efficiency effects. So if an electric scooter is 150 lbs and the vehicle is 150 lbs, you have right away a 50% efficiency rather than the current 1% (or less) of a typical car to the person weight in a combustion engine (a 50-fold improvement, or 2% of the energy used originally). In the global south where much of the human population resides, this is possible to do year round in many places as the cold is not an issue.
3) Use public transportation. There are inefficiencies with established routes and timings on public transportation, but especially as it electrifies this will bring very large improvements.
4) Carpool. Carpooling apps such as the Waze carpooling app have great potential to screen individual riders beforehand and facilitate this activity greatly.
5) Telecommuting. Improvements in this field since Covid have been profound.
6) Autonomous vehicles. From what I’ve read level 5 is a long way off, at least a decade even for the likes of Tesla. But level 4 autonomous vehicles that are “geofenced” (i.e. premapped routes) are already in operation and are likely to compete with other fixed bus routes in the next 2-3 years on a wide-scale basis. Smaller vehicles with more frequent routes (and more routes generally) that can also operate earlier and later in the day will seriously compete with public transportation in major cities. Again, combining this with electric propulsion and with smaller personal electric transportation for the “last mile” will be highly efficient in terms of moving people around.
Of course this is just personal transportation, but this is where the inefficiencies are largest and where the options for disruption are most numerous. What will happen with all the stuff we have to move around? My guess would be more localized manufacturing using higher tech equipment that is less labor intensive and more customizable. As fossil energy prices increase and the world devolves politically, the money saved on transportation and the increase in reliability will be worth the transition (one that is already underway I might add).
Nothing is set in stone and I’m sure places will fail to make this transition (some already have). That’s what makes the topic so interesting right?
In addition to the items that Stephen outlined,
I’ll add the idea that scarcity of energy, or lack of prosperity for any other reason,
will provide a huge incentive for humans to restrict the waste of transport energy
on frivolous or optional uses.
And that is a huge item.
Much more waste in some countries than others.
I can speak with certainty that in the USA there is huge energy to be saved.
Sorry if this bursts somebodies entertainment or vacation bubble.
Dennis,
everything that goes into an electric vehicle or a large wind turbine magnet is mined from the ground. And in most instances it’s not a pretty sight or remotely eco friendly.
There are plenty of problems in the World, they existed long before EVs were produced. The same argument can be made for every product produced.
EVs and wind turbines will reduce the volume of ground extraction dramatically: oil, gas and coal extraction volumes are 100x as large as the additional virgin metals extracted for EV and wind turbine production.
Dennis “IF that continues until 2028 and then fixed sales rate for plugin vehicles after that, we get to half the personal vehicle fleet as plugins by 2033 and 100% in 2044. ”
I have always called out your “if” and ” but ” ‘
Now for something which I know is in bad taste and inappropriate ” If grandpa had t**t’s he would be called grandma ” . 🙂
Hole in head,
You use if and but as well, just commonly used words in the language. A fairly silly criticism, you can do better.
Perhaps Dennis, at least in part.
One major variable missing in that analysis is the love of cars, driving and independence. Here in Texas, for example, folks generally love to drive and need to as we have minimal public transport. Vehicles here can often be an expression of individuality, style and personality…. working on them can also be a passion. Whether it’s a big block V8 truck for mudding/hunting to a low rider vintage ICE with awesome wheels and chrome to a Bentley for those so fortunate.
In high density population areas, self-driving will certainly have their place and dominate… much like the yellow cab industry has for decades in Manhattan. But self-driving displacement will not change overall individual car ownership much in these areas as it is already the case.
Self-driving cars will certainly find a utility use where I live, much like Uber has. But most folks I know like to have both options… Uber is most often used when destination parking is limited or it’s a boozy evening. Meanwhile, the individually owned cars sit at home waiting for other tasks they are better suited for. Individually owned vehicles (both EV and ICE) will persist much longer here in Texas than 2030 I think… maybe into reasonable perpetuity.
Gungagalonga,
Yes it is possible individual ownership of vehicles will continue, just as there are still people that own and ride horses because they love them. I have never ridden a horse and never plan to, I imagine in the future there will be many people that have never driven a car because there was no need. I do not expect self driving cars to replace all cars by 2030, I expect they might be approved by 2030 (at the earliest), it will take a generation before most driving is by self driving vehicles after approval, so perhaps by 2050. The number of miles covered by self driving vehicles once approved will increase exponentially by 15 to 20% per year, perhaps faster (depends on safety in part).
US Oil Output Slips as Higher Costs Hit Drillers
Weekly US crude oil production declined for the first time in three months, signaling that soaring costs across the oil fields may be preventing drillers from expanding output.
The decline hits as the oil-consuming nations are scrambling for additional supplies to reduce reliance on Russia and bring down the skyrocketing crude prices. President Joe Biden has urged the industry to raise supply to help battle historically high fuel inflation.
Domestic crude output last week fell 100,000 barrels to 11.8 million barrels a day, after holding steady over the previous three weeks, according to data from the Energy Information Administration. The decline stems from a small drop in Alaskan volumes. Output from the rest of the US, including prolific Permian shale basin, held steady.
U.S. crude oil production down last week: EIA
HOUSTON, May 11 (Xinhua) — U.S. crude oil production averaged 11.8 million barrels per day (b/d) during the week ending May 6, down 100,000 b/d from the previous week, U.S. Energy Information Administration (EIA) said Wednesday.
The figure rose by 8 percent from this time last year, according to the EIA.
More than 80 percent of the U.S. crude oil production growth comes from the country’s Lower 48 states, which does not include production from Alaska and the Federal Offshore Gulf of Mexico, said the report.
Weekly numbers follow the STEO. There was a major adjustment lower in the STEO recently to adjust for actual output in February, so the weekly number has been adjusted downward, the weekly numbers and changes in them from week to week mean very little.
Weekly 4 week average and monthly data for US C plus C
OPEC Kingpins Sound Alarm Over World’s Dwindling Energy Capacity
“I am a dinosaur, but I have never seen these things,” Saudi minister Prince Abdulaziz bin Salman, who’s been attending OPEC meetings since the 1980s, said Tuesday at a conference in Abu Dhabi, referring to the recent surge in prices for refined products. “The world needs to wake up to an existing reality. The world is running out of energy capacity at all levels.”
Can anyone guess Putin’s timing???????????????
Well, this Fall would be the ideal time.
Just think about it——
This is only relevant to oil and gas production in the long term, but it obviously has the potential to cut sharply into demand for both oil and gas.
https://www.cnbc.com/2022/05/12/tesla-ceo-elon-musk-dismisses-hydrogen-as-tool-for-energy-storage.html
Some of the regulars in the oil and gas section may want to talk about it there, so I will post the link there too.
My opinion of Elon Musk, as a business man, is that he is both extraordinarily intelligent and a world class workaholic, with world class charisma, etc. He may be the most popular business man on Earth.
He is also extraordinarily lucky in that he has been in the right place at the right time with money enough to see his opportunities and take advantage of them.
But I’m not impressed with him as a person.
Now it’s pretty much sop for business men to dismiss the competition out of hand, but I don’t like it when one of them is so popular that tens of millions or even hundreds of millions of people are apt to take his opinion as gospel…… when I strongly suspect that he is deliberately bending the truth into a pretzel.
It’s not as if he’s stupid, and cannot see hydrogen’s potential as an energy storage medium.
I’m personally dismissive of hydrogen as an automobile and light truck fuel, myself, because of the difficulties involved in handling it, the experimental state of the fuel cell industry in terms of cost and durability in transportation, and the lack of infrastructure to distribute it for sale at retail, etc.
BUT having said this, Musk himself is heavily invested in solar energy, at the residential level, and potentially at the industrial level, later on.
My personal opinion is that he makes fun of hydrogen mostly because he’s heavily invested in batteries, although it is true that for now, batteries are the answer in terms of cars and trucks and small scale energy storage at homes and businesses.
Given that he is neither stupid nor ignorant, I believe he fully understands that hydrogen produced by electrolysis of water using wind and solar power is at least potentially well suited to production and use at the industrial level.
Barring near term economic collapse, we will have wind and solar power out the ying yang within ten to twenty years, and this power during off peak hours can be used to strip hydrogen out of water. ( There’s a market for the oxygen too. )
In industrial quantities, hydrogen can be shipped world wide using specialized tankers and then used locally to run electric generating plants on a regular basis or intermittently as needed, when the wind isn’t cooperating and at night.
So far as I can see, from having read this and other similar sites for years, hydrogen can be stored in salt caverns, old mines, and even in oil and gas wells, in which case it might actually help get more oil out of an old well. It can be put in storage at such locations via pipeline from the production site, and distributed as needed to sites where it will be used by pipeline. This will cost a hell of a lot, for sure, but energy efficiency doesn’t have much to do with it…… since the initial supply will be DIRT cheap……. almost free, actually.
And it will very likely cost less in a number of countries than it costs to maintain armed forces in large part due to energy security issues.
Plus of course there’s always a potential for a breakthrough technology that would enable us to store hydrogen in small tanks at moderate pressures in large enough amounts to run trucks and cars on it.
It’s also relevant that in my personal opinion, “we ain’t seen nuthin yit ” as some of my neighbors put it when something unexpected is about to happen, and we haven’t seen anything yet in terms of how cheap it’s going to be to manufacture almost anything in fully automated factories a decade or two down the road.
This includes solar panels and all the infrastructure associated with them as well, and it will also apply to wind turbines, but not so much. If we have the materials, we will be home free in terms of many goods.
Some people in some places have the potential to pull thru the bottleneck more or less whole……. given some luck.
Some truth’s about the hydrogen economy . Prof Ugo Bardi of the Seneca Cliff fame also gave it a thumbs down after working on it for years .
https://energyskeptic.com/2019/hydrogen/
Automated factories .?? Prepare for what is coming down the road . Learn some hand skills .This is the future .
https://www.youtube.com/watch?v=p1uYeLg1UUQ&ab_channel=PakistaniTrucks
Hole in Head
In my mind you’re one guy that’s figured it out.
No where, no way and at any time is the energy content in a kg of hydrogen greater than the process required to produce it. It’s only reasonable if you live your life in mortal fear of the carbon atom.
Yup. By definition this is a hard wired energy fact. It consistently amazes me how people can ignore such mathematical realities.
Rationalluddite , ” People desire to believe what they desire to be true ” . Greek Proverb . Many here are still in stage 3 of ” The five stages of grief ” which is bargaining . They have to go thru stage 4 which is depression and only when they come to stage 5 which is acceptance they will realize that peak oil is not a problem but a predicament , then they will stop with the blabber . Till then ???
The latest Monthly Oil Market Report is out. It shows OPEC crude up by 152,000 bp/d in April. But they were really up 91,000 bp/d from what was reported last month as March crude production was revised downward by 61,000 bp/d.
@HHH, what’s your opinion to the current fiscal situation?
Especially oil is holding the line at the moment, while stocks are down hard. With still lot’s of margin dept out there, some trigger actions because of margin calls are around the corner I think.
Oil is holding out – I thought it got washed down by the future market together with stock and bitcoin. Looks like without this slow motion stock crash it would have already tried a moonshot.
Improvement of oil production I personally don’t see for this year. This supply chain chaos because a chinese KP boss wants to extinguish corona by himself blocks all industry. In the company where I work (big machine builder) all year planning already is in the trash bin because nothing can be really planned anymore when parts don’t arrive in time – and are still not there a week later.
I think the top might have been made in bond yields. Need a little more confirmation to suit me but yields on 10 year have comeback down. Looks like the Yen might have made its turn with bond yields.
US, China, South Korea are all in slowing growth with inflation. So growth will continue to slow and bond yields will fall with stock. FED and other central banks will figure out too late that they are hiking rates into a slowdown.
Hmm.
Additional, Euro is still crashing against the $ but European stock markets are relative stable. The english national bank already communicated they want to produce a recession to stop inflation. So they know.
Parts of the inflation is state welfare programs for COVID, parts energies and war, part supply chain chaos and chip shortage.
There is no past event like this, so the old receips won’t work. Especially the central bank actions.
Euro isn’t near as sensitive to yields as is the Yen. And since the dollar index is more heavily weighted to the euro. Yen strengthening isn’t showing up as dollar weakness. Dollar was above 104 and climbing.
Strong dollar is a problem for everyone. It will weigh on US corporate profits soon enough.
Relatively stable? Europe is down 15 – 20% across the board. S&P is down 11%
Bubble mega-cap stocks and crypto are a problem. Crypto collapse is bigger than dot-com collapse already. Over a trillion dollars in “value” or market cap or whatever has been wiped off the earth. Will it destabilize and contagion spread? I’m not convinced it will, but it’s certainly not adding to any confidence about the “opinion of the current fiscal situation”.
It wasn’t wiped off the earth. People borrowed a bunch of dollars to bid up crypto. As that unwinds value is transferred back to the dollar.
Eventually same thing will happen in oil as it has before. People borrowed massive amounts of dollars to bid up oil. That will unwind at some point. And value will be transferred back into the dollar.
but IT’S value was destroyed. that’s all I meant. don’t be a dennis. we’ve already got two.
The Fed is tightening into a slowdown. That’s all you need to know Eulen. For European investors its just a question of how long the ECB will play along with this strategy. I don’t think they will for too long. Oil is interesting, and its still bullish, but you’d have to be quite the cowboy to be riding the last bull in a raging thunderstorm.
Recent piece on Guyana (published May 11, 2022)
https://oilprice.com/Energy/Crude-Oil/Guyana-Is-On-Track-To-Become-A-Leading-Global-Oil-Producer.html
Excerpt:
The deeply impoverished former British colony has been pumping over 130,000 barrels per day since the Liza Unity floating, production, storage, and offloading vessel (FPSO) came online in February 2022 as part of the Liza Phase 2 development. Exxon is developing the $9 billion Payara project in the Stabroek Block, which on commencing operations in 2024 will pump up to 220,000 barrels per day. The energy supermajor also recently committed to the $10 billion Yellowtail development, also in the offshore Stabroek Block, which will eventually produce 250,000 barrels daily after coming online in 2025. The projects being developed by the Exxon-led consortium in the Stabroek Block alone will catapult Guyana to become a leading top-20 oil-producing nation globally. Exxon estimates that it will be pumping 1.2 million barrels of crude oil daily from Stabroek by 2027, which based on 2021 oil production will see Guyana ranked 17th globally.
So based on this, about a 1100 kb/d increase in output over the next 6 years in Guyana.
Never a dull day 😂DRAGHI: DISCUSSED CREATING CARTEL OF OIL BUYERS WITH BIDEN . Anti OPEC . Oil cartel wars as if drug cartel wars were not enough .
Tidbit on flaring.
MEXICO’S OIL GETS EVEN DIRTIER AS FLARING CONTINUES TO SOAR
Globally, flaring volumes have risen and fallen with levels of oil production over the last few years. Progress in reducing flaring in countries like Nigeria, Kazakhstan and the US has been cancelled out by setbacks in Russia, Iran and Venezuela. If the world is to eliminate routine flaring by 2030, it needs to be reduced by 44% a year from 2022 onwards. Progress so far has been “woefully inadequate.”
https://www.climatechangenews.com/2022/05/09/mexicos-oil-gets-even-dirtier-as-flaring-continues-to-soar/
Doug , we will not stop until the planet becomes Easter Island .
HOLE IN HEAD
IGNORED
05/09/2022 at 1:31 pm
India invokes emergency law reopening 100+ coal mines as power demand hits record with fuel inventories plummeting .
Burn baby burn .
The Plus part of OPEC+ was down 1,300,000 barrels per day in April. But only 900,000 of that was Russia. Kazakhstan must have took one hell of a hit.
OPEC+ April crude oil output tumbles as sanctions hit Russian output: Platts survey
OPEC production up 70,000 b/d, but partners lose 1.13 mil b/d
Russian output down 900,000 b/d; Kazakhstan, Libya slump amid outages
Crude oil production by OPEC and its partners fell to a six-month low of 41.58 million b/d in April as Russian production took a battering from Western sanctions, the latest Platts survey by S&P Global Commodity Insights found.
OPEC’s 13 members raised output by 70,000 b/d to 28.80 million b/d, led by gains in Saudi Arabia and Iraq, but production by key ally Russia fell by 900,000 b/d, and Kazakhstan also registered significant losses.
This meant the glaring gap between OPEC+ production and quotas rose to a record-high 2.59 million b/d as 13 out of the 19 countries with quotas struggled to hit their output targets, the survey found.
The shortfall propelled the group’s quota compliance to 220.3% — illustrating how the sanctions on Russia, along with capacity constraints faced by several members, have eroded the alliance’s ability to balance the market even as it keeps raising its production targets every month.
Platts has OPEC crude only at 28.8 million bp/d in April. The OPEC MOMR has them at 28.65 million bp/d.
The May OPEC MOMR says Russian oil production will increase in 2022 over 2011. They have Russian oil production increasing by 80,000 barrels per day in 2022 over 2021. This is absolutely insane. What is going on here? Why is OPEC making such a very stupid prediction when an idiot would know better?
This prediction was made today, May 12, 2022, long after the Russian invasion and Russian oil production collapse.
Does anyone have any explanation? The below data is their prediction.
https://mishtalk.com/economics/house-speaker-pelosi-seeks-price-controls-and-a-ban-on-excessive-gasoline-prices
Pelosi wants to ban high gas prices
Summary from May IEA report.
World oil demand growth is forecast to slow to 1.9 mb/d in 2Q22 from 4.4 mb/d in 1Q22 and is now projected to ease to 490 kb/d on average in the second half of the year on a more tempered economic expansion and higher prices. As summer driving escalates and jet fuel continues to recover, world oil demand is set to rise by 3.6 mb/d from April to August. For 2022, demand is expected to increase by 1.8 mb/d on average to 99.4 mb/d.
Russia shut in nearly 1 mb/d in April, driving down world oil supply by 710 kb/d to 98.1 mb/d. Over time, steadily rising volumes from Middle East OPEC and the US along with a slowdown in demand growth is expected to fend off an acute supply deficit amid a worsening Russian supply disruption. Excluding Russia, output from the rest of the world is set to rise by 3.1 mb/d from May through December.
How do we get to 3.1 Mb/d. Five months of increases from OPEC Plus to September 2022 is 5 X 420 = 2.1 Mb/d. US production is growing @ 75 kb/d, according to the May STEO. That is good for another 0.6 Mb/d. Canada will add 0.3 Mb/d. Others will add in the remaining 0.1 Mb/d. No problem. It is in the bag,
Let’s watch over the next 6 months what reality has to say.
🤣🤣🤣🤣
Excluding Russia, output from the rest of the world is set to rise by 3.1 mb/d from May through December. How do we get to 3.1 Mb/d. Five months of increases from OPEC Plus to September 2022 is 5 X 420 = 2.1 Mb/d.
That has to be the joke of the year. They expect OPEC+ to increase by 420,000 bp/d. All increase in OPEC+ will have to come from OPEC’s big 5, Iran, Iraq, Kuwait, UAE, and Saudi. The rest of OPEC+ will decline for the rest of the year, not increase. Check the chart below.
But wait, they said excluding Russia. That chart is next.
Click on chart to enlarge.
Here OPEC+ Other 18 less Russia. It is even worse than the one including Russia. They will very likely continue to decline for the rest of the year putting a larger burden on the big 5 to increase production. At any rate OPEC+ will definitely not increase by 420,000 bp/d for the next 5 months. They have to be damn fools to believe that.
Click on the graph to enlarge.
Ovi,
One obvious reason the forecast could be wrong is OPEC+ is only likely to see 250 kb/d increases (at best) from May to Sept so that is only 1.25 Mb/d, perhaps the IEA thinks US output will grow at 100 kb/d per month which would be an increase of 0.8 Mb/d, not sure if the Canadian increase of 0.3 will occur (I have not seen the latest data from Canada), but that is only 2.35 Mb/d, there might also be some NGL growth in the US and perhaps a bit of growth in Latin America (Brazil and Guyana) and perhaps a bit in Eurasia (not including Russia).
The growth in World less Russia will be closer to 2 Mb/d than 3 Mb/d in my opinion. Though historically I tend to underestimate future output.
For the past 5 months (Jan 2022 to May 2022) oil output in the DPR regions has increased at an annual rate of 1450 kb/d according to the DPR estimate, the decrease in the Nov 2021 to Jan 2022 period may have been due to a $10/b drop in oil prices over the October 2021 to Dec 2021 period. In the chart below I move oil prices forward by one month, based on the hypothesis that the previous month’s oil prices affects the current month’s oil output (in fact the lag might be longer than one month). Based on this chart it looks like output can increase at $55/bo or higher, but perhaps increasing labor and material costs lately have raised the oil price where we see increased output to oil prices higher than $80/bo. In any case I thought the chart was interesting. The DPR output includes both tight oil and conventional output from the 7 tight oil and shale gas regions covered by the Drilling Productivity Report (DPR) published monthly by the EIA.
https://www.eia.gov/petroleum/drilling/
Dennis, we both know that the DPR predictions are horrible. They always miss their projected output for the last two months of production by a country mile. They predict the Bakken April production will be 1,169,000 bp/d. Do you think that is close to what the Bakken actually produced last month? I know you don’t. This begs the question. If you know they are so far off in the Bakken production then why did you still use those figures in your chart above?
But hey, the new DPR will be out Monday. I hope they include the North Dakota double blizzards data in April. But perhaps not.
Ron,
Yes they have trouble predicting the weather in advance. We will see what happens in the Permian, Eagle Ford, and Niobrara where most of the tight oil growth is occurring, I think if oil prices remain above $100/bo, we will see 1000 to 1200 kb/d annual rates of growth for overall US tight oil output over the next 12 months or so (May 2022 to April 2023).
I guess it’s very obvious now that the economy will tank. Making it once more obvious that no economy can sustain high energy prices. Given the tight supply I guess it will be interesting and telling how this will effect the price of oil.
Required , I have a bet with Mr Coyne $ 25 by 2025 . What will be the price tomorrow ? I don’t know . Yes , the sun will rise in the East and set in the West , that I can assure you .
The As We Exhaust Our Oil, It Will Get Cheaper But Less Affordable (which is an article I really hope everybody read here) argument is very convincing to me too. Will it be our future? As you say, it’s really impossible to know.
Required,
For the World real GDP per capita has been rising, doubtful this will change any time soon. The argument that income will decrease will need to be backed up by more than words.
https://data.worldbank.org/indicator/NY.GDP.PCAP.KD
Required also note that World real GDP per capita rose at an average annual rate of 1.83% from 1995 to 2019. So the idea that average income is falling is not quite correct, there is certainly a problem with income distribution, but faster growth rates in less developed nations helps to address international differences and better tax policy within nations can address widening income gaps in some developed nations (this is a big problem in the US).
Over the 1995-2019 period per capita income grew by 1.3%/year for high income nations and by 4.3% per year for low and middle income nations.
Required,
The World economy did fine from 2011 to 2014 with average Brent oil price at about $110/bo in 2021 US$. If oil price goes to $200/bo the economy is likely to falter. There is a lot going on besides simply high oil prices, including a pandemic, several wars and severe supply disruptions increasing prices due to lack of supply. One can claim that high oil prices are the root of all other problems, but it remains an unproven claim. Correlation proves very little.
Keep in mind that a slow economy will reduce demand for oil and oil prices will decrease. Note what happened to the price of oil in 2008/2009, they dropped from $134 in Jun 2008 to $40/b in April 2009, annual prices were $100/bo in 2008 and $63/b in 2009.
Thanks for your answer! I’m quite sure that you aware of Dr. Tim Morgans research he publishes at https://surplusenergyeconomics.wordpress.com. I would be very interested if you agree with his physical (instead of monetary) interpretation of our economy or not.
Required,
Not going to read an entire blog, but I tend to go with more mainstream economists. Pick a single post that lays out this person’s argument or summarize it. The idea that it’s all about energy, I would call an energy or possibly a fossil fuel theory of value. Any good whether it is labor, apples, or a barrel of oil can be claimed to be the source of all value, but this is true of the infinite number of goods that exist. Simple matrix algebra allows us to value all goods in terms of any other single good, the choice is arbitrary.
Then people start claiming that such and such is the master resource. Note that such and such could be labor, capital, a burger, or a barrel of oil.
Bottom line, there is no master resource.
Dennis
If your usable energy takes as much energy to produce as it yields, you’re never going to get ahead. Look around, we live in a world of embedded energy – buildings, airplanes, highways. They carry momentum, a promise of future energy to keep them vital. You’ve seen the charts of declining EROEI.
Without excess energy, there can not be growth. Without growth the world collapses. Sure, a few hundred tight oil wells in Texas might come out ahead on paper, but we’re talking about the globe. The US isn’t even 4% of the global population – do you ever ponder that?
When excess energy exists, one can make novel fuels that are energy negative, from surpluses elsewhere. Absent that, what keeps the airplanes in the sky? When there is no surplus energy, ‘goods’ will stop magically appearing at our doors and at our ports.
Add in the need to grow, grow all these alternatives, grow a billion electric cars from dirt, grow a billion solar panels and a hundred thousand windmills. Massive surplus energy is required, not to mention all the resources often discussed here. The energy cost is upfront, payback comes later. Folks are right to be skeptical that the massive amount of energy to pull this off exists to us.
Dennis , ” The World economy did fine from 2011 to 2014 with average Brent oil price at about $110/bo in 2021 US$. ” . No it did not . It took on $ 16 trillion of debt . If living on a credit card on a daily basis is fine with you , I am not going to argue . Don’t mistake debt for prosperity . I also read Tim Morgan’s blog regularly , suggest you acquaint yourself with his SEED calculations . Interesting concept .
Got2surf , absolutely valid points . Imbedded energy required for upkeep of the already existent infrastructure and then what net surplus energy LEFTOVER is what matters and has to be taken in account . No net energy surplus = no growth = collapse .
Dennis ” Bottom line, there is no master resource. ”
Disagree . Oil is the master resource .
“Civilization…dependent on fossil fuels used in production of [steel, concrete & plastics]. No artificial intelligence…, no apps, no claims of… “dematerialization” will change that.”
–Vaclav Smil
Got2Surf,
Yes surplus energy is needed, clearly we have it. Also note that one cannot claim on the one hand that finance does not matter (which I agree with up to a point) and then say the physical economy is ok because of debt. Debt is money owed to other people who have balancing assets, at the World level it is a wash unless we take on debt from beings from other star systems. During the 2011 to 2014 period World real GDP rose by about 3% per year, this has been the average World rate of growth for the 2000-2019 period.
Either the financial economy matters or it does not, one cannot have it both ways. The real economy was not affected by high oil prices for 2011 to 2014.
Note also there is a significant measurement problem for surplus energy. Another significant problem with many EROEI analyses is that they do not take account of waste heat. Most fossil fuel uses only create 35 to 40% useful work (exergy), but many EROEI calculations ignore this and utilize primary energy instead. Lets take oil used in and ICE, typically the exergy is one third of the primary energy, thus EROEI calculations that yield a 30, become a 10 and EROEI of 10 becomes 3.33. This would make the comparisons with EROEI for wind and solar more comparable with fossil fuel.
If you look at Japan. In dollar figures their exports/imports look great. But reality is they are paying a 3rd more for basically the same amount of stuff. Compared to 2019
GDP numbers are useless. They don’t tell you anything about the health of the economy.
GDP can’t tell you at what price of oil the economy will contract at.
I agree GDP is a terrible metric. Wealth inequality is off the charts regardless of GDP increasing. If this trend continues social unrest will follow.
Hole in head,
The quote says fossil fuel, but really the need is for energy and particularly exergy, every unit of energy from wind and solar is like 3 units of primary energy from fossil fuel that is used in power plants and engines because there is very little waste heat for wind and solar. Energy is important, so is air, water, and minerals, there is no master resource, there might be a small set of master resources which would include energy, but in time fossil fuel energy will be replaced, by wind, solar, nuclear, and hydro.
Iron Mike,
GDP is a terrible metric, can you suggest a better measure?
It is a little like democracy, the worst possible form of government, but better than any other conceived.
Also note the number used is real GDP which accounts for inflation, I agree distibution of income is unequal and a major problem that needs to be addressed, we can do it incrementally or wait for the revolution. The US took a huge step backward with Reagan tax cuts in the 1980s.
Dennis,
I honestly can’t think of a metric which gives reliable quantitative figures on how well a nation is doing (Maybe a populations tertiary education rate). I know you older generation contributers disagree but all these econometric variables are highly questionable as a dictator of policy.
The seeds of neoliberal ideology was sown with Thatcher and the current state of the world is its result. Wealth inequality being at the heart of this ideology.
Iron Mike,
I agree the GDP metric is not a good one, but I think it is better than tertiary education metrics (which I am not sure exists at the World level)? I guess I meant measures that we have access to.
If someone is going to argue that oil is not affordable and they use real GDP per capita as their measure of income, I will tend to use that data at the World level to refute their hypothesis.
One possibility is to use median rather than average income, but I don’t have World data over time for that metric. Lack of equity is a big problem and measuring “well being” is difficult see for example
https://www.weforum.org/agenda/2015/01/how-should-we-measure-wellbeing-2/
and
https://www.oecd.org/wise/measuring-well-being-and-progress.htm
Required,
Tim Morgan got his PhD from Emmanuel College at the University of Cambridge (UK) in History and Political Philosophy.
As far as I can tell he has no peer reviewed papers published (or they are not listed in Google Scholar).
Baker Hughes rig count for US Horizontal Oil Rigs
https://bakerhughesrigcount.gcs-web.com/na-rig-count
I use pivot table at link above and filter on drill for oil and trajectory horizontal to get this data.
The trend from Jan 2021 to May 13, 2022 is an average weekly increase of 3.78 rigs per week. If the trend continues the US horizontal oil rig count will reach the march 2020 level of 620 rigs by the end of 2022. With the current high oil price level we could see this increase accelerate (steeper positive slope).
The world economy has run on life support since 2008 because that’s when real oil peaked. Liquids volume increases count for little compared with reduction in quality. Diesel is the red flag.
Lightsout . Correct . I feel we must turn our attention more to refining than to production . An extra 1mbpd in production is no use if it cannot be refined . Refining imbalance is becoming a choke point .In addition more ideas on net surplus and imbedded energy as outlined by Got2surf would be a new direction and interesting .
Lightsout,
Can you define “real oil”?
The trend won’t continue. I met with the CEO of one of the largest oil field service company in the US and he told me Upstream CEOs are rethinking their capital allocation decisions and beginning to drop Rigs even in the Permian. All would be thrilled with flat to slightly lower production and the current product price will be used to pay down debt and pay out dividends. Finally the CEO’s are acting more rationally.
A “dirty little secret” he told me was that these Upstream CEO’s are very concerned with rapidly depleting drilling inventory and increased density well results. By the way, every well drilled in the US uses his equipment/service therefore he knows the various companies’ drilling budgets and drilling schedule. Everyone is complaining and the tremendous cost inflation up 30% year of year and the lack of equipment available. It’s a shit show.
Using DPR DUC data spreadsheet for the 5 oil focused DPR regions (Permian, Bakken, Eagle Ford, Niobrara, and Anadarko basins) we have the following for tight oil wells drilled from Jan 2021 to March 2022. The annual rate of increase in tight oil wells drilled was 295, and note that the annual rate of increase in horizontal oil rigs was 197, this implies about 1.5 horizontal tight oil wells are drilled for each horizontal oil rig operating over this period.
The completion rate for the 5 oil focused DPR basins from April 2021 to March 2022 increased at an average annual rate of 128.
If we take these previous 2 charts and the annual rates of increase of 295 for wells drilled and 128 for wells completed (in both cases these are tight oil wells in the 5 DPR basins) and we assume the past trends shown in the charts continue in the future, we can estimate the future DUC count for these 5 basins. That estimate is shown in the chart below with both historical and projected DUC counts. The completion rate for the 5 oil focused DPR basins in December 2023 for this scenario is 1006 per month with 1178 wells drilled by 831 horizontal oil rigs.
There is a new link for the North Dakota Directors Cut. The old link no longer works. Also, this is where you will have to get any North Dakota production data because that old link no longer works either. The new link:
https://mcusercontent.com/4753e4b0ea70df438a15ff868/files/b0ea59d8-29b9-cdae-1e9b-6d622eab14d9/05.13.22.Directors_Cut1.pdf
Director’s Cut
March 2022 Production
Oil Production
February 30,494,557 barrels = 1,089,091 barrels/day (final)
(New Mexico) 36,510,147 barrels = 1,303,934 barrels/day
March 34,720,679 barrels = 1,120,022 barrels/day (+2.8%)
1,078,022 barrels/day or 96% from Bakken and Three Forks
42,000 barrels/day or 4% from legacy pools
Click on graph below to enlarge
Ron
I got the directors cut here. It gives a quick summary and the option to read it.
https://www.dmr.nd.gov/dmr/oilgas/directorscut
Dear Dennis, as I mentioned in my previous comment I thought you where familiar with Tim Morgans arguments regarding his view of the economy as a energy system, not a financial one. Following is a link to an introduction of his views from last June.
Surplus Energy Economics
If have time I would be really interested in your thoughts about it. Thanks!
Required,
I do not buy the premise that energy is all that matters, important yes, but it does not need to be the starting point. The problem with net energy is that measurement is exceedingly difficult and the data is all over the place, different reserarchers argue for different boundries around the analysis. Also as I have often pointed out many of these analyses focus on a single type of fuel such as oil or coal, the analysis has to be done on a whole system basis for the entire World, or at minimum an entire nation (World is really the important analysis). This is an impossibly complex task which can only be done in theory, or at least that is the case to date.
A mainstream analysis is more useful in my view because there are thousands of researchers and universities, governments and international agencies gathering data and working on the problems.
Stepping out of the mainstream view cam be interesting, but it becomes mostly a theoretical exercise, much like Marxian political economics.
Both Marxian and SEED suffer from picking an arbitrary starting point for an “objective” theory of value, for one labor is the source of value and for the other it is energy, a capitalist could just as well choose capital as the source of all value, or we could use onions, the choice is entirely an arbitrary one. The claim carries equal weight in each case their is no logical basis for the choice.
See also the following paper
https://hal.archives-ouvertes.fr/hal-01182894/document
Dennis
You can cut through all that complexity, by using energy as the constant. Surely you see that if labor is your source of value, then a human with a barrel of oil can do a lot more work than a human without a barrel of oil. If you use onions for your source of value, then the man with a ton of fossil-fuel produced fertilizer will have bigger onions than the man who grows his onions without fossil fuel inputs. The man with diesel to run his pump will have more water than the man who pumps it by hand. This doesn’t seem hard to grok or far-fetched.
Boundaries don’t matter on a planet burning 100 million barrels of oil a day vs a planet running on solar panels and biomass. Surplus energy is what matters, what’s leftover after all the work to create the energy at hand. Relying solely on mainstream economists is bound to lead to such blind spots. I heard one say yesterday that the only reason we have high energy prices is because of lack of investment. To them money = energy.
Got2surf,
I am not arguing that energy is not useful, simply that it not the only thing that matters. For our farmer, many inputs matter, water, soil quality, fertilizer, seed quality, technology, along with energy.
You can claim that only energy matters, I would argue that is an gross oversimplificatin of the real world.
Let’s say you had a barrel of oil, but no surfboard and none could be found, you only have the barrel of oil, or better yet, any form of energy, but no materials, you could body surf I guess, but I am thinking you do this on a surfboard. Of course you also need an ocean with clean water and good surf conditions and hopefully a home near the beach.
I do not think there is a valid objective value theory, any good could be used to determine the value of every other good in an input output matrix. The choice is entirely arbitrary.
Physical investment does matter, even if we think money isn’t important. I think of money as simply a means of exchange. I don’t know much about oil production, but without oil producers and the work they do, we would not have much oil to use, investment in oil production is part of this process. Oil prices are high due to a lack of oil supply relative to oil demand and lower levels of physical investment in the oil industry may be a good explanation for the low level of the supply of oil.
Dennis , no desire to argue . I will sign off with this . Goednacht .
Mr. Titelman agrees that this saying has its roots in the Bible, specifically Jer. 5:21 (King James version): “Hear now this, O foolish people, and without understanding; which have eyes, and see not; which have ears, and hear not.”
: : “There are none so blind as those who will not see. The most deluded people are those who choose to ignore what they already know. The proverb has been traced back in English to 1546 (John Heywood), and resembles the Biblical verse quoted (above). In 1738, it was used by Jonathan Swift in his ‘Polite Conversation,’ and is first attested in the United States in the 1713 ‘Works of Thomas Chalkley’…”
Here is a quote from Acemoglu’s “Introduction to Modern Economic Growth”, I believe the book for the standard beginning graduate course on this topic.
“The aggregate production function for the unique final good is written as
Y(t)=F(K(t),L(t),A(t))
where Y(t) is the total amount of production of the final good at time t, K(t) is the capital stock, L(t) is the total employment, and A(t) is the technology at time t. ….. The capital stock K(t) corresponds to the quantity of ‘machines’ (or more specifically, equipment, and structures) used in production. …. There are multiple ways of thinking of capital … Since the objective here is to start with a simple workable model, I make the rather sharp simplifying assumption that capital is the same as the final good of the economy, However, instead of being consumed, capital is used in the production process of more goods. To take a concrete example, think of the final good as ‘corn’. Corn can be used both for consumption and as input, as seed, for the production of more corn tomorrow. Capital then corresponds to the amount of corn used as seed for further production.”
So how does the situation change if instead of corn one uses a nonrenewable resource; most particularly fossil fuel. No “seed corn” left. I wonder how he would answer the question from a pondering student, that this kind of logic does not hold in most cases. My guess is that he would answer that this rests on the highly simplifying assumptions and that he will cover a more realistic situation later, but never does it in his book as neither energy, nor fuel, nor fossil fuels appear in the index.
Thanks Seppo
Seppo,
This would often be covered by technological changes and substitution of one type of energy for another. The models covered in introductory texts are often not realistic. I imagine this may also be true in introductory engineering courses (or that was the case at the undergraduate level in 1978 to 1982 when I was a student).
Yes, I know about this way of accounting for the Solow residual, but my point was the choices he made in the text.
Seppo,
Just pointing out what you are already well aware of which is that introductory texts often cover just the basics. The better models tend to be more complex and are covered in other texts. Economic models are also not very good/realistic. The mainstream Walrasian microeconomic model introduced in introductory graduate level economics is elegant mathematically, but requires a number of assumptions that are quite unrealistic.
For example it shows that there exists a general equilibrium set of prices and quantites for a given set of preferences and production functions, but has no realistic mechanism for adjustment from one equilibrium state to another if there is a change in preferences or technology. It proposes a non-existent auctioneer to arrive at an appropriate set of prices which is absurd.
Macroeconomics has its own set of problems. There are a number of resource economic models that explicitly consider energy, but these are not mainstream models in the world of economics.
For those who live in fear of the carbon atom:
https://time.com/6175734/reliance-on-fossil-fuels/?fbclid=IwAR1VCD8TQ7dSEAOpfj7XIo0NKHIifPrW7Wm8Ug38Ltb70nzCeNxgDcDY-mQ
Follow up: https://surplusenergyeconomics.wordpress.com/
The plus part of OPEC+ fell by 1,130,000 barrels per day in April. Russian production fell by 900,000 bp/d while Kazakhstan fell by 220,000 barrels per day. That is a huge hit for Kazakhstan. Something drastic must have happened. Haven’t seen anything in the news about it though.
OPEC+ April crude oil output tumbles as sanctions hit Russian output: Platts survey
Crude oil production by OPEC and its partners fell to a six-month low of 41.58 million b/d in April as Russian production took a battering from Western sanctions, the latest Platts survey by S&P Global Commodity Insights found.
OPEC’s 13 members raised output by 70,000 b/d to 28.80 million b/d, led by gains in Saudi Arabia and Iraq, but production by key ally Russia fell by 900,000 b/d, and Kazakhstan also registered significant losses.
This meant the glaring gap between OPEC+ production and quotas rose to a record-high 2.59 million b/d as 13 out of the 19 countries with quotas struggled to hit their output targets, the survey found.
The shortfall propelled the group’s quota compliance to 220.3% — illustrating how the sanctions on Russia, along with capacity constraints faced by several members, have eroded the alliance’s ability to balance the market even as it keeps raising its production targets every month.
The latest OPEC+ meeting on May 5 resulted in another 432,000 b/d collective quota increase for June.
Yeah, a 432.000 increase in June. Fat chance!
Correction, Correction, Correction
Concerning the numbers given in this link, which was the basis of my post and and graph above chart below: OPEC+ April crude oil output tumbles as sanctions hit Russian output: Platts survey These numbers are crude only and that is why they are so different from the EIA numbers. So Kazakhstan has not really declined in February and March as my chart above indicates. Please just ignore that chart. Kazakhstan did decline in April however, just as the chart indicates. But the numbers there are crude only. The EIA will have different C+C numbers later.
Yes, something is definitely happening in Kazakstan. For the chart below I used EIA data through January 2022 and data from the link I posted above for March and April. I just filled February in as half way between January and March.
Click on graph belwo to enlarge.
Kazakhstan oil output down in March, Chevron leads the fall
April 4 (Reuters) – Kazakh oil production excluding condensate fell to 1.55 million barrels per day (bpd) in March, down 3% from February, amid export problems from the Black Sea Caspian Pipeline Consortium (CPC) terminal, Reuters calculations based on output data from two industry sources showed.
The fall in Kazakh oil output was because of lower intake in the Caspian Pipeline Consortium (CPC) system in the second half of March owing to storm damage to loading facilities at its Black Sea terminal situated in the south of Russia.
More than 80% of Kazakhstan’s crude is exported via the CPC pipeline to the port of Yuzhnaya Ozereyevka, close to Novorossiisk, supplying around 1.2% of global oil demand.
CPC terminal damage affected operations of Kazakhstan’s giant Tengiz and Kashagan oilfields led by Western oil majors including Chevron, Exxon Mobil, Total, Eni and Shell.
https://www.reuters.com/business/energy/kazakhstan-oil-output-down-march-chevron-leads-fall-sources-2022-04-04/
Thanks Ovi, that explains a lot.
Regarding GDP discussion above, someone bright would get applause for coming up with a ‘reality GDP’.
It would exclude sectors like financial/digital/real estate transactions, sports/entertainment/fashion, service sector, for example.
This kind of metric would be very useful to track trends of critical sectors.
Go for it…please.
Hickory,
The choices would be arbitrary, so it would not be very useful in my opinion.
Good article explaining what gets counted in GDP
https://www.thebalance.com/components-of-gdp-explanation-formula-and-chart-3306015
Services (mostly healthcare and banking, but also hospitality industry, restaurants, etc) account for 45% of US real GDP in 2021.
“The choices would be arbitrary, so it would not be very useful”
I bet someone bright like you could make choices that would be a lot more useful than what we have today, particularly when we are talking about relevance to energy issues.
Hickory,
Any choices made would be highly subjective, who is to decide what is important and what is not, I like the idea of freedom of choice, seems a worth while feature of many OECD societies.
Dennis,
What is the freedom of choice you speak of ? The fact that you can choose between 100s of different cereals at the supermarket? You think that brings happiness ? Or does it lead to more confusion, neurotic behaviour not to mention anxiety and depression, living a pointless existence being a slave to money?
Too much choice or too little choice seem to lead to the same road of a miserable existence it seems.
Iron Mike,
So who decides what is sold in a store?
Do you have an elegant solution for this? Mr Smith got a lot right in 1776 in Wealth of Nations.
There has been further progress with the work of Ricardo, Marshall, Keynes, Samuelson and others. More work to be done.
Well, is it User Value or Exchange value?
If it is Exchange Value, someone who did none of the work just got a profit–
and that is capitalism.
(Marx acknowledges that commodities being traded also have a general utility, implied by the fact that people want them, but he argues that this by itself says nothing about the specific character of the economy in which they are produced and sold.)
I don’t think it would very hard to decide on what metrics would useful vs irrelevant for fabricating a GDP of energy related economic indicators/sectors.
GDPe
It would be useful, especially if it was based on data that had some history to it.
How long is it before the US bans exports of diesel? 6-12 months is my guess. And food exports won’t lag far behind.
There was a unstable guy posting about API gravities here before, claiming that within 6 months we would see exactly diesel shortages etc… can any of you in the know, reflect on this API business?
https://en.wikipedia.org/wiki/API_gravity
HHH,
US net exports of diesel are not very large, in 2021 the average was 834 kb/d, mostly to Latin America (Mexico, Brazil, and Argentina were the top 3 accounting for 64% of the total). US produced an average of 3943 kb/d of distillate fuel in 2021 and exported 834 kb/d of this product, so US average US consumption of ditillate fuel in 2021 was only 3209 kb/d. In Feb 2022 only 637 kb/d of distillate fuel was exported (this is net exports) and consumption was 3540 kb/d. Current stocks of distillate fuel are about 121 million barrels (Feb 2022), about 34 days at the February rate of consumption recently this has dropped to 104 million barrels, net exports information on distillate fuel is not available in the weekly data only total product exports.
Perhaps we will ban diesel fuel exports, refiners will not be happy, they might be wise to self limit their exports to build diesel stocks in the US.
And if your Latin American and you fail to import the needed diesel. If your Brazil do you produce enough soybeans to be able to export to China?
Diesel shortage in one place can mean less soybeans in another place which can mean less feed for pigs in China. Which means people in China go hungry.
Might not seem like a big deal but it is.
HHH , yes it is . Few understand the laws of ” unintended consequences ” . A small leak can sink a big ship” . Did you notice the experts who advised the governments worldwide on lockdowns now saying they had no inkling about what will be economic effect .? Now the head of IMF comes out and says that the CB’s printed too much during the Covid crisis without realizing that this monetary policy would be inflationary . As a follower of the Austrian school my question is , what were you thinking ? An example of stupidity at the highest level . 13 th April PM Modi says India can feed the world if WTO rules on food exports are relaxed . 14th May the govt of India bans the export of wheat by private parties citing domestic food security . Only govt to govt . We are being led by the blind .
Global spending on the energy sector will increase from roughly 4% of GDP toward 10% over this decade.
Which has various implications, including relatively less spending on other sectors.
Which sectors?
Hickory,
By energy sector do you mean for fossil fuels? I assume this means consumer spending as is 29.2 billion barrels of crude for say $100/b would be 2.92 trillion dollars of 96 trillion in 2021, that is about 3%, note that for oil exporters this increase in oil price means an increase in income.
Dennis- I am thinking about all energy spending/investment.
The current scenario will spur escalation of investment in more oil/gas E and P, as well as on nuclear, wind, solar, etc, along with increased end user expenditures for consumption.
I am not able to nail down the numbers more accurately, but do think that the gist of the argument is solid.
An excellent question.
Hicks , which sectors ? All . Total collapse of BAU .
Hair on Fire…
Similar to other comments. Not funny or insightful.
I gave up waiting a long time ago.
HIH,
Do you have any investments yourself? Stocks in specific sectors? Or in your opinion is it gold/silver & lead? Enjoy life now b4 we all die?
The estimate that energy sector % of global GDP is roughly 4% is probably a big underestimation if you include all forms of energy spending, and include end consumption and upstream investments.
Whatever it actually is, the point remains that energy sector spending will be greatly increased going forward as we simultaneously
1-go after higher priced fossil fuels and
2- begin to get serious about going after alternative energy systems- including production/transport/storage/etc
Hickory,
Wind and solar are far cheaper than coal and natural gas especially at current price levels, widely distibuted highly interconnected wind and solar requires far less storage than many understand.
The higher that fossil fuel prices go, the less competitive they become in the marketplace and the faster they are replaced with other types of energy.
This is counterintuitive, but it is the way things progess. Cars replaced horses because they were cheaper. Wind, solar, and EVs will replace oil, coal and natural gas for the same reason.
Understood, but for the next 20-30 years we are in the position of funding the fossil fuel system at full effort,
while simultaneously needing to fund the build-out of a whole new energy system,
from nucs to heat pumps etc.
Its going to require much more money than in prior decades.
Beyond that timeframe, I do not look.
Hickory,
I would guess the fossil fuel effort will wind downaround 2028 to 2030 as demand wanes as fossil fuel is replaced. Demand for wind, solar and EVs will increase (as they will be relatively cheaper) while demand for fossil fuel will decrease because they will be relatively expensive. The money that would have been used for fossil fuel heating systems and airconditioners will now be used for heat pumps, capital used in the past for oil, natural, gas, and coal, will be used for wind, solar, batteries, and perhaps nuclear power.
But right now, and in the next years
the world will have to spend lots and lots and lots of money on all energy related industries to have any chance of making a smooth adjustment to peak fossil fuels.
Its not as if we can spend heavily on fossil fuel until one month where we just switch all the funds and effort to other mechanisms.
We are in a situation where we require a full court press (spending and effort)
on many paths simultaneously.
And on greater scale than we have to this point.
The sooner this is acknowledged at all levels of society, the more likely there will be an at least partially successful response.
Hickory,
I agree it is a big job, the free market does a pretty good job of allocating scarce resources (at least according to theory if markets are competitive, sometimes government antitrust regulation is needed to ensure competition.) If energy prices are high this will lead to higher profits for both fossil fuels and substitutes for fossil fuels, if renewables and EVs are more profitable than fossil fuels and ICEVs or more competitive due to lower cost then more resources will be allocated to those industries rather than fossil fuel. Some good government policy ( a carbon tax for example ) would help this process, unfortunately this is not likely in the US as our government is designed to not do much at all. Europe will do better as they have more representative democratic government.
One thing to calculate:
Wind and solar have to be backupped by 100% – either by fossil, big storages, ultra long transmission of other renewables or all together a bit.
That’s coming on top of the costs.
For example: When in Texas now in the heat wave the air con is rumbling full speed into a hot evening. Solar will fade out, wind calm down and energy usage is still record high.
Wind & solar output here in Germany is between 60 GW and 600 MW. So backup comes additional to the cost. At the moment backup is done by the old power plants – but they plan to wind down the coal without really plans for the replacement.
PS: For the enviroment it would be no problem if old fossil power plants stay to be fired only a week in a year as a last backup after storage and transmission.
Eulenspiegel.
The backup already exists in the existing energy sources. The natural gas power plants can ramp up as the sun sets or as the wind blows less strongly. It is pretty much known when the sun rises and sets each day, weather forecasts give an idea of future cloud cover and wind speeds, this is not really beyond capability.
For Texas it is a bit more difficult because their connections to other US grid systems is limited, Texans will pay higher electricity costs in the future unless this changes, but that is their choice. For the rest of the US, most of the grid is highly interconnected and power can be moved from one region to another reducing fossil fuel backup needs, as more of the system moves to wind in solar their will be periods of excess output where the excess power could be utilized to produce synfuel which could by used in place of fossil fuel based natural gas for backup power. Also batteries, pumped hydro, and EV to grid backup power could be utilized as the battery powered vehicle fleet increases.
All of this happens over the next 30 to 40 years, it is a complex engineering problem which may be optimized over time. Time to get to work.
Capital will be a scarce commodity over this next decade. The wealthiest generation ever is in mass retirement and will be drawing down capital.
10% of GDP on energy not going to happen.
It might need to happen. It’s just not going to.
Doesn’t have anything to do with retirements.
The higher pricing of diesel, of fertilizer, of food,
the mandates for CO2 emission abatement,
the cost of electricity, of lithium, of jet fuel, etc
will provide the incentive to increase the global investment in energy,
[and all of the energy related industrial activity]
in addition to the money spent on actual energy consumption.
People/companies/governments will prioritize energy sector spending.
10% is a conservative guess
HHH,
Retired people will probably spend less on energy so demand will be reduced. EVs replacing ICEVs also reduces energy demand, as does wind and solar replacing coal and natural gas for electric power. Likely there will be no need for energy spending to rise to 10% of GDP.
Retired people will probably spend less on energy so demand will be reduced.
Many of the retired people I know are bound and determined to travel come hell or high water, particularly to warm places in the winter. (This includes people in a climate action committee my wife belongs to, which I find darkly amusing.)
Also, they may be over-housed: a house suitable for 6 people holding one or two after the children move out increases the per-capita cost for heat and air conditioning.
Curious and genuine question, how many are fully financed and how many count on SS and medi-x for expenses?
Edit to clarify, unfunded/limitedly funded liabilities in the US, and elsewhere, where I live, is a big part of BAU, and hence responsible for quite some oil consumption (air travel, cruises etc)
So without it, what would happen?
Hi Laplander.
I live in Toronto, Canada, so health care is single payer. Also, my sample may be tilted towards the affluent and the prudent- teachers, university professors, cops, nurses, tech workers, etc.: all (except tech) professions with robust pensions here.
There was an article in the paper in April questioning the soundness of the Canada Pension Plan (a Government organization that takes payroll contributions, invests them, and distributes the income after you retire) as well as 7 large private pension funds, that the article deemed to be making riskier bets than they had in the past. The CPP answered with a letter saying, essentially, “Don’t worry, we’ve got this.”
I don’t have the skills to tell if they’ve got it or not (one of which would be clairvoyance). : ) The CPP is usually only part of one’s retirement strategy; if it’s all you’ve got (max CD$12,000 a year) any traveling you do is probably on foot.
Interesting info, since I´m in the northern part of Sweden, we, like the rest of whats left of it also have socialized healthcare (the horror, according to many US citizens), one big issue when you´re getting older is therefore less of an issue here also.
I´m fairly well payed, with 401k equivalents (ITP2) etc., but my main plan is to reduce debt as much as possible, and grow potatoes just in case. Not that easy at 66N, but doable.
Got some more solar panels for summer use also, to keep a small compressor fridge going, just in case.
However, burned quite a bit of gas to get some beer earlier today, so might need to grow hops as well…
Edit, but my point is, as you´ve also implied, some can pay twice or triple for gas, and travel the globe but not that many are in our shoes, that might be a factor to consider. As Dennis noted below, interesting.
Laplander, how about just a root cellar for potatoes. I have an insulated closet in my garage because the water table is too high here. I only need this during the hot summer days. At night I just open the door and close in the morning. The night here are nice and cool. Also, how many kg of potatoes can you grow during the summer?
Seppo, a root cellar is in the works, have an old food cellar (matkällare) in the house but a bit too warm, adjacent to the ground source heatpump. The fridge would be for butter, beer etc. during summer, possibly luxury items in the future… The yield of potates is low (limited use of fertilizer) but somewhere in the range of 3-4 buckets from ~60 m2, but in the 50s and 60s, the “potato-land” was several hundred m2s, for staple food for 10-12 people.
Lloyd,
Often retired people move to a smaller home once kids are gone unless they are very affluent.
The big house without kids usually occurs before retirement occurs. In the early years of retirement there is some travel, again for the affluent, but eventually retired people find travel too difficult and stay in place. Taken as an entire group, it is likely retired people have lower energy needs. In addition they generally have all the stuff they need (furniture, clothes, appliances, cars, tools, etc.) and are accumulating less stuff than younger people so total embedded energy that retired people consume as a group may be less. The one exception is healthcare where much of the resource is spend on the older population, once that is accounted for retired people might consume quite a bit of energy.
Would be an interesting study.
Great comments Lloyd and Laplander,
Note that when I talk about energy use of healthcare I mean from a total society point of view and whether the energy is available to meet everyone’s needs regardless if the government or an individual is paying for it.
Also note that for US citizens over 65, basically there is socialized medicine in the US, the affluent can pay extra for a bit better coverage, but basic healthcare needs are mostly met, prescription drugs is one area where the US does poorly, supplemental insurance must be purchased privately to cover some prescription medicines even for those on medicare.
I agree socialized medicine is the way to go for everyone in advanced economies, but this is another area where the US remains in the 18th century, maybe by 2300 we might reach the enlightened level of our neighbors to the North and our friends in Europe, one can hope.
Example- “Cumulative spending to build and install the massive fleet will hit $1 trillion in 2031.”
“Twenty-four countries will have turbines at sea by 2030, accounting for 330 gigawatts of generating capacity, analysts including Soren Lassen said in a report Wednesday. That compares to 34 gigawatts in nine countries at the end of 2020. Cumulative spending to build and install the massive fleet will hit $1 trillion in 2031.”
OPEC is ignoring its mission statement — has it lost its way?
Most concerning is the market for oil. Spiking prices have pushed U.S. gasoline over $4, a third higher than a year ago, and diesel has risen even more sharply, to above $5. Oil inventories in the industrialized world have fallen for 14 months straight. And countries from Japan to the United States are tapping emergency stocks.
Amid this cyclone of commodity turmoil, there is one oasis of calm: The gilded parlors of OPEC.
Somehow, the cartel’s movers and shakers — Saudi Arabia and the United Arab Emirates — have decided that the best response to global commodity panic is no response at all.
None of that explains why OPEC is sitting on spare capacity that would reduce oil prices. Three factors suggest a potential rationale.
First is the Russia effect.
Russia is now a member of the broad OPEC+ cartel, and a declared alliance partner of Saudi Arabia for “decades and generations.” Russia is in no mood to bring down costs for voters in unfriendly countries that have been sanctioning it and sending weapons to Ukraine.
https://thehill.com/opinion/energy-environment/3487581-opec-is-ignoring-its-mission-statement-has-it-lost-its-way/
It seems rational to take a go slow approach on production.
Unless they think that this price level will lead to permanent demand destruction.
I don’t…with one caveat-
If I was a producer and feared that EV would lead to rapid demand destruction within a decade,
then I would ramp up production in the short term.
They don’t seem too worried about that.
Or, they don’t have spare capacity.
And the Saudis hate Biden. MBS won’t even return his call.
Dennis
Is there a place where one can get energy as a percentage of GDP vs time. interesting to see where it was in 2008 when the GFC hit. Also fossil fuels as a percentage of GDP. Food would also be of interest since FFs are a big component of producing and transporting food.
You have some of this data on Jancovici site, for instance :
https://jancovici.com/wp-content/uploads/2016/04/energie_graph9.jpg
in : https://jancovici.com/transition-energetique/l-energie-et-nous/lenergie-de-quoi-sagit-il-exactement/#:~:text=Le%20terme%20%C2%AB%20PIB%20produit%20par,une%20m%C3%AAme%20quantit%C3%A9%20d'%C3%A9nergie.
You can also check :
https://www.parisschoolofeconomics.eu/IMG/pdf/article-pse-medde-juin2014-giraud-kahraman.pdf
Yves
Thanks
Below is the cost share of oil in the U.S. from 1970 to 2008. The graph was
produced by James Hamilton who was one of the few economists to relate the 2008
financial crisis to the rise in oil prices via the concurrent rise in the cost share of
oil (note that the scale changes from years to months from 2008). His article can be found at https://www.nber.org/papers/w15002.
You have the cost share of energy in the UK from 1300 to 2008 on page 20 of
this talk:
https://www.math.univ-toulouse.fr/~schindle/talks/cours_2021-4.pdf
Note that Equation (7) on page 19 calls into question the so called Cost
Share Theorem from neoclassic economic theory which essentially says that
the importance of a sector in economic production is an increasing function
of its cost share. Equation (7) suggests that the importance of a sector be
judged by the dynamics of the cost share, in particular the cost share of an
important sector should decline in periods of economic growth and rise in
periods of economic contraction.
Schinzy
Thanks
Ovi,
Using BP data for energy consumption and prices fro fossil fuel up to 2020 and World bank REal GDP data, I get the following, note that in theory the prices paid for the fuel should cober the past money invested for producing the good. I do not include refining, and distribution of these fuels as well as cost for the electric grid and its maintenance as this is more complicated to estimate (there is not a world price for gasoline, diesel, jet fuel, etc, or electricity so trying to do the full cost for the World in detail would be a big project) I have simply taken barrels of oil equivalent and multiplied by an estimated World price for oil (Brent) and done something similar for natural gas and coal to get total spending on fossil fuel (in 2015$) then divided by World GDP in 2015$.
I also made a projection for 2021 and 2022, though we dont have coal and natural gas output data for 2021 yet and obviously we don’t have 2022 data yet, for 2022 I assumed output was at the 2019 level for all 3 fuels and the following prices in 2022 in 2015$:
Coal $147.5/tonne, natural gas $12.39/ million BTU, oil $110/bo
I expect actual output in 2022 will be lower than this estimate so actual spending would be lower if prices are at the level assumed or lower.
Found some data from the World bank for prices in 2021 and a forecast for prices in 2022 to 2024, I have guessed on prices from 2025 to 2027 (coal prices decrease, oil prices increase and natural gas prices remain at 2024 level. I have also assumed coal output decreases after 2022 by 0.5% per year and oil output follows my shock model and natural gas output rises by 2.9% per year (2009-2019 trend). I use the IMF estimate for real World GDP from 2021 to 2027. I get the chart below as a result.
Dennis
Thanks. Great work.
I heard an economist/oil specialist a while back say that when oil accounts for 5% of GDP, the economy begins to suffer. According to him, the 5% mark is reached when WTI gets to $125/b. At $185/b, the economy is into a full recession. What made his comments believable/credible was the transition from a small hit to the economy to a full blown recession as the price of oil rose to $185/b.
Something has been happening in the oil market over the last week. Since last Tuesday when WTI was $99.76 to today at 113.89, +$3.40, ( Close to settled) it has been up every day, up by $14.13 in 4 days. Maybe Shanghai may be over its covid lockdown. Note the higher lows.
Settled was $114.20
Thanks Ovi.
Chart below uses different oil price projection where oil price increases to $203/b in 2027, it is also assumed that oil output plateaus at the 2019 level of 32418 Mboe (includes all liquids in barrels of oil equivalent) from 2023 to 2027. This is different from the assumptions of the fossil fuel scenario from earlier. Note that the share of World Real GDP spent on oil from 1979 to 1981 was significantly higher than is reached in this scenario. It is not clear that oil prices will rise to this level($203/bo in 2015$) for an annual average.
Not sure I agree with the 5% claim given 2011.
Dennis
The 5% quote was based on today’s oil prices. Looking at your charts around 2008, they are all around 4 to 6% back then before the GFC.
Ovi,
In peak oil circles it is claimed that high oil prices were the root cause of the GFC, 2011 and 2012 had similar % level of World Real GDP spending. Growth in real GDP was 2.8%. Similar to the average growth rate from 2016 to 2019 when spending on oil was lower. If it goes up to 8% as in 1979 to 1981, then there is likely to be a recession. I doubt we get to $185 per barrel for average annual oil prices before 2027 and I doubt the 5% level is significant.
Dennis
I am in the camp that says that Oil was the trigger that set off the GFC. The house of cards had been set up and it was just waiting for something to start the collapse. High gasoline prices in the US triggered an increase in mortgage defaults which adversly affected other leveraged financial instruments that were out there. Some may say it was a perfect storm setup.
As for what the critical oil percentage is that begins to harm to economy. I think that 4% to 5% is in the ball park.
Ovi,
The financial situation was pretty bad due to lack of banking regulation, that was the critical factor, anything could have set of the GFC, at that point, Note that in 1979-1982, there was a recession, but no finacial crisis and % spending of World real GDP was far higher, in addition the % spending on oil in 2010 and 2011 was similar to 2008 with no problem. The high oil prices may have been a factor in 2008, but a minor one at most unless one thinks oil is the “master resource”, I don’t so opinions differ. Most economists focus on the financial sector and poor lending practices and the widespread use of CDOs as being the root cause of the GFC, in my opinion those analyses are sound.
The 5% level is sometimes a problem, it was in 1973-4, but not in 1975-1978, or in 1983, it was in 2008, but not in 2011-2012, as far as 4-5% there is also 1984-1985 when oil spending was between 4 and 5 % when real GDP grew at 3.8%, and also 2013-2014 (2.7% annual growth in real GDP). From 1975-1978 World real GDP grew at an average annual rate of 4.4% and the average share of World GDP spent on oil was 4.75%. I think based on the data, perhaps 6% of World real GDP spending on oil or higher and over 10% of World real GDP spending on fossil fuel may be critical levels that affect the World economy negatively.
Fossil fuel spending from 1970 to 2027 (projections after 2020) using price data I found at World Bank for 1970 to 1986. I also use World bank price projections for natural gas and coal for 2021 to 2024 and my own oil price scenario and my guesses for coal, natural gas and oil output. The spending spikes in 2022 due to high projected prices for all 3 fossil fuels in 2022.
Ovi, I previously held the same view on oil price rise being the cause of the GFC, but after reading much more about it over the years I agree with the gist of what Dennis says.
Severe mismanagement of financial rules/regulation was the root cause and crises setup.
Sure high oil prices may have been enough to put many households over the edge, but the oil price situation alone would not have been enough to do systemic damage if the financial system had been properly regulated and moderated
Such as –
https://www.usnews.com/opinion/blogs/economic-intelligence/2012/08/27/repeal-of-glass-steagall-caused-the-financial-crisis
Currently- I do think that high energy prices may play a very big role in coming recession. Look at food pricing around the world over the next 6 months. Prices up around $175/barrel may be a lot closer to depression.
Dennis
1979 to 1981was the Iran crisis and oil spiked and caused a recession. I guess that is what I am trying to get at in this discussion. At what point does the price of oil begin to impact consumer spending and slow the economy in today’s economy. Throw in the Fed raising rates and you can see the headwinds that the US and possibly the world economy is going to face.
Hickory
I did not say it was the cause. I said it was the trigger. The financial rules let the house of cards build. Increasing mortgage defaults got the ball rolling. Check reference below.
“Second, there is an interaction effect between the oil shock and the problems in housing. Joe Cortright (2008) notes that in the Chicago, Los Angeles, Pittsburgh, Portland (Oregon), and Tampa metropolitan statisti- cal areas, home prices in 2007 were likely to rise slightly in the zip codes closest to the central urban areas but to fall significantly in zip codes with longer average commuting distances. Foreclosure rates also rose with dis- tance from the center. And certainly to the extent that the oil shock made a direct contribution to lower income and higher unemployment, that would also depress housing demand. For example, the estimates in Hamilton (2008) imply that a 1-percentage-point reduction in real GDP growth translates into a 2.6 percent reduction in the demand for new homes.
EVENTUALLY, THE DECLINES IN INCOME AND HOME PRICES RAISED MORTGAGE DELINQUENCY RATES BEYOND A THRESHOLD AT WHICH THE OVERALL SOLVENCY OF THE FINANCIAL SYSTEM ITSELF CAME INTO QUESTION, And the modest recession of 2007Q4–2008Q3 turned into a ferocious downturn in 2008Q4. Whether those events would have been avoided had the economy not gone into recession, or instead merely postponed, is a matter of conjecture. Regard- less of how one answers that question, the evidence to me is persuasive that had there been no oil shock, economists today would be describing the economy in 2007Q4–2008Q3 as growing slowly but not in a recession.
I made the upper case to show the critical point.
https://www.brookings.edu/wp-content/uploads/2016/07/2009a_bpea_hamilton-1.pdf
Ovi,
I agree at some point a high percentage of spending on oil will lead to a recession, I only disagree that the level is 5%, In 1979-1981 the average % of World real GDP spent on oil was roughly 8% so I think maybe 7.5% or higher is needed (if we have a properly regulated banking system, which was not the case in 2008). In 2022, if output of oil was at the 2019 level (highest point for all liquids) an oil price in 2015$ of $208/bo ($254/bo nominal price) gets us to 7.5% of World real GDP spent on oil, $140/bo (2015$) would be a 5% spending level, this would be $171/b for the nominal oil price.
To me these prices do not seem realistic, but a year ago I thought oil prices wouldn’t rise to more than $90/bo and I thought $75/bo was more reasonable. In short, I rarely get future oil prices right, I think $150/bo nominal Brent price is the highest I would guess for a 2022 average oil price and $120/bo seems much more likely than 150.
Agree Ovi. Pardon the misinterpretation.
https://www.dailymail.co.uk/money/markets/article-10818679/Saudi-Aramcos-profits-surge-82-three-months-year.html
SA’s profits up!!!!
“Germany Girds for Day of Reckoning in Gas Showdown With Russia.
“Europe’s largest economy is bracing for the prospect that Russian natural gas gets cut off suddenly, a shock that would trigger a form of martial law for energy and affect 80 million residents and businesses from bakers to chemical producers. ”
https://www.bloomberg.com/news/articles/2022-05-14/germany-girds-for-day-of-reckoning-in-gas-showdown-with-russia
Shanghai, which has been under lockdown for about 6 weeks, will start to reopen on Monday. If the re-opening actually do happen, the extra oil demand will come at the worst possible time as Russian crude supply drops.
If you are the real JB, pretty cool to hear you on Bloomberg radio this morning.
It’s fun to be driving down a lease road in the middle of nowhere listening to stuff like that. I’ve always thought Tom Keene and those folks would get a kick out of knowing there are a few small town folks doing stuff like running stripper wells while tuned in to them.
This stripper oil ride never is boring. $25 to $8 to $136 to $25 to $68 to $15 to $105 (for March oil paid in April) has been my personal roller coaster since 1997. Still standing. Still no plans to drill. Instead looking at plugging a few more wells for the $9 per foot 2 3/8” tubing. (For perspective, it was $2-3 per foot pre-COVID).
I don’t think my family will ever produce more oil than we did in 2014, no matter the price. Not interested in buying anything except one 40 acre lease that would block up some leases for us and make our water injection easier. But they won’t sell, but also haven’t started the wells back up from 2020 crash, despite $105. Hate to try top leasing, not worth the headache really.
Just for you, there are a few oil fields still in Germany.
Ahmm, kind of – it’s not really Denver clan level…
But it’s not in private hand, it’s owned by BASF a 50 billion $ company… eating peanuts.
https://de.wikipedia.org/wiki/Landau_(%C3%96lfeld)
(only on German because of the huge size of this field but I think you can figure out the picture and the numbers).
Distances are shorter there, so no long pickup drive ;).
Shallow sand,
Is it not economic to start up the wells shut in in 2020 at $105/bo, or just a matter of not having the people and equipment to do what is needed, or perhaps some of the wells are ready to be plugged?
Has your thinking changed on future drilling? At one point I thought you had said if prices stayed over $80/bo for a year you might consider it, I may not be remembering correctly or you may have changed your thinking, WTI has been $80/b or higher since the second week of Jan 2022, the past 17 weeks, so another 35 weeks and we will see what happens. I expect $80/b or higher for WTI is likely for the next 57 months at minimum. For someone who is skeptical of an EV transition occurring over the next 10 years, it might be more like 120 months. Looks like a repeat of 2010 to 2014 at minimum, but this time there will be no excess OPEC or tight oil production, unless the EV transition occurs more rapidly than I imagine (this is doubtful, but I am often wrong).
Dennis.
Lack of labor. Inflation.
Also, we haven’t gotten any younger. Not as interested in all the work drilling now requires on our end.
2015-2020 really wore us down. Never say never, maybe next year.
Shallow sand,
Thanks. I would think at the current price level, it would be hard to resist, what percentage of the cost of a newly drilled well is the steel tubing? It seems prices have tripled, but I would imagine it is a small pert of the overall cost of the well. What would your guess be about the overall cost of drilling a new well today vs 2014 or whenever you completed your last new well?
Of course the one thing we know for sure is that if you wait a year, you will be one year older.
In any case I hope oil prices continue to stay high and that the supply chain problems get sorted out so costs come down and most importantly, that things go well for you, LTO Survivor, and Mike.
WTI $113.87 Brent $113.97
WTI June. Brent July
WTI $115.27 Brent $115.01
HHH
July WTI $109.72
July Brent 111.90
Russian crude production plunges by nearly 9% in April, OPEC+ data shows
Russian crude output fell by nearly 9% to 9.16 million barrels per day (bpd) compared with March levels, according to assessments by OPEC+ secondary sources, an internal report seen by Reuters on Tuesday showed.
This meant that Russia last month produced 1.28 million bpd below the levels required in an oil production cut agreement between the Organization of the Petroleum Exporting Countries and its allies, a group known as OPEC+.
Overall, OPEC+ produced 2.6 million bpd below its targets in April, the data showed.
https://www.theglobeandmail.com/business/industry-news/energy-and-resources/article-russian-crude-production-plunges-by-nearly-9-in-april-opec-data-shows/
https://oilprice.com/Latest-Energy-News/World-News/API-Reports-Inventory-Draws-In-Crude-Gasoline-Despite-SPR-Release.html
API crude inventory draws and SPR release
Russian oil production to decline by 10.3%, gas output – by 5.9% in 2022
Russia’s crude oil production will go down by 10.25% in 2022 compared with last year, remaining below 2021 level at least until 2025, according to the outlook on the country’s social and economic development released on the website of the Economic Development Ministry, Trend reports with reference to TASS.
Similar dynamics is expected in the gas sector as a decline in production by 5.91% is projected by the end of this year, according to the document.
In particular, the production of oil, including gas condensate, which totaled 524 mln tonnes in 2021, will decrease to 475.3 mln tonnes in the base-case scenario and to 433.8 mln tonnes in the conservative scenario by the end of this year, according to the ministry. Output is projected at 472.8 mln tonnes in 2023 (405.3 mln tonnes in the conservative scenario), at 476.1 mln tonnes in 2024 (416.4 mln tonnes), and 480.5 mln tonnes in 2025 (421.3 mln tonnes).
Doing the math, using their figures of 524 million tons in 2021, (almost exactly what the EIA says they averaged), that works out to be 10,523,000 barrels per day in 2021 and 9,545,000 barrels per day in 2022. That is an average for 2022. Russia produced over 11 million barrels per day in the first three months of 2022 so for Russia’s average to drop 1.5 million barrels per day from their average the first three months of the year, then the second half of 2022 their average would have to be much lower than 9,545 K barrels per day.
Of course, this is just someone’s estimate. The Trend News Agency did not say where they got their information.
I think it’s hard to guess what’s happening. They are under embargo of such many things, so maintaining field capacity and replacing broken equipment will be difficult at many places.
Mr Shellman is pissed off .
https://www.oilystuffblog.com/single-post/an-embarrassment?postId=7033fd99-3385-4abd-9ead-33dc74334321&utm_campaign=d89034e6-b0dc-49cb-8ff8-2ae62149318d&utm_source=so&utm_medium=mail&utm_content=89ce3efe-edb1-4e40-88c0-e9f007a654f9&cid=fa335351-37bb-44a6-9899-f8c34b4a0f81
One thing to consider:
High gas prices are a wakeup call to change something – when the USA would provide low prices the catastrophe would be set. As Shellman himself writes, the Permian wonder has limited time.
And this time should be used to reduce the need of the stuff. All alternatives wellcome, be it Wind, nuclear, other or all together. Together with a dwindling supply of fossils.
Some people acknowledge the concept of population overshoot
is applicable to not only tadpoles in a small pond in mid spring,
but also applicable globally to 8 billion human beings on planet earth.
The most gentle way that human population overshoot could correct itself is very gradual economic pressure,
giving strong and clear signals to force downsizing of population and economic footprint.
We will be extremely fortunate if this gradual forcing is the worse way this plays out.
What would this mildest case look like?
look around now for all the early signs…
stagflation trending toward deep and prolonged recession, tightening of credit, rising interest rates, decline of purchasing power, resource nationalism (tariffs, sanctions, embargo’s, export restrictions), food and energy price escalation and shortages- even to the extent of rationing, extreme displays of racism and ethnic nationalism, large scale migrations and regional armed conflicts (regional if we are lucky), for example.
I am not predicting that there will necessarily be constant downward pressure without episodes of stability or rebound, but the ingredients are certainly in place for sustained deep downdraft.
No one should be surprised, given the severe condition of overshoot that we are in.
Followup-
this bloomberg article (linked from indiatimes to get around the paywall)
does a good job describing the shifting economic landscape/ramifications
“Age of scarcity begins with $1.6 trillion hit to world economy”
https://economictimes.indiatimes.com/news/economy/indicators/age-of-scarcity-begins-with-1-6-trillion-hit-to-world-economy/articleshow/91657888.cms
Heinberg has some insight also.
http://www.smirkingchimp.com/thread/richard-heinberg/101627/the-energy-and-food-crisis-is-far-worse-than-most-americans-realize
New posts are up
https://peakoilbarrel.com/opec-update-may-2022/
https://peakoilbarrel.com/open-thread-non-petroleum-may-19-2022/
Thanks for this interesting information!
Most frameworks add a lot of extra HTML, CSS, and JavaScript to the pages. If you’re trying to keep bandwidth low for your customers, you might not want to use a framework at all, or just use minimal amounts of the framework. Some frameworks (such as Bootstrap) offer tools to help you build a version of the framework with only the elements your site needs https://mlsdev.com/blog/web-development-companies