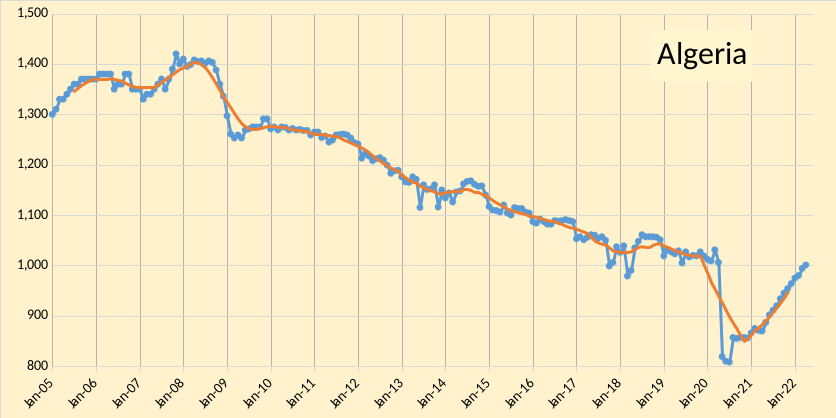
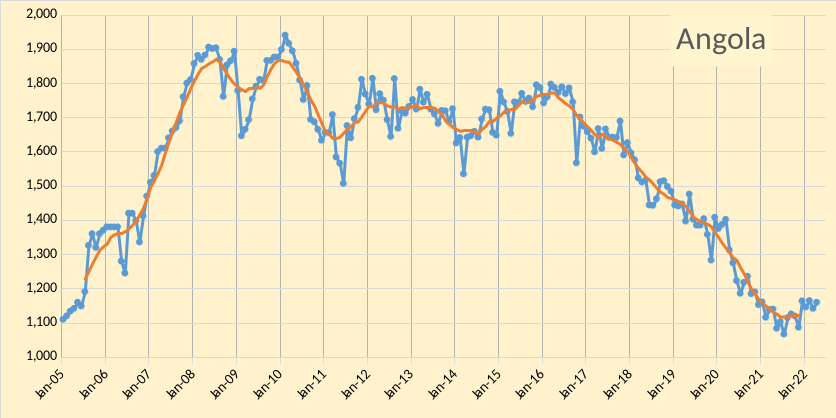
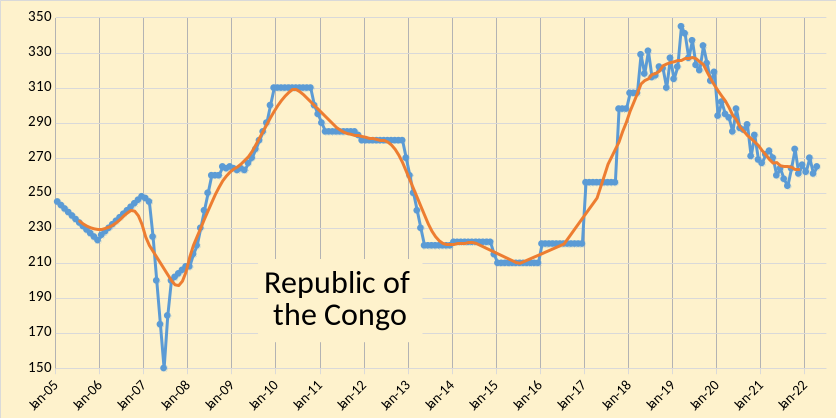
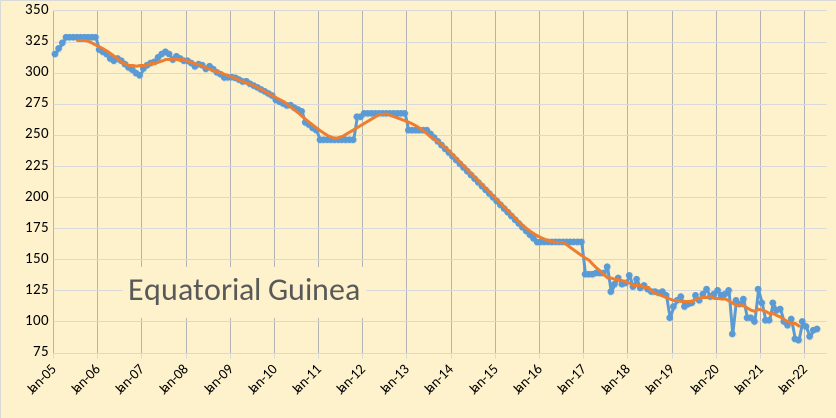
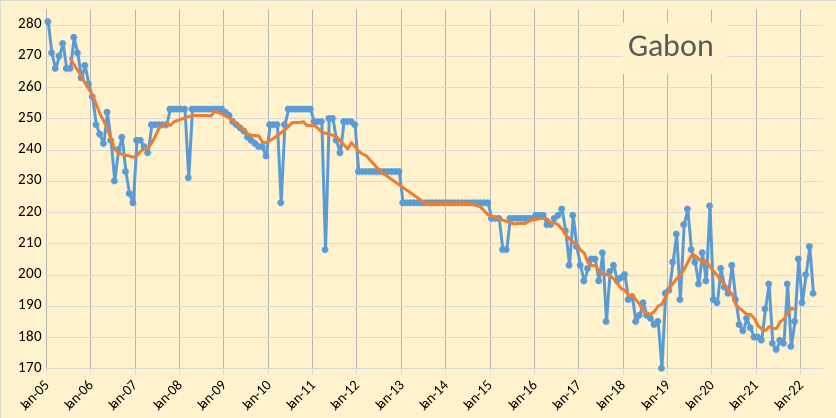
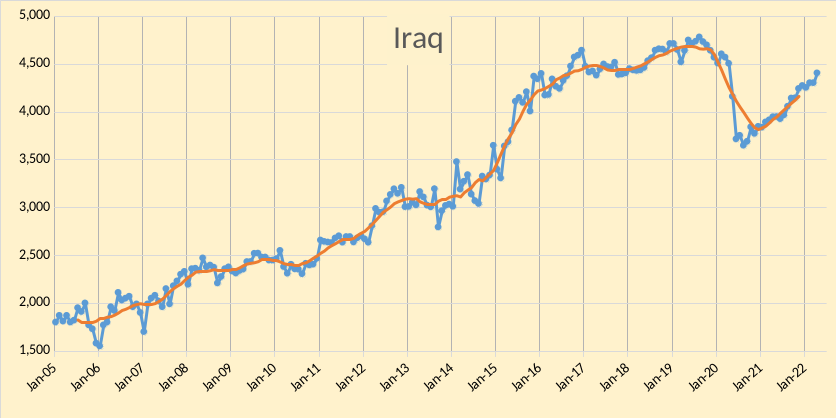
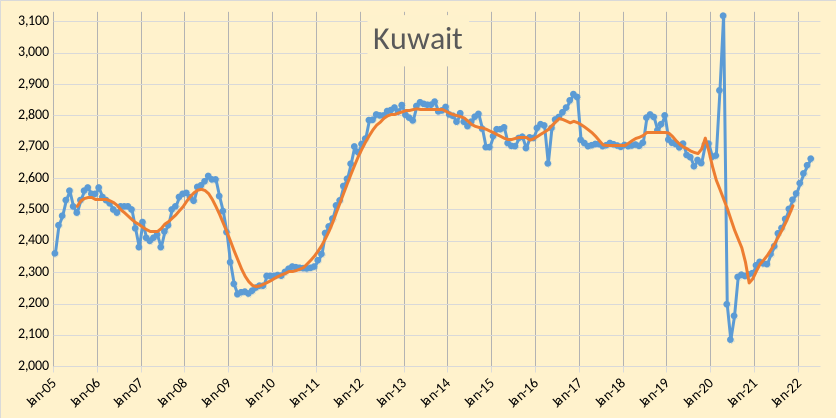
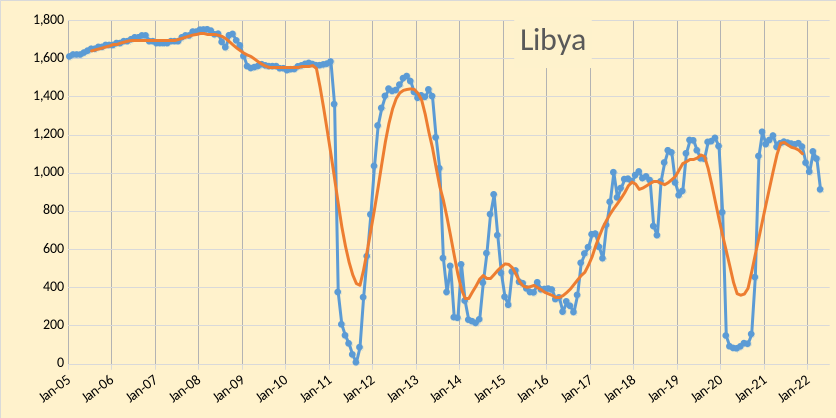
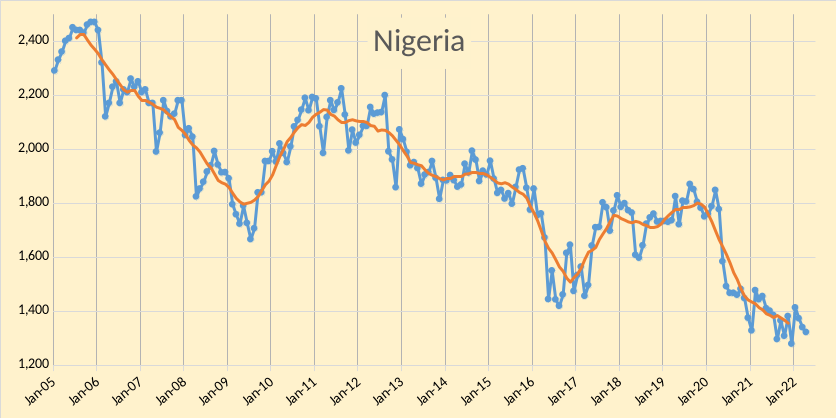
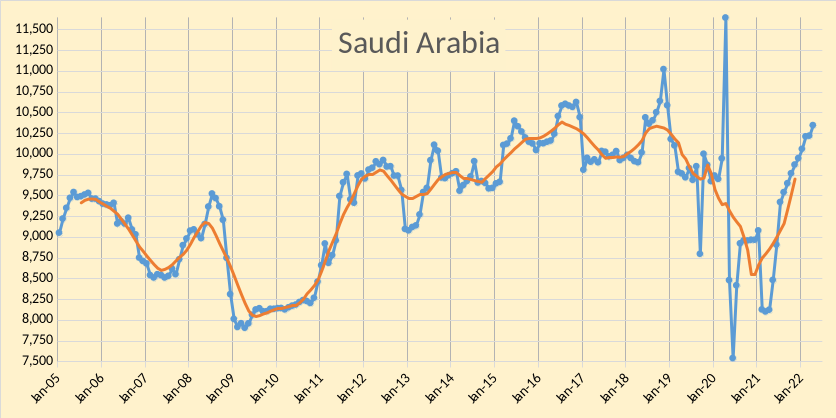
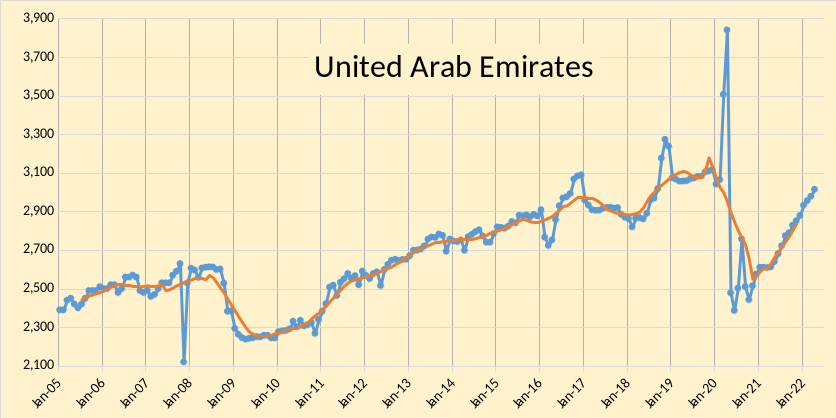
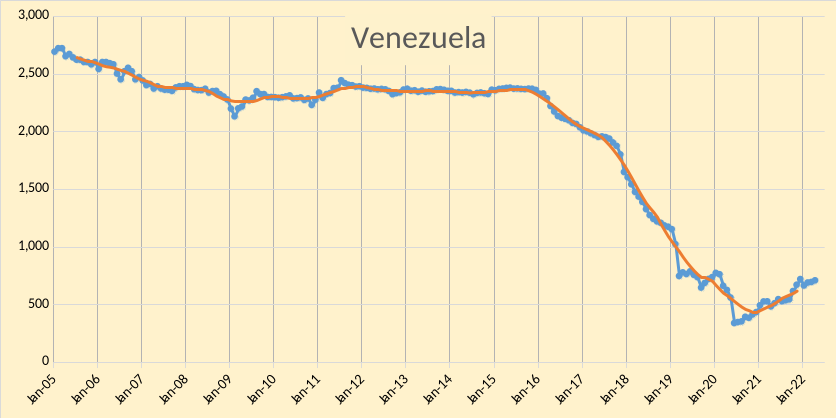
The OPEC Monthly Oil Market Report (MOMR) for May 2022 was published last week. The last month reported in each of the charts that follow is April 2022 and output reported for OPEC nations is crude oil output in thousands of barrels per day (kb/d). In most of the charts that follow the blue line is monthly output and the red line is the centered twelve month average (CTMA) output.
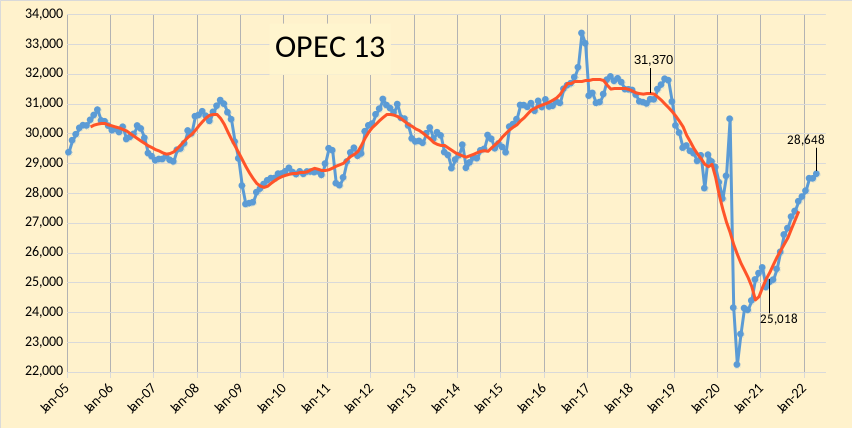
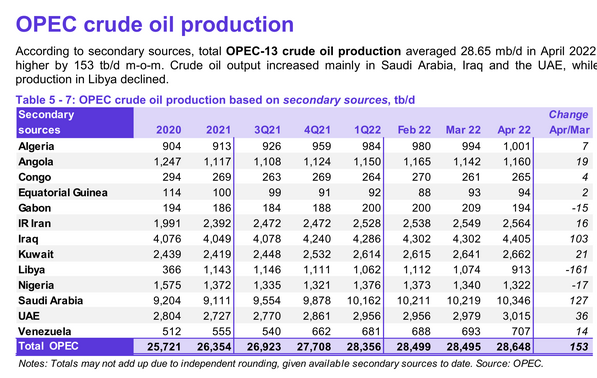
OPEC output increased by 153 kb/d according to secondary souces in April 2022. March 2022 output was revised down by 62 kb/d from what was reported last month and February 2022 output was revised down by 1 kb/d compared to the April 2022 MOMR. Most of the increase in OPEC output was from Saudi Arabia(127 kb/d) and Iraq (103 kb/d). Eight OPEC members saw increases of 36 kb/d or less (total of 119 kb/d combined output for that group of 8 nations). Three OPEC nations had lower output in April, Libya (-116 kb/d) had the largest decrease in output and the other two nations with lower output in April had a combined decrease of 32 kb/d.
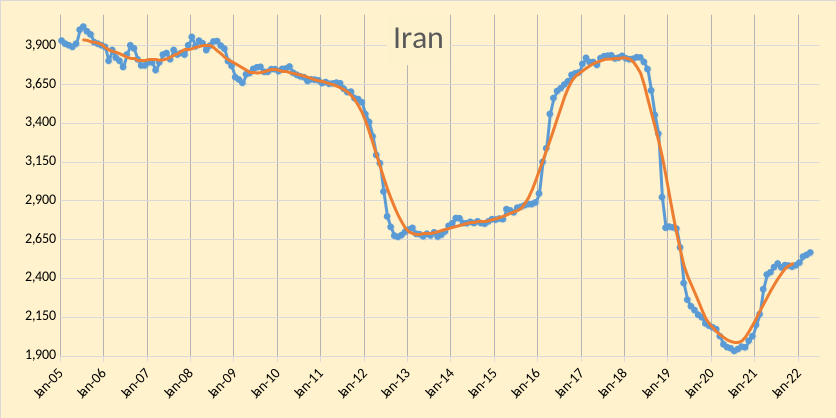
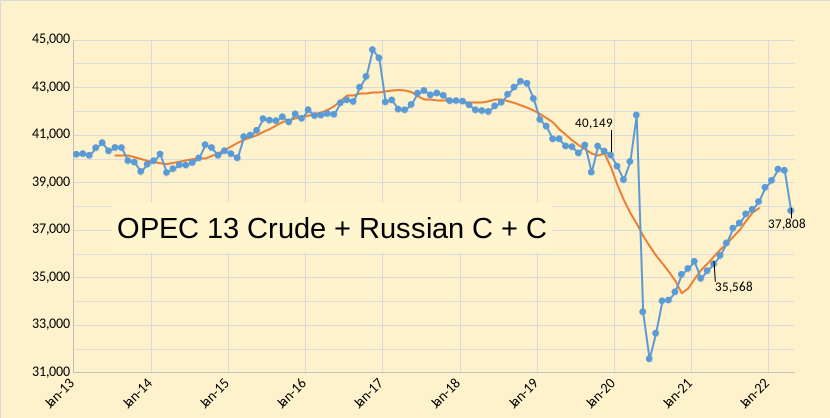
In the chart below OPEC 13 crude and Russian C+C are shown, I expect that OPEC 13 crude plus Russian C + C are unlikely to return to the near term peak of 35,216 kb/d reached in Feb 2022 in the next 12 months. Any future increase for OPEC 13 will likely be small (less than 100 kb/d) and will more than offset by decreases in Russian C+C output over the next 12 months. It also seems unlikely that we will see increased output from Iran in the near future as the JCPOA negotiations are stalled.
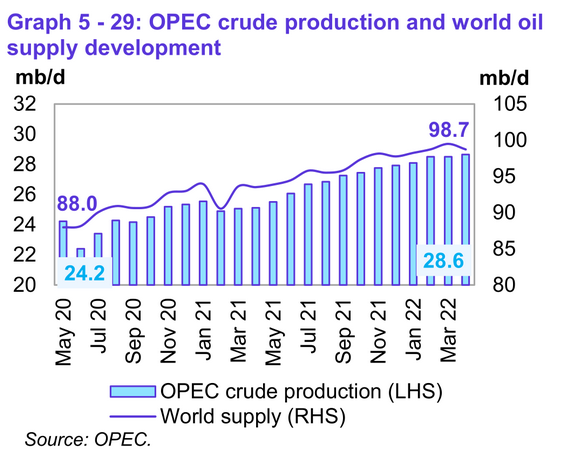
World liquids output was down to 98.7 Mb/d in April from 99.7 Mb/d in March.
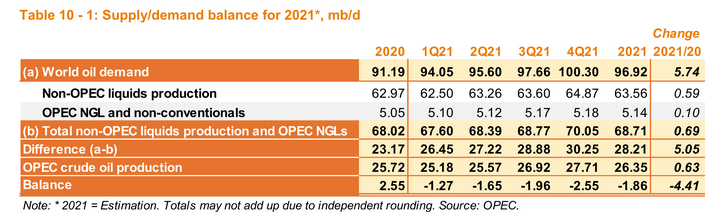
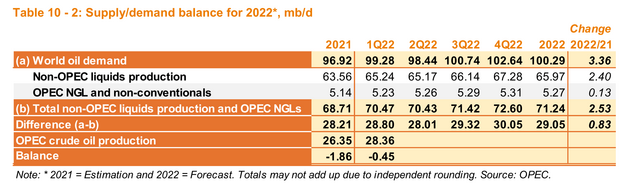
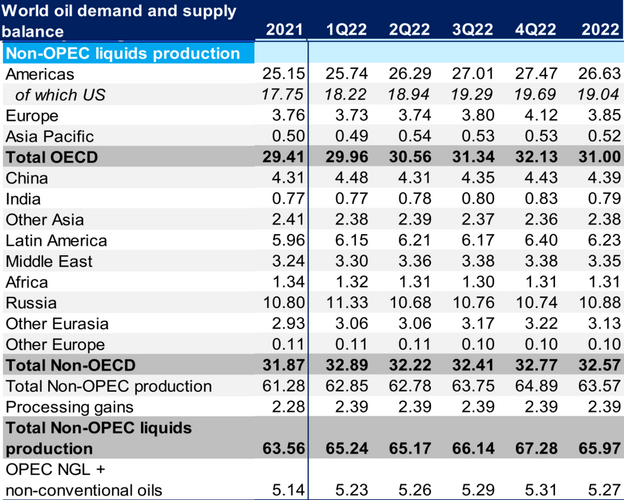
In figure 5 we see that in 2021 there was a stock draw of 4.41 Mb/d which would amount to a total annual stock draw of 1609 million barrels in 2021. When we consider supply/demand balance in 2022 (figure 6), note that OPEC capacity is likely 28.7 Mb/d or less. For 2022Q2, the “call on OPEC” is supposedly 28 Mb/d, but note the output assumed in Figure 7 for both the US and Russia, neither estimate is very realistic. Russian liquids output in April was about 10.3 Mb/d and it seems unlikely that the 10.68 Mb/d Russian liquids output assumed by OPEC for 2022Q2 will be realized (it is more likely that Russian output will fall even more going forward). Likewise for the US an increase of 720 kb/d is assumed from 2022 Q1 to 2022 Q2,US output will likely not increase to this extent in quarter 2 of 2022. The story is much the same for the second half of 2022 and even if the optimistic estimates of non-OPEC output were met in 2022 Q3 and Q4 OPEC is unlikely to be able to match the call on OPEC.
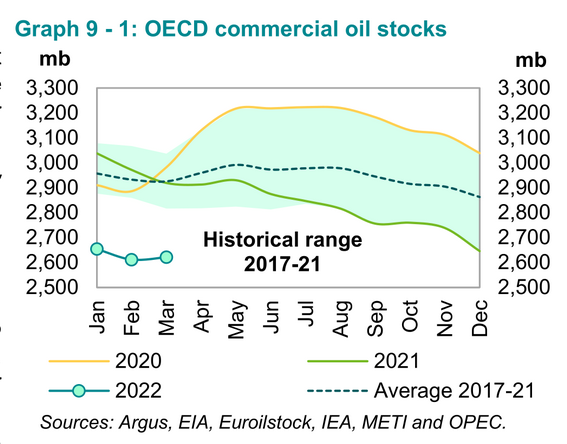
The fall in stocks that was seen in 2021 is likely to continue from April to December 2022, unless a severe recession cuts World demand for oil. Current OECD stocks are about 300 million barrels below both the 2017-2021 average level and the 2015-2019 average OECD stock level. I foresee high oil prices for the next 7 months and probably longer.
124 responses to “OPEC Update, May 2022”
Great post David! Iraq and Saudi Arabia are doing surprisingly well. Is this a trend? Or just an uptick? I suppose SA is bringing a lot of oil from storage to the market to cushion the embargo against Russia. But will they be able to succeed this way for much longer?
The production does not come from storage, consumption and exports come from storage, the produced oil goes into storage, think of stocks as a big tank, production is a big pipe flowing into the tank and consumption (actually inputs to refineries) and exports are two pipes where oil flows out of the tank.
Yes David, good explaination. I thought in those production spikes of various OPEC countries right before the production shutdown in 2020. I doubt these spikes can have been reached with real production right out of the wells.
Wes, it’s Dennis, not David.
Uh, yes. Thank you Ron. Dennis of course, how could I forget your name after all these years? Must be because of polyglot multitasking on my smartphone. Hate these tiny screens …
Westtexasfanclub,
I believe there are things that can be done temporarily to boost output, such as higher water injection rates and so forth, also produced oil and water can be stored in holding tanks temporarily before being processed by GOSPs as in many cases GOSP capacity may be the limiting factor, they just take the average recent level of water cut to estimate output of crude in this case, or that’s my guess. The sustainable level of output is the 12 month average peak in my opinion. I think Saudi Arabia, Iraq, UAE and Kuwait are very close to sustainable capacity (probably within 100 kb/d) at least for the near term. In the future they might be able to bring more capacity online, they would be wise to do so or they may find in the future (say after 2030 or perhaps 2035) that they have stranded assets that will no longer be very profitable to produce. The same applies to tight oil in the US, though in that case it is more urgent, because those plays will no longer be profitable at $60/bo in 2021$, for large middle east producers it might be $25/b for new resource development.
Dennis
More Grist
Saudi Arabia set for oil output capacity above 13 million barrels per day by 2027, minister says.
MANAMA, May 16 (Reuters) – Saudi Arabia is on track to lift oil production capacity by more than 1 million barrels per day to over 13 million barrels bpd by the end of 2026 or start of 2027, the energy minister said on Monday.
Abdul-Jabbar also said his country’s current production capacity of 4.9 million bpd and would reach 5 million by the end of the year.
Iraq, the second largest OPEC producer, aims to raise its capacity to 6 million bpd by 2027, he said.
https://www.reuters.com/world/middle-east/saudi-arabia-track-hit-oil-output-over-13-mln-bpd-by-2027-says-minister-2022-05-16/
Ovi,
Their real capacity will be perhaps 11500 kb/d if they raise it by 1000 kbpd avove today’s level. They do not have the capacity that they claim, it is about 1500 kbpd less than claimed imho.
Saudi Arabia was supposed to pump almost 14 mb/d in 2018
http://crudeoilpeak.info/saudi-arabia-was-supposed-to-pump-almost-14-mbd-in-2018
https://mishtalk.com/economics/gas-prices-hit-another-record-high-on-thursday-whats-biden-doing
Great work Dennis!!
New gas price record….HI FIVES ALL AROUND!!
Peak Avocado,
If we look at the real price of gasoline in May 2022 US$, the high monthly price was July 2008 at $5.38 per gallon. Real inflation adjusted prices are a far better measure.
See
https://www.eia.gov/outlooks/steo/realprices/
and chart below
Thanks for the work Dennis. Very much appreciated.
Your Figure 7 chart from the MOMR shows third-quarter Non-OPEC liquids production 900,000 barrels per day above first-quarter liquids production. That is totally absurd, to put it mildly.
But it gets worse. Non-OPEC liquids production jumps another 1.14 million bp/d in the fourth quarter, putting fourth-quarter production 2.04 million barrels per day above first-quarter production. And this is all Non-OPEC liquids. With Russia down over one million bp/d from the first quarter, where are three extra million Non-OPEC barrels per day going to come from?
Edit: Looking back over the chart they have Russia down only .59 Million bp/d and the Americas up 1.73 million bp/d. Since Mexico will likely be lower they must expect the USA and Canada to increase by about 2 million bp/d. Russia will likely be down about a million bp/d more than the .59 Mbd they expect. And I seriously doubt that the USA and Canada will be up by anywhere near 2 million bp/d by the fourth quarter.
That begs the question. Why does OPEC post such bullshit?
Ron,
I agree. I discuss this at the end of the post, but I focus on the Q1 to Q2 change which looks the most unrealistic and then simply state that the last half of 2022 projections by OPEC also look quite optimistic. In any case, that’s what I intended to convey.
OPEC does say the forecast for Russia is highly uncertain, perhaps they give such poor forecasts to give the illusion that they have everything under control.
One big problem is the myth of OPEC spare capacity of about 2 Mbpd that does not exist. Basically the highest peaks of OPEC output are claimed as “OPEC capacity”, which is nonsense in my view. The proper measure of “spare capacity” is the recent 12 month peak of the big 4 OPEC producers plus the recent (past 12 month) peaks of the other producers. OPEC total capacity is likely about 28,800 kb/d while Iran continues under sanctions and perhaps 30,100 kb/d if Iranian sanctions were removed and Iran has 9 months to ramp up output (currently this seems unlikely based on recent news). Non-OPEC output is likely to be much less than what OPEC has forecast in the May 2022 MOMR, my guess is about 800 kb/d lower (400 kb/d less for Russia and 400 kb/d less for North America.) High oil prices will need to destroy some demand to balance the market. SPR releases are not going to solve this problem, higher output from tight oil producers would help and Biden would be smart to work on that problem rather than simply release oil from the SPR which will run dry pretty quickly.
Biden does not seem to be getting good information from his advisors on this, it will quickly become a crisis without immediate action.
In my view Biden’s advisors fall into one of two categories, pretending to be in mortal fear of the carbon atom OR believing carbon dioxide can and will destroy life on earth. Either way every decision, in some way, is to limit the production of fossil fuels. God help us all.
You’re full of shit and this is the wrong site to flaunt it.
Show me I’m wrong, when the Biden Administration mentions emissions they only talking about one thing, Carbon Dioxide. Why is that? For instance, the latest five year offshore oil auctions, will be based on emissions, or better known as carbon dioxide.
Your talents are wasted here! You should be CIA; Director of Complicated Analysis.
Whining about politics doesn’t have to be wrong to be stupid. You watch TV, the TV guy hates Biden, and you regurgitate that hate here. You emotional react into Biden appointees isn’t much help to anyone, it’s a personal problem.
I recommend less time in front of the screen and more physical exercise. Not only will it improve your health, it will clear some demons out of your head.
As a machine learning professional, I am painfully aware that despite over seven decades of trying, we have yet to create artificial intelligence.
But we have achieved artificial schizophrenia, with sophisticated algorithms channeling custom tailored hate filled voices into the heads of hundreds of millions of casual internet users, replacing the voices in the heads of schizophrenics. That explains a lot of the political crises worldwide over the last decade.
Along these lines, this is a good read that sums it up fairly well:
https://ritholtz.com/2022/05/panic-tv/
I’ve come to the conclusion that the MSM wants to generate a lot more excitement than to inform. More excitement, more eyeballs to the screens, more advertiser revenue. It’s all about the money.
To me, this says it all: There was an ad for lite beer awhile back where Bob Ueker (of the film Major League) who walks up into high school bleachers and gets some well known football to scream at each other: Less Filling Taste Great!! back and forth until the scene breaks just before they get into fighting each other. **What happens if the camera was turned 180 degrees?** What would it show? Likely it would show a bunch of their young kids playing sports wanting help, tips, and cheering on from their parents. But all they see is a bunch of parents screaming inane slogans at each other instead of supporting their kids. I think that sums it up about where we are socially in this country. I refuse to watch MSM “news”.
Performance Conformation Mike, I.e. your reply – emotional, bullying and lacking any facts or logic – is rather a poor example to set if you wish to present “your side” as the ones with truth and reason. Rather, it obviously suggests you feel threatened by any need to argue your point based on facts.
Anyway, I personally have found the heuristic “the ad hominem attacker likely cannot defend their position, so they resort to Simian turd flinging” to be mostly true.
Perhaps try a second approach?
Anyway, just my two cents.
Ad hom?!
“Being an asshole is not a logical fallacy” ~ Ben Burgis
It would do all well to know that if one refuses to consider MikeB’s argument because he’s being an asshole, then it is them who has committed the logical fallacy.
“Contrary to popular belief, merely insulting someone is not a fallacious ad hominem. A character attack is only considered a fallacious ad hominem if it is used in exchange for a genuine argument.”
https://en.m.wikipedia.org/wiki/Ad_hominem
Survivalist, I read the following headlines and marvel that a**holes as per above continue to emit CO2 to voice their blather:
https://climateandeconomy.com/2022/05/21/21st-may-2022-todays-round-up-of-economic-news/
https://climateandeconomy.com/2022/05/20/20th-may-2022-todays-round-up-of-climate-news/
Market link.com, dated 21May. Headline. US preparing plan for new 5 year for offshore oil and gas leases. Quote “ president Biden wants to reform the oil and gas lease program to take into consideration its effects on climate change. Making the cost of producing fossil fuels harder and more expensive. Nothing more, nothing less.
Ervin,
Political parties and figures tend to reflect their constituents.
Most people in this country seem either extremely naive, poorly educated, brainwashed, or partisan above else,
when it comes to many issues- including energy and earth science.
This applies to both parties and to those who are non-aligned.
Many people do not acknowledge or are unaware of basic truths, for example
-The inexorable depletion of fossil fuels, and the extreme reliance on fossil fuels
-The growing global risk of severe climate disruption related to burning fossil fuels all in one century or two
-The very long lead time and expense of deploying major energy projects like refineries, nuclear power plants, hydroelectric facilities, utility scale solar and wind production, electric transmission upgrades, electric vehicle fleet, electric grid storage, new oil field discovery and development, ocean drilling rigs…
The US has been extremely poor on energy policy, regardless of party in office.
The citizenry (who elect the leaders) are living in an energy dreamland state.
Partisanship driving leadership selection and policy results in a USA that is a small shadow of its capability- like a spoiled and entitled child who never did their homework.
Hickory. Thanks.
I am a niche poster. I feel the world will need us stripper operators for non-light transport and non- transport. But light transport can transition. It better or there will be serious issues.
But, fact is a few billion in the developing world are harmed by traders in NY and London. That’s a fact. Almost every bloody uprising the past 20+ years is in part due to fuel and/or food. The city people mock me for this. They think fuels comes from the gas station and food from the grocery store.
I’m just a small town redneck. But you should see my tax returns. Some years you would think I’m a robber baron and other years you’d think I’m going BK.
This financialization of commodities has been a very bad thing. My reading says it started under Greenspan and Clinton in 1998. I don’t dispute that at all. $8 to $136 with a lot of mountains and cliffs don’t lie.
I appreciate your perspective. I had no awareness of the sector of the industry that you operate in prior to your explanations.
I will add additional comment on policy-
It is foolery to have allowed unrestricted free market production in the oil industry.
We have known about our absolute reliance on oil and gas, and the finite nature of the resource, for at least 50 years. We have known that the longer we could stretch the domestic supply the better off we would be… in the long run.
Boom and bust cycles have been disruptive to both domestic producers and consumers.
A long term production regulation and pricing support mechanism would have been good policy for the nation, with the goal of stretching out these finite oil and gas resources for as long as possible. Despite the fact that growth rates would have been slower. It would have been very hard to hold office with this platform, I understand.
Nonetheless- a national unforced error.
Hickory
Well done, you certainly made some profound statements.
The developed world in the last 30 years or so has ended up thinking of emissions as only carbon dioxide and has guided its policies as such.
Google the summers of 1911-12 on the east coast and of course the summers of 1936-37. I feel it’s safe to say that the US today does not have the electrical infrastructure that would survive. A person today would have a better chance guessing the next powerball number than guessing the state of the world climate a 100 years out. As far as elections, the good citizens of Australia have voted to make sure that they will have more expensive and less reliable electricity. Think of this, if Australia disappears tomorrow, China and India would replace all of the carbon dioxide lost in a matter of a month or two.
Ervin,
what is your energy plan, now that we are at peak oil and soon to be at peak coal and gas?
Trolls attack places that are actually doing something, and argue for inaction (conveniently for some). And they deny science.
DPR for May came out recently
https://www.eia.gov/petroleum/drilling/
Permian completion rate scenario based on recent trend. Some will claim this is not realistic, but note that the annual rate of increase in the completion rate from Jan 2017 to Feb 2018 was about 162 per year vs the recent rate of increase of about 66 per year (used for the projection into the future). At current oil prices this is likely a conservative rate of increase.
Note also that I expect the Permian completion rate to remain flat at 650 completions per month after mid 2025 until WTI prices start to fall below $90/bo in 2021 US$ somethime after 2028. At this point completion rate may fall as wells will become less profitable to drill and complete in the Permian basin as demand falls due to rising share of electric transport.
Using the recent rate of increase in drilling rigs in the Permian basin and assuming that continues in the future, we get the following for projected DUCs in the Permian basin.
Dennis
Attached is the same chart on a shorter and expanded scale. The future is in the eyes of the beholder.
In April 2022 there were essentially the same number of completed wells as March 2021. In March 2021 WTI was $60/b. Today it is almost double at $112/b. The unknown here is the change in management thinking and investor activism on how much investment goes into drilling and how much is returned to investors. Today’s reality is different than the past.
This chart shows an increase in drilling to offset the lower completion/use of DUCs. Drilling is getting more expensive and I assume so are completions. Looking at this chart I can see completions increasing but at a much slower rate than shown by the OLS line shown above.
If I had invested in a business that kept showing red numbers and they finally started earning some profit, I think I would like to first at least get my investment back before letting them spending it on more potentially (as previously done) money loosing endevours. So I agree, the sentiment has likely changed.
Edit, a thought, if the drilling crosses over completed, it would lead to more DUCs, hence a bet on even higher oil prices in the future, prepared when drilling costs were “low”. Another thought, alternatively, the ratio of dead DUCs is going up?
Laplander,
We don’t know how many of the remaining DUCs are “dead”, if we get to the point where the completion rate suddenly decreases and becomes equal to the drilling rate, perhaps all remaining DUCs are “dead”, at this point we know the Permian dead DUC count is no higher than 1256 (if the DPR DUC count is accurate.) At current prices, the profits for Permian producers is quite large, they may use all profits for either paying dividends to share holders or for paying down debt, if so tight oil output drops.
Most are playing the game of flat output, they are waiting for oil prices to decrease before increasing output, as this seems what the smart shareholders want. One would think they would prefer to produce more when oil prices were high, but I am not an oil man so I just don’t understand.
Hi Ovi,
I guess we will agree to disagree. I used the past 12 months, you seem to think the past 3 months (annual rate of increase of 30 per year) tells us more. If we use the past 6 months of data the OLS has an annual rate of increase of 82 per year. The recent twelve month trend has been an annual rate of increase in Permian completions of 66 per year. The average price of WTI oil from Jan 2917 to Feb 2018 was $52.6/barrel and the Permian average annual increase in completion rate was about 162 per year. If the completion rate increases at a slower rate than 66 per year (say 33 per year) and the drilling rate continues at the recent rate, then the DUC projection changes to the following.
For rate of increase in drilling I used the following (data from DUC spreadsheet of DPR).
Dennis
Starting back in November 2020, at the 310 count would give a lower projection.
Ovi,
Not clear what you mean. Maybe you mean duc count would be lower? Yes that would be true.
Dennis
I meant that the Permian completion rate would be lower.
Dennis
Agreeing to disagree in a nice way these days appears to be disappearing.
I guess I am hanging my hat on the change in management thinking and looking at the recent trend.
The drop in DUC completions in the latest DPR report is hinting that the remaining DUCs are not that economically viable. I can’t see drilling a lot of extra well to increase the number of DUCs when drilling costs are high and steel piping is scarce.
On the other hand, some deep investors may be betting on $150/b WTI.
Ovi,
Perhaps most of the remaining DUC are not viable, I don’t think we know. There are many reasons why the completion rate has increased more slowly the past few months, such as higher prices for steel tubing, a shortage of workers in the oil field, and a shortage of sand for completions all resulting in higher costs. There is no sign of a slow down in the rate of increase in the number of wells drilled (or not that I see). Let’s assume all ducs are now dead DUCs and completion rate matches the drilling rate and the trend in the rate of drilling continues. Also we assume no more than 434 wells are completed in future months. In that case we get the following for DUCs in the Permian.
From a business point of view, a lot of potentionally profitable holes in the ground might be like finding some holes prepared by the azstecs. I just hope they´re not radioactive …
Following may be more realistic, the drilling rate decreases after October 2023 until the 434 well per month rate is reached, it seems doubtful to me that a constant completion rate is likely in the future at $100 or more per barrel.
Ovi,
Sometimes people respectfully disagree, now I apologize for not being nice enough in my explanation of what we seem to disagree about.
It could be that the completion rate slows to 30 per month or to zero or decreases, all is possible. I just think the 12 month OLS is the most likely future, but as you know my guesses about the future are usually incorrect, yours may well be better.
Do you have a specific prediction (such as 0 or 30 per year for annual rate of increase in Permian completions over the next 24 months)?
Dennis
I did not mean to imply that your response was inappropriate or disrespectful. It was meant for the other discussion boards where discussions get nasty.
Agreeing to disagree is a nice way to have a good discussion on this board.
Ovi,
Thanks. I agree things often get nasty, unfortunately. I thought perhaps I was too pointed in my comment, I often come across in a different manner than I intend.
And there are some people who take strong offense when their opinion is challenged in any way and consider it an insult when not insult was intended, it some cases it is somewhat amusing seeing the reactions people have.
Dennis
I don’t have a specific number in mind for completions. I could calculate an OLS line through a few points and come up with number. However by looking at the last six months, I think that should reflect managements thinking on what to do with completions going forward. To me it is saying that monthly completions are slowing and could slowly work their way up to about 450 by year end.
Ovi,
I agree it looks like we may see a change in trend for the rate of increase in completions and it may be as you suggest due to the quality of the remaining stock of DUCs.
I imagine a scenario where completion rate remains flat until wells drilled per month rises above 450 and then we might see the annual completion rate rise at about 65 per year thereafter. Or that seems a fairly likely scenario if oil prices remain above $95/b over the next 5 years or so.
Agree Ovi. Mike B’s limbic ad hominem above also was most unbecoming of a blog that traditionally keeps it to civil debate, even if an echo chamber on most other topics (yes, it really is:) l. However, that’s of course fine, as the core work done here, documenting Peak Energy, is a rare commodity in itself.
Thanks also both to you, Ovi, and Dennis, for your continued hard work, even when there is profound disagreements.
Suadi Arabia oil stocks have been bouncing between 137 Mbbls and 132 Mbbls since January 2021.
In March 2022 they dropped 1,302,000 barrels or 42,000 b/d to 135,847 kbbls.
OPEC E&P expenditures
Norway’s natural gas output is up about 5% in April compared with pre-conflict, with a few percent more coming in May as the Snøhvit LNG facilities starts up again. The oil output is however 10% down in April compared to NPD forcasts. The short story is that natural gas output is up 5%, and oil output is down about 5% due to tweaking as a response to the European natural gas crisis. A bit more is coming online (LNG), so natural gas output could increase up to 10% compared to pre conflict (a bit less). When it comes to oil, some of the reduction has to do with the tweaking of output and some has to do with equipment failure. There will be maintenance during summer as normal, meaning oil output will normalise thereafter.
https://www.reuters.com/article/norway-oil-output-idAFL5N2XC3F7
There is no doubt a lot of shelved projects in Norway where the “only” find was natural gas. There is no way of knowing the size of the discoveries without drilling them further (appraisal wells). The coast of Norway is exceptionally long with a lot of resources (not so many big finds most probably – mid sized and small in a mixture). The key is how to establish the infrastructure in the form of pipeline or LNG capacity to get the gas moving to Europe. Germany is open arms as I understand it as to make things happen; it will take a lot of drilling, planning and time to implement solutions. But I guess Germany will end up with more natural gas imports from Norway in the end.
When nat gas prices were low with respect to oil, they were reinjecting the nat gas to produce oil. Currently nat gas prices are high in Europe with respect to oil so the economic incentive to use the nat gas to produce oil has diminished. This could help to explain the difference in extraction numbers.
Over in Alberta, the Canadian tar sands consume one third of the nation’s natural gas. There is very little energy return for this endeavor of cooking tar sands to make oil. The primary reason to do so is because for a long time folks have wanted oil more than natural gas. However, over the course of the next 5-10 years there’s a good chance most of these tar sand companies will go bankrupt, as a fundamental shift is occurring in the relative importance of natural gas vs oil.
Natural gas prices have been rising strongly relative to oil because of an increase in export capacity making natural gas more of a global commodity, and the Ukraine war limiting supplies to relatively wealthy Europe. The tar sand oil is relatively landlocked and the only real market for it is the US. Because of this the tar sand oil sells at a significant discount. Oil production in the US will remain relatively strong this decade, but by mid decade demand will start to fall off from EV adoption. Natural gas prices are likely to remain high especially in the northern US and Canada because of its use for heating buildings. Because of these factors it appears to me that Canadian tar sand production is a dead man walking and will be mostly gone by 2030. The natural gas is just too precious to waste it in this manner.
“Because of these factors it appears to me that Canadian tar sand production is a dead man walking and will be mostly gone by 2030. The natural gas is just too precious to waste it in this manner.”
So post peak oil, people won’t want oil! Great prediction!!
“Oil production in the US will remain relatively strong this decade, ”
You must not be reading Mike Shellman’s posts.
So put in nuclear reactors to provide the necessary steam. Also power for hydrolysis to provide the necessary hydrogen. The saving in natural gas will be immense.
DAVID ARCHIBALD,
I enjoy your “Let’s just INSERT THIS” to solve our energy predicament. I see a lot of this type of Delusional thinking today because many believe the world is run by the ENERGY TOOTH FAIRY.
With the U.S. Vogtle #3 & #4 Nuclear Plant Units in Georgia reaching $28.5 billion, double the original cost, along with France’s Flamanville #3 at quadruple the cost at $14.4 billion, we are just going to RAMP these suckers up in no time??
Why? Because those who sit in their LAZYBOY CHAIRS fail to realize that the components that go into these highly complex Nuclear Power plants come from the very High-Tech Global Supply Chain that is breaking down.
Sure, we may attribute wasteful capital expenditures due to Government oversite and contractor overbilling, but China is also dealing with massive cost overruns… LOL.
Now, David… if you can call up CAPT KIRK and get him and SCOTTY to make hundreds of millions of parts for 200-300 Nuclear Reactors from a FLEET OF STAR TREK REPLICATORS, then I might agree with you.
If not… the world is heading in the same scenario as all past ancient civilizations and empires… COLLAPSE. 🙂
steve
I’ll add that it takes 10-20 years to build a nuke, from permits to completion.
I was once a visiting fellow at the Institute for World Politics in DC. It is a graduate school for the State Department, DOD, all the intelligence agencies etc. I made up a lecture for them entitled “The Four Horsemen of the Apocalypse” which became a book entitled “Twilight of Abundance” in 2014: https://www.amazon.com.au/Twilight-Abundance-Century-Nasty-Brutish/dp/1621571580
All my dire predictions in that book are coming true:
Energy shortage
Cooling climate
Middle East starvation
Chinese aggression
Nuclear weapon proliferation
I am so happy about that. By the way, my first job in the oil industry was as a juggie on a seismic crew in 1973.
“the world is heading in the same scenario as all past ancient civilizations and empires… COLLAPSE.” ~ Steve
I thought “we” were special lol sarc :/
Steve,
After your fear mongering of Exxon going BK only a year ago. You have no credibility to be communicating to anyone with such arrogance.
@David+Archibald
“Cooling climate” – Scratch that one off of the ones you got right
“I’ll add that it takes 10-20 years to build a nuke, from permits to completion.”
Under “normal” conditions. How long under emergency?
11 years- assuming international supply chains are functioning smoothly and labor is well paid
@hickory
Where did you get that from? I am unaware of a nuclear plant being built under “emergency” conditions.
And don’t cite the “Manhattan Project”
Here are some more bold predictions,
https://www.youtube.com/watch?v=qWyhKobyM68
Peak Avocado,
about building nuclear plants, it’s worth mentioning the America doesn’t have the industrial capacity to do it. The huge boilers needed for projects like Vogtle are imported from South Korea.
about building nuclear plants, it’s worth mentioning the America doesn’t have the industrial capacity to do it. .
I have to question that assertion by Alimbiquated.
The huge boilers needed for projects like Vogtle are imported from South Korea.
By that logic, we do not have the industrial capacity to do anything. We live in a globalized world. At least half of everything we manufacture is imported from one place or another. The same can be said for just about every other country. They all depend on imports of one sort or another. It is the collapse of globalization that we must worry about. Every nation must worry about the collapse of globalization.
However, the boilers for nuclear power plants are nothing like ordinary boilers. In a nuclear power plant, the reactor is the boiler. That is, the reactor is the source of heat that heats the water that creates the steam that drives the turbine. There are no huge boilers like you would find in a conventional power plant. Of course they all have a heat exchange. The steam that powers the turbines is not the same water that circulates through the reactor. And sometimes it is liquid sodium. But nevertheless the reactor is the source of heat. In ordinary power plants there is an actual fire in an actual hugh boiler. Not so for a nuclear plant.
PeakAvocado-
The 11 years was just a speculation [plus or minus a few years]
We already are in an energy emergency [check fertilizer pricing trend]
It is slow motion and just starting.
Note- if the world wanted to replace the equivalent of 10% of the global
Oil, Coal, and Nat Gas energy consumption [2019]
it would need to build roughly 1,750 new nuclear power generating stations
[assumes a 1GW nameplate capacity, which is a typical full size reactor, and standard reactor performance- CF 90%]
There are 51 nuclear plants currently under construction in the world, with only 5 countries having more than 2 (China, Korea, Russia, India, Turkey). There were 5 retirements last year.
Steve,
great !
I see on your blog a post concerning motor vehicles, and their production peak. Up to now, i have not joined as a member, so i can`t read it. Eventually, i will do it now.
For other people who have not joined, i add an image with the Hubbert Linearization of all motor vehicles.
The data point for 2022 is an estimation based on the four last months.
Stephen
I am not sure what your source of information is. I think you should provide a source or let us know if this is an opinion.
Here is one fact that I can dig out if required. COS, bought out by Suncor used to release the amount of NG required to make one barrel of Syncrude. It typically was 1000 ft^3 or 1/6 of a barrel of syncrude. Since then the number has dropped due to use of solvents and other efficiency improvements. So the EROEI is in the neighbourhood of 5.
For SAGD operations, the use of NG was higher. However that operation has turned to using more solvents to reduce the use of NG.
You say the tar sands oil sells at a significant discount. Syncrude at times sells at a premium to WTI because it has no bottoms, is sweet and diesel rich. The main export to the US is western Canada Select (WCS) and sells typically for a $13 to $14 discount. It depends when the Mid West Refineries close for maintenance. At 110/b, that is not a big hit. The oil sands will be around for a long time and they are not a dead man walking. In fact they probably will be the last man standing as we hit Peak Oil within a few years from now,
From David Hughes analysis, tar sands ERoEI is 2.9-5.1. If we assume the lowest hanging fruit is harvested first, the number is slowing declining towards 3. What is changing is which is the more useful fuel, natural gas or oil. Natural gas has had a paradigm shift in the last year because of the reasons I mentioned, namely, the market for this fuel has finally globalized sufficiently that it will now be priced at the marginal cubic foot rather than being constrained by local market needs; and the availability of natural gas globally has constricted due to the Ukraine war; and, transportation fuels in North America are transitioning to electricity; and, tar sands oil is pipeline constrained. So, as oil prices fall relative to natural gas (oil may still be $100 I am speaking of relative prices only in Canada/northern US where heating loads are very high), it will no longer make sense to burn expensive natural gas to make oil.
https://insideclimatenews.org/news/19022013/oil-sands-mining-tar-sands-alberta-canada-energy-return-on-investment-eroi-natural-gas-in-situ-dilbit-bitumen/
Stephen
The article is from 2013. Note that the article confirms the EROEI of 5 I mentioned.
For SAGD, as I mentioned, the use of solvents reduces the amount of NG used. Below is a paper from 2017, which shows a range of EROEI for both mining and SAGD. Improvements, especially the use of solvents for SAGD, have continued since then.
Oil sands is a manufacturing process and as such efficiency gets better with time, not worse.
Tar sands oil is pipeline constrained. Where did that info come from. Line 3 opened a year ago and added 400 kb/d of capacity. Also the Capline pipeline was revered and added capacity to the gulf coast. It effectively offset the loss of Keystone XL.
It will be a while before EVs start to affect crude demand.
https://www.spglobal.com/commodityinsights/en/market-insights/latest-news/oil/010722-capline-pipeline-reversal-fully-online-with-extra-canadian-crude-capacity
Results of this paper show that EROI of both mining oil sands (range of value: 3.9–8) and in situ oil sands (range of value: 3.2–5.4) display an upward trend over the past 7 years; EROI of mining oil sands is generally higher, but is more fluctuating than the EROI of in situ oil sands. Compared with EROI of other hydrocarbons, the EROI of oil sands is still quite low, despite the fact that it is increasing gradually.
https://www.mdpi.com/1996-1073/10/5/614/htm
Good points Ovi, but consider the relative price increases of natural gas vs oil since the Ukraine war. Price of gas has doubled and oil is up maybe 20%. To get to European prices gas could easily double again in the next few years. If most of your input for a product goes up in price fourfold but the product you sell only goes up 40%, it will be very difficult to compete with the product you sell. Put another way, if you give someone in northern US or Canada the choice to heat their home or drive their car, which do you think they would choose? As gas gets exported tar sands are likely to be left high and dry.
Stephen
Looks like you and I are on opposite sides of the fence on this issue.
We need some base information to work from. Let’s take an average value of 4 for EROEI for SAGD. This means 1500 ft^3 of NG gets 1 barrel of Bitumen that fetches $80/b today for $12 of NG, assuming $8/1,000 ft^3.
According to the latest report from Suncor, the operating costs/b for bitumen is $21.37/b and their net back is $59.95/b.
Assume the cost NG doubled to $16 for 1,000 ft^3. $24 for 1,500 ft^3. Suncor would still net back $36/b. At some point it does become uneconomic. However is $16 on the horizon?
The other question is, is SU paying $8/1,000 ft^3.
Let’s stand back and watch as the future reveals itself.
Yes that was my primary intent, to suggest this is an issue to watch. From today:
“Natural gas prices in Europe are roughly four times as expensive as U.S. natural gas—a ratio that has enticed many U.S. LNG players to export their product outisde the U.S. market.”
https://oilprice.com/Latest-Energy-News/World-News/US-Natural-Gas-Prices-Rise-As-LNG-Exports-Reach-7-Week-High.html
To me this is a more significant story than the rise in oil prices especially as we approach winter. Large consumers of natural gas such as tar sands, fertilizer cos, etc will be adjusting as a new reality sets in.
All Russian oil produced will be sold .
https://gcaptain.com/greece-emerging-as-hub-for-russian-ship-to-ship-fuel-oil-transfers/
The buyers will be getting a great discount.
Yup. There will be problems for 6 months, but there will be willing buyers for every drop after that, hence the 50s handle for the USD to RUB being broached yesterday (1:59 as I write). It will go much further of course (30s, 20s) in time, much to the confusion of many observers.
September is when things begin to accelerate, rumour has it.
You realize the reason the RUB is up on the dollar is because dollar credit hasn’t been cut off right?
There are plenty of large banks that will still do business with Russia. For a small fee of course. Sometimes a large fee. Dollar credit is flowing because there is money to be made on cheap Russia oil.
I think it’s pretty clear dollar credit is still flowing as Russia didn’t default on their dollar debt. Even when a lot of reserves were seized by the FED and ECB.
A strong RUB is a problem for Russia btw. Makes their internal debt harder to pay. It makes exports more costly. Russia has an exporting economy. They have nobody to sell their production to internally. They have no choice but to be a exporter.
If the RUB continues to strengthen it will crush their economy.
Foreign banks gave Russia a lifeline for a profit.
Let’s not view that as a win for Russia. Because with the strong RUB their corporate profits are being squeezed.
HHH
In my assessment, you are a very, VERY knowledgeable person, but on this you have everything, literally, precisely backwards.
But rather than forensically rebut or litigate your viewpoints, I think perhaps best we watch the developments in RUB exchange rates, oil production and the economies in general. Then if, like with your initial predictions re how this would effect the Russian economy, your assessment or mine is shown to be grossly incorrect, then it might be worth the time for us both to exchange ideas. Until then I suspect it’s a waste of both of our time.
Perhaps we chat at USD to RUB of 1:40?
I’m guessing you believe that there will be some sort of commodities back currency?
Eurodollar system was created because commodity backed means of exchange don’t work because they are illiquid. Putin doesn’t really have any levers he can pull to effect the exchange rate. Private banks in foreign countries that lend dollar liquidity get to decide that. And right now private banks are making a killing off Russia. But as recession hits and price of oil goes down instead of up. Then dollar funding provided by private banks goes away from Russia and a whole lot of other places.
Central banks aren’t central to global monetary system. Private banks are.
Saudi Arabia set for oil output capacity above 13 million barrels per day by 2027, minister says
I posted this article on SA increasing their production to 13 Mb/d further up. With all of the skeptics on this board regarding SA production, it never got one comment. Sounds like everyone agrees that SA will be adding 1Mb/d of capacity.
Currently SA is 200 kb/d below the highest level they have sustained for 6 months, 10,600 kb/d. We will know in 4 or 5 months if they will exceed that level for a sustained period.
Wonders never cease to amaze me.
https://www.reuters.com/world/middle-east/saudi-arabia-track-hit-oil-output-over-13-mln-bpd-by-2027-says-minister-2022-05-16/
Ovi, I read the article a day or so before you posted it. I did not post the article or comment on it because “capacity” is just a meaningless buzzword. That is “production capacity” is just a way of saying: “We could produce this much oil if we wanted to, but right now we just don’t want to.”
With oil prices, this high, production capacity is what they are producing right now. When they can produce more, they will. Unless prices collapse, in 2027 Saudi Arabia will be producing every barrel they possibly can. And they will still be claiming they have the capacity to produce more.
Ron
Sounds like SA and Iraq may be adding 200 kb/d of production capacity each year for the next five years. However as I mentioned above, SA is going to be pushing into the SA 12.0 Mb/d spare capacity once they gat past 10,600 kb/d in two months. Their June target is 10,663 kb/d. That was their output in the latter half of 2016. By September. their target will be close to 11,000 kb/d.
For April there is a 95 kb/d difference in SA output between secondary sources and direct communications, secondary sources are lower by 95 kb/d. Will this gap grow gpong forward?
We will keep monitoring
Will this gap grow gpong forward?
Naw, I doubt it. The gap moves up or down every month but never gets too wide. That would make things too obvious.
I have no doubt that Saudi, and the other four, (the big five less Iran), can increase production a little each month simply by doing more infill drilling. But they will hit their limit in a few months, likely before the year is out.
I expect the OPEC 13 to reach their 2019 average level late this year or early 2022. That may be a tall order, however. That is because The OPEC big 5 are already half a million barrels per day above their pre-covid level. The OPEC other 8 are one million barrels per day below their pre-covid level. And they will not get much closer if any than they are right now. They are right on their decline line.
Click on graph below to enlarge.
Ron do you think its technically ‘possible’ OPEC can beat their previous all time high peak (2016 i think). Or will geological limits will hinder their efforts to beat that previous high?
No, they will never get even close to that level again. The OPEC other 8 have declined two million barrels per day from the level they were at that time. And they will continue to decline. That means the OPEC big 5 would have to make up that two million bp/d after they themselves had reached that level. That will never happen.
About 85% of world’s fields are in decline amounting in the range 3-4.5 million barrels per day each year. With the war in Ukraine, the deficit will keep growing and the decline rate as well slowly. Whatever comes from the rest of the world, and the increase in OPEC 4 production will not prevent the world decline. This gig is over.
Seppo, yes that should be obvious to everyone. However, there seem to be some people who, for some strange reason, cannot see the blatantly obvious. Strange! The workinges of the human belief system is a real challenge. How can some people believe some things that are so obviously fantasy.? But I keep trying. It is my passon.
Seppo,
Conventional output has likely peaked in my opinion, but there are a lot of undeveloped resources. About 1400 Gb of conventional oil has been produced abd there are about 477 Gb of conventional producing oil reserves at the end of 2021 and about 700 Gb of non-producing resources (total discoveries through the end of 2021 about 2600 Gb.)
There will be decline, but I expect it will be after 2030.
One potential scenario for World conventional oil in chart below, this assumes extraction rates gradually rise to about the 2008 level of 6% (note that in 1995 the extraction rate was 6.7% and in 1980 it was 11%) from the 2021 level of 5.1% (in 2018 the extraction rate was 5.7%). So a small possibility of a secondary peak, if extraction rates rise and the rate of development of resources remains at the historical level (1918-2021).
Iraq also had to reach 11 or 12 mbd. They have not even reached the half
1/10/2019
The Attacks on Abqaiq and Peak Oil in Ghawar
http://crudeoilpeak.info/the-attacks-on-abqaiq-and-peak-oil-in-ghawar
WELCOME TO THE ENERGY CLIFF…
It’s quite easy to understand when we bring it down to simple math.
Global Oil Discoveries by Year (billion barrels):
2017 = 7.1
2018 = 5.4
2019 = 6.2
2020 = 7.0
2021 = 3.1
Total = 28.8
Annual Average Global Crude Production for the past 5 years = 29.2 billion barrels
5 years of discoveries are consumed each year… LOL
steve
Srsrocco
Did you scale the green bars to get those numbers?
Ovi,
I used the KISS principle. I just used Rystad Energy’s GAS-OIL RATIOS shown below the Billion BOE. While Gas is in BOE, oil is a regular Oil Equivalent.
For example, for 2021, total Gas-Liquids Discovered was 4.7 BOE. Rystad stated the Gas:Oil Ratio was 34:66. Thus, 4.7 multiplied by 0.66 = 3.1 Billion Barrels Oil Liquids.
Was my methodology correct?
steve
Srsrocco
Thanks. You have always been at the top of the class. I did not see that the GAS/Liquids ratio was listed
Note that in most cases we also see reserve growth which adds to reserves along with new discoveries. For the US from 1980 to 2005 (before tight oil was adding significantly to reserves) US reserves grew by 63% and the US had amongst the most mature reserves in the World, during that period.
Tidbits from from Bloomberg report on plugin vehicles-
Zero-Emission Vehicles Progress Dashboard
-Global oil demand in road transport reached roughly 43.7 Mbpd in 2021
-The adoption of electric vehicles and fuel cell vehicles avoided almost 1.5 Mbpd in 2021 [about 3.3% of total demand]
-Two- and three-wheeled EVs accounted for 67% of the oil demand avoided in 2021. This is due to their rapid adoption particularly in Asia.
-In BNEF’s Net-Zero Scenario, which achieves a zero-emission vehicle fleet globally by 2050, oil displacement increases to over 7 Mbpd in 2030 – roughly equivalent to Russia’s total oil and products exports prior to the war
note- this info pertains to ‘ZEV Transition Council countries’, and does not include the big guy- China
https://assets.bbhub.io/professional/sites/24/BloombergNEF-Zero-Emission-Vehicles-Progress-Dashboard-May-2022.pdf
Some countries have may made big progress on weaning from transport oil, but most have made close to zero progress
ShaleProfile updated their page on May 20.
Interesting that they chose not to do a Permian update.
EIA tight oil data is out, big revision from last month, this seems to occur every month lately. OLS trend for past 12 months is an annual increase of 395 kb/d for US tight oil. The three month trend is an annual increase of 1000 kb/d, the 6 month trend is an increase of 10 kb/d, I have said elsewhere I think the 12 month trend gives us the most information, but depending on what we pick we could have anything from 10 kbpd to 1000 kbpd. As always the future is not knowable.
This is amazing. Eyeballing your chart, last month’s production estimate was off by almost 100 K barrels per day. How could possibly have miss guessed by such a huge amount? That was a rhetorical question. Please don’t feel obliged to reply. 😉
Ron,
The most recent two months have been revised quite a bit for the past 4 months or so. Notice that earlier months (Sept 2021 to December 2021 were revised higher though by smaller amounts) the estimates have not been very good lately.
Ron,
I pulled up the estimate from February 2022 abd compare with the April and May 2022 tight oil estimates. The estimate for Jan 2022 was too high by 200 kb/d in Feb 2022, but note that September to October 2022 were too low by about 100 kb/d in the February 2022 estimate, these estimates change over time, especially the most recent 9 to 12 months of the estimate.
Often it is claimed that GOR is increasing in the tight oil plays, based on EIA data the GOR for all unconventional oil in the US is in chart below,
For Permian basin the GOR is in chart below.
https://www.eia.gov/naturalgas/data.php#production
https://www.eia.gov/petroleum/data.php#crude
GOR for largest 4 tight oil plays (Permian, Bakken. Eagle Ford and Niobrara).
https://nypost.com/2022/05/19/washington-state-preps-for-10-gas-stations-run-out-of-fuel/
Washington state gas stations run out of fuel, prep for $10 a gallon
Not accurate. I live in that state.
Info originated on conservative talk radio- more of a belief system than a source of fact, just like throughout the rest of the country.
Gas stations are open throughout with no lines.
Price is roughly 20% higher than last year.
Don’t interrupt his conspiracy theory with facts!
Conspiracy theory? I just posted a link. I didn’t write the article.
” I just posted a link. ”
Be very careful with that, i suggest.
Everyone’s credibility is at stake.
If everyone “just posted a link” without skepticism and verification
we could end up with a buffoon and/or authoritarian for president
or going to war under false pretense,
for example.
Ok…I’ll be super duper careful next time.
I’m sure an authoritarian dictatorship will emerge because I posted a link about gas prices on website whose focus is oil.
thanks for the heads up!!
https://news.yahoo.com/no-washington-not-fuel-gas-235743834.html
to your credit!!
Its a big challenge for all of us.
Separating real from trash.
Since I’ve been alive two US invasions have been started or escalated based on false pretense directly from the oval office- both massive disasters [VietNam and Iraq]
And crap spreads fast these days.
Conspiracy theory? I just posted a link. I didn’t write the article.
An actual internet link? Well it must be true. I mean they would publish lies in the internet would they?
An actual journalist looked into these claims, looks like it’s all guacamole:
“KIRO7′s Deedee Sun looked into the facts behind the headlines.
There is something unusual about the 76 gas station that’s family-owned by Small and Sons – it sells specialty racing fuel that’s 100 octane. Operations manager Jeff Small says rising fuel prices mean they did have to adjust the pump display when prices for the specialty gas topped $10 per gallon. However, he says national headlines picked up on a story that misrepresented the situation – and it went viral.
“They completely spun it from what our conversation was,” Small said.
Small said since then, he’s been getting dozens of calls from around the country this week.
“It was on Fox news, I guess, and that’s when everything really started rolling in,” Small said. “It was kind of frustrating after that point, getting phone calls — not knowing with today’s climate and social media, what would happen to our little station, you know?”
“Another piece of misinformation circulating? Several media reports say Washington State is running out of gas. There is a photo circulating from a Pasco gas station in Eastern Washington that has a “out of fuel” sign. KIRO7 called the station, which said it’s just because of a missed delivery.
KIRO7 also reached out to AAA Washington to check on fuel supplies for the state.
“We are not facing any kind of shortage. We have a good supply,” said Kelly Just, with AAA Washington. She said while the war in Ukraine is driving up prices, it’s not causing supply to dwindle – in Washington or nationwide.
“We’re not in a position to see shortages by any means,” Just said.”
Sorry Alim,
I posted a link without performing a peer reviewed analysis.
But I admitted my mistake.
I’ve been reading your posts, you shouldn’t be giving lectures!!
My guess is yields on long bonds 10 years + have peaked. And as recession starts to get priced in everybody will pile back into long term treasuries forcing yields towards zero.
This is a problem for the FED. As inflation is still running hot. And they are hell bent on raising short term rates. While long term rates will fall.
My opinion is we don’t have to wait very long before next major recession and market crash. It’s going to break in next 3 months. And maybe price of oil spikes to a higher high before then. But it doesn’t last.
A typical thread on twitter from the guys at the sharp end.
https://twitter.com/andy_oilman/status/1528808940640911361?t=zFII1GEiCvClse3rc8OBqg&s=19
Russian oil output in mid-May was 830,000 barrels a day lower than in February, according to calculations based on data from the Energy Ministry’s CDU-TEK unit . Rosneft projects, including assets run by subsidiary Bashneft PJSC, accounted for 560,000 barrels a day of the drop, the data show.
https://energynewsbeat.co/?p=14461
Biden administration has not ruled out curbs on exports to ease fuel prices, Granholm says
https://energynewsbeat.co/?p=14469
The title of the Granholm piece is somewhat misleading, what she said is that no tools have been taken off the table. Hopefully Granholm knows that restricting crude exports will have the affect that I claim rather than the simple minded thinking of the reporter.
Reducing US exports might actually increase fuel prices for consumers. The oil that is exported is mostly tight oil which refineries do not have the capacity to utilize. US will still need to import the appropriate types of crude that is matched to existing refinery capacity, By taking the tight oil off the tight World market there will now be more competition for conventional crude with heavier weights and the price of those crude imports will increase.
So essentially restricting crude exports might raise prices of crude imports, while hurting tight oil producers who will see lower prices for their product.
In addition, tight oil producers will complete fewer wells in response and there is a lot of associated gas produced by the tight oil plays, so on top of higher gasoline and diesel prices we might see natural gas prices increase as well.
In short, this would be a dumb move by the Biden administration, unless the idea is higher energy prices and handing over the House and Senate to Republican majorities in the fall elections.
From the article on Russia:
This month, Russia’s oil industry is showing signs of adjusting to the restrictions and output is rising. Rosneft is leading the way, making up for a drop at other companies.
Yuganskneftegaz’s output rose by almost 350,000 barrels a day in the first 15 days of May, compared with the prior month. Bashneft, however, continued reducing its output this month with total loss in production of more than 170,000 barrels a day by mid-May compared with February.
“The pickup in Rosneft’s production in May could be a result of new export deals in Asia as well as a recovery in domestic fuel demand,” Katona said.
Russia’s oil output is set to keep recovering through June after the country’s producers diversified their export destinations, according to Deputy Prime Minister Alexander Novak.
A new post by Bob Meltz (aka SouthLaGeo) has just been published
https://peakoilbarrel.com/gulf-of-mexico-update/
and a new open thread non-petroleum
https://peakoilbarrel.com/open-thread-non-petroleum-may-25-2022/