Through 2021 the federal waters of the northern Gulf of Mexico (OCS) have cumulative production of 23.4 Bbo and 193 Tcf. The deepwater (water depths > 1000’ as defined by BOEM) has produced 10.2 Bbo and 23.5 Tcf while the shelf has produced 13.2 Bbo and 169.5 Tcf. From a BOE standpoint, the GOM has primarily been a gas province, and the bulk of that production has come from shelf fields. While the shelf has produced more cumulative oil than deepwater, over 90% of current oil production comes from deepwater fields.
First production from the OCS occurred in 1947. First deepwater production was in 1979 from Shell’s Cognac field in 1022’ of water. GOM oil production in December 2021 was 1.69 mmbopd as per BSEE. As Ovi says in his monthly updates, if GOM were a state, it would be the 2nd leading oil producing state in the US, only behind Texas.
Brief history of GOM gas production
GOM gas production peaked in 1997 at 14.4 bcf/day and has been declining ever since. Current gas production is about 2 bcf/day.
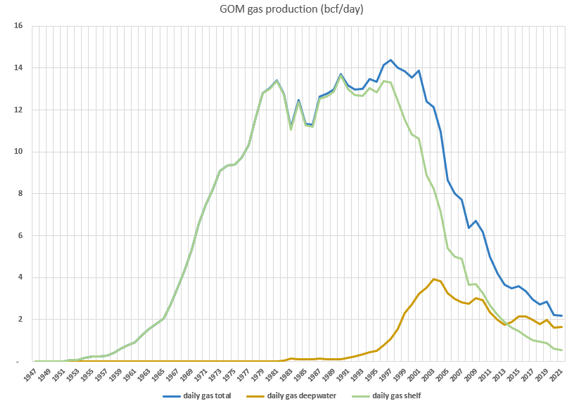
Figure 1 – GOM gas production, with shelf and deepwater broken out. Data from BOEM.
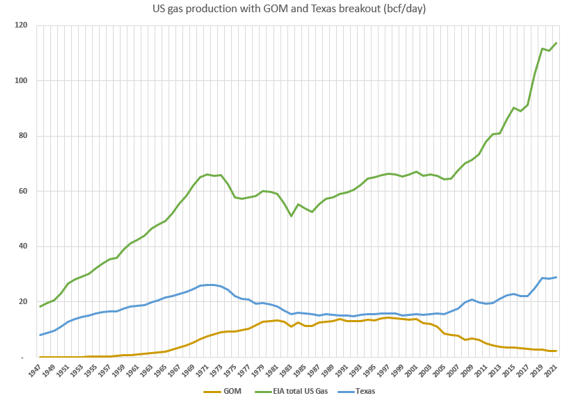
Figure 2 – US gas production (EIA data) with breakout of GOM (BSEE data) and Texas (EIA data).
One of the more significant seismic advances occurred in the late 70s-early 80s. This is when geophysicists recognized that a gas accumulation can often generate an anomalously high-amplitude seismic response, or a “bright spot”. Intentionally looking for bright spots, and high grading prospects based on bright spot quality was a big contributor to the abundance of gas produced in the 80s, 90s and 00s.
Also, 3D seismic became more and more common from the late 80s onward to where now almost the entire GOM is blanketed with 3D surveys. Any current drilling activity is supported by 3D.
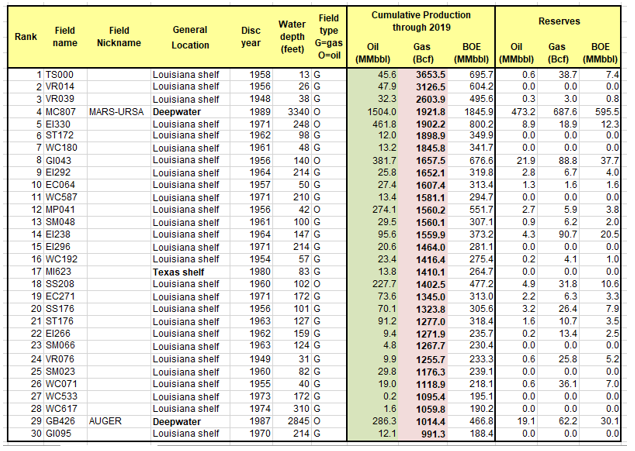
Table 1 – 30 largest gas fields in the GOM through 2019. Data from BOEM.
The table above shows the 30 largest gas fields in the GOM through 2019. 29 have cumulative gas production over 1 tcf. 27 are on the Louisiana shelf, 1 is on the Texas shelf and 2 are in deepwater. 24 are classified as gas fields and 6 as oil fields. The field with the largest remaining gas reserves as per BOEM is actually a deepwater oil field, Shell’s massive Mars-Ursa complex.
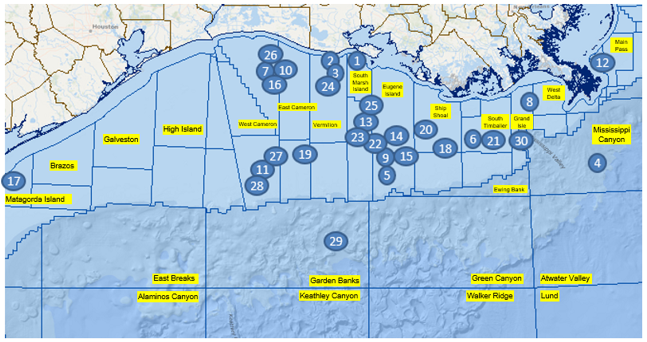
Figure 3 – Map showing the distribution of the 30 largest gas fields in the GOM. Numbers refer to fields in Table 1. Many of the protraction areas are labeled. The shelf protraction areas all have “south additions” which are not labeled (e.g. Ship Shoal area, south addition is south of the labeled Ship Shoal protraction area.)
The map above shows the 30 largest GOM gas fields. Many of them are located on the Louisiana shelf. The thickest sediment accumulations in the GOM occur in this area. I suspect the burial depth of the source rocks has contributed to the gas abundance in this area – meaning the source rocks are buried deeper than the oil window, into the gas window. In addition, there also are numerous shallow biogenic gas accumulations that have been produced.
In conclusion regarding gas: Will current high natural gas prices cause a resurgence of gas drilling in the GOM? Maybe a bit, but nothing too substantial. I just don’t think the geology supports it. One interesting thing to consider though, is that there is a deep shelf gas exploration play that never really took off before prices crashed. Perhaps this will be revisited.
Update on GOM oil production
Figure 4 shows GOM oil production, with shelf and deepwater broken out. Deepwater production surpassed shelf production in 2000, and it has been dominant ever since. Based on these trends, I predict in 2027 or so deepwater cumulative oil production will exceed shelf cumulative oil production.
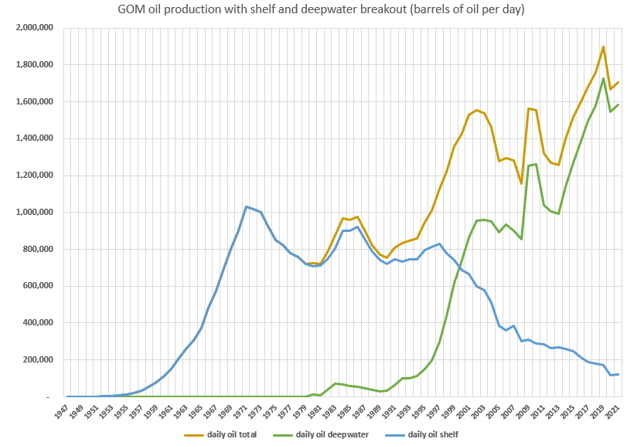
Figure 4 – GOM oil production with shelf and deepwater broken out. Data from BOEM.
Table 2 shows the 30 largest cum oil fields in the GOM, with production through 2021. 12 of the fields are in the deepwater and 18 are on the shelf. Shell’s Mars-Ursa complex is by far the largest field, but it includes multiple fields. In BOEM’s accounting, they have combined a number of additional deepwater fields including Tahiti and Caesar-Tonga, and King and Horn Mountain.
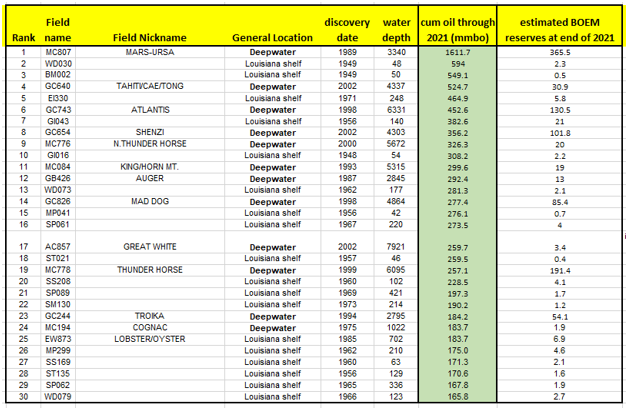
Table 2 – 30 largest GOM oil fields. Data from BOEM. Estimated reserves are mine – determined by subtracting 2020 and 2021 production from BOEM’s yearend 2019 reserves.
Figure 5 shows the distribution of the 30 biggest GOM oil fields. Note how a great number of the shelf fields are concentrated just offshore southeast Louisiana over to the Mississippi River delta. These fields are associated with, and adjacent to, the Terrebonne trough. This prolific oil trend continues into the onshore and state waters portions of southeast Louisiana and is one of the sweetest of sweet spots in the greater GOM basin. 12 of the 30 biggest GOM fields are in this trend with cumulative production of over 3.6 BBO, and this doesn’t include the onshore or state waters fields, or the numerous smaller fields. (Technically, the east edge of the Terrebonne trough is roughly the west edge of the Mississippi River delta. For this discussion I’m extending further east to include the Main Pass fields.)
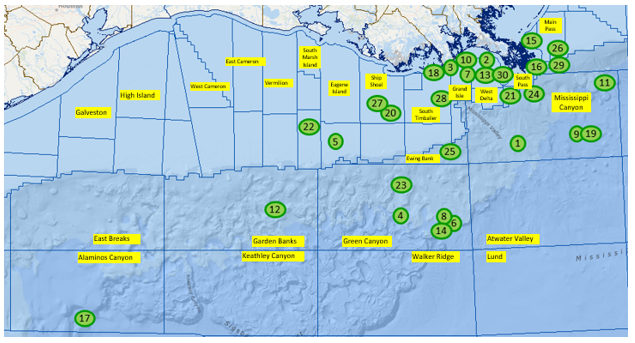
Figure 5 – Map showing the distribution of the 30 largest oil fields in the GOM. Numbers refer to fields in table 2.
Gulf of Mexico oil producing sweet spots
As one can see from the 2 maps above, there are some patterns to the distribution of both the biggest gas fields, and the biggest oil fields. They are not uniformly distributed around the offshore GOM basin. I define a Tier 1 oil sweet spot in the offshore Gulf of Mexico as an area that can be described geologically as having numerous petroleum system element similarities (such as similar structural styles, similar age reservoirs and probably a common source rock) and where the cumulative oil production, or anticipated cumulative oil production, has exceeded, or can be reasonably expected to exceed, 2 billion barrels. A Tier 2 sweet spot can be expected to have cumulative production between 1 and 2 billion barrels of oil
The previously discussed Terrebonne trough is a Tier 1 sweet spot. Cumulative production from just the biggest fields is over 3 billion barrels. It is very mature and future production will be, in my opinion, negligible. 12 of the 30 biggest fields are in this trend, and they have estimated remaining reserves of 44 MMBO. Many of these fields are salt dome related, reservoirs range in age from shallow Pleistocene to deep Miocene, and most of the pay is normally pressured. Production from this trend began in the 1940s.
The remaining Tier 1 sweet spots are in deepwater. One is the subsalt Miocene trend of southeast Green Canyon. Cumulative production from this trend is 1.9 Bbo. Production from this trend started in 2005 when Mad Dog and K2 came on line. BOEM’s remaining reserves for these fields is 692 MMBO. Four of the biggest GOM fields – Tahiti-Caesar/Tonga, Atlantis, Shenzi and Mad Dog – are in this trend. The most significant remaining project to come on line will be Mad Dog 2 where first oil is expected in late 2022. (I place Murphy’s recent King’s Quay project just to the north of this sweet spot.) These fields are all either completely, or at least mostly, subsalt. The reservoirs are all Middle to Lower Miocene deepwater channels or fans and the structures are either large faulted 4-way closures or 3-way closures against salt. I expect the ultimate cumulative oil production from this trend to be close to 3 billion barrels.
Another Tier 1 sweet spot is the greater Mars-Ursa Basin. BOEM lumps Mars, Ursa and a few nearby fields into one entity, which has cumulative production of 1.6 BBO and is clearly the biggest field in the GOM. If you include the nearby fields – Crosby, Europa, and Kaikias – cumulative production to date from the greater Mars-Ursa basin is 1.8 BBO. Production from this trend started when Mars came online in 1996. Remaining reserves for this trend are 843 mmbo, with most of those reserves split between Mars-Ursa and Vito. The most significant remaining project to come online in this trend is Shell’s Vito where first oil is expected in late 2022.
The remaining Tier 1 sweet spot is the Wilcox in Keathley Canyon, Walker Ridge and Green Canyon. Even though this sweet spot covers a pretty large area, the prospects share petroleum system elements such as similar reservoirs and source rocks. This trend includes the Wilcox producing fields outside of the greater Perdido Fold Belt area, and a number of developments set to come on line within the next few years. While cumulative production to date for this sweet spot is only 468 mmbo, I expect the midcase EUR to be 2-3 Bbo.
For those interested, below is a link to a recent Wilcox update I did.
Update on the Wilcox in the Offshore Northern Gulf of Mexico – Peak Oil Barrel
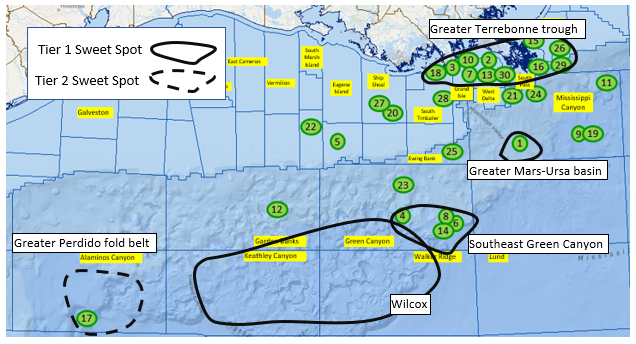
Figure 6 – My interpretation of Tier 1 and Tier 2 oil sweet spots. Tier 1 – ultimate cum oil > 2 Bbo. Tier 2 – ultimate cum oil 1-2 Bbo
The Greater Perdido fold belt area in Alaminos will become, I believe, a Tier 2 sweet spot. Cumulative production to date is 260 mmbo, from Shell’s Perdido’s host facility, but there are 3-4 future projects with most likely recovery in the 800 mmbo to 1.2 bbo range. Those include Whale, Blacktip, Leopard and Blacktip North.
I’m currently not convinced that the Norphlet trend will ultimately become a Tier 2 sweet spot, although this is subject to change. This trend would be just south of field 11 on Figure 6 above. As per an assessment done by Talos Energy, as of 2019 23 Norphlet exploration wells had been drilled and 9 were classified as discoveries. Since then, only Shell’s Appomattox and Vicksburg discoveries have come on line via production to a new facility, (with cumulative production through 2021 of 71 mmbo) and Chevron’s Ballymore will get developed via a tieback to nearby Blind Faith. No development plans have been announced for any of the other discoveries, which were all made by Shell. If some of these do end up getting sanctioned, then I think the cumulative production from the Norphlet can exceed a billion barrels.
The greater Thunderhorse area, fields 9 and 19 in figure 6, is another area that I’m not convinced yet is going to have cumulative production over a billion barrels. BP’s Thunderhorse and Thunderhorse North have cumulative production to date of 583 mmbo, and BOEM’s remaining reserves are 211 mmbo. Current production from the Thunderhorse fields is about 100 kbopd, and BP anticipates production increasing to about 200 kbopd over the next few years as the Thunderhorse South project comes on line, but I believe the reserves for that project are already included in BOEM’s assessment.
One could argue that numerous shelf protraction areas outside of the Terrebonne trough fields could be classified as Tier 2 sweet spots. For example, the Eugene Island fields have the largest oil cum of any shelf protraction area of 1.7 Bbo. I have decided to not include that area, for example, because the fields don’t share enough petroleum systems elements to warrant being classified as a sweet spot. Also, since my focus here is more on future GOM production and ultimate EURs, the shelf protractions are long past their peak in oil production and won’t, in my opinion, be contributing much in the years to come.
How much of a difference will offshore lease sales make?
Some have argued that the lack of offshore lease sales will have a big impact on future GOM production. For example, the National Offshore Industries Association has said GOM production could be reduced by 50% by 2040 if the offshore lease sale ban continues. I’m not quite as pessimistic. Oil production could be reduced 50% by 2040, but, if that happens, it will be due to geology as much as due to a lack of lease sales. It’s a question to me of how many substantial prospects are there out there that industry has missed. The Gulf of Mexico has had annual area-wide lease sales for most of the years going back to 1983. (Before 1983, leases had to be nominated by industry prior to a sale to be considered in a lease sale. Far fewer leases were available for industry to bid on in these pre-1983 lease sales.) That’s almost 40 years of area-wide annual lease sales. How many bites at the apple does industry need? Many of the leases that have been getting picked up by industry in recent sales have already been leased at least one time, and then they have been dropped because either a dry hole, or non-commercial discovery was drilled, the prospect on the lease didn’t stack up against the inventory of prospects the operator had at the time, or it was picked up as protection acreage. These clearly aren’t, and never were, the most prospective leases in the Gulf. The exceptions to this are that new play concepts and advances in seismic imaging technologies can make non-prospective leases prospective. I believe this has resulted in, for example, the recent discoveries Shell has made in the subsalt portions of the Perdido fold belt. I haven’t seen evidence of any more examples of this. And these prospects are all going to be deep, difficult to appraise, and expensive to develop.
Now one could argue that the industry hasn’t had the technology to drill and produce from the deepest high temperature and high pressure plays for the last 40 years. Fair enough – those technologies have been developed over the last 10-15 years or so, and, in fact, the first HT-HP field is yet to come on line, notably Chevron’s Anchor. But again, if there are prospects like that still out there, they will be deep, difficult to appraise, and expensive to develop. Another HP-HT field that was thought to get sanctioned, TotalEnergie’s North Platte, was recently deferred because it didn’t stack up against their queue of other global projects.
Also, most oil companies have enough undrilled leases in their current inventories that they can continue drilling exploration wells for at least 2-3 years. After that, industry will probably start running out of exploration prospects, but the question is: Are there still attractive undrilled prospects out there, after 40 years of lease sales, that industry has just over-looked?
(In my review of recent GOM discoveries, I found that the most recent lease sale where a block was acquired, and a recent significant discovery was made was the August-2017 sale. Shell acquired Alaminos Canyon 336 in that sale, and in early 2021 made the Blacktip North discovery on that lease. Since then, there have been 6 sales – 2 in 2018, 2 in 2019 and 2 in 2020. I’m not aware of any discoveries that have been made on any of the leases picked up in these sales. The one in November 2021 was the on-again/off-again sale. My point here is that industry has had ample opportunities to pick up leases.)
Of late, industry has been focused on near-field exploration because of quick turn-around. A discovery made near existing infrastructure can be tied back and brought on-line much more quickly than a frontierish type of discovery that needs a new facility. Almost always these near field discoveries are small. If those same volumes were discovered in an area lacking infrastructure, it would be called a non-commercial discovery. There still are, probably, a queue of these types of discoveries remaining to be made, but, this queue is also getting smaller and smaller.
In my projections of future GOM oil production, I don’t make any specific considerations about whether future lease sales happen or not, although in my high side estimates, future lease sales are baked in (and the related new discoveries of mostly small but some decent sized reserve ranges), while in my low side estimates, there are no future lease sales, or, at least, no significant discoveries if lease sales continue.
Now if the entire eastern GOM were made available for leasing, this story changes. But there are no signs of that happening.
Estimate of future production and EUR ranges from the GOM
The queue of high impact projects set to come on line in the GOM over the few years is quite attractive and includes King’s Quay (just came on line), Mad Dog 2 (2022 first oil), Vito (2022), Anchor (2024) and Whale(2024). All 5 projects have dedicated new facilities with capacities ranging from 75 to 140 kbopd. Table 3 shows those these 5, plus 2 other projects, that should come on line before 2025 with most likely reserves of at least 100 mmbo. 6 of these developments include new facilities. The last, Thunderhorse South, will be tied into BP’s Thunderhorse facility. Note that the total new facility capacity is over 700 kbopd.
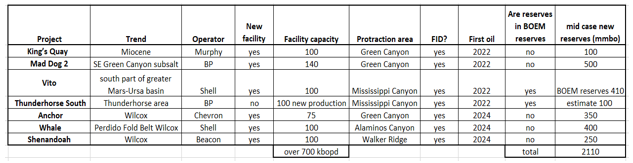
Table 3 – 7 projects with at least 100 mmbo of most likely reserve potential that will be developed in the deepwater GOM with first oil before 2025,
The new production coming from the projects above will result in a new annual peak in GOM oil production between now and 2030 or so, and it is possible this peak will exceed 2019 peak of 1.9 mmbopd.
After these projects, the remaining significant identified projects are in Table 4.
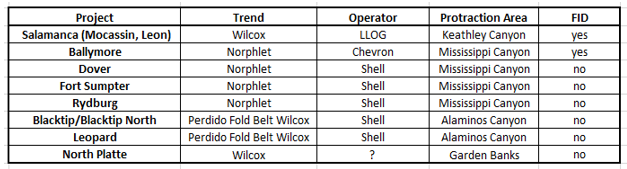
Table 4 – Remaining significant identified projects in deepwater GOM. FIDed projects will get developed. Development decisions have not been made on the others. Note that TotalEnergies recently withdrew from North Platte.
I believe the era of significant deepwater megaprojects is nearly over in the GOM. After the projects referenced above come on line, I don’t see much more megaproject activity in the GOM. The link below is to a recent SPE article by Blake Wright on this topic.
Is It Twilight for Deepwater US Gulf Megaprojects? (spe.org)
As mentioned in the article above, part of the reason for this is because of the lack of significant discoveries. My Figure 7 below, from Wood Mackenzie, and also referenced as Figure 3 in Wright’s article, shows how discovered volumes in the GOM have been dropping over the last 4-5 years. Some would argue this is because of low oil prices, and that discovered volumes are low because of fewer exploration wells. I disagree – I think it’s primarily because of geology. But, with the current high oil prices, let’s see if operators start making more significant discoveries. If industry starts seeing year after year of 1 Bbo+ in discovered reserves (or even 500 mmbo per year), then I will have been proven wrong. (But what about the lack of lease sales discussed above? If the lack of discoveries is due to the lack of drilling because of low prices, as some think, then companies should have a good queue of undrilled exploration prospects to drill now with high oil prices.)
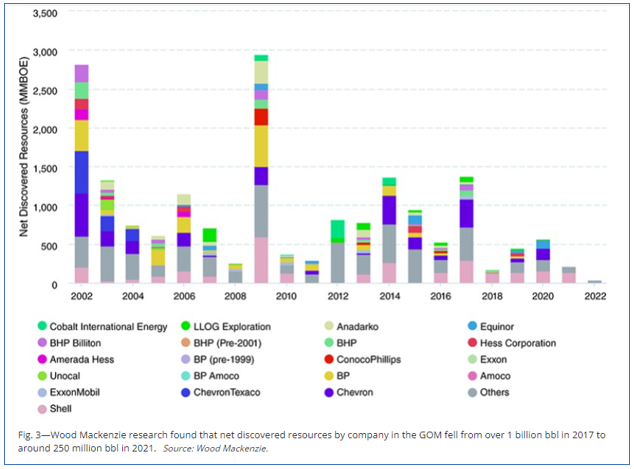
Figure 7 – from Wright SPE article referenced above.
Figure 8 shows my low-mid-high range of predictions of future production from the GOM. I have also included a recently released EIA estimate of GOM production out to 2050, from their March 2022 Annual Long Term Energy Outlook. The EIA estimate stopped at 2050, so I started decreasing their production at the annual rate of 100 kbopd until I got down to 0 production.
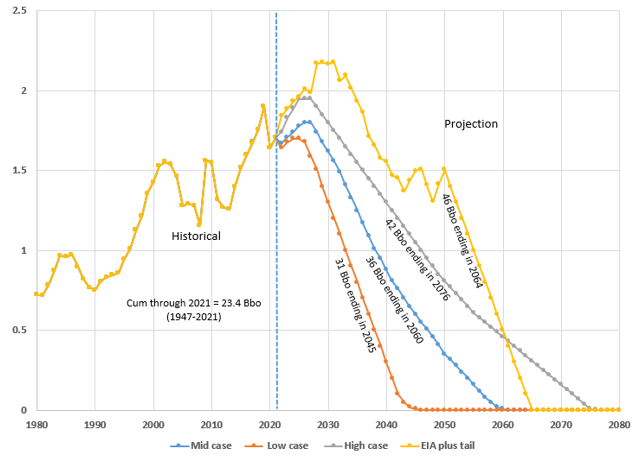
Figure 8 – GOM oil production from 1980 to 2021 and my projections out to 2080 in mmbopd. Included is my edited EIA estimate, which takes their projection to 2050, and then reduces it by 100 kbopd per year til 2064.
In all cases, I see production increasing to a new peak. This new peak ranges from 1.7 to 2.18 mmbopd (EIA estimate), and in both my high side case and the EIA case, the previous peak from 2019 is exceeded.
EURs ranges are 31, 36 and 42 Bbo in my low-mid-high cases, and the edited EIA EUR is 46 Bbo. Among other things, the low side outcome assumes either lack of future lease sales, or lack of material discoveries from future lease sales. The upside case assumes numerous significant discoveries from either industry’s current lease inventories, or from leases picked up in future sales.
BOEM’s UTRR (Undiscovered Technically Recoverable Resources) from their 2021 update for the entire GOM is 29.6 Bbo (from Jan. 1, 2019 data). This is down from about 48 Bbo in the 2016 assessment. Significant discoveries since then include Blacktip, Leopard, Monument and Blacktip North. Any other announced developments are from discoveries made prior to Jan 1 2019. If you include just the Central and Western GOM, their UTRR drops to 24.7 Bbo. 24.7 Bbo plus the 21.4 Bbo cum at the end of 2018 give a total EUR for the GOM of 46.1 Bbo. That is, in my opinion, pretty high, even for a high side estimate, but it is in line with my edited EIA EUR.
For those interested, comparison to my 2016 GOM production post.
This post is an update to one that I did as SouthLaGeo back in 2016. Below is a link to that post. I initially promised Dennis I would do this update in 2018, but,,, oh well. If I keep this pace up, my next update would be in 2028. Given the divergence in the production profiles in 2028, that would be a very interesting update. Even a 2025 update would be interesting.
Overview of the Northern Deepwater Gulf of Mexico – Peak Oil Barrel
I include this primarily to show how my EURs and production profiles compare, but for those interested, there is more geology in the 2016 post. Below is a chart showing my low case, mid case and high case projections from 2016 included with the data from the chart above. I know the chart is busy. Hopefully you can see through everything.
My 2016 EUR ranges were: low case 30 Bbo, mid case 37 Bbo, high case 47 Bbo. Interestingly, my mid and low EUR ranges have not changed too much, but my high side has come down a fair bit. The profiles in all cases certainly have changed. I clearly under-predicted future production, and my current profiles show production dropping off more quickly.

Figure 9 – Production profiles from my 2016 posting as SouthLaGeo compared to 2022 profiles.
122 responses to “Gulf of Mexico update”
The many facets of peak oil
25/5/2022
Australian fuel import bill going sky-high
https://crudeoilpeak.info/australian-fuel-import-bill-going-sky-high
Thank you Bob for a great post!
For some background on recent government resource evaluations there is a BOEM 2021 GOM Undiscovered Resource assessment at link below
https://www.boem.gov/sites/default/files/documents/regions/gulf-mexico-ocs-region/resource-evaluation/2021 Gulf of Mexico Oil and Gas Resource Assessment (BOEM 2021-082).pdf
Discovered oil resources are estimated at 38.4 Gb, this includes cumulative output and remaining reserves (27 Gb at the end of 2020), as well as contingent resources and reserve growth (see page 28 of the report, figure 9).
Mean UTRR is estimated at 29.6 Gb (also figure 9 on page 28). The F95 UTRR is 23 Gb and the F5 UTRR is 38 Gb (page 31 of report linked above). For TRR the mean estimate is 68 Gb with F95 TRR=53 Gb and F5=76 Gb.
Switching to economically recoverable resources (ERR) on page 37 of the report linked above, at $60/bo and $3.20/Mcf for natural gas ERR=58 Gb and at $100/bo and $5.34/Mcf natural gas, ERR=62 Gb, at $30/bo and $1.60/MCF natural gas, ERR=46 Gb.
Note that there was a very large revision in BOEM mean estimates from 2016 to 2021, from a mean total resource estimate of 77 Gb in 2016 to 68 Gb in 2021. Perhaps in 5 years the BOEM will revise its estimate again to 9 Gb less than previously to 59 Gb. Note also that Mr. Meltz’s high case in 2016 was about 61% of the BOEM mean estimate and in this most recent evaluation the high case is about 62% of the BOEM mean estimate. For the mid case scenarios in 2016 it was 48% of the BOEM mean TRR estimate and currently about 53% of the mean BOEM TRR estimate.
More info at
https://www.boem.gov/oil-gas-energy/resource-evaluation/undiscovered-resources#tabs-1687
Dennis,
Thanks for your comments. Regarding the 38 Bbo of “discovered oil resource” – that is comprised of cum oil, remaining reserves from producing fields and contingent resources. By my calculation, the contingent resource component is around 11 Bbo. This includes projects that may be applied to recover additional resources from known accumulations – things like water floods, infill driling, CO2 floods, etc. In my opinion, there is no way that anything more than a fraction of that 11 Bbo will ever be produced (remember the deepwater GOM has already produced 10 Bbo). The successful waterflood that is currently occurring on the WM12 reservoir at Great White may be one example where some future contingent resource could be added – maybe another 100 mmbo or so – that is the only example I can think of here. (Great White is one field where BOEM’s reserves are pretty low). There are other water floods occurring in the GOM, but either they aren’t too successful, or I believe the water flood reserves are already included in BOEM’s reserves.
Infill drilling – there might be some uplift here, especially with high oil prices – some operators may get back in the mode of chasing production, rather than value, and engage in infill drilling campaigns. It’ll add some EUR, but not much. But note how so many operators, at least now, even with high oil prices, are not in that “chase production” mode.
10-15 years ago some operators were looking at CO2 floods in the GOM – primarily in the low perm Wilcox, but I don’t think that will ever happen.
Now regarding BOEM’s UTRR assessment of 29.6 for the GOM – I think I addressed my view on this in the post. Certainly some new discoveries are baked into my mid case EUR of 36, and even more in the high side of 41. I just can’t see where over 20 Bbo of new discoveries could come from, in what I think is a fairly mature basin (even 10 Bbo).
And realize that BOEM’s 29.6 Bbo of undiscovered technically recoverable resource is already a risked number. If you dig into their 2021 assessment, referenced above by Dennis, you can see the risk factor they applied to all of the 30 plays they looked at. For example, they applied a 25% POS to the deepwater Wilcox, which is by far their biggest contributor : 9 Bboe of the 29.6 comes from the deepwater Wilcox.
Some of the trends they include have never been tested in the offshore GOM, and may never be tested (like the offshore Sunniland, or the pre-salt), and the fine folks at BOEM know this. So I don’t feel like I’m doing them a disservice by not including their UTRR in my EUR calculation, even in the upside case. Page 29 (page 38 in pdf format) has BOEM’s estimated contribution of all of the 30 play types to the overall UTRR, on a boe basis.
Bob Meltz,
Note the difference in the resource charts in the 2016 report vs the 2021 report, in 2021 they call the discovered resources “grown” and in 2016 they say they are “not grown”. Unfortunately they do not clarify this anywhere in the text, so I may be incorrect. What do you think the distinction is between “not grown” and “grown” (figure 9, p28 of 2021 report and figure 19, p32 of 2016 report) discovered resources. Clearly the cumulative production would remain the same (those do not grow over time typically), but often reserve and contingent resources do tend to increase as fields and plays are developed.
The 2021 report uses data from the end of 2018, see page 1 of the 2021 report:
utilized internal geological and reservoir engineering data from BOEM-designated oil and gas fields as of the end of 2018.
Unfortunately we do not have contingent resources specified anywhere, the last estimate of these comes from the 2016 resources report where we estimate contingent resources at 4.5 Gb at the end of 2013 (data used for 2016 report is from the end of 2013). If we assume contingent resources are the same at the end of 2018 (in the absence of any data) and also assume “grown discovered resources” includes reserve growth, the I would estimate that reserve appreciation for the 2021 report is about 9 Gb in the “grown discovered resources” estimate of the 2021 report. This is a shift from the methodology of the 2016 report where reserve appreciation was included as part of the UTRR. Or that is my interpretation.
At the end of 2018 BOEM has cumulative output of oil at 21.42 Bbo and remaining reserves at 3.44 Bbo, adding these together we get 24.86 Bbo. Grown Discovered oil resources in the 2021 resource report are estimated at 38.409 Bbo. If we assume zero reserve or contingent resource appreciation in the future, then this would suggest contingent resources of 13.5 Bbo.
I would agree this is too large a number for contingent resources, but believe that the “grown” discovered resources includes reserve and contingent resource appreciation. My estimate is contingent resources are 4.5 Bbo and reserve and contingent resource appreciation is about 9 Bbo.
I understand the BOEM has used risked estimates, but note that their UTRR and UERR estimates take account of the low success rates anticipated in many of the plays. They have carefully modelled past reserve and contingent resource appreciation over time. Generally scientists and engineers are pretty conservative in their assessments, it is surprising how different the assessments an be.
Dennis,
I’m not sure why BOEM says “not grown” in the 2016 assessment, and “grown” in the 2021 assessment. I can’t see anything in the material that describes that difference. The cumulative production would change. Cum production at the end of 2018 was certainly higher than at the end of 2013.
At YE 2013 – reserves were 3.7 Bbo, there were 1300 fields, cum oil was 18.5 Bbo, discovered resource in the 2016 update was 26.7 Bbo, so I calculate contingent resource to be 4.5 Bbo.
( 26.7 – (3.7 plus 18.5))
At YE 2018 – reserves were 3.4 Bbo, there were 1319 fields, cum oil was 21.4 Bbo, discovered resource in the 2021 update was 38.4 Bbo, so I calculate contingent resource to be 13.5 Bbo, and I calculate that the growth in reserves was 3.1 Bbo (some from new fields and some from revisions to existing fields).
The contingent resource number has “grown” the most, from 4.5 to 13.4, between YE 2013 and YE 2018. That number I have a very hard time believing.
Bob,
It is not clear what the meaning of grown and not grown is in those reports, unfortunately the BOEM does not clearly say what this means. My suggestion is that grown resources takes current estimates of reserves and contingent resources and assumes they will appreciate in the future at some rate. For example let’s say that the estimate of reserves and contingent resources that currently have been discovered and have not yet been produced will increase by 9 Bbo over the next 20 years. I am suggesting this resource “growth” (or appreciation) might be included in the “grown” discovered resource estimate. From 2002 to 2019 based on BOEM estimates, there were 4.92 Bbo added to 2P reserves from new field discoveries and 5.34 Gb of 2P reserves added to reserves due to revisions of earlier estimates.
Earlier estimates (before 2010) tracked proved reserves and after 2009 BOEM switched to proved plus probable reserves. A better estimate of reserve appreciation comes from considering 2010 to 2019 data where reserve appreciation was 3.2 Bbo and new field discoveries were 2.35 Bbo over that 10 year period. Reserves grew by about 69% in a 10 year period or at an average annual rate of 5.4% per year.
A final thought on reserve growth is that if reserve growth continues at a 5.4% average annual rate for 21 years, then the 2019 reserves grow by about 9 Bbo over that period.
What would be a reasonable estimate of contingent resources? Maybe 5 Bbo?
Bob I emailed someone at BOEM on the grown discovered resources. I will report back with what I learn.
Bob,
Take a look at 2016 national assessment, they give reserve growth of 9 Bbo. Note that this is not past reserve growth, it is the estimate of future reserve appreciation.
So for the 2021 discovered resources there may be both contingent resources and future reserve appreciation. If we assume reserve appreciation of 9 Bbo contingent resources would be about 4.5 Bbo.
Bob the 2016 national OCS report by BOEM is at link below see table 3 on page 18
https://www.boem.gov/sites/default/files/oil-and-gas-energy-program/Resource-Evaluation/Resource-Assessment/2016a-National-Assessment-of-Undiscovered-Oil-and-Gas-Resources.pdf
contingent oil resources were 3.3 Bbo, cumulative oil production was 18.5 Bbo, and remaining oil reserves were 3.7 Bbo, and reserve appreciation was 9 Gb.
Discovered resources (not grown) were 25.5 Bbo, grown resources would be 34.5 Bbo,
UTRR mean estimate was 48.5 Bbo and total endowment of oil was 83 Bbo.
Thanks Dennis,
In 2021 BOEM’s total endowment for the GOM was 55 Bbo.
In 2016 it was 83 Bbo.
I think they are headed in the right direction.
https://www.boem.gov/sites/default/files/documents/about-boem/Historic%20Assessments_2021.pdf
Bob,
The number in the historic assessment document does not coincide with the 2021 GOM report where total endowment is about 64 Bbo. One of the two is wrong, I think they mistakenly left out reserve growth in the 2021 number. In fact they should explicitly show a column for reserve growth in that historic assessments document. In 2016 the estimate was about 9 Bbo for reserve appreciation. In addition they should have a column for contingent resources as well.
Bob,
Basically the number they give for total endowment in the historical assessments document for the 2021 BOEM assessment would suggest contingent resources are zero and future reserve appreciation will also be zero. These seem like unreasonable assumptions.
Note that if we take your mid case scenario with URR=36 Bbo, this suggests undiscovered resources plus reserve appreciation plus contingent resources would be 11.14 Bbo, lets assume remaining reserves and contingent resources are 6 Bbo and they appreciate by 30% over the next 20 years, they would grow to a total of 7.8 Gb, new field discoveries would then amount to about 3.3 Bbo for your mid case scenario over the next 36 years (including any reserve growth for newly discovered resources.)
Mistake in comment above. Total resource estimate for 2016 was 88 Bbo for GOM, there was also reserve growth included in the estimate( about 9 Bbo).
Reserve growth was also included in the 2021 estimate, but it is not clear how large the reserve growth was in 2021.
In any case, the estimate of the resource endowment was about 21 Bbo lower in 2021 vs 2016. If they reduce their estimate again in another 5 years by 21 Gb, they will be close to Bob’s high case, they would be down to 46 Gb. With the EV transition and oil prices likely dropping in 2028 to 2032.
Bob’s low to mid case will likely prove correct. It is surprising that the BOEM has such poor estimates. They have been claiming TRR of over 80 Bbo for many years, at least they are moving in the right direction. Though still pretty far from the mark.
Thank you for this post Bob! Also thank you for past posts and comments!
Putin’s state oil champion suffers biggest production drop
Russian oil output in mid-May was 830,000 barrels a day lower than in February, according to calculations based on data from the Energy Ministry’s CDU-TEK unit . Rosneft projects, including assets run by subsidiary Bashneft PJSC, accounted for 560,000 barrels a day of the drop, the data show.
The share of idled Rosneft wells grew from 17% of the producer’s total in January to 30% in April, according to industry data seen by Bloomberg. Bashneft idled more than 55% of its wells last month, compared to just over 27% at the start of the year, the data showed. As of end-April, the two companies had the largest percentage of idled wells among key Russian producers.
If we can’t get pipe and other equipment in the US then they are surely worse off.
I had been wondering if Gulf oil and gas was dropping off due to all the industry action shifting to the shale zones, but the information provided clearly shows that nat gas production from the gulf declined well prior to 2009.
Great posting Bob.
Hickory,
While natgas production from Da Guf has been in long term decline, an innovative approach with small/mid scale liquefaction infrastructure – to be introduced offshore Louisiana next year – is apt to change things dramatically.
Starting at ~400 Million cubic feet per day, the total should rise to ~3 Billion cfd if/when all 8/9 units are deployed off Texas and Louisiana in the coming years.
This is an audacious venture from a highly entrepreneurial outfit called New Fortress Energy and they label their project FLNG (Fast Liquefied Natural Gas).
Globally, several offshore gas fields that are currently undeveloped/stranded, might become economical by emplacing relatively inexpensive LNG infrastructure onsite.
The entire universe of LNG hardware and processing has been undergoing rapid evolution so as to continue to make natgas a more consumer-friendly, accessible source of energy.
Coffeeguyzz,
Sounds very expensive, is it competitive with onshore gas from the Marcellus and Permian that can be piped to the coast, liquified and then exported?
It would be interesting to hear Mr. Meltz’s comments as he may still be in the area.
Dennis,
It is actually very cheap, relative to historical offshore gas field development and legacy liquefaction infrastructure.
While it is well recognized that you just LOVE to peruse different companies’ Investor Presentations in your ongoing quest to be informed in all hydrocarbon matters, spending 10 minutes to read NFE’s recent Presentation and accompanying conference call transcript is apt to be an eye opener for you.
(The Q&A CC transcript directly addresses your question vis a vis competive costs.)
Speaking of eye openers, I just looked in on current Jettyless LNG terminals and was taken aback at the ongoing innovations.
Future is incoming at warp speed.
(Edit/correction to my above post … initial FLNG output should be ~200 Mcfd, eventally increasing to ~1.7 Bcfd.)
Coffeeguyzz,
Sometimes investor presentations are a lot of hype, there is not a lot of natural gas left in shallow water, deep water would likely be too expensive relative to competition from onshore gas.
Dennis
I would think that a land based LNG plant could be more efficient. There is a lot of available energy supplied when NG is liquified. In places like Texas, not sure what one could with this heat in summer. However in winter it could be converted to steam and sent downtown into building.
My sense is that this company builds a small lower cost LNG plant that is installed on a ship and then shipped to some location which has a low volume NG supply. Not clear if the ship also purifies the natural gas to CH4 or if it is done onshore.
I agree that company presentation gloss over a lot
OVI the gas needs to generally be purified prior to liquefaction. Any water or CO2 in the gas will freeze solid when it’s liquefied and the ice chunks will clog up valves, piping and heat exchangers. Even worse, any mercury in the gas will destroy the Cryogenic heat exchangers (aluminum) and cause outages ranging up to a year or more depending on how complex the heat exchangers are. Nitrogen is generally flashed off just as the gas is liquefied and heavies are usually removed and sold separately via heavies removal units prior to liquefaction.
Coffeeguyzz,
The impression I get is that these are just expedited LNG facilities, in other words they can be built very quickly. I imagine thay will just hookup to existing pipelines supplied by onshore natural gas output (though they don’t specifically say where the gas is coming from. At some point we may see natural gas prices rise in the US to the World level as LNG facilities come online, it is not clear if US natural gas output will be able to keep up.
Dennis you bring up a good point. Permitting these world scale LNG facilities can be an environmental nightmare depending on what state you are in. I don’t know what environmental reviews would be needed for an offshore liquefaction facility, perhaps they can get away with much fewer FERC reviews in an offshore jurisdiction. It’s ironic because liquefaction facilities are extremely clean compared to something like oil or coal.
In any case, gas prices are going to rise since the US is now on the world stage. Heck we hit $9 a dek in the last week. It will continue to rise until it balances out with international prices. Electric bills are going up no way around it.
Thanks LNGuy,
I was checking European natural gas prices today, they are at $35/ Mcf recently, that would be a problem for electricity and heating prices in the US as they would rise as you suggest. The silver lining from an environmental perspective is that this may accelerate the transition to wind and solar power as they will be highly competitive if natural gas prices continue to rise.
Coffeguyzz-
Thanks for the info on New Fortress Energy and their FLNG project.
I checked their website and it wasn’t clear to me where they expect the gas to come from. Do you know – do they expect the gas to come from offshore GOM fields, or from other sources?
Mr. Meltz,
Great post that you made.
I thank you for your time and efforts in putting it together.
Re NFE’s source gas … I do not know, but somewhere it was stated that the first FLNG unit (2 jackups with ~100 foot water depth capacity, IIRC) will be located 16 miles southeast of Grand Isle.
They have purchased several semis and are in the early stages of constructing fixed platforms for their future locations.
In the past, there was mention that they might collaborate with upstream operators who have stranded assets, but very little has been said about this (to my knowledge) in recent months.
Coffee.
I love ya man. You are always boosting the upstream space.
But I swear you have had to work in boiler room at some point in your life?
SS,
Get ready, maybe a year out, to finally read of successful EOR for the shale boys.
Compressors … ~$5 million a pop.
Up to 10,000 psi.
Up to 20 Million cubic feet per day capacity.
Harold is paying $3 million to run a short 8 inch gas line to his pads in ND.
New suit at CLR – Doug Lawler – was Chesapeake’s former CEO as they were about to launch huge EOR project in the EF.
Dennis gonna hafta redo his charts
Coffeeguyzz,
We will see, my guess is that at most it might reduce overall field decline. The charts are always being redone as assumptions about the future are wrong 100% of the time.
Note that most of the oil pros believe my charts are far too optimistic for tight oil (and most everything else). Much depends on assumptions about future oil prices. We may see peak oil demand by 2030 or so and that might lead to lower oil prices and EOR in tight oil plays will no loger be viable for cost reasons. Many producers that realize this may not want to be left with stranded assets when oil prices start to fall so this may reduce investment.
In my view, based on peak oil demand in 2030, the smart play for tight oil producers would be to ramp up in the most profitable areas as rapidly as possible up to 2025 and then start to pull back gradually through 2030, as soon as they see oil prices drop close to their breakeven they should stop drilling new wells all together, because any new wells will be a losing proposition. Once oil prices start to drop in the 2028-2032 time frame, they will never be coming back up, it will be game over for expensive oil production.
Dennis.
How you charted, or seen credible charting of, projections of the number of ICE vehicles on the road globally out to 2040?
This information seems more important than the number of plugin vehicles when considering the idea/timing of peak oil demand.
This one projection indicates- “2030: 20 Million More ICE Vehicles Will Be on the Roads in the US Than in 2021”, despite increasing EV sales, for example.
I don’t know if the analysis is accurate, or if it pertains to the global situation.
https://evadoption.com/2030-20-million-more-ice-vehicles-will-be-on-the-roads-in-the-us-than-in-2021/
Hickory,
The scenario is not realistic. With rising oil prices and falling costs for EVs as they reach scale the share of new vehicles sold that are BEVs may reach 100% by 2030, raather than the very conservative 30% assumed in that piece. By 2023 in my scenario the World light vehicle ICE fleet starts to fall and by 2034 more than half of all light vehicles will be plugins, at this point the total World light vehicle fleet has grown to 1.586 billion, it gradually slows down to reach a final level of 1.9 billion in 2052. Ice fleet falls to near zero in 2044 (there will always be a few collectors, but miles driven with ICE will be very small.
This scenario assumes no robotaxis, if that technology should ever become widespread prior to 2044 the drop in miles travelled with ICE will drop far more quickly as most people will opt not to own a vehicle and most miles will be travelled in robotaxi EVs.
Hickory,
My projection of icev and plugin light vehicle fleet size for World.
Thanks Dennis. The trend will obviously be heavily affected by battery prices.
We will need a Battery $/kwh to $ barrel oil ratio to serve as a trend indicator.
Lithium-ion battery pack prices averaged $132 per kwh in 2021
barrel oil $110
None of these analyses take into account that the people who drive more are more incentivized to switch to EVs because of the massive fuel savings. My guess is at 10% EV saturation in any given vehicle segment, fuel consumption will have dropped 25%. At 50% EV saturation it’s probably close to 80% reduction. Most vehicle miles are done by cars six years old or less despite average vehicle age being 11-12 yo.
With a big ramp up by GM, Ford, and Stellantis into the EV space by 2025, and with New vehicle sales in China almost completely EV by this date and half way there in Europe, there will be very little appetite for deep water GOM projects that start production in 5-7 years. I’m not saying this is ideal as I think it will cause massive fuel shortages and make the transition more difficult, but because the way capitalism works all the money will be flowing to the new thing and not the old thing. Just look at market cap of Tesla vs rest of ICE car industry.
https://cleantechnica.com/2022/05/26/china-electric-car-market-29-market-share-in-april/
Oil prices will stay volatile. Expect wild swings down and up as volatility is the hallmark of a paradigm shift, a shift occurring because of peak supply and, eventually, peak demand issues. Making long term investments into a volatile price environment is a tricky decision.
Stephen Hren,
Thanks for your comments. I appreciate your observation: “there will be very little appetite for deep water GOM projects that start production in 5-7 years.”
That’s consistent with an observation from the SPE paper I reference above about why GOM megaprojects are likely in their twilight phase.
My spin on this is that it’s not only the energy transition headwinds that will drive this, but the GOM geology as well : there just aren’t the undiscovered prospects out there that will be large enough to warrant development, especially if they require new facilities.
Stephen,
Yes prices are likely to be volatile. Your point about peak demand may make Bob’s low case more likely because oil companies may no longer invest in new deepwater projects after 2025 as they may see peak demand coming, they will continue to produce and perhaps develop tiebacks to existing platforms as these existing facilities will be printing money at $100/bo.
Good points about the concentration of mileage driven Stephen.
Two big wildcards regarding the speed of transition to Ev’s
-general level of national economic health and prosperity. It takes purchasing power to move on to a new vehicle, especially when current vehicles have excellent lifespans.
-functional level of the international supply chains. This is especially true in regard to lithium battery component/manufacturing, and electronic components.
Clearly, international trade relations have a big bearing on these issues, just as they do for the pricing of petrol.
Hickory,
Yes the economy is always a factor, eventually supply chain disruptions may diminish.
The current crop of EVs is directed at affluent buyers, basically Tesla has destroyed the market for entry level Mercedes, BMW, Audi, Lexus and Cadillac vehicles in the US and this may soon be true in Europe in terms of ICEVs (BMW, VW, and Audi will be joining in the EV market and most luxury mid-size vehicles will be EVs). Once this market is saturated with EVs, they will start producing more affordable EVs to compete with Toyota, Honda, Hyundai, Ford, and GM, etc. After 8 to 10 years the early adopters may want the latest tech and will sell their old EV, these used EVs will replace ICEVs in the used vehicle market and will have far lower TCO for those who buy them. In this way the EV becomes affordable to the masses. I typically keep a vehicle for at least 9 years befor I move on to a new vehicle, my current EV will probably go to one of my children when I get something new in 2028 or so. Perhaps by that time robotaxis will have been approved and my children may opt to not own a vehicle, that might be the way things go if full self driving vehicles become commonplace.
My guess is that the war in Ukraine will eventually be resolved.
BOB MELTZ,
Great post on GOM production and future forecasts. In looking at your data, are you suggesting that the more realistic peak will be about 2028 with a range between 1.8-2 mbd? With current production at 1.6 mbd for FEB 2022, according to the EIA’s recent update, this isn’t much of an increase, with much downside over the next two decades.
Furthermore, with the coming collapse of U.S. Shale Production, 50% plus or minus by 2030, any increase in GOM production will pale in comparison to the declines in the lower 48 states.
thanks,
steve
Steve,
When do you expect this collapse in tight oil output to begin? So your prediction is for less than 4000 kb/d in 2030, is that right? The shaleprofile.com supply projection has output at over 11000 kb/d in Dec 2029.
My current tight oil model, URR=74 Gb, CTMA=centered twelve month average. Output peaks at 11469 kb/d in June 2029, output falls to 4000 kb/d in Dec 2035, annual decline rate is 18% in 2035 ( a decrease of about 900 kb/d from Dec 2034 to Dec 2035).
Steve,
Thanks.
Even in what I believe to be the very optimistic EIA production scenario for the GOM where production works its way up to over 2 mmbopd and stays there until the mid 2030s, and then starts declining – as you say, it will pale in comparison to what many believe to be the coming collapse in US shale production – hundreds of thousands of barrels a day in the GOM vs. millions of barrels a day in the shale patch.
Bingo!!
How many years have you predicted the collapse of US shale oil production without…you know…it ever collapsing? Has it been 8 years of it now? Or 9?
Reservegrowthrulz,
It is clearer if you address your comment to someone specific. I think you are talking to Srsrocco. Eventually tight oil production will collapse, much will depend on prices, but the sweet spots will probably be drilled up by 2028, if prices hold up tight oil output might decline gradually, peak demand may lead to a crash in oil prices and tight oil output will also collapse as oil prices fall below $50/bo. My guess is that this may occur between 2030 and 2035.
Bob
Great presentation. A few questions.
Does your forecast account for the decline rate in the various fields. What is the range of decline rates in the various fields.
In a field like Thunder horse and Mars, how many wells are there. If more than one, are they tied back to the drilling platform or are there more than one drilling platform. Also once into the pay zone, is the well still vertical or does it go horizontal.
Ovi,
My forecast does not have any specified decline rate built in. I combine 2 factors:
1. My best estimates of EUR ranges based on my views on future exploration successes, BOEM’s reserve estimates for existing fields, my views on the upside ranges for existing fields, and my estimates of reserve ranges for near term projects that haven’t come on line yet
2. My best estimates of near term production profiles – for example, with all of the projects set to come on line in the next 2-4 years, I wanted to make sure that I include a range of near term production peaks to reflect that.
Then, after determining the range of near term production peaks, I decline things out to arrive at my EUR ranges.
The biggest producing fields in the Gulf (50 kbopd and bigger) have anywhere from 10 to 50 or so producing wells. Mars has the most,, probably in the range of 50 wells,, but the production comes from 10 leases, and there are 3 facilities that the production flows back to – Mars, Ursa and Olympus. This is unusual for the deepwater GOM.
The Thunderhorse facility takes in production from both Thunderhorse and Thunderhorse North – maybe 20-30 wells from 6-7 different leases.
Almost all of the wells are vertical – there may be some exceptions but that is very rare. One of the near exceptions is the Frio development at Great White where most of the wells are high angle (not vertical).
Bob,
If you are having trouble posting the chart, it has to be 55 kB or less in size for an image to be in the comments. You could add it to the end of your post where there is no size limitation.
Dennis, Thanks.
This is the image I was trying to post in my comment above to Ovi. It shows production from the largest GOM fields – most typically produce over 50 kbopd.
Thanks Bob
If you were to plot those separately, wouldn’t they give you an estimate of their decline rate or possibly a net decline rate if drilling continues in those fields.
As an aside, I regularly post 60 kb pictures. 61 kb ones don’t post.
If you look at the fields above, the production stays fairly constant through 2019 (2019 was GOM’s peak production year to date), and then from the start of 2020 to the start of 2022 production drops from around 900 kbopd to around 800 kbopd, which is about a 5-6% per year decline. Some of the fields had fairly steady drilling (like Mars-Ursa and Thunderhorse) and some didn’t have much or any drilling (like Mad Dog and Caesar Tonga). You kinda have to look through the production issues in early 2020 from covid, but by late 2020 production had bounced back up, and then Ida took out some production in late 2021. We’ll see if the recent decline from February 2022 is an anomaly or not.
Bob,
If you run an ols through the total from the fields in your chart, what decline rate do you find?
Doing a linear regression through the data yields an annual decline rate of about 5.5%, although the decline for these fields should be at least flattened and perhaps even reversed when the new production from Thunderhorse South and Mad Dog 2 come on line this year.
Thx Bob.
Permian oil producers about to slow despite $100 crude
(Bloomberg) — In a world crying out for more oil, a dusty stretch of West Texas and southeastern New Mexico is one of the only places that can deliver. But even with crude above $100 a barrel, producers in the Permian and other U.S. shale basins are riding the brakes.
For most of the past decade, the Permian was an unstoppable drilling machine. Its vast, low-cost reserves helped transform the US into the world’s swing oil supplier, primed to turbocharge output as soon as prices soared or to halt when they collapsed. Because shale producers amassed a backlog of wells that could be tapped in just a few weeks, a crude rally was sure to incite a fracing frenzy that would help replenish global stockpiles and cool off prices.
But not this time.
After Russia invaded Ukraine in late February, crude prices surged to a 13-year high. Gasoline is above $4 a gallon in every US state for the first time. Jet fuel in New York spiked to a record last month. Yet shale explorers show no sign of riding to the rescue. Their business model has fundamentally changed, reshaped by pressure to curb growth and divert cash to investors with dividends and buybacks. Inflation is also taking a toll. US oil output this year is expected to expand by less than half the amount it did in 2018, when crude traded around $65. That means more pain for consumers, with JPMorgan Chase & Co. predicting US gasoline at $6.20 a gallon by August.
“The US oil and gas supply system remains very potent, but at any given price, growth will be smaller and slower,” said Raoul LeBlanc, vice president for North American upstream oil and gas at S&P Global. “Without the subsidy that shale shareholders provided, consumers can expect to pay higher prices.”
Good piece on Permian.
https://oilprice.com/Energy/Crude-Oil/Top-Producing-Oil-Play-In-The-Permian-Set-To-Break-Records-In-2022.html
Excerpt:
However, the play’s production dynamics have changed since the pre-Covid-19 era. The majors largely dominated the growth trend before 2020 – ExxonMobil, Chevron and BP – and other public companies that focused on meeting their aggressive production growth targets and investing cash flow. This time around, public players are maintaining capital discipline, and prioritizing returns to shareholders while keeping reinvestment rates at between 30% and 40%. High oil prices have incentivized several large producers such as EOG Resources and Occidental Petroleum to increase activity further from last year’s fourth quarter and still deliver on their reinvestment objectives. Even so, it is the private operators that have stepped up the game since the beginning of last year, responding quickly to higher oil prices. Mewbourne Oil Company, which is focused on developing acreage in New Mexico, is now running 16 rigs in the Delaware, second only to EOG, while Tap Rock Resources made it to the top five drillers with a stable seven rig count in the play.
Supposedly 5 different entities (EIA, Rystad, Bloomberg, Enverus, and S&P Global) have an average increase in US output forecasted at about 900 kb/d.
From https://oilprice.com/Energy/Crude-Oil/Permian-Frackers-Blame-Supply-Chain-Bottlenecks-For-Stymied-Growth.html
Monthly Energy Review is out
https://www.eia.gov/totalenergy/data/monthly/
US output is expected to rise in March and April (these are based on estimates from STEO). The trend from June 2020 to April 2022 is an annual increase of about 600 kb/d, my tight oil scenario also has US tight oil increasing at an annual rate of 600 kb/d over the next 12 months.
Note that for the past 12 months US output has increased at an annual rate of 310 kb/d and tight oil output has increased at an annual rate of about 427 kb/d, my expectation is that high oil prices may lead to more rapid increases in tight oil output over the next 12 months, but at a slower rate than forecast by others (those forecasts being an increase of about 900 kb/d per year).
April production will be revised down next month.
Ron,
It may, the STEO is likely overestimating both March and April output. The Blizzards in North Dakota will likely reduce April output in North Dakota by at least 250 kb/d, so yes US output is likely to be lower in April.
Turns out I was wrong about STEO estimate for March being too high, it was actually low by 60 kb/d, though I still expect April output will lower than March 2022 output, perhaps by only 100 kb/d as increases elsewhere (Texas, New Mexico, and Colorado) may make up for some of the decrease in North Dakota due to April blizzards.
See the UK is enacting a windfall profits tax.
The US left would like to. Manchin stopped it. He also saved percentage depletion for stripper wells and is thus revered by that contingent.
Probably country specific.
If you take Japan, they grant more subsidies as oil prices go higher. At least the government in the UK gets more income, meaning they choose to withstand high oil prices (even though a lot of people despite it).
Bob Meltz,
Important, informative, and useful. Thanks.
Synapsid
Thanks B. Meltz
I see a similar pattern offshore in Norway. If these oil prices can hold for a while; I guess there will be more offshore oil coming from West Africa, Brazil and Guyana foremost. And Norway. A cushion most probably – but if it can hold up for another decade or more. All good.
Hickory, you said above:
We will need a Battery $/kwh to $ barrel oil ratio to serve as a trend indicator.
Lithium-ion battery pack prices averaged $132 per kwh in 2021 barrel oil $110
Oil is 1700 * 30% ICE efficiency = ~500 kWh per barrel. At today’s prices that’s $0.23 per kWh. As opposed to $132 per kWh for the battery.
[Edit: forget what I just wrote. What’s important is the TCO (total cost of ownership) and if electricity is less than $0.23 per kWh then this favours EVs. Of course, battery cost also figures heavily in TCO so the smaller the better.
]
Hey everybody, you need to read this article. In 2014 they predicted Russian oil production to peak in 2019, and it did. That was determined in early 2022 when it was predicted that Russian production would reach another peak at 200,000 barrels per day below the 2019 peak.
Think Longer-Term Here, What Happens To Russian Oil Production From Here On Out?
Put aside the near-term events for a second here and let’s focus on the bigger and longer-term picture of the oil market. Russia is the world’s second-largest oil producer. Even prior to the Ukraine invasion, Russia’s oil production was expected to peak because of the lack of investment during the 2014-2019 period.
This was detailed in an Oxford Institute for Energy Studies paper.
SNIP
Here is the author’s analysis, assuming a steady 2% and 4% decline rate. Even under the base case scenario, Russia’s oil production was expected to peak this year and fall gradually into 2030. With the situation we just laid out above, there is a good chance Russia’s oil production will fall closer to the 4% decline rate scenario.
SNIP
Oil demand growth from 2022-2030: ~6 to ~7 million b/d.
The graph below was produced in 2014. The article goes on to state that by 2030 oil production will be 6.4 million barrels per day below what demand is projected to be. That means we are post-peak today.
Click on graph below to enlarge.
Solid find, interesting projections. The only thing i can think of which will keep a lid on oil prices is a major recession in the short term. Otherwise $200+/b oil is a reality. WTI is $110/b and this is with Chinese demand falling sharply. I think China is enforcing covid-zero policies in order to curb demand for everything.
China’s Zero Covid policy is driving away long-term investment at a massive clip. If they were genuinely interested in protecting their citizenry they would have used this time to bring in mRNA vaccines for their elderly population to protect them from the fast-spreading Omicron variants. Instead the elderly population is extremely vulnerable with barely effective homegrown vaccines. This tells me Zero Covid is about population control. Xi has decided this is more important to him than economic growth. China may be turning into another North Korea before our eyes. The Chinese economy has likely peaked for the medium term. Their statistics to the contrary are not trustworthy. Add to this a rapid shift to EVs and a rapidly aging population, and it is very likely Chinese oil demand will be falling from now on.
China told their citizens that foreign vaccines were inferior and caused health issues. China can’t import vaccines that they label as bad.
Only tool the CCP has is lockdowns. And since omicron is so infectious every time they try opening back up it will spread again.
So unless XI changes his stance on zero Covid. China will be under lockdown on and off for years to come.
Another piece from Oxford Institute of Energy Studies from May 2022.
https://a9w7k6q9.stackpathcdn.com/wpcms/wp-content/uploads/2022/05/Russias-Invasion-of-Ukraine-New-Oil-Order.pdf
Good stuff.
Looks like India is getting a 35$ discount on Urals oil purchases.
Russia’s Oil Production Has Plunged Even As Its Revenue Climbs Bold mine
In the middle of May, Russia’s oil production was 830,000 bpd lower than it was in February. Rosneft—the top producer and the top refiner in Russia—accounted for 560,000 bpd of this drop, data from the energy ministry compiled and calculated by Bloomberg showed.
Moreover, the share of Rosneft’s idled wells jumped from 17% of all wells at the start of the year to as much as 30% in April. Idled wells at Rosneft’s unit Bashneft accounted for 55% of all Bashneft wells in April, per industry data Bloomberg has seen.
SNIP
Then there is the Sakhalin-1 project—which Exxon decided to quit in the early days of the invasion and in which Rosneft is a partner. Production at Sakhalin-1 is down by a massive 71% compared to pre-war levels, per data compiled by Bloomberg.
SNIP
The International Energy Agency (IEA) estimates that Russia already shut in nearly 1 million bpd in April.
“Following a supply decline of nearly 1 mb/d in April, losses could expand to around 3 mb/d during the second half of the year,” the IEA said.
Production is down 71% in the Sakhalin-1 project because Exxon pulled out. There is no denying that Russia is dependent on foreign oil companies and foreign oil service companies. Yes, Russian oil production is likely to be down 3 million barrels per day later this year.
How much of whatever Russian production level decline occurs through 2023 will be eventually re-established?
I will guess it to be very little.
And if there is some recovery- the oil available for export will be pre-owned by China.
How much of whatever Russian production level decline occurs through 2023 will be eventually re-established?
None! Russian brownfields were already in decline. Now the decline rate will increase. When Russian oil production drops below 8 million barrels per day it will never reach that level again.
The below graph is Russian C+C production projected through this year. Click on graph to enlarge.
EV transition won’t happen without massive amounts exports of nickel and aluminum other metals from Russia.
US pretty much ignored two Greek ships being taken by Iran for obvious reasons. As hunger takes over Middle East later on this year. It’s going to be a powder keg over there. I won’t be surprised if conflict between Iran and Saudi Arabia heats up.
US GDP 1st quarter was nominally 6.5% But in real terms it was about -1.8% We are all paying way more for a slightly less amount of stuff and calling it great.
Oil is caught between factors that could easily push it to $200 or take it back to $25.
But I think the higher it goes the more economic damage is done and the harder the fall will be.
Russia produces 11.2% of global nickel [2020],
and 6% of Aluminum [2020]. China is the big guy on Aluminum.
“Russia holds the world’s fourth largest deposits of rare earth metals (electronics) but contributes only 2% towards global production.”
“Russia also produces 40% of the world’s palladium (used in everything from catalytic converters to electronics to dental equipment)” Note- catalytic convertors are about the enter a permanent decline phase.
“About 22% of the world’s titanium sponge extraction occurs in Russia.”
HHH,
In 2017 Russia was the sixth largest producer of nickel in the World
https://www.worldatlas.com/articles/top-nickel-producing-countries.html
For Aluminum
Russia is the third largest producer in the World, aluminum production will ramp up elsewhere and take market share from Russia, if there are sanctions on Russian exports of aluminum.
As far as I know there are no sanctions on Russian nickel or aluminum, but self sanctioning by companies not wanting to deal with the uncertainty over future Russian sanctions has reduced Russian exports and led to increases in prices.
https://ajot.com/news/russian-metal-exports-slide-as-sanctions-hit-commodity-financing
There is a desperate attempt to fight inflation at this point – yet for a lot of key materials they are still up YoY: Oil – 74%, NatGat – 192%, Coal – 285%, Wheat – 74%, Palm Oil – 58%, Oats – 86%, Cobalt – 69%, Nickel – 56%, Ammonium Nitrate 187%, Eggs – 165%, Cotton – 70%, Lithium 415%. This is what people refuse to understand about Peak Everything – it doesn’t matter what the proximal cause is – subprime mortgage collapse, mega-cap bubble burst, crypto implosion, russian invasion – the peak dynamics are always going to be a force multiplier that will carry on the negative effects (inflation/upward) for longer which will, as you say, make the fall (economic downturn) harder on the way down.
Average mortgage payment if you bought a home a year ago versus today is 40% more for the same amount of home.
Since rents are tied to the value of homes and rents are also a huge component of CPI. FED is targeting the value of homes. By shrinking their Mortgage back security holdings. To bring those values down.
QT or when FED shrinks it’s balance sheet. The market will have to absorb all those MBS’s and treasuries which means dollars from the real economy will be tied up in mass. Which means we get an illiquid market that has far fewer dollars to bid up prices.
Wealth effect in reverse.
But the problem I see is central banks print bank reserves which are a form of interbank money. Which never leaves the FED.
Private banks that create real money when they lend it into the economy need lower interest rates to spur lending.
By popping the credit bubble that is behind this current inflation. I don’t see the tools available to pump prices back up after recession takes them down. We going to end up with a completely broken monetary system that doesn’t work.
Large layoffs are already starting to happen as rolling over debt has become more expensive for corporate USA.
Credit spreads which are the difference between corporate bond yields and treasuries are widening and will continue to widen as FED fights inflation.
FED can’t make more oil appear. FED can’t stop a war going on in Ukraine. FED can’t make more baby formula appear. FED can’t stop China’s zero Covid policy.
What they can do is slow demand by making credit harder to obtain.
Generally high prices lead to both higher supply and substitution, this is followed by lower prices. Perhaps this time will be different, I think the odds are low, at least for the next 20 years.
The solution to high prices are high prices
https://mishtalk.com/economics/oil-looking-bullish-president-biden-pm-boris-johnson-and-eu-looking-foolish
Oil Bullish!!
Guys. This article (translated with Google) states that KSA intends to be operating 90 jack up rigs by close of 2024. Does anyone here know of a major shallow offshore field development? Or is this a massive infill drilling campaign?
https://attaqa.net/2022/05/28/%d8%a3%d8%b1%d8%a7%d9%85%d9%83%d9%88-%d8%a7%d9%84%d8%b3%d8%b9%d9%88%d8%af%d9%8a%d8%a9-%d8%aa%d8%ae%d8%b7%d8%b7-%d9%84%d8%aa%d8%b4%d8%ba%d9%8a%d9%84-90-%d9%85%d9%86%d8%b5%d8%a9-%d8%ad%d9%81%d8%b1/
Price of natural gas could climb higher still after cresting multi-year highs
The war in Ukraine and resulting concerns about global energy security have driven up commodity prices world-wide. But where the price of oil is up about 85 per cent year-over-year, natural gas is up more than 200 per cent.
Frugal,
The natural gas problem may be solved as LNG facilities ramp up. If not the high electricity prices due to high natural gas prices might accelerate installation of wind and solar power as they will be very competitive as electricity prices rise and will gradually steal market share from coal and natural gas. It will take 10 to 20 years before this becomes obvious to mainstream media.
Conversation elsewhere.
With prices high, KSA more than covers its regime saving domestic bribery/spending. Vastly more than covers it. Estimate for the FY, which is a bit of a prediction, is surplus $24B USD and that’s 2.5% of GDP. They actually cut spending during 2020/21 and until the next variant surge hits, they are pocketing money. Quite a lot.
The conversation is this. 2.5% surplus, and a $650B SWF, is driving some talk about the old saying around Peak Oil . . . why not save it for our grandchildren. We have so much money now, and global rates are rising so we can grow the SWF with zero equity risk, that there’s not much use for doing extraordinary things to get more money, so save the oil for the grandchildren by cutting production. No need to sell more of it now. Lower production makes us plenty of money at this price (which would perhaps increase on the news) so why not cut production.
Watcher,
If oil prices remain high it will speed the transition to electric transport and their remaining resource will become worthless. The oil will be saved for the great grandchildren and many generations thereafter, there may not be much demand for it. They would be wise to increase production enough to get oil to $80/bo, that might slow the transition a bit. The higher the price of oil the quicker the transition to EVs.
Watcher- Same thing applies more to US domestic nat gas
Hickory,
Natural gas producers may want to take advantage of high natural gas prices, they will produce as much as can be consumed and exported, especially at higher prices, much of this natural gas will be associated gas from tight oil plays and shale gas, the lead time on ramping up output is low, especially if they can find the supplies, labor, and equipment to increase the rate of drilling and completion. The inflation in costs may eventually bring on more labor, sand, pipe, pumps, and equipment, etc. though that process make take more time.
Also there has been a pull back in the unconventional natural gas output since November 2021, part of this may be that we have run out of LNG liquification capacity, with one new train coming online in Sabine pass 0.59 Bcf/d in Feb 2022 and another at Calcasieu Pass in May 2022 (0.66 Bcf/d). No more capacity is scheduled to come online until Sept 2022 (0.66 Bcf/d). Another 0.8 Bcf/d of LNG capacity is scheduled for 2023 and a further 3.35 Bcf/d in 2024. So some of the recent slowdown in unconventional natural gas output may be due to lack of export capacity expansion. Some of this may change due to high natural gas prices ( the LNG projects might be expedited to take advantage of the high natural gas prices in Europe and Asia.)
US production up by 349 kb/d to 11,655 kb/d. It is still 114 kb/d lower than November 2021.
Full update in a couple of day,
And still 1,311,000 barrels per day lower than November 2019.
The centered 12 month average (CTMA) of US C plus C output in November 2018 when the World was at its most recent peak in output was 11462 kb/d. Output in March 2022 was 193 kb/d higher than the CTMA in Nov 2018.
Well, looking at it that way, World production in January 2022 was 3,327,000 barrels per day below the high 12-month average in April 2019. (I don’t do centered.)
82,986 12 mth avg April 2019
79,659 Daily production January 2022
-3,327 Difference
Ron,
Yes it was, and note that the trailing 12 month average in April 2019 is the same as the centered 12 month average in November 2019. We will see if sustained high oil prices eventually leads to an acceleration in World output, perhaps not if worst case scenarios for Russian output prove correct as a drop in Russian output of 3 to 4 million barrels per day (from the Jan 2022 level) will be difficult to overcome in the near term, if that occurs, I expect Russian output would eventually recover to 10 Mb/d, if they saw sanctions relief at the end of the Russian invasion of Ukraine. Difficult to predict.
Note:
Russia in March rose to 6th place in the ranking of the largest oil suppliers to the United States from 9th, almost doubling monthly deliveries to 4.218 million barrels, according to the Energy Information Administration of the US Department of Energy (EIA).
I expect Russian output would eventually recover to 10 Mb/d, if they saw sanctions relief at the end of the Russian invasion of Ukraine.
No, that is not possible. Russia cannot possibly recover to a point above where it would be without sanctions. Russia would have hit 10 million barrels per day in2023 or 2024 at the latest even if sanctions had not been imposed. Bringing new fields back up after a deep cut is one thing. Bringing tired old brownfields back to former production is another thing altogether.
Ron,
I disagree. The resources that are not developed during the period that sanctions reduce the rate of development can be developed later once sanctions are removed. Output will decrease as fewer new wells are drilled, if oil prices remain high and sanctions are eliminated, more wells can be drilled and output may rise. If the resources are there, but are not extracted, they might be extracted at a later date. In addition the Russian deputy prime minister claims that oil output is recovering in May.
Good theory Dennis, but it is just plain wrong. The original problem, for future Russian oil production, was not enough new resources to make up for the huge decline in their old brownfields.
So they stop developing new resources during sanctions. That does not mean they will get to double up on new resources once sanctions are lifted. They will just resume at their prior normal rate. But the old brownfields will have declined by just as much. Most of those stripper wells shut-in during sanctions will never be restarted.
Sanctions will not enhance future production once they are lifted. That seems to be what you are predicting. That is not how things work Dennis. Shutting old wells down means that most of them will never be restarted.
Ron,
Yes old wells will continue to decline, but new infill wells will not be drilled and completed. Resources that are not extracted now can be extracted later and the rate of drilling may be ramped up once sanctions are removed. The Russian oil resources are very attractive and amongst the cheapest resources in the World, only onshore production in large middle east producers may be cheaper.
We will see in the future who is correct. Much will depend on the price of oil and the length of the conflict in Ukraine.
Ron,
Oxford Institute for Energy Studies slide presentation from May 2, 2022.
” I expect Russian output would eventually recover to 10 Mb/d, if they saw sanctions relief at the end of the Russian invasion of Ukraine.”
Well, perhaps under the best case scenario…maybe.
But short of the best case scenario the output recovery someday could easily turn out being much lower. Sanctions could last a very long time. It is unknown to what extent shipping and insurance and international oil industry partners will be realigned to enable the oil export biz in Russia. The risk is on the downside.
Hickory,
My scenario is that a resolution to the Ukrainian conflict is reached within 5 years. Some compromise is reached and agreement is signed, hostilities end and sanctions are removed from Russia. At that point Russian output may recover.
Also there is some indication that the sanctions are not stopping exports of Russian crude and products as much as is feared. If this is true, then Russi will continue to drill and complete new wells and Russian output may fall to only 9 Mb/d rather than the worst case scenario of 6.5 Mb/d.
My guess is that it will probably be somewhare between the best and worst cases, maybe 8 Mb/d at the bottom, but Russia will devise ways to get around sanctions with the help of China, India, Iran, and Venezuela, who have become adept at circumventing sanctions.
OPEC Weighs Suspending Russia From Oil-Production Deal
How would this make sense? Saudi Arabia and others already fail to meet their quota.
This whole OPEC+ thing made no sense from the start. Without Russia all the non-OPEC nations of OPEC+ were in decline. And Russia had already peaked and could only hope to get back to 11.25 million barrels per day before they started to decline again. They were within 200 Kb/d of that goal before the invasion.
Now they have only the other 9 of the non-OPEC+ 10. And they are in decline as the chart below showe. OPEC+ have always been nothing more than a joke. Now they are even more of a joke.
Click on chart to enlarge.
Ron,
Note that Mexico is no longer a part of OPEC , I agree the plus part of the DOC is not very important any longer, Russia may become irrelevant, though even at 7 Mbpd they would be the third largest oil producer in the World. Different scenarios by various experts see Russian output falling to anywhere from 7 Mb/d to 9 Mb/d by 2023. My guess is that is falls to 9 Mb/d and eventually recovers to about 10 Mb/d in 2027 or 2028.
It looks like the 9 nations in your chart declined about 450 kb/d over 4 years (2014 to 2018), before OPEC started to cut output in 2019 (followed by the pandemic and bigger cuts), so an average annual decrease of 112.5 kb/d over that 4 year period (a period of mostly oversupply of oil and relatively low oil prices starting in October 2015).
You just help to make my point Dennis. The non-OPEC portion of OPEC+ is irrelevant, a joke.
Concerning Russia, even if the conflict ends tomorrow, sanctions will continue until every Russian soldier is out of Ukraine. And the effect of those sanctions will only get worse. Production will eventually get well below 9 million barrels per day and once it does, Russian oil production will never recover to that level again.
In the short term, in May and June, Russian oil production will drop but not by that much. But they cannot hold that level very long. Production will start to gradually drop in the second half of this year due to lack of new drilling and service to current oil wells and other oilfield equipment.
With all foreign oil companies and service companies gone, things will fall apart. But it will take a few months for things to start to deteriorate in earnest.
Very little, if any, oil field equipment is manufactured in Russia. It is shipped in, mostly from the USA. It would take them years to tool up and start manufacturing their own drilling and service equipment.
Ron,
You assume the conflict in Ukraine will never be resolved and that sanctions will not end in the next 10 years, I make different assumptions. If your assumptions are correct, your scenario may be. We will know more in the future.
Dennis, where did I ever make such an assumption? No, the conflict will likely end within the next few months, or one year at most. But Putin will try to hang on to the part of Ukraine that he has already conquered. Thea will likely lead to sanctions not being lifted. I expect sanctions to be in effect for several years, or at least three to five. After all the sanctions that were put in place after the Crimearian conquest by Russia have been in place since 2014. If you think those sanctions will be lifted when the fighting stops, you are dreaming.
No, the war in Ukraine will not last forever. Of course, there could be a black swan event, like the death of Putin, perhaps to cancer. That is rumored. I have no idea what would happen then.
Ron,
You expect the sanctions will remain in place. I think they will not. A resolution of the conflict would include a settlement between Ukraine and Russia, it is in Russia’s interest to resolve the conflict and reach a compromise with Ukraine, perhaps that will never occur. If so, the World will need to get by with less oil as you may be correct that Russia won’t be able to manage to increase oil output without western technology. Difficult to foresee how it will play out.
Required,
I cannot read the whole article, but the first few lines hints that Russia would no longer be subject to quotas (like Iran, Libya, and Venezuela) and the nations that can increase output can be given larger quotas. It might make sense to exempt everyone from quotas except Saudi Arabia, Iraq, Kuwait, and UAE as pretty much everyone except those 4 are producing all they can. Alternatively they could simply stop with the quotas all together and let each nation decide how much to produce. They may be worried that this will expose the myth of OPEC “spare capacity” which is overstated by at least 2 Mb/d and perhaps even 3 Mb/d.
US Update Tonight
A Contrarian View on US Production
Permian Leaves Rivals Behind As Production Continues To Grow
– All U.S. shale basins are expected to see growth this year.
– Permian is on track to account for about half of all U.S. output in 2023.
– The Permian has produced more oil per year than Iraq since 2020.
https://oilprice.com/Energy/Crude-Oil/Permian-Leaves-Rivals-Behind-As-Production-Continues-To-Grow.html
Question To The Group….
Does anyone know when BP will release their 2022 Statistical Review?
steve
Steve last year it was July 8, my guess it will be around that time this year, I cannot find an announcement of the date on the web.
Dennis,
Okay… thanks a million. I thought it was in June.
steve
Steve,
That is what I remembered as well, but last year it was July and I cannot find any announcement on the web for the 2022 version.
The 2019 version was released on June.
The 2020 version was also released in June.
2021 was an anomoly, don’t know about 2022.
I just checked 3 websites for wind power U.K. is getting 0.50 MW out of 26,000 installed, France 2.25MW out of 12,000 installed, Germany getting 5.0MW out of 50,000 installed. 4:00 pm EDST. It’s night so ZERO from solar. Thank God for nat gas, coal and wood pellets.
https://mishtalk.com/economics/russia-uses-chinese-ships-and-indian-refiners-to-stay-ahead-of-oil-sanctions
Russia using India and China to stay ahead of sanctions
A new thread on US March Oil production has been posted.
https://peakoilbarrel.com/us-march-oil-production-recovers/
A new Open Thread Non-Petroleum has been posted.
https://peakoilbarrel.com/open-thread-non-petroleum-15/