A guest post by Bob Meltz
I’ll start with a brief overview of some northern offshore GOM production statistics, and then review what I see as the current state of Wilcox exploration and development projects and finish by discussing Wilcox production data. All production statistics are from BSEE/BOEM.
Cumulative production from the federal waters of the offshore Northern Gulf of Mexico (OCS) through 2020 is 22.7 BB (billion barrels) oil and 190 tcf gas. First production was in 1947. Production from deepwater (defined by BOEM as water depths > 1000’) is 9.6 BB oil, and 22.9 tcf gas. The first deepwater production was in 1979 from Shell’s Cognac platform in 1025’ of water.
The current annual peak in offshore oil production was in 2019. Average production was 1.9 mmbopd. 2020 production averaged about 1.64 mmbopd. So far in 2021 through October average oil production has been about 1.67. With the near term queue of Miocene projects set to come online in 2022 (Mad Dog 2, King’s Quay and Vito), and the queue of Wilcox projects set to come online in 2024-2025 (Anchor, Whale and perhaps North Platte), I believe we will see another peak in production in 2 to 6 years, and this could even exceed the 2019 peak.
The Wilcox, sometimes also called the Lower Tertiary, was thought by many to be the future hope for the offshore Gulf of Mexico, providing long-term production for years. As the shelf and flex trends played out, and as the deepwater Miocene fields started playing out, the Wilcox was going to pick up the slack and keep offshore production going.
I co-authored a paper with several Chevron colleagues in 2005 that led to some of this initial enthusiasm. Here is a link to that paper.
View PDF (searchanddiscovery.com)
The article indicates potential from the play of 3 to 15 billion barrels of recoverable oil. The high-end estimate of 15 billion barrels of recoverable oil generated a lot of industry buzz at the time, but I’m glad we also included the low estimate of 3 billion barrels. As you will see later, I currently believe the ultimate recovery from the Wilcox will be closer to that low estimate.
The oil industry has faced many challenges in pursuing the Wilcox. Some include the technical challenges of drilling and completing these wells. In many cases, they are drilled through thick salt canopies onto total depths exceeding 30,000’. They are some of the deepest wells in the world, and often the top of the reservoirs are encountered below 25,000’. The deepest well in the GOM was a Wilcox test drilled by Chevron in 2013 to 35,935’ TVD_SS. Usually the Wilcox reservoirs are quite thick, often over 1000’ of gross reservoir thickness and over 500’ of net oil pay. Successfully drilling and completing these wells is not for the faint of heart.
So, after 20 or so years of exploration and 11 years of production, how has the Wilcox been performing?
First I’ll discuss the exploration story of the Wilcox.
Below is a simplified stratigraphic column showing the primary producing intervals of the offshore Gulf of Mexico.

Figure 1 – Simplified stratigraphic column for the offshore Gulf of Mexico
Historically, the Wilcox has been a prolific gas producing interval onshore Texas and Louisiana. It wasn’t thought to be prospective in the deepwater Gulf of Mexico until the BAHA #2 well was drilled in 2001 in the outboard-of-salt portion of the Perdido Fold Belt. This well, classified as a dry hole, demonstrated both a working petroleum system (it did encounter 15’ of oil pay) and, surprisingly, thick Wilcox sands. This was followed in Perdido Fold Belt by the Trident discovery in 2001, and the Great White discovery in 2002.
Meanwhile, the initial test of the Wilcox section in the deepwater Central GOM was made by BHP at Cascade (2002). Interestingly, this well was not initially intended as a Wilcox test, but when the shallower Miocene section came in wet and very poorly developed, they deepened the well to test the Wilcox. The significance of this well is that it demonstrated both a working petroleum system in this portion of the GOM (the well was an oil discovery), and the existence of Wilcox sands over 200 miles east of those being found in the Perdido wells. That started to open up the potential for the Wilcox over the entire deepwater GOM. Subsequent discoveries included Chevron’s Jack and St. Malo.
A very good recent assessment of Wilcox exploration results can be found on pages 82-86 in the following BOEM document.
Deepwater-Gulf-of-Mexico-Report-2019.pdf (boem.gov)
BOEM sites 21 discoveries out of 72 exploration tests, for a commercial success rate of 29%. 24 of the wells found non-commercial oil. (If the lease in which the well is drilled is still held by the operator, it is considered a commercial success. If the lease has been dropped, it is considered a non-commercial success. Of course, in both cases, at least some oil has to be encountered.)
The maps below from this document show the distribution of Wilcox exploration wells in the deepwater GOM. Producing assets are highlighted in green, and discoveries in red. (At least 3 discoveries are not included on the map or their statistics: 2 in the Perdido Fold Belt area to the west of Figure 2 to be briefly discussed later – Leopard, a few blocks south of the word Brontosaurus and Blacktip North, just north of Blacktip; and Constellation, a producing asset in Fig. 3. -a bit north of Turtle Lake.)
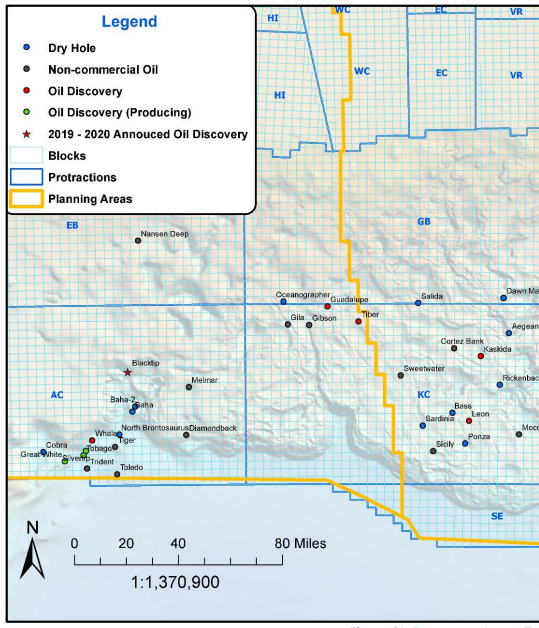
Figure 2 – West half of Figure 61 on page 86 of BOEM document referenced above, showing the distribution of Wilcox exploration wells in the deepwater Gulf of Mexico. Lease blocks are 3×3 miles. The underlaying map is a rendering of bathymetry.
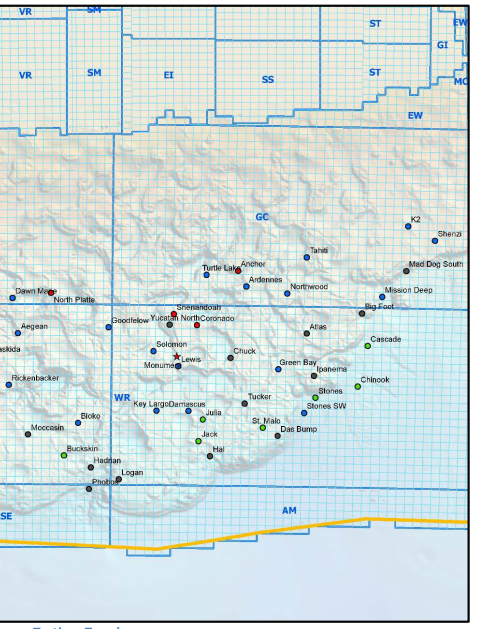
Figure 3 – East half of Figure 61 on page 86 of BOEM document referenced above, showing the distribution of Wilcox exploration wells in the deepwater Gulf of Mexico.
One of the biggest challenges presented by the Wilcox is how to handle a discovery. After drilling an exploration well where you have encountered oil, it isn’t always apparent that you’ve drilled a commercial discovery. Most of these Wilcox wells are subsalt where seismic data can be difficult to interpret, and your ability to determine how extensive an oil accumulation is can be quite challenging. As a result, no final Wilcox development decisions are made based on the results of the first exploration well (unless you decide to walk away from the project). Appraisal is a very big deal, and sometimes appraisal well results are disappointing, and the operator decides to not pursue development, and drop the leases. This results in a non-commercial oil well.
If the appraisal results are successful, and this could include multiple appraisal wells, the operator will often have enough confidence that they will be able to produce economic volumes of oil and will sanction the project, sometimes called FID or Final Investment Decision. The development may involve the fabrication of a new facility, a commitment to drill additional development wells and installation of all of the subsea facilities to bring the oil and gas to market (it’s different if you decide on an FPSO where the oil is stored on the facility, and then offloaded to a tanker). Project costs can vary from as little as a few hundreds of millions of dollars (for a small well tieback to an existing facility) to multiple billion dollar projects.
Recently, the Perdido Fold Belt area (located on the west half of Figure 2) has been a focus of exploration. A number of significant discoveries have been made by Shell and partners in the subsalt to mostly subsalt portion of the Perdido Fold belt in the Alaminos Canyon protraction area. These include Whale (2018), Black Tip (2019), Leopard (2021) and Black Tip North (2021).
The lease map below, Figure 4, courtesy of Shell with a few of my edits, shows the locations of these recent discoveries. It also shows the location of the Perdido host production facility. Note the proximity to the U.S. / Mexico international boundary. At one time there were rumblings that the Mexican government was convinced Shell would be draining oil reserves that extended into Mexican waters. This is definitely not the case. These are bright spot associated reservoirs that are very well imaged on seismic, and the bright spots clearly stay in US waters, and abundant well control confirms this.
Below is a link to a 2007 article about this.
As Deepwater Drilling Booms, Mexico’s Oil Could Leak to U.S. | Rigzone
The Perdido fold belt extends south into Mexican waters. The trend has been moderately explored in Mexican waters with BHP’s Trion discovery being the most significant and one that is very likely to be developed. The Trion discovery was made in 2012 and first oil is expected in 2026 and non-op partner Pemex’s estimate of the gross estimated recoverable resource is 485 mmboe.
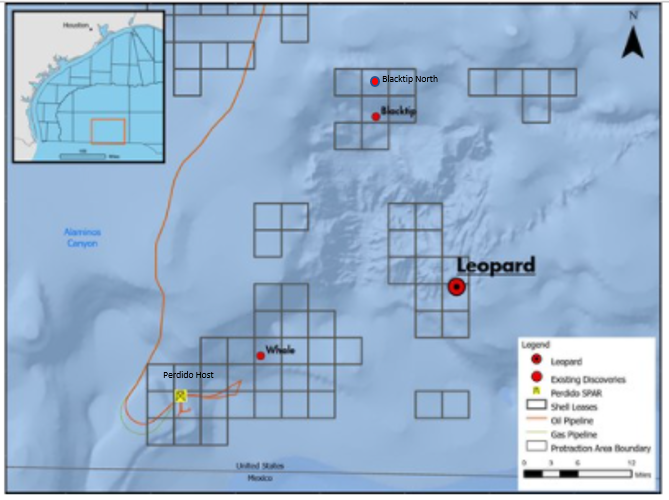
Figure 4 – Lease map of the Perdido Fold Belt area showing key Shell leases and recent discoveries. Map is courtesy of Shell with a few edits. The underlaying map is a rendering of bathymetry.
Next, the production side: The first Wilcox production occurred in 2010 when Shell brought the Perdido project online, (see location of Perdido Host in Fig 4). At the time it came online, it was producing from the deepest water in the world, with the Perdido host facility in 7835’ of water. The main producing reservoirs at Great White are at about 17,000‘, about 9000‘ below the mud line. The Great White Wilcox is unusual in that it has quite favorable rock properties because it is fairly shallow – porosities in the low 20% range, and permeabilities in the 100 mD range or so. This differentiates it from the other producing fields where the Wilcox is deeper, porosities are in the 10-20% range, and permeabilities in the 10s of mDs. It is also outboard of salt and, consequently, doesn’t suffer from the seismic data quality issues seen in the subsalt areas.
Soon after, in 2012, Petrobras brought on Cascade and Chinook in Walker Ridge. They are located in the eastern portion of Figure 3 above. These fields are producing to a centrally located FPSO, the first of its kind in the GOM.
There are currently 9 fields producing from the Wilcox. The chart below shows annual production from these fields through 2020 compared to total GOM oil production. To date, peak Wilcox production was 304 kbopd in 2019. This was 16% of total GOM production in 2019. Total GOM production was down slightly in 2020 because of Covid, while the Wilcox contribution increased to 17%.
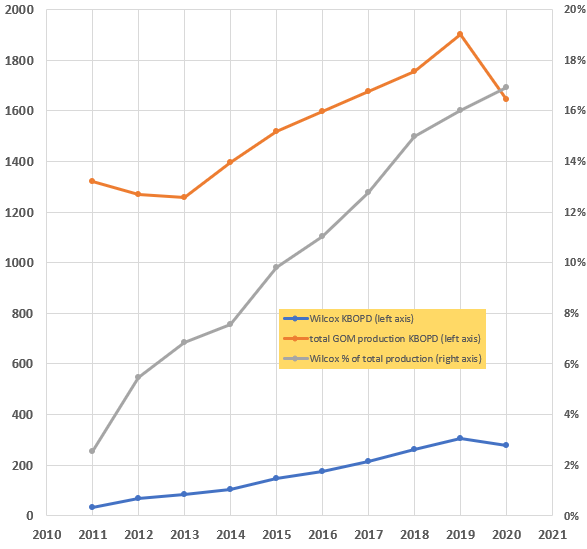
Figure 5 – Annual Gulf of Mexico oil production with Wilcox breakout
Cumulative Wilcox production through 2020 is 614 mmbo, with the per field breakout in table 1. BOEM’s latest reserve updates are through 2019, so I just subtracted each field’s 2020 production from BOEM’s 2019 reserves to get an estimate of remaining reserves at the end of 2020.
(I’ve included a column showing cumulative gas production for these fields through 2020. With the exception of Great White, these are all low GOR oils.)
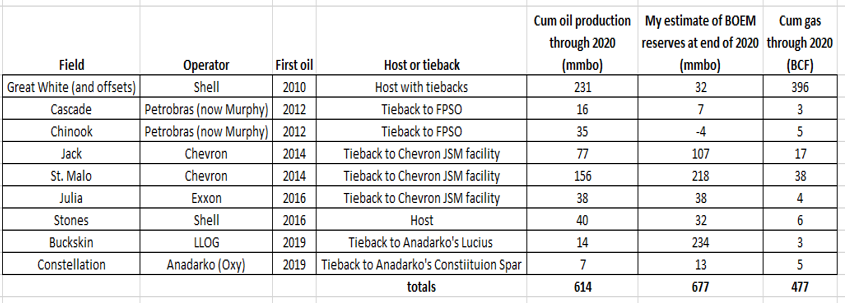
Table 1 – Key information on the current Gulf of Mexico deepwater fields producing from the Wilcox.
Chinook stands out as having negative reserves at the end of 2020, meaning Murphy (the current operator) produced more oil in 2020 than BOEM’s reserves were at the end of 2019, and it has produced more than 2 mmbo through 9 months in 2021. So you can at least change that -4 to a +2.
Then it starts getting to be a question of what the most likely total recovery will be from these fields, or, how much additional recovery will these fields achieve beyond the sum of current cumulative production and my estimate of BOEM’s reserves at the end of 2020. I’m going to go with an estimate of 1.6 +/- .3 BBO as the EUR range for these fields. That captures the current cum plus reserves of 1.3 BBO (614 + 677 = 1.291 =~ 1.3 BBO) on the downside and allows for a fair bit of upside. 2 things that I can see leading to that upside are further developments at Great White and Buckskin and there certainly could be others.
Buckskin is an interesting case study. Chevron and partners drilled the discovery in 2008 and followed it up with some appraisal drilling. After not seeing a clear path to an economic development, LLOG acquired Chevron’s interest, drilled and completed 2 development wells, and brought the project online as a tieback to Anadarko’s nearby Lucius platform in 2019. Buckskin is in the southwest portion of Figure 3.
The queue of near-term future developments is quite attractive. They are shown below in Table 2. These are all projects that have either FIDed, or where the operator has shown a very strong commitment to FID. Note that 3 of them will be 20 k projects – meaning the drilling and production equipment needs to be able to handle the ultra-high pressures (up to 20,000 psi) associated with these Wilcox reservoirs.
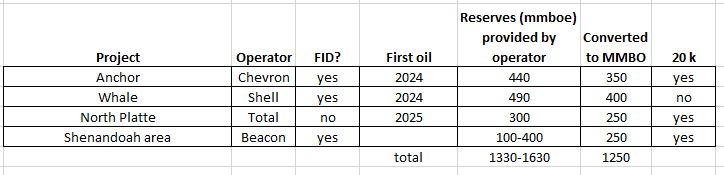
Table 2 – Gulf of Mexico Deepwater Wilcox projects that have been FIDed, or are very likely to FID within the next year or so.
The Shenandoah development has a somewhat similar history to Buckskin. Anadarko and others drilled numerous wells at Shenandoah and nearby prospects, with the first discovery drilled in 2009, but were never able to come up with an path to an economic development. The project languished, but Beacon has come in and is planning a phased development approach. Shenandoah and offsets, Yucatan, Coronado, and Monument, are in the central part of Figure 3.
There also are a number of projects that are likely to be developed but have not been FIDed and are, therefore, a little further out in the future. They include 3 of the recent Shell discoveries in the Perdido Fold Belt area – Blacktip and Blacktip North and Leopard. Another project is a potential co-development of Leon and Moccasin (Leon is in the southeast portion of Figure 3 and Moccasin is to its east. The Moccasin label is cut off by the edge of the map.)
It’s harder to put a reserve range on these because of a lack of information from operators, but, when that’s the case, I find that the best practice is to make the range wide. So,, I’m going to put the range from .7 +/- .4 BBO.
What about undiscovered prospects? It’s my view that exploration for the Wilcox is fairly mature in the GOM, so I put this range at .5 BBO +/- .5 BBO. (A high side estimate of only 1 BBO may be too conservative?) The chart below, Figure 6, from the BOEM report referenced earlier, shows how the number Wilcox exploration wells has been steadily decreasing over the last 8 years or so. This, to me, speaks to the overall maturity of the basin. Some, though, may disagree and say this is related to low oil prices.
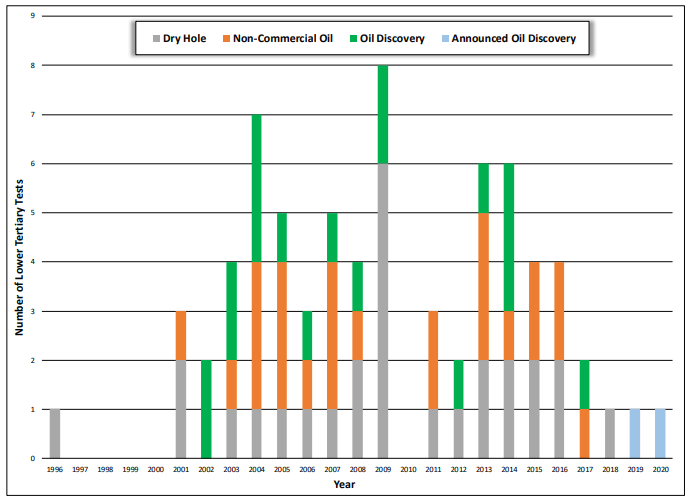
Figure 6 – Number of deepwater Wilcox (Lower Tertiary) exploration wells since 1996. From BOEM document referenced above. No wells were drilled in 2010 because of the BP oil spill.
One source of prospects could be for operators to revisit some of the remaining discoveries that have been made but don’t appear to be on a path to development. A good example here is the Guadalupe-Tiber area in the middle of Figure 2. I could see this area getting revisited in a similar way that Beacon is moving ahead in the Shenandoah area.
Table 3 below is my EUR ranges for all of these projects, broken out by status, in mmbo.
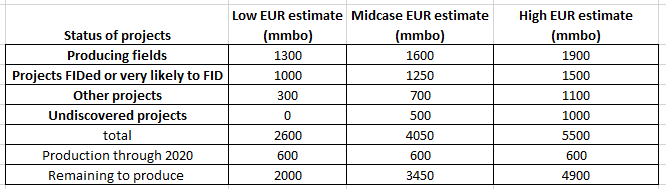
Table 3 – EUR ranges for Wilcox projects of varying status in the GOM.
So, after 20 years of exploration, and 11 years of production, my EUR range for the Wilcox is between 2.6 and 5.5 BBO, with a most likely EUR of about 4 BBO, pretty close to our low-end estimate of 3 BBO from 2005.
You might ask how did we ever get to that upside estimate of 15 billion barrels of recoverable oil? At that time, only 13 exploration wells had been drilled, and 9 were classified as discoveries, and about 12 BBO of original oil in place had been discovered. That results in a discovery rate of 9/13 = 69%. If you assume a similar success rate for future Wilcox wells, and assume a total of 65 prospects, that results in 45 discoveries. If you also assume a similar OOIP per future discovery as existing discoveries, the total OOIP goes to 60 BBO. (I’m just multiplying things by 5.) Then, if you assume 25% recovery, you get 15 BBO. The biggest “miss” here is the recovery factor. Because of the low perm nature of most of the Wilcox reservoirs, 25% recovery is very unlikely. 10-15% recoveries are probably closer to what operators are going to achieve. Great White is an exception to this because the main reservoir is shallower than others and has better rock properties. In fact, a fairly successful water flood is being done in this reservoir and the expected recovery factor could be 40-50% of OOIP.
Another “miss” is around the number of discoveries that have ended up being non-commercial, and unlikely to get developed.
Interestingly and in conclusion, using the BOEM data mentioned earlier plus the 3 additional discoveries that I mentioned, you get 75 total exploration wells, 24 discoveries, and 24 wells with non-commercial oil. 48 out of 75 wells found oil, resulting in a discovery rate of 64%, not too far from the early discovery rate of 69%. The commercial discovery rate, though, is 24/75 = 32%. As mentioned earlier, it is these wells that end up being non-commercial discoveries that can become real appraisal challenges. (Actually, even some of the commercial discoveries end up being appraisal challenges,, but I will leave it there.)
196 responses to “Update on the Wilcox in the Offshore Northern Gulf of Mexico”
This is a great post. Thanks!
If you can guess, how much has the uncertainty over future oil prices and future supply/demand affected production rates in GOM?
Given the tremendous upfront costs, long lead times and public sentiment against offshore production, my naive view is that GOM will not hit its full production potential.
But I will readily admit my views are based on my sense of Federal government and public sentiment, and not what the companies may actually be looking to do regarding future development.
Again, thanks very much for this post!
Shallow Sand,
Investment decisions for GOM projects are made with long term oil and gas prices projections baked in, and once a project is FIDed and the facility starts getting fabricated, the project is going ahead. (Operators have more flexibility with tie-backs, but, even with tiebacks, I’m not aware of any cases where an operator has FIDed a tieback, and then not done it if oil prices dropped). With that in mind, in response to your question, the main way uncertainty over future oil prices impacts production rates is by operators curtailing, or slowing down, development drilling for existing projects. For example, when oil prices dropped in early 2020, alot of development drilling was deferred. Since prices have rebounded, alot of these wells are being drilled, or, have already been drilled.
I do believe all, or at least most, of the projects I mentioned in the post will ultimately get developed. I think, for example, all of the Perido area discoveries will at least get appraised to the point where Shell can make an informed “FID or not decision”
Bob Meltz–
Thanks, I learn something new everyday.
Bob Meltz,
Based on this post is it possible to update your scenarios for GOM C plus C output from 2020 to 2035?
Dennis,
That is a good idea. Give me a while to put something together for that. It may be a shorter than normal post,,
I would like to wait until final 2021 production data is in ( he says,, deftly pushing the commitment out to some nebulous future date, in the hopes that when that nebulous future date arrives, all will be forgotten.)
Bob Meltz,
Whenever you have a chance, or not. It seems you think a peak in 2025 for GOM around 1.9 Mb/d, I assume followed by decline, but how fast, your guess would be far better than anything I could produce.
Bob Meltz,
For the original estimate in the 2005 paper a range of 3 to 15 Gb for UTRR was given, I will assume the F50 was roughly 9 Gb. Now your best guess is around 4 Gb a little less than 50% of the 2005 estimate. Is this primarily because now you believe the recovery factor will be about 12.5% vs a best guess estimate in 2005 of about 25%?
I think this is what you said in the post, but I likely have it wrong. Thanks for any corrections (it is no doubt far more complex than I have said.)
There at least 2 contributing factors:
Lower recovery factor and fewer projects getting developed.
I suspect a third factor could be less oil in place per discovery, but I’m less sure of that.
Thinking about this a bit more – I suspect back in 2005 we weren’t considering the number of tiebacks that would end up being part of the overall production. I suspect we were thinking at least 100 mmbo recoverable oil per project, and tiebacks, even for the Wilcox, can be economic with smaller recoverable volumes.
Also, we weren’t considering FPSOs because they had never been used in the Gulf. I’m not sure about the economics of FPSOs vrs. conventional producing platforms, but I suspect they are more favorable, especially if you have a smaller or riskier project. As I said, Cascade and Chinook both produce to an FPSO, and Shell’s Stones also produces to an FPSO.
And, while I don’t know the specifics, I suspect some of these projects have not been that economic for the operator.
Bob Meltz,
Would those factors tend to make the estimate larger rather than smaller? In other words it would seem lower recovery factor and a lower percentage of discoveries being economically viable would have tended to reduce the URR while the factors mentioned above would tend to make the URR larger ceteris paribus. Of course my knowledge of these matters is ffar exceeded by yours, so I may have this backwards.
Thanks.
Dennis,
Your’s is a very perceptive comment, and I thought that’s how my comment could be interpreted,, basically that not only are the larger Wilcox projects able to be economically produced, but the smaller ones can also be economically produced (because of tiebacks and FPSOs), and this would result in more EUR. That is not my point.
My point is that there haven’t been the number of large Wilcox discoveries made that we thought would be made back in 2005. Overall, the discoveries that have been made have less oil in place. Now, because of tiebacks and (perhaps) FPSOs, these smaller oil in place projects can be economically developed.
By the way, ceteris paribus means “with other conditions remaining the same”, but I’m sure most of you all know that. I had to look that one up.
Bob,
Got it thx.
Maybe this has offset the lack of large discoveries to some extent.
Mr Metz , your comment of 11/1/2021 at 5.33 Pm . For me you and Mr Kaplan are the Placido Domingo and Luciano Pavarotti as far as GOM matters are concerned . However I must disagree . The current prices , markets do not support your assessment . Respects .
Bob,
This is really a great report and very informative. Having been only onshore, I have always been amazed and impressed with the GOM technology and producers. Thank you for such detailed information.
Fascinating to hear about all these particulars and challenges- thank you sir.
It sounds like new money to go after additional prospect drilling or facility development would have to be willing to accept the considerable risk of complete loss of investment.
I guess that has always been in the cards, but the risk is now much higher after all the prior exploration and appraisal work that folks like you have completed over the past decades.
Hickory,
Yes, that risk has always been part of the game. And with the cost of Wilcox wells, you can spend hundreds of millions of dollars on exploration and appraisal wells and then decide to not FID the project. Ouch!
On the other hand, it is these very projects that become Buckskin and Shenandoah, where a third party comes in on an appraised project, and moves ahead with development.
Bob.
As I know so little about offshore production, maybe you could answer a few questions for me.
1. What are the bonding requirements offshore. I have read that leaking wells are a problem. Is GOM like onshore, where operators go BK and plugging gets thrown onto the taxpayers. Any comments you have on decommissioning would be appreciated.
2. Are there any restrictions on creating overriding royalty, or other types of interests in GOM wells?
3. I assume at some point artificial lift is used. What types of artificial lift are used.
4. Where does the produced water go?
5. How are the offshore rigs powered? Is this a big challenge, and does lack of reliable power supply ever end production prematurely. I assume everything is powered by produced gas?
6. Is production all transported by pipeline? Are there storage vessels? Maybe explain the gathering a little bit?
7. I assume this varies, but what is a standard hole size and casing size for GOM wells?
8. Once a well is producing, are there still workers at the well 24/7/365, weather excepted?
9. What kinds of actions are taken to prepare for hurricanes?
Sorry for all the questions, and don’t feel obligated to answer. And if there’s a place you could refer me to where I could read articles about this, that’s fine.
Just don’t get a chance to converse with someone with your knowledge. Posters need to realize they are lucky to have resources like you and others.
Shallow sand,
Agreed, we are all lucky to have people share their knowledge of the oil industry here.
Thank you Mr Meltz, Shallow sand, Mr Shellman, LTO survivor, and Mr. Kaplan.
I can try some of these, though Bob might know better, so trust his answers more than mine:
1 – don’t know
2 – don’t know
3 gas lift, either injection at a subsea wellhead or further downhole, and electric submersible pumps.
4 overboard after treatment, I can’t remember exactly but I think it has to average 10ppm average OIW with maximum of 40ppm
5 the large platforms have gas fired turbines using fuel gas from treated produced gas (most associated) with diesel emergency gensets, I think the smaller platforms just use small diesel sets.
6 most is by pipeline for gas and oil, there are two FPSO’s which presumably use shuttle tankers, I don’t know if other platforms have storage, the are a few large gravity based platforms but I don’t know the exact designs
7 from memory they go up to 7″ for the largest deep water wells such as on thunder horse (and the deep water horizon well) but may have only been 6″.
8 subsea wells are just left to get on with things, but there may be facilities for chemical and methanol injection and they have instrumentation up to the eyeballs for monitoring and control from the central control room – a rig or intervention vessel is needed for workovers; some rigs have platform rigs but they are usually drilling new wells so while its easier to do workovers on dry trees it is not something done lightly.
9 platforms are shut down with subsurface safety valves shut on each well and pipelines isolated (i.e. a major shutdown), if they are in for a direct hit they are partially (key workers only) or fully abandoned (completely black); fpsos may be moved off station; moveable offshore drilling units are moved out of the way.
George Kaplan. Thanks for the reply!
Thanks George,
Let me add a few comments to some of Shallow’s specific questions.
1. Regarding bonding requirements – there are bonding requirements. They essentially, have to do with ensuring that operators having the financial ability to properly abandon/decommission their assets. Regarding leaking wells, etc, and who pays the final abandonment costs if an operator goes bankrupt – it does ultimately go back to the taxpayers as a last resort.
In cases I’m familiar with, though, where a big company, Exxon, Shell or Chevron, sells a field (usually a shallow water field) to a small operator, and the small operator goes bankrupt, the abandonments liability, and costs, usually go back to the original operator. These are called boomerang fields. Regarding platform abandonment itself, BSEE manages a pretty successful “Rigs-to-Reefs” program where abandoned platforms are moved to certain parts of the Gulf that have been set aside, and then dropped to the seafloor as reefs. These have become quite successful fishing locations, etc.
2. Regarding royalties – since the FEDs are the landowners of everything, royalties get paid to them. I think 1/6 royalties for shallow waters, and 1/8 royalties for deep waters,, I think.
7. a few additional comments here – the shallow casing sizes in some of these wells can be quite large – up to 30″ or even 36″
After the BP oil spill in 2010, there were 2 deepwater well containment companies formed. One is called MWCC or the Marine Well Containment Company and the other is called HWCG.
Bob
Nice report. Answers to the questions helped. What is different about the Pleistocene, Pliocene, Miocene, Oligocene layer that there was no oil.
With regard to the BP spill. Is there any assessment of the lingering damage to the fishery and tourism. Is there a consensus or is there a range of views on the state of the gulf today after the spill?
Ovi,
The Pleistocene, Pliocene and Miocene all produce both oil and gas.
All of the shelf production comes from reservoirs of these ages.
(There are a few outliers such as Norphlet gas in the Mobile Bay area offshore Alabama, and Cretaceous James Lime gas production primarily in the Viosca Knoll area)
The initial deepwater production, starting back with Shell’s Cognac in 1979, produces from reservoirs of these ages
The initial subsalt discoveries were all Miocene.
The Oligocene only produces from some of the shallow reservoirs in the Great White area, but I lump that production in with the Wilcox.
Don’t really have any insights as far as whether there are still lingering issues from the BP oil spill,, I suspect there are, but I don’t have any specifics on that.
Hi Bob,
Not to question your expertise, but wouldn’t the climate have been too cold in the Pleistocene, Pliocene and Miocene to produce oil or gas. My thought was you need a hot house earth climate to produce oil and gas as you need ocean dead zones for the accumulation of dead phytoplankton.
The oxygen minimum is off the shelf edge from 200 metres down. Between 200 metres and 1000 metres. Don’t need no hot house climate for carbon accumulation. I have found ice crystal impressions in Permian coal seams.
Iron Mike,
Just to clarify – the reservoirs are Pleistocene, Pliocene and Miocene. The source rocks in the Gulf are older, mostly Jurassic with some Cretaceous and Paleocene. The source rocks have been rarely penetrated in the offshore Gulf, but there are at least 2 notable exceptions where older rocks have been rafted over younger rocks. The source rocks have been penetrated in alot of onshore wells.
There are numerous shallow biogenic gas accumulations on the shelf. In those cases, the source rocks are the adjacent Pleistocene shales. These shallow source rocks were never buried deeply enough for thermogenic processes to occur.
Thank you for the clarification. Very much appreciated.
I misremembered a bit there – the 6/7″ was for flexible risers on individual wells, I don’t know if there is tubing made in those sizes, which would probably have been 5″. Additional info on the wells: chokes are set from petroleum engineer nominations (probably daily), wells are tested for oil/gas/water flow monthly (usually in dedicated test separator) and subsurface safety valves are regularly function tested (I think also monthly but may be longer).
I’m running through charts tonight. Chart that catches my eye the most is the US 10 year government bonds.
There is a potential breakout in yields to the up side. It’s really all about positioning. Long term I think long term yields go to zero and the catalyst is interest rate hikes.
But in short term we could see a breakout move higher to 2% and that move could happen this week. It would be a really volatile move. Likely risk off and stocks down big for at least the duration of the move.
Good chance oil has a pullback that would coincide with this move in yields.
Keep in mind that most other sovereign bonds track the US bonds and will be carried higher with it. We are talking a global tightening of monetary conditions that happens without anybody actually having raised rates.
I think yields continue to fall in China though as they have to make moves to avoid a deep contraction. But with the complete opposite monetary policy between China and US money is likely to start flowing out of China. You’ll know this is happening by watching the dollar appreciating against the yuan.
Which ultimately leads to a really big global contraction as there are just less US dollars following through global economy. Which ultimately leads to lower oil prices.
10 year BUND is already above break out level. They should get positive soon.
Yeah nominal 10 year yields in Germany haven’t been positive since about April 2019. So it’s been three years since Germany has seen positive interest rates.
There has been a whole lot of borrowing and pricing based off negative interest rates over those three years. Things are going to get interesting.
The ECB is still buying them – other only when looking into an legal .38 ( Insurances & co ). And lot’s of companies use the cheap credit for buybacks or to survive with an outdated business model.
And house prices have soared the last 3 years – a one family home goes for a million in my small suburban town now, thanks to 0.5% credits. But no way to pay back such much money with the german tax system – We have higher income tax, higher VAT and much higher energy tax than you – Electricity is now over 40 (Euro) cents.
But I think the 10 year US bonds have now crossed the chart line, too.
Stocks are down, but oil seems mostly untouched so far.
Things are going to get interresting ;).
Why do you think long term yields are heading towards zero?
( I agree with you actually although I know zip about technical analysis)
Thanks
WP
The debt load is only going higher by leaps and bounds. Interest rate hikes will be a deflationary catalyst. If they do the 4 hikes by years end that they say they are likely to do.
Yields at the long end of bond market will crash towards zero. Yield curve will likely invert with the 10 year bond at or below 1% and FED will be cutting rates or entire house of cards comes tumbling down.
Honestly we’ve had one policy error after another during the last two years fighting COVID.
And if inflation doesn’t respond to the end of QE and the 3-4 rate hikes that are coming. Then lookout.
Powell has no choice but to continue coming out like he will tomorrow and be Uber hawkish.
[…] Original Post […]
2022 Is When Oil Supply Panic Replaces Fears About Demand
Unless the need for oil slows dramatically, the prospect of inadequate supply and triple-digit prices is real.
https://www.bloomberg.com/opinion/articles/2022-01-09/2022-is-when-oil-supply-and-prices-panic-replaces-fears-about-demand
It’s now official. The Russian Minister of Energy just released Russian C+C production for December. They declined 3,000 barrels per day in December. Not much but according to OPEC+ they should have increased production.
Russian Energy Statistics in tons per month. In order to get barrels per day, divide by 31 then multiply by 7.33.
So if this is the new plateau they lost around 250k barrels per day.
Oh, I don’t think you can call two months a plateau, but I think it does mean they are at or very near their area of maximum production. Notice their big jump in September, less of an increase in October, still less in November, then no increase at all in December. I believe their December 2022 production will be well below their December 2021 production. I know they dream of holding a plateau of around 11 million barrels per day but very old oil fields just don’t do that. Of course, they know that, they just hope to bring new Eastern Siberian fields online to make up for the decline. That is a pipe dream also.
If you are speaking of the vostok development area, they are going to have some issues with the permafrost. If I am not wrong, near Arctic sea, the ground must be still frozen in depth but in 5 or 10 years, the permafrost will have melted. And then, everything that has been installed and fixed in the frozen permafrost will move. I think in particular of the pipes.
This problem is also happening on the North Slope of Alaska and is especially a problem for pipelines. Most of these Arctic areas are essentially frozen swamps.
lightsout,
No not 250 kb/d, December output was 3 kb/d less than November, basically output was flat.
Dennis, you misunderstood Lightsout’s post. He was not saying that Russia was down 250 kb/d in December, he was saying that if they plateau at this current level, that will be about 250 kb/d below their pre-covid level.
Ron,
Yes I believe you are correct, I misunderstood the comment.
Ron,
Russia may already have exceeded their quota in November so they kept output flat (3 kb/d is essentially a rounding error) in December.
Chart below uses average condensate output for Saudi Arabia from Oct 2020 to Sept 2021(230 kb/d) to estimate Saudi C plus C output in October and November by adding 230 kb/d to crude output as reported in the December MOMR. The chart presents C plus c output in kb/d.
Dennis, we have been over this before. Russia undershot her quota by 37,000 barrels per day.
It’s difficult to assess Russia’s compliance with the OPEC+ deal, as the CDU-TEK data don’t provide a breakdown between crude and condensate — which is excluded from the agreement. If condensate output was the same as in November — some 930,000 barrels a day — then daily crude-only production was around 9.973 million barrels, about 37,000 barrels below its December quota.
Russia’s weak December oil production signals lack of capacity
Dennis/Ron
The official crude output for Russia for December is 10,018 kb/d. With crude output of 9,973 kb/d, Russian December crude output was 45 kb/d below their commitment. The December production target is attached to the press release below.
https://www.opec.org/opec_web/en/press_room/6690.htm
Dennis/Ron
Russian November output as reported by Russia was 10,906 kb/d. Subtracting 930 kb/d of condensate, as guesstimated by Bloomberg, gives 9,976 kb/d of crude. November crude production commitment was set at 9,913 kb/d. So November crude output was 63 kb/d above their commitment.
So was Russian output in December limited by the DOC or by geology. It will take a few more months to sort this question out.
According to three Russian oil companies, it was limited by geology. https://www.bloomberg.com/news/articles/2021-11-26/russian-oil-output-growth-losing-steam-as-opec-may-review-plans
So was Russian output in December limited by the DOC or by geology. It will take a few more months to sort this question out.
Or, you could just take their word for it. As Jean wrote above: According to three Russian oil companies, it was limited by geology.And the Russian Oil Minister says he hopes to plateau, for a few years, at about where they are right now. Lots of luck with that one.
Ron
I think that Russia could get back to 11,100 kb/d this summer when it gets warmer. That is why my time frame was short.
Ron,
In November, Russia was above their quota and may have kept output below their quota in December to meet their overall commitment, it may not be capacity constraints, though After Russia gets to 11.1 Mb/d, I believe they will be close to their capacity.
For now Russian output may be limited by the DOC rather than by geology as Ovi suggests. Also note that not all Russian oil is produced by the largest 3 oil companies.
After Russia gets to 11.1 Mb/d, I believe they will be close to their capacity.
I don’t think they will hit that level but they might. After all, that is only 200,000 barrels per day above their current production and way below their previous peak. And it is quite obvious that their problems are due to geology. I don’t see how you can possibly deny that. But obviously, you do and I find that very strange.
“ANYONE who believes that exponential growth can go on forever in a finite world is either a madman or an economist”
—remarked (the economist) Kenneth Boulding.
Ron,
The question was is the flat output in December due to Russia being unable to increase output further due to geological constraints or other factors. Geological constraints are an ongoing issue for all oil fields at all times, to deny that it is a factor would be absurd, just as it is absurd to suggest that it is the only factor at play. I maintain my position that Russian output will remain on an undulating plateau at around 11 to 11.5 Mb/d from 2022 to 2028. Geology will indeed be the major factor along with access to western technology which is primarily a political calculation by Putin and NATO.
I maintain my position that Russian output will remain on an undulating plateau at around 11 to 11.5 Mb/d from 2022 to 2028.
I understand that Dennis. And I understand that is what the Minister of Energy said. However, you should realize that is nothing but hopum with no chance of being realized. I seriously doubt that the Minister really believes it. And I doubt that there is an oilman in Russia who also believes it.
Ron,
We really don’t know, but based on past experience higher oil prices sometimes result in more oil than I predict (in almost every instance to date this has been the case). The future may be different, we will see.
As to reading the mind of the Russian Minister of Energy, that is beyond my pay grade and ability.
Shale drillers delaying emissions cuts from operations, says Federal Reserve
HOUSTON (Bloomberg) –Less than half of oil and natural gas drillers in the U.S. Great Plains and Rocky Mountains plan to curb emissions of carbon dioxide and methane this year, according to the Federal Reserve Bank of Kansas City.
Those same managers said they need benchmark crude prices to average about $73 a barrel to justify new drilling and higher output. They foresee oil prices remaining above the $75 level through at least the middle of the decade, the survey found.
https://www.worldoil.com/news/2022/1/7/shale-drillers-delaying-emissions-cuts-from-operations-says-federal-reserve
Have any of the regulars here changed their minds recently about when oil will peak ?
OFM
This article appeared in my morning newspaper. According to it, peak oil may be around 2025. This is the time frame, plus or minus a few years, for some of us on this site.
https://www.reuters.com/markets/europe/shrink-fit-year-big-oil-starts-become-small-oil-2022-01-10/
OFM,
My current guess is 2027+/-1 at 86 Mb/d+/-1 for World C plus C output.
84,598 mbpd in Nov 2018 for C+C . Take it to the bank . Tooth fairies do not exist and Jeffery Epstein did not kill himself .
Note I focus on centered 12 month output for World C plus C, so the 86+/-1 Mbpd estimate reflects the centered 12 month output of World C plus C that may be achieved in the July 2026 to July 2028 time frame.
The current centered 12 month average peak is 83130 kb/d in November 2018. This peak is likely to exceeded by July 2024 (average for Jan 2014 to Dec 2024).
Oil goes over $100 by this summer. If it can stay there for three years we can probably beat the old peak by a (statistically insignificant) smidge in the 2024-25 timeframe. Then it keeps getting more expensive with no real output increases until something breaks. The biggest wildcard imo is China and their unsustainable zero Covid policy. There’s no easy way for them to rejoin the world economy with endemic Covid. They’ve really painted themselves into a corner. To me they look a lot like Japan in 1989, demographically and debt/real estate wise. Just ten times bigger. 30 years of growth has created gobs of zombie companies and corruption out the wazoo. At some point it comes down.
Stephen Hren,
That sounds like a reasonable lower bound scenario, but from my perspective there is about a 75% probability that output from 2024 to 2029 will be higher than your scenario. There are a lot of oil resources that can be developed profitably at $100/bo or more, some deepwater offshore tiebacks and tight oil as well as other brownfield projects can be brought online relatively quickly, by 2028 we may no longer need increased oil supply as demand for oil may be falling at that point.
That’s plausible. You have more faith in everything holding together longer than I do.
Stephen Hren,
Yes that is correct, if there is a civil war, nuclear holocaust, or large asteroid strike, any model of the future falls apart, future recessions cannot be predicted in advance, nor future pandemics and other unknown unknowns.
The future is impossible to predict, that is the only thing we can be sure of.
OFM and OVI
I am still trying to understand, how is it possible (if we are very close to the peak) that non-OPEC production is roughly 2.5 times that of OPEC, whereas OPEC’s reserves are 2 times those of outside OPEC. When I asked this question before, Ron said that OPEC is lying about its reserves. But this does not seem to explain it. If we take out the Venezuela’s XH (260 Gb) and Canada’s tarsands (160 Gb) from the OPEC and Non-OPEC reserves and adjust OPEC’s reserves down owing to the quota wars in the 80’s, (say down by 200 Gb) their reserves are still about 750 Gb and the non-OPEC reserves are about 360 Gb. So we have total reserves of 1110 Gb rather than the latest OG&J number of 1742 Gb. We have now used 1400 Gb of oil and if the ultimate is about 2800 Gb, we ought to be about half way through. So how can the reserve to production ratios for OPE and non-OPEC be so far apart?
Seppo, you are asking the wrong question. The question should be: “How can OPEC possibly be telling the truth about their reserves?” Answer: They are not.
Hey, it ain’t that hard to lie and get all the ignorant folks to believe it. We used to have a president who lied every time he opened his mouth. And his ignorant worshippers believed every word of it.
“Hain’t we got all the fools in town on our side? And hain’t that a big enough majority in any town?”
Mark Twain, The Adventures of Huckleberry Finn.
Ron, if they are lying, their reserves would be much less than they claim. I adjusted it down by 200 Gb. If you adjust it down more, say by another 100 Gb, the same question remains.
OPEC hikes December oil output, but falls well short of quotas again: Platts survey
OPEC’s 13 countries pumped 28.04 million b/d of crude, up 190,000 b/d from November, while nine non-OPEC partners pumped 13.98 million b/d, an increase of 120,000 b/d, the survey found.
However, 14 out of the 18 members with quotas fell short of their targets, including even its largest producer Russia, whose compliance rose above 100% for the first time since February, when severe winter temperatures shut in wells and reduced pipeline flows.
However, 14 out of the 18 members with quotas fell short of their targets, including even its largest producer Russia, whose compliance rose above 100% for the first time since February, when severe winter temperatures shut in wells and reduced pipeline.
Angola was up as it started production from new fields!!. Surprised.
There is a complete table at the end of the article.
https://www.spglobal.com/platts/en/market-insights/latest-news/oil/011122-opec-hikes-december-oil-output-but-falls-well-short-of-quotas-again-platts-survey
So, OPEC+ has 19 members who are not exempt. 5 are producing above quotas, 14 are not. Of the five that are producing above, two are miniscule (South Sudan and Gabon) and the other three are not especially politically stable (Iraq, Kazakhstan, and Algeria). Of course the exempt members are not very stable either (Libya, Iran, and Venezuela).
I think it’s safe to say that the ones near 200% compliance or above are not going to be producing any significant additional barrels: Congo, Angola, Equatorial Guinea, Nigeria, Azerbaijan, Malaysia, Sudan.
Saudis Are Right to Warn of a Collapse in Oil Supply
We ignore those warnings at our peril. A 30-million barrel a day drop in oil supply might seem like a victory to the most short-sighted of environmental campaigners, but without an accompanying fall in oil demand, it will come with a price tag none of us can afford — oil prices at levels never before imagined.
“Have potential investors been so bullied, or so scared, by environmental campaigners that they are unwilling to sink capital in new oil production? ”
I call bullshit on that narrative. A few points
-There is a huge amount of capital available for, in fact eager for, a target for deployment that will give a decent return on investment when taking risk into account.
-Dozens of trillions of dollars in the world have no ESG restriction or mandate. This does not even include privately held funds. Complete freedom to deploy money where they see opportunity.
-Interest rates are as low as they get. Global liquidity is as good as it gets.
If you look up the energy sector stocks traded in the USA on all of the exchanges, only a small number have a positive ROI- [return on investment].
If that improves (and I suspect it will with sustained higher prices) then investment money will be fighting to get through the door and find a place to deploy.
We have heard from industry personnel over and over just how marginal the current projects and prospects are for viability, let alone profitability. That is why investment in future projects is lukewarm.
The world is going to have to invest in both oil and all the non-oil energy sectors simultaneously, and both are going to be increasingly expensive just to keep running in place. And even running in place will be backsliding
I suspect.
For new plays investment must start NOW – to deliver oil in a few years. Drilling some infills always works – but they are speaking of new projects.
Yes, when oil is over 120$ and still accelerating money will come, for a new pork cycle.
The other thing in the western part are enviromental regulations. Canadian oil can be killed completely, so the European rest of it. Even US oil could be in danger. At least a tiny bit:
https://oilprice.com/Energy/Energy-General/Biden-Administration-To-Reduce-Oil-Drilling-Lease-Area-In-Alaska.html
WTI currently a little over $81. Still waiting on yields on 10 year bonds to brake out higher.
We’re not far from erasing the omicron/SPR release pullback that happened the day after thanksgiving.
Politically we getting back into the no fly zone on oil prices. I expect FED to come out swinging an surprise market with something unexpected. If they don’t oil will be at $100 by March or April. Heading into midterm elections this is just not good for incumbent politicians.
I think FED will speed up pace after the next red hot inflation reading that comes out Wednesday.
They must be careful – any big hammer clubing oil down to 60 for the elections will club stonks down 30%, too. And this all the Robin Hood millenialls and the 401k plan owner won’t find amusing. Lot’s of them elect democrats, even a void vote will be bad here for Biden.
So they need a scapel to lower oil prices without damaging the whole market. And pushing 10 years to either 0 or 3+% won’t help, too. This will be load, not a quiet operation. And the government can’t need loud. That’s why they tried the SPR release first – this is an operation only affecting oil.
Just my opinion – the FED has a problem.
10 year is likely just waiting on Wednesday data release.
FED has only one tool and it’s the exact opposite of a scalpel. They can crush inflation but there will be broad collateral damage.
Trying to jawbone or talk down inflation just isn’t going to work.
With inflation running just over 5% by the government numbers. It’s actually much higher in reality. And short term rates at 0.25% real rates are negative 5%. Going by their numbers.
When inflation was under 2% real rate were negative but nowhere near as negative as they are today.
In order to tame the beast they going to have to tighten way more than most people think.
“Just my opinion – the FED has a problem.”
Always, and forever. Just try to keep a leaking tanker ship moving forward, and on track.
Mission Impossible.
Yes, correct all of you HHH , Eulen and Hicks . Interest on debt is $ 500 B at current rate of 1% . At 2% ( 4 increments of 0.25 %) it is 1 trillion . FUBAR .
If I’m right in my thinking the FED has to get the FED’s fund rate or their short term benchmark rate up to 3.5-4.0% just to get us back to the pre COVID average of 2% inflation. It’s at 0.25% currently.
That is problem nobody wants to have a conversation about.
Markets will crack and go to hell before the FED ever reaches what is needed to tame inflation.
“That is problem nobody wants to have a conversation about.”
Seriously?
Just because you are not part of the conversation does not mean it is not taking place- every single day.
Hickory
When it comes to the FED if it’s not being said openly. If it’s not something talk about openly then it’s not part of the conversation. And it isn’t policy.
And until it is said openly it doesn’t even matter what’s discussed in private. Just as if it was never discussed.
The EIA’s new Short-Term Energy Outlook is just out. They now have predictions through 2023. Notice they have greatly revised down the latest three months of their Non-OPEC liquids production. December 2021 has been revised down by 860,000 barrels per day.
All data is in millions of barrels per day and is total liquids, not C+C.
As the OPEC came back more or less to their production level of March 2020 in December 2021, we can assume that, according to the estimation of production for December 2021 for non OPEC oil producers, the world oil production will be 2 millions barrels/day below the production of March 2020 in December 2021 : ?
Well, their total liquids in December were 1.86 million bp/d below their level of March 2021. But they were, in December, 2.16 million bp/d below their January 2021 level and 2.48 million bp/d below their peak of November 2019. But that is total liquids, not C+C.
The fact that the Short-Term Energy Outlook last month overestimated December liquids production by 860,000 barrels per day tells me something very profound about the EIA. To be that far off on production for a month that close is astounding. And if you notice in the chart above, they catch up pretty fast, increasing by 2.7 million bp/d by November of this year, making a new all-time high, this year! I really don’t believe that will happen.
Ron,
The EIA STEO revisions may reflect revisions in the IEA Oil Market report. In the Nov 2021 Oil Market report from the IEA they estimated World output would increase by 1500 kb/d in both November and December 2021. The December 2021 Oil Market Report (IEA) revised the November 2021 estimate for World liquids supply to an increase of 970 kb/d (about 530 kb/d less than the previous month’s estimate). The EIA likely has access to the full Oil Market report (I do not) and the revision to December 2021 may reflect the IEA revisions in the December Oil Market report.
As you well know predicting the future accurately is quite difficult (impossible really, with the odds of success very close to zero).
Resource nationalism . This is how the cookie crumbles , it begins at the edges .
https://eurasianet.org/uzbekistan-ends-gas-exports-to-china-abandons-price-increases-at-home
The question now is that tankers meant for China were diverted to Europe . Is China looking to energy starvation or energy poverty ?? Will they keep quite ??
An update . Now even Russia .
https://kun.uz/en/news/2022/01/07/uzbekistan-completely-stops-natural-gas-export-to-russia
WTI’s over $80 today. It looks like Biden’s SPR release has failed to bring down gasoline prices.
The laughing guy on the Biden SPR release . ROFL.
https://twitter.com/StreetBomber/status/1479137921001213956
Frugal,
Did anybody think the SPR release would do anything to oil prices? I never did. The move was symbolic to show Biden was “doing something” about high gasoline prices.
Oil exports from Russia peaked in 1988. We all understand they collapsed as a country and their oil industry also collapsed. Still 33 years later they have yet to eclipse the high made in 1988.
Oil exports from Saudi Arabia peaked in 1980. Had another much lower peak in 2013. Still 9 years later they haven’t surpassed the high mark made in 2013.
Oil exports from Venezuela peaked in 1998.
Oil exports from Mexico peaked in 2005.
Oil exports from Nigeria peaked in 2010.
Oil exports from Iran peaked in 2004.
Oil exports from Indonesia peaked in 1980.
Oil exports from UAE peaked in 2013
Only 6 countries that export oil with any significants that haven’t seen a peak in exported oil are Canada, Iraq and USA, Kuwait, Brazil and Kazakhstan.
Does it really matter if we see a new peak in production if that doesn’t translate into more oil being exported?
No, I don’t think it really matters. I wish we could have a chart of “World Net Oil Exports”. That would be very interesting. But we had net oil production peak in 2018-2019, depending on whether you are talking monthly or annually. But net oil exports likely peaked two or three years before that.
Thanks, HHH for posting this. It is very interesting.
HHH
In reply to Ron Patterson.
I couldn’t find a chart showing all global exports combined. But I was able to look up each oil exporter individually between 1980-2020.
There was some difficulty finding just the volumetric data in chart form. A lot of charts had natural gas an other liquids added in under oil exports and then others were in dollars which can be misleading in times when oil was high priced.
Agree HHH and Ron-
volume of ‘oil available for export’ is the big factor that stabilizes global economic and geopolitical relationships.
Here is a story from today, right up this alley-
“China doubled down on imports of Iranian and Venezuelan crude in 2021, taking the most from the U.S.-sanctioned regimes in three years as the nation’s refiners brushed off the risk of penalties to scoop up cheap oil. Chinese buyers, particularly private refiners, have benefited from Washington’s tough line on Iran and Venezuela, continuing to buy their oil long after their counterparts elsewhere in Asia ceased purchases. The risk that non-U.S. entities may lose access to the U.S. financial system or have their American assets frozen if found guilty of breaching the sanctions hasn’t dissuaded them.”
HHH,
As long as there is no interplanetary export of oil only production and consumption matter. A big change in World exports which are equal to World imports is that the US is importing far less crude oil today than at the peak in 2008. Currently the centered 12 month average of US crude net imports is about 3000 kb/d, at the peak in 2005 the centered 12 month average of US net imports of crude oil was 10200 kb/d.
Dennis- that is nice for the USA,
But this issue of eventual tightening of oil exports will be extremely tough for countries that don’t have enough domestic supplies, and yet do have big industry/internal demand. This includes many countries in Europe and Asia such as China, Germany, Korea, Japan, India
If they don’t electrify quick the shortage of oil for import will be a very big issue, as you know.
Hickory,
I mostly agree that the need to electrify transport is important. Note that fewer net imports for the US means more is available for those other nations on World markets. As oil available for export diminishes and the supply on World oil markets becomes short as a result, we are likely to see oil prices rise. This will likely lead to increased demand for electric transport and lower demand for new ICE vehicles, my models of the EV transition suggests that World demand for oil may fall below World supply of oil by 2029-2032 (depending on assumptions about the rate that demand for new plugin vehicles increases with the assumption that the supply can meet that demand.)
Beyond that point of peak World demand for oil we will see oil prices start to fall and there will be an excess of oil on World markets at higher price levels.
There will likely be a period where the World oil market is very tight from 2024 to 2028 and oil prices might be very high during this period ($120 to $150 per barrel in 2020 $), this may increase demand for plug in vehicles leading to a faster transition to EVs, if supply of EVs can keep pace with the increase in demand.
“likely be a period where the World oil market is very tight from 2024 to 2028 and oil prices might be very high during this period ($120 to $150 per barrel in 2020 $)”
yes, I think that is a likely scenario too
I couldn’t find a chart showing all global exports combined. But I was able to look up each oil exporter individually between 1980-2020.
CPI inflation reading came in at 7.0%. Core inflation was 5.5% so far yields on 10 year bond have move slightly lower.
Bond market already starting to price in an economic contraction or at least deceleration? Due to high prices. That is the way I’m reading this. If this is where long term bonds peak then they can only do a handful of rate hikes before they collapse the yield curve.
I’d say FED has a problem here. And by extension so does all markets and prices. We could get runaway price inflation and runaway oil prices. Or we can get crashing markets. 50/50 on which way this thing goes.
There won’t be a happy medium here unfortunately.
Yes, looks like the long road the FED was kicking the can down comes to an end.
They can’t tollrate 7% inflation doing nothing. And they can’t tollerate a total market crash. The moment wages start to move big deal up, inflation will be hard to stop. Especially when supply problems won’t go away fast.
The question is how fast does this escalate? When turning down QE to 0 until march this will be the first test. No more big buyer of bonds – movements here will be much more extreme without the one maximum “stupid” buyer.
The ugly thing is additional, even when they stop QE and do some tiny increases, there is enough central bank money out to create a big inflation. As you wrote some time ago central bank money is now lended by only factor 2 – it can go up to 10. So any monetary space for a runaway inflation even without new QE.
Or a credit crunsh deflation with inversed curve – not better.
My scenario: They will hike until the market crashes. Then they panic (because politic panics and there is fire in the streets) and they will reverse 180 degrees panic buying everything to stop the crash. And they’ll get a big inflation.
Only way price inflation come down is if dollar continues to appreciate. If they raise rates and dollar sinks inflation continues on its merry way higher.
They don’t control long end of bonds curve right now. Both the FED and treasury want higher slightly higher yields on 10 year to give them room between the spread of FED’s funds rate to be able to cut rates later during next crisis.
2-3 more dollars on oil price and Biden will be calling Powell on the hotline.
Hedge funds are long oil giving price a big push.
Maybe Biden does “temporary “ price controls on oil. Puts a ceiling at $70 or something. Only thing is it would crush the oil industry and the moment any price controls are lifted we get an absolute moon shot in price and inflation.But they can’t afford to sit back and do nothing.
Hmm, a price control on oil.
The US still imports a lot of oil – mainly for rotating around gravities. So the government would have to pay the difference while importing. Possible, a few billion here and there doesn’t matter.
Surely it will hurt domestic production, so more expensive imports.
But that’s cheaper than hammering down stocks and real estate with the big interest rate increase hammer. That surely will kill oil, but everything else, too. Say goodbye to stock buyback on credit, say welcome margin call.
Controlling the long bonds they can do to some extend only during QE, running out soon:
– Reducing yield by buying like mad (like the ECB buying everything italian ): easy
– For increasing yield they have to throw their bought bonds on the market – as long as they have some. To keep QE at level they would have to buy even more short bonds then, decreasing yield here.
So a kind of artificial yield curve – this could only be an emergency stopgap to do something.
They did a thing like this during “Operation twist”, buying long term and selling short term to decrease long term interrest rates in 2011 – I think it was to strengthen real estate market by creating cheaper house credits on this way.
More likely if the price goes high this summer, exports will be banned by Dems. This should dramatically lower the domestic oil price while ratcheting up Brent.
… and you will have to pay big for your imports, too.
The refineries you have are still not tooled to intake that much light oil from the shale. So you will have to close down half of the permian, and continue to import as much as before (the USA imports and exports 8 mbd at the moment). Only for higher prices ( the ca 3 mbp will be missing in the world market ).
And retooling the refineries is a longer and expensive process – that’s why it isn’t done so far. They are still configured from the classical Texas oil boom time.
Stephen Hren,
The Democrats will never be able to pass an export ban in the Senate, I don’t think they have 60 votes to end a likely filibuster.
You guys are talking nonsense. The US was a net oil exporter in 2021.
Petroleum Overview
Ron,
US was not a net exporter of crude oil. Net imports of crude were around 3000 kb/d, with about 6000 kb/d of imports and 3000 kb/d of exports. The ban on exports always applied to crude only as I am sure you know.
Sorry Dennis, I just screwed up. I meant to say net oil importer. The monthly petroleum review clearly shows the US was a net oil importer for the first 11 months, (average). Sometimes I just think my head ain’t screw on right. 🤯
Ron,
No problem, if I had a dime for every time I made a mistake, I would be a wealthy man. 🙂
Remember the creative accounting that the Trumpsters did to classify the USA as a net oil exporter? They counted UNREFINED IMPORTED crude oil as being produced by the USA since it was being REFINED here.
Price controls just result in lines at the gas pump, this would really piss people off.
Nixon tried price controls. When the price controls were lifted we got a huge surge in inflation.
But when they get desperate you can’t rule out anything.
I think the FED is hoping if they drag it out long enough prices will come down some on their own and they won’t have to do as much.
So far they have done nothing to bring inflation down other than talk about it. QE should be ended immediately. Why wait 3 months? They should be hiking rates now. They aren’t really serious about inflation.
HHH,
They are winding down QE, it cannot be done overnight with disrupting financial markets, this action will affect interest rates in time. Doing too much too soon will lead to a recession, they will see how unwinding asset purchases affects inflation and if still a problem they will raise the Fed funds rate incrementally over several quarters. They are hoping to find the right balance between employment and inflation. A difficult wire to walk.
Dennis,
In order to fight inflation they have to disrupt markets. They can end QE slowly and raise rates slowly. But inflation won’t respond to that.
All avoiding disrupting markets means is higher inflation. Because as long as things are good and markets aren’t crashing. Why not bid up oil? Why not bid up stocks? Why not bid up housing.
HHH,
Yes they need to disrupt things a bit, but it can be overdone as in the 1980s when a severe recession resulted, tightening of money supply can be overdone in my opinion. The Fed is trying to avoid that. There was a lot of fiscal stimulus during the pandemic and a lot of pent up demand in the system.
Since 1970 inflation has went to 5% or higher and peaked seven times. And every single time we’ve had a recession immediately after inflation peaked.
I’m not going to try to call exactly when inflation peaks this cycle. Heck China is locking down ports which should put upward pressure on prices. But there is absolutely zero reason to believe that this time will be any different.
Yields on 10 year bonds likely just signaled inflation just peaked and recession is imminent. Keep an eye on bonds. If yields sink here. We are likely at the start of a recession and FED ending QE and hiking interest rates will be forgotten about shortly.
If we get a short squeeze in long term bonds which is likely underway at the moment. Yields could half from
where they are now in short time. Putting 10 year under 1%.
I’m thinking we are entering some type of inflationary recession or stagflation. Where perhaps prices continue to go up but economic growth first decelerates then goes into contraction.
And honestly I don’t know how they remedy that. If you try to inject more money to kickstart growth you just get more inflation. If you hike rates to fight inflation growth will just contract even more.
HHH,
I think the Fed has gotten better with dealing with oil shocks, worldwide pandemic shocks they are probably less adept at as the last one was a century ago.
Keep in mind that from April 1973 to August 1982 the CPI was over 5% for annual inflation every single month. Inflation was over a 7% annual rate every month from August 1973 to December 1975 and then from May 1978 to Feb 1982, June 1982 was the last time annual inflation rate was over 7% (prior to December 2021).
Hint:
Paul Volcker
Dennis , yes there was a lot of fiscal stimulus but ” pent up demand ” is a false narrative . Nobody went and got himself two haircuts , an extra shirt or shoes . Nobody took a vacation of 4 weeks because he missed out on his earlier vacation of 2 weeks . The fiscal stimulus shifted demand from different sectors ( restaurants , travel ,leisure etc to certain forced changes to lifestyle due to lockdowns example if you are now WFH then maybe you buy some new furniture , computer etc . Time pass activities like gardening or home improvement etc . Those stimulus cheques had to find a place . Some of it went to buying stocks and crypto’s . Anyway that party is now over . The current inflation is a problem from the supply side . The FED has no control . It can print dollars but not semiconductors .
From another blog but interesting .
Some maths here but the crux is this:
“In a nutshell, the 10-year rate cannot break 2.5%.
At 2.5% our adjusted debt service to GDP moves to 2.74%, matching the all time high in 1985.”
Powell said four hikes. Yeah, four 0.10% hikes. And the market knows it. With continuing $400B/mo back-door. however, without BBB and $3Trillion hitting the streets in payoffs, there won’t be enough cash on the ground to keep the system from locking up. Which it is, look at the empty shelves nationwide.
Part of that is real but part is a show, look at the backlogged containers worldwide, never seen before. In 300 years. So…everyone dismantled their cranes? Uh, no. It’s a scam, or a sabotage, but they’re up to something.
https://macroheathen.com/macroheathen-blog/f/interest-rates-still-cannot-rise-heres-why
Hole in head,
Many people spent less money during the pandemic and as the situation has improved with more people being vaccinated demand has increased. I agree supply has also been a major factor in inflation, the system does not respond well to fast changes in demand, supply chains cannot keep up and the pandemic has disrupted supply chains.
Fed policy is less about money supply and more about interest rates and those can affect demand if they rise. Higher interest rates may lead to less home buying (and home building) and lower levels of business investment.
Paul Volcker remedy isn’t on the table. IF FED does 4 rate hikes like they say they will do this year. They invert the yield curve and inflation really spirals out of control as nominal negative interest have to be considered.
Negative nominal interest rates kill the dollar and CPI goes to 20% instead of 7%.
Their road to kick the can down ends in 2022.
HHH,
The relationship between US real GDP growth and the rate of inflation is far from as simple as you assert. The data is below, essentially there is no correlation from 1960 to 2020. Data from Fred
https://fred.stlouisfed.org/
Dennis,
Currently the 10 year bond can go either way. We are either going to get a technical breakout that likely goes to 2% or it’s a false break an yields are headed lower.
Both have implications on which way growth goes over next 6 months. You can have inflation and growth at same time. Most people call it reflation. Which we’ve had over last 18 months or so.
We can get stagflation where growth is slowing but inflation isn’t. Likely what we are transitioning into.
History shows long end of bond yield curve falls after they start hiking short term rates.
They running out of room to play this game unless negative nominal interest rates are on the table.
Which would cause and inflationary boom. As dollars would be borrowed like never before and invested into everything that’s not dollars.
Might even get a growth boom but it won’t last. They just be expanding dollar debt like never before. And it would end in a deflationary collapse when all those borrowed dollars fail to get paid back.
Dennis , your post a12:22 PM . If shale is a Ponzi then the FED was/is running along with CCP the two biggest Ponzi schemes ever in modern history . If ZIRP and QE are not Ponzi’s then please justify . The problem with Ponzi’s is that they all run out of road and end in a disaster if not a catastrophe . Don’t believe ? I wish I could get Bernie Madoff or Ken lay to explain this . HHH is bullseye ” 2022 is when we run out of road ” . The problem with Ponzi’s is that they can run for a long time and desensitize the majority that the Ponzi is the ” new normal ” .
The Russians are not letting a good opportunity go to waste. High inflation and high energy prices gives them good leverage for a trade war. Electricity prices are already brutally high here in Europe and a long trade war with a large energy supplier is the last thing we need. Russia is also a large mining and forestry country so in a hard trade war it wouldn’t be just oil and electricity that would jump in price.
There have been numerous comments here over the past months regarding Russia’s failure to ramp up oil production lately. I suspect they don’t want to ramp up production as they want to use fuel shortages as a bargaining trick.
Chart for World oil imports using BP Statistical Review of World energy (oil trade tab and oil consumption tab in barrels). Also shown is percentage of World consumption that is imported.
https://www.bp.com/en/global/corporate/energy-economics/statistical-review-of-world-energy.html
Note that for the World oil imports are equal to oil exports.
It will be interesting to track this- thank you.
The near term peak of world oil import 2018-19 may end up being the long term peak.
We will see in a few more years.
Got electricity?
Hickory,
World consumption decreased in 2020 as expected due to the pandemic, but on a percentage basis the peak in the percentage of World oil imported was in 2020, rather than 2019 (peak in World imports was 2019 at 70404 kb/d, the peak percentage of oil imports divided by oil consumed was 73.5% in 2020, in 2019 it was 72.1%.)
Supply projection for permian from http://www.shaleprofile.com at link below
https://public.tableau.com/shared/DXQTY9KSD?:display_count=y&:origin=viz_share_link&:embed=y
Permian tight oil at 6496 kb/d in Dec 2029 with 68465 total horizontal tight oil wells completed from Jan 2009 to Dec 2029 assuming oil rig count, rig efficiency, and average new well productivity is unchanged from Dec 2021 to Dec 2029 (obviously just a simplifying assumption, well productivity will decrease and rig count is likely to increase over this period).
What’s the usefulness of so long a projection? Esecially when 2020 and 2021 on the graph are not that smooth
Svaya,
There will always be statistical noise leading to small variations around trend (look at the Jan 2017 to Dec 2019 part of the chart, it is relatively smooth with small wiggles). The pandemic obviously affected output, as well as the severe winter storm in Feb 2021 in Texas. The scenario from 2022 to 2029 is a what if exercise for Permian basin output if the rig count were to remain constant, average new well productivity (or the average EUR of new wells) remains constant and rig efficiency (average number of wells drilled per month for each rig operating) also remains constant. As I suggested none of these assumptions is likely to be correct and as I often say there are an infinite number of possible future scenarios, the likelihood that any single scenario chosen from that infinite set will be correct is approximately 0 %.
So one could easily claim that all projections of the future are useless.
I am good with projection but I am skeptic of any model that is not known and I cannot verify the data that goes in it
Svaya,
The model has been presented in the past see
https://peakoilbarrel.com/oil-field-models-decline-rates-convolution/
Link to permian spreadsheet below(this is an older model from July 2021, well profiles need updating, but gives an idea of model), large file 16 Mb. TRR is 50 Gb, ERR for price scenario is 34 Gb, mean USGS TRR estimate for Permian is 75 Gb. The scenario is quite conservative in my opinion with a maimum completion rate of 525 new wells per month from June 2025 to Feb 2027, peak output in 2027 at 6275 kb/d.
https://peakoilbarrel.com/wp-content/uploads/2022/01/permianmodel50-Gb-TRR.ods
Alternative link to spreadsheet from Google (it downloads a bit faster, but some people distrust google)
https://drive.google.com/file/d/13ouk6NzJ3cX5yQMJqOYvCRi6fzMsl5_5/view?usp=sharing
Note that the well profile data and completion data is from http://www.shaleprofile.com. See the Permian basin updates as well as the supply projection for recent (past 12 months) well completions per month. A hyperbolic well profile is fit to data and when annual decline rate reaches 13% it is assumed that exponential decline at 13% per year is the terminal decline rate with wells shut in at 12 bopd. Natural gas profiles are also used and NGL is assumed to be extracted at the average Texas and New Mexico rate (barrels of NGL per MCF natural gas). Natural gas assumed to sell for $3.50 /MCF from Nov 2021 to end of scenario and NGL at 35% of the crude oil price.
Note that I do not know the details of the shaleprofile model, but I imagine Enno Peters uses well profile data and completion data and assumptions about future completions to arrive at the projection, he has access to data on every well completed though his approximation of future well output may be different from mine (his choice of function to fit to the data may be more sophisticated than the simple hyperbolic/exponential fit that I use.
Example of Permian 2019 well, terminal decline at 13% begins at 72 months at 328 kbo cumulative output.
hyperbolic only applies to months 7 to 72 with months 1 to 6 having output below in barrels per month
12481
24157
20387
17068
14251
12279
after month 72 decline is exponential at an annual rate of 13%.
An individual well profile is fit to average 2010-2012 well, 2013, 2014, … , 2018, 2019, and 2020 (9 separate well profiles). After 2020 average new well EUR is assumed to decrease in my model depending upon completion rate (so a slightly lower well profile each month after Dec 2020). I assume that wells are only completed in the highest productivity benches (that is why TRR for my scenario is only 50 Gb rather than 75 Gb). For this reason the decrease in average new well productivity is marginal for my scenarios.
Recent posts at http://www.shaleprofile.com on North Dakota and US tight oil through Sept 2021, both well worth a read in my opinion, Enno Peters does great work.
Great chart on well productivity in US post at link below
https://shaleprofile.com/blog/us/us-update-through-september-2021/
The chart of interest at link below
https://shaleprofile.com/wp-content/uploads/2022/01/Normalized-well-productivity-1.png
Excerpt from shaleprofile post describing chart at link above:
In the top chart you can see how normalized well productivity (average cumulative oil produced in the first 3 months, normalized for lateral length) has changed over time in each of these basins. It reveals that based on this metric productivity increased strongly through 2016, but has not changed by much since. In the Eagle Ford you can find a surprisingly strong increase in performance earlier this year, but the number of wells completed was also lower. The bottom 2 charts plot the average lateral length and proppant loading over time for each of these basins.
North dakota post at link below
https://shaleprofile.com/blog/north-dakota/north-dakota-update-through-november-2021/
In this post a great chart on well productivity direct link below
https://shaleprofile.com/wp-content/uploads/2022/01/Well-productivity.png
below chart the text is
Well productivity (cum. oil vs time, per 1,000′ of lateral length) in the 4 core Bakken counties. Horizontal wells completed since 2011 only.
Comments from Enno on chart linked above
After several years of significant productivity increases, well results have barely changed in the 4 core counties in North Dakota since 2017. This is especially visible after normalizing for lateral length (as these have slightly increased):
(chart between these in post)
Recent wells are on track to recover 25 thousand barrels of oil per 1,000 ft during the first 2 years on production, just 2% higher compared with the wells that came online in 2018.
North Dakota average tight oil new well productivity has held up relatively well, I believed in 2013 that average new well productivity would start to fall by 2014, it is 2022 and I am still waiting, will Permian productivity follow a similar pattern? Maybe average new well productivity (aka EUR) holds steady from 2022 to 2026.
”Maybe average new well productivity (aka EUR) holds steady from 2022 to 2026.” Apparently, Mike Shellman doesn’t think so.
No, I don’t; thank you, Jean. Well productivity per stage, or per 1000 feet of lateral, whatever, is being manipulated by operators in need of cash flow, because prices are high. Its a meaningless metric going forward, as is “rig efficiency.” We are beginning to see mid-life parent well decline rates accelerate and child wells are not going to be anywhere close to 70% of parent well UR’s in the Permian. My respects to Mr. Survivor, who seems to have left the building, sadly. Big piles of data are meaningless if you don’t know how to break it all down to people, places, and things…like 4.5 earthquakes and groundwater depletion as frac source water. Inflationary costs in the oilfield associated with drilling, completion and OPEX is raging now. Hope for higher oil prices is NOT a plan.
Think about this, please: for US tight oil to grow 2MM BOPD more than current production levels over the next 8 years it will have to replace nearly 3MM BOPD of legacy decline, each and every year, BEFORE it can grow 250K BOPD per year… for 8 straight years. Can’t be done. Not enough Grade A locations left to drill, not enough OPM to drill them with, way too much produced water to get rid of and gassy oil wells are turning into oily gas wells at a very fast clip now.
America is in deep doo-doo. We have to drill enough stinking tight oil wells in the future to replace 3MM BOPD of tight oil decline, every year, AND 3MM BOPD in tight oil exports to Asia, every year. Just about all of that will now have to come for a few counties in the Permian, already stuffed to the sideboards with tight oil wells and suffering from pressure depletion.
The sooner people get their minds right about all this, and stop listening to the BS, the better they will be. There are things to do that can make you better prepared.
“There are things to do that can make you better prepared.”
We all could use to be talking about this more.
Any of your thoughts on this Mike would be appreciated.
Personally I’m on the look out for a dented forty mpg Honda or Toyota, with fifty thousand miles of likely life left it it. Dents I can fix.
An electric car is not a realistic option for me at my age, considering the up front purchase cost. I would never put enough miles on it to justify the purchase and beyond that, the opportunity cost…… the potential earnings to be made investing the money in an APPRECIATING asset.
Wasn’t it Rockman at the old TOD site that used to say “Get thee hence to the non discretionary side of the economy?”
I’m not invested in anything that depends on cheap travel.. but as a matter of luck, more than anything else, I am invested in real estate in a part of the country where living expenses are still dirt cheap, and the environment is still in great shape, compared to lots of other places.
So….. if it becomes necessary, I can sell out piecemeal to newcomers fleeing the high cost of living in places such as the DC area and points north.
People need to be thinking about such things when they decide how they’ll invest their money.
There will likely come a time when very few people think an I Phone is worth the extra money……
or that the money they were intending to spend on vacation travel had best be spent on upgrading the McMansion to save on energy costs.
Personally I’m on the look out for a dented forty mpg Honda or Toyota,
Driving one currently– Yaris, I am on the dirt daily, still no dents.
I’m off to the “Bad Lands” in few minutes–
Oregon Badlands Wilderness
https://en.wikipedia.org/wiki/Oregon_Badlands_Wilderness
Thanks Mike.
My scenarios for the Permian assume a maximum WTI oil price of $73/bo in 2020 US$ (that is lower than current oil prices). I agree rising costs may be a problem, especially if costs rise by a higher percentage than the percentage increase in the price of oil. So far well productivity has held up pretty well based on 3 month cumulative data from shaleprofile through 2021Q3, this could change in the future, new well productivity has hel up pretty well in the ND Bakken as well. I only have the estimates by Enno Peters on wells spud per rig on average in the various basins and the data I see reported on output. The future is unknown.
From http://www.shaleprofile.com at link below.
https://shaleprofile.com/blog/us/us-update-through-september-2021/
I forgot to mention that I assume in my Permian tight oil scenarios that average new well productivity decreases after 2020 in the Permian basin. Based on current data this might be too conservative an assumption. I thought North Dakota Bakken average new well productivity would start to decrease in 2014, the fact is this assumption was wrong, average new well productivity increased from 2015 to 2017 and has remained at that higher level until 2021 (a period of 7 years) and the North Dakota Bakken started its ramp up in horizontal tight oil drilling about 4 years before the Permian took off in 2011 (in terms of horizontal tight oil wells).
For the 4 North Dakota counties with the highest tight oil output and highest number of horizontal oil wells completed since 2005, the blog post linked below from http://www.shaleprofile.com has the following chart which accounts for changing lateral length over time (well productivity per 1000 feet of lateral length). Since 2017 well productivity has been fairly stable with increased productivity over the 2015 to 2017 period after a period of relative stability from 2011 to 2015.
Link to blog post
https://shaleprofile.com/blog/north-dakota/north-dakota-update-through-november-2021/
Exxon Mobil launches sale of U.S. shale gas properties -marketing document
The company in 2020 took about a $20 billion writedown on properties, primarily purchased with subsidiary XTO Energy a decade earlier. It removed gas assets in Appalachia, the Rocky Mountains, Oklahoma, Texas and elsewhere from its development plan after the writedown.
https://www.reuters.com/business/energy/exclusive-exxon-mobil-launches-sale-us-shale-gas-properties-marketing-document-2022-01-11/
It is fascinating that investors are just now figuring out that shale oil is not profitable. We’ve had research for over a decade indicating the net energy issues:
https://www.mdpi.com/2071-1050/3/11/2307/htm
Philip:
The article you appended seems to use oil shale interchangeably with shale oil. As I’m sure all of you reading are aware, that’s like interchanging near beer and real beer. To expound–probably needlessly for the well-informed crowd here–oil shale is kerogen, which is an oil precursor and has to be retorted at high temperature, anaerobically, to yield “real” oil. That produces a massive amount of CO2 and is not usually profitable under an oil price of about $120. Interestingly, much oil shale doesn’t really come from shale at all. This was the Colony project in Colorado that went bust 35 years ago.
The stage of oil maturation past kerogen is bitumen such as that found in the oil sands. Bitumen is great for laying down macadam but needs to be mixed with lighter oil to go through the refinery. Retorting isn’t necessary, per se, but it does need to be heated to get it moving.
Finally, shale oil is “real” oil–mature oil–of high quality that doesn’t require a retort chamber and is ready to go. Getting it into the pipeline is not exactly a clean process but it’s nothing like the massive GHG production from processing kerogen.
I feel like an idiot saying this to you bunch–I’ve read along and most of your comments are brilliant and you’re even nice to each other. And maybe I’m misreading the article (but usually when the word retort is used in the same sentence with shale it’s kerogen they’re talking about).
Again, as a non-fan but a follower of shale oil, using e-fracking and even mining cryptocurrency to mitigate the Statewide Rule 32 violation of venting/flaring forever this is a much cleaner and quieter process than it used to be. The problem is finding water for fracking and a safe place to dispose of the wastewater.
I see that everyone uses an alias to prevent hurt feelings so I’ll use one too.
RumDum
Gerry Maddoux,
You are correct, Philip, has confused shale oil (kerogen) with tight oil, the EROEI of tight oil is far higher than for kerogen.
The amount of oil produced from kerogen in the US is very close to zero.
Thanks for the clarification.
You are welcome.
Though you may have been thanking Mr. Maddoux who pointed out the error.
Thank you Gerry.
Philip,
Unfortunately sometimes tight oil is called “shale oil”, and kerogen resources are sometimes referred to as “oil shale”, this terminology is endlessly confusing, so we usually stick with “tight oil” and “kerogen” to avoid confusion.
See for example
https://geology.utah.gov/map-pub/survey-notes/oil-shale-vs-shale-oil-whats-the-difference/
More information on oil shale resources in the US from the USGS at link below
https://www.usgs.gov/centers/central-energy-resources-science-center/science/oil-shale
Wikipedia gives some production numbers (link below), one of the largest projects produced about 4.4 million barrels of oil over 5 years from 1987 to 1991, with a maximum production rate of 5.9 kb/d and an average output rate of 2.4 kb/d.
https://en.wikipedia.org/wiki/History_of_the_oil_shale_industry_in_the_United_States#1970s_-_the_energy_crisis
For comparison, tight oil output reached a peak level of over 8000 kb/d in 2019/2020.
Correction, the confusion is oil shale (kerogen) being confused with shale oil (aka tight oil), this is an easy mistake to make see my comment above.
Oil Demand Strength Exceeds IEA Expectations
Global oil demand has proven to be more resilient to the effects of the Omicron variant’s spread than the International Energy Agency expected, according to its chief, Fatih Birol, who spoke to media at a virtual meeting this week.
“Demand dynamics are stronger than many of the market observers had thought, mainly due to the milder Omicron expectations,” Birol said, as quoted by Bloomberg.
The following “This Week in Petroleum” was interesting
https://www.eia.gov/petroleum/weekly/archive/2022/220112/includes/analysis_print.php
Excerpt covering US future output:
We expect production will increase for most of 2022 as more new wells come online. For U.S. tight oil production, our models include a four- to six-month lag between a change in oil price and change in production. We expect the recent West Texas Intermediate (WTI) crude oil price, which averaged more than $70/b during most of the second half of 2021 (2H21), and average forecast WTI prices of $74/b during 1H22 will contribute to an increased number of active drilling rigs and production growth in the Lower 48 states (L48). We expect annual average L48 production of 9.6 million b/d for 2022, which is 3% lower than the 2019 record high of 9.9 million b/d.
We expect the WTI crude oil price will average $71/b in 2022. Although down from the current price, it is still sufficient for producers to realize positive cash flows in many areas, particularly the more productive areas of the Permian Basin. Most of L48 growth in the forecast comes from the Permian Basin.
In 2023, we expect that declining oil prices will contribute to slower rig additions, and production growth in the L48 will slow from 0.6 million b/d in 2022 to 0.5 million b/d in 2023. We forecast that L48 crude oil production will average 10.2 million b/d in 2023. Despite the slowing growth, we expect total crude oil production in the United States will average 12.4 million b/d in 2023, slightly surpassing the record high set in 2019 (Figure 3).
Figure 3 referred to in quote above is below.
Dennis.
I just read Mike’s most recent post on the Delaware Basin.
He is using shaleprofile data. It looks to me that some of the big Delaware operators are seeing lower productivity from new wells.
I looked at EOG some on shaleprofile also. Roughly, over a 3.5 year period, EOG spent what I estimate to be about $20 billion to hold gross oil production flat at about 580k BOPD. Again, these are rough figures, but it took over 2,000 wells in the lower 48 to accomplish this.
Are you seeing companies in the Delaware Basin that are having better wells as the years go by?
If EIA is correct, how many gross wells is it going to take to get US production back to slightly above the annual peak? We are talking not only shale, but also GOM, Alaska and conventional lower 48. Those would be everything from March, 2020 to the end of 2023.
That is a tremendous amount of money to barely grow. Maybe a few hundred billion $ when we consider all costs.
Doesn’t the slowdown of the early Covid pandemic show what is going to happen once the best locations are gone? Except there will be no rebound, absent some new field discovery or EOR breakthrough?
Shallow sand,
Thanks, another great post from Mike Shellman (link below).
https://www.oilystuffblog.com/single-post/delaware-basin-2021
I do not have access to all of the shaleprofile data. Only the stuff freely available at the blog.
For all of the Permian basin at 24 months the average cumulative output for wells that started producing from 2016 to 2019 was (listed by year starting in 2016), 180.8 kb, 189.8 kb, 202.1 kb, and 215.6 kb. To normalize for 1000 feet of lateral I have to estimate from the recent US post at shaleprofile for average lateral length for Permian basin, again listed by year starting with 2016 in feet, I get 7000, 7500, 8000 and 8500 as rough estimates from the chart (see link below).
https://shaleprofile.com/wp-content/uploads/2022/01/Normalized-well-productivity-1.png
So well productivity per 1000 feet of lateral (again starting with 2016 in cumulative kbo at 24 months) is 25.8, 25.3, 25.3, and 25.4. Mike is correct that productivity has decreased, the average annual rate of decrease in normalized well productivity at 24 months is about 0.5% per year from 2016 to 2019.
My guess is that Enno Peters looked at how 3 month cumulative data compared with 24 month cumulative for the entire Permian set of wells and decided it was a good approximation. Enno is a wizard with the data and has access to all of it at his fingertips, I doubt he would have created a misleading chart.
If we use 24 months or 36 months as our criterion then we can only consider wells up to 2019 (for 24 month cumulative) or to 2018 (for a 36 month cumulative). Enno may have chosen 3 months so he could look at more recent wells.
Some of the decrease in well productivity might be due to spacing wells too tightly, over time when an optimal well spacing is determined (LTO Survivor has suggested 4 wells per section width or 1320 feet between laterals) well productivity might stabilize. As I have pointed out it has been stable or increasing in the Bakken from 2014 to 2020 and that play started ramping up horizontal tight oil output in 2007, about 4 years earlier than the Permian basin (2011 was when horizontal tight oil output started ramping up in the Permian). Of course the two plays may behave very differently.
The USGS has about 30 million prospective acres in the best benches (highest EUR per acre) of the Permian basin with a UTRR of about 45 Gb, if we assume about 300 acres per well on average that would be about 100 thousand wells to be completed from Jan 2018 until the last well is drilled. I don’t include about 25 Gb of the USGS UTRR in the less productive benches.
I don’t look at the data on a company by company basis, I focus on overall average data for the Permian basin from shaleprofile.
After the best locations are gone output will decrease, but my expectation is that there will be a continuum, wells will gradually get worse from a productivity perspective (when looking at basin wide averages) and completion rate will slowly decrease (unless we see a severe drop in oil prices to under $30/bo as in the spring of 2020.) Seems to me April 2020 was unusual, we may not see oil prices go negative again in the future.
Finally I think the EIA’s STEO is quite optimistic on US output, my optimistic scenario for US output (high completion rate in Permian basin rising to 800 new wells per month) has average 2023 US C plus C output at 10819 kb/d and a peak in 2027 at 14537 kb/d. Output falls rapidly to 6669 kb/d in 2034 as I assume oil prices start to fall after 2028 due to peak oil demand.
I agree there will be no rebound after 2028, it will be lower US output year after year. Tight oil output falls to 105 kb/d in 2043 for my “optimistic scenario”, US tight oil URR for that scenario is 65 Gb, with about 43 Gb of cumulative tight oil production after October 2021 for this scenario. Peak tight oil output for the scenario is 11673 kb/d in 2027 (annual average output).
My optimistic US scenario in chart below, URR is about 65 Gb.
Dennis.
Your prediction for the steep drop is strictly demand based? You don’t foresee a production drop having anything to do with lack of well locations, or am I misinterpreting your views?
Shallow sand,
It is based on my assumed oil price scenario. Different oil price assumptions would lead to different results. For comparison, the EIA has cumulative tight oil production through 2065 at about 120 Gb, my scenario about 65 Gb.
My oil price scenario is below, can you give me your best guess and I can run the model?
Shallow sand,
If prices remain high then output will drop due to a lack of well locations, the scenario below has a more conservative completion rate than my “optimistic scenario” with maximum completion rate of 600 wells per month vs 800 completions per month for optimistic scenario.
In this case the well locations are the factor leading to lower output rater than prices.
Dennis Coyne; I do not pretest to be an oil analyst, I am an “influencer.” I try to use “data,” and my experience to persuade people into believing the way I do, and that is that the tight oil phenomena in the US is nothing more than a speed bump on the road to serious hydrocarbon depletion in our country, and in the world. I readily admit that I hope that people are inclined to believe me because I have been in the oil and natural gas business for a half century, with my own money, and I understand the pain of decline and the heartache of depletion. I genuinely want people to understand this stuff better and to get ready.
You, on the other hand, offer no real life experience in business, or the oil and gas industry; you have nothing whatsoever invested in your beliefs. In spite of all the intellectual superiority you convey over everyone, you do not not put your money where your mouth is; you simply argue for the sake of arguing. Your not an analyst either. You pick and chose data to support your believes simply for the need to be relevant. To be able to say someday you got one out of 9,957 guesses, right. Which of our motives is right is for others to decide; never on oilystuff do you ever get mentioned.
Enno Peters is my friend; he has come to Texas to visit me and see the real world oil business; I have tried to help him, as an actual oil operator in Texas, for the past six years, to develop his remarkable data service and I am using that data that he provides EXACTLY as he would want for me to. To think for myself and reach my own conclusions about the tight oil business. You are an asshole of immense proportion for your repeated attempts to suggest Enno would not approve of what I do with his data. I have never, nor would I ever, suggest or imply that Enno’s data is not correct, that he is wrong, or that my opinions are better than his. That is chickenshit on your part. If you don’t agree with me, man up with your own data and leave Enno out of it.
Don’t read my stuff, dude. Its over your head.
Mike, I genuinely appreciate your insights into the oil industry with all your hard-won experience, but your continued insulting of our host gets really old. Try to make your point without calling names. Dennis is offering his best opinion on what the future will look like based on his own background and set of experiences. You need to try to give him the benefit of the doubt and not see an insult in every comment that he makes.
Tell you what, pardnor; speak to your “host” about not insulting MY work, my experience, or my industry and the people in it trying to counter the tight oil abundance narrative. If I actually provided some of my work here I would expect to defend it and relish in a respectful debate. I don’t precisely because of HIS repeated insults. Your host knows exactly what he is doing, and why, even if you don’t. Do that for me and I’ll never comment here again. Then we’ll all be better off.
Mike,
Do you consider someone disagreeing with you to be insulting?
Can you point out some of the insults I have levelled? I think you imagine insults where there are none. I have never insulted you intentionally.
As to my motives, those are to inform people of where the oil industry might be headed, the motives you imagine are incorrect.
There are many different viewpoints expressed on this blog, my views are the views expressed in my comments and they change over time as I get new information. When have I insulted you, your work, your experience or your industry?
The views expressed by others on this blog do not represent my views.
Mike,
You do great work and I agree that Enno’s stuff is fantastic. I do not have access to the full data to be able to look at lateral lengths, etc, I only see what is available at the blog. My humble apologies for seeming “superior”. What I post is never intended to offend and I am truly sorry that no matter what I say you seem to think I am insulting you.
I learn by asking questions and I have learned a lot from you, thank you.
US reserve estimates for the end of 2020 are out
https://www.eia.gov/naturalgas/crudeoilreserves/
A big decrease in US tight oil proved reserves with 2020 reserves 3581 million barrels less than 2019. Part of this change may have been the low oil prices in December 2020 ($47.02/b) compared to December 2019 ($59.88/b).
In 2015 when oil prices dropped from the 2014 level (37 from 59) tight oil reserves dropped by 15%, in 2020 we also saw about a 15% drop in reserves, though in 2020 the drop in oil prices was smaller (59% oil price drop in 2015 vs 27% in 2020.) A lot more stuff going on in 2020 with pandemic etc so not an apples to apples comparison (it never is, but maybe less so in this case).
In other words, those proved reserve numbers are meaningless. It’s a the proved plus probable reserves that matter — does anybody know what they are for the US?
Tks Dennis . I was going to post this but you beat me to it . No problem . Confirms what I have been saying from long . All estimates by EIA and USGS are unreliable . Period . I don’t want to get into the discussion about their definitions of reserves . The problem I have earlier highlighted was that only these organisations have the mandate , resources and manpower to collect O&G data . So we are stuck , this is a “take it or leave it ” situation .
Hole in head,
I disagree, the estimates are the best guess of experts, proved reserves depend on the price of oil, when that changes the proved reserves are revised. USGS estimates are an expert guess on future discoveries, any estimate of the future is likely to be wrong, infinite number of possible futures, pick one, odds of success (picking correct scenario) is one divided by infinity which is zero.
A kind of funny, mildly OT, thing happened in Sweden this week since we are exporting all the electricity we can, preferably at low prices and then importing at high prices, brilliant as we are, thusly making some customers bills larger than normal…
Anyway, now the government will reimburse those with high electricity bills, regardless of location (there are four price areas with large differences in price) and regardless of your heating system and any improvements made, so naturally I´ve taken more saunas in my regretfully electric heated one this week, and in the process also having more beers. So I wonder if the I can send an invoice to Magdalena, the new prime minister, for the beers too?
So, in conclusion, if oil prices rises fast similar things might also happen elsewhere. Some co-workers actually wondered when the Diesel tax reimbursements will arrive, just a matter of time, I guess…
https://www.svt.se/nyheter/inrikes/norrlanningar-vinnare-pa-regeringens-el-stod
🙂
Govts will never subsidise carbon fuels. Never! If they do, Greta will be on their case.
Electricity is clean and green – when you don’t look deeper into how they get made!! So, that can be subsidised.
When oil prices go up and people complain, there will be a big push from the govts to make people buy electric cars.
Enjoy your sauna and the beers and have a great weekend everyone!
Ancient, as hard as I´ve tried, we still exported quite a few GWs the last week, and month on average, quite a bit of it wind actually.
But thanks, and the same to you!
https://www.nordpoolgroup.com/Market-data1/Power-system-data/Exchange1/SE/Hourly1/?view=table
Per shaleprofile.com
August, 2014, 9,814 wells in the North Dakota Bakken produced and average of 1,095,593 BOPD.
November, 2021, 16,944 well in the North Dakota Bakken produced and average of 1,094,240 BOPD.
So 7,760 wells in 87 months, or about 89 per month, to stay in place.
However, it looks like the recent wells must be better, as ND Bakken is staying in place, or close to it, with 50-60 wells per month.
I wonder if re frac of old wells is making up the difference, at least in part?
OTOH, still way below peak.
It’s all about well locations. When they run low, off the cliff we go.
Shallow sand,
For Bakken I have the following with ERR=7393 million barrels. cumulative output up to Dec 2020 for ND Bakken/Three Forks was 3749 million barrels, proved reserves on Dec 31, 2020 for Williston Basin were 3685 million barrels, added together this is 7434 million barrels. Total wells completed for this scenario are 22652 (6375 wells completed after November 2021, about 69 wells per month on average), with last well completed in August 2029, completion rate on right axis.
Note that this scenario was done on January 6, 2022 before the 2020 reserves had been published and 2019 reserves were significantly higher for Williston basin (2.16 Gb higher than year end 2020).
We should Pray to The Wind Gods for Germany as it becomes more reliant on extremely volatile Wind Power for its Electricity Production.
https://oilprice.com/Latest-Energy-News/World-News/Germany-To-Become-Net-Power-Importer-For-The-First-Time-Since-2002.html
After Germany & Europe received a nice LNG Shipment last week, all that is GONE NOW. Up in smoke and now history.
German Natgas Storage Levels are now 21% lower than last year. With Germany closing down more Nuclear and Coal, we suggest everyone PRAYS to the WIND GODS to keep Germans warm during the winter.
However, if Germany can get through the winter, they will likely be at 30-40 TWh of Gas Storage, much lower than the 65 TWh low last year. Thus, they will have to make up for it after the summer.
So, not only do we PRAY FOR THE WIND GODS to continue blowing, but we also should PRAY TO THE COOL WIND GODS during the summer. If Germany experiences a scorching summer, this could set them up for a disastrous Fall Natgas Storage building deficit.
steve
Well, they could also turn off their airconditioning units and enjoy the outdoors (the horror…) and also possibly put some frequency inverters on their electric motors for compressors, fans, hydraulic pumps etc… Quite a few of them in Wolfsburg and Stuttgart! Been there, see`n that.
And a bit of insulation might also help, in both directions.
Not much airconditioning in private homes here. Wind is needed in the Summer, too – in the summer nights the spare capacity runs on gas.
Europe shouldn’t fight the battle with russia for the USA – or the USA should offer long scale gas supply contracts. Russia always hold their contracts even in the cold war.
And the Ukraine is russian influence area, not Nato. Compares like China and Russia would make a coup im Mexico and install a government direct at the US border…
The prayer must begin now because there is a big anticyclone on western Europe which is expected to last during the whole month. Therefore, as weather is cold, they are going to have less gas than that at the end of last winter. https://energy-charts.info/charts/power/chart.htm?l=fr&c=DE&stacking=stacked_absolute_area&interval=month&legendItems=00000000000010100
It will get just expensive I think. Liquid gas traders will come to Europe, and in Asia prices will rise, too. I hope the warning shot will be felt – things must get really expensive that something changes.
Next winter additional 3 atomic plants will be shut down in Germany – even more gas needed. In these cold weather episodes where much heating is needed, seldom is much wind. So all these wind energy and solar plans for the next years doesn’t really help much.
I still have an oil therme – will be forbidden in 10 years I think and has to be replaced with a heat pump. Let’s see.
Perhaps buy a jet ticket to the Canarian islands and work “home office” in the winter…
You can also buy a furnace and burn in it the election posters and leaflets off the pretended ”ecologists”. There are always to much election leaflets and posters after an election and they will be happy to find someone wanting them.
Equinor (EQNR) Revises Mariner Oilfield Reserves in UK North Sea
Equinor ASA EQNR reduced its estimate of total recoverable reserves in the Mariner oilfield to 180 million barrels of oil equivalent from its initial consideration of 275 million barrels.
The downward revision led to an impairment charge of $1.8 billion in the area. The Mariner oilfield is situated on the East Shetland Platform of the U.K. North Sea. Equinor operates the field with a 65.1% interest.
Not looking good for the energy situation in the UK.
Equinor ASA EQNR reduced its estimate of total recoverable reserves in the Mariner oilfield to 180 million barrels of oil equivalent from its initial consideration of 275 million barrels.
Down from 0.275 Gb to 0.180 Gb. Put that in perspective to the amounts of crude oil in big, giant and super giant oilfields. Amounts (OOIP = oil original in place) of which mostly less than 50% can be extracted at suitable velocity. Frugal, you are mentioning the kind of discoveries that the world has mostly to do with now. The world needs hundreds of them EVERY year. And even then…
There will be a new post on Non-OPEC production on Saturday afternoon.
Another thing for the chart technicans here.
Oil price rallied to exactly the October high on friday. Now it’s on a crossroad – rally to 100$ or make a deep crash when too many failed attempts are there.
I think hedge fonds are in big, so much senseless dynamic in the marktets.
Eulenspiegel:
The price of copper, aluminum, lithium, cobalt, dysprosium, “clean” nickel, and zinc are going up, up and away, what with the green energy movement. All energy, especially electricity, is going up in price as scarcity sets in. 2021 saw the lowest oil discovery since year 1946. The “transition” is going to be rougher than a cob.
I have followed the erudite conversations here: all the established oilfields are going to run out about the same time, for different reasons. The shale fields are pierced through with rat-tunnels. Siberian infrastructure is sinking into the muck. The North Sea oil is hard to get at. Saudi Arabia is water-flooding @ near-desperation levels. Canadian oil-sands oil is about the dirtiest to get at, and is of low quality. Mexico has given up. Venezuela is too corrupt to even supply its filling stations. The “woke” generation board members on the Exxon board (3 activists) are out to hogtie the only company with a new find (Guyana)–and even it is gassier than my Aunt Sally. If I know these things, the market knows them. JP Morgan will not loan to big GOM projects. It’s mass suicide out there–like handing out the poison kool-Aide to only the fossil fuels crowd. Of course, some of that was self-inflicted.
This is not necessarily a hate piece. George Mitchell basically saved America with his “Tombstone Rock” in the Barnett Shale–his company provided NG for almost 10% of American electricity one year. But that is gone. And soon will be gone the other shale basins–they’re being drilled out too fast, with <20% recovery. Re-fracking is helping in the Bakken, but it's small potatoes overall, and hit and miss–especially with low reservoir pressures and cross talk idiosyncrasies that seem to be unpredictable.
In the near future, petrochemicals will likely be manufactured using LNG, but without the shale oil fields the production of NG in the U.S. will truly flag. Since oil trades on futures contracts, and the future says we're likely to see a 30-million BOD deficit in roughly five years, this thing is likely going to tighten up dramatically. I would imagine we'll see three-mile laterals in the Tier-2 and Tier-3 shale oil properties, lots of cheap-to-drill vertical wells into places like the Austin Chalk and the Granite Wash, and overall mayhem in the oil and gas world. In fact, I think we'll see a ridiculous level of madcap shenanigans by the Doc Joiners of the world.
To perform this green energy movement, using wind and solar primarily, the price of rare earth elements is going to the sky–because China controls the market. They just merged six companies to form the China Rare Earth consortium. The graben in Helmand province in Afghanistan is probably the greatest concentration of REE's on Planet Earth–and the U.S. just walked away from it, leaving behind a great air base, as well as all the REE's (surveyed by the USGS in 2004-'06). Afghanistan has already reached out to China to mine the graben. China controlled 95% refined REE's before Afghanistan. That just became more lopsided. Perhaps China will be munificent with its rare earth elements, but I sort of think they're going for worldwide hegemony. A few months ago the European Space Project used the International Space Lab to see if REE's could be mined from the regolith covering basalt on the moon–in a microgravity situation. That shows just how desperate the world is for REE's. If I know this, China knows it. Not only that but it takes a long time to get a REE mine up and going and our best sites are in California and Montana–might be a problem there. SMR's (small modular nuclear reactors) are great, but they're mostly made by Rosatom, a Russian company with a backed-up orders log. Hydrogen will take a while.
The energy situation–especially electricity–is not looking good for the world. The price is going up, no matter what kind of cap and ban (on U.S. oil and gas) might come into play by executive order. In short, there's going to be hell to pay for this energy transition, with possible mass-existential accidents. The market is foreseeing this and the worldwide price is going at least to the mesosphere.
For rare earth minerals:
There is a medium sized deposit even in Germany – but nobody, especially greens, like mining because it’s dirty and noisy and always something can go wrong and loud trucks are driving through romantic villages.
So getting stuff from China is the easy way. As far I know some rare earth mines in the USA and Canada have closed years ago – too expensive and no strategic interrest. You can always get stuff from China…
You don’t need to look at space.
And for other things: Expensive raw materials are good – then waste is reduced and engeneering enforced. Look at the batteries: From Cobalt / Nickel / Lithium / Copper to Iron/Phosphor/Lithium/Copper to Sodium / Iron / Aluminium (CATL is doing the production rampup here at the moment). They arent’ top performance (but great in winter, Canadians will love them) – but they don’t have any bottlenecks.
The same with generators: When rare earth gets too rare and expensive, synchrone generators and motors will be back.
And the current energy crisis I count to the post-Corona-chaos and chinese political games with Australia. It will settle, there still is enough gas and coal. High prices will help to develop ressources and be less wasteful with the stuff.
Huge quantities of oil are optional. You can convert low range city traffic in short time to propane gas. I’ve seen that in Sofia/Bulgaria, every taxi was driving with a propan bottle in the trunk. It was because of the price.
Gerry , a very good assessment . Unfortunately you have written this at the fag end of this post . I suggest you repost this on the new Non -Opec post now up . I think many would like to engage on this topic .
A new thread on Non-OPEC production has been posted
https://peakoilbarrel.com/september-non-opec-oil-production-slips/
A new open thread Non-Petroleum has been posted.
https://peakoilbarrel.com/open-thread-non-petroleum-13/