A guest post by Ovi
Below are a number of oil, crude plus condensate (C + C ), production charts for Non-OPEC countries created from data provided by the EIA’s International Energy Statistics and updated to September 2021. Information from other sources such as OPEC, the STEO and country specific sites such as Russia, Brazil, Norway and China is used to provide a short term outlook for future output and direction for a few countries and the world.
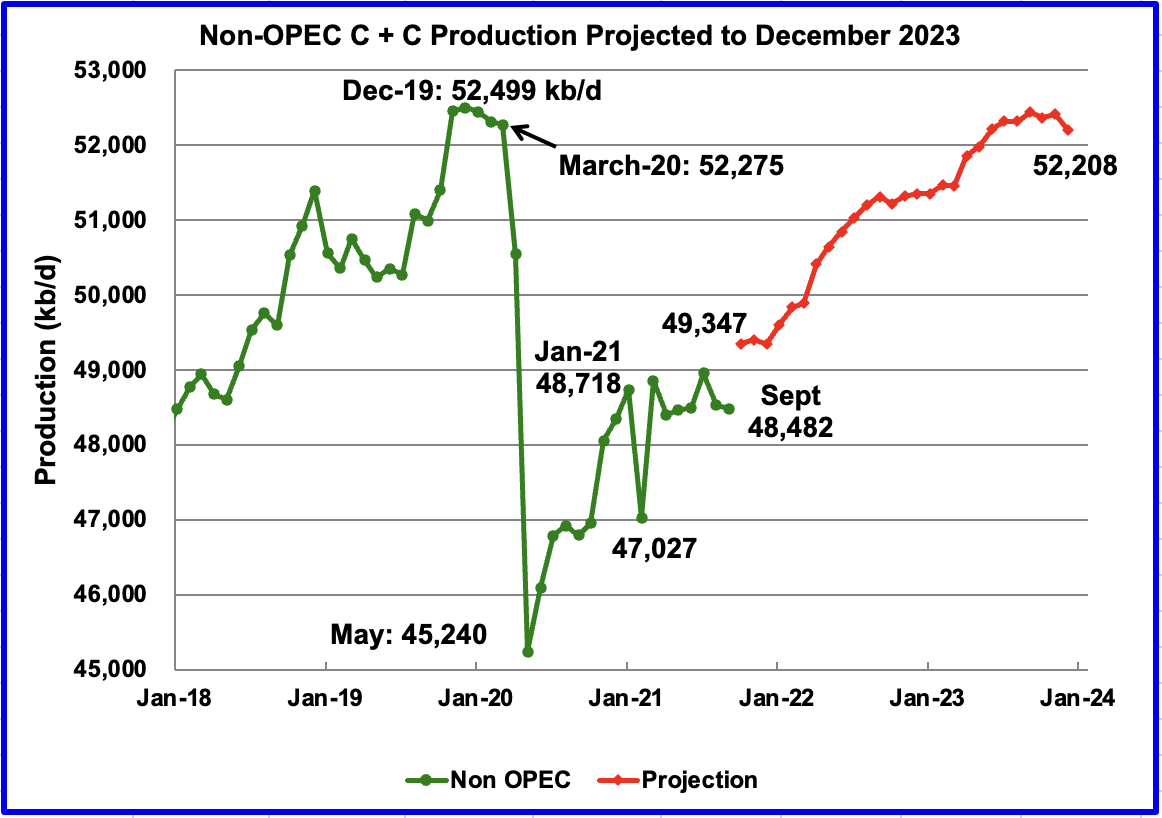
September Non-OPEC production declined by 44 kb/d to 48,482 kb/d. The biggest changes in production occurred in the US, -381 kb/d and Russia, +290 kb/d.
Using data from the January 2022 STEO, a projection for Non-OPEC oil output was made for the time period October 2021 to December 2023 (Red graph). Output is expected to reach 52,208 kb/d in December 2023, which is 291 kb/d lower than the December 2019 pre-covid peak of 52,499 kb/d.
Output in October is expected to rebound to 49,347 kb/d, an increase of 865 kb/d. The majority of the 865 kb/d increase will come from the recovery of US production in October, 651 kb/d, and close to 250 kb/d from OPEC.
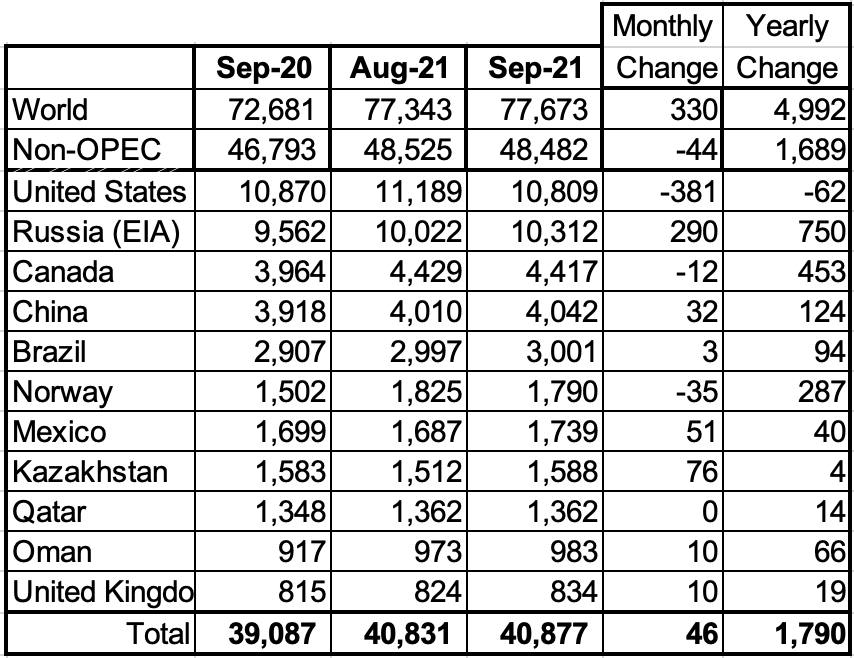
Above are listed the world’s 11th largest Non-OPEC producers. The original criteria for inclusion in the table was that all of the countries produced more than 1,000 kb/d. The last two have currently fallen below 1,000 kb/d.
In September, these 11 countries produced 84.3% of the Non-OPEC output. On a YoY basis, Non-OPEC production increased by 1,689 kb/d while on a MoM basis production decreased by 44 kb/d to 48,482 kb/d. World YoY September output was up by 4,992 kb/d.
Production by Country
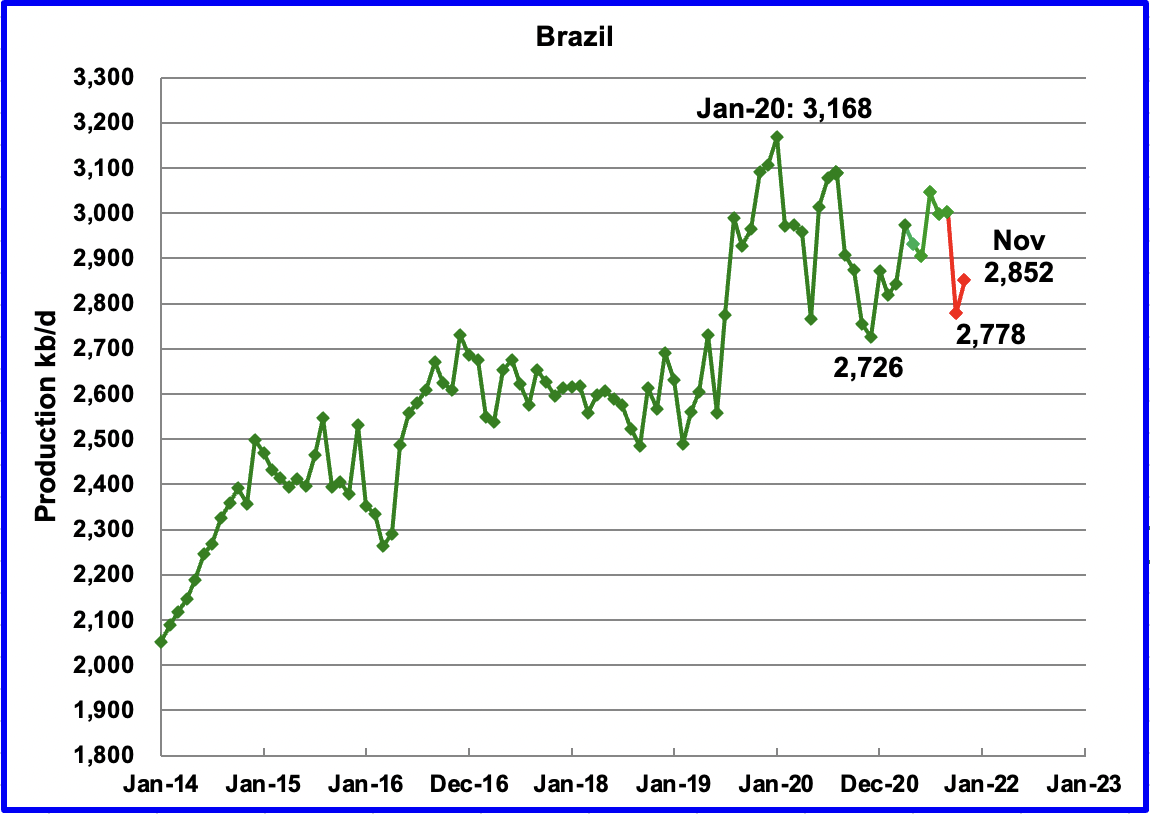
The EIA reported Brazil’s September production increased by 3 kb/d to 3,001 kb/d. According to this source, October output dropped by 223 kb/d to 2,778 kb/d in October and then rebounded to 2,852 kb/d in November. (Red Markers).
With regard to Brazil, the December OPEC report stated: “COVID-19-related health and safety measures at production platforms, delays in project start-ups and heavy natural declines at offshore mature fields, particularly in the Campos Basin, have also contributed to under-performance in production.”
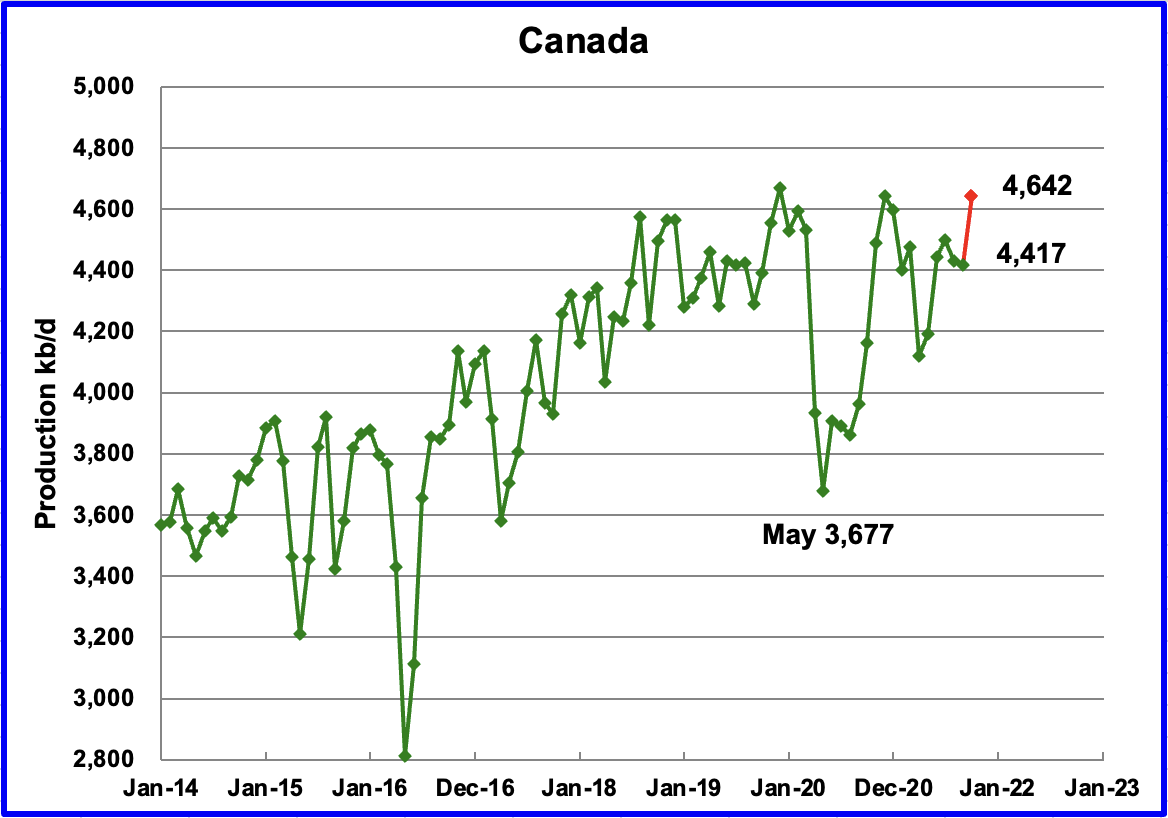
According to the EIA, September’s output decreased by 12 kb/d to 4,417 kb/d.
Canada’s Energy Regulator (CER) has partially updated Canada’s oil production estimates up to October. The main change for October was an increase of almost 225 kb/d in upgraded bitumen. The increase in bitumen production, 225 kb/d, has been added to the EIA’s September output to provide an estimate for October, 4,642 kb/d.
On October 1, the updated Enbridge Line 3 pipeline began operating to deliver crude to Superior Wisconsin. The new line delivers more crude and is safer since it replaces a 50 year old pipeline.
With the addition of Line 3, Canada has gone from famine to feast with regard to pipeline capacity. In addition to Line 3 starting up, Marathon reversed the direction of its Capline pipeline from flowing South to North to North to South.
According to this source: “In just a few months, heavy crude from Western Canada will start flowing south on the Capline pipeline from the Patoka, IL, hub to the one at St. James, LA. While the initial volumes will be modest, Capline’s long-awaited reversal will provide Louisiana refineries and export terminals with easier, lower-cost access to oil sands and other Alberta production. Flipping the pipeline’s direction of flow also means more changes for the St. James storage and distribution hub — one of the U.S.’s largest — which has already seen more than its share of evolution during the Shale Era.”
According to this source, Capline began operating on Dec 18 with initial capacity of 200 kb/d. The additional capacity along with supplying Louisiana refineries has reduced the WCS to WTI discount according to this source. Essentially this means that as of January 1, 2022, Canadian heavy oil flowing to the US is not pipeline constrained anymore.
An unanticipated benefit of Capline and Line 3 becoming operational at roughly the same time is that Canadian oil producer can now ship more oil to the Gulf coast and then on to Asia according to this source.
“The recent reversal of Marathon Pipe Line Inc.’s Capline pipeline is sending oil sands crude produced in landlocked Alberta to export terminals on Gulf Coast where it can be shipped to other countries. Exports to Asia were at their highest ever, with India the leading destination by far, followed by China and then South Korea, according to oil analytics firm Kpler.”
“Shipments of heavy crude jumped to more than 266,000 barrels a day in December after averaging over 180,000 through the year, according to Kpler. Canadian crude exports from the U.S. Gulf Coast averaged just 25,000 barrels a day in 2018, before rising to average around 70,000 in both 2019 and 2020.”
In October Canada shipped 132.6 kb/d by rail to the US which was 32 kb/d lower than in September. Will this downward trend continue now that there is more pipeline capacity?
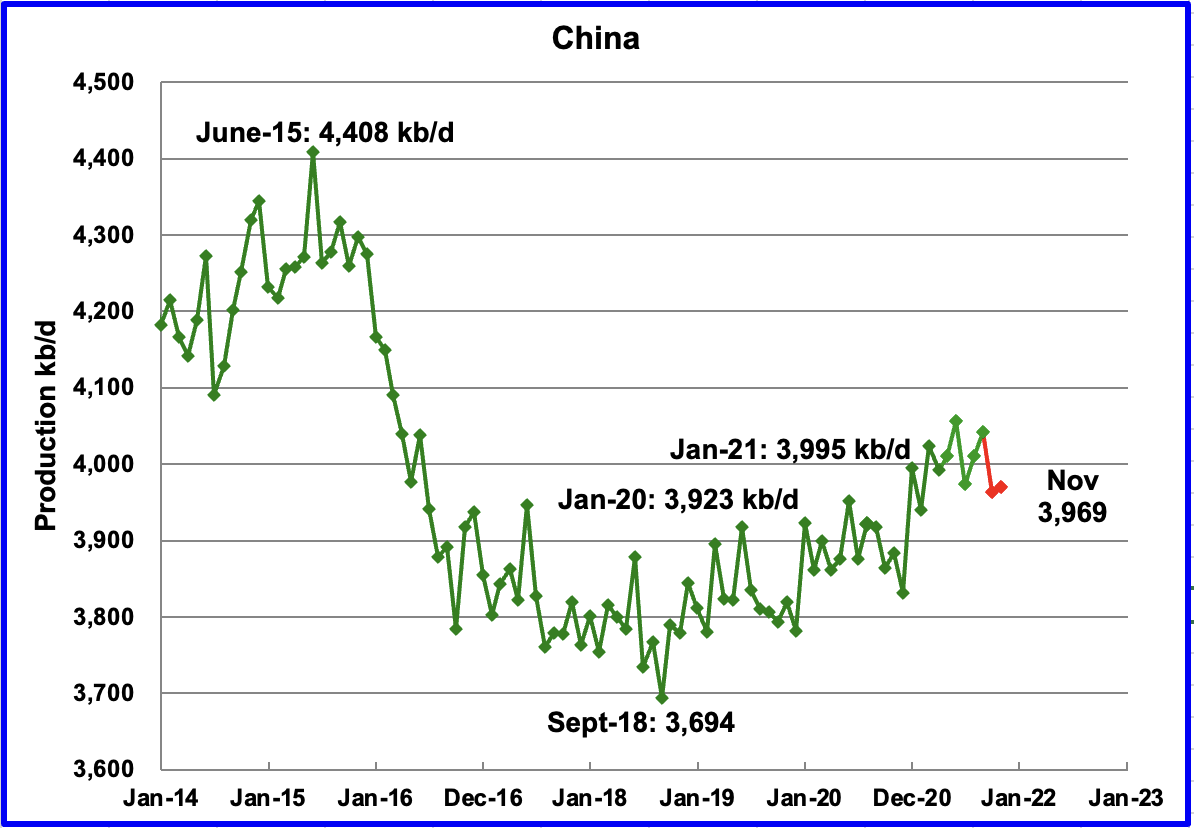
The EIA reported China’s September output increased by 32 kb/d from August to 4,042 kb/d. However in October output dropped by 79 kb/d to 3,963 kb/d and then increased slightly by 5 kb/d in November to 3,969 kb/d according to this source. (Red markers)
From January 2020 to January 2021, China’s daily output increased by 72 kb/d to 3,995 kb/d. For 2021, no growth is apparent up to November 2021. Note also that November 2021 production is only 46 kb/d higher than January 2020.
According to this source, China’s CNOOC raised 2022 production target, expects domestic crude output to hit peak by 2030. Its Bohai oil cluster off north China has overtaken Daqing to become the country’s biggest crude oil production base, with 2021 output hitting 30.132 million tonnes.
For 2022, the company plans to drill 227 offshore exploration wells and 132 onshore unconventional exploration wells.
It also expects to launch 13 new projects, including the Bozhong, Kenli and Enping oil fields in China, Liza Phase II in Guyana and 3M in Indonesia.
December 2021 was the first month since March that China imported more oil than last year according to this source. I wonder if this report caused the price of WTI to hit a new inter day high yesterday.
“December oil arrivals reached 46.14 million tonnes, up nearly 20 percent in the first monthly year-on-year growth since April, as independent refiners rushed to utilise 2021 quotas, customs data showed. The December influx, equivalent to about 10.87 million barrels per day, was the highest daily amount since March.
In a backwardated market, prompt delivery prices are higher than those in future months, discouraging companies from storing oil.
Liu Yuntao, an analyst with Energy Aspects, estimated 70 to 90 million barrels of crude oil were drawn down from storage throughout last year, including a rare public auction of strategic petroleum reserves in September.”
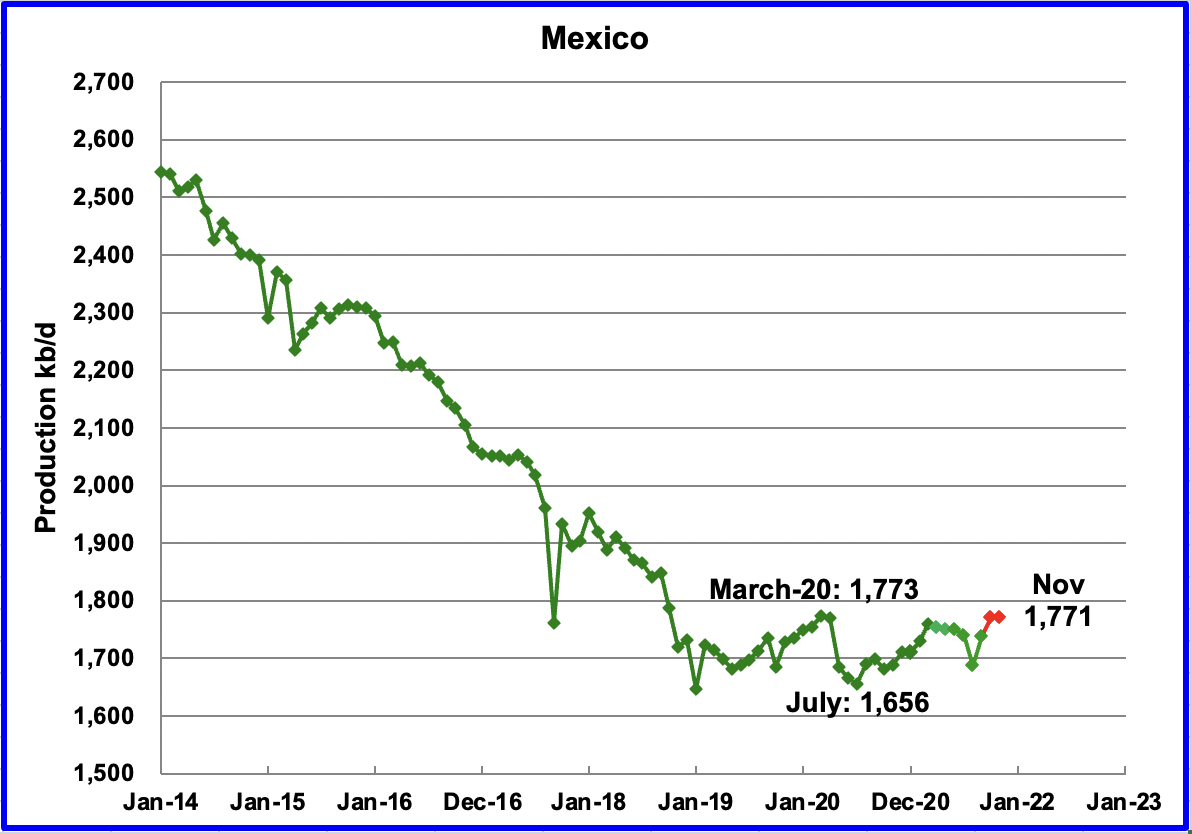
Mexico’s production, as reported by the EIA for September increased by 51 kb/d to 1,739 kb/d. Data from Pemex shows that October’s output continued to climb to 1,771 kb/d and stayed at the same level for November. (Red markers).
Production has been range bound between 1,650 kb/d and 1,800 kb/d since January 2019. Note that November 2021 production is essentially the same as March 2020.
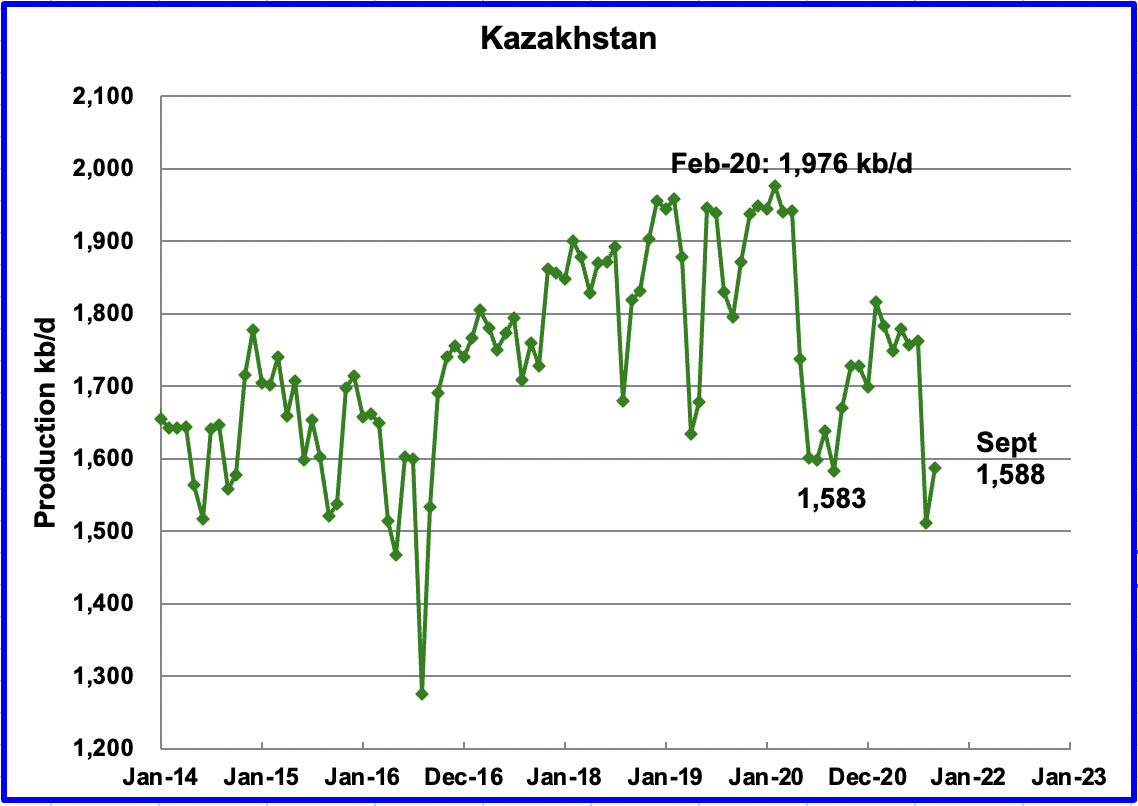
Kazakhstan’s output increased by 76 kb/d in September to 1,588 kb/d following the end of maintenance in the Tengiz field.
Under the OPEC + Declaration of Cooperation, Kazakhstan can produce 1,508 kb/d of crude in September. The September 1,588 kb/d output is C + C.
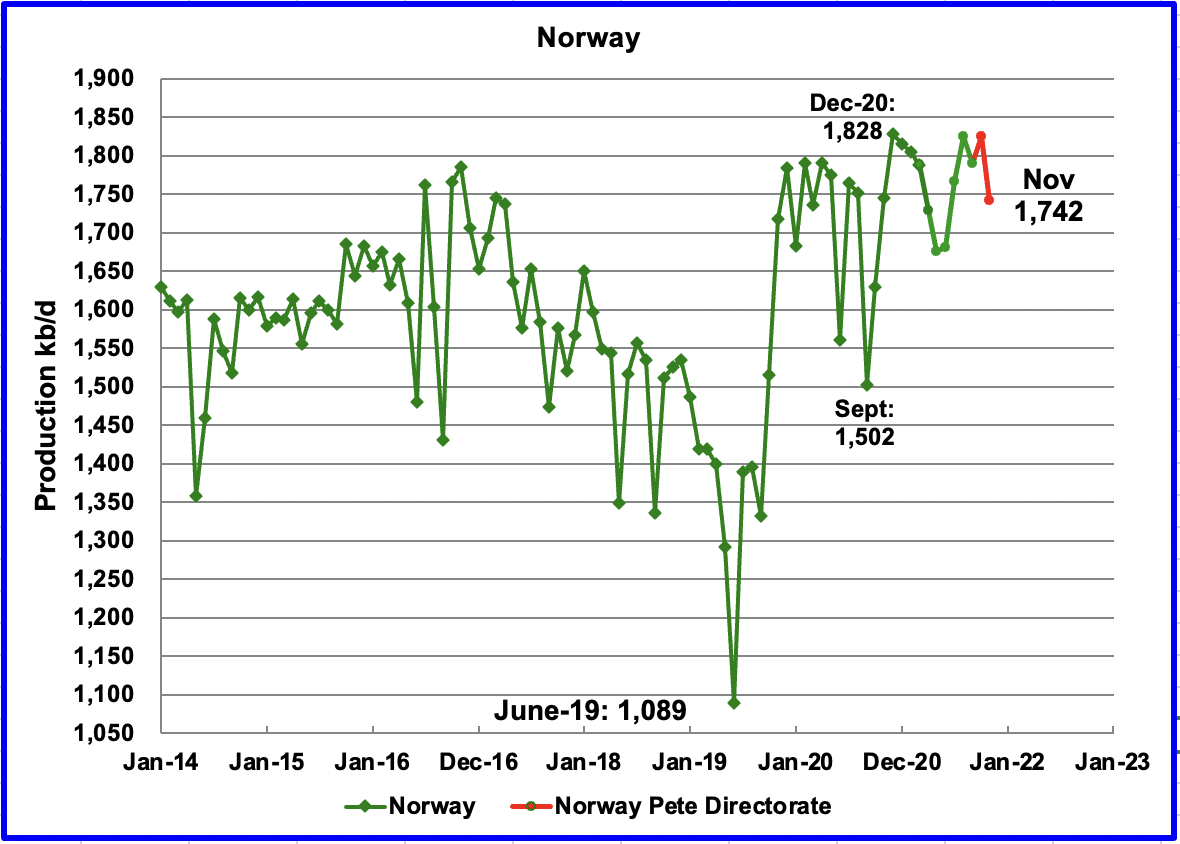
The EIA reported that Norway’s September production was 1,790 kb/d, down 35 kb/d from August. The Norway Petroleum Directorate (NPD) reported that production in October increased back to 1,825 kb/d and then declined to 1,742 kb/d in November. (Red markers.)
According to the NPD, November production dropped due to technical problems. The production level was 5% lower than the Directorate had forecast.
According to the December OPEC report, “The higher oil output in October was due to first oil from Aurfugl Phase 2 by operator Aker BP as well as rising production in Martin Linge, which started-up in July. Part of this monthly increase is also due to the return of some fields from seasonal maintenance. Moreover, after years of delays, the Yme field in the southeastern part of the Norwegian sector of the North Sea started production on 25 October. At its peak, the field should deliver around 56 tboe/d.“
Earlier this year, the NPD implied that Norway’s production would exceed the December 2020 output in the latter half of 2021. There is only one month left to go.
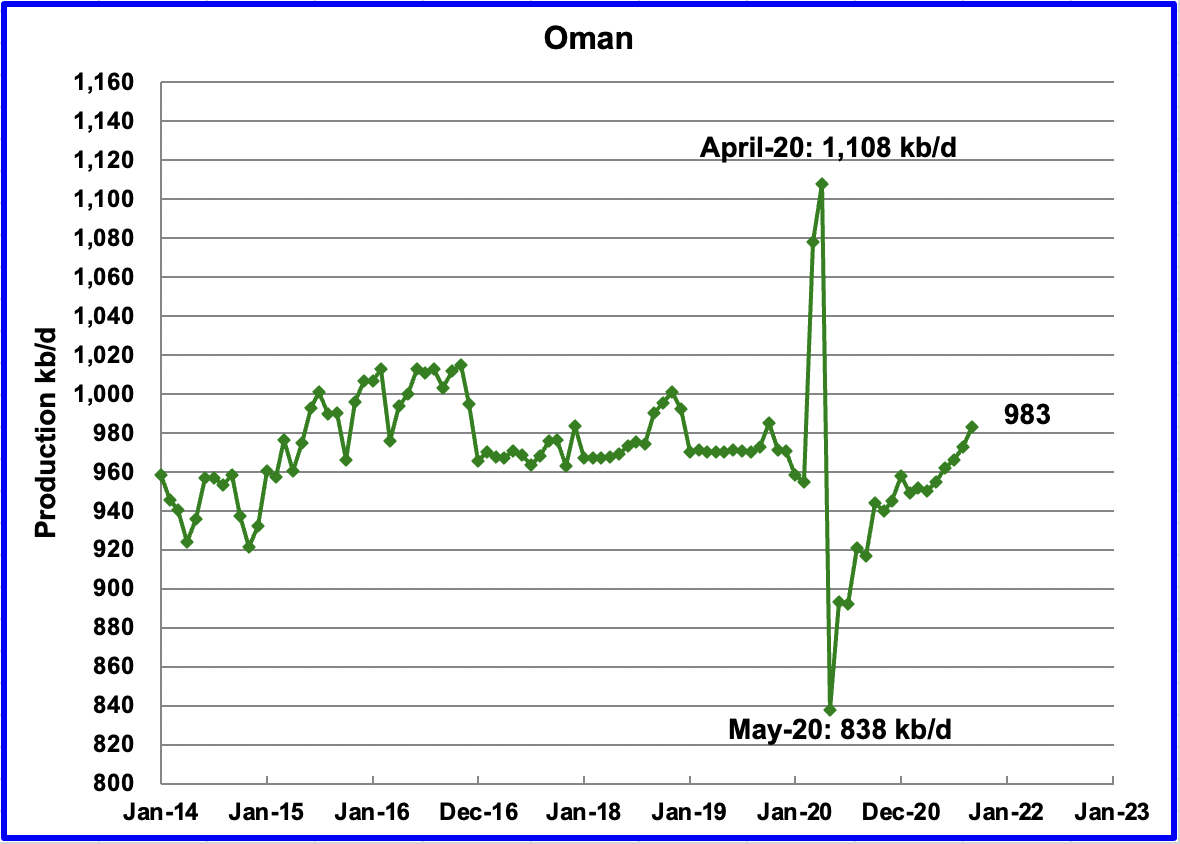
Oman’s September production increased by 10 kb/d to 983 kb/d.
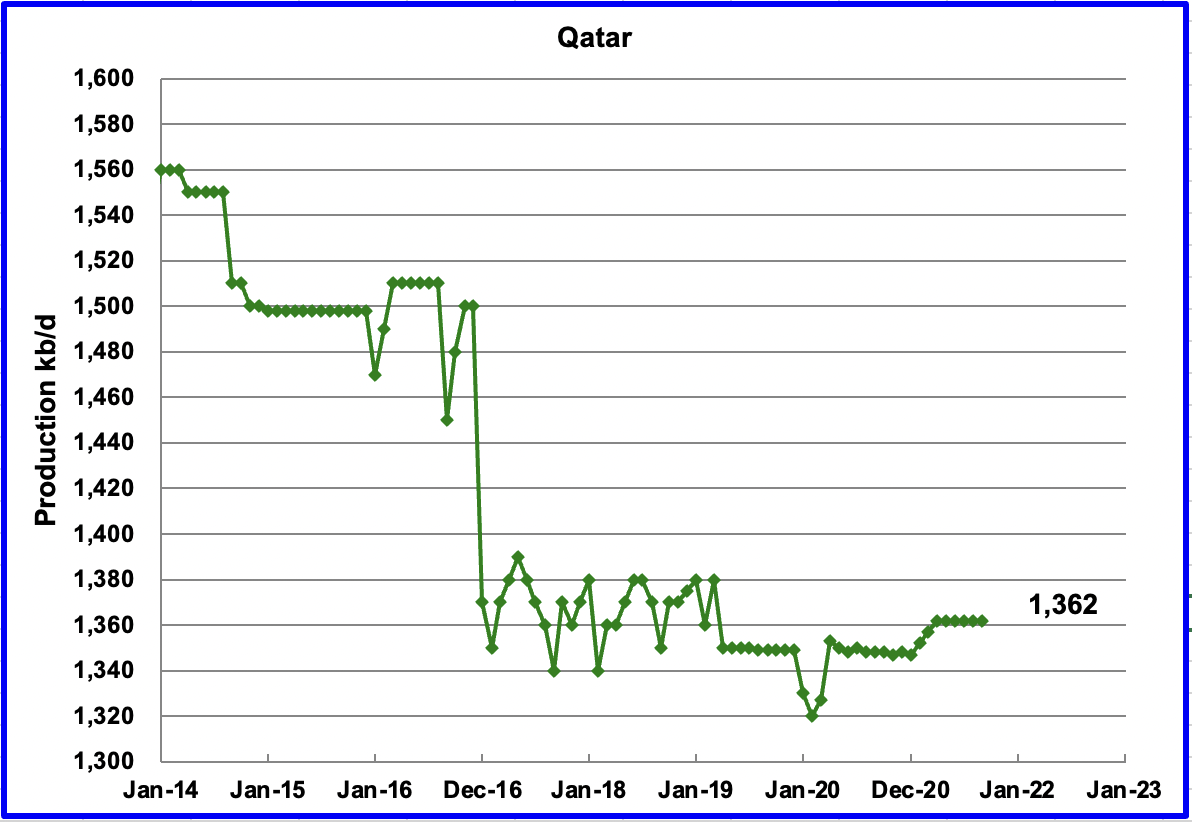
September’s output was unchanged at 1,362 kb/d.
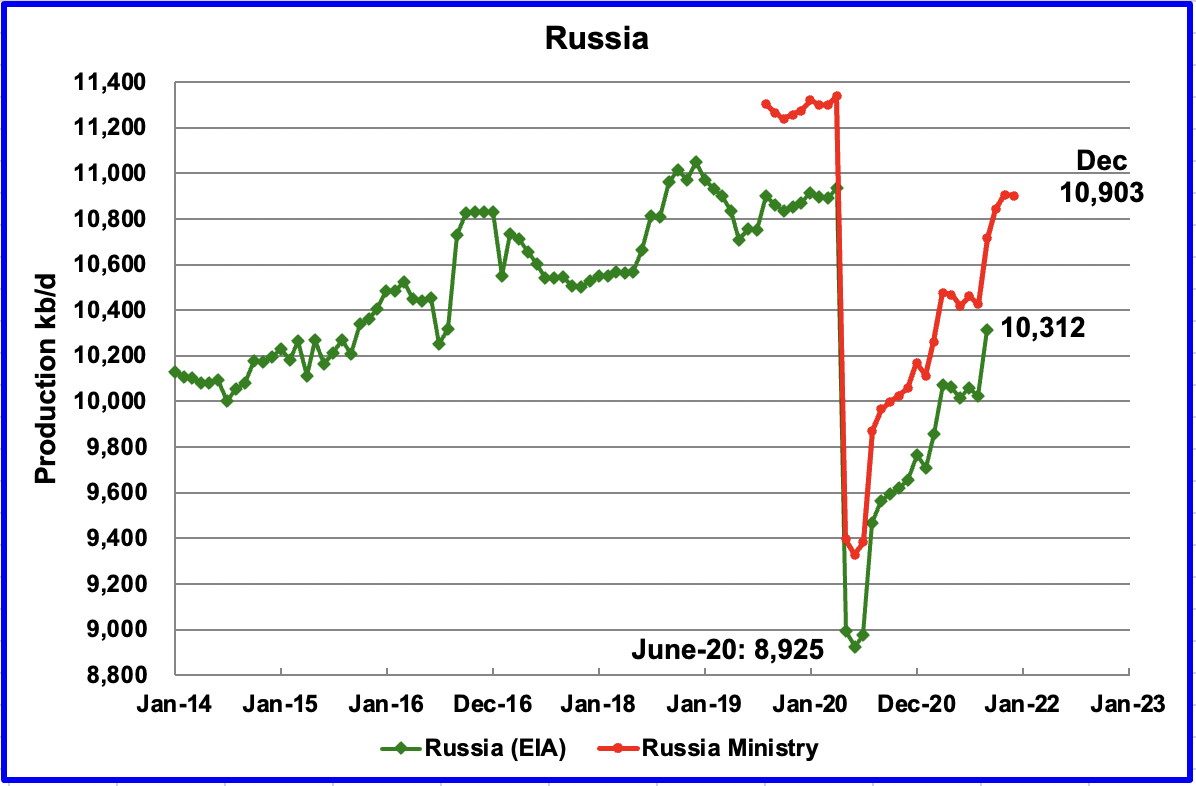
The EIA reported that Russian output increased by 290 kb/d in September to 10,312 kb/d. According to the Russian Ministry of Energy, Russian production increased by an additional 127 kb/d in October to 10,843 kb/d.
This source reported that output in November increased by an additional 63 kb/d to 10,906 kb/d and declined to 10,903 in December and thinks that “Russia’s weak December oil production signals lack of capacity”
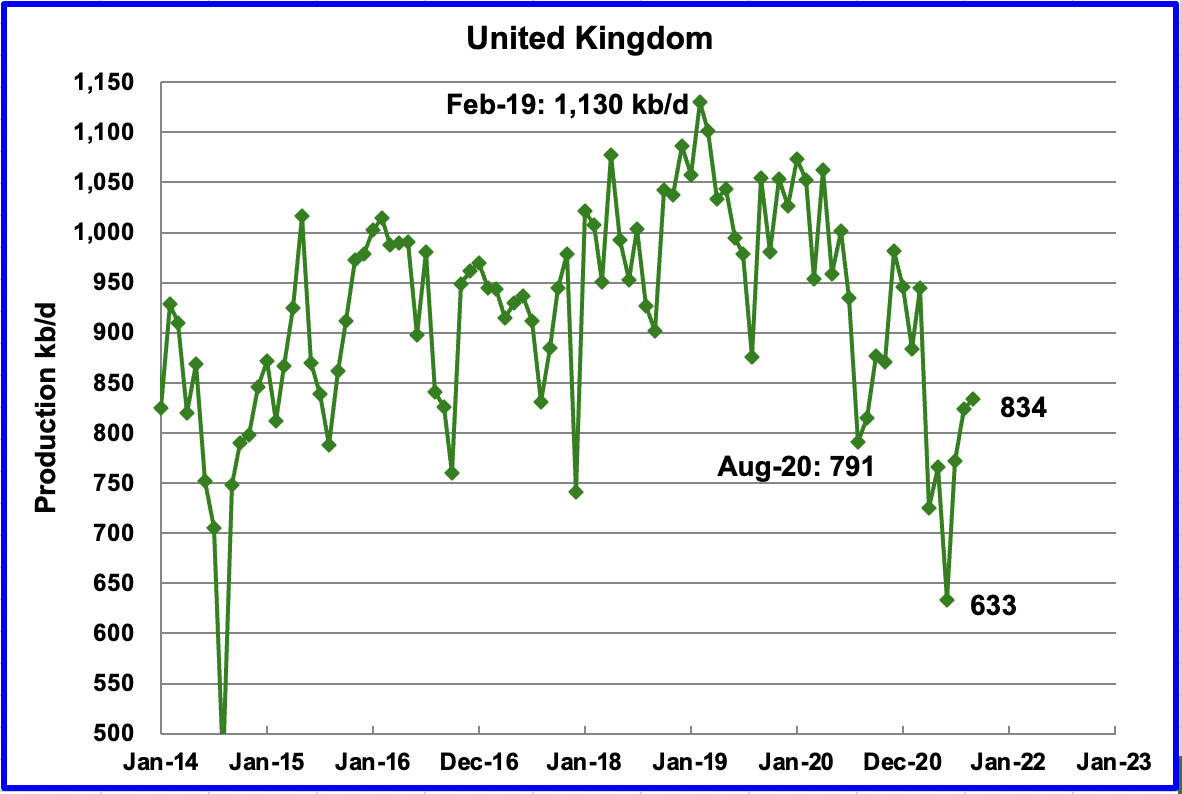
UK’s production increased by 10 kb/d in September to 834 kb/d.
Last year from August 2020 to December 2020, the rebound from summer maintenance was 191 kb/d to 982 kb/d. The rebound so far this year from June is 201 kb/d. This implies/hints that the UK has reached it highest production level for 2021 or is very close to this year’s peak.
Assuming that UK production can return to 850 kb/d by February 2022, that implies a decline rate of close to 90 kb/d/yr.
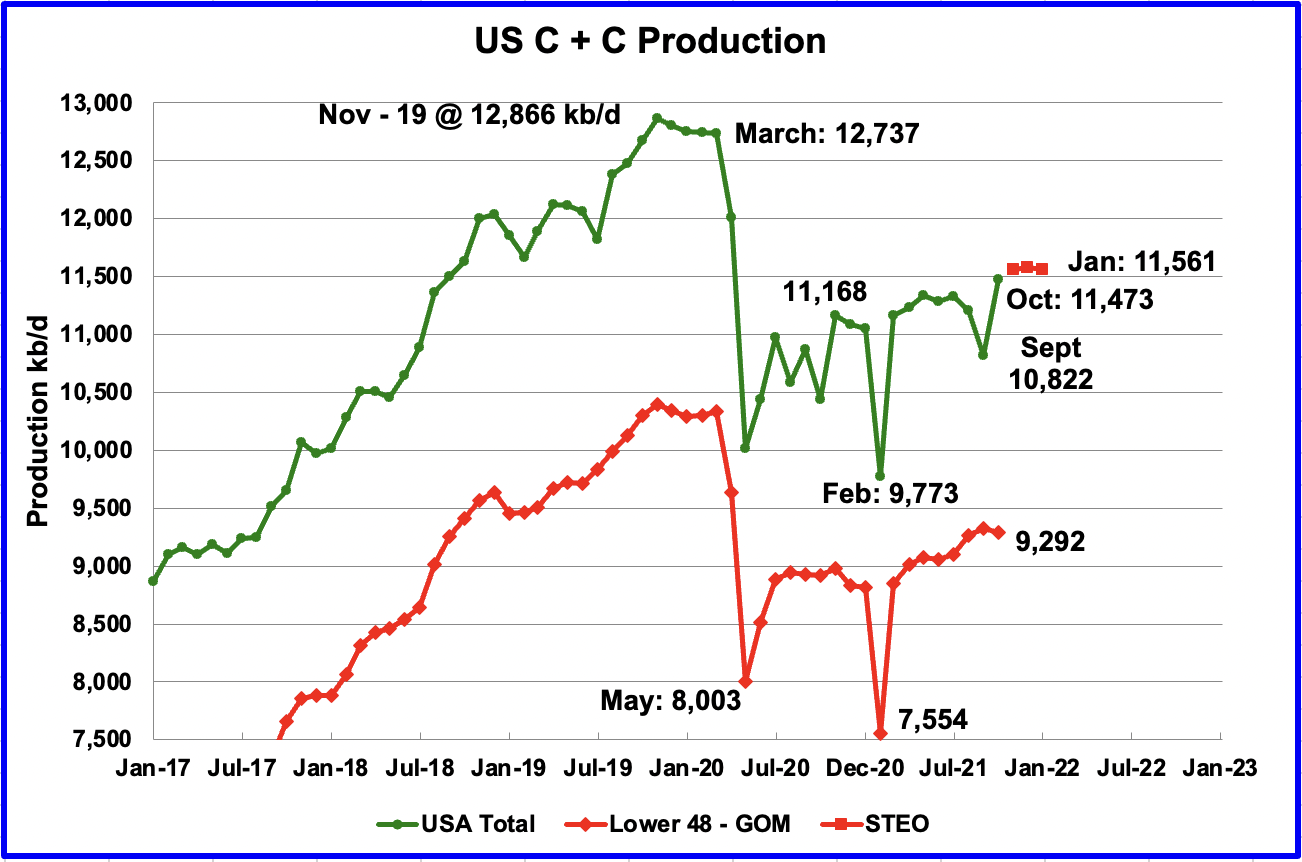
U.S. October production rebounded by 651 kb/d to 11,473 kb/d. The rebound is largely due to increased production in the GOM. GOM output increased by 680 kb/d after the damaged platforms were repaired and brought back on line. The three red markers are the STEO’s output expectation for November to January and are essentially flat at 11,561 kb/d. In the on-shore lower 48, October production decreased by 36 kb/d to 9,292 kb/d.
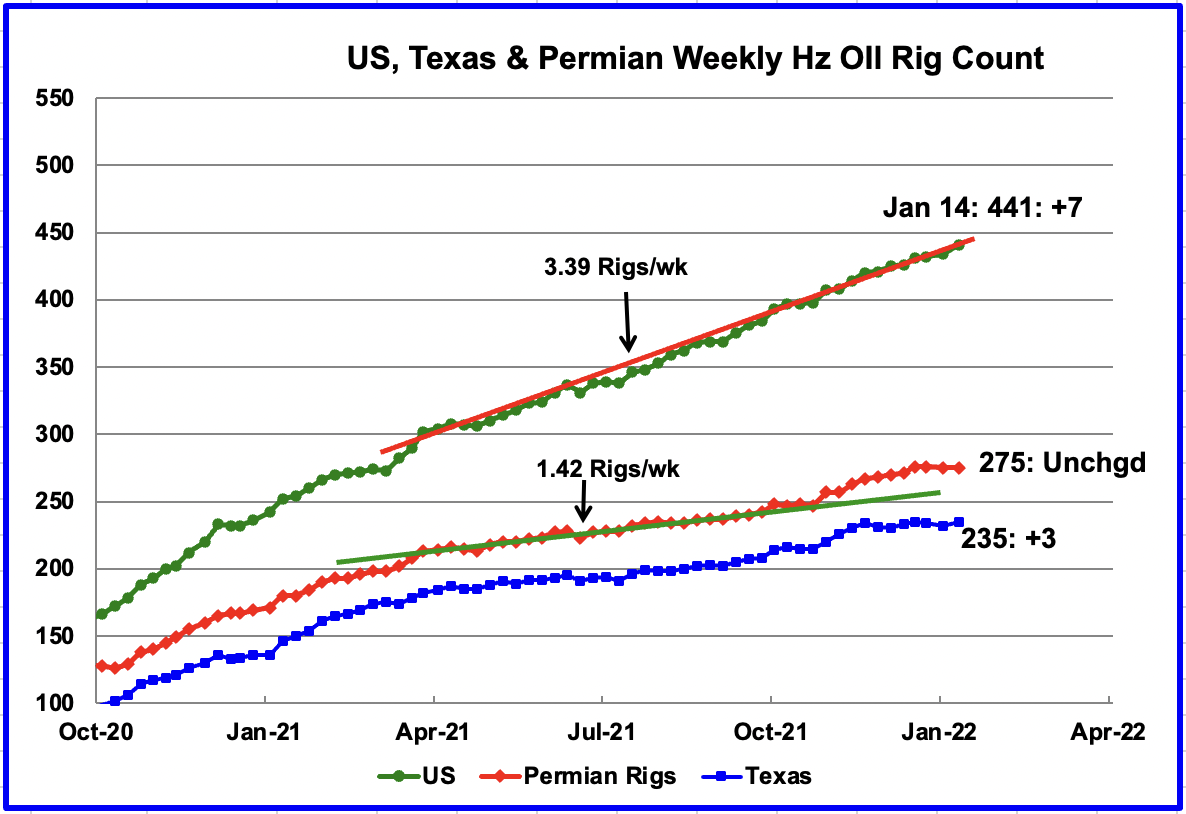
Since the beginning of April, the US has been adding horizontal oil rigs at an average rate of close to 3.39 rigs/wk. For the week ending January 14, 7 horizontal oil rigs were added for a total of 441. Permian rigs were flat at 275 while the Eagle Ford increased by 5. In total, Texas rigs increased by 3. In Texas there was only 1 more rig operating in the week of January 14 than there was in the week of November 26.
From late April to early November, the addition of horizontal oil rigs in the Permian had been rising at an average rate close to 1.42 rigs per week. However since Xmas the weekly addition of rigs has stopped. Xmas holiday?
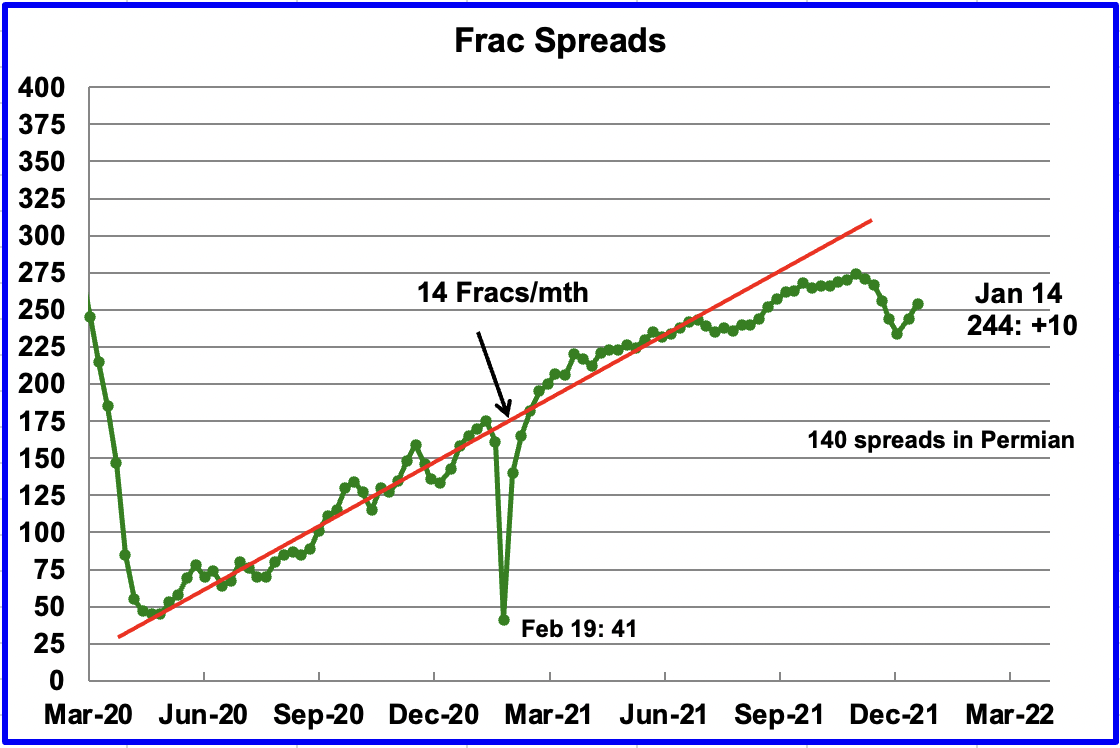
Starting from the week of July 23, 2021, frac spreads were not being added at the previous rate of approximately 14 spreads per month. During December 2021, 37 Frac spreads were decommissioned primarily due to the holidays. In the first and second week of January, 10 frac spreads were added each week for a total of 244.
Note that these 244 frac spreads include both gas and oil spreads, whereas the rigs information is strictly oil rigs.
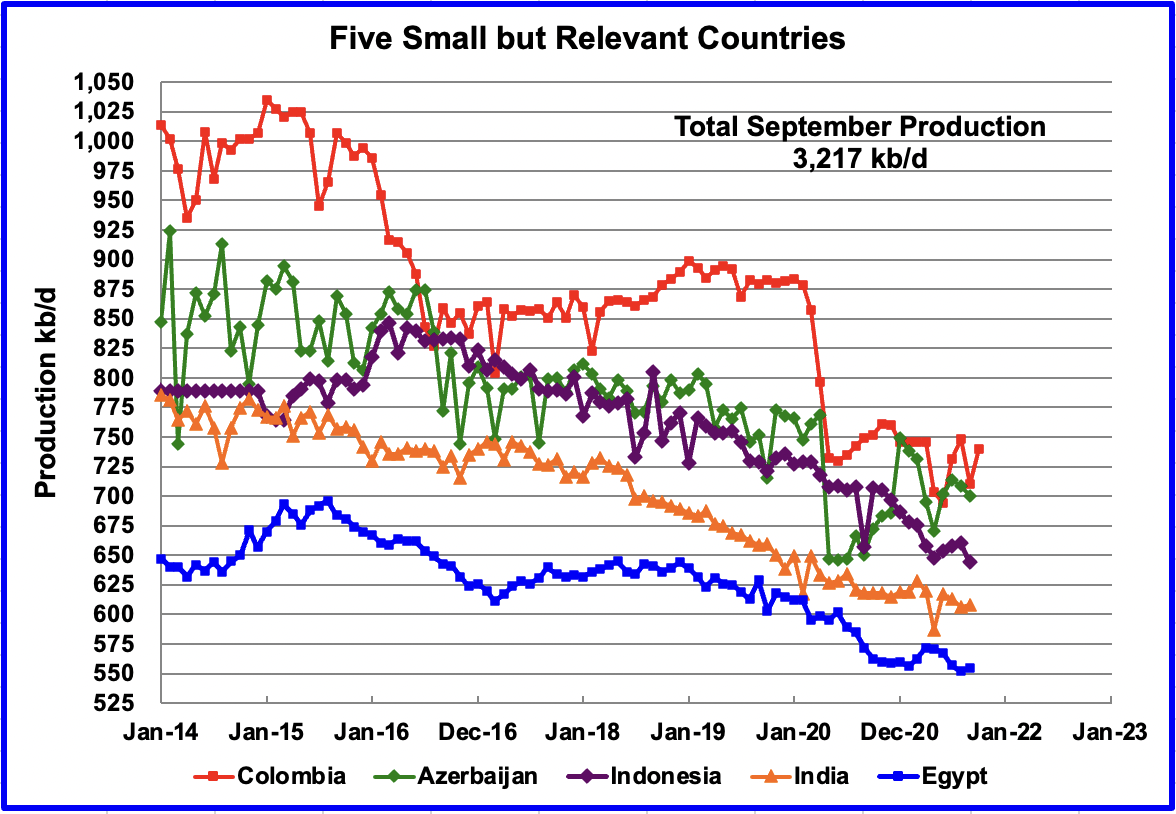
These five countries complete the list of Non-OPEC countries with annual production between 500 kb/d and 1,000 kb/d. Their combined September production was 3,217 kb/d, down by 59 kb/d from August.
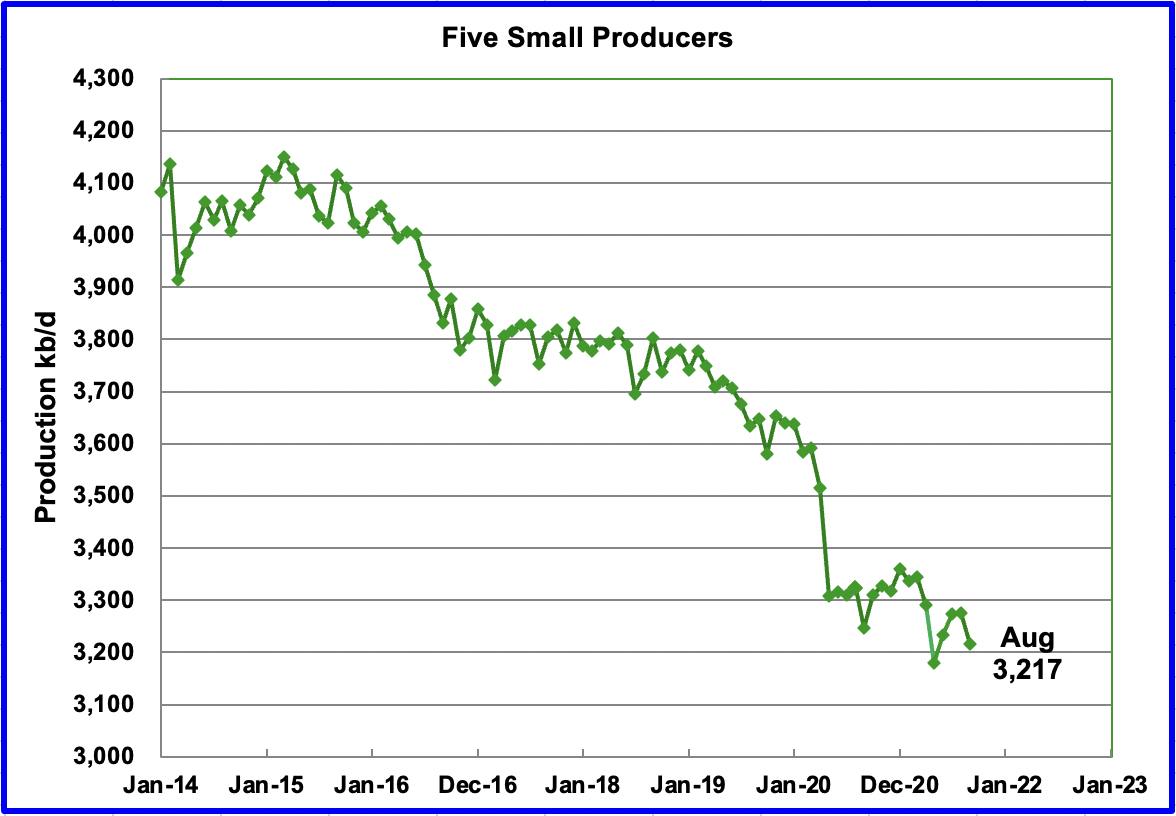
The overall output from the above five countries has been in a slow decline since 2015. The drop in May 2020 from 3,500 kb/d to 3,300 kb/d was primarily from Azerbaijan, 125 kb/d which is a member of OPEC + and Columbia.
World Oil Production
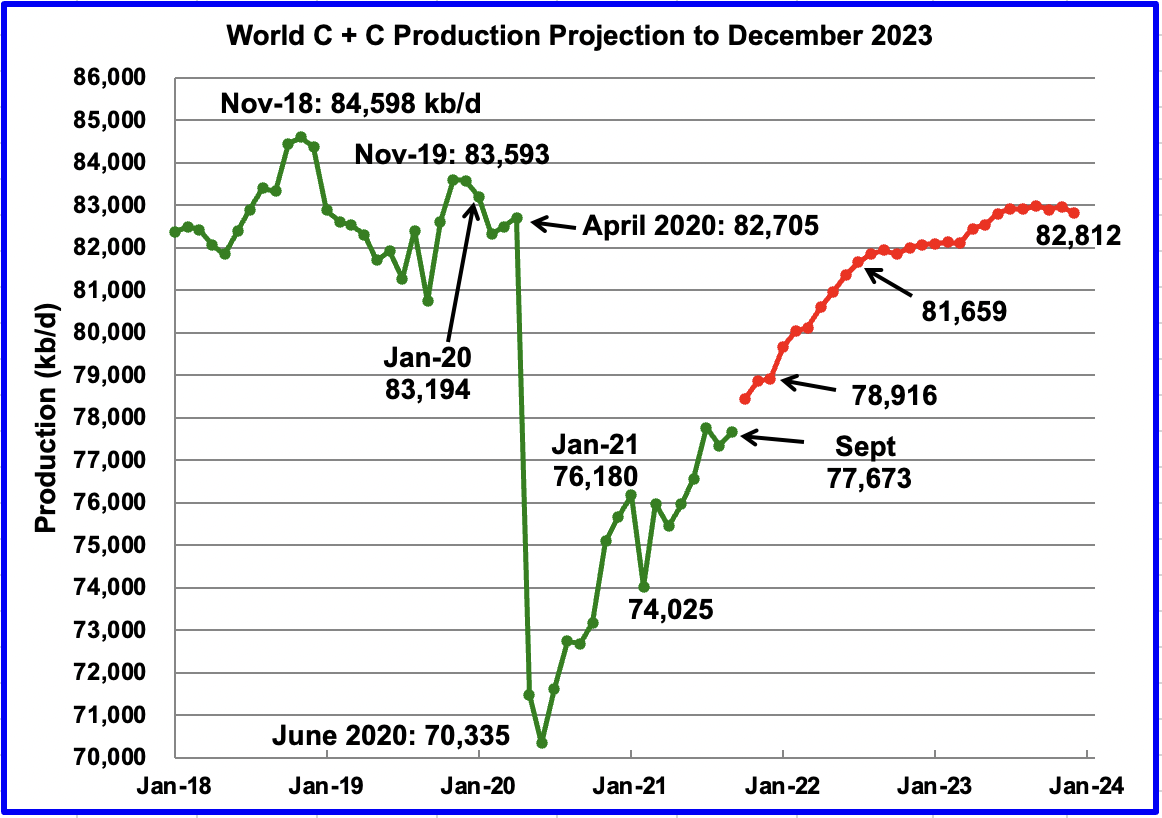
September world oil production increased by 330 kb/d to 77,673 kb/d according to the EIA. Of the 330 kb/d increase, the three biggest contributors were Russia 290 kb/d, Nigeria 170 kb/d and Kazakhstan 76 kb/d. The US dropped by 381 kb/d.
This chart also projects world production out to December 2023. It uses the January 2022 STEO report along with the International Energy Statistics to make the projection. (Red markers). It projects that world crude production in December 2023 will be 82,812 kb/d, 382 kb/d lower than the January pre-covid rate of 83,194 kb/d and 1,786 kb/d lower than the November 2018 peak.
In the previous post, production for December 2021 was projected to be 80,044 kb/d. The latest EIA update now projects December 2021 output to come in at 78,916 kb/d, a downward revision of 1,126 kb/d. What change occurred that caused the EIA to lower its forecast by 1,126 kb/d.
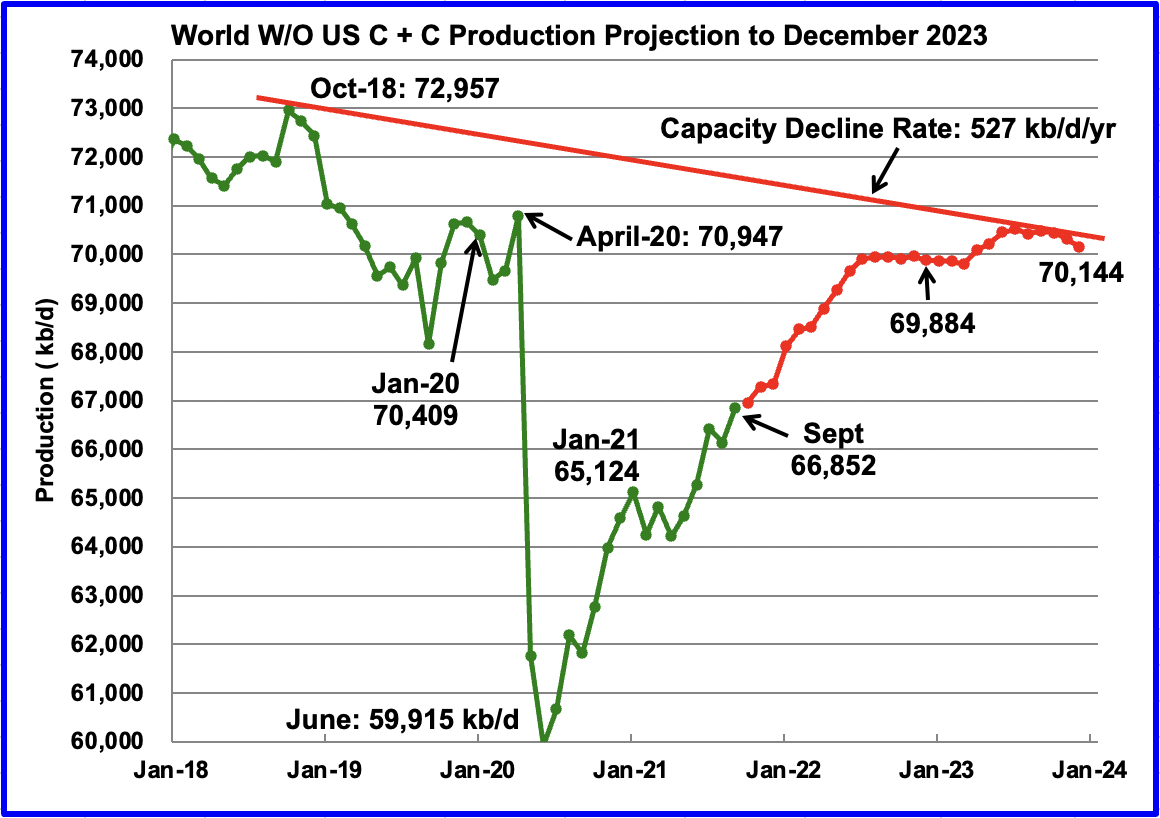
World W/O US oil production increased by 715 kb/d to 66,852 kb/d in September according to the EIA. Very little increase is expected for October.(First red marker).
This chart also projects world production out to December 2023. It uses the January 2022 STEO report along with the International Energy Statistics to make the projection. (Red markers). It projects that world crude production W/O US in December 2023 will be close to 70,144 kb/d. Note this output is only 260 kb/d larger the December 2022 output of 69,884 kb/d and still less than the January 2020 pre-covid output of 70,409 kb/d.
Note that the chart also shows a Capacity Decline Rate line of close to 527 kb/d/yr over the years 2018 to 2023. Capacity decline encompasses natural decline and decline associated with reduced investment for drilling and exploration.
193 responses to “September Non-OPEC Oil Production Slips”
Thanks, Ovi, great post. I like your projections. I agree with the last one. I was a little shocked to see the latest EIA projection drop so dramatically. I expect we will see a lot of projections be revised in a similar manner pretty soon.
Ron
My new site: The Fine-Tuned Universe
Ron, your response to my question in the last thread makes the production figures even more puzzling.
In the meantime,
“Opec+ crude production increased last month but fell short of the 400,000 b/d agreed rise in quotas, as several members struggled to keep pace.”
https://www.argusmedia.com/en/news/2291906-opec-quota-gap-widens
Seppo, it has been known since the 1980s that the big 5 Middle Eastern nations greatly exaggerate their oil reserves.
Why does OPEC lie about its oil reserves?
OPEC, since the 80’s, began determining production quotas based on the proven oil reserves of its member countries. And, in the same decade there was ridiculously large leaps in numbers: In 1983, Kuwait increased its reserves from 76 billion barrels to 92 billion barrels. Come 1987, Iraq’s reserves went from 47 billion barrels to 100 billion barrels, Iran’s reserves soared from 49 to 93 barrels, and the UAE oil reserves tripled from 31 billion barrels to 92 billion barrels in 85-86. Suspiciously, all the countries had either discovered new oil fields or their existing fields began producing more.
Also: Kuwait says will never disclose oil reserves
Industry newsletter Petroleum Intelligence Weekly (PIW) said in January 2006 it had seen internal Kuwaiti records showing reserves were about 48 billion barrels — half the officially stated 99 billion, or some 10 percent of global oil reserves.
Ron, I am well aware of that and therefore subtracted out the phantom reserves. But this does not address my original quandary (of course, nobody is obligated to answer it). If OPEC reserves are about twice the non-OPEC ones, how are the non-OPEC countries able to produce at a rate of 2.5 times what OPEC produces?
Does the answer lie in the nature of the differences of the oil industry in OPEC and non-OPEC countries? That is, with a many more fields in non-OPEC countries, have the engineers been able to figure out how to increase the recovery factor or something similar. We know that majors sell their fields to smaller operators toward the end of the life of a given field, but the small operators are still able to get more oil from it.
No, no, Seppo. While it is true that OPEC’s Middle East nations have, on average, much larger individual fields, they, just like Non-OPEC nations, produce every barrel they can possibly produce. Every nation produces as much oil as they can and how much oil they can produce depends on how much oil they have to produce.
OPEC reserves found here: OPEC share of world crude oil reserves, 2018 greatly overestimates OPEC reserves and underestimates Non-OPEC reserves. If the reserves to production ratio were truly known, the R/P ratio for OPEC nations would not be that different from Non-OPEC R/P ratio.
There is no mystery involved here. I think that those nations have been repeating that lie so long that they truly believe it themselves.
“Every nation produces as much oil as they can and how much oil they can produce depends on how much oil they have to produce.”
Well. lets keep in mind that current production from Venezuela, Libya and Iran is far below that which would be possible under different political/cultural circumstances.
Also, if a country has big reserves they may rational choose to not attempt to produce at maximal rate in the short term, preferring to spread their investment in production over a longer time-frame. Boom and bust cycle is not necessarily the goal of all producers outside of the USA.
Hickory, Venezuela, Libya, and Iran are producing every barrel they can sell and store. So politics is keeping them from selling more. That does not change the fact that they wish they could produce a lot more. But they cannot for political reasons. Politics is just part of the equation. There is no way to avoid it.
Yes, some nations, like OPEC and OPEC+ may temporarily cut production. But right now they are desperately trying to produce more. They want to increase production by 400K barrels per day but are just unable to do that. They are increasing production by less than 100K barrels per day.
Only cartels voluntarily cut production. That is just more politics. I know of no nation that has cut production just to keep it in the ground. Yes, they could of course, but if any nation has ever done that, I have never heard of them. And most oil is produced by individual oil companies. They cater to their shareholder’s demands, not any nations interest.
Seppo,
OPEC nations develop their reserves more slowly than non-OPEC nations, also their proved reserves may be overstated, likely the OPEC “proved reserves” are 2P reseserves.
Dennis,
OPEC proved reserves are most probably overstated, way overstated. Could be 3P also. Concluded from what Ron wrote:
Only cartels voluntarily cut production. That is just more politics. I know of no nation that has cut production just to keep it in the ground. Yes, they could of course, but if any nation has ever done that, I have never heard of them. And most oil is produced by individual oil companies. They cater to their shareholder’s demands, not any nations interest.
Han,
We don’t really know what the reserves are for OPEC. For the UK North Sea we have some publicly available 1P and 2P data and the ratio there was about 1.7 to 1.
In 1981 OPEC proved reserves were 427 Gb, if the 2P/1P ratio was similar to North Sea 2P reserves would have been 726 Gb, in 1988 after Saudi Arabia increased their reserves matching other OPEC nations increases, OPEC was at 755 Gb, fairly close to the North Sea ratio. Since 1988 there may have been some reserve growth.
Isn’t the same for US fracking bonanza?
No, obviously not. US oil fields are not operated by a national oil company, they are operated by private oil companies. If they lie about their oil reserves, they go to jail.
In theory, but in practice is there precedent of though regulation for fracking? It looks that they got a free pass last decade in a lot of regulations
Seppo
I am not sure if you have seen the BP Statistical Review. In the Oil- Proved reserve history tab, you can see how the OPEC countries started to ramp up their reserves. Here is Saudi Arabia from 1886 to 1989: 169.7 169.0 255.0 260.1
https://www.bp.com/en/global/corporate/energy-economics/statistical-review-of-world-energy.html
Ovi,
Yes this is where OPEC changed their reporting from 1P to 2P reserves. Typically 2P is 1.7 times proved reserves. 170 times 1.7 is 289, even higher than 260 in 1989. Also there is reserve growth, for the US this was about 63% from 1980 to 2005. That explains further increases after 1989. The ratio of 1989 reserves to 1986 reserves is about 1.52, less than a typical 2P/1P ratio.
When did OPEC countries ever say that they switched from 1P to 2P reverses?
Frugal,
they never said it, but looking at the historical reserve numbers, it would explain the jump in reserves. Also in 2011 reported proved reserves from BP were about equal to 2P reserves reported by IHS at the World level.
This was my original post:
“I am still trying to understand, how is it possible (if we are very close to the peak) that non-OPEC production is roughly 2.5 times that of OPEC, whereas OPEC’s reserves are 2 times those of outside OPEC. When I asked this question before, Ron said that OPEC is lying about its reserves. But this does not seem to explain it. If we take out the Venezuela’s XH (260 Gb) and Canada’s tarsands (160 Gb) from the OPEC and Non-OPEC reserves and adjust OPEC’s reserves down owing to the quota wars in the 80’s, (say down by 200 Gb) their reserves are still about 750 Gb and the non-OPEC reserves are about 360 Gb. So we have total reserves of 1122 Gb (I had 1110 Gb in the post) rather than the latest OG&J number of 1742 Gb. We have now used 1450 Gb of oil and if the ultimate is about 2800 Gb, we ought to be about half way through. So how can the reserve to production ratios for OPE and non-OPEC be so far apart?”
What I wrote above clearly shows that I have been aware of the phantom barrels in the Gulf countries (actually since summer of 2000 when I read Colin Campbell’s book “The Coming Oil Crisis, Multi-Science Publishing Co and Petroconsultants” page 73).
If we tentatively fix 2800 Gb as the ultimate, and reduce the OPEC reserves, then the yet-to-find oil increases by the same amount. The URR amount 2800 minus 1450 used leaves us 1350 Gb. So if the actual reserves are 1122 Gb, there is 238 Gb yet to find. The more one reduces the OPEC reserves, the more there is left to find if the ultimate remains fixed.
Last year the oil companies found 4.7 Gb of oil. At that rate the 238 Gb would take 50 years. When I mentioned that the smaller oil companies are able to extract more oil after the majors have abandoned a field, this would count as reserve growth. As I speculated before, perhaps this is the reason non-OPEC countries are able to produce more oil from lower published reserve numbers, but I wanted to get various people’s ideas about whether this is the explanation. Cheers !
seppo,
We do not have estimates of developed reserves for individual nations, except
Norway and the US. It is likely that producing reserves to proved reserves ratio is far lower for OPEC vs nonOPEC.
I think it make more sense to work bottom up – i.e. look at how discoveries and revisions are progressing – and come up with and expected yet-to-to-be discovered number, rather than picking an ultimate recovery number and trying to fit things around that. That’s why the access to databases like IHS and Rystad cast so much.
Rystad makes the most data available and they had a major markdown in reserves when they looked on a well basis rather than a field basis. I think the issues with price volatility and ESG (making companies more risk averse) and resource issues will only reduce the URR. Resources are human (the ongoing great crew change plus lack of new entrants), material (competition with renewables and infrastructure projects) and time (because there is only a limited window when smaller fields can be tied in to existing hubs between there being enough spare capacity and decommisioning)
I doubt if the lean and mean smaller companies will have as much impact in places like Angola, Nigeria and Brazil, as those basins come to end off life, as they have in the North Sea (and it’s still to be shown if the small companies are really able to handle all the decommissioning committments there or are going to end up taking the bankruptcy route out).
Permian Ponzi Schemes
https://nexusmedianews.com/top_story/multiple-permian-basin-fraud-lawsuits-underway/?amp
Permian looks highly over inflated, how they could possibly give that much in the future?!?!
This would have been better in the previous post but the EIA reserves have only just been issued. For GOM in 2020 the C&C reserves had the.biggest downgrade recorded with virtually no discoveries, negative adjustments and a big downgrade in non-producing reserves (I think these are mostly in new developments).
Similarly for gas.
George,
I agree bottom up is the best method. Getting the needed data is quite difficult.
Not difficult. But expensive to acquire.
Reservegrowthrulz,
Yes either difficult or expensive, it is expensive because gathering the data is difficult.
For those with deep pockets I guess it would be easy.
The full boat annual budget for a professional researcher on this topic might, run, oh, into the 7 figures. But that covers the bases needed to answer a peak oil question from all the angles, the technical, geologic and economic. Way back when, say 6 months after Thanksgiving Day 2005, I would have said a half million a year would do it. However, 6 years after that my research moved beyond just the technical and geologic, and a fully inclusive and holistic approach involving economics pushed the budget into the 7 figure range.
Well, inflation is a bitch, but so is also depletion, so the value of your knowledge (goes for all parties) goes up accordingly. And as you apparently know, the more you know the more you realize you need to look into some more details. (Unknown unknowns and whatnot, but in that case for other reasons)
Anyway, finding grants is not always a picnic, I´ve heard…
Laplander , “Well, inflation is a bitch, but so is also depletion, ”
Then so is life . Just joking . Too many Laphroigs on a Friday evening when it’s raining and cold outside . Be well . 🙂
Well, it wasn’t so much the more you knew, the more you needed to know on that topic, it was more like the more you knew, the more it was obvious you needed the precepts of an entirely different field of science. The fundamentals of the geologic and technological understanding were all there 20 years ago, but it must have taken 5 years to realize that these two specialties were insufficient and lacked the appropriate framework to discuss all the complexities of development, the pace and what dictates it, capital, production profiles of projects both large and small, competition between equal sized but unequal in cost resources, cartel behavior, etc etc. And then it took another 5 years to learn, figure how how to apply and incorporate it within the technological and geologic, and get a cohesive integrated answer.
The Uppsala group got the data, with a grant partly from Lundin Petroleum. Theirs is the most comprehensive bottoms up analysis to my knowledge.
https://en.wikipedia.org/wiki/File:OPEC_declared_reserves_1980-now_BP.svg
Looking at graphs of historical OPEC reserves, the trend lines are always either dead flat flat, slightly rising, or abruptly jump upward. Clearly, any reserves graph that never decreases does not take depletion into account. It should be obvious that OPEC reserve growth cannot be explained solely by a one time switch from 1P to 2P reserves.
Without government fiscal stimulus coming down the pipe in 2022. With FED monetary stimulus being taken away. What exactly is there to pull economy forward in 2022?
The savings glut has disappeared. Consumers credit is blowing out to all time highs as wages aren’t keeping up with inflation.
I get the supply side argument for higher oil prices. Higher energy prices. But high prices in an over leveraged economy are ultimately deflationary. Because consumers just can’t afford price increases that outpace wage increase.
Long term only way prices don’t crash is if we get lower interest rates. That allow for growth in credit.
If you look at TIC data which is the flow of money from overseas into US treasuries. We’ve seen 4 months that on a net basis outflows exceeded inflows. Most view this as money front running FED tightening. Or some even see as money trying to avoid US assets. I don’t see it that way.
When both Saudi Arabia and Norway are selling US debt on net basis. It means they need US dollars. It means there is a dollar shortage even when oil prices are tripled what they were.
And with no stimulus either fiscal or monetary. That is deflationary money. And we will likely see more net selling of US debt to obtain US dollars to service dollar denominated debts going forward.
I don’t see the pressure underneath oil prices lasting rest of this year.
China just did cut rate again. When they get to the zero bound on interest rates look out because money in search of yield will no longer flow to China. And China demand for everything will fall off a cliff.
China might have a lot of rare earth metals. But if their economy is in free fall at the time when those rare earth metals are needed the most don’t count on them being produced. My guess is they’ll have to import a lot of energy just to mine and bring to market and in an energy crisis those metals largely stay in the ground.
I don’t think Norway needs the fresh $s. They have historical high oil income, mostly in $ – I think they are only reshifting their investments of the oil money. They are rotating their investments now on big scale, by the need to go green and anti weapon.
SA still need money, they need even higher oil prices to have a surplus of $.
One question: Can Biden create the much needed stimulus by a bunch of presidental orders? I think I have read something like this.
I think the answer is no Biden can’t. Not to say there is nothing that won’t come. It just won’t be near enough.
If the FED ever gets to quantitative tightening. And actually allows balance sheet to shrink. That blows up REPO market as it means less bank reserves or cash and it also means less collateral less ability for banks to make loans. Don’t think we will ever see quantitative tightening though.
In all honesty though while what happens with US fiscal and monetary policy absolutely matters. One thing I think that matters more is what is going on in the Eurodollar market.
Eurodollar market is 3 times as big as the US onshore dollar market. 3 times the amount of US dollars are created outside the US as there are inside the US. FED doesn’t have a monopoly on the dollar.
And the banks that are making all these dollar loans outside US are telling us by the inverted Eurodollar yield curve that extends from 2023 to 2026 that they believe something extraordinarily bad is coming just over the horizon.
The dollars that leave the US via trade deficit are just not enough to service all the dollar denominated debt that exists outside the US. There is a global dollar shortage.
HHH , there are only 3 actions possible .
1. Raise interest rates . Problem is at 2% the interest payment will double and eat up all tax revenues . Crash of market and deflation .
2. QT . Do QT and take the wind out of stock buybacks . Suck USD from the Euro Dollar market and crash the world economy .
3. Don’t do anything . Let inflation run wild . Result .Crash the Biden administration and democrats which will become a precursor to a social unrest and bring out the pitchforks .
The Fed is now passing time . Doing small increments of 0.25% x 4 times or 7 times is going to fail when entrenched inflation is running at 7 % . The emperor has no clothes moment is here .
I think the market will crash when the QE stops and first tiny increments appear. It is now dependend of new inflows of credit, of stock buybacks and increasing margin credit speculations.
Take the punch bowl away and it crashs. The very moment the music stops. The stock market will tear down the real estate market and commodity market during the crash – the first because nobody buys expensive real estate on credit during a crash, the second by the margin speculants scrapping every penny they findy by selling other stuff like oil contracts and gold to buy themselves out of margin debt.
Being long oil futures and stocks is pretty much akin to picking up nickels in front of a steamroller.
On one hand you have the pension funds that have to have 7.5% return on investments bidding up prices via bankrolling corporate debt. It’s been very hard to short markets.
On the other hand there is the monetary plumbing that is on verge of breaking down. The policy errors that set this in motion were made long ago and can’t be undone.
latest nowcast from Atlanta Fed
https://www.atlantafed.org/cqer/research/gdpnow
real GDP estimate for 2021Q4 dropped to 5% from 6.8% in latest nowcast from Jan 14, previous estimate from Jan 10. Blue chip consensus forecast about 6%.
Slowing growth. So FED will be hiking rates into a slow down or falling GDP. Who wants to be long oil in a world of slowing growth and rising interest rates?
I don’t think the fact that it’s still positive matters. If growth shrinks by 2% that’s a lot.
If their calculations are a little off and we shrink by a little more than 2% that is a big negative for oil prices.
HHH,
Growth did not shrink by 2%, the estimate changed. Real GDP growth of 5% is pretty good for a mature economy, especially during a severe covid outbreak.
For the US economy real GDP from 2020Q3 to 2021Q3 grew at an average rate of about 5%, eventually there will be a recession. If one makes the claim every quarter that next quarter there will be a recession, eventually the claim will be correct. The Pandemic recession for 2020Q3 was the first recession since 2009Q2 in the US.
HHH,
I imagine you are aware that annual growth in real GDP was about 2.3% for 2021Q3, so 5% is an increase in the real GDP growth rate, if the estimate is accurate, often the now cast is incorrect and it bounces around a lot as new data comes out.
Guys , the intelligent folks are leaving the casino . Phase I has begun . Fraud SPAC’s and IPO’s are becoming unglued . The fun is just beginning and Mr Powell is yet not on the starting blocks .
https://wolfstreet.com/2022/01/18/russell-2000-drops-below-year-ago-level-collapse-of-ipos-spacs-housing-tech-stocks-arkk-etc-progresses/
Thanks for the work Ovi. The info on the Canadian to US pipeline capacity/workings is very interesting.
Amazing how quietly/effectively this has been implemented.
Does this affect the initiative to expand the Trans Mountain pipeline to the west?
Hickory
As far as I have heard work on TMX continues and is expected to be completed in early 2023. They had to stop work when heavy rains hit BC. They also stopped work in one area when they got to a place where bird mating season had started. So far construction is ongoing without protests. Not sure what happens this summer when they get closer to water.
https://biv.com/article/2021/07/trans-mountain-pipeline-hits-major-milestone
Kuwait is becoming unlivable . Pumping oil at 56degrees centigrade is not a very pleasant situation . Mother nature takes no prisoners .
https://finance.yahoo.com/news/one-world-wealthiest-oil-exporters-071522947.html
A few years ago I remember reading somewhere that temperature spikes above 60°C are going to happen in certain parts of the World such as the Middle East. And humans subjected to temperatures above 60°C will die within a few hours.
Hole,
Well, maybe Kuwait can build a massive Dome over a large part of the country and cool it with Natgas. But, that would likely consume all of Qatar’s surplus and even more.
Thus, the solution is to just THINK BIG and BUILD BIG as the Energy Tooth Fairy is unlimited.
steve
Steve , I think I will go into the dome construction business . One dome over Kuwait and all the domes for the nuclear plants that some gentlemen of ” green ” nuclear energy propagate . Should keep my kids and grandkids occupied . Now where the f*** is my passport ? 🙂
Maybe I should apply for a job at Ski Dubai, afterall, I have a bit of experiance in ski lifts, slope grooming etc. On the other hand, a second cousin working construction there was rear ended, not his fault, but was still put in custody/jail for three days, since he “should not have been there” according to the local police…
That attitude might however also make it more difficult for them to find experienced people for extracting the last barrels at the top, possibly? (unless the pay is really, really good I guess)
https://www.skidxb.com/
Edit: Or they know there is no use in trying, and/or that the pakistani might do a good enough job…
Oh I forgot about Ski Dubai. An indoor ski hill with 50°C heat outside — the ultimate insanity.
Or just build like they do in Masdar, which claims to be able to reduce outdoor temperatures by 20 C with passive design. Or look at cities like Sana’a.
Using a little common sense can save a lot of trouble. If you live in a hot desert, you want to avoid sprawl. Build you house up (or down) instead of out, and near enough to your neighbor to be in his shadow.
Its going be hell for poor workers in places like the deltas of Mekong, Ganges, Indus, Tigris, Nile etc.
No joke. Migrants will be heading your way.
From an economic growth POV that is probably a good thing for a number of countries although in aggregate that would increase overall consumption so we can turn the earth to shit a bit faster.
Rgds
WP
In previous thread Shallow sand asked if my US estimate had lower output after 2028 mostly due to low demand, the answer was yes.
The scenario below considers a high oil price scenario where locations in tight oil basins are the main limiting factor. Oil price rises to $120/b in 2020$/b from Dec 2029 to Dec 2033 with a linear rise in oil price in 2020$ from $72/b in Nov 2021 to $120/b in Dec 2029, prices fall after Dec 2033 to $80/b by April 2037 and then to $55/b by July 2041 and then oil price remains at $55/b. Tight oil output URR for this scenario is 81 Gb with a 12 month average peak of 12000 kb/d in 2028. This is a low probability scenario, likely a 95% probability actual output will be lower than this in my opinion.
Dennis.
That scenario seems very optimistic that there are enough shale locations left to get back to adding around 1 million BOPD a year for a few years.
How many wells are completed each year under that scenario? How many rigs and frac spreads will that take?
Your scenario must assume the EFS and Bakken are able to grow production again? The knowledgeable posters here on GOM don’t foresee it adding much. Alaska and lower 48 conventional onshore can’t help.
I tend to think it is physically impossible for the Permian Basin to add 4 million BOPD to what it already produces. The land area is big, but not that big.
We seemed to hit a physical limit just shy of 13 million pre-COVID.
You don’t have to, of course, but I’d appreciate if you share some of the granular detail behind the notion that USA surpasses 15 million BOPD C C and stays there.
Shallow sand,
I agree the scenario is very optimistic see oil price scenario down thread, it is a very optimistic oil price scenario, I expect to see oil prices drop starting in 2028 as demand may fall below supply as the EV transition gains momentum. Did you watch any football this past weekend? The ads for the Ford F150 lightening were ubiquitous, hard to know how fast Ford and others will ramp up.
The scenario is low probability as I doubt oil prices will be as high as this scenario. Most of this comes from the Permian basin other tight oil basins are relatively flat (US tight minus Permian reaches 3337 kb/d in 2026 vs 3316 kb/d in November 2021 based on shale profile supply projection.) My expectation is that higher oil prices will allow “rest of US tight oil” (all except Permian basin) to remain flat to 2026 and then decline. I have the rest of US onshore falling at historic rates and GOM following Bob Meltz’s last forecast.
Permian optimistic high oil price scenario below, this was created to show what might happen if demand for oil does not peak and oil prices remain high, I do not expect this scenario will be right, perhaps a 1 in 20 chance output will match this (or exceed it).
For Permian horizontal oil rigs would need to rise to 615 by March 2025 from about 275 in Jan 2022, an average increase of about 9 rigs per month, frack spreads would need to double from Dec 2021 level. I agree the scenario is optimistic, it is an F5 estimate (about 1 in 20 odds it might be this high or higher).
Maximum average centered 12 month completion rate for this scenario for all US tight oil is 1510 new wells per month from July 2026 to Jan 2027, the previous peak was in March 2015 at 1300 new wells per month for centered 12 month average completion rate. For all of 2026 18120 new tight oil wells are completed in the US (9600 new wells in Permian basin in 2026) for this scenario.
Shallow sand,
Keep in mind that the mean estimate for undiscovered TRR net acres in Permian by USGS is 50 million acres for the combined 2016 (Midland wolfcamp), 2017 (Spraberry), and 2018 (Delaware Wolfcamp and Bonespring) assessments of the Permian basin. If we assume average well footprint of 9000 by 1320 feet (about 273 acres) for Permian basin wells that would be 183150 wells in total. I use only the best benches in my analysis so UTRR is reduced to 45 Gb from USGS mean estimate of 70 Gb and net acres are reduced by 40% to 30 million acres. For 30 million acres at 273 acres per well we would have 109890 wells completed after 2016, up to Dec 2017 12137 wells had been competed in Permian basin so adding these we get 122 thousand wells. Also note that the USGS F95 estimate for Permian TRR is about 45 Gb so about a 95% probability that TRR will be at least 45Gb according to USGS. At high oil prices close to 100% of the F95 TRR is likely to be economically recoverable based on a discounted cash flow analysis.
US tight less Permian tight scenario
Secondary peak at 3202 kb/d in Dec 2025, Nov 2021 output about 3216 kb/d based on EIA data (shaleprofile slightly higher at about 3300 kb/d).
Dennis,
With the current rig count, capital constraints, and available drilling locations that are of any quality in the Permian, I like the shape of this immediately above chart for the entire Shale Industry including the Permian. In the industry that I am working in today, significant capital is unavailable to increase production even in the Permian. I strongly suggest you watch the current production reporting by public companies over the next two quarterly reporting cycles. You will be unimpressed with their numbers. Other than by mergers creating production growth for the surviving company( which is a zero sum game) we will not see robust organic growth by Permian centric E&P companies which you are solely relying on for your model that shows significant production growth up to 2030 fueled primarily by the Permian.
The only way your other charts are correct would be if oil tops $100 per barrel and stays there in a hedgeable range on a multi year basis, the oil service industry expands and skilled labor comes back into the industry, the government eases draconian regulations, and demand doesn’t fall off of the cliff due to the economic slow down seemingly orchestrated by the FED to raise interest rates to calm down in inflation.
All economic Pundits believe an interest rate increase will tamp down inflation based on previously accepted concepts of modern monetary theory policy. This is wrong. Our inflation is caused by significant supply chain disruptions and the previous drunken party of allocating (wasting)capital to “woke” uneconomic and ridiculous SPAC scams, alternative energy scams and technology companies that make APPs rather than basic products that people use daily for living.
We are living in an era where Wall Street continues to scam the hard working public by selling them “gimmicks” and fluff that do not provide the basic staples but instead offer very little in the way of products that humans need to live an every day life. If the US doesn’t begin to allocate capital back to the meat and potato boring basics, our economy is on the verge of imploding. The inmates (ie Wall Street slime balls, millennials, mainstream media) have run the Asylum for way too long and they have no concept of reality as they eat their protein bowls, beyond meat burgers, and spend their bonuses on overpriced coffee drinks and gaming entertainment. All of which are “cool” but not critical for survival in an overpopulated planet.
There is a little catch to this:
– Without 100$ oil, we won’t see a shale boom
– Without a shale boom, we’ll see 100$ oil soon
– With a shale boom, we won’t see 100$ oil
So pork cycle at it’s best – volatility in oil will stay.
The usual expectation in a situation like this is that the market will “clear” — that is, settle down to a price where supply meets demand.
But who studies classical economic theory these days? Youtube videos make much more sense.
Ali oil production growth and oil comsumption changes are on another time scale.
Thats why you can forget classical here. Proof: oil price never was steady always boom and bust. The OPEC tamed it a bit but not complete. Now the Opec is mostly out of spare capacity – so fasten your seatbelt.
LTO survivor,
Thanks.
The “other tight oil scenario” has a secondary peak below November 2021 output as estimated by both the EIA and shaleprofile that is not reaced until 2025. US tight oil output is likely to surpass its previous peak in Dec 2021. Horizontal oil rig count has been increasing at a rate of 9 per month for the past 4 months. The Permian tight oil well completion rate has been at 400 per month for several months, about 310 rigs are enough to drill 410 wells per month, the recent rig count for the Permian was about 275, so about 4 months at a continued 9 rig per month increase gets us to a point where DUC count stabilizes. My guess is that $90/bo might change the outlook in the Permian basin, we are likely to be there by April 2022.
US tight oil scenario with high oil prices
completion rate in new wells per month on right axis, URR-79 Gb.
High oil price scenario used for scenario in comment above.
Found a great paper, hat tip to Mr Shellman on pointing this out.
https://www.mdpi.com/1996-1073/15/1/43
This is far better than my simple modelling. See figure 15 on page 13 of the PDF, but the entire paper is excellent.
One comment on paper above. On page 14 (bottom) there is
On the one hand, our prediction of total recoverable oil of 54.4–62.4313 billion bbl falls in-between what USGS and EIA predict at 46 and 95.6 billion bbl, respectively.
This is not quite correct as the USGS mean TRR estimate is about 75 Gb and the EIA tight oil estimate is more like 115 Gb, the estimate in the paper is quite reasonable in my view as it takes account of the economics which would reduce the USGS TRR to something less than 75 Gb for a reasonable oil price scenario (likely in the range of 40 to 60 Gb seems reasonable based on my own analysis.). The USGS F95 estimate for URR is approximately 45 GB and perhaps they are using that to represent the USGS estimate, the F5 estimate for Permian URR by the USGS is 114 Gb.
Dennis,
The USGS is an academic institution and is always 100% wrong because it is only theory and does not take real world factors into account. Their number MAY be theoretically correct in a perfect world but since I began my career in 1980 they have never been accurate. Their reserve estimates based on rudimentary volumetrics are probably in the ballpark but their recoverable reserve estimates are most likely overstated by a factor of 2 or 3. One is the world of math while the other is the world of reality.
LTO Survivor,
I agree the TRR is only going to be approached if oil prices were very high. My estimates take the economics into account, for the North Dakota Bakken for example the USGS 2013 assessment had mean TRR of about 11 Gb, when I use a reasonable set of economic assumptions I get a scenario with 22650 total horizontal oil wells completed and a URR of 7.4 Gb. Cumulative tight oil output through Dec 2020 is about 3.75 Gb and proved reserves at the end of 2020 are about 3.26 Gb or about 7 Gb, my guess is that there are likely 400 kb of probable reserves, but perhaps my scenario is too optimistic. Note that 11/7 is a ratio of about 1.57. If we use that for the USGS Permian basin assessments we would arrive at a Permian URR of 47 Gb, my updated Permian scenario for a high oil price scenario has Permian URR at 41 Gb so a TRR/ERR of 1.83.
Much will depend on future oil prices, a lower oil price scenario would likely reduce the Permian ERR to 30 Gb where the TRR/ERR would be 2.5 and match your estimate for the TRR being 2 to 3 times higher than URR.
LTO survivor, D Coyne,
The USGS TRR assessments are of Technically Recoverable Resources, not TRR Reserves. There’s no price component that I know of. Am I missing something?
Comin’ up on Port time.
Synapsid,
That is correct. TRR is technically recoverable resources. The price and cost assumptions are added to the analysis to estimate ERR which is economically recoverable resources. With a very high oil price Scenario TRR=ERR, in most reasonable scenarios ERR<TRR.
LTO Survivor, D Coyne,
TR Reserves, not TRR Reserves
Dennis.
What blew me away in this paper is the idea that drilling the core areas of PB is profitable at $35 WTI and gas at any price.
Isn’t 2020 proof that is false? Where are the profits from Permian producers in 2020?
Then don’t believe it, Shallow; you don’t have to believe it just because of who the author is and that he is PE. I know who he is, I’ve set his lectures; he’s famous. If you told him he was full of shit he would want to know why and listen intently. Everything everybody is PAID to write these days boils down to definitions, interpretations, and what are the things NOT said. Tight oil in the Permian has NEVER been profitable, ever. Its not now, at $75. There is, still, all that debt. As a business man have you ever felt profitable, that you were in complete control, if you owed money to the bank? Thats a big negative on the ‘ol financial statement, yes? Are you good financially, your family cared for, even if you still own a mortgage on your house? How about four mortgages on your house, like the tight oil industry has on their assets? Those are liens on those assets and that does not mean you own them. Trust your instincts as an oil man working from a checkbook. They will always, ALWAYS be right. NOBODY has the instincts into all this that you and other oilmen do.
Are there 55,000 more wells to be drilled in the cores areas of the Permian Basin that will replace legacy decline and hold current production steady for the next 10 years? Hell no there isn’t. No way, Jose. I’ll show you maybe why on Thursday. As you and LTO say, there are NOT enough profitable, drillable locations left in those core areas.
Years ago there was a meme that suggested we not believe everything on the internet, just because its on the internet. Today that a big, gigantic 10-4.
Mike. I have heard of him and read some of his previous work. Felt he knew what he was writing about.
And then he says profitable at $35 oil and ANY gas price.
Does ANY include when they were PAYING to GET RID of it?
I would sure like an explanation of how PXD racked up $5 billion of NOL 2015-19, if $35 oil and ANY gas price were profitable.
There is a price that this stuff is profitable, and I think for the good acreage we are there now. Hit $87 just a few minutes ago in the overnight.
I’ll await your post on Oilystuff, but don’t delay a historical post for a shale oil post. The historical stuff was before internet barrels. I don’t like internet barrels.
Mike.
I looked at PXD 2020 10k. I really wish people would actually read these. Lots of good info.
PXD GAAP earnings for 2020 were -$1.21 per share. That was with 2020 WTI at $39.57 and 2020 HH at $1.98.
I also see PXD had about 750k acres leased, all in the PB, as of the end of 2020. Think they have since sold some to Harold Hamm’s CLR.
Per shaleprofile, PXD had drilled 3,301 horizontal wells in PB through 9/21. 750k acres divided by 1,280 per drilling unit equals 585 drilling units.
So, PXD is approaching 6 wells per 1,280 acre drilling unit.
PXD also has thousands of vertical wells it operates on a portion of this 750k acres.
I’m using very rough figures here, of course. But I’m just not seeing where all these remaining locations are.
I’ll read the paper Dennis linked again. But if these guys didn’t use any 10k data in their analysis, they made a big mistake. 10k don’t lie. If 10k lie, somebody usually ends up going to jail.
Of course, the -$1.21 GAAP earnings in 2020 makes things look better than they are. I’m sure the EUR to calculate cost depletion is overstated, understating cost depletion and therefore juicing GAAP earnings. I have found these guys all do this. Since they are estimating EUR, and still plug in the fat tail, I guess they feel they can do this in the 10k without getting in trouble.
The big NOL carry forward was still in the 10k for 2020. They will use some of that up in 2021, and likely more in 2022.
I invite all to read the 2020 PXD 10k and poke holes. I did this real fast on my phone without notes, so maybe I made some errors.
Funny, seems like only Rune and I would ever read the 10k. We must be odd ducks, reading the 10k. Heck, Rune even read the 10Q too! Lol!!
Who ever heard of reading annual reports sent into the SEC during the age of Twitter and internet oil?? Lol!’
Shallow sand,
The economic analysis for the paper may not be very good. I imagine the physical analysis is excellent, or at least far better than my simple models.
Below is a revision of my high oil price Permian model using the physical analysis from that paper as a guide, and my own economic analysis, under the high oil price scenario, and a high completion rate scenario the URR is reduced from 50 Gb to 41 Gb using the 62 Gb best guess TRR from that paper. Wells are limited due to lack of profitability of the non-core wells after 2035. No future wells are completed in the “others” group (those not in the Bonespring, Spraberry or Wolfcamp formations.)
Using this Permian scenario instead of my previous (too) optimistic scenario would reduce the US optimistic scenario peak to about 13.5 Mb/d (about 1.6 Mb/d lower than previously).
Shallow sand,
Read the following carefully, I think you might have misinterpreted.
From page 14 of the PDF for the paper, an excerpt:
Figure 17 (left) shows a scenario where we assume a constant gas price of $4/kscf and vary the oil prices. We observe that infilling core areas is profitable even if the oil price is as low as $35/bbl. Infilling noncore areas is only profitable if the oil price exceeds $52/bbl. Operators should avoid infilling the ‘Others’ area, unless the oil price is above $72/bbl. The second scenario is shown in Figure 17 (right) where we assume a constant oil price of $60/bbl and vary gas prices. Using this scenario, infilling core areas will be profitable at any gas price. The break-even points for infilling the noncore and ‘Other’ areas are $1.5/kscf and $6/kscf.
I read this as saying that if we assume $4/MCF for natural gas, the core areas are profitable at $35/bo, non-core at $52/bo and others at $72/b. If we instead assume a fixed oil price at $60/b then core areas are profitable at any gas price (so flaring if prices are too low), non core at $1.50/MCF and others at $6/MCF.
It does not say $35/bo and any gas price, if I am understanding the words correctly. In 2020 WTI was $39/bo and natural gas price was about $2/MCF at Henry Hub ($2.03/MMBTU), so in 2020 the conditions of both scenarios are not met.
Also note they use unrealistic royalty and tax rates, low D and C costs, and only an 8% annual discount rate for their economic analysis. It is not very well done in my opinion.
I was looking at google earth in the stretch between Ft. Worth and Midland. It’s amazing how many O/G pads there are – the landscape is just completely covered in the things.
It is hard to see how there is still (much) unexplored acreage to be explored.
But what do I know.
WP
If the Permian is a feature of the financial bubble wouldn’t it go away along wit the bubble? asking for a friend
Shallow sand,
It just occurred to me that they may be doing their analysis in real dollars (inflation adjusted constant 2021 dollars), in which case a nominal 10% discount rate (typically used in 10k reports) would be an 8% real discount rate assuming a 2% annual rate of inflation. I use a 10% real annual discount rate in my analysis which would be a 12% discount rate assuming a 2% rate of inflation. Note that the average annual rate of inflation from Jan 2000 to December 2021 in the US has been 1.8%. The long term average from 1960 to 2021 is about 4% per year. From 1984 to 2021 the average annual rate of inflation in the US has been about 2.5% per year. From Jan 1992 to Dec 2021 (30 years) the average annual rate of inflation in the US was 2.2%.
Svaya,
Permian is profitable at current oil prices, if oil price holds up, so will Permian output through 2035, if WTI oil price falls to under $50/bo (in 2021 US$), then Permian output will fall. This assumes natural gas sells for $3.50/MCF and a barrel of NGL for 35% of the price of a barrel of crude oil.
Shallow Sand,
You are 100% correct. What occurred is that the price would rise to $65 per barrels, shale companies ( ours included) would ramp up drilling only to bring on these wells a year later in the $40 dollar a barrel range. Which means we were producing our significant first year Reserves at a price that guaranteed that the wells would never pay out. Break even prices published by all of reporting sources like Raymond James, Rystad, etc… etc were a lie and didn’t take into account overhead, mechanically screwed up wells, equipment failures and basis differentials. We lost a ton of money at $35 per barrel and so did every other oil company. If it wasn’t for the irresponsible PE unseasoned know nothing weasels and the debt spigot, the industry would have collapsed completely.
LTO Survivor,
I agree $35/bo does not work, but if we use a low real annual discount rate of 8% (assuming 2% annual inflation rate) and assume well cost is $10.3 million in real dollars. The NPV for future discounted cash flow for an average 2019 Permian well is equal to the well cost at a wellhead price of $43/bo, if we assume also that natural gas sells for $4/MCF and NGL sells for $15.05/b. This assumes the average EUR for a 2019 average Permian tight oil well is 413.8 kbo, 1975 MMCF natural gas, and 164 kb of NGL with well shut in at 157 months at a daily output rate of 16.8 bopd for oil and 172 MCF/d for natural gas and 14.3 b/d of NGL extracted from the natural gas output.
Russia may be able to deliver only about half of its scheduled increases in crude production over the next six months, joining the ranks of OPEC+ nations that are struggling to ramp up.
From Bloomberg behind paywall.
Seppo
Do a google search for the title when a Bloomberg article is behind a paywall. Below is the Canadian affiliate and it is free. Not all articles are there.
https://www.bnnbloomberg.ca/russia-seen-struggling-to-keep-pace-with-opec-oil-supply-hikes-1.1709022
Thanks Ovi
Looks like a few chart technical patterns are breaking out today.
10 year us bonds over 1.8%, and brent oil over the 86$. Inlation sceanario played here. This is still all short range pattern – but this is very important for this year for consumption and production of oil.
More expensive oil and more expensive credit – not all rosy for the part of the oil industry needing credit. And supply chain trouble.
A friend bought an expensive used luxury car 3 months ago. Now it’s “worth” 10% more – hello inflation.
Yes ultimately inflation peaks and so does the 10 year yields. Prices are going to get rejected due to our over indebtedness. And we roll over into recession right on cue and prices come down and yields come down also.
Likely has a matter of a few months to play out at most.
Maybe less as wheels in China are falling fast.
China’s coal production is at a record amount. They going all out to just keep the lights on. How long that can last is a good question.
It’s easier for them to just import coal when available as they don’t have to spend any energy to produce that extra coal. Problem now is those imports have disappeared.
Nobody wants to gear down their economies. It’s politically not good. Net zero will largely be abandoned in years ahead.
I see Canada is going ahead with it’s cross border trucking vaccine mandate. Which will be a financial disaster for Canada. Guess it’s a good thing most oil and gas go through pipelines. Or it would really be a financial disaster for them.
Do they still have their silly conflict about submarines with Australia where they got a lot of coal from? So the submarines are the first topple in this domino rally.
Not sure if China is still not importing from Australia. But I think India started importing a lot more coal from Australia. So those imports from Australia might not even be available anymore.
It’s been a few weeks since I’ve even looked at price of coal but it’s back up to 220 not that far from recent highs.
I think this is something to watch closely. Recent high was just under 270 it had dropped back down to 150.
The faster China exhaust their domestic coal supply the higher price will go. And unless they are importing coal from Russia or Mongolia they need US dollars to import coal. So it’s not like they can just print yuan to pay for coal imports.
The reserves of economically available coal in China are estimated at 25-35 years. That explains why they have a crazy project of building 168 nuclear reactors outside the reactors they have by now (50), the 18 they are building and the 37 which are in project.
Guess they better hope Kazakhstan can continue producing large quantities of uranium to fuel all those nuclear reactors.
Otherwise they will have ghost nuclear reactors to go along with their ghost cities.
Currently, nuclear power represents 5% of primary energy production in the world. By doubling it, there will be still enough U 235 to fuel these reactors during one century. With breeder reactors such as the salt fast reactors, this will be U 238 and Th 232 which will be used as fertile in the reactors and there are ressources for a few thousand years with U 238 and Th 232.
Building 168 nuclear reactors isn’t that crazy if you do it like the chinese do it. Build them in series. It won’t be more than a trillion $ cost – most likely less. Almost all work including development can be done in country, so not much $ needed. And a trillion – that’s not more than a medium sized “build back” package in the USA.
They’re developing 4th generation now – I think they won’t only build light water reactors.
Edit: They are experimenting:
https://www.nature.com/articles/d41586-021-02459-w
Some uranium breeder reactors are going life soon, too – but they are more secret because they first will supply the military with bomb stuff.
That’s a thermal spectrum thorium salt reactor. They will go nowhere with this configuration because at high power (let’s say 1 GWe) they become unstable. That has been determined with modelisation by the scientists of LPSC at the beginning of the 2000s : they were asked by EDF to review the MSBR (Molten Salt Breeder Reactor) concept. But, as they were curious, they tried different configurations and they found one which was giving satisfaction. As a result, the GIF (Generation IV Interntional Forum) removed the concept of MSBR and replaced it with the concept of MSFR (Molten Salt Fast-Reactor) found by the French scientists. This is this last concept which is under investigation for the MCRE (Molten Chloride Reactor Experiment) in USA, for the project MOSART in Russia and the feasability study of the CEA in France. Chinese scientists choose the concept of thermal spectrum thorium salt reactor because it has been already studied by American scientists during the 1960s with the MSRE (Molten Salt Reactor Experiment). There are a lot of retex with this experiment and they are using it.
Let me answer some questions on China coal . First the dispute with Australia is not over (officially ) but China has restarted buying Australian coal . India did buy some shipments of stranded coal when the dispute was hot . There was/is no alternative source since Indonesia the biggest supplier shut down exports because of domestic shortages ( restarted now because they need USD to import oil ) . China’s reserves are incorrect . They are resources . Chinese coal is mostly ” coking coal” good for steel manufacturing , however they need to import ” thermal coal ” for power plants . The coal quality in China is poor just like India . Too much powder not enough lumps (stone) .Nuclear plants will not be commissioned . There is a saying ” China will grow old before it becomes rich ” relating to its demographic crisis . In the same tone ” China will go bankrupt before it commissions its nuclear plants ” . No nett surplus energy to do grandiose projects . Yes they are buying coal from Mongolia . I had posted an image of trucks a few threads earlier . Burning diesel to transport coal . How intelligent ?
Image of China coal truck train .
https://www.google.be/search?q=china+coal+trucks+train&hl=en&tbm=isch&sxsrf=AOaemvIQR9fjH4r5NUmT2wVAb3kLRo2rUA%3A1642531346142&source=hp&biw=1366&bih=625&ei=EgrnYcHFBc-5kwWPrYOgBg&iflsig=ALs-wAMAAAAAYecYIjzSFmW5axITwBrJVrK8_tNOYiUS&oq=China&gs_lcp=CgNpbWcQARgAMgcIIxDvAxAnMgUIABCABDIFCAAQgAQyBQgAEIAEMgUIABCABDIFCAAQgAQyBQgAEIAEMgUIABCABDIFCAAQgAQyBQgAEIAEOggIABCABBCxAzoECAAQA1AAWOEPYMg6aABwAHgAgAFJiAHbApIBATWYAQCgAQGqAQtnd3Mtd2l6LWltZw&sclient=img#imgrc=vaRkUP61YGdGJM
WTI is at $85 currently. Stocks on other hand are in red this morning. There has to be an oil price that pulls stocks down. I don’t know if that price is $85 or not. But FED has no choice but to be more hawkish than ever. I’ll be surprised if Biden doesn’t also pay lip service to inflation soon.
If stocks head lower in any meaningful way it will pull 10 year yields down. Heck that could easily be the catalyst for negative nominal rates as long bonds yields collapse.
Three Mile Horizontal Wells
Has anyone heard of any pushback on the drilling of three mile horizontal wells from mineral owners or regulatory agencies?
Operators began testing these in the STACK a year or two ago and as the lateral gets longer, the overall production from each unit (640 acres) goes down. This might be good for the operator who gains some efficiencies and makes a quick buck but if the resource is stranded, the mineral owner and State gets screwed (and eventually the operator as locations dry up). From what I’ve observed, overall production is at least 30% lower for these longer laterals.
How’s that work into future production models??? LTO Survivor- have you seen this in the Permian?
OK Cowboy,
I have tended to use 10000 feet as the limit in my models, these models are very simple with an average well profile used for all wells completed for any given year. For Permian which I focus on, the latest basin wide average I have seen is about 9000 feet for the average 2020 well, for the Bakken it seems to have topped out at 10000 feet for Williston basin average. Lateral average length is longer for Marcellus I believe, but I focus less on gas.
Mike Shellman knows a ton, so he might be able to answer more intelligently than me.
His blog is at link below
https://www.oilystuffblog.com/
WTI has punched through to a New Recent High. Highest since October 2014.
$85.43
Permian Reached A New Record High According to EIA Drilling Productivity Report:
Oil production in the Permian Basin set a record in December as America’s most prolific shale patch leads the recovery in domestic output.
Crude supply from the Basin, which includes Texas and New Mexico, averaged 4.92 million barrels a day last month, according to the Energy Information Administration. That surpasses the previous record set in March 2020. The agency also forecast that supplies in February would surpass 5 million barrels a day for the first time.
https://www.bloomberg.com/news/articles/2022-01-18/permian-oil-production-reached-record-high-last-month
steve
For a few brief years it will take the title from Ghawar for most prolific daily production… and then it will quickly plummet into nothingness.
Stephen
Ghawar is somewhere close to 3.6 M/d today. The Permian is approaching 5 Mb/d. However I agree, the Permian will begin to fade soon.
Hi Ovi, I meant Ghawar at its peak production, it held at around 5M/day for several decades before it began to fade.
Stephen Hren,
After 1980 the data for Ghawar output is not publicly available. People speculated that capacity was 5 Mb/d for decades, but it is far from clear that output was maintained at that level for decades.
Ovi,
I could create a scenario where Permian remains at 5 Mb/d for 15 years, if we assume oil prices remain at a high level (over $80/b) until 2040, it will be falling oil prices after 2030 that causes Permian output to fall.
This is not sustainable. How many more DUCs were completed in December 2021?
No. Wrong. It’s the Best basin complex ever. Still hiding many mysteries and potential. Technology and time will increase EURs at all levels and expand productive fairways.
Gungagalonga,
I assume you mean Permian basin. There is no indication that EUR per 1000 lateral feet will increase any further in Permian. From 2018 to 2021 EUR normalized for lateral length in the Permian basin has been either lower or at best flat. Technology can help to reduce the rate that EUR decreases perhaps, but eventually (probably 2022 or 2023) we will see average new well EUR sart to decrease significantly in the Permian basin.
Steve
The December 2021 POB post showed that the Permian output had exceeded 5 Mb/d in January. Today’s update dropped January below 5 Mb/d and the EIA has now moved that marker to February.
However what is intriguing in today’s report is the number of completions in the Permian from August to December were 403 +/- 2. November to February production is expected to increase at a up 71 kb/d each month. This high rate can only continue as long as drillers continue to use DUCs.
Shaleprofile uses 1.3 wells drilled per month for each horizontal oil rig operating based on long term trends. Recently the horizontal oil rig count was 275 and if it remains at that level and the 1.3 rig efficiency metric is correct that would be 358 wells drilled. Also for the past 4 months the horizontal oil rig count in the Permian basin has been increasing at a monthly rate of 9 rigs per month. When the HOR count gets to 310 it will be enough for 403 wells drilled per month and at a 9 rig increase per month we would be there by May 2022. At that point if completions remain at 403 the DUC count stabilizes or starts to increase if rigs continue to increase.
Dwindling OPEC+ Spare Capacity Sets Oil Up for Sizzling Summer
Grant Smith Tue, January 18, 2022, 4:01 PM (Bloomberg) — As they strain to restore oil production, OPEC and its allies are being left with a diminishing buffer of spare supplies — potentially setting up crude prices for a sizzling summer.
With depressed investment and internal unrest hobbling coalition members from Nigeria to Russia, the task of satisfying the vigorous recovery in world fuel consumption is down to just a few Middle Eastern producers. As they raise production, the buffer of untapped supplies held back to cover any emergency disruptions will grow ever-more precarious.
Pipeline that runs from Turkey to Iraq is apparently on fire. Oil up big at moment on news
Ovi,
Agreed. And according to Goehring & Rozenewajg Q3 2021 Energy Crisis Report, they believe the Permian producers will reach 50% of the Tier 1 drilling locations by the end of 2022, suggesting the peak will occur then or soon afterwards.
steve
This PXD acreage and well count thing is a little more complicated than I described above, after further review.
In the 2020 10k, PXD has 750k gross acres containing 6,700 gross wells. But no doubt many of those are vertical holes. They don’t break that out.
200k of those acres are in the Southern Midland basin in a JV with Sinochem. They just planned on running 3 rigs there in 2021, and as I recall this acreage wouldn’t be considered core.
But the above also doesn’t include the 290k acres they got via the Parsley merger in early 2021. Then, they sold 100k of this 290k to CLR. That 100k was in the Delaware, where they were just running one rig.
The 2021 10k should be required reading for anyone posting here that is more than a casual observer, as it will include the Parsley acreage and well count, less that divested to CLR. Should be out in a couple months.
By the way, PXD picked up $1.2 billion of NOL carry forwards from Parsley, bringing total NOL carry to $6.5 million as of 1/2021.
PXD has about 165 million shares outstanding.
Dividing $6.5 billion NOL carry forward by 165 million shares equals $39+ per share of NOL carryforwards racked up by PXD and Parsley 2015-2020.
PXD claims it’s break even on WTI is $29 in the preface to the 2020 10k. How could that possibly be true?
Oh geez. I forgot about PXD acquisition of Double Point. That added 97k acres.
If you get down to it, it wouldn’t take that much to add up all the public company acreage (assuming it’s all in the 10k) and then consult shaleprofile and see how many gross wells are located on that acreage.
I’m sure a bunch of analysts have done that already.
But the Biden administration told Europe not to worry about Russian supplies . They were going to send all the LNG to replace .
https://www.spglobal.com/platts/en/market-insights/latest-news/natural-gas/011822-us-gas-production-drop-colder-weather-promises-tighter-supply-higher-prices-ahead
False political narrative
US thinks Europe should be worried about nat gas supplies, of course.
Oil is back at 2014 prices with suppressed winter/omicron demand. If this jalopy of a world economy can hold together long enough we will see $100 oil here shortly.
Dennis.
Shaleprofile’s last blog post on the Permian has a hz well count of 33k since 2008.
The detailed paper you linked above says 53k drilled in PB to date.
Happen to know why there is this difference?
Also, I see 2012 wells in PB are down to about 10 BOPD average. Any reason to think newer wells will perform better?
Is there any refrac of early wells going on in PB like they have done in Bakken and EFS?
I have just been too busy w life to keep up with all of this.
Shallow sand,
I asked Enno about that, he said his data is for horizontal wells completed since 2008 that have laterals over 2000 feet. The paper may be using all horizontal wells completed in the Permian basin, but it is surprising the difference is that large. For the average 2019 Permian basin well I have this for Bopd starting at month 1 and continuing to month 158. This assumes hyperbolic with q=50900, b=1.177, and D=0.6686 up to month 72 and 13% exponential annual decline rate after that with well shut in at 20 bopd. The well would reach 10 bopd at month 216. Note those hyperbolic coefficients are for a well profile in units of barrels of oil output per month, data below is converted to bopd.
410
794
670
561
468
403
358
324
298
273
252
235
220
207
194
186
175
171
164
157
152
145
139
134
130
125
122
118
115
111
108
106
103
100
98
96
94
92
90
88
86
84
83
81
80
78
77
75
74
73
72
70
69
68
67
66
65
64
63
63
62
61
60
59
58
58
57
56
56
55
54
54
53
52
52
51
51
50
49
49
48
48
47
47
46
46
45
45
44
44
43
43
42
42
41
41
40
40
39
39
38
38
37
37
37
36
36
35
35
35
34
34
33
33
33
32
32
31
31
31
30
30
30
29
29
29
28
28
28
27
27
27
26
26
26
26
25
25
25
24
24
24
24
23
23
23
22
22
22
22
21
21
21
21
20
20
20
20
20
Shallow sand,
Have not heard anything about refracs in Permian, Mike would know more of course.
Shallow sand,
I have 8 different well profiles I use for Permian up to 2019, the first is for the 2010-2012 average well and after that I have one well profile for each year, I assume well profiles start to decrease after 2019 and the rate of decrease is a function of completion rate (higher completion rate results in bigger decreases in average new well EUR).
For 10 year cumulative in kbo for the 8 well profiles (oldest wells are first) I have
123, 143, 182, 249, 337, 341, 368, 379
Output at 120 months in barrels per month for the 8 well profiles is
338, 331, 396, 554, 731, 704, 841, 957
If posters are interested in a pure play Delaware company maybe check out the SEC filings for CDEV. Everything they have is in Reeves and Lea counties. About 100k gross acres. About 535 gross wells as of 12/31/2020 per 2020 10k.
2021 10k should be out in March. Should be required reading here for those serious about analyzing Delaware Basin production.
Shallow: In every core area of all of the most prolific producing counties in the Permian Basin we can now see clear evidence of the ramifications of over drilling; GOR is going up, WOR is going up and well productivity is going down, in spite of longer laterals, more proppant and more money spent. Best not be fooled by IP90-180’s; those numbers are often operational induced. No better place to see all of this than the Delaware sub-basin. Look at the quality of CDEV wells in Reeves County in the link below. FANG touts 6,000 some odd locations to drill in the Delaware; in its biggest acreage block in Pecos County it drilled 5 wells in 2020 and they will likely be the worse in that block in company history. https://www.oilystuffblog.com/forumstuff/forum-stuff/papa-s-problems
That more or less says the oil age is over for the USA. Conventional has peaked long ago and won’t come back, gulf oil won’t have any growth and all but a few shale basins have peaked. And no untapped field in reserve.
As it is for Europe – terminal decline here, too. The new giant field of Norway doesn’t change anything to this. Time to look for other sources, alternative and nuclear, with coal and imported gas as stopgap. Import works bad, as this winter shows. Whatever works somehow will be done.
Moving to the next level while there still is oil – it will take time.
And I see no alternative to electric cars / trucks / busses in the future – besides cart+horse. Hydrogen is electric car with just another form of battery loading.
And the next 30 years oil is still badly needed – a transformation isn’t done in 10 years. 30 years of oil at our current world consumption is 1 trillion barrel. All tapped big fields are stripper then.
Thanks Mike.
Scenario below has 89 thousand wells completed in Permian basin (55k after 2021) with a maximum assumed completion rate of 400 new wells per month from Dec 2021 to September 2029, EUR starts at 408 kbo for average Permian well in Dec 2021 and falls to 336 kbo in April 2036. URR is 31 Gb for scenario where medium oil prices are assumed. I understand you think there are far fewer profitable locations to drill, this scenario is based on Patzek’s recent paper (Jan 2022) where he assumes there are 55k locations in core areas. If his estimate is incorrect the scenario will also be wrong.
My apologies in advance if this somehow offends.
This looks like an expensive dawn. When these 4 mbd are gone, the world oil markets better are prepared – no spare capacity left at the moment to replace this.
Shallow sand,
Looks like Centennial has run out of drilling locations in sweet spots after 2018. Link to chart below for CDEV from http://www.shaleprofile.com
https://public.tableau.com/shared/2D5NC9N84?:toolbar=n&:display_count=n&:origin=viz_share_link&:embed=y
For EOG peak productivity was 2019 see chart below
https://public.tableau.com/shared/5JMTCJ9B4?:toolbar=n&:display_count=n&:origin=viz_share_link&:embed=y
For pioneer it also looks like 2019 was peak year for new well productivity, chart below
https://public.tableau.com/shared/ZNX5JMWDK?:toolbar=n&:display_count=n&:origin=viz_share_link&:embed=y
If we consider Devon, new well productivity was still increasing in 2021, chart at link below
https://public.tableau.com/shared/JD6KTRW28?:toolbar=n&:display_count=n&:origin=viz_share_link&:embed=y
Diamondback also had increasing new well productivity, chart at link below
https://public.tableau.com/shared/9WT5B2WSF?:toolbar=n&:display_count=n&:origin=viz_share_link&:embed=y
Exxon saw new well productivity fall from 2018 to 2020, then increase in 2021
https://public.tableau.com/shared/TY7XPTN4S?:toolbar=n&:display_count=n&:origin=viz_share_link&:embed=y
Conocophilips saw new well productivity fall from 2017 to 2019 then increase above the 2017 average well in 2020 and 2021.
https://public.tableau.com/shared/Q2M99T5NQ?:toolbar=n&:display_count=n&:origin=viz_share_link&:embed=y
Note that I do not have access to lateral length data so results would be different for a chart with new well productivity normalized per 1000 feet of lateral.
Aside from centennial, the other companies I chose are the top 6 producers in the Permian basin. Centennial is not one of the top 15 producers in the Pwrmian basin based on data from shaleprofile.com
You can read anything you want. I just sold our company in the Delaware. The over pressured nature of this basin made the Parent wells some of the best in the Permian but now with the pressure depleted, thes child wells are some of the worst in the basin for the D&C cost. If I still had my company, I would sell any asset I could to pay off debt and try to hang on and drill fewer wells (unhedged) to enjoy the cash flow with a sinking fund established to plug and abandon the thousands of stripper wells before their cash flow goes negative. The rate of decline of production in the Permian once the DUCs are gone will floor you. At that point, the oil companies won’t be able to hide their debt laden balance sheets and those companies will bleed out.
For the record, I would only drill a shale well will 100% equity and only if I could hedge the first two years of a production at above $80 per barrel. Otherwise it is a losing proposition. I see many of these companies with Debt to EBITDA at more than 2.5 to one. These companies will never be able to repay this debt. For all intents and purposes, they are truly bankrupt.
Yeah. What this guy, he say, me too. On a normalized for lateral length and proppant loading basis no body’s wells in the Delaware are improving, they’re getting worse…well productivity for EVERY large operator with well saturated cores is going down. The cores areas in just a few counties make up 80 % of Delaware production. https://www.oilystuffblog.com/single-post/delaware-basin-2021. WOR’s are remarkable in many of those cores. Declining well productivity is like turning 50 and your eyesight getting bad. It ain’t gonna get better, its only gonna get worse.
What Rystad, the Energy Inaccuracy Agency, the USGS, Patzek, or individual tight oil companies say about remaining drillable locations is meaningless. Folks use to say the same thing about buffalo.
FANG drilled one well on its enormous block in Pecos County in 2021 because in 2020 the five it drilled were the worse in company history. PXD dumped its Delaware crap. Its quickly becoming the land of oily gas wells. Mark my word, there is a reckoning coming in the Delaware.
Mike and LTO Survivor,
Thanks for the comments. Could be on a normalized basis all wells have become worse. I don’t have access to that data.
I tend to focus on the entire basin rather than individual companies. Again this would look differently if normalized for lateral length. Average well productivity increasing in this chart from http://www.shaleprofile.com up to 2021, as Mike Shellman says at his blog the data is from the TRRC and New Mexico’s equivalent, so it is likely accurate. Enno Peters does great work!
https://public.tableau.com/shared/T5W4BK7YB?:toolbar=n&:display_count=n&:origin=viz_share_link&:embed=y
I agree new well productivity will get worse on a output per lateral foot basis, unclear how fast that will occur (annual rate of decrease in new well EUR).
Mike,
Maybe you could post a chart of Permian basin (or just delaware basin) well profiles on your blog normalized by lateral length. Then we would know what the forest looked like.
EUROPE… Where’s All The Gas??
Back on December 23rd, many news stories stated that a Massive Flotilla of LNG was heading to Europe. That was more than three weeks ago. LNG Ships take two weeks to get to Europe.
https://www.bloomberg.com/news/articles/2021-12-22/a-flotilla-of-u-s-lng-cargoes-is-headed-to-fuel-starved-europe
Since December 23rd, Europe’s Natgas Storage Levels are down another 16%.
Going to get interesting when Europe tries to build Natgas Storage for winter 2022.
steve
Steve , I have been scratching my head on this flotilla thing for the last week . I read that 24 tankers were coming to Europe some were rerouted to Europe from their original destinations as per the yarn . My thought has been that LNG tankers are loaded against specific indents or contracts . So what are the companies in China, Japan and South Korea doing if their scheduled tanker did not arrive by date ? Specially since the importers must be big players in the power sector, fertiliser plants etc . No small Mr Chin Dong Ding in a back alley of Beijing is going to import a tanker .There is no such concept as surplus ” floating extra LNG ” like we have in the oil business ( tankers used for storage ) which could have been sold “Off Shelf ” . Is it possible that this was spread to avoid panic in the population ? I don’t know . Stranger things have happened in the past . Last I recall they were still searching for WMD’s in Iraq . 🙂
Hole,
It looks as if there was some LNG supply that bumped up the INJECTION GREEN LINE in the chart, From Dec 28th to Jan 2nd, the Greenline jumps higher showing increased INJECTION of natgas into the storage system.
However, MUMS the word ever since. I haven’t seen that INJECTION LINE move at all in the past two weeks.
IMPORTANT: As I have mentioned to my subscribers, we will know we are really getting close to the ENERGY CLIFF when we see Global Energy Storage Levels continuing to trend lower and lower each year. When that BUFFER IS GONE… we are going to experience Extreme Energy Price Volatility that will be another factor that will destroy LARGE CHUNKS of the Global Supply Chain.
steve
17.7 days of gas in storage for Germany . German Economic Ministry .
https://www.rt.com/business/546399-germany-reveals-gas-reserves/
HOLE,
Indeed… the situation for Natgas storage in Europe is even bleaker. Unfortunately, the Mainstream Media seems to be ignoring this for the most part.
I read that article and if Germany didn’t get any Natgas, then yes, less than a month worth of supply. This is quite interesting:
“According to the consolidated register of gas storage facilities of the European association Gas Infrastructure Europe, Germany’s gas storage facilities are 50.6% full (as of January 11, 2022),” the German Ministry of Economy said in response to a deputy’s request as quoted by RIA. “This corresponds to a theoretical working gas availability of 17.7 days,” it added.”
Interestingly, the Natgas Storage data shows that Germany is now at 45% capacity. It dropped quickly from 50 to 45% in just a few days.
This means, Germany is likely down to 15 days of supply.
If Germans Freeze during Winter… I gather some Politicians Heads are gonna ROLL.
steve
In the winter all the major LNG plants are already producing flat out at or near max capacity. LNG facilities are very complex, it’s not like you can just squeeze out another 10% at will when somebody needs it. You don’t run them at half capacity just for fun. So I never understood the flotilla thing either. If gas was redirected to Europe that means the previous customer has to do without. Our ships weren’t redirected, they went to the shippers who have long term firm contracts. It sounds like a media blitz meant to talk gas prices down to me.
Thanks LNGUY . Confirmation of my thought from a GUY who has an “ear to the ground ” is not only comforting but encouraging . Respects .
New complete hospital UK data set last 8 months-
Age 50-59 chance of being sick enough to be admitted to the ICU (and likely incubated) is
60.5 times great for a person who declined vaccinated opportunity vs
a person who was fully vaccinated.
These findings are also reported wherever the data is collected elsewhere, for example Nebraska state compilation shows sickness severe enough to require hospitalization to be 46 times greater risk for those declining the opportunity of vaccination vs those who were fully vaccinated.
Willful Ignorance,
since the vaccine is free and contraindication is at or close to zero%.
Sorry to put this in the oil thread, but I have to say that the vaccine is not free. It is paid for by the government. That’s why Pfizer, one of the most corrupt companies you can find (see https://clcjbooks.rutgers.edu/books/why-the-innocent-plead-guilty-and-the-guilty-go-free-and-other-paradoxes-of-our-broken-legal-system/ in which Pfizer is taken as one of the most egregious examples) made huge profits last year.
Health care is a need. Profit should not be the motive in satisfying a human need. The pharmaceutical industry has turned into a patent troll which has caused a large part of the population to distrust it and our health care officials who are owned by this industry. This could all be cleared up if intellectual property in the area of health care was covered with copyleft licenses. I would add the food industry to the sectors in which only copyleft licenses are permitted.
Nobody would hinder you doing this, developing something with state or collected money and give it free under copyleft.
Please finance the level 1,2 and 3 tests, too, because nobody wants unsafe drugs.
Other have done it for COVID, too. The chinese vaccine ist state developed, it’s not that popular in the West (no level 3 test so far either, as for the russian).
The vaccine costs are peanuts for the West – they could also finance them for poor countries. Someone calculated the costs for the stately vaccine centers here – a shot costs between 100 and 150 € for giving it. Plus all the testing cost, burocracy cost, quarantine payment cost (the state pays the wage during stately ordered quarantine), helps for small business ++++++
Giving everyone 3 shots with the most expensive vaccine in Germany would cost only 5 billion € – we have corona costs of several 100 billion still counting.
Yes, you could forbid patents in health care, and produce drugs only to self cost prices. I’ll say you won’t have much drugs then – and not often new ones. And more unsafe ones – if the state develops the drug + tests it, there will be much corruption.
Most drug development is done in publicly funded universities (or startups). The patents are then sold to the patent trolls, aka pharmaceutical industry. The pharmaceutical industry spends more money on executive pay, stock buybacks, and dividends than it does on research (https://patientsforaffordabledrugsnow.org/2021/07/08/new-report-reveals-big-pharma-spends-more-on-stock-buybacks-dividends-and-executive-compensation-than-research-and-development/) . The system is extremely inefficient at protecting public health.
Schinzy-
-the vaccination has been free for the person receiving it.
-regarding government financial support for vaccine development and production it has been minimal compared to the hospital costs paid for by medicare of those who declined vaccination but nonetheless have flooded the hospital ER’s and ICU’s when they get sick. And the costs to the healthcare system not covered by the federal government will be shared by all the rest of us in the form of higher insurance rates in the coming years
-I’m glad that successful vaccination programs have been profitable and provided good incentive, or else the death rate from this pandemic which is now over 850,000 in the US would probably be pushing 3 million and the economy would be in much more severe distress-outright depression
I do not understand Covid 19 statistics.
Professor Didier Raoult claims that the vaccine actually increases the spread of Covid 19 because people are more susceptible to infection the first two weeks after being vaccinated. He gives Australia as an example, as soon as they implemented a vaccine mandate, the number of cases exploded.
The vaccine skeptics claim that early treatment using things like ivermectin (at a penny a dose) and betadine nasil sprays (also cheap) prevent hospitalization (see https://ivmstatus.com/). The studies supporting this viewpoint are said to be low quality. Agreed. But so are the studies that validated the vaccines (see https://www.canadiancovidcarealliance.org/). What happened to Maddie de Garay is a crime.
What I don’t understand is why people who choose not to be vaccinated are vilified and not allowed to have the treatment option they desire. So what if it’s only a placebo? It costs peanuts and the placebo effect is quite powerful. Vilifying those who choose not to be vaccinated is a distraction so people don’t notice how little is being done to actually fix the health care system which was in a poor state before the virus. This is exactly what the Nazis did in the 1930s. Remember “First They Came for the Communists” by Martin Niemoller.
“I do not understand Covid 19 statistics. ”
perhaps because you have been using sources of information that deliberately misinform you.
its not all that complicated
If you would like to see some straight forward presentation of actual large scale data results here you are-
https://yourlocalepidemiologist.substack.com/p/state-of-affairs-jan-18
Thanks for the link.
This data supports what I started saying 6 months ago: the vaccine saves lives but does not halt the spread of the pandemic. Nothing on how Uttar Pradesh flatlined Covid cases mid 2021 (https://www.aninews.in/news/national/general-news/no-covid-19-case-in-33-districts-of-uttar-pradesh20210910140454/).
The long term plan seems to be a booster shot every 4 months. Doesn’t seem workable to me.
A perfect vaccine would last forever and 100% protect the person.
We don’t have that,.
But the goal of avoiding be so sick that you beg to be admitted to and treated in a hospital, on a breathing machine and with tube in your bladder, is accomplished something like 50 to 1 risk reduction by getting the vaccinations.
Count me in on that.
There is very little in life that gives you so much benefit for so little risk.
The use of potholders when taking a cast iron pot is one such example.
Your 50 to 1 risk reduction does not apply to everyone.
Accepting at face value everything you hear on mainstream media about the vaccines is an order of magnitude more naive than accepting without question OPEC’s reserve numbers. According to Xavier Bazin who wrote a book on big pharma, revenue for big pharma is on the order of $500 billion / year, of that $100 billion is profit. Their marketing budget is $150 billion/year (why invest in LTO when you can invest in big pharma?).
According to Jake Rakoff who wrote a book on the U.S. criminal justice system, Pfizer entered into three consecutive deferred prosecution deals for everything from bribing managed care companies to illegally promoting off-label medications, only to be busted a fourth time for, among other things, bribing doctors and medical journals.
According to Dr Robert Malone, 95% of those who die of Covid 19 have at least one comorbidity and they average 4 comorbidities. In France, before the vaccine roll outs, 45,000 adverse reactions to medications were recorded per year. The vaccines caused 110,000 adverse reactions in 2021. According to Dr Didier Raoult, a risk benefit assessment should be done for each individual based on his age and health. He estimates that with early treatment in the case of infection, most healthy people under the age of 50 don’t need the vaccine. The trick with early treatment is to keep the infection in the upper respiratory system, that is, out of the lungs. Lumping everyone into the same category and sending them to be vaccinated when the vaccination doesn’t stop the pandemic is pretty senseless. Preventing people from obtaining the early treatment they desire when numerous studies support those treatment options is close to criminal.
Hi Hickory,
Please watch this video regarding ONS statistics regarding the UK, courtesy of a freedom of information request.
https://www.youtube.com/watch?v=9UHvwWWcjYw
Curious to know your opinion.
Schinzy, in Nebraska for the entire year of 2021 the risk reduction for hospitalization by being fully vaccinated was not 50-1, it was only 46-1, for example.
That is 46 x’s less risk if fully vaccinated.
This is data reported by the state hospitals- not some media manipulation or commentary.
Other data supports this degree of risk reduction- such as the entire UK.
That is why I shared the link with you from the Texas based epidemiologist- she is a straight shooter (non-political), and apparently a huge amount of people are unable to find such information. Sad.
The link to the Jan 18th report again-
https://yourlocalepidemiologist.substack.com/p/state-of-affairs-jan-18
Hi Iron Mike,
For those who don’t want to spend 17 minutes on that video, here is the summary-
In the UK he estimates that only about 1/10th of the deaths due to Covid so far were among people with no underlying health issues.
I would not be surprised if this was roughly true, since the large majority of deaths worldwide have been among those over 50 years [and most people over 50 have some health issues]. And it seems like the biggest single underlying risk is being overweight- at any age. It is a valid point, from what I have seen and read.
So if those who are overweight or otherwise not young and healthy are not of your concern or are not in your circle of people, then perhaps vaccination is just for the others and you can take your risk.
I certainly think that local government and government agencies, and businesses of all sorts, should have the discretion to decide whether vaccination is mandatory for their workers, citizens and customers, with full disclosure mandatory if they decide.
Others may disagree, believing that risk should be shared blindly.
Drs are paid to push big Pharma and they make money as a moonlighting cottage business to push these drugs. Big Pharma is the biggest drug cartel in the USA. The politicians rely on big Pharma for their survival and lucrative economic side hustle. Nobody works for free and especially the politicians who will sell out to the highest bidder. The Politicians serve themselves way before they serve their constituents. We live in a great country where everyone is for sale to the highest bidder. I would love to see each politician pet cause. I would bet a transfer of money ie bribes is always available. This is how the third world works.
Oil Markets May Be Even Tighter Than Forecasters Say
Bloomberg) — The oil market is getting tighter and there may be even less slack in the system than forecasts suggest.
The latest outlooks from the International Energy Agency and the U.S. Energy Information Administration show the world needing more oil this year from the members of the Organization of Petroleum Exporting Countries than they did a month ago. The bigger worry is the growing mismatch between the level of oil stockpiles they can measure and the volumes their models predict.
Elsewhere, it sees lower than previously expected Russian production offset by higher U.S. output. The U.S.-based EIA made downward revisions to its forecasts for domestic production, as well as supplies from Brazil and Ecuador. A downward revision to Russian production was offset by an increase in the forecast for neighboring Kazakhstan.
https://www.bnnbloomberg.ca/oil-markets-may-be-even-tighter-than-forecasters-say-1.1709999
Let’s hope the IEA agree to make all its data freely available when they decide in early February so that the matter gets a bit clearer fr everybody.
George
Have you heard/read that they are considering going back to their previous policy of releasing their monthly report two weeks after it is released to their paying customers?
I think they are wanting to make everything free to all – i.e. no paying customers, but they need to get the members to cough up 50% more to cover it (only a couple of million total though). From memory the meeting to decide is February 5th (or might be 2nd).
Very interesting, fingers crossed. I had access to some of the content before but not all. It’s easier to see their assumptions and read between the lines in the full reports than the short summaries they publish on their webpage. For example, in the “5y oil market report” or whatever it is called they used to include a summary table in the appendix with major new upstream projects, start-up dates, capacity etc. one could easily compare the new capacity with their forecast and also make own forecasts based on decline rate assumptions for existing fields.
Good article on Permian basin at FT, just do a google search on “Permian Basin: high oil price breathes new life into US shale” to get by paywall, click top result at page link below
https://www.google.com/search?q=PermianBasinhighoilprice
Wondering about future oil prices and found this site
https://longforecast.com/oil-price-today-forecast-2017-2018-2019-2020-2021-brent-wti
I doubt this forecast is correct.
Also Goldman Sachs sees $100/bo by 2022Q3.
https://economictimes.indiatimes.com/markets/commodities/news/goldman-sachs-sees-brent-oil-hitting-100/bbl-in-q3-2022/articleshow/88971695.cms
In article linked below
https://www.reuters.com/markets/europe/inflation-breaks-records-100-oil-is-also-looming-2022-01-19/
JP Morgan has oil prices rising to $125/b in 2022 and $150/b in 2023, others such as UBS Asset Management believe oil will remain in the $60-$80/b range in 2022. So a big range from $60 to $125/bo, the mean would be $92.50/b, that sounds about right to me for highest monthly average price in 2022 with maybe a $15/b window so $85/bo to $100/bo for a 90% confidence interval for highest monthly average Brent oil price in 2022.
Here is the problem I see with the $100 oil narrative. While it can happen. Economic data is already softening. Even job claims are rising.
We going to get high inflation. $100 oil and slowing economic growth and they are going to have no choice but follow through with zero QE and interest rate hikes.
It’s going to be a disaster. Repeat of 2008 in the cards?
Higher oil prices are never going to last long enough to matter.
Maybe they last long enough to run up a huge amount of debt on top of what already exists only to see oil go back to $50
HHH,
Real GDP growth in 2021Q3 was 2%, forecast growth for 2022Q4 is 5 to 6% (US data), layoffs after holiday season is the norm and surge in omicron cases is expected to subside in next month. Perhaps the rate of growth slows a bit due to Fed action to get inflation down, that is expected.
Oil essentials . A real good presentation by my favorite geologist Art Berman . Terrific analysis .
https://static1.squarespace.com/static/61d5bc2bb737636144dc55d0/t/61ddf96153634f28a1ec7b16/1641937256358/NJH+Presentation+December+2021.pdf
Texas went big on oil. Earthquakes followed…
https://www.vox.com/22891806/texas-earthquakes-oil-gas-drilling-wastewater-reinjection
Dennis, Thanks for the response… I agree on the data for the recent past and near-term future, some trends are peaking in EUR estimates….. However, past statistics area great for trend analysis in the past and perhaps near future modeling…. Medium and Long term they lose their luster. What trend analysis misses is innovation, which is unpredictable, of course. However, innovation has also been a constant in human history, so it feels unlikely that we are at “peak innovation” in the shale oil/gas extraction biz.
I have seen conventional fields that have come back to life multiple times after head stones were planted on them… all due to innovation making them economic again and thus raising the ultimate EUR for those fields. The Barnett Shale also has some miracles in it that keep giving back due to technology and innovation shifts…. I have seen some wells on their third refrac, for example…. thus raising the EUR on them quite a bit from the linear analysis after initial production. The Barnett is somewhat different animal than the Permian shale plays, but it’s past development learning curve was fascinating and kept improving even after periodic stall outs.
Innovation may also move some fairways from Tier 3 to Tier 2… or dare I even say Tier 1??? New Permian play are also developing… EOG has a large stealth play going on in Gaines/Dawson Counties, for example… After years, it’s still in the science phase, but showing lots of promise and appears to be accelerating recently. Scurry and Fisher Counties are also getting lots of positive new trend action right now. If successful, these efforts have potential to raise the overall EUR of the Permian… and they won’t be the last new plays most likely.
I am not disputing that the past evidence may be showing peaks in current, near term EURs for certain trends, but I am saying that the game isn’t over and humans are creative and resilient. The Permian Basin complex has so much unknown potential still, especially when this human creativity is applied.
Thanks again for all your creativity and efforts on your site. Great reading, even when I may respectfully disagree.
Kenny Dornandt,
You are correct that we cannot predict future innovations and the entire Permian basin is very large so there might be some areas that become productive that are not expected. The Permian is not a new basin, so I imagine the oil men in Texas know where the better areas are and that is where they have focused. Also students of Tad Patzek have done an interesting analysis (Saputra et al,2022) see link below
https://www.mdpi.com/1996-1073/15/1/43
Patzek is an excellent geophysicist, he does great work. The paper suggests a TRR of about 62 Gb with a likely ERR of around 54 Gb for the Permian basin. Note that this is in line with a likely ERR based on USGS assessments and current costs and a reasonable oil price scenario. Perhaps innovation will lower costs, but physics will reduce recoverable resources. Technology does not change natural laws.
Frontier Exploration Drilling In 2021 Hits Lowest Point Ever Recorded
E&P companies seem to be running out of new places to drill, and oil price doesn’t make a lot of difference, at least on the upside, but I can foresee another price crash killing off a lt of the high risk and high cost frontier drilling for good..
https://www.rigzone.com/news/frontier_exploration_drilling_in_2021_hits_lowest_point_ever_recorded-20-jan-2022-167638-article/
Oil is down big WTI at about $84.
OFF TOPIC… But has anyone seen NETFLIX after-hours trading??
It’s down 20%. Gosh, tomorrow is going to be interesting in the MARKETS. Looks like Everything is being sold… Energy too.
steve
We will know more tomorrow at close. How many times have we’ve seen these panics get bought?
Eventually the dip buyers are going to get burnt. And it will turn into a bloodbath where 13 years of buying the dip comes back to really bite. Because the dip buyers will keep showing up because it’s worked for 13 years.
Dip buying has worked so well people have forgot how to do a proper analysis of market conditions. And wouldn’t have a clue as to what is coming because they listened to and believed the FED’s bs.
Netflix Isn’t Looking Up — WSJ
6:42 pm ET January 20, 2022 (Dow Jones) Print
By Dan Gallagher
Netflix has proved quite adept at pleasing the masses. Finding more of them is getting to be the real problem.
Both dynamics were evident in the streaming giant’s fourth-quarter results Thursday afternoon. Netflix added nearly 8.3 million new paid subscribers during the quarter — its best growth in a year as the company has dealt with the aftermath of the pandemic’s pull-forward effect.
But that number also fell a little shy of the 8.5 million additions the company had projected. And that was despite a record-sized content dump that saw Netflix release 157 original movies, TV series and new seasons of existing series during the quarter, according to tabulations by Wedbush Securities.
Now winter blues are setting in. Netflix projected adding just 2.5 million net new subscribers for the current quarter, far below the 5.8 million expected by analysts. The company cited “Covid overhang and macro-economic hardship in several parts of the world” as reasons for the weak view.
For the first time, though, Netflix also acknowledged in its letter to shareholders that the deluge in new streaming services from rivals “may be affecting our marginal growth some.” Netflix shares crashed by nearly a fifth following the results Thursday.
******
Cathie Wood Sold Another $1.5M In Netflix On Thursday Ahead Of Stock Crashing On Weak Guidance
9:36 pm ET January 20, 2022 (Benzinga)
Cathie Wood’s money managing firm Ark Investment Management on Thursday sold more shares in Netflix Inc (NASDAQ: NTFLX) just ahead of the streaming video-on-demand company issuing quartely guidance below estimates and sending its shares down in the after-hours session.
Ark Invest sold 2,958 shares — estimated to be worth $1.5 million based on the latest closing price — in Netflix on Thursday.
Shares of the company closed 1.48% lower at $508.25 a share on Thursday. The stock was down 18.1% in after-hours trading at $416.38.
My question is. Is this more than Netflix?
Is the market forecasting that there will be an incursion into the Ukraine?
It looks like a non-event. Neither the stock markets nor oil prices have crashed this morning.
Frugal,
I wouldn’t call it a Non-event because it takes time for Market Selloff to RIPEN. Check out Amazon’s chart. If something BIG is coming, it will happen in the next 2-3 days.
steve
You’re right — now it’s starting to crash.
Frugal , it is still morning . Wait for the closing bell .
This is just a standard single stock crash – at least sometimes the markets work as they should.
No growth in an expensive growth value with negative cash flow -> crash this value. It’s still overpriced as hell if it doesn’t grow a lot anymore.
EULENSPIEGEL,
Just a single stock crash??
SHOP (Shopify) down 13%
SPWR (SunPower) down 16%
SMNEY (Seimens) down 14%
HTZ (Hertz) down 11%
CLF (Cleveland Cliffs) down 9%
ECL (EcoLab) down 9%
AA (Alcoa) down 5%
Looks like more going on than one stock. Again, it takes time for Stock Market Selloffs to RIPEN.
steve
Well I take my stock information from shoeshiners, and they all say everythings is hunky dory, the only way is up! Don´t miss out! /S
When I wrote this the NASDAQ was green.
No action in Ukraine till 20th Feb .Winter Olympics in Beijing from 4th to 20th Feb . Putin is guest of honor . Hope NATO does not doublecross like they did during the Beijing olympics 2008 by instigating Georgia or 2014 in Ukraine when Putin was busy with the Sochi Winter Olympics.
There will be a new post published in 16 to 24 hours.
Have You Seen 200 Million Barrels of Oil Anywhere?
Bloomberg: The International Energy Agency is trying to figure out where 200 million barrels of oil went.
The adviser to energy-consuming nations said on Wednesday that observable global oil inventories plunged by more than 600 million barrels last year. That would be fine were it not for the fact — based on its estimates of supply and demand — that the decrease should only have been 400 million.
IEA says its oil balances aren’t matching observed inventory changes
There is always a gap between the two, but the 200 million barrel discrepancy means the oil market could be tighter than previously thought. The gap could be a result of underreporting of demand or over-reporting production, the IEA said. Its monthly report is a benchmark for traders trying to evaluate the balance between supply and demand the world over.
“A retrospective view shows the difficulty over the past two years of reliably analyzing and forecasting supply and demand,” the agency said on Wednesday. “Lessons learned will improve the work in 2022 and allow us to better understand our market.”
https://www.bloomberg.com/news/articles/2022-01-20/the-iea-goes-hunting-for-200-million-missing-barrels-of-oil
New posts are up.
https://peakoilbarrel.com/opec-update-january-22-2022/
and
https://peakoilbarrel.com/open-thread-non-petroleum-january-22-2022/