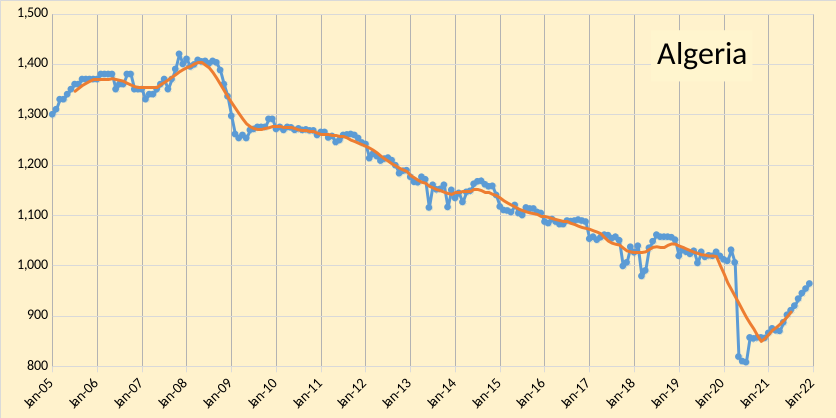
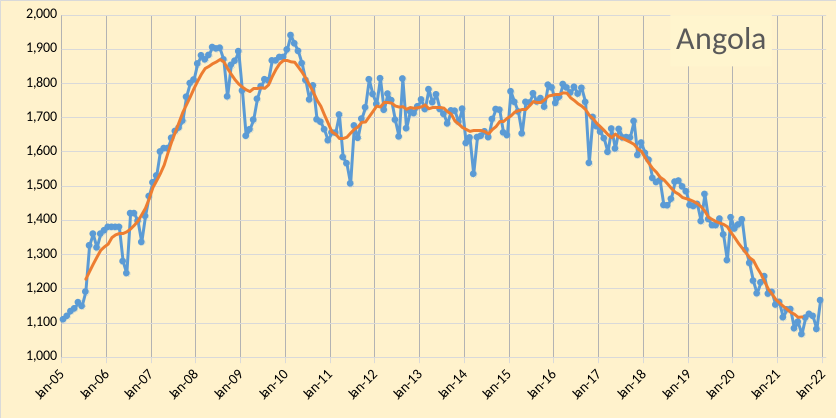
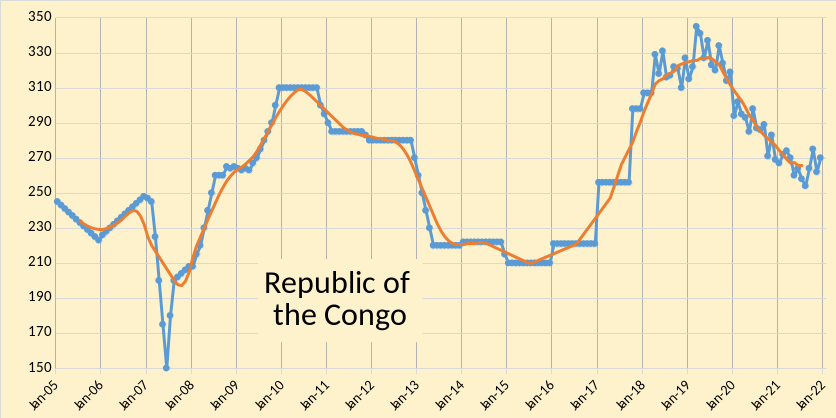
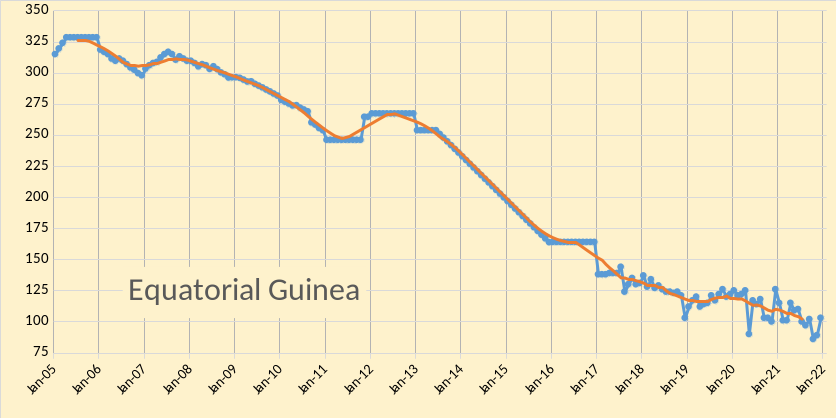
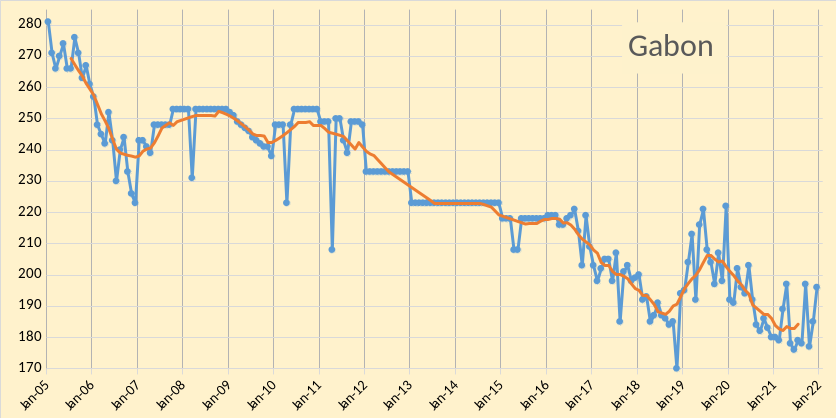
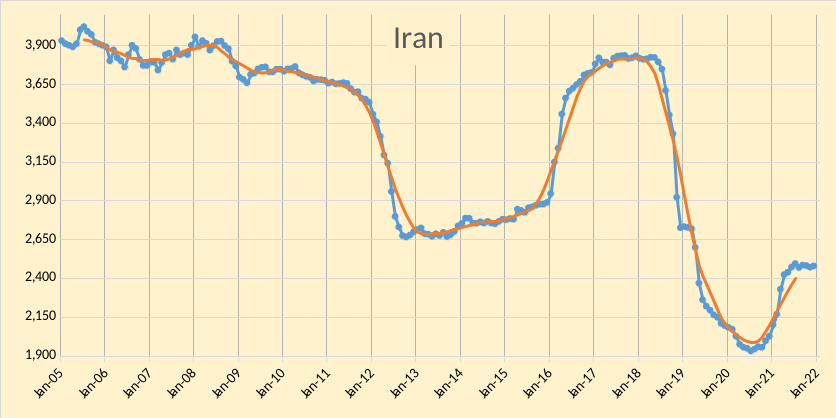
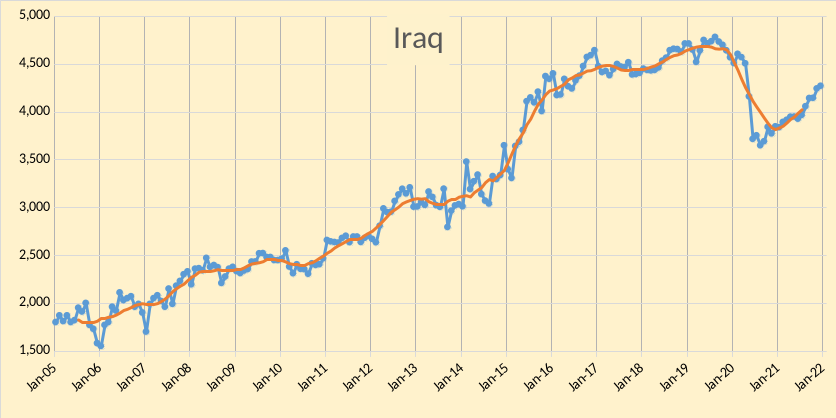
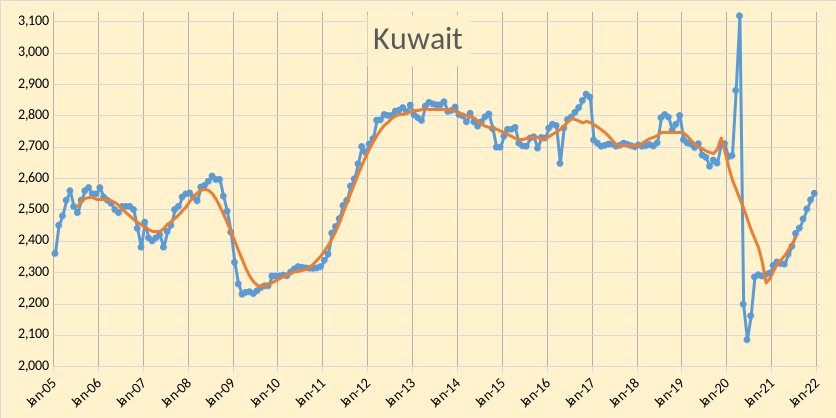
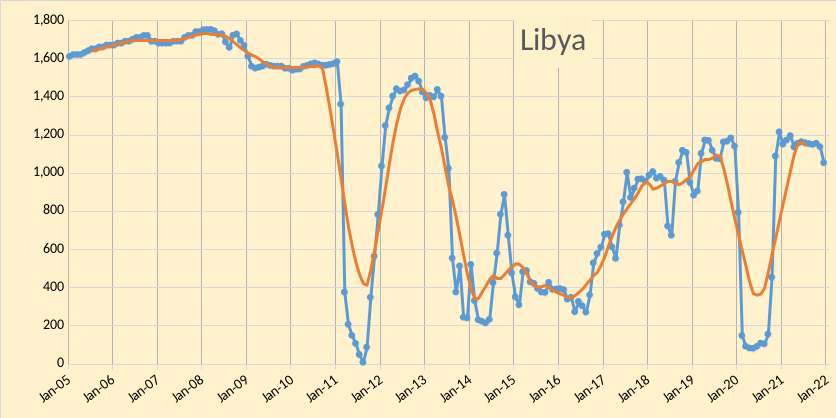
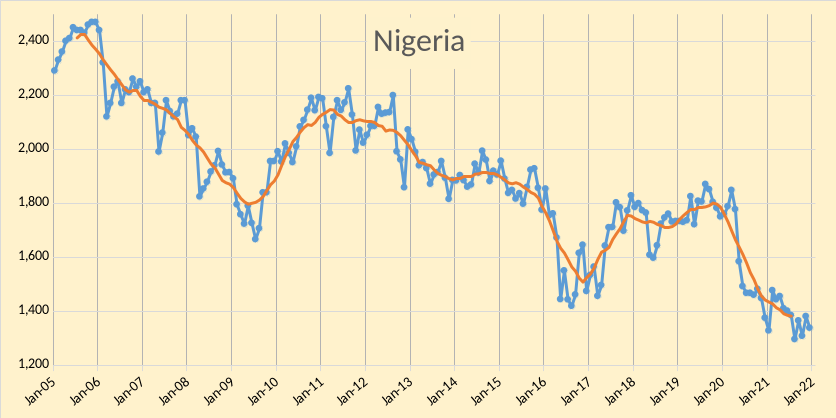
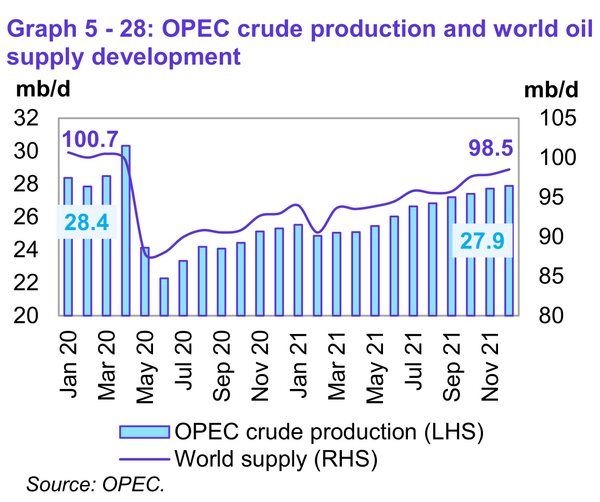
The OPEC Monthly Oil Market Report (MOMR) for January 2022 was published this past week. The last month reported in each of the charts that follow is December 2021 and output reported for OPEC nations is crude oil output in thousands of barrels per day (kb/d). In the charts that follow the blue line is monthly output and the red line is the centered twelve month average (CTMA) output.
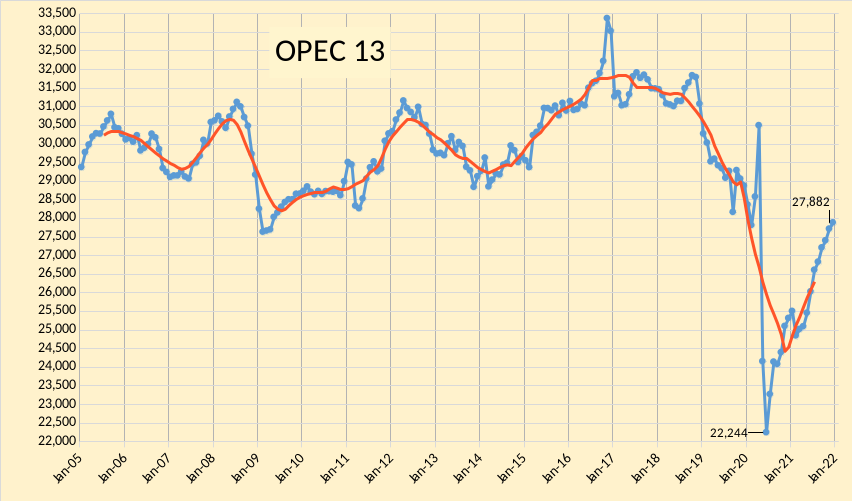
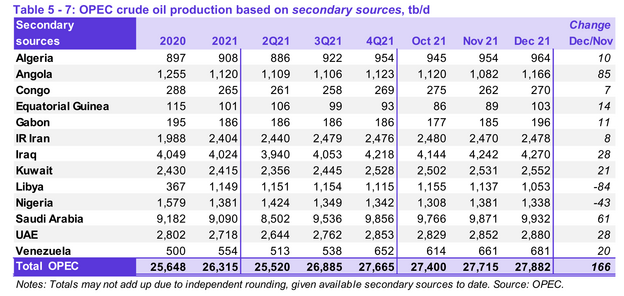
OPEC produced 27882 kb/d of crude oil in December 2021 based on secondary sources, an increase of 166 kb/d from November 2021. October 2021 output was revised lower by 32 kb/d from what was reported last month and November 2021 output was revised down by 2 kb/d compared to the December MOMR. Most of the increase in OPEC output was from Angola(85 kb/d) and Saudi Arabia(61 kb/d) followed by Iraq (28 kb/d), and UAE (28 kb/d). Seven other OPEC members saw increases of less than 22 kb/d in December 2021. Decreased output from Libya (84 kb/d), and Nigeria(43 kb/d).
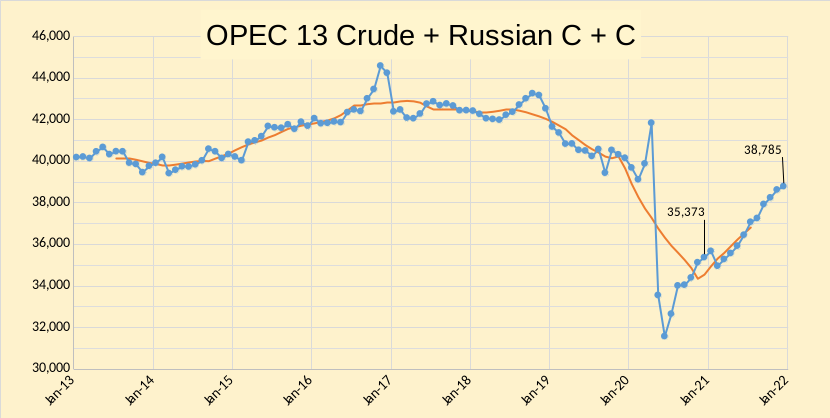
In the chart below OPEC 13 crude and Russian C+C are shown, I expect that OPEC 13 will struggle to get to 29000 kb/d and Russia will likely top out at about 11000 kb/d, where I assume there will be no near term sanctions relief for Iran and Venezuela (together they might add 1800 kb/d in the medium term, if sanctions were removed.) Over the next 6 to 12 months we might see 1215 kb/d added from Russia and OPEC 13. I doubt they will be able to increase by 350 kb/d each month as suggested by the DOC.
World liquids output increased by 0.65 Mb/d in December 2021 to reach 98.51 Mb/d, this is about 2.2 Mb/d less than liquids output in January 2020.
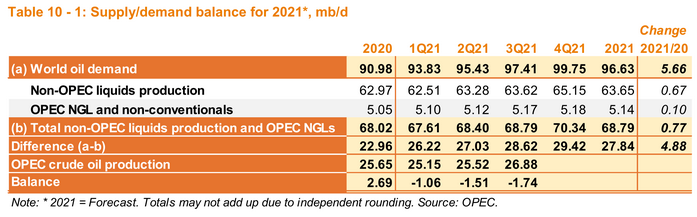
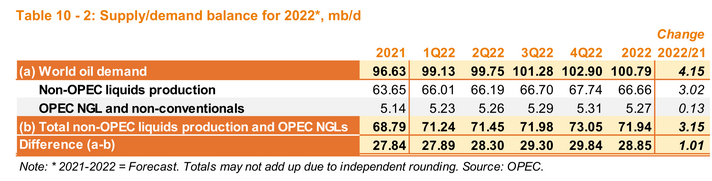
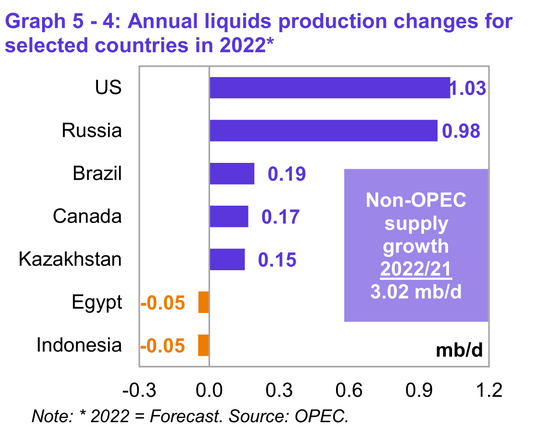
There will be a significant stock draw in 2021Q4 if OPEC’s demand estimate is correct, about 1.75 Mb/d (or 159 million barrels). If OPEC meets its 250 kb/d quota increase each month from Jan to March, there might be a surplus of 492 kb/d in 2022Q1, but note the large increase in output assumed for non-OPEC in 2022Q1 (900 kb/d). It is unlikely this estimate will be accurate in my opinion. Also consider the figure 7 below that shows non-OPEC liquids output increasing by 3 Mb/d in 2022 with two thirds of this coming from US and Russia. A better guess is about 1 Mb/d from Russia and US combined in 2022. Note that this might increase the call on OPEC to 30.84 Mb/d in 2022Q4 and OPEC is likely to fall about 1.84 Mb/d short. If sanctions on Iran and Venezuela are removed by mid 2022, perhaps leaving adequate time for them to ramp up output (roughly 1.6 Mb/d has been taken off the market by the sanctions on these two nations) the supply crunch might be less severe.
From MOMR (page 65):
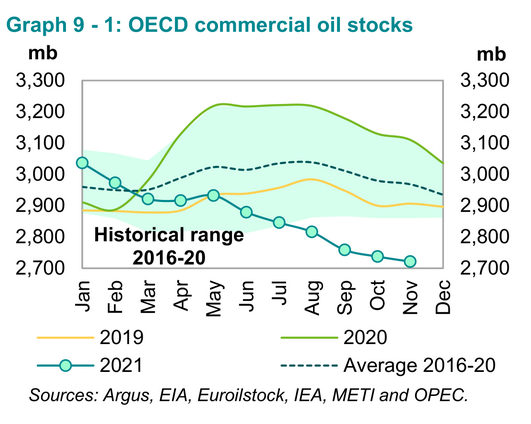
Preliminary November data sees total OECD commercial oil stocks down by 16.0 mb m-o-m. At 2,721 mb, they were 389 mb lower than the same
time one year ago, 247 mb lower than the latest five-year average and 221 mb below the 2015-2019 average.
My expectation is that OECD commercial stocks will continue to fall through the end of 2022.
349 responses to “OPEC Update, January 22, 2022”
The OPEC big 5, Saudi Arabis, Kuwait, Iran, Iraq, and the UAE are almost back to their pre covid level. The other eight, however, are still about one million barrels per day below that level. They have been on a plateau for fourteen months now. They are in obvious decline as the chart below clearly shows. And, they are at about the level they should be according to their decline rate. The other five will have to make up for their one million barrel per day decline.
Anybody know which oil producing countries are managed by a central authority (vs a ‘free for all’ market approach without significant regulatory restriction such as we have in the US)?
I ask with the following in mind- a nation with oil reserves and central planning authority might intentionally produce at a less than maximum ‘all out’ rate in order to sustain their output over more decades, attempting to avoid a boom and bust scenario and having the goal of extending production to a time when others countries are more depleted and the prices for product will be higher. Its what i would do.
Intentionally slower pace, steady progress, longer run time.
I´m afraid such a country would soon be “liberated” by the US, so we will never know how it would work out…
Edit: or by some affiliated group of nations, in some treaty.
This article is a month old yet it is important as it tells us what Russia plans to do in the first quarter 2022.
Russia plans lower oil exports for Q1 2022 despite OPEC+ plan to raise output
MOSCOW, Dec 17 (Reuters) – Exports and transit of oil from Russia are planned at 56.05 million tonnes in the first quarter of 2022 versus 58.3 million tonnes in the fourth quarter of 2021, a quarterly export schedule seen by Reuters showed on Friday.
Russia’s plan for lower export loadings comes at a time of its planned gradual increase in the state’s oil output next year under a recent OPEC+ agreement.
On a daily basis Russia’s own oil exports and the transit of crude from Kazakhstan, Azerbaijan and Turkmenistan via Russia’s Transneft pipeline system will decline by 1.7% in the first quarter of 2022 compared to the fourth quarter of 2021, Reuters calculations showed.
Export Land Model math applying to Russia here? Demographics in Russia are pretty bad. They have to export their way to prosperity. As they just don’t have to demographic profile to consume their own production.
The fact they are cutting exports is very telling of the dire situation their oil industry is in. It’s not like their domestic demand is increasing by any huge amount.
As exports from Russia and Saudi Arabia decrease their revenue decrease. Which will decrease their ability to bring more oil and gas to market. Doom loop.
“Russia’s trade surplus widened to USD 21.06 billion in November of 2021 from USD 7.39 billion in the corresponding month of the previous year. Exports surged 62.4 percent to USD 48.96 billion, the highest since December 2013, boosted by sales to non-CIS (64.8 percent) and CIS countries (49.2 percent). Meanwhile, imports rose at a softer 22.6 percent to USD 27.90 billion, driven by purchases from non-CIS (21.3 percent) and CIS countries (34.4 percent). “
Russia is building floating nuclear power plants to not only produce arctic oil but also mine lithium and copper and other recourses.
But are they even going to make money if prices don’t go much higher and stay higher. Don’t let a trade surplus fool you. Higher nominal oil prices can make the value of their exports seem great even if volumes of exports aren’t making higher highs.
Russia oil exports peaked in 1988. When the price of oil was $15. Russia had a second more recent peak after they recovered from collapse. Which was in 2006. And oil was $58. 2006 was 16 years ago and between 2006 and today and oil prices were much higher for a period of time between 2011-2014 than they are currently and Russia still hasn’t seen a peak in exports higher than in 2006.
Oil exports from Russia have been on a 20 year plateau and they are starting to come off that plateau. They also need much higher prices in order to try to extend that plateau.
And everything they have left is the hard to get to and costly variety.
$58 in 2006 is today about $79 inflation adjusted. If the oil was there to increase exports we at the price they should be increasing at. But they are cutting exports instead.
My friendly neighbor Norway has previously been less smart, exporting oil at fairly low prices during maximum production. However, they have now smartened up a bit, so they now export electricity at high prices, and importing it at low prices, contrary to us, the Swedes, who do the opposite…
https://www.nordpoolgroup.com/Market-data1/Power-system-data/Exchange1/ALL/Hourly111/?view=table
You have probably seen the other picture before but must post it as a new post, as required by the hosting agency…
Hint:
Russia imports less than any other major country.
With a large energy and agricultural production, a highly educated and small population, largest country on Earth, etc.
It would do just fine with minimal exports.
It just happens to have one of the largest oil reserves.
How Russia became the world’s LEADING wheat exporter:
“Mainly through increased yields, Russia saw its wheat production double to 60 million tonnes in 2010 and to a record 85 million tonnes in 2020.”
I think that’s the point. When Russia and Saudi exports fall a lot of dominos fall. It doesn’t really matter if production goes a little higher from here in producing countries if that doesn’t equate into more exports.
Wheat takes a lot of fossil fuel inputs btw. Their exports of wheat will also be cut in not too distant future.
And it’s not like exports have to go to zero for there to be a problem. Just a little less here and there and people go hungry.
In just a handful of years at most the US will be importing on a net basis a lot more oil than we do today as shale oil production collapses. Which everyone here agrees will happen it’s just a matter of when. That means somebody somewhere gets left out in the cold.
I think that’s the point. When Russia and Saudi exports fall
You are missing the point— Russia can live at its current level with little oil exports.
Saudi’s need oil to survive.
In Russia, the entire economy depends on taxes on the export of hydrocarbons. The thought is that projects where the cost is high will not be implemented until the price increase makes it possible to pay taxes on projects. So about 10 years ago, when they did not yet know the exact reserves in Yamal (80% of gas production) , they wanted to develop the Shtokman gas field (the Barents Sea 650 km to Murmansk). But they refused – the estimated cost was $ 150 per thousand cubic meters …
In Russia, the entire economy depends on taxes on the export of hydrocarbons.
Really?
—–the oil-and-gas sector accounted for 36% of federal budget revenues.
“Really?
—–the oil-and-gas sector accounted for 36% of federal budget revenues.”
—–
Hightrekker. Of course, 36%. But the surplus value of the hydrocarbon industry is simply huge. The industry is highly profitable. There are several dollars of income per dollar invested. Revenues from the industry are a multiplier for the rest of the economy.
The profits from exports are used to purchase components for industry and the production of goods.
In conditions of discrimination, there are few goods to sell abroad from Russia. Markets have long been divided. There was a time when the share of civil aviation in the world was approximately 25-30% for the USSR. For objective reasons, it is difficult to integrate into the world trade in high-tech goods.
What’s the oil production and reserves of Yemen to warrant that brutal genocide by the coalition of ” freedom and democracy ” ?
Remember that Wahhabirabia and the others gulf feudal monarchies are kingdoms not regimes in western vocabulary so they can get away with it.
You don’t get the ressources by air raids, as done for many years now.
You get them only after an old style invasion – or a complete capitulation. No sign of this in this war.
The economics of invasion aren’t good: https://www.americanthinker.com/blog/2022/01/one_reason_russia_wont_invade_ukraine.html
That has never stopped the United States [Viet Nam, Aphg, Iraq],
but perhaps Russia is more rational?
Interdependencies do not stop wars. France and Germany were interdependent prior to WWI. At the time, a war was seen as inconceivable for this reason, e.g. Norman Angell, 1910. The Great Illusion: A Study of the Relation of the Military Power in Nations to their Economic and Social Advantage. London: William Heinemann.
“Interdependencies do not stop wars”…
entirely, but perhaps makes war much less likely?
Ask yourself this, which can you survive longer: less income, or not heating your home in winter? I think Europe may be in for a surprise if they think Russia losing a bit of cash will stop them going into Ukraine if they want to.
To quote President Palmer from 24, “It may hurt us, but it will destroy you.”
Dennis
Attached is a table which compares the December crude output of OPEC countries with their required December output. The overall deficit is 629 kb/d. As you can see, the biggest deficiencies are in Angola and Nigeria. While SA is also showing a much smaller deficit, I have noted at the bottom that “official communications” show that they are above target.
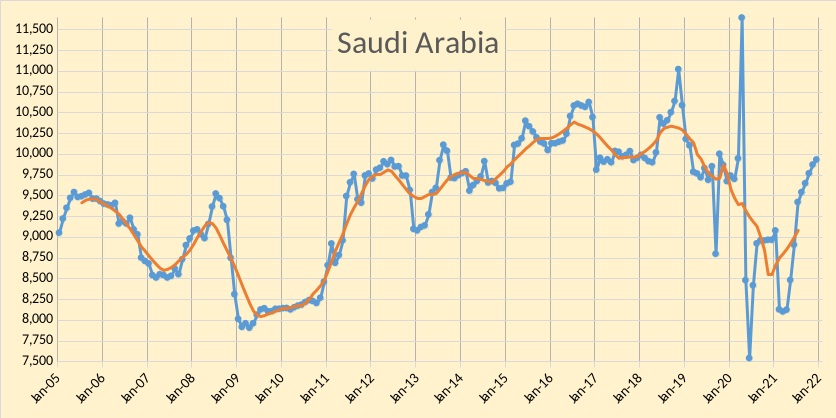
I also note that SA is now producing 9,932 kb/d, which is 855 kb/d above their January 2020 output of 9,077 kb/d. It will be interesting to see how much they will increase production to erase the OPEC plus deficit.
I also note that SA is now producing 9,932 kb/d, which is 855 kb/d above their January 2020 output of 9,077 kb/d.
I think you meant their January 2021 output.
Ron
Thanks for the wakeup notice. I did mean January 2020 but looked up the January 2021 data. January 2020 production was 9,739 kb/d and very close to the same production level for most of 2019. (See Dennis’ SA Chart).
So December 2021 production of 9,932 kb/d is only 193 kb/d higher than January 2020. Over the next six months we will see if SA can increase and maintain a production rate of over 10,000 kb/d.
Ovi,
Thanks. I doubt the deficit from Nigeria and Angola can be made up. The best hope for higher OPEC output is an end to sanctions on Iran and Venezuela. Eventually UAE, Iraq and Saudi Arabia might be able to raise output in a high oil price environment.
A repost of Norways production/oil income, as mentioned above.
Courtesy Rune
Edit: a similar graph might be made of Permian frackers…
I’d love to see that chart updated to show 2021. That chart ends in 2011 right at beginning of high oil price period of 2011-2014.
I think if you extrapolate it out beyond 2021 you’d see that unless prices go way higher there will be lack of revenues to support funding and or ability to borrow cash to support and maintain future production.
HHH,
The world is now upside down.
Norway recently achieved more than 300 USD/BOE (1 BOE = 159 Scm or 1 BOE is about 6 Mcf) for natural gas as opposed to about USD 87/Bo for crude oil.
(On a BOE basis natural gas now achieves about 4 times more than crude oil.)
I got Norway natural gas reserves at 72,358,000 mcf and production at 5,763,408 mcf which at current rate of production they run out of natural gas in 12-13 years. If those numbers are correct they better get as high of a price as they can get.
They have their sovereign wealth fund. Most of which is invested in global stock markets. Smaller slices are in bonds and real estate. That wealth could literally vanish in short amount of time if they are unable to exit their positions during a global liquidity crisis or dollar shortage crisis. A repeat of 2008. $1.4 trillion wealth fund up in smoke.
These high energy prices increase odds significantly that something systemic breaks.
Eurodollar market is where the breakdown will occur.
The most recent NPD (Norwegian Petroleum Directorate) data confirms your R/P number of 12-13.
More than 90 % of Norwegian gas extraction (ex installations) is exported to Continental Europe and the UK, or close to 25% of the EU + UK consumption.
Something is going on in the Eurodollar (inverted yield curve) system, and according to some sources, the Eurodollar system is 3-4 times bigger than the US Dollar system.
The Fed has no jurisdiction over the Eurodollar system.
What is unknown is how much firepower the Fed has left for an upcoming USD liquidity squeeze.
I am also in the camp that the present high energy prices are not sustainable…..after that, we will have close to free energy……. for some time 😉.
Eurodollar system creates actual dollars that are injected into global economy. FED creates bank reserves that are denominated in US dollars that never leave the FED.
It will be up to US government to spend dollars into economy. Not the FED. Good luck 😁
Actual money in the US onshore dollar market is created by commercial banks via loans. Which FED manipulates banks to do with lower interest rates for borrowers.
FED QE is nothing but a collateral swap. They swap bank reserves for US treasuries and MBS with primary dealers. Which allows collateral not to be marked to market. No money is injected into economy during the process.
Banks however do use the bank reserves created by the FED at REPO to borrow collateral from the FED in the form of treasury mainly T bills. Collateral for which they use to borrow money at REPO to fund daily transactions between banks. So shrinking the amount of bank reserves or FED’s balance sheet is a no go. Margin debt used to pump asset prices takes a hit if FED’s balance sheet were to ever shrink.
Eurodollar market dwarfs the FED and the onshore dollar market though. And when there is a contraction of lending in Eurodollar market all hell brakes loose and you get a wrecking ball dollar.
Oil at $147 and 2008 have one thing in common. First people believe what they are told. It was high oil prices or subprime mortgage in USA that caused the crash.
No it was smooth sailing Eurodollar market that created the dollars that drove oil to $147 and it was a contraction in the Eurodollar market that lead to the crash of oil prices and subprime and all of 2008
People are focused on just the inflation created by supply side issues. But it’s these very supply side issues that will limit the ability of the banks the create the dollars or the loans in Eurodollar system from doing what they are supposed to do.
China lockdowns lead to less lending. Is by far the biggest.
European natural gas shortage if it continues will lead to less lending.
@HHH excellent summary. One minor addition worth thinking about: The connection of subprime to the Eurodollar market was largely a self-fulfilling prophecy. Pristine collateral is UST’s. In good and stable times various lower tier collateral was often used. This included increasingly sketchy MBS based products. The growing fear that the underlying collateral would be devalued became a self-fulfilling prophecy. There was at least some whiff of reality to this, probably caused in part by a slowing housing market – which may have a causal root in oil prices – or at least shared late-cycle phenomena.
At the end of the day the Eurodollar market exists because Americans save less than they invest. This is the same as importing more than you export. Low savings are a perennial problem.
America has been a net importer of goods and services for generations, and a net exporter of dollar bills in exchange. This works because international supply chains need to be kept liquid, and local currencies can’t provide that service.
The Fed can’t control the Eurodollar market, but the American government could easily tighten Eurodollar supply by taxing domestic consumption, especially of oil, which would stem its import and encourage its export.
Also I think the Eurodollar should be called the Asiadollar, because the euro pretty much killed the Eurodollar market in Europe.
Hello Laplander,
I received your email back in Sep-21, but I have had a ton of other issues to tend to.
I will of course reply to your email.
I am looking into updating said chart with data as per 2021.
Found a slighty more recent graph, but still a bit old,,,
Don´t think things have improved that much though, but I know Johan S has exceeded expectations. Still they are only at the 1,8 mmbd range…
Laplander,
I have a post showing the same figure with data as per 2016.
https://wordpress.com/post/runelikvern.com/1210
(Chart was updated as per 2017, but not posted)
Note the charts are forecasts for sanctioned fields at the end of the year.
Johan Sverdrup produced more than the operator’s expectations when the chart was developed.
(I was aware that some projected a higher output from Johan Sverdrup, but at the time settled to use the operator’s (Equinor) data.)
Attached is the latest Norway production data from the Norway Petroleum Directorate. The green line is EIA data up to September. The red markers are for Oct, Nov and Dec from the NPD.
The October increase was due to a number of factors according to OPEC, which also explains the increase in December.
“The higher oil output in October was due to first oil from Aurfugl Phase 2 by operator Aker BP as well as rising production in Martin Linge, which started-up in July. Part of this monthly increase is also due to the return of some fields from seasonal maintenance. Moreover, after years of delays, the Yme field in the southeastern part of the Norwegian sector of the North Sea started production on 25 October. At its peak, the field should deliver around 56 tboe/d.“ In addition, the the second phase of the Johan Sverdrup facility is planned to start up in 4Q22.
The November drop was due to technical difficulties which were resolved in December and brought Norway’s production to a new local high since Jan 2014.
From link below
https://www.norskpetroleum.no/en/production-and-exports/production-forecasts/
The Norwegian Petroleum Directorate forecast below, expected peak is 2.03 Mbpd of crude plus condensate in 2024 from a 2021 level of 1.77 Mbpd (increase of 260 kb/d over next 3 years.
USA peak 12,868 Kbpd Nov 2019
World peak 84,598 Kbpd Nov 2018
I sound like a needle stuck on a broken record but am helpless . The facts are the facts . These will not be surpassed .
Hole in head,
The last statement is an opinion. I agree on your facts. Also a fact that there have been many past peaks that were then surpassed in the future. Eventually this will no longer be the case, when that occurs is highly speculative. World 12 month average peak is about 83.5 Mbpd (can’t remember exact number) in Nov 2018 for centered 12 month average. Single monthly records are of little interest, sustainable output is what matters in my opinion.
World oil 12 month average peaked at 83,130,000 barrels per day in April 2019. That 12 month average will never be surpassed.
End of story.
Will one of the great ironies of modern history be that for a brief time POST PEAK — April 2020 — oil prices actually “went negative” when inventories were full, but world supply had begun its permanent decline?
Stay tuned.
Ron,
That is speculation on your part, there are no future facts. We will see in 2025 to 2028 if 2018/2019 remains the peak in 12 month average output. I doubt it. The trailing 12 month average is April 2019, the centered 12 month average is Oct/Nov 2018.
Dennis, you speak as if those extremely optimistic charts on your part are not speculation. No, they are no more than wild ass guesses on your part. At least I study the charts of all the major oil producers and the combined charts of all the minor oil producers. I am firmly convinced of the results of my research. My research tells me that peak oil is in the rearview mirror.
I will make another prediction. We will not have to wait until 2025 to 2028 to know when peak oil happened. I predict we will know before the end of 2023. In fact, world production in 2022 is going to tell us a lot more than you think it will. With Brent at around $88, every nation will be producing flat out. Let’s just see how much they can produce.
Oh, I watched the Art Berman video. Art has the exact opinion as I do. And not just peak oil either, though we do agree there, but also about the state of the world and the coming anarchy. Have you ever noticed how often very smart men think alike? 🤣
Ron,
I agree all predictions about the future are speculation and I consistently say so.
You make statements about the future as if they are fact, in fact they are not.
I also look at historical production of all nations, past discoveries, the rate that resources have been developed, and utilize research by many others in reaching my conclusions.
They remain guesses about the future.
On what happens in 2022 and 2023, it takes time to develop resources, it does not happen overnight. It is unlikely the 2018 peak will be surpassed in 2022 or 2023, but between 2024 and 2028 there is a high likelihood (80% or higher) that the previous 12 month peak in World C plus C output will be surpassed. After 2028 I expect 12 month average output of World C plus C will likely be decreasing. All of it is speculation.
Dennis, sure I speak of the past peak as if it were a fact. I have every confidence that it is. But if I am wrong then I will freely admit it. I will not make excuses as is the habit of a lot of people.
However, making a statement like: there is a high likelihood (80% or higher) Is far worse than just saying I am convinced that peak oil is in the rear-view mirror. It sounds like you have actually done some serious calculations, when in fact you just pulled that 80% number right out of your posterior. I consider your crime far greater than mine. 😇
Ron,
Here is a quote,
World oil 12 month average peaked at 83,130,000 barrels per day in April 2019. That 12 month average will never be surpassed.
The first statement above is a fact on that we agree. The second appears as if it is fact, notice the certainty implied by the use of will.
It is a possibility that your second statement is correct, in my opinion the odds are about 1 in 5.
Yes both are guesses, and both are likely to be incorrect, you are certain you are correct (or seem so) I am fairly certain you are wrong. We will see.
Berman says @ 40:00:
“you can’t compare a barrel of oil to PV because oil burns and does work and there is your measurement, you can’t do that with sun or wind because they come in a barrel and don’t burn, what do you with a barrel of sun? ”
Man, sounds all scientificy and objective doesn’t he?
He then goes on to talk about energy density and comes up with the astounding fact that more energy comes out of a 6″ natural gas pipe than a 6″ PV panel… or some nonsense. Yeah, sunlight on your shoulder is more diffuse than fossilized sun out of a well, but the choice isn’t between RE and fossils, the choice is between RE and nothing.
Don’t expect a reply from Art if you send him an email. He doesn’t know how to return it without a stamp and envelope. I couldn’t believe he said what he did.
Ron,
I agree with you. I was having a conversation with one of my oldest friends who also “was” an Independent oil producer. He was a great geologist/oil finder and now is retired. We both agree that the oil industry at least in the United States ceased to be an economic business when the projects we invested in yielded a potential (if successful) of less than 4 times your money based on undiscounted cash flow. I asked him to dust off some of his work and come up with some conventional prospects. He claims that the conventional prospects are way too small to justify the risk.
We then discussed why the Shale industry is an illusion. The company that bought my company has debt to EBITDA ratio of 2.5:1. ( I sold my shares as fast as I could) Their production (without any drilling) would decline by 50% in a year. This means that prices would essentially have to increase by 50% in order to maintain the same EBITDA year over year. The math simply doesn’t work and we came to the same conclusion that any company in the Shale Industry with a debt to EBITDA ratio of over 2.3:1 is a total zombie company with a significant chance of going bankrupt. Most of these companies are worth the debt value only leaving zero equity value for the investors. If this is a good business model that portends growth, please explain to me what sophisticated investor would play this game? The decline of these shale wells and now mostly child wells is so wicked that if you do not get pay back within 12 months, you will never make any money. The cost to operate a typical 3 year old Shale well making 20 barrels a day is probably only economic at above $120 per barrel once you include water disposal, pulling costs once or twice a year, equipment failure plus average operating costs and finally the typical 25% Royalty. If you don’t make your profit from the end of year one to the end of year 3, you will never make any money on these ventures.
So when I look at Dennis’s charts which show a peak in the Shale oil production being around 2025, I wonder if we are looking at different industries. I don’t know whether we will see $100 oil or $150 oil but at current prices (even at $85) most companies are really bankrupt theoretically with no real path to pay off the debt. One thing to also consider is that the majority of the banks have forced the companies to hedge a minimum of 2-3 years with swaps. Therefore most of the companies other than the larger unhedged companies are not enjoying the benefits of higher cash flow from WTI at above $85 dollars and are in fact losing big money on the hedges while their production is at near peak.
I can’t speak for the rest of the world’s potential for increasing production but I know that the US shale industry is an illusion and will fall off a cliff sooner rather than later.
Art is very smart and I happen to agree with his views but as an optimist I also have hope for the discovery of breakthrough technologies to avert anarchy and wars over scarce resources.
LTO Survivor,
I use royalty and severance payments at an average of 28.5% of wellhead revenue. At $77/bo and $3.50/MCF for gas at wellhead, and NGL at $28/b, the average 2019 Permian well pays out at month 20. (undiscounted net revenue is equal to $10.5 million at month 20). My understanding from Mike Shellman is 36 months is usually adequate for a profitable well to payout. If we use a dicounted cash flow analysis where the net present value is equal to well cost, we would need a real annual discount rate of 55% or a nominal annual discount rate of 57% (assuming a 2% annual rate of inflation). The average 2019 Permian well based on shaleprofile data and a hyperbolic fit to data with terminal decline at 13% per year after month 85 (hyperbolic used for months 24 to 84 from first flow) has cumulative output of 407 kbo, 1900 MMCF of natural gas, and 158 kb of NGL at month 144 from first flow at output of 20 bopd.
Note also my economic analysis assumes about $192 thousand (2020$) per year is spent on average on downhole maintenance for the average well over its life.
We have been living in a very strange place these past 13 years. A place in which interest rates and bond yields are actually negative when corrected for inflation. A lot of previous predictions of peak oil date made before 2009, failed to anticipate the effect that zero or negative effective interest rates would have on what had previously been uneconomic oil and gas deposits. There was very little unconventional production before 2008. If rates rise substantially due to inflation, global production is going to plummet. Zero interest rates and artificially low bond returns (resulting from QE) have masked weakness within the hydrocarbon sector. Would anyone be drilling shale if interest rates were at 5%?
This discussion is about when world oil 12 month average has peaked or will peak. Regarding barrels of oil
At least as important is ERO(E)I of those barrels. Already in 2012 (and earlier) ASPO conference speakers talked about this.
“The important thing (so far) – economically – is NOT Peak Oil but a cessation of growth in oil and energy,” Hall continues.
Next he describes the energy return on invested (EROI) concept: the energy delivered to society divided by the energy put into that activity. In countries around the world, Hall and his students have found a declining EROI for oil production.
Hall presents the “cheese-slicer” diagram that shows that the economy must extract energy, use it to produce GDP, which is then divided into two categories: investment and consumption. We invest in energy acquisition, infrastructure maintenance, and discretionary investments. Consumption is split into staples and discretionary. The charts begin in 1949, and if the EROI continues to decline as Hall suggests, by 2030 a much larger percentage of investments must be devoted to energy acquisition, greatly challenging both infrastructure investment and discretionary investment.
By D. Ray Long, originally published by ASPO-USA
August 6, 2012
Maybe this is less important than in the past ?
If important (almost) same way, we shouldn’t look at the number of extracted barrels only.
And what about the quality of crude oil and contaminations with different kind of elements ?
Han, yes I know EROI is very important. But where do we find those figures for OPEC, or Russia, of for the USA. Barrels is all the data we have so that is all we can track. I know it is not a perfect measure of what is happening in the oil patch, but it is all we have. Therefore I will keep tracking barrels per day.
…..EROI is very important. But where do we find those figures for OPEC, or Russia, of for the USA.
Ron,
Those figures cannot be found, because it will be impossible to measure them. That goes almost without saying.
I brought this subject up to ‘declare’ that Peakoil is most probably in the rear view mirror, when declining ERO(E)I is taken into account. Even without looking at this parameter, counting only barrels, it could be in the past. According your opinion.
Important then is: how long could a world production plateau last, during which world oil exports won’t decline drastically (at least in theory)
how long could a world production plateau last, during which world oil exports won’t decline drastically (at least in theory).
I don’t think a plateau in exports would last very long. When it becomes obvious that peak oil has passed, some exporting nations will start hoarding their oil. And due to the fact that oil prices will spine sky high, they can export less and still make more money. It will be crazy times.
“It will be crazy times”
And those people/companies/regions with electric capable transport will look brilliant.
Did you write the title, or did the editors do it for you? Love the hedge though, you know, just in case the 6th peak oil of the century showed up (it did), and do I hear a bid for the 7th?
https://oilprice.com/Energy/Crude-Oil/Why-Peak-Oil-Is-Finally-Here.html
Nope, I wrote everything there. And I was three years off. It is better than Dennis’ guess of 2026 to 2028. He will be eight to ten years off. 🤣
You are 3 or 4 years off… currently. Hell, it took Hubbert what, 45 years to be wrong about the US peak? The SECOND time he claimed it in 1956, not the first time he did it back in like 1936-38, I forget which. It took TOD 5 years to implode after getting gonged off the stage with their 2008 call, but they were far more visible than this place, and the professional stigma must have been making some folks awful warm to continue to be associated with it.
Ron,
We will see, I guessed 2020 in 2012 and was also wrong. Your 2015 call seemed wrong to me and I said so at the time. A claim that 2018/2019 will be THE peak also seem incorrect we can see in 2025 to 2028 what happens.
HIH
The EIA is predicting that in December 2023, US production will be 12,668 kb/d, just 298 kb/d short of the November 2019 peak. Also note that the November 2019 peak has been revised up by close to 100 kb/d.
I am not saying that I agree with their forecast. They are also saying that WTI will be $62 in December 2023.
Dennis, where will we manufacture the surplus DUCs from to show month over month growth which is the only reason we have seen any growth in 2021. Tell me how the Drilling Rig count will increase with the diminished labor pool? I had to shut in two new wells that I just completed because while there are plenty of disposal trucks and SWD capacity around me, there are zero drivers available to haul off the frack water.
The “woke” Labor pool has moved on to alternative energy platforms (another Wall Street scam) or they are starting an ESG side hustle (which is also a huge money waster). I do believe in limiting emissions and recycling frack water but other than that ESG is another “woke” fabrication that has zero intrinsic value and cannot actually produce the goods and services necessary to run an economy.
The only reason PE touts ESG is so they can raise more money from the Pension funds requiring ESG to earn their 2% management fee for just opening their office doors in the morning. Having worked closely with PE, I can honestly say that I have never been less impressed with allegedly very well educated people in my entire business career. They have zero talent in the category of “value add” and usually minimal industry specific wisdom or experience.
LTO Survivor,
when you use PE do you mean private equity? There are many meanings of PE. Horizontal oil rig count has been increasing in the Permian basin, higher pay for drivers will eventually attract more truck drivers.
Dennis,
PE= Private Equity
Tight oil official estimate is out for Dec 2021 see “tight oil production estimates by play” at page linked below
https://www.eia.gov/petroleum/data.php#crude
December 2021 at 7.6 Mb/d about 832 kb/d below Nov 2019 peak. Centered 12 month average (CTMA) for July 2021 (most recent data point) is 7.27 Mb/d about 830 kb/d below the Nov 2019 CTMA of 8.1 Mb/d, the Nov 2018 CTMA for tight oil (at World C plus C peak) was 7.04 Mb/d. Units for vertical axis on chart below are millions of barrels of crude plus condensate per day.
Latest Art Berman video . Talks sense . Also says OPM in shale has dried up and the growth party is over .
https://www.youtube.com/watch?v=vyxddYfXaQk&t=2275s&ab_channel=Wealthion
Art says, bluntly, growth in oil supply has stopped. Not “we’re running out.” But–supply has stopped growing.
Truly amazing talk after about minute 25. He even uses the “O” word after minute 40 or so.
What he says after minute 45 about mass migration and refugees in the future just blows my effing mind, because IT IS THE LATE BRONZE AGE ALL OVER AGAIN. (See “Sea Peoples”.)
There’s a more radical written presentation here
https://www.artberman.com/2022/01/05/the-climate-change-trip-to-abilene/
or here
https://www.artberman.com/2022/01/19/oil-it-was-the-best-of-fuels-it-was-the-worst-of-fuels-art-berman-and-nate-hagens/
I thinkthese might have been written partly by Nae Hagens and it is mostly a retread of Prof. Rees’s ideas bu interesting to see them embraced by someone so prominent in the oil industry,
Art Berman claimed that there was no significant oil in shale formations in the US in 2011. On video. Does his saying anything on video matter when now whatever he says contradicts his professional “knowledge” in 2011? Maybe he learned stuff since then? Maybe we should, about the value of his opinion on a topic that he now contradicts himself on?
People say a lot of stuff.
In 2016 Dennis Gartman said oil would never be above $44 WTI again in his lifetime.
I try to avoid predictions.
I do like trying to figure out how many wells can be drilled per unit in places like the Permian basin.
Four of the six core counties in the Midland Basin are 30 miles by 30 miles. Those are Midland, Martin, Howard and Glasscock. Not that big really. Midland County already has over 3,600 shale wells, or about 8 per 1,280 acres. If those are all in a single zone, that would be on 660’ spacing. That’s already getting pretty tight. That is the same spacing as we are required to space our 900’ vertical sandstone wells in our tired old stripper field that will turn 117 years old this summer.
I figure all of the core areas in all basins will eventually go the way of Parshall in ND.
That is unless someone figures out how to get a secondary of tertiary recovery project going that is akin to the water floods and CO2 flood we have seen with conventional production.
People do say a lot of stuff. Have you ever seen Art explain how his expert geologic knowledge didn’t know there was significant oil in the shales in the US? Like….ANY? Why would he just say ignorant stuff?
I don’t know what he’s said or why.
People say stuff that is controversial to get attention.
I kind of like to just look at the production info on shaleprofile and see how companies are doing.
I used to do that on IHS, but shaleprofile is a lot easier (and cheaper) to use.
For example, EOG is completing some huge wells in NM Delaware Basin and they are really growing production.
In November, 2021, EOG had 1,826 wells in the Permian basin produce 323,503 BOPD. That’s a lot of oil.
The 279 wells completed in 2021 produced 175,573 BOPD.
The 242 wells completed in 2020 produced 53,041 BOPD.
The 293 wells completed in 2019 produced 43,181 BOPD.
The remaining 1,012 wells completed 2008-2018 produced 51,708 BOPD.
EOG has top notch acreage in the Eagle Ford. Looks like EOG hit a monthly peak in the EFS in September, 2018 with 286,399 BOPD from 2,736 wells. In August, 2021, the last EFS blog post on shaleprofile, EOG produced 203,471 BOPD from 3,574 wells.
EOG also has top notch acreage in the ND Bakken. Looks like EOG hit a monthly peak of 96,473 BOPD from 576 wells in the Bakken in September, 2014. In November, 2021, EOG had 804 Bakken wells which produced 22,150 BOPD.
Shale has saved the world’s bacon. As an owner of conventional production, it has probably cost me a decent amount of money. But it has probably been good for the other investments I have.
I figure shale will eventually go the way of US conventional, but I tend to think it won’t be a gentle decline down the production hill.
But maybe I’m wrong. I hope I am, because a fall off a cliff won’t be pretty for a lot of things.
Or maybe most of us are wrong and abiotic oil will save us?
Abiotic isn’t where the oil is to be had for a reasonable price, as we continue to consume and demand more. Canada and Venezuela are. One being a geopolitical problem, the other being a potential environmental restriction, should the government decide the environment means more than its ability to make plenty of money without additional taxation of its citizens (and what government has ever thought that?).
My production experience is almost exclusively with shale gas and shale oil and light tight oil. The common knowledge back in the 80’s and 90’s when I was working in the industry was that the Appalachian Basin would never become anything of note because you couldn’t put the lease rights back together again. Boy was that wrong. If anyone was actually interested in the downfall of shale, they only need to do the work to see the precursor events. You can bet that Art can’t do that, he is a straight up broken clock routine, can’t happen…oops….can’t be big enough to matter…oops….can’t last when price drops (2016)…oops…..can’t turn the US into worlds largest producer…oops….can’t grow any more……tick tock tick tock.
I believe that the Shale companies with great balance sheets will gobble up the “Shitcos” with debt laden balance sheets and look for greener pastures off shore and over seas with their free cash flows. Believe me, the C-Suite team at EOG know full well that they need to reinvent themselves over the next few years to stay relevant as an oil producer. They have had a track record of being innovative and hard working so I believe they will survive but in a different form.
Art is a scientist turned capitalist, like many of us (including me). Difference is he is prioritized with selling an extremist fantasy to attract eyeballs…. much like the Weather Channel promoting climate change fear so they can charge more for ad time. Art is selling his wares for profit, and to advertise, he fans the flames of panic. Really a simple concept… we all hear the radio ads about Medicare saviors and time share property white knights. Art says… come buy my stuff for the answers to the end of civilization! Get a membership and you will be enlightened to prepare for death! By the way, I am not condemning him for this, he has made tons of cash… and that! …Is capitalism and more power to him. My problem is that I do not think Art’s opinions are worthy of the folks in this medium for a scientific discussion.
Regardless of Art Berman, where do the shale bulls think a company like EOG will be long term?
In the grand scheme of things shale has hit so fast. But look at what has happened to EOG in EFS and Bakken. Drilled a lot of wells after peak and production still has fallen a lot.
Will the Permian be different?
How attractive is EOG when it’s average well produces less than 50 BOPD? Less than 25?
So much depends on the price of oil and gas, of course.
Very hard stuff to predict. But looks to me like EOG will need to find another “big” shale basin once the limit gets hit in Eddy and Lea.
The last US shale profile post shows that EOG hit a peak in 2/2020, right before COVID hit.
About 800 wells added through September, 2021, and EOG was still 90k BOPD below that 2/2020 peak.
EOG is a good proxy, “Double Premium” acreage and wells in the three big oil basins, plus some decent stuff in Wyoming.
Which is smarter, ramp up drilling and grow production, or try to keep it flat and make it last a few more years?
Hard to predict oil prices when the range since shale started big in 2008 has been a monthly average of $15-135. So how fast to crank it up?
I’d like to talk to the Econ guys in these big shale companies. I assume they have some?
I don’t think Art is a scientist.
“Arthur E. Berman [M.S. Geology, Colorado School of Mines] is a petroleum geologist with 36 years of oil and gas industry experience. He is an expert on U.S. shale plays and is currently consulting for several E&P companies and capital groups in the energy sector. During the past year, he made more than 25 keynote addresses for energy conferences, boards of directors and professional societies. Berman has published more than 100 articles on oil and gas plays and trends.” (from oilprice.com)
Thanks, RGR. Now we know not to care a goddamned bit about what you “think.”
Mike B , thanks for saving me the trouble . Kudos .
I don’t really want to get into a debate over Art Berman.
I’d rather focus on whether the Permian Basin is going to get back to the tremendous growth it was in pre COVID, how long it will last, etc.
The idea seems to be PB will grow for at least a decade, if not more, because of multiple benches. Not sure how accurate that is.
Also, what is the optimal spacing? Both Mike and LTO Survivor make the case it is 4-5 wells per 1280 acre unit. In fact, it seems LTO sold a large part of his Delaware Basin holdings for this very reason.
Mike is not an internet oil producer. LTO is not an internet oil producer. Both are on the ground in two of the largest shale basins in the USA. One of those, the EFS, seems to have hit a wall. The other has turned out to be massive, but how much higher can it go?
Art Berman is an engineer, not a scientist.
“Art Berman is an engineer, not a scientist.”
What, he can’t be BOTH?
And you, Al, you are a punk.
Thanks for the link, interesting discussion. I think the only way oil prices will fall to sub $50 is a major economic depression. Which doesn’t seem likely at the moment, but who knows.
Regarding oil consumption. I think we are at the flip side of what occurred during march-april 2020.
Incredible what has happened in such a short period of time. Oil prices will continue to edge higher for now i think.
Saudi Arabia to stick with OPEC+ quota despite shortfall from other producers Bold mine.
Saudi Arabia does not plan to pump more crude beyond its quota to make up for other OPEC+ members’ production shortfalls, the kingdom’s energy minister, Prince Abdulaziz bin Salman, said Jan. 17, despite increasingly tight spare output capacity among the group.
OPEC and 10 allies are hoping to restore their production to pre-pandemic levels by late 2022 through a series of monthly 400,000 b/d production hikes, but not all members are likely to get there, having already hit their maximum output levels or come close to it.
That has raised doubts about the OPEC+ alliance’s ability to keep markets amply supplied and led to speculation other members with sufficient spare capacity — namely Saudi Arabia and the UAE — would have to step in to keep the market well-supplied.
“They have hit their maximum output level.” That’s the same story many other nations, not just OPEC+. It is not only that they have hit their maximum output level, their maximum output level will decline a little every month. Even one of the world’s three largest producers, Russia, has hit its maximum output level and will decline from now on. Of course, there will be months where they have a slight increase, but the general trend will be down.
We are in the post-peak period of world oil production.
In other words, most or all of the post-Covid oil production recovery has already taken place.
For the vast majority of nations, I think that is a foregone conclusion. There may be a few of the OPEC nations that have some recovery left, but not very much. Every non-OPEC nation is producing flat out, and many of them are in decline.
Ron
There are four Non-OPEC countries that will continue to increase production for a few more years, Brazil, Canada, Norway and Guyana. Kazakhstan is a potential fifth.
What is critical here is the decline rate in those countries that we know are in decline. It is close to 500 kb/d/yr. The countries mentioned above will not increase their production by 500 kb/d/yr.
If the IEA, EIA and OPEC are correct in their prediction that demand in H2 22 will exceed pre pandemic levels, that will put a lot of stress on the few OPEC countries with spare capacity. The first clue will come the March OPEC report when SA is committed to provide 10,227 kb/d in February and an additional 107 kb/d every monthly after that to September.
Ovi,
You forgot the US, it will at minimum return to previous peak in 2019, likely 1000 to 2000 kb/d higher than the peak 12 month average.
Ovi, World oil production, less the 11 largest producers, (Dennis’ big 11), since 2016 has been declining at an average rate of 860,000 barrels per day per year. They are now about 2.5 million barrels per day below their pre-covid level….and declining! And they will continue to decline. Your growth nations will not even come close to making up that deficit.
Ron
When I look at that chart, decline is from Jan 2013 to Jan 2020, 571 kb/d/yr. (27,000-23,000)/7 = 571 kb/d/yr. Not 860 kb/d/yr.
After Jan 2021, when production starts to decline again, a new decline slope will develop. There is insufficient data yet to see what that decline rate will be.
I was very clear about the countries I mentioned.
“The countries mentioned above will not increase their production by 500 kb/d/yr.”
Ovi, when I did the calculation again, the data was pretty much what I said it was.
I started at September 15 and averaged every 12 months from that point. The results are below with the first data being the September 2016 previous month. The top row is the actual data for that month and the bottom row is the 12 month average for the 12 previous months.
Ron
I have plotted the data in your first line in the attached chart. What is clear is that 2020 is a discontinuity in your data, similar to what is shown in your original chart.
The slope of the first four years is 567 kb/d/yr, similar to the number I noted above. Looking at the second segment 2020 to 2021, the slope is 494 kb/d/yr. It will take a few more years to better define that slope.
Another way to look at your data is to look at the blue line in the chart. it shows a steady slope of 567 kb/d from Sept 16 at 24,800 kb/d to Sept 2020 to roughly 22,300 kb/d and then imagine a discontinuity or vertical drop of 1,300 kb/d to 21,000 kb/d and then a new slope, similar to the previous one.
So what does this chart say to those countries that can increase their production.
This means that those countries that can increase their output have to produce an extra 550 kb/d/yr to offset the decline and in addition have to make up the one year loss of 1,300 kb/d.
Ovi, I have emailed you the Excel worksheet with my data. I have checked and double-checked it. I stand by it. It is correct. The 2020 discontinuity does not matter because by September 2021 they had fully recovered from that. I made a slight mistake in the data I posted above because I began with the difference in 2017 instead of 2016. But it did not matter because it came out almost the same.
I measured using the monthly data and then using the difference between 2015 and 2021, and dividing by the six years elapsed. They both came out the same. That data is in bold below.
I stand by that data. It is correct. The annual decline for the combined world oil production, less the Big 11, is declining at around 850,000 barrels per year or more.
World oil production was, in September, still over 5.5 million barrels per day below its 2018-2019 twelve-month average peak. World less Big 11 is 2.5 million barrels below that level while the big 11 is still 3 million barrels per day below that level.
Since the world less the Big 11 will decline, even more, that means the Big 11 must increase its September production by 5.5 million barrels per day to make up that gap. Well, 5.5 million barrels per day plus the amount that the World less the Big 11 declines. And as I said, they are currently declining at the rate of 860,000 barrels per day per year.
That will be a Herculean task for Dennis’ Big 11. I just don’t think they can do it.
Of course Ron , your arithmetic is correct . 600 million barrels used from inventory .IEA had calculated 400 million . Ovi had posted a link on this . We are in a supply crunch .
No , I will redefine this as ” peak demand” . This is the narrative that the deniers love .
Ron, “That will be a Herculean task ” . What is that ? 5.5 mbpd + 865Kbpd ( make it 1mbpd ) = 6.5 mbpd . That is what KSA EXPORTS PER DAY to the world . You just let the bull loose in the China shop . As Colin Powell said ” If you break it then you own it ” 🙂 . Hope you carry a lot of product liability insurance . 🙂
Those 11 nations increased output from 49000 to 61000 kb/d from Jan 2013 to Dec 2019 (7 years), this is an average annual rate of increase of roughly 1714 kb/d. Currently the big 11 are at around 57000 kb/d, about 4000 kb/d below pre-covid level, if previous rate of increase continues we would see output for big 11 increase by about 6800 kb/d in 4 years, the rest of the World declining at about 567 kb/d per year over the 2020 to 2025 period would see output fall by 3402 from the Dec 2019 level and by 3969 kb/d from World centered 12 month peak. The difference is 6800-3969=2831 kb/d above the centered 12 month peak from Oct/Nov 2018.
Dennis wrote: if previous rate of increase continues we would see output for big 11 increase by about 6800 kb/d
If the previous rate of increase continues? Dennis, you know that is not going to happen. 823 kb/d of that average annual increase, almost half, was from the USA alone. Do you seriously believe that is going to happen again? Yes, shale oil may continue to creep up, but very slowly. Those boom days of an increase of almost 1 million barrels per day per year are gone forever.
And of the other 10 nations on your list, some will actually decline and the others will contribute but a pittance to the overall production.
Dennis, it just ain’t gonna happen.
I saved a New York Times column from 2005 to which this article refers:
https://www.greencarcongress.com/2005/03/algeria_opec_ha.html
“Algeria’s minister for energy and mines has said that OPEC has essentially reached its production limit.”
We are now 16 years later and it sure looks like OPEC+ can’t deliver on it plan of 400,000 b increase per month through this spring.
Ron,
US tight oil keeps increasing, Norwegian output is expected to increase up to 2025, Brazil and Canada are both expected to increase and many forecasts have Russia maintaining flat output at least until 2025 and possibly until 2030. OPEC may also see increased output from Iraq, Iran, UAE, Saudi Arabia, and Kuwait, difficult to know how it plays out, but if oil prices remain at current levels or rise higher World output is likely to continue to increase up to 2027, we are likely to see flat to declining output after that unless oil prices fall, in which case decline may occur sooner than 2028.
Dennis, who are you trying to convince, me or yourself? It sounds to me like the latter. Yes, the US, Canada, and Brazil just may increase a bit. But that will not be nearly enough to make up for the decline in the rest of the world. You keep ignoring the decline in all those declining nations. And there are a lot of them, including Russia.
At any rate, lest just wait three or four months, that will tell us a lot about what is about to happen. You and I battling about what is about to happen means nothing. I am anxiously awaiting the next four to six months. I know they will tell us a lot.
Take care, Ron
Ron,
I am explaining to the other readers my reasoning, I know you will not be convinced.
Well, you started your comment with:
Ron,
US tight oil keeps increasing,…. etc, etc.
Since you addressed the comment to me, I just naturally assumed you were talking to me. 😂
Dennis.
Have you every looked at the shaleprofile blog on a county by county basis for the Permian, Bakken and Eagle Ford? Interesting stuff to say the least, in my opinion, anyway.
I wish I had more time, this stuff is fascinating.
Four of the six Midland basin counties that produce the majority of the oil are just 30 miles by 30 miles square. If the entire county were broken down into 1,280 acre drilling units for two mile laterals, each would have 450 drilling units approximately.
Midland County already would have over 8 wells per 1,280 drilling unit. Maybe that’s why it is on a plateau?
The two larger counties are Upton and Reagan. SW Upton has very few shale wells. Reagan wells appear to be inferior.
Likewise, in the Delaware Basin, it appears Reeves and Loving might be slowing down. Eddy and Lea are really now the core of the Delaware (or the Double Premium, as EOG management would say).
Double Premium makes me want to drink some of my Jack Daniels single barrel. lol.
If you normalise each county’s production (so the area under the curves are the same and the peaks match) it looks like they all have very similar shapes so it might be expected than the few counties still growing will turn down soon. It would be interesting to GR and water cut on county basis but I can’t figure out how you do that in Shaleprofile anymore. I guess the original data is available through RRC but downloading from there is an absolute pain.
Shallow sand,
I tend to focus on the entire basin, note that in the Permian there are as many as 6 viable benches (or horizons) where wells can be completed, especially in the core counties, So for each county figure 450 times 6 times 4 wells per drilling unit or 10800 wells on 4 wells per section width spacing. Note also that some of the Delaware counties are far larger than those in the Midland basin.
Baissically there are likely about 30 million acres at minimum that could be developed at the end of 2017in the Pemian basin, at 275 acres per well that would be about 109 thousand wells, maybe 15 to 20 thousand wells have been completed since the end of 2017 leaving 90 thousand to be completed, this assumes high oil prices, there is a narrow window from now to 2030 where oil prices will be high.
Dennis.
Of course, this is the whole debate.
What data are you relying on regarding all of these benches being everywhere in the PB, besides company investor presentations?
Our field has multiple productive formations from 800’ to 4,100’. I can think of 11 different zones, and we presently operate wells producing from 7 of them.
Of course, of the 11 zones, only 1 is found on almost all of the acreage in our field, and it has produced well over 90% of cumulative oil, which is approaching 300 million barrels.
These pays each have their own distinct characteristics and issues. Some are susceptible to secondary recovery. Some aren’t. Some rapidly decline. Some have very difficult water issues. Some are more gassy.
I think you will find most fields of any size have multiple pays and there is little uniformity across all acres of the field.
Aren’t some of the benches in PB only found on some of the acreage? Aren’t some not as productive as others? Are you using geological data when you arrive at total locations?
You can get a good sense for just how very variable the distribution of various layers are by looking at the diagrams/maps in the EIA presentation on the Wolfcamp zone-
https://www.eia.gov/maps/pdf/Permian_Wolfcamp_Midland_EIA_reportII.pdf
Thanks Hickory.
I am sure there are maps like these for other formations and areas also.
Produced water is also getting to be a bigger deal. Looks like about 270k BWPD of the produced water disposal capacity could be shut in by TRRC.
Shallow sand,
I am mostly relying on the USGS assessments, but the paper I recently referenced at link below
https://www.mdpi.com/1996-1073/15/1/43/htm
That paper looks carefully at the geology and expects 55 thousand wells in the core areas and 100 thousand wells in non-core areas to be added to the wells completed by mid 2021 (roughly 30 thousand wells) for a total of 185 thousand wells.
My methodology prior to reaing that paper was to take the USGS mean estimate from the best benches with net acres (this adjusts for probability of a successful well) of about 30 million acres after 2017 left to be developed. I take the spacing suggested by LTO survivor (1320 feet between laterals) and average lateral length of 9000 feet (273 acres per well) divide 30 million by 273 and get about 110 thousand wells, the mean TRR estimate for those 30 million acres is about 45 Gb, add that to cumulative production and proved reserves at the end of 2017 (about 5 Gb) and I get a TRR of 50 Gb, similar to the paper’s estimate for core plus non-core of 52 Gb.
Since reading the paper I have adjusted my TRR lower based on this new research. The 110 well scenario yields about 40 Gb for TRR, but I have increased the number of wells to match the paper and assume faster decrease in new well EUR than my earlier estimates.
Shallow sand,
If you look at that paper by Patzek’s student from 2022, make sure to re-read carefully page 14 of the PDF. The $35/b breakeven for core areas assumes $4/MCF for natural gas, and the core areas breaking even at any natural gas price is based on an assumed oil price of $60/b.
Somehow you got the impression (based on previous comments) that they claimed $35/b and andy natural gas price for break even. If you read carefully you may agree that you misunderstood on a first skim through.
USGS Permian assessments are at link below
https://www.usgs.gov/centers/central-energy-resources-science-center/science/permian-basin-oil-and-gas-assessments
It was some decent work by Patzek though. He started off back when he was lead ASPO joke maker doing the usual silly bell shaped curve routine, but moved it into a far better technical realm than the likes of Art ever did, or Engelder. Geologists both though, so the more technical aspects can’t be considered their forte. Anyone who doesn’t take into account a range of price futures nowadays is just behind the 8-ball of this thing bigtime.
Reservegrowthrulz,
Patzek has a PhD in Chemical Engineering, a lot of his research focuses on geophysics and petroleum engineering.
There is a significant difference in training between geology and geophysics.
Shallow sand,
The various benches are not assumed to be everywhere. The best benches are Wolfcamp A and B in both Delaware and Midland basins, the lower spraberry bench in midland basin and the the second and third bone spring benches in the delaware basin. All together those benches have net acres of over 33 million acres. Net net acres take mean estimate of potential productive acres and multiply by the mean estimate of probability of a successful well. For most of these benches the mean estimate of probability of success is about 95%. If we assume the average well is about 273 acres, then about 121 thousand wells could be completed. For midland wolfcamp this would be 27 thousand wells after Dec 2016. For midland spraberry this would be 13.7 thousand wells completed fter Dec 2017. For the Delaware wolfcamp and bonespring this would be 81.5 thousand wells completed after Dec 2018, so roughly two thirds of total wells completed after Dec 2016 would be Delaware basin wells according to this analysis. To arrive at TRR I take an estimate of 400 kbo per well and multiply by 122 thousand wells and get about 48.8 Gb.
The breakdown in TRR is 10.8 Gb for Midland wolfcamp after Dec 2016, 5.5 Gb TRR for Spraberry after Dec 2017, and 32.6 Gb TRR for Delaware Wolfcamp and Bonespring formations. About 67% of total Permian TRR after Dec 2016 will be from Delaware basin, based on conservative estimates of TRR. Note that my 49 Gb Permian UTRR estimate is only about 67% of the USGS mean TRR estimate.
Shallow sand,
The following PDF has details for various benches of Delaware sub-basin of Permian.
file:///tmp/mozilla_d0/5044DelawareBasinInputForms.pdf
I read all of the back and forth about peak oil and all I know is that the world/wall street/ Greta Thunberg all out attack on the fossil fuel industry for the past 7 years has finally won by eliminating capital from replacing reserves and the chickens will come home to roost. Playing catch up in a mature industry is not possible without outrageous amounts of capital being spent.
On a different note. I have just finished completing two horizontal sand (not shale )wells and while there are plenty of water trucks lined up available to haul the recovered frack water to a disposal nearby, there are ZERO ( that’s 0) available drivers to pick up our water so that we now have to shut the wells in temporarily. Where did all of the work force go? It’s unbelievable. These are high paying truck driver jobs and no one available to fill them.
“all I know is that the world/wall street/ Greta Thunberg all out attack on the fossil fuel industry for the past 7 years has finally won by eliminating capital from replacing reserves ”
To the contrary- If there is a good energy investment there is trillions of dollars looking to book it, whether its nucs, or oil, or wind, etc.
Blaming “Greta’ for poor economic performance (return on investment), and well depletion, and high cost of developing residual resource is weak.
Poor performance will sour the taste for people seeking a solid investment.
“Since 2015, industry analysts Haynes and Boone have listed nearly 800 exploration and production, oilfield services and midstream oil and gas companies that have filed for bankruptcy, with a debt load of more than $300 billion. ”
“Since 2010, the stock values of the four largest oil and gas firms have plummeted by more than half.”
“The companies at the center of the U.S. fracking boom have fared worse than most other segments of the industry, consistently spending more on drilling and production than they generated by selling oil and gas. ”
“According to The Wall Street Journal, large publicly traded oil and gas producers spent $1.18 trillion on drilling and pumping oil over the past decade, largely on fracking, while bringing in only $819 billion. To stay afloat, many oil and gas companies took on substantial debt, setting the stage for subsequent bankruptcy filings and debt write-downs.”
““Living Beyond Their Means: Cash Flows of Five Oil Majors Can’t Cover Dividends, Buybacks.”
https://www.ewg.org/news-insights/news/oil-and-gas-industry-decline
But clearly the economics are improving, even if the geology and labor conditions are not.
I think you can’t borrow money for tight oil wells because they don’t make financial sense. I can only imagine if I were selling solar panels that depleted 40% every year and were useless after five years what all you oil folks would say. But yet, there’s your typical shale well. Instead the PV panels being installed today will still be close to 90% efficient after 25 years, long after most of us old farts commenting here and dead and buried. How much tight oil will be coming out of those tens of thousands of shale wells in 25 years? My guess: zero. The fact is that investing in shale oil is a colossal waste of resources and we should instead be installing PV everywhere. But I’ll let Greta know you’re pissed at her I’m sure she’ll be really upset lol.
I guess maybe thinking about this too much today between doing laundry, paying bills, watching some NFL and trying to stay warm.
But pulled up shaleprofile and limited US to EFS, Bakken, Permian, OK, WY and CO.
Prior to COVID, completing about 10.5K wells per year. I’d assume one well per 100 acres (that would be 12 in a two mile lateral unit, which to me is probably too many).
Anyway, at that rate chewing up 1.05 million acres per year, before we get into how many benches. 2020 and 2021 that has backed off to 6,000+ completions per year in those plays.
Midland County has less than 600k acres. So, pre Covid, US shale was chewing through about two Midland counties per year. Now they are down to chewing up just a little over one Midland County per year.
Just fascinating stuff. If it wasn’t for shaleprofile we couldn’t visualize all of this.
so how many Midland County ‘s are left ?
Forbin
There are ten counties in TX and NM producing 94% of Permian Basin oil. Four are the size of Midland County (including Midland County). The other six are larger, but not all acreage in these four appear to be productive.
As Enno Peters pointed out in his most recent blog post, only three are significantly growing at present. Lea and Eddy in NM, and Martin in TX.
The other counties are Reeves, Loving, Midland, Howard, Glasscock, Reagan and Upton, all in TX.
Over 1/3 of the rigs are currently running in Lea and Eddy.
I would note Andrew’s, Scurry and Fisher have recently grown a lot, but from a very small base. Two of these counties also already have tens of thousands of conventional well bores.
Mike S on the ten counties .
https://www.oilystuffblog.com/single-post/ten-counties?postId=94afb6d2-d814-435e-b02b-ef106f0ae3d2
An amazing comment by “Anne” left at the article:
Wonder how many know that at best this light crude is trade bait to bring in the heavy oil we actually run?
Part 2 of the counties and benches from Mike S . Knowledge is power .
https://www.oilystuffblog.com/single-post/top-ten-counties-top-four-benches-part-two?postId=2c522646-a1b2-435d-b199-b84561547329
Shallow sand,
I think one well per 300 acres might be a better figure, so 3 million acres per year. Note though that on average there might be 3 benches per acre so as far as land area your 1 million acres per year at a 10 thousand well per year completion rate and 3 benches per acre would be about right.
Oh dear!
Great graphic!
Tells us a lot about DUC’s
The world’s oil stockpile is nowhere to be found
https://indexedworldnews.com/2022/01/24/the-worlds-oil-stockpile-is-nowhere-to-be-found/
Where did all the oil go? According to the latest estimates, the world should still be awash in oil stockpiles built up during the pandemic. But that’s not what the actual data on oil supplies show.
OPEC’s Shrinking Capacity Could Send Oil Above $100
The oil market is quickly realizing that many OPEC producers may not have the capacity to boost output much further.
OPEC+ has been undershooting its collective production targets for months and will likely continue to do so in the months ahead.
Low spare production capacity could leave the world without a buffer to offset sudden supply disruptions, which are always lurking in the global oil market.
As the OPEC+ group unwinds its production cuts, the oil market has realized that not only do many producers in the pact lack the capacity to boost output further, but those who can pump more are reducing the global spare production capacity, thus exposing market balances to unexpected supply disruptions, and oil prices to further spikes. Most of the world’s global spare capacity is currently held by OPEC’s Middle Eastern members Saudi Arabia and the United Arab Emirates (UAE). Those two producers have the potential to raise their output as OPEC+ continues to unwind the cuts, but they are doing so at the expense of declining spare capacity.
Low spare production capacity could set the stage for a prolonged oil price rally because the world would have a lower buffer to offset sudden supply disruptions, which are always lurking in the global oil market.
The unrest in Kazakhstan and the blockade in Libya in the past month highlighted the challenge that the oil market will be facing if spare capacity continues to shrink. And shrink it will—that is, if OPEC+ continues to add 400,000 barrels per day (bpd) to its production quota every month until it unwinds all the cuts.
SNIP
Sure, the United States, Canada, and Brazil—all of which are outside OPEC+ pacts—are expected to raise their oil production this year as high prices and growing demand incentivize more activity and drilling. In the U.S. shale patch, however, capital discipline continues to be a key theme, so annual production increases are not expected to be anywhere near the 2018-2019 surge in output.
“In the U.S. shale patch, however, capital discipline continues to be a key theme, so annual production increases are not expected to be anywhere near the 2018-2019 surge in output.”
‘Capital discipline’ as a key theme in the shale patch…wow what a concept.
So, production of the permian basin oil shouldn’t happen all at once in a boom and bust fashion?
That concept would have been useful to apply back starting about 8 years ago.
What gives? Good question.
Oil prices are up but the taps aren’t flowing like they should be
The price of oil is at a seven-year high, above $88 dollars per barrel. Demand is rising and may surpass pre-pandemic levels by the end of 2022, the International Energy Agency forecast last week, as the global economy seems not to have been stalled by omicron. And yet, many top oil-producing countries are falling short of their quotas. What gives?
Several posts ago I had called out the myth ” oil on the sidelines ” waiting for higher prices . My analogy was cash waiting ” on the sidelines” which will enter the stock market if the market does ” this ” or if it does “that ” . There is no oil waiting for higher prices . You cannot extract what does not exist . If not now , then when ? Or maybe ” If not now, then never ” . Choose one .
Hole in head,
There are no sidelines in the oil industry. I imagine the oil proscould comment on how things change when the oil price is $50/bo vs when it is $100/bo. My impression based on past comments is that all else being equal (ceteris paribus) higher oil prices tends to lead to higher profits than lower oil prices. This intern affects investment decisions and how much capital is employed.
I will leave it to others to correct this.
Projects take time to get ramped up, the activity doesn’t just change on a dime.
These aren’t easy things to get done.
Sustained prices over consecutive years is what we should expected to move the needle on production
(assuming supply chains and labor conditions and interest rates are favorable).
This isn’t a pop-up store or day trading or choosing a prom date.
Sustained prices over consecutive years is what we should expected to move the needle on production.
World oil production dropped by over 11 million barrels per day in May 2020. It was up by almost 2 million bp/d in November 2020, down by over 2 million bp/d in February 2021 and up by almost 2 million bp/d in March.
And if you look back over the past decade you will see several months with movements of over 1 million bp/d. No, It does not take years to ramp up production due to prices. In years, the price could easily double or halve. Prices have been up long enough now for production to be ramping up significantly.
Of course, finding and developing new resources does take years. So don’t look for much help there for a long, long, time. The article below came out on December 28th, 2021.
Oil and gas discoveries are at the lowest level since 1946
Oil and gas firms are having their worst year for new fossil fuel discoveries in decades and reserves are dwindling. The oil and gas industry is on track to discover just 4.7 billion barrels of oil equivalent (boe) by the end of 2021, its worst performance in 75 years, according to the research firm Rystad Energy.
Ron,
I was commenting on the statement made above-
“There is no oil waiting for higher prices . You cannot extract what does not exist .”
And the point I was making is restated well by you-
finding and developing new resources take years
Hickory,
Lots of resources have already been found that are not developed, so any discoveries just add to the pipeline of undeveloped resources. Much of this is simply a matter of developing discovered resources when oil prices reach a level where it is profitable to do so. Some projects are all set to go and waiting on final investment decision (FID), when oil prices reach $100/b the rate that oil resources are developed may increase.
Hickory, thanks for the explanation. Glad we agree on this. I must add however that finding new resources has become extremely difficult. Hole in Head says, “You cannot extract what does not exist “. Well, must we assume that we can find what does not exist? Oh, I am sure there is undiscovered oil out there but not nearly as much of it as there used to be. It is getting harder and harder to find as well as costing a lot more money to look for it. There has to be a reason that discoveries are the lowest in 75 years. A damn good reason!
Dennis wrote: Lots of resources have already been found that are not developed,..
Really now? Just how much oil resources exist that have not been developed? Where can I find information on the world’s discovered but undeveloped resources? I am not doubting your word Dennis, but this is some information that I would dearly love to have.
Ron,
I do not have that data, but we do have that data for reserves in the US, in the rest of the World the proportion of resources that are undeveloped is likely much higher than the US. Actually we only have an indication from the US of non-producing proved reserves which were 10.6 Gb on Dec 31, 2020. Proved reserves at the end of 2020 were 35.8 Gb, and typically 2P reserves are about 1.7 times proved so 2P reserves of 60.9 Gb.
So we have 35.8 minus 10.6 which is 25.2 Gb of producing reserves and 60.9 minus 25.2 which is 35.7 Gb of non-producing 2P reserves about 58.6% of the 2P reserve total.
In 2011 the World 2P reserves were about equal to BP reported total proved reserves of crude oil for the World. If this remains the case in 2020 (I don’t have that data) and 232 Gb of reported oil reserves by BP are NGL this would suggest World 2P reserves might be about 1500 Gb at the end of 2020. If the World has a ratio of producing reserves to 2P reserves similar to the US (I expect the ratio for the rest of the World would be considerably lower than the US) there would be 879 GB of non-producing 2P reserves for the World, that estimate is quite conservative.
If we eliminate oil sands and Orinoco belt reserves and stick with the 230 Gb NGL estimate, we would have 1077 Gb of conventional 2P reserves for the World and 631Gb of nonproducing 2P reserves. For my oil shock model the estimate is a bit lower at roughly 616 Gb (the methodology is different) of non-producing conventional 2P oil reserves at the end of 2020 (assuming World 2P conventional C plus C reserves are 1077 GB at the end of 2020), producing conventional reserves are 460 Gb at the end of 2020 for my recent oil shock model.
Ron,
Capacity can increase, but it does take time, I agree. Tight oil can ramp up pretty quickly as occurred in the 2017 and 2018, but that is up to oil producers to ramp up output, they may choose to wait for higher oil prices. Tight oil output has been increasing, but not at the rate of 2017 and 2018. Other projects in deep water take considerably more time, not sure about oil sands, Ovi has a better handle on that.
I don’t understand the definition of “discovered but undeveloped resources”. The oil sands for example have both been discovered and are being developed, but at the current rate of extraction, it’ll take 100 years to extract all of it. Does “developed” mean that you have to extract everything that you’re discovered all at once?
Frugal,
I mistakenly said developed and should have said producing resources. In BP stats they have 19 Gb of Canadian oil sands reserves under active development out of 161 Gb of proved reserves. So this is an obvious example of 142 Gb of undeveloped resources, I imagine the number is much higher for Orinoco belt.
You cannot extract what does not exist .
This certainly applies to OPEC’s paper barrels. I can say with confidence that not a single paper barrel will be extracted, regardless how high oil prices go.
Frugal – In reply to your question about “discovered but undeveloped”
Most conventional developments, especially offshore developments, go through this phase. An offshore discovery is made and, usually, the operator will then assess whether he thinks he has enough to justify the development costs. Depending on the size of the project, he may appraise the project with a 2nd well. Then, after, hopefully, a successful appraisal well, he may make the Final Investment Decision to commit to fully develop the resources. Then, he goes ahead and starts building facilities, drilling development wells, and getting the project primed for “first oil”
So, to me, the term “discovered but undeveloped” refers to this time period between the initial discovery and first oil.
Thanks Bob,
Crystal clear and much better than I could have explained. Thanks.
Hickory,
Correct, but higher oil prices will move the needle, take a look at the US tight oil output in 2017 and 2018, today things are different and tight oil output is responding far more slowly to the increase in oil prices, perhaps due to supply chain and labor issues. Chart below compares tight oil output and prices in these two periods. The 2016 to 2018 period is Sept 2016 to October 2018 and the 2020-2021 period is May 2020 to Dec 2021.
Thanks Dennis.
If the pandemic peters out I suspect the recent trend will change to the upside- funding and production
Hickory,
Perhaps, but we are fast approaching the point where new wells will have lower EUR than past wells so profit per well will be lower for similar well cost and oil price and output will rise less quickly. I agree the slope may increase (output increase per dollar oil price increase), but doubt it will ever return to the 2016 to 2018 slope.
I expect with higher prices we will see an increase in the rate that tight oil wells are completed.
US PMI or private sector growth went from 57.0 in December to 50.8 in January. No stimulus? A reading under 50 is in contraction.
We will be in contraction by March and FED will have to hike rates during a contraction? Disaster ahead.
Oil was slammed on the news. WTI at $82.50
If you can’t afford it ,you can’t have it . 10 days industrial shutdown ordered . No electricity .
https://www.dailysabah.com/business/energy/turkish-industry-warns-of-production-hit-as-iran-shuts-gas-flow
Permian basin scenarios with high oil prices. Note that a low completion rate scenario, such as the 400 well per month maximum completion rate scenario would require oil prices to remain over $90/b until 2038 in order for enough wells to be completed to reach 41 Gb. If oil prices start to decrease by 2032 which is my expectation, a lot of Permian tight oil will never be profitable to produce, in that case the 400 max well completion scenario changes to only 88 thousand wells (from 118 thousand shown here) and ERR falls to 31 Gb.
Bottom line there is a narrow window of profitability for Permian producers, if they maintain too high a level of “capital discipline” 10 billion barrels of tight oil will get left in the ground.
European Dutch TTF Natgas Price Back up 18% Today
Seems as if the LNG Flotilla was a BIG DUD. European Natgas Storage continues to Fall like a rock, now down to 42% Storage and we still have 2 months and a week left worth of large net withdrawals.
Add to the mix that France had to shut down several Nuclear Power Plants due to technical issues and has become a NET IMPORTER of Electricity.
Seems as if the Energy Crisis is wreaking Havoc across Europe and this is just the First Inning of the ENERGY CLIFF GAME.
Steve
Oil Dips On Rising Dollar Despite Mountain Of Bullish News
Despite several bullish factors, oil prices erased earlier gains to drop on Monday morning due to a strengthening U.S. dollar.
There was also a general stock market correction this morning that later reversed itself.
Oil dipped on risk off beginning of the day. But the corporate stock buyback window which was closed the last 3 weeks is open again now.
Dow was 1,100 points down today and still finished in the green. Which is risk on. Corporate USA doesn’t look at charts. They don’t care what’s going on in the world. They don’t analyze the monetary plumbing. They just buy.
When you understand that the money is coming from pension funds. Not the FED. Never has been the FED. What is going on makes a little more sense. And why just because FED is tightening doesn’t equal lower price assets or commodities. They’d have to tighten a lot to actually bring prices down using monetary policy.
The dip in oil price got bid as well.
Inflation may or may not ease up. But growth is likely to come in a lot softer than they are predicting. Just as it did today with the PMI falling from 57.0 in December to 50.8 in January.
Markets view bad data as a good thing and enough bad data equals not so much FED tightening going to happen.
I figure at best they will get one or two rate hikes in and the data due to lack of fiscal and monetary stimulus will be bad enough to warrant rate cuts.
It will be shortest tightening cycle we’ve ever seen. Unless some fiscal stimulus shows up. And right now more fiscal stimulus is along ways off.
Just from a technical standpoint the BOJ (Bank of Japan) will likely step in soon and buy a massive amount of Japanese stocks otherwise they risk technical breakdown of chart.
Which would further juice markets and prices. Just a risk on move even if the move is 100% financial engineering it can keep oil prices from correcting lower on bad economic news.
The crazy swings are mostly generated on the option and future markets.
Banks must hedge options by going long or short in the underlying value – this can have explosive results.
A short sqeeze is easy to generate but doesn’t hold long. 4% up in 2 hours is a short sqeeze ‘ the work of buybacks is more visible on the long scale .
Frugal/Eulenspiegel/HHH
I don’t understand much of the conversation you three have. However I get the impression that the price of oil is determined by the $US and financial markets and has nothing to do with geology and supply/demand of oil. Is my impression correct or wrong?
Oil prices aren’t merely just supply and demand.
Understand oil prices are bid not set . And in order to bid there has to be the credit or liquidity to bid. In a risk on market liquidity is flowing. In a risk off market credit to bid oil falls just like credit to bid stocks fall.
What is good for stock in general is good for oil.
But in today’s world financial markets are financially engineered higher.
Take Saudi oil completely off market but also restrict credit and price of oil goes nowhere.
What is good for stock in general is good for oil.
HHH, that is simply not correct. Equities and commodities are worlds apart, hardly related at all. Equities can be bid up without regard to the supply of the equity. Commodities are different animal altogether. There is always a finite supply of any commodity. If the price gets bid too high then holders of that physical commodity will start to dump their inventory, bringing the price down. And vice versa, if the price gets too low, consumers of that commodity will immediately start to buy up the cheap stuff, pushing the price down.
No, the price of any finite commodity will always, in the long run, be tied to supply and demand. Of course, market emotions or rumors can swing the price of oil or whatever. But they cannot permanently move the price, it will always swing back to what the supply and demand.
I use the example of a water skier being pulled by a boat. The boat sets the path but the skier can swing wide to either side of the boat. The path of the boat is supply and demand and the wide swings are rumors and market emotion.
Commodities can’t be bid up without liquidity regardless if there is a shortage or not. People tend to bid up what is in short supply but if the cash or liquidity just isn’t there to bid price it doesn’t matter.
Liquidity got shut off in 2008 prices tanked well before shale oil came along adding supply.
Is the correlation 100% No it’s not. When supply was over abundant. Stocks went up and oil down. But in tight supply that liquidity to bid price has to be there or prices don’t go where people think they are going.
Right now I think the correlation is pretty high. Oil needs stocks that aren’t crashing to get to $100
You are assuming that the commodities futures market is the price setter. The futures market sells, and buys, paper barrels to be exchanged in the future, not now. And over 99 out of every 100 paper barrels are settled in cash, not the physical commodity.
It has a lot to do with it but most oil is sold producer to the consumer via the spot market. When you talk about liquidity you are speaking of the futures market for paper barrels. Far more paper barrels are traded than barrels of the physical product that actually exists. If every futures market shut down tomorrow, there would be zero liquidity in the future market. That would have little effect on the price of oil. It would be a burden on hedgers, they could not ply their trade at all. But oil would still be bought and sold on the spot market.
Supply and demand, and credit / liquidity.
Heavy oversupply is clear – no matter how much credit, prices will fall even in a stock rally enviroment.
Something in between – production and supply meet – here the speculants are very important. They can buy parts out of the market to make an artificial rally, or are forced to sell. Prices trend to be higher when there is much credit:
Undersupply: Prices can go only that high as there is credit. People without money can park their car or get horse + cart.
The same with increasing production: This is only possible if there is credit. Oil exploration is expensive, building infrastructure for new fields even more.
So it’s not just geology and existing technology, but additional money. And political circumstances – that part our discussion left out. But most times when the politic is unstable, money is scare, too.
Eulenspiegel, whether you realize it or not, you are clearly talking about supply and demand.
It’s not that primitive.
For example there are other shale basins world wide.
They will never be developed because they are not in Texas 😉 – there is not enough credit.
Here every barrel of oil reserve is counted, and every rig.
But you need the availability of money to see the development – it’s one of the parameters.
Or speculants – they can dash around prices so crazy that conservative investors lile shale to decide NOT to drill a new well. Only as an example. Money matters.
Ovi —
My opinion of oil prices is that there is a wide gap between the cost of producing oil and the amount of money customers are willing to pay for it, making it a high margin business. For example, oil got above $120 a barrel some years ago, and that dented demand a little but not that much. On the other hand, if I’m not mistaken, there are producers out there whose costs are under $30.
As a result, there is a lot of “play” in the market. The laws of supply and demand say that supply and demand will determine the price “in the long run”. Markets are said to “clear” in the long run.
But the theory doesn’t say when that will happen. Look at any theoretical demand curve diagram and you will notice that there is no time axis. And as Keynes put it, in the long run we’ll all be dead. So it is reasonable to look for other reasons to explain short term changes in prices.
Keynes used this argument to explain unemployment. According to market theory, long term unemployment is impossible, because if labor supply outstrips demand, wages should fall and employers should start hiring again. But anyone can observe that the theory is false, because unemployment does happen. Keynes explained that labor costs are “sticky”, meaning it takes a long time for markts to clear. That means the prices are stuck at the “wrong” level and there are “short term” (whatever that means!) disparities between supply and demand.
Oil prices are not sticky, but supply and demand are. If I buy a gas guzzler and move to a suburb far from my workplace, I’m stuck with that situation for years. My demand is stuck. And oil fields can’t be ramped up and down overnight either. Combine that with the gap between what consumers are willing to pay in a pinch and what suppliers are willing to sell for in a pinch and it’s easy to see where the play comes from, especially if both sides are running on debt.
However, I think the role of the dollar tends to be exaggerated in these discussions. I think the herd psychology of traders is the key factor.
Alimbiquated,
This “stickiness” of labor markets is unique to labor markets in Keynesian theory, it does not apply to commodity markets. Clearly there can be excess supply in the short term, there is not a good method for producers to predict future market demand and supply and especially for products requiring long lead times such as deep water offshore, arctic, or oil sands oil output, gluts will occur and oil prices will then adjust. Likewise, there will be periods of low investment and tight supply where oil prices will rise above the long term trend (as in the 2011-2014 period and I predict the 2023 to 2027 period, where real oil prices will be $110/b /-$20/b in 2020 US$ for Brent oil price).
The stickiness in labor markets applies to prices. Commodity prices are notoriously volatile, so I wasn’t claiming the prices were sticky like labor prices. So we agree there.
The point I was making is fact was just the opposite — that oil prices change much more quickly than supply and demand change, so short term fluctuations aren’t much of an indicator of supply and demand. The signal function of oil prices may work “in the long term” but current bellyaching about high oil prices makes about as much sense as the hyperventilation about $-38 did.
Hess announced a 75% increase in CAPEX in the Bakken to $790 million for 2022. Intends to run 3 rigs, targeting a production increase of 20k BOEPD. Not sure what the GOR is there.
$40k per BOEPD seems expensive, but that depends greatly on GOR.
Well, here we go. WTI at $80 for a couple months and we lose our “discipline”.
Shallow,
Hess may be a bit of an anomaly in the Bakken due to its commitments to its Tioga Gas Plant, the largest in the Bakken. With Natgas prices high and likely even higher, Hess can process 400,000 mcf/d there.
https://hessmidstream.gcs-web.com/operations/processing-storage
steve
Occidental CEO says the United States will never again breach its all-time record high oil production level. ConocoPhillips CEO says it will.
U.S. oil CEOs offer opposing views on crude output growth
HOUSTON, Jan 24 (Reuters) – The chiefs of major U.S. oil companies Occidental Petroleum Corp and ConocoPhillips (COP.N) offered differing outlooks on the growth of U.S. oil output at a conference on Monday, as the industry rebounds from shutdowns during the first stage of the coronavirus pandemic.
Oil prices have surged to seven-year highs in the last several weeks, with international benchmark Brent crude hitting nearly $90 per barrel, bolstered by tight worldwide supply and resurgent global demand.
ConocoPhillips Chief Executive Officer Ryan Lance told an audience at the Argus Americas Crude Summit in Houston that he was bullish about markets as high oil prices “will persist for a while.”
“What we’re seeing is a call right now that there’s more supply needed. That’s why prices are where they are today,” he said, adding that he expects U.S. output to grow by about 800,000 barrels per day (bpd) this year. Output is likely to eventually eclipse the record 13 million bpd reached in late 2019, he said.
Occidental Chief Executive Officer Vicki Hollub was more measured in her forecast, saying the United States would likely surpass 12 million bpd at some point – but fall short of that all-time record.
From Arab News: Oil production capacity will become a market feature in late 2022
If one assesses the past two decades of global oil demand growth versus non-OPEC supply growth, the net result was increased demand for OPEC oil and a related whittling down of its spare output capacity. Looking out over the medium term, we forecast global oil demand to fully recover as coronavirus disease (COVID-19) morphs from pandemic to endemic. Non-OPEC supply, on the other hand, will not see a commensurate rebound.
We are well aware our forecast is out of consensus, but note that our view is not borne of an underlying bullish bias but rather an assessment of data that portends bullish pressures. Global capital budgets for oil production have been slashed by over $2.2 trillion since 2014’s high watermark, and challenges to grow oil production are going to be exacerbated by strong and evident anti-carbon lobbying.
RON,
I believe this is true. And, what will make the Oil and Natgas prices so much more volatile?? This is when the global energy storage inventories continue to trend lower over time. Can you imagine if Europe Natgas storage falls to such a low this spring that it will start with an even lower storage level during the winter of 2022-2023?
When a lot of the Energy Storage-Buffer is gone, we are going to see PRICE VOLATILITY or PRICE CONTROLS like we have never before.
steve
Demand up but exports are down.
Russia Cuts Key Oil Flows Just as Demand Looks Set to Jump
Russia’s exports of its main grade of crude oil will slump to a five-month low in February, underscoring the challenges the country faces bringing supply to the global market at a time when there’s optimism over a demand recovery.
The world’s second-largest oil exporter will ship 1.31 million barrels a day of its flagship Urals crude from the nation’s Baltic seaports next month. That’s the smallest flow since September. Much of that crude ends up at refineries in northwest Europe.
The number of wells are up but production is down.
Russia Struggles to Lift Oil Output Despite Wells at 5-Year High
Russia’s operating oil wells reached the highest since OPEC and its allies joined forces, yet bringing back production curtailed under the current deal remains elusive.
Last month, Russia pumped oil from more than 155,600 wells, according to Bloomberg calculations based on data from the Energy Ministry’s CDU-TEK unit. That’s the country’s highest number of active ones on a monthly basis since at least 2017, when Moscow partnered with the Organization of Petroleum Exporting Countries in coordinating output curbs to rebalance the market.
Yet despite this surge in December, Russia’s crude output that month dropped below its monthly OPEC+ quota for the first time since the alliance enforced record coordinated cuts.
This must mean that natural decline is overwhelming new drilling.
Yes, I think that is what it means. And it means there will be no plateau.
The begining of the end.
Frugal,
It is just a matter of increasing the number of new wells completed. Older wells will tend to produce less so it is expected that average output per produing well will tend to decrease. Focusing on the number of producing wells is silly, it would be unexpected if for the same number of producing wells at some later time the output was the same as earlier, it always takes a higher number of producing wells in a mature basin to increase output.
As I recall, I read a prediction in 2015 that Russian output would start to fall by the end of 2016. We will see how soon Russian output declines from a plateau at about 11 Mb/d which will be reached probably in Jan or February 2022, my expectation is 2027 /-1 year.
… it always takes a higher number of producing wells in a mature basin to increase output.
Yes because natural decline causes the average well production to drop — aka the Red Queen effect.
Frugal,
Yes so any expectation that output is correlated with the number of producing wells in a linear fashion will be incorrect, this has always been true.
Is the FED going to crush the dip buyers tomorrow? Oil with likely have a large day down if the FED remains uber hawkish
I could see stocks close 1500 points lower on the day tomorrow and oil down 5-6 dollars or more. Could also see stocks up 500-600 points and oil adding another dollar or two to price. If FED blinks.
I’m currently in the camp that the only way inflation comes under control is a market crash. I don’t believe they can get oil to head down without a market crash. They don’t have the tools.
And every time there is a FED meeting or announcement if they aren’t Uber hawkish. Oil has no reason not to go higher. If they blink now oil takes off and their inflation problem becomes a lot worse than it already is.
… and if they crash the markets, they’ll produce the mother of all market crashs. It’s not just stocks, they’ll crash anything. Imagine the real estate industry going down to 0 new build homes. Imagine the 20% zombi companies going insolvent. And all the stock based retirement plans vaporized – and then consumption will cave again.
Only thing to solve this – print more money and make even bigger “build back better” packages.
The road to kick the can runs out – how can the FED make a 180 degree turn to get more road?
The margin debt is still very high – there is more margin debt now than there has been junk real estate debt in 2007. And real estate is on historic high, too – there should be a lot of underwater debt when prices start to slide.
And an “all crash” will create a deflationary meltdown, removing lot of the debt in a big crater of insolvencies. The ice of deflation or the fire of inflation – chose your poison.
At least the south european countries could live with a high inflation.
Yeah the have choice to make. I don’t see any middle ground here where they can have their cake and eat it too.
They either fight inflation or they don’t. And if they don’t oil will be at $120 within a year. And while stocks will continue higher during this time. $120 oil will crash global economy.
You have to start looking outside US. What does $120+ oil do to China’s economy? What will global GDP look like with $120+ oil?
And a forced crash will hurt the economy now – since it will spread at least into Europe at the same day. It will have an impact like the first corona lockdown – or harder. Without help, big banks will get insolvent. Think Lehman on stereoids.
So – some long inflation agony, or bombshells now.
My 5 cents are still: They try to fight inflation until things really start to crash. Then they will revert 180 degrees and take the inflation way.
And yes, there isn’t middle ground anymore.
The deflation way will be even more interesting to oil prices: Oil price will crash and credit will be very tight, and oil prices crash. So finally good bye to US shale, and good bye to all the starting deep sea oil production. And state owned oil companies will fight with their budget ministers for the last investing $ – military or drilling. Military will win, since needed for external security and regime stability.
And since in a deflationary enviroment there is no money for green energy and electric trains and cars, demand will stay. With the first glimpse of new credit we’ll at least hit the old oil all time high.
I think the inflation way is the less painful: I’ve already lived with inflation, you can handle that somehow. At some point the tech stocks will crash, too, since long bonds get more interesting.
I don’t know but remember midterm elections are in November. They don’t bite the bullet today WTI will be at $90 by end of week or next week. A lot of political pressure mounting.
Oil will be at or over $100 within 2-3 months and by midterm elections we at $120 or above. Should we expect shale oil boom to come and knock prices down? I don’t.
Incumbent politicians will be leaving in masses come November if they don’t act now to handle inflation. Tough choice.
HHH , time to hit the “sleep” button in Europe . Hope to see what you have to say about the FED decision when I wake up .
Market was hoping the FED would change some of the language. That didn’t happen.
There was nothing new. No surprise hawkishness or dovishness.
Basically the way I interpreted it was . You less than two months. If inflation doesn’t correct itself on its own by March. Not only is QE ending but rate hikes and balance sheet reduction are going to happen.
Market wanted at least some of that walked back. Particularly the balance sheet reduction part.
If your an investor and between now and say March 15th if you no signs of let up in inflation data you have to take money off the table before everyone else does.
I’d also add that the FED is very good at expectations policy. If everyone is expecting what they are saying they are going to do.
People start withdrawing money from markets and prices might just come down. We will see.
HHH,
You forget that higher oil prices are likely to result in higher oil supply which will tend to reduce the price of oil. The World economy was fine with oil at $110/b from 2011 to 2014, currently World real GDP is quite a bit higher so the World could probably handle oil at $130/bo, I doubt it gets there because supply will be too high relative to demand, probably the limit is $115/bo for any 12 month average oil price befor a supply glut pushes oil prices lower.
Dennis,
You wrote:
The World economy was fine with oil at $110/b from 2011 to 2014, currently World real GDP is quite a bit higher so the World could probably handle oil at $130/bo,
The world(economy) is more than real GDP of course. Things change fast nowadays, and 8-10 years have passed since 2011-2014. Some scenarios that HHH and Eulenspiegel described today are not unimaginable and could be disastrous for years to come.
Not to mention the increasingly bad consequences of a runaway climate change.
Net effect so far from yesterday FED news is a stronger dollar. Dollar is up against all major currencies including Chinese yuan. Which here lately has also been a strong currency due to it’s peg to the dollar.
So you have a Eurodollar market that is 3-4 times as large as the onshore US dollar market and you have a dollar that is appreciating in value due to FED policy.
It’s a recipe for disaster for dollar credit outside US. And maybe that is where we should be looking.
There has been a lot of new dollars borrowed since the beginning of the pandemic. Just that two years of credit creation alone can’t handle a move in interest rates. And if you borrowed dollars via Eurodollar market as dollar continues to appreciate. Your financial gain from borrowing cheap dollar credit and investing outside US start to shrink. Dollar moves high enough and your underwater in your trade and eventually you face margin call.
Han,
I agree things change over time, this has always been true and my guess is that it always will be, rate of change can vary in unexpected ways. I also agree World real GDP is but one measure, but it is one that is tracked closely, there are other important measures such as income distribution, but those measures are not tracked as well at the World level.
I picked this comment from another blog . ESG is going nuts . Should the title be ” How to commit hara kiri ” ?
“It does not end there. Mini despots are emerging from the cohort of pension fund managers.
The Sunday Times has just reported that Aviva Investor’s chief executive says that Aviva will hold the boards of companies and individual directors, in which Aviva are investing, accountable to commitments on climate change ( and bio diversity and human rights) if the pace of change does not reflect the urgency required.
Aviva will vote against the election of such directors who do not comply.
Further, Aviva wants those companies in which Aviva is investing to commit to reaching net zero targets and wants to see their progress in achieving them.
Virtue signalling run amock. “
This shows Permian drilling by the top counties, they are ordered by the number of rigs added in the last six months. Lea added most but Eddy dropped the most. Howard added a few but the others were flat or slighly down. The other smaller counties added (not shown) added the most – about three times as many as Lea so maybe there are some hotspos elsewhere but I don’t see that in the production figures yet.
The real test of Permian production will be the first half of this year – when finally the DUCs run out and companies return to fracking what they drilled recently.
Then supply chain problems with drilling equip, tubes etc. (Mike and LTO will know more about this) can really bite.
No industry can ramp up production by 50% in a year – not without being financed time before.
Eulenspiegel,
Who is claiming a 50% increase in output in a year? Not me.
For my most optimistic Permian scenario output increases by at most by 16% per year in 2023/2024. The maximum annual increase in well completion rate in the Permian in my optimistic scenario (maximum completion rate of 800 new wells per month) is 29% in April and May 2023. The scenario has all wells completed after October 2021 financed from cash flow, no new debt, in fact the cumulative debt of about 100 billion from Permian operations since Jan 2010 up to November 2021 can be paid back by early 2025 for a scenario that has oil prices rising to $100/b (2020$) by July 2026 and remaining at that level up to August 2035 and then declining.
It are rough numbers, but to grow Permian has to increase new drilled wells and replace the DUCs finished with new drilled wells finished.
That’s a lot of work to do for the service industry and drilling suppliers. They still have DUCs left to finish, so still easy going.
One simple method in Permian is to assume 1.3 wells per rig drilled (this is the estimate at shaleprofile for Permian basin). Future horizontal oil rig count is unknown, but the trend of the from Sept 2020 to Jan 2022 has been about a 9.3 per month increse in Permian horizontal oil rigs, using the 1.3 wells drilled per month per rig estimate this would be an increase of 12 wells drilled per month, for past 4 weeks the rate of wells drilled would be 358 wells per month, in about 3.5 months we might be at the driiling rate of 400 wells per month, which is equal to the recent completion rate. At that point DUC count stabilizes.
Chart below shows theoretical wells drilled assuming 1.3 wells per rig per month have been drilled over the entire 2011 to 2021 period. Note that for the early period from 2011 to 2016 this is likely an overestimate of actual wells drilled as rig efficiency was likely lower over that period.
At link below from http://www.shaleprofile.com is a chart showing actual wells drilled from Jan 2011 to Dec 2020
https://public.tableau.com/shared/FKB4HTM3Y?:toolbar=n&:display_count=n&:origin=viz_share_link&:embed=y
This is total drilling. Almost all rigs are horizontal and drilling for oil. The few vertical rigs are mostly outside the main producing counties, I guess some could be rig based work overs but it would take too much effort to check.
Note the rise in horizontal rigs in the 2016 to 2018 period. Can this be repeated? I doubt it can at that rate, but over 4 or 5 years perhaps, much will depend on the price of oil, but there are other factors at play such as water disposal and earth quakes, lack of lending to oil industry, lack of new leases on federal land, and lack of profitable drilling locations.
These are the proportions by depth. Somebody may know if the New Mexico wells are deeper than Texas ones which is why they are being developed a bit later.
To answer my own question NM permian wells are mostly deeper than 15k.
Whereas almost all of TX wells now are 5 to 15k, which probably explains why TX was slightly ahead in development.
George Kaplan,
Great analysis. Thanks. Is this data pulled from the Baker- Hughes North American Oil Rig pivot table?
I don’t think it was posted here earlier .
https://blog.gorozen.com/blog/running-out-of-spare-capacity-global-oil-markets
Here is the EIA reserve estimates for the Permian. As with all the shale basins the net adjustments have been trending seriously negative as reality catches up initial optimism.
And R/P is declining, reserve replacement ratio has been strongly positive but last year was below replacement level and non-productive ratio (i.e. production planned but not yet started) is likely to decline continuously in the future.
George Kaplan.
Thank you for all of the Permian Basin information.
The Permian appears to be where the growth will come from, if it comes.
I am not in a shale area, but in an area with thousands of wells. Despite WTI now over $80, there is still a shortage of workers here. Many wells SI due to the Covid collapse are still SI as there are very few rigs running.
People still aren’t interested in oil. Have a small, easy to operate lease for sale that is priced at a 24 month payout at $75 WTI. Has been on the market since September. No offers. Right now, one could make money plugging the lease out and selling the equipment, if one could find a contractor to plug the wells.
The entry barriers into the oil industry in the lower 48 onshore are very high. If you can’t do all the work yourself, you better have some connections made through years of relationship building. You better also have a good CPA and attorney. I can count the number of oil and gas attorneys under 65 in my basin on one hand. If our geologist retires, I really don’t know where we’d go.
We have a young service contractor who bought his father out. He’s really working hard. He says he could have several more rigs running right now if he could find the labor.
This industry is such a mess. COVID shut downs had to be the most dire time I can recall, much worse than 1998-99, 2008 crash, 2016 crash. Yet, here we are, 2022 and the anti-oil administration is begging for more. Or should I post moar?
I don’t know if this is already postet here, but it is too nice to miss.
Can somebody help?
The IEA lost 200 millions barrels of oil – poof gone. Perhaps one reasond behind the stubborn oil rally at the moment…
https://oilprice.com/Energy/Crude-Oil/How-The-IEA-Lost-200-Million-Oil-Barrels.html
So much for all these oil inventory messages, interpreting doom or boom into 1 million barrel less or more.
Saudi crude stocks at all time low (source):
Moreover, crude closing stocks decreased by 4.43 million barrels from October to 132.4 million barrels in November, the lowest ever level on record.
Pollux , your info comes just when I was thinking about this . Tks . Just proves what I have said earlier ” KSA is running down inventory to disguise its peak and decline rates ” . Tks once again and please update as soon as you have fresh figures .
Hole in head.
No it does not say this. It simply says exports plus internal consumption is greater than output so there is a draw on stocks.
Note that the production numbers are not from Saudi Arabia they are from independent sources.
Dennis , there are only 3 methods of taking care of what is extracted which are exports+ domestic consumption + storage = Total production . If storage is down that means no oil went into storage . So exports + domestic consumption < total production and inventory was used to cover the shortfall .
It is a logical conclusion .
P.S : I know only the 3 methods above of disposal . Now, if they have started drinking oil instead of water, is a different story . 🙂 . Yes , it is JODI data . Maybe you can point to another better source .
Hole in head,
The secondary sources account for net exports, domestic consumption and storage to arrive at their conclusions for output. The Jodi data is not very good, EIA, BP, IEA, and OPEC MOMR data are far better.
Generally we do not have a great handle on storage levels, in much of the World it is not reported, also outside the OECD we do not have very good data on consumption of oil.
For the most part the best data is output data, but it is far from perfect.
Dennis
What makes yo say that Jodi data is not reliable. Since SA set up Jodi, I would think their info should be reliable.
Dennis , “Many paths lead from the foot of the mountain, but at the peak we all gaze at the single bright moon. 🙏 IKKYU – Zen, Monk, Poet, 1394-1481″
Take any path you wish, you will arrive at ” KSA is using inventory to disguise its peak and decline “
Ovi wrote: What makes yo say that Jodi data is not reliable.
Ovi, I will have to agree with Dennis on this one. Jodi relies entirley on self reporting. And if a country won’t tell them how much they produce, or anything else, they simply do not report anything for that country. That’s why there ar so many blanks in their spreadsheet. Jodi is as reliable as the country they are talking to on the other end of the line. Some of them tell the truth and some of them lie and some of them just do not tell them anything.
Ovi,
When I go to the Jodi website I cannot find any stock data. So it is unclear where you are getting the data. If you compare Jodi data with EIA, BP, and IEA data there are large differences, at least when I checked 5 years ago. You could create some charts to convince me otherwise, I have stopped paying any attention to JODI data. EIA, and BP are my go to sources as the IEA data is mostly now behind a paywall.
Ok. Figured out how to get a chart with longer term Saudi closing crude stocks. See chart next comment, perhaps it is accurate, I do not know.
Ovi,
Longer term chart for Saudi closing crude stocks below from JODI.
Hole in head,
I disagree. The production data reported from secondary sources is likely fairly accurate.
The “hide the decline with declining stocks” argument is BS in my opinion.
Ron
I guess I was a little general in my question. I agree that many countries don’t provide accurate data. My question pertained mostly to SA.
“Since SA set up Jodi, I would think their info should be reliable.”
In the process of looking into the SA numbers at Jodi and comparing with OPEC I found that the secondary source for these countries, Algeria, Angola, Iraq, Kuwait, Nigeria, SA and Venezuela, is Jodi since the numbers for October and November match perfectly with the OPEC secondary sources. Data is only available up to November. Jodi is one month behind on the public side but OPEC has access to the data one month ahead.
Dennis
Above you wrote: “The production data reported from secondary sources is likely fairly accurate.”
I trust that you have taken note of my comment to Ron that the secondary sources for 7 of the OPEC countries in the OPEC report are from JODI.
Ovi,
Perhaps it is accurate for nations that report, note tht in the MOMR there are two tables for OPEC output, direct communication and secondary sources, usually the two numbers are different for several OPEC nations, when that is the case I ignore the direct communication table and focus on secondary sources. Perhaps the 7 nations you name are those whose direct communication numbers match the secondary sources, not all nations will report unreliable numbers, but some may.
The main problem with JODI was the incomplete nature of the data, compared to EIA and BP statistical review of World energy data.
Jodi chart for SA stocks.
The stocks popped up for September and October and then November dropped to a new low. The November drop was 4,428,000 barrels or a daily drop of on average 146.6 kb/d.
This chart will become very interesting in a couple of months if the stocks keep dropping as SA has to increase production/exports to meet their output commitment.
The change in Saudi stocks of around 70 Mb over the Jan 2019 to Dec 2020 period is roughly 1% of average annual output about 95 kb/d on average out of average output of 9478 kb/d over that 2 year period. This is not really a big deal.
Pollux,
Note that the record (at JODI) on Saudi crude stocks is not very long, it extends back only to Jan 2002.
Perhaps the Saudis want their stocks low as it may lead to higher oil prices.
Surprise build this morning of 2.4 M barrels and WTI punched through $87. Normally a build results in a drop in WTI.
Total products supplied was back over 22,000 kb/d to 22,417 kb/d. Maybe this is driving WTI this morning.
Attached is the futures contract table out to July. Notice the backwardation is greater than $1 all the way to July and the front month is highest at $1.30. I cannot ever remember such a steep backwardation for so long.
The jump in reserves in a sense (not total) can be explained by the phased approach the Administration is using to the 50 million SPR release. They just released an additional 13.4 million barrels as of 1/25.
https://www.cnn.com/2022/01/25/politics/oil-reserves-gas-prices-biden/index.html
Department of Energy approves release of 13.4 million barrels from Strategic Petroleum Reserve
I received a quote for WTI puts this morning. A $68 WTI floor for calendar 2022 was quoted at $3.71. A 2023 calendar floor was quoted at $10.73. Quite a difference.
Even a 2022 floor $20 below the spot price is still about 3-4 times higher than when we bought in the money floors in 2003 and 2004.
The many money in oil increases volatility. Hedge is bought cheapest when nobody wants it and anything seems calm – now is action in the oil price and many companies want to secure at least their break even.
And you must consider: Dec 2023 oil is now at 72$ – so you are buying an almost at the money put, that’s expensive.
https://www.barchart.com/futures/quotes/CL*0/futures-prices
Doesn’t sound like it is worth it, but do not know what your total cost would be.
SS
Please explain to me what it means that you got a quote on a $68 put. If you bought it, would it give you some kind of protection. I am not clear on what kind of a bet you would be making?
If I bought a $68 put, and WTI fell below $68 for a monthly average, I would get paid the difference a few days after the end of the month from the counter party I bought the contract from.
A contract is 1,000 barrels per month. So I buy a $68 put contract for calendar 2023. It costs $10 per barrel, or $120,000 for one contract for the year (1,000 BOM x 12 months x $10). Have to pay that when sign the contract. Upfront.
If in January, 2023, WTI averaged $60, I would be paid $8,000. If WTI averaged $68 or more I wouldn’t get paid.Same deal for each month thereafter.
So, puts also called floors, are much more expensive than 2003-2005, when we paid 80 cents to $1.20 or so per barrel. But oil prices were both much lower and much less volatile.
Smart move Shallow Sand. I like the puts and the cost is very low. Aren’t you glad you kept your production?
For what little we have been offered for it, yes.
But who knows what tomorrow brings.
SS
Thanks for the explanation. Seems to me that buying a 2023 put would be better after WTI goes over $100/b. I think when it gets over 100 the economy suffers which could lead to a mini 2008 situation again.
To analyze this, according the data here on the blog:
– At the moment, you should earn good money – otherwise you really have a problem. Stash away some of it.
– A next year put will only pay out under 58$ – to be really of interrest it must be under 50. Prices this low can’t stay for long, as we have seen in the 2020 crash. Shale will suffer and with increased OPEC discipline they won’t be long there. OPEC discipline should be high the next few years, since they noticed they got a lot of money from this.
A this year put – strong question. I personal think every dip will be short lived, since it only will dip in an economic crisis. And then new stimulus and even more QE will arrive, fast and furious.
So it is perhaps better to put the money for hedging on a the side. And under 40$ (your breakeven??, as far as I have noted from your last years posts, you don’t need to answer 😉 ) just go into survival mode.
The glorious days for shale on record growth even on low oil prices should be over.
But you need to cash out anyway – the next 10 years the electric car revolution will gain momentum in key markets like China( they want to axe any oil import for geostrategic reasons in my opinion ), and then prices aren’t predictable. The final oil decline can even be profitable – with big companies investing less there can be a lot of price action.
For this year oil supply looks like to be tight. OPEC has problems ramping up – and no drilling frency to see there. New deep sea or sub salt projects can be started now but doesn’t produce anything this year, shale will grow but not too much. And 200 million barrels are missing. So prices should stay over 70, perhaps dipping only short time under it.
Buy the this year puts if you sleep better then and can affort them ( a good sleep is worth much), but don’t touch the 10$ things for next year.
That’s just my thoughts from the economic level.
I’m starting to think we are getting a high positive correlation between oil and the dollar. Where they both go to the moon together.
Higher oil prices driving dollar higher. If you think about it right now it’s the same damn trade. Higher oil and energy prices wrecking economies. Putting pressure on dollar liquidity driving dollar higher.
I think the FED and other central banks are shitting in their collective pants right now behind closed doors.
Yes, and oil decoupled from stocks. That’s outright dangerous for the economy. Something not right at all here.
Well as oil continues higher. Credit contracts which is dollar positive and should be negative for stock prices and entire economy. Though not all the dip buyers have figured this out yet.
And the thing is if the Central banks just surrendered to inflation and did nothing credit is going to contract massively and you’ll see a much higher dollar.
Inflation is deflationary in an over leveraged everything economy.
How about grain. Also rocketing higher.
Didn’t think when I was a kid growing up here in rural Midcontinent that grain farms and stripper wells would be such a roller coaster.
Guess we did have Farm Aid back in the day, and I do remember oil going from $28 to $8 about the same time. So it’s always been volatile I suppose.
Shallow sand,
Yes the 28 to 8 (more than a factor of 3 decrease) makes 85 to 30 (less than a factor of 3) seem less drastic, both are clearly a problem, but it seems to be the way the oil market works since OPEC has controlled prices. The RRC did a much better job until it lost control of the World oil Market in 1971.
HHH , I think the FED will string it out as long as possible till the whole house of cards falls . The fact is they have lost control . Perhaps they are waiting for a ” black swan ” event to occur before March 15th which would give them an excuse for their inaction . Powell is gutless and spineless .
Well 4.9% of the 6.7% GDP was due to inventory buildup. We have a historic inventory buildup in US on our hands. Companies over ordered during pandemic just hoping to get anything.
A lot of this inventory just hasn’t made it way to store shelves yet. But it will eventually. And prices will fall dramatically. That doesn’t solve high oil and energy prices though.
Actually becomes a real drag on growth as orders for more goods shrink drastically.
Without stimulus checks and the extra $600 of unemployment benefits that were heaped on top of the normal state unemployment benefits consumers spending will be down drastically when inventories are swollen to historic highs.
Here is a chart I found that shows what it looks like
Well,
it sounds like a take home message is that everyone better learn to live a life with
-less energy use, personally and embedded in the products they rely on
-a higher price for all the energy and products (food for example) you do use
How far do you need to drive, what transport activities will you give up, how will your local area do with products and labor and services in an energy stressed world, how much non-oil energy infrastructure/supply does your region have, are the leaders you elect looking forward or backward?
USA production through November 2021 according to the EIA’s Monthly Energy Review
Peak everything .
https://gcaptain.com/qatar-is-totally-maxed-out-of-lng-gas/
Not true.
Here is a global energy production source that is growing very fast and is in its embryonic or infancy phase.
Maybe you can guess another one that is in similar phase of growth.
A global energy production source that is entirely reliant on fossile fuel and fossile fuel infrastructure in every step of its life cycle. But this discussion shouldn’t be held here but in the Open Thread Non Petroleum.
Perhaps you are correct Florian- all the more reason to get it deployed while you can.
My guess would be wind, since we in Sweden are now exporting a sh.tload of energy to Europe although we’ve shut down some “life-necessary” nukes.
Edit: but some will whine none the less…
Yep- and the growth chart looks very similar.
@Hickory ”Are there plans to build more nuclear plants or hydroelectric facilities?” There are currently no plans to build supplementary nuclear reactors. The wind electricity production is negligible, to say the least, and there is not a great wind to produce more wind farms. It seems that the Swedish government is pleased to be in a state of stagnation in energy project stasis. Everything seems very sluggish. The current nuclear reactors are not supposed to be decomissionned before 2040 and on the other side, no more than 10 reactors can function simultaneously in Sweden and new reactors must be build on existing nuclear power plants. The fact is that there is a little project of a demonstrator of lead cooled fast reactor (project SEALER). The other fact is that the Swedish steel company SSAB stated that if they convert their Swedish steel production facilities to the hybrit process (hydrogen in place of coke to reduce iron ore), they would need, if I am not wrong, 55 TWh of electricity to run their factories.
Lucky they are next to Norway.
J-F Fluery.
“there is not a great wind to produce more wind farms.”
You may be familiar with nuclear issues, but you’re just far off-base (wrong) on the wind resource of Sweden
https://gwec.net/wp-content/uploads/2021/06/Sweden_Offshore-Wind-Technical-Potential_GWEC-OREAC.pdf
I repeat- “Should Sweden decide to build more offshore wind capacity, the resource generating capacity is equivalent to around 200 nuclear reactors (1000 MW size).”
You cant just look at net exports, then you dont understand our market and the reason for current issues and what will come.
I guess you live in the north, if you lived in the south as a house owner you would probably see it less binary.
Oh and our net exports will cese to exist in a couple of years as the surplus of the north will be gobbled up.
Karlshamverket used 28.000 tonnes of oil in 2021, more then previous 10 years put together. A direct result of our “green” policy and termination of nuclear in the south.
Well, since Karlshamn is a 600 MW plant and we´ve been exporting 2-6 GW, i.e. 3-10 times it´s capacity the last 2-3 months, the “national emergency” some have been whining about is just BS. But I agree that our export will, and should, stop as soon as possible, and electricity prices should be quite a bit higher.
Edit: but you will surely get the government refund of 2 kSEK/month, since you are likely a registered voter.
https://www.nordpoolgroup.com/Market-data1/Power-system-data/Exchange1/ALL/Hourly111/?view=table
Edit 2: in fact I own two houses, just a bit south of the arctic circle, one on a fixed electric rate and one on a monthly moving rate, but heat pumps and good insulation makes electricity prices less important. btw. most is fixed utility cost, transfer cost, tax and VAT anyway. (in Sweden you pay VAT (moms) on the taxes for electricity)
That is not my point, the plant is a spare capacity plant for emergency use that now fired up 80+ times last year (from memory) my point is we burned 28.000 tonnes of oil because we terminated nuclear without any realistic replacement in place. And we called that green transition. This wont get better in the coming years, it will get worse as the new “green” industry together with datacenters with 99% subsidized electric prices are established in the comong five years will consume what is today surplus in the north leading to even more oil burning to balance the net.
My personal economy had nothing to do with my comment, but for the record o think its ironic that tax payers money is used as a refund/ band aid to lessen the impact of piss poor planning and virtue signaling.
Im well aware how tax and vat works as i run two companies and own several properties, if you look at your energy bill both the tax and vat is a function of energy prices, both on consumption and transfer bill. I saw this coming more than a year ago and i adjusted my capital according and profited, but my comment was not about my personal economy as stated. It was against that the implication as i saw it that terminating nuclear was not that important since we were still net exporters. In my opinion then you have limited knowledge of the swedish energy market and the consequences of such actions. 28.000 tonnes consumed oil that we wouldn’t have consumed if we would have kept reactors in operation is in my opinion something to consider. Ignoring it or the reasons why it happened doesn’t make the world greener.
Just a remark, the closing of Ringhals 1 & 2 and Oskarshamn 1 & 2 was made mainly due to financial reasons since the fixes for independent emergency core cooling and some other issues combined with low prices at the time made them unprofitable.
Some links: (Mostly in Swedish, sorry…) And at current prices in Europe, had they been running, we just would have exported more, inkluding Karlshamns production.
https://en.wikipedia.org/wiki/Oskarshamn_Nuclear_Power_Plant
https://www.mkg.se/uploads/Jan_Hanberg_Oberoende_hardkylning%20_170420.pdf
https://www.svt.se/nyheter/lokalt/halland/darfor-stangs-reaktor-ett-och-tva-ner-pa-ringhals
https://group.vattenfall.com/se/nyheter-och-press/nyheter/2019/fragor-och-svar-om-avvecklingen-av-ringhals-12
I rest my case, for the time being.
Ok you don’t get it,
Its not about average production, that we are net exporter on average doesn’t help one bit the days we have a lack of production and our emergency reserve plant is forced to fire up, its supposed to be an emergency and it happened 80+ times last year. Even though we are net average exporters 🙄.
The reason this has increased last year is lower base load in the south, again it helps nothing that we exported energy the week before the day we have no wind and high consumption then we burn oil.
Its a little bit like it wont do you much good to try to live on average breading, it will cause problems even though average numbers looks dandy.
No we would not just have exported more, we would not had to crank up oil burner as often id south had more base load available.
Its not just because its so fun we burned more oil 2021 then previous 10 years together. We had no other available options on 80+ days.
Just checked December numbers, there were two days we were importing, the 6th and 7th, and not that high numbers, and not the whole days either,so the Horror! So I stand firmly by my statements.
Btw. when you´re in a hole, stop digging, unless it´s for facts, of course.
https://www.nordpoolgroup.com/Market-data1/Power-system-data/Exchange1/ALL/Hourly1/?view=table
(some menu choises might need to be done, start with a change to Daily, and please compare to Norway)
Should Sweden decide to build more offshore wind capacity, the resource generating capacity is equivalent to around 200 nuclear reactors (1000 MW size).
https://gwec.net/wp-content/uploads/2021/06/Sweden_Offshore-Wind-Technical-Potential_GWEC-OREAC.pdf
Are there plans to build more nuclear plants or hydroelectric facilities?
You cant just check days we imported energy and label those the only issue days, unless you only consider import in it self an issue for some reason. You realize oil burner might be operational on both days of net export and import i hope.
Well this was fruitless, i consider using our emergency spare capacity very often and burning oil an issue, you dont as we are net exporters most days. 👍
From the Qatar LNG article:
Qatar is spending almost $30 billion to increase its output capacity by 50%, but the project isn’t expected to yield its first gas until the end of 2025.
That is 4 years from now. A lot of time in nowadays energy world. Output capacity should increase from 80 million ton LNG/year now, to 120 million ton/year. Mind-boggling quantities.
Whoa nat gas off the charts today
https://oilprice.com/Energy/Natural-Gas/US-Natural-Gas-Prices-Climb-Most-Ever-In-A-Single-Day.amp.html
Oh dear.
https://worldoil.com/news/2022/1/28/u-s-judge-voids-80-million-acres-of-offshore-oil-and-gas-leases/#comments
LIGHTSOUT,
If many more judges decide this it means: short term pain vs long term (climate) gain.
Obvious is that most people fear that the ‘short time pain’ will be too strong.
A 2+ C warming of the earth is a disaster and from now on a hell of a lot needs to be done FAST to prevent that.
Choosing for decades of good life for a good deal of nowadays adults or choosing for the same for the children who live now ? Supposing that a rather steep decline of oil and gas production doesn’t result in a long lasting (economic) catastrophe.
In May last year a Dutch judge decided that Shell has to reduce CO2 emissions with 45% before 2030.
Last December Shell decided to move their head office from Holland to London. Shell is not Royal Dutch Shell anymore. They didn’t give a reason why, but one can imagine why.
Peak oil, if already in 2019 or around 2028 or something in between, production plateau could (theoretically) last at least 10 years. How long in practice ? Many parameters to think of, judges being one.
Lack of supply is being felt. Brent is at $90 at the moment. We haven’t’ seen oil prices at this level for 7 years.
Now that we are at [or close to or just beyond] peak oil supply,
one wonders how we will adjust to less oil, and more expensive oil.
In the US 66% of oil consumption is used for transportation. This consumption is now readily replaced by electric transport- its simply a question of speed of transition. That means the purchase of electric vehicles, battery manufacturing capacity build out, the shoring up of the electric transmission grid and storage system, and electric generation capacity.
All are doable tasks- its a matter of proactive decision making, and getting the job done in a timely manner.
Sounds easy, but it will be very expensive and unlikely to get accomplished in a smooth or quick manner.
Will it happen quickly enough to avoid a big national shortfall in oil based transportation affordability. Extremely doubtful. And certain regions and sectors will be hit much harder than others.
Ovi, I stand by my prior projection from yr 2000- that 90% of new vehicle sales for light transport will have a plug by year 2030. It may have sounded ludicrous then, but I suspect it will be less and less outlandish of a statement in 5 years from now. disclosure- I bank on it
Hickory
Did you mean 2020? Secondly 90% world wide. 90% US?, 90% China, 90% Europe?
Ovi,
I think he means for the World in 2030 90% of new light vehicle sales will be plugin hybrids or EVs. This seems conservative to me, I expect it will be 95% of new light vehicle sales at minimum in 2030 Worldwide will be plugin. Note this is not the same as saying 90 or 95% of all registered vehicles will be plugins at that point, it will take time for old vehicles to fall out of service.
Yes, thanks for the correction. I’m still getting used to all this 21st century numbering.
And yes- globally.
Hickory
My question regarding 2020 was “did you really make the prediction in the year 2000 or 2020.
My answer is no. The whole world will not have sufficient electrical infrastructure to support a 90% level of PHEV sales. Also cost will continue to be an issue. My guess is it will be closer to 66.6666666%.
It was in 2020 Ovi.
Han- “I think in 2030 a lot of car sales will be second hand ICE cars.”
Yes, and it is amazing how much longer ICE ‘s last compared to prior generations.
Just how desired the old ones are will depend on certain things like
-how expensive is oil and cost per mile to operate
-what is the general level of prosperity vs poverty in the world
-how well is the rest of the vehicle holding up
Ovi,
We will see. Prices for EVs will fall as output scales up and total cost of ownership for EVs will be far lower than ICEV, especially with oil over $90/bo (likely for 2022 to to 2030). Much of the charging can be done overnight when there is excess grid capacity. Perhaps reality will fall somewhere between your guess (67%) and mine (95%), generally my guesses in the past have tended to underestimate growth in output. See for example
https://peakoilbarrel.com/the-future-of-us-light-tight-oil-lto/
My best guess in that post was between the 44 Gb to 50 Gb models with peaks of 5500 kb/d to 5800 kb/d from 2023 to 2027. In 2019 I expected US tight oil output to be about 4500 kb/d rather than the 8100 Mbpd actual level of 12 month average output in 2019/2020.
Dennis
Prices never go down. They may go down for manufacturers but are not passed on to customers who don’t have leverage.
Here is what is happening to lithium. A year ago, I could buy 3 2032 batteries, 3 for $1. Now one costs $1.49. Lithium prices are climbing. See below
“Seaborne lithium carbonate prices have gained 413% since the start of 2021 to $32,600/mt CIF North Asia on Dec. 14, while lithium hydroxide prices have climbed 254% over the same period to $31,900/mt CIF North Asia, according to S&P Global Platts data.”
https://www.forbes.com/sites/rrapier/2021/12/31/the-challenges-posed-by-rising-lithium-prices/?sh=555289823af9
As I have mentioned a few times earlier, I am still of the opinion BEV’s are a totally crazy idea. I think PHEVs with a range of 125 to 150 miles make more sense. As lithium prices rise, the only way to slow the demand and make more EVs is to make 3 PHEVs for one BEV. The vehicle will also be cheaper due to the smaller battery. That is a trade-off that companies and California regulators may have to face in the near future.
Summary of results from a Toyota study. The research found:
1) GHG of a currently available BEV model and PHEV model are roughly the same in on-road performance when factoring in pollutants created by electricity production for the average US energy grid used to charge batteries.
2) Manufacturing is a component of GHG emissions. Using the “Greenhouse gases, Regulated Emissions, and Energy use in Technologies” (GREET) model, researchers found that the production of a PHEV emits less GHG since it uses a smaller, lighter weight battery.
3) The PHEV is much less expensive to buy and own, compared to the BEV. Without any incentives, the five-year Total Cost of Ownership (TCO) of a long-range BEV is significantly higher than the PHEV. If you include incentives available this year (2020), the TCO of a long-range BEV is much higher.
https://www.greencarcongress.com/2021/02/20210211-tmna.html
At some point in the future, BEVs are going to have to pay for the roads they drive on. The incentive of driving free on roads can’t last forever.
Dennis
Another update
Other commodities used in cathodes, the most expensive part of a battery, have also been rising. The price of cobalt has doubled since last January to $70,208 a tonne, while nickel jumped 15 per cent to $20,045.
The increases are undermining the technological and efficiency gains of recent years, during which automakers and battery makers have worked hard together to develop long-life, high-performance batteries while trying to reduce costs. They also threaten to throw a wrench in the car industry’s ambitious plans for electrification just as even formerly reluctant companies such as Toyota embrace targets for electric vehicle production.
https://www.ft.com/content/31870961-dee4-4b79-8dca-47e78d29b420
Ovi,
The increase in material prices may be due to current supply disruption worldwide.
Note that my prediction is for plug in vehicles.
I disagree that plugin hybrids are the best option.
Ovi,
The cost of batteries has decreased significantly. A 2018 Tesla model 3 was 52.5k after incentives for long range AWD with 310 miles of range, so $169.35 per mile of range. Currently the Model 3 (with similar equipment as the 2018 model) without incentives for long range all wheel drive (Tesla calls this dual motor) which has a range of 358 miles costs 52.4k and cost per mile of range is $146.37. If one wants less range and does not need AWD, the rear wheel drive model with range of 272 miles costs 46.4k or $170.59/mile of range. The first comparison is more apples to apples and the price has decreased, if we did the calculation in real dollars there would be a bigger drop in cost.
So the idea that price always increases is false, at least in this case. As to the electricity used to power the BEV or any plugin, over time the contribution from fossil fuels may diminish substantially, especially as the price of fossil fuel rises.
Regarding REE, there is a battery company in Sweden that aims to use 50% recycled material in their batteries by 2030, and apparently they have come quite some way in the process. So mineral prices might be a bit smaller obstacle than some might think, hopefully at least, for both BEVs and PHEVs.
https://www.cnbc.com/2021/11/12/northvolt-produces-battery-with-recycled-nickel-manganese-cobalt.html
https://northvolt.com/products/revolt
Laplander , another ” hopium ” corporation . Hope is not a strategy . Put it in file 13 .
P.S ; In a lawyers office ” File 13 ” is the waste paper basket .
HiH, might be, but they´ve got quite a few heavyweights investing several billions, like VW, BMW, Scania, Volvo etc. But we´ll see. Btw., one of the founders worked at Tesla in the early days.
Edit: And a positive sideeffect of the building of their first factory, around 50 miles from here is that it has raised property values quite a bit, so I can now take out a second mortage and build a really nice woodfired sauna. The realestate prices in the vicinity are now insane!
Edit 2: at least by our standards, maybe not for Stockholmers…
Are we even going to be producing cars at all by 2030?
If you live in Europe the answer is no. If you live in Asia the answer might be no. You’ll just be trying to keep the lights on an heat on in winter.
When the Russian and Saudi energy exports are cut in half over the next 8 years you’ll see what I mean.
Do you use high priced natural gas for plastics used in the manufacturing of EV’s or do you keep the lights on and heat going?
Maybe 90% of cars will be EV’s but there won’t be a lot of new cars being built.
“Are we even going to be producing cars at all by 2030?”
Its possible the world ends in 2027 or some such thing,
but the much more likely scenario that the world will be producing many millions of cars and other light vehicles on and on.
Hicks , my expiry year is 2025 when TEOTWAWKI hits . The unraveling I have said will began in the financial markets which have nothing but digital 0’s conjured by the CB’s backed by no assets . They have successfully kicked the can down the road since 2008 and now they have run out of road . The cherries on the cake are fraudulent activities and entities like crypto ,SPAC , derivatives etc . The financial mayhem will cause a gridlock in trade flows and constrict already squeezed supply chains . Russia has already said they cannot supply more oil and gas . The lies of KSA are going to be unmasked in the very near short term . Forget the Permian , ESG ,credit , GOR , WOR and running out of sweet spots will put a cap . The nett energy surplus available to society will greatly diminish . We have entered the period of consequences . It takes time but the last stages move for very fast . I have been following Turkey since Sept 2020 when the first signs of trouble began . The rate was 1 USD = 8 TRL . In December 2021 it went to 1USD= 16 TRL . Inflation 36 % . Today it stands at the brink of collapse as Iran has cut off its gas supply since it has no USD to pay . Industry has been ordered to shutdown for 10 days . See for yourself .
https://www.youtube.com/watch?v=_UQMMKyP15I&t=3s&ab_channel=JoeBlogs
I find HHH and Eulen’s views very interesting ,specially about inflation vs deflation and the Euro dollar market flows about which I was totally ignorant until they mentioned it here . Watch out below .
Dennis,
I think in 2030 a lot of car sales will be second hand ICE cars.
The comment of HHH could become reality, though I don’t think (hope) that Russian and KSA energy exports are cut in half in eight years.
Han,
I doubt it, EVs will be pretty cheap at that point, but I could be wrong as has been true often in the past,
There are seven EV Chinese models already available for around $20K or less. If there is still a subsidy for EVs later in the decade you might be able to pick up a decent model for less than $10K by 2025. If gas is $4.00 I would expect the invasion from Chinese EV manufacturers to be in full swing by then.
https://egear.asia/cheapest-electric-cars-china/
This is without considering the availability and cost of other electric-motor driven vehicles such as scooters, bikes, robotaxis, etc
Don’t forget current ICE-powered vehicles are only about 1% efficient at moving human payloads. To say there is room for improvement is a vast understatement.
Nominal cost of EVs isn’t even the major issue. The infrastructure needs to be there.
As oil approaches $90. Price of coal is within $42 dollars of it’s most recent high of $269.50. China is producing all the coal it can and can’t keep a lid on price.
$300 coal will likely be here soon. Wonder what the growth story in China looks like with oil at $105 and coal at say $320?
And what can they do about it? Raise interest rates? 🤣
Invade Indonesia perhaps.
HHH,
They can build nuclear power plants, install wind and solar and this is likely at high oil prices. Also they sell a lot of EVs in China so oil demand may start to fall before long, especially as EV prices start to drop as production experiences economies of scale.
Dennis , your post reminds me of a hit song by Annie Lennox . It was called ” Sweet Dreams ” .Here is the
link . Who am I to disagree ? 🙂
https://www.youtube.com/watch?v=qeMFqkcPYcg
Since I´m quite a bit of a resource “nationalist”, as you might have noted and we thereby exist as mentioned below, I´m however now a slightly bit concerned about the export of Guinness from Ireland…
But we´ll figure it out, I hope. The link to lateral thinking was really good, and loved Annie, as always. Be well, all, I´m off to the government sponsored sauna!
One of my favorites!
” Sweet Dreams ”
HHH,
China can import coal as well.
Dennis , resource nationalism is the next step down the ladder. Try connecting the dots . Try lateral thinking instead of linear thinking . I am sure you are aware but sometimes we are not omnipotent .
https://en.wikipedia.org/wiki/Lateral_thinking
Hole in head,
US and Australia and South Africa are all willing and able to export coal, that is just a fact.
China has chosen to not import Australian coal (their cheapest source of imports) high coal prices may lead them to reconsider their position.
Currently covid is disrupting supply, that is likely to end in the medium term (maybe in 6 to 12 months.)
China only imports 6% of its coal consumption currently and it’s still can’t do anything to keep lid on price.
That small 6% was also apparently the difference between keeping lights on or off for some cities, towns, and provinces early this year.
Why haven’t they built those nukes out already? I keep hearing about these. And if it would solve all their energy problems not to mention some pollution problems why hasn’t it already been done?
China doesn’t have the right coal which is thermal coal. And in light of that why aren’t those nukes being built in a hurry?
HHH,
No doubt there are supply disruptions in China and nukes cannot be built overnight. Often the World market price cannot be determined by an importing nation, whether the proportion of imports is 1% or 100% makes no difference in this regard.
”They can build nuclear power plants.” Yes, it is what they are doing. They have 18 nuclear reactors in construction out of 37 projects. And they have a far target of 168 reactors.
JFF , the bottleneck is the special steel required for the nuclear domes . Only a division of Nippon Steel can produce this. Maximum is 3 to 4 domes per year .Countries can plan all they want
China’s coal
Bison report.
After conducting this analysis, in which we assumed rig productivity has declined 10% after the pandemic, we estimate that the industry would need to add ∼180 rigs or remove ∼45 frac spreads to restore DUCs depleted since April 2020
:
https://bisoninterests.com/content/f/bison-2022-oil-outlook-record-year-2022-outlook-duc-dilemma
This is a good analysis (despite the silly intro paragraph) of the DUC problem, which boils down to frac spreads being too high at the moment relative to drilling rigs. A good summation also of the headwinds facing tight oil: supply shortages; lack of financing options; and a shrinking labor force.
“Ultimately, we anticipate that the rig count may not reach necessary levels for the reasons above, and almost certainly not in 2022. US production may continue to underwhelm expectations, potentially sending oil prices higher.”
Here is a different way at looking at the Permian production. For the four districts that contribute (eastern NM and 7C, 8 and 8A in TX) a Verhulst curve combined with a small contribution from exponential decay was fitted to production each month from 2005 to 2021. In addition the total production after 2020 was constrained to equal the latest EIA estimate for remaining reserves in the district. In recent years downward adjustments and revisions have exceeded discoveries so the remaining reserve estimates may be high. Some of the revisions may be due to price but I think most is because initial recovery factors were overestimated and have to be corrected as actual end of life performance data is received.
The bite taken out from the Covid effects makes exact fitting difficult. In conventional reservoirs an unexpected shut in is usuaully followed by a rebound that is slightly above what would have been seen (without the shutdown), which then fades away to follow the expected decline curve. I don’t know if tight oil production will see something similar (it will be interesting to see and these projected curves may help in comparing). The projected curves look quit god in on way in that the post peak decay is slower than the increase to peak (i.e. the curves are skewed to an earlier peak compared to a strict logistic) and this is what has been seen in Bakken and Eagle Ford.
The data is from TX RRC and the NM equivalent, shown as kbpd. Numbers are slightly low because they don’t include the minor NM counties (only Eddy and Lea).
George,
What is cumulative production for all 4 areas for the Verhurlst fits through 2034?
George,
It seems you are using all C plus C production from Permian basin, both conventional and tight oil. Why not just use tight oil output from EIA spreadsheet linked below
https://www.eia.gov/energyexplained/oil-and-petroleum-products/data/US-tight-oil-production.xlsx
Your curve seems to suggest peak is roughly Dec 2021, which looks to be approximately 50% of URR for cumulative output at that point. For tight oil output from Permian basin cumulative output from Jan 2000 to Dec 2021 is about 8.4 billion barrels so this might suggest a URR of about 17 billion barrels based on an assumed Verhulst fit. A recent 2022 paper co-authored by Tad Patzek suggests about 13 billion barrels of output if no wells were completed after mid 2021, also the paper suggests Core areas of Permian will produce about 30 billion barrels and adding non-core areas increases output to 54 Gb. That analysis was more of the bottom up variety.
Paper is Wardana Saputra et al, 2022 at link below
https://www.mdpi.com/1996-1073/15/1/43/htm
Permian proved reserves at end of 2020 was 11.87 Gb, proved plus probable would be 20.2 Gb if we assume 2P/1P is 1.7 like UK North Sea over most of its history. Cumulative tight oil production from Permian to Dec 2020 is about 6.9 Gb, that suggests a URR of about 27 Gb if there is no new discoveries, reserve growth or possible reserves being reclassified as probable reserves in the future, we would also be assuming that any contingent resources never become reserves.
In my opinion, itt is likely that at least 30 billion barrels of tight oil are produced in total from Permian basin with 21.6 Gb produced after Dec 2021. Best guess is 30 to 40 Gb.
Reminder:
The Donbas has coal in great quantity. Think about it.
Good point, Putin is clearly not an angel, but he´s got the patience of one…
If I would be him, I´d turn Kiev to glass, just because of the Odessa “incident” alone.
Read up about it, and keep an eye on Victoria Nuland.
I was referring to phrasing the warmongers must craft.
“We must ensure Ukraine retains the mineral wealth of its Donbas region.”
Then you hope the green wacko types in the US and UK govts never ask what the minerals are. You do not want anyone concluding that a coal selling and burning Russia is easier to demonize because that undercuts the Ukraine war drumbeat.
SS, Isn’t this a Sweet Deal?
Maybe this is a better way to play oil. Could you have bought oil from the SPR?
The trading firms can sell the oil immediately to refiners for current prices – West Texas Intermediate crude is trading in the high $80s – and are expected to pay back in some cases by September 2024, currently priced about $20 a barrel less on the forward curve.
They can lock in profits by buying call options that will give them the right to buy WTI in the high $60s when it is time to return the crude, traders said.
The Department of Energy offered to loan fuelmakers 32 million barrels, on condition they pay it back in oil by 2024.
So far, 68 per cent of the total offered was awarded, where at least half was taken by trading houses. The loan is part of a 50 million barrel release.
https://www.thenationalnews.com/business/energy/2022/01/29/why-trading-houses-are-set-to-take-advantage-of-us-strategic-oil-reserve-release/
Ovi.
Seems like if you have the financial might this is guaranteed profit.
We have only project hedged, and that was many years ago. Have never speculated in the crude market.
The feeling I get is that the actual trading market for crude and other fossil fuel commodities is dominated by a few big money players. It also had a “club” feeling to it. I also got the feeling it isn’t the most regulated space.
I have seen recently the CFTC has filed suit against at least one firm for trading against its clients. Giving the client a quote, getting a better deal in the open market, and then selling to the client and profiting the difference.
Granted, suit was just filed and will likely take years to get to trial. So everything is just an allegation at this point.
Google Coquest.
Note, the markets are regulated, but not funded and staffed the level to effectively regulate.
Recent article states CFTC regulates a whopping $342 trillion in annual trades with a budget of $315 million and a staff of about 700 FTE. Most of the attorneys, although very talented, are very young. High turnover, stepping stone type of job given pay and benefits.
For example, salary posted on a job opening for a CFTC supervising attorney with five years federal prosecutor experience in Washington DC is $148k.
That doesn’t sound like big bucks for an experienced attorney living in DC area.
Oil flying high, beating historical rate of $147/barrel not far away
Next week, the OPEC+ will meet again based on its monthly schedule and due to the increased expectation to renew its usual volume of 400,000 barrels per day. However, 18 of its members still cannot meet the agreed quota. So why not let others replace their volume, as about 800,000 barrels are short of the agreed daily OPEC+ volume which is causing the tightening of the oil market, and pushing the oil prices above $90? It might be just possible for OPEC+ to increase its own production volume from the current established level to 500,000 barrels or more to ease the price pressure and calm the energy market. OPEC+ should perhaps just stick to its usual volume release, as in both cases the supply is not there and it can’t furnish the market with more volume any time now.
Four OPEC+ countries can meet their monthly quota, 18 cannot. Errr… What does that tell us?
OPEC+ can increase production by 500,000 bp/d. OPEC alone, without the plus, as of December, was one million bp/d below their pre covid level and four million barrels per day below their 2017 12 mounth average high.
OPEC Plus? Start Thinking OPEC Minus
Officially that demand can be met by 23 nations in the OPEC+ alliance. On paper, they have the capacity to pump 5.6 million barrels a day more than they are today — the aggregation of baselines they were allowed to ramp up to under a pact to support oil prices.
The reality is that, yes, spare production capacity does exist, but far fewer nations can materially help if the clamor for crude intensifies.
I think OPEC can possibly reach their pre-covid level, but not much further than that. In the meantime, while OPEC is trying to reach that level, the rest of the world is 4 million barrels per day below their pre-covid level and is just running in place. Look for the World less OPEC to begin to decline in late 2022 or early 2023.
The data in the chart below is through September 2022 and is thousand barrels per day.
Ron, remember the story of the ” the three little pigs and the big bad wolf ” . The punchline was ” you can huff and you can puff but you cannot bring this house down ” . My take is the whole world ” can pump and they can pump but they will not bring the peak of 2018 down ” . I will go out on a limb . We will not even touch 80 mbpd . Pump and pump . The pumps will fail . Best of luck .
Well, you might be right, and it would not surprise me at all if you are right. However, I will not go that far. I doubt it will ever reach 83 million barrels per day or the 12 monthly average will ever reach 82 million barrels per day.
At any rate, I think we will know one way or the other by the end of this year. What everyone is overlooking is the reduction in production capacity that has happened during this covid dip. The combined production capacity, among many nations, has declined by over two million barrels per day in the last two years. And it will continue to decline by almost one million barrels per day every year.
In my chart above, World less OPEC is of course just Non-OPEC. I just thought we might look at it from a different direction. 😂
Omicron wave will have subsided by April. People are tired of being cooped up and plan to travel this summer unless a super crazy new dangerous variant shows up. Oil demand will be big. The big question is China and their insane zero-Covid policy and how that will play out. They may destroy their economy over it. But I don’t think they care because it’s allowing the CCP to establish the Orwellian police state of their dreams.
A lot of people look at China’s credit impulse thinking they are going to open up credit spigot and all will be fine.
Nothing could be further from the truth. Their debt burden denominated in their local currency the yuan. Is so large virtually 100% of the credit impulse is just rolling over existing debt. Growth in China isn’t on the table. And that has major implications for all countries who rely on China to buy their exports.
The idea that our economic problems are due to Covid is just ludicrous.World has an energy problem that’s been covered up by growing debt. Now the world has a debt problem that existing energy recourses can’t cover.
It’s why we need ever lower interest rates and ever growing debt or economically we collapse.
Those that are counting on renewable energy or green energy to service the debts that are already accumulated and all will be fine just aren’t fully understanding the predicament.
The 12 month average for World less OPEC at World 12 month peak (May 2019) was roughly 1600 kb/d higher than the Sept 2021 level, US, Canada, Brazil, Norway, Russia and Guyana (total output from this group of nations) are likely to more than offset declining output from other non-OPEC nations through 2026.
I seriously doubt that Dennis, but why are they not doing anything right now? Non-OPEC September production is below their January 2021 level. At a time when oil prices are sky high?
Hi Ron,
It takes time for producers to respond to market signals and the volatility in oil prices may have the producers thinking that by the time I get this project completed oil prices will have fallen.
The smart producers realize there may be a narrow window from now until 2030 to produce oil, after that demand will fall faster than supply and only the very low cost producers (onshore conventional mostly) will be able to produce oil at a profit. For tight oil in particular, the “capital discipline” will leave a lot of tight oil in the ground as oil prices fall after 2029. The smart tight oil producers will ramp up as quickly as possible and produce as much as they can while oil prices are high.
Also your data is through Sept 2021, oil prices were not sky high at that point, WTI was $72/b and Brent was $75/b in Sept 2021. So perhaps current oil prices might lead to higher output, Brent is at $91/b as I write this, if $90/b or higher is maintained for a couple of months we may see higher non-OPEC output by June 2021.
Dennis , ” smart producers ” .?? If you believe this then all I can say is that you also believe in tooth fairies and unicorns . The shale sector was pumping even when the prices were ultra low . There is no such category , just like there are no ladies who are a little bit pregnant . 🙂
Hole in head,
There are plenty of smart people in the oil business. The smarter producers produce more when oil prices are high and less when oil prices are low.
We will see what happens if oil prices remain in the $90 to $100 per barrel range as many of us believe will be the case for the next few years.
I know that you believe oil prices will be $25/b on 2025 (not clear how long you believe oil prices will remain this low or lower), if you are correct and the price is sustained for 5 years or so, then no tight oil wells will be completed after 2025 and tight oil output crashes. I assume you envision a Worldwide economic depression perhaps leading to WW3. Anything is possible, but odds for such a scenario are quite low in my opinion.
Dennis ” there are smart people in the oil industry ” . Sure they are all smart when it is OPM in action . Ask LTO’s , SS and Mike S , Rasputin etc where they are the last in line to receive the paycheck or even worse to pay for the next months wages from their own pockets . Don’t believe go and read ” The smartest men in the room ” about the Enron fiasco ( EOG was Enron Oil and Gas ) . Shakespeare ” History repeats itself , first as a tragedy and then as a farce ” . We are there .
Ron,
Also from March 2021 to December 2021 the rate of increase in US tight oil has been at an annual rate of 446 kb/d. December tight oil output was about 500 kb/d below the November 2019 12 month average peak and 564 kb/d above the level of the Nov 2018 centered 12 month average for tight oil (when World centered 12 month average was at its peak).
Dennis, I am not nearly as optimistic about US production as you. And I doubt they will ever breach their former high. But, that is a possibility. And if they do it, it will not be by a large margin. However, the US is far more likely to breach its former highs than the world is likely to breach its former highs.
I am adamant that world oil has peaked. I believe the US has also peaked but I am not nearly as sure about that as I am about world peak oil.
Whether or not the US has reached peak oil is just not that important. It is extremely important whether or not the world has reached peak oil.
Ron,
US output may not return to its previous peak, but in 2018 average US C plus C output was only 10.94 Mbpd scenario below assumes oil prices never rise above $100/b for Brent in 2020$ and Permian tight oil completion rate remains at 600 new wells per month or less. Oil prices start to fall after 2030 and tight oil output declines sharply. Secondary peak in 2026 and 2027 is 12.1 Mb/d, this output and higher output from Canada, Brazil, Guyana, Norway, Iraq, Iran, Saudi Arabia, and UAE may be enough to surpass the 2018 12 month centered average peak, especially if Demand is high enough to increase oil prices to over $100/bo as I expect by 2024.
I agree World output is more important, by 2030 this will be less important because demand will start to fall faster than supply as the transportation transition ensues.
chart with us scenario
Oil opened just a little while ago. Both WTI and Brent opened up just under a dollar.
Last year Dennis asked me what my short term oil price projection would be. I said a 2022 average price of $90 for WTI. We’ll see if this comes to pass?
Frugal
I will raise you $10 and bet it will be a nice round $100.
OK Ovi — it’s a deal!
Frugal and Ovi,
That sounds like a reasonable range, but for 2022 average Brent oil price, $90/bo seems a reasonable guess, but Ovi could end up being correct if we do not see an economic down turn. I think $100/b for the average price in 2023 might be right.
I don’t think $90 – 100 oil will in itself crash the World economy (too low of a price for that) but the economy could crash for other reasons, such as the enormous amount of debt accumulated by consumers, businesses and governments. And it’s not a given that a crashed economy will reduce the amount of oil consumed.
Permian Average Well Production Is Set To Break Records In 2022
Surge in lateral well length is driving average well productivity to new heights in the Permian.
New wells are expected to break the 1,000 boepd thresholds in 2022.
The total completed lateral footage of wells in the Permian is expected to reach a record high of 50 million feet in 2022.
“The Permian is now entering a three-mile lateral era. Such long wells were viewed as inferior for their high finding and development costs in some deeper zones just a few years ago, but modern equipment and completion methods allow extended reach wells to spread across the entire basin,” says Artem Abramov, head of shale research at Rystad Energy.
https://oilprice.com/Energy/Energy-General/Permian-Average-Well-Production-Is-Set-To-Break-Records-In-2022.html
The same thing is happening in North Dakota.
Helms said: “What we’re observing there is significant work in what we call tier 2 and 3 areas outside the core areas as people are beginning to drill 3-mile laterals and different strategies to start developing that lesser developed area.”
https://www.spglobal.com/platts/en/market-insights/latest-news/oil/011422-north-dakota-oil-output-rises-4-in-november-to-116-million-bd-state
Does this also imply/mean that drillers are moving out to Tier2 and 3 areas in the Permian?
Given the saturation in Tier 1 area of Permian, I would say yes. Perhaps, M. Shellman could say more about this?
Trying to get US November data out by tonight. Surprise build of 244 kb/d. See attached chart. Please keep comments for the post.
Ovi, regarding your comments above
I have had similar thoughts as you on the virtues of PHEV vs EV, at least as a transition mechanism for this decade. But apparently the vast majority of the major auto manufactures have studied the engineering and economic issues hard and come up with the conclusion that a direct move to EV is the way to go. The only two remarkable holdouts or laggards on this are Toyota and Honda. They are going to be playing catch up, with the success of their brand hinging on the ability to make up for lost time. I wouldn’t bet against them though.
Producing a PHEV with range over low 30’s appears to be a big challenge; I think having to do with trade-offs on weight and suspension. Only a few vehicles pull this balance off well including Toyota RAV4 Prime and Ford Escape PHEV.
PHEV’s with electric range north of 60 miles would be very useful, but I haven’t seen any in the pipelines.
EV’s with range less than 150 miles have been gaining traction in some markets (especially China) and I expect this segment will be bigger than many of us would guess. Smaller battery, smaller weight, less cost. Very useful for daily errands/commute in urban/suburban environments.
Lastly, I’ll point out that batteries will be likely to improve in the next 5 years- either in cost, weight, longevity, density…and likely in a combination of these aspects. R & D money and brains have been hitting the problems hard for the last 5 years. Big competition and incentive for achievement.
Hickory, I´ve made some remarks in the battery matter above in the thread, disclosure, not invested, but secondarily profiting.
Hickory
I think the path to BEVs will be through PHEVs. As much as I read these days, more PHEVs are being introduced than BEVs.
https://www.motor1.com/news/514629/mazda-ev-phev-2025-plan/
https://www.motortrend.com/news/2022-mazda-mx-30-phev-rotary-range-extender-official/
This Mazda will use their rotary engine. It will be a serial drive.
https://www.bmw.ca/en/all-models/phev.html
Either way, a person or a country could use these vehicles to ride out a dramatic drop in oil/petrol supply as we expect with peak oil. Or handle a big rise in price .
I have two years experience with a plugin hybrid that got 32 miles electric range, and then over 500 miles of gasoline range. It was a pretty big vehicle- a van. The times I went to the gas station became rare, and over 75% of my miles was via plug-in at home with a regular outlet. Never charged it at some public station.
So I am very familiar with the benefits. And they are dramatic when it comes to saving on petrol (and saving money/mile). Also, the vehicle had great torque and acceleration when under electric power- Startling really.
I sold it when I moved because we needed a vehicle that could handle snow/ice and occasional trips on rough roads. None like that was available at time. Wish there had been.
Hick – R & D money and brains have been hitting the problems hard for the last 50 years. There, I fixed it for you.
Our entire electricity generation process over the last 50+ years could have been twice as efficient if we had “the battery issue” successfully, economically addressed. The electrification of things would 100 times more advanced too. It has been well understood that anyone who solves that or even improves on it significantly would be a mega millionaire right now. There has never been a shortage of R & D money and brains and there has never been a shortage “new and game changing” scams out there too. I know of two local start-up in my are that are total frauds but raking in massive VC.
lithium ion—
First commercialized in the early 90’s.
It has been a while comrades.
Hah- NETLEJ
Thanks for the fix.
I should say the global effort has massively escalated in the past 5-10 years, or so.
And yes Hightrekker. And the progress has been increasingly dramatic since then.
Anyone expecting the battery storage capability to be static is going to be left in dust of change.
A new thread on US November Oil Production has been posted.
https://peakoilbarrel.com/november-us-oil-production-surprises/#more-35150
A new open thread Non-Petroleum has been posted.
https://peakoilbarrel.com/open-thread-non-petroleum-january-31/