A guest post by Ovi.
All of the oil (C + C) production data for the US state charts comes from the EIAʼ’s Petroleum Supply monthly PSM.
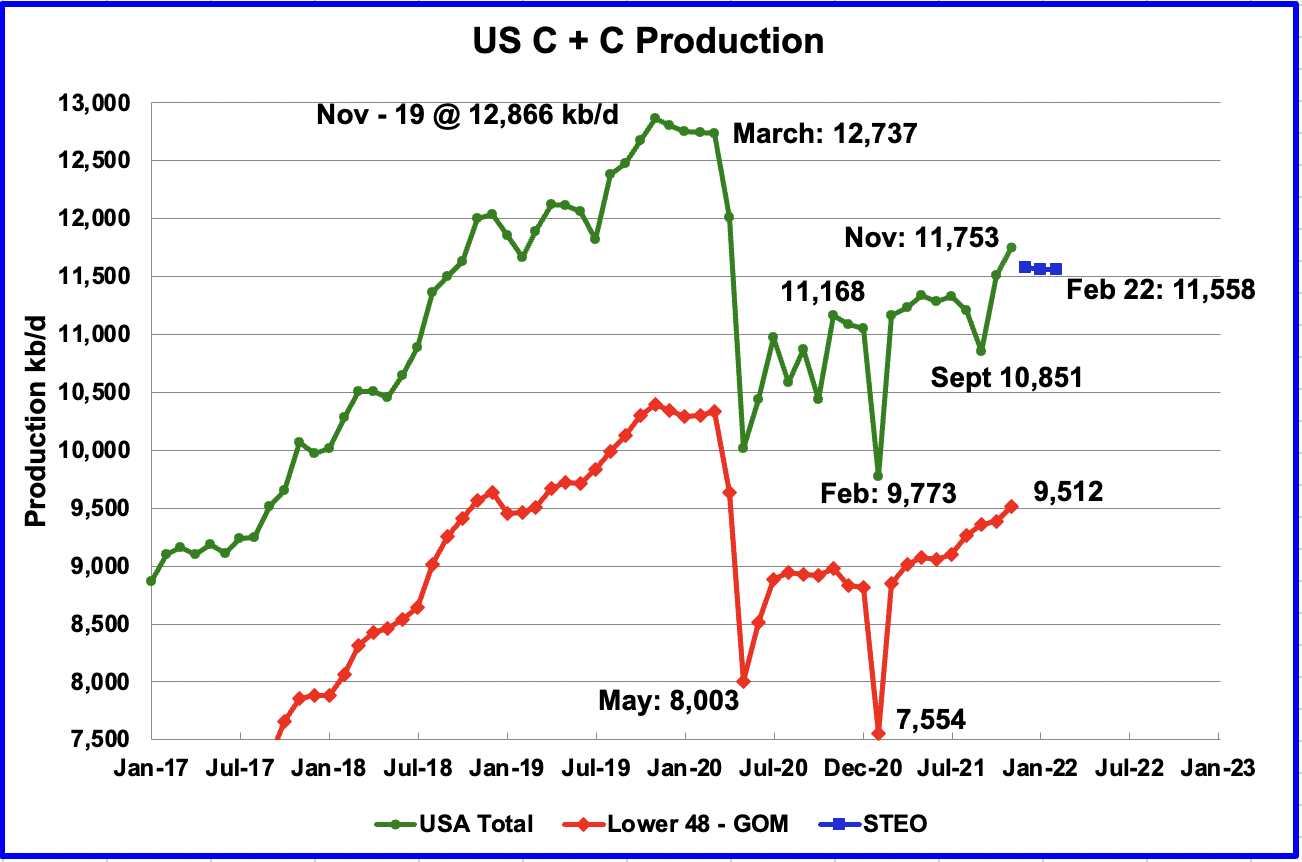
U.S. November production increased by a surprising 244 kb/d to 11,753 kb/d. The unexpected gain was due to a large production increase in the GOM, along with smaller gains in Texas, New Mexico and North Dakota. GOM output increased by an additional 108 kb/d over October after the damaged platforms were fully repaired and brought back on line.
The blue markers are from the January 2023 STEO and are forecasts for December to February production. While they seem low, they are consistent with the weekly EIA reports, which estimated November output to come in at 11,527 kb/d, low by 226 kb/d.
Overall, including revisions, November output is 280 kb/d higher than reported in the October report.
While overall US production was up, a better indication of the health of the US oil industry can be gleaned by looking more closely at the On-shore L48 states. In the On-shore lower 48, November production increased by 128 kb/d to 9,512 kb/d. The main contributors to the increase were Texas, New Mexico and North Dakota.
From July to November output in the Onshore L48 increased by 414 kb/d or at an average rate of 103.5 kb/d. Incredible
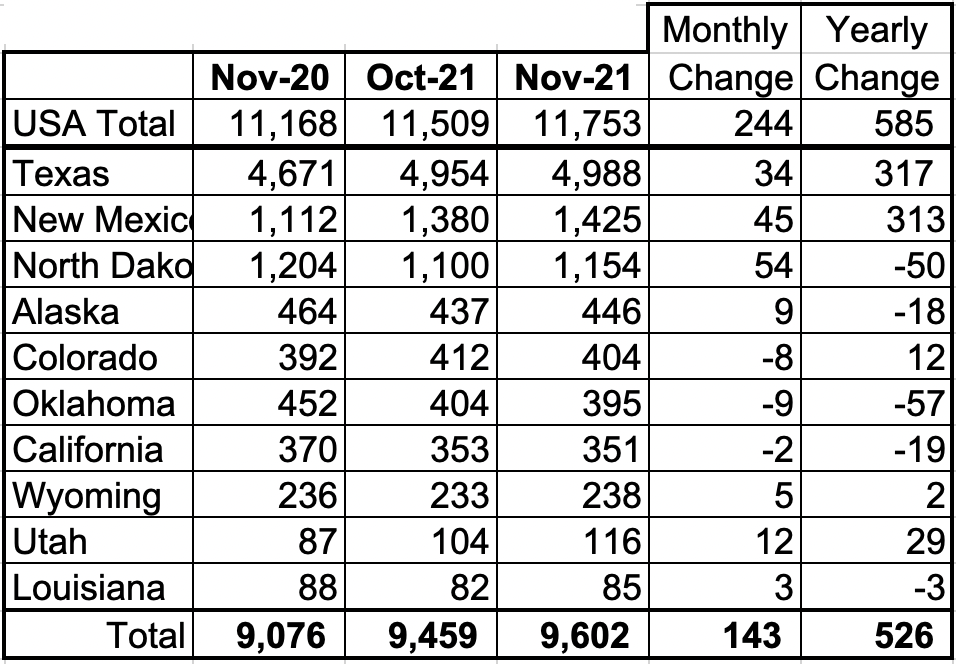
Listed above are the 10 states with the largest US production. These 10 accounted for 81.7% of US production out of a total production of 11,753 kb/d in November 2021.
On a YoY basis, US production increased by 585 kb/d.
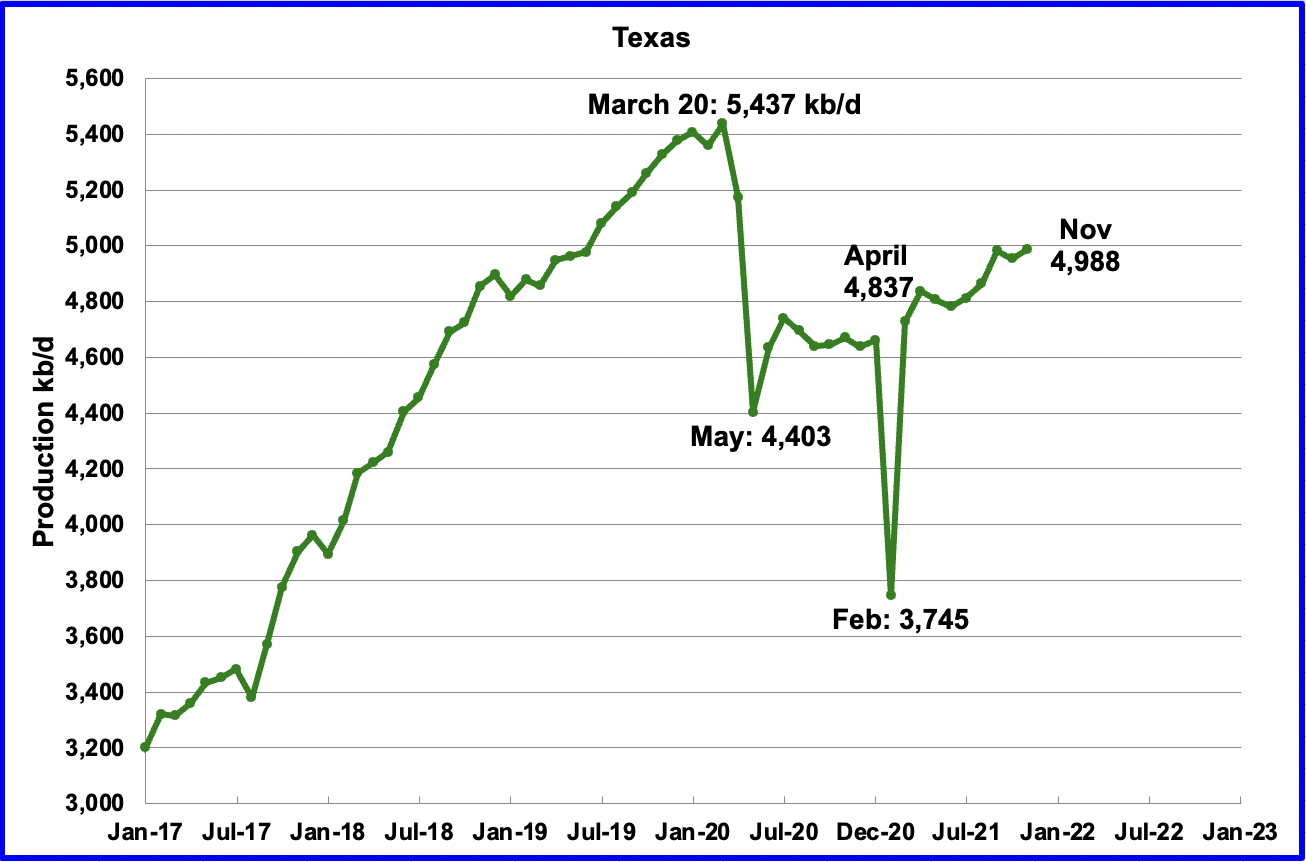
Texas production increased by 34 kb/d in November to 4,988 kb/d from 4,954 kb/d in October. Note that October’s output was revised up from 4,906 kb/d in the October report to 4,954 kb/d in this report.
In August there were close to 200 Hz oil rigs operating in Texas. By the last week of November, an average of 228 oil rigs were operating, an increase of 28 rigs. At the end of January 2022, 240 Hz oil rigs were operational.
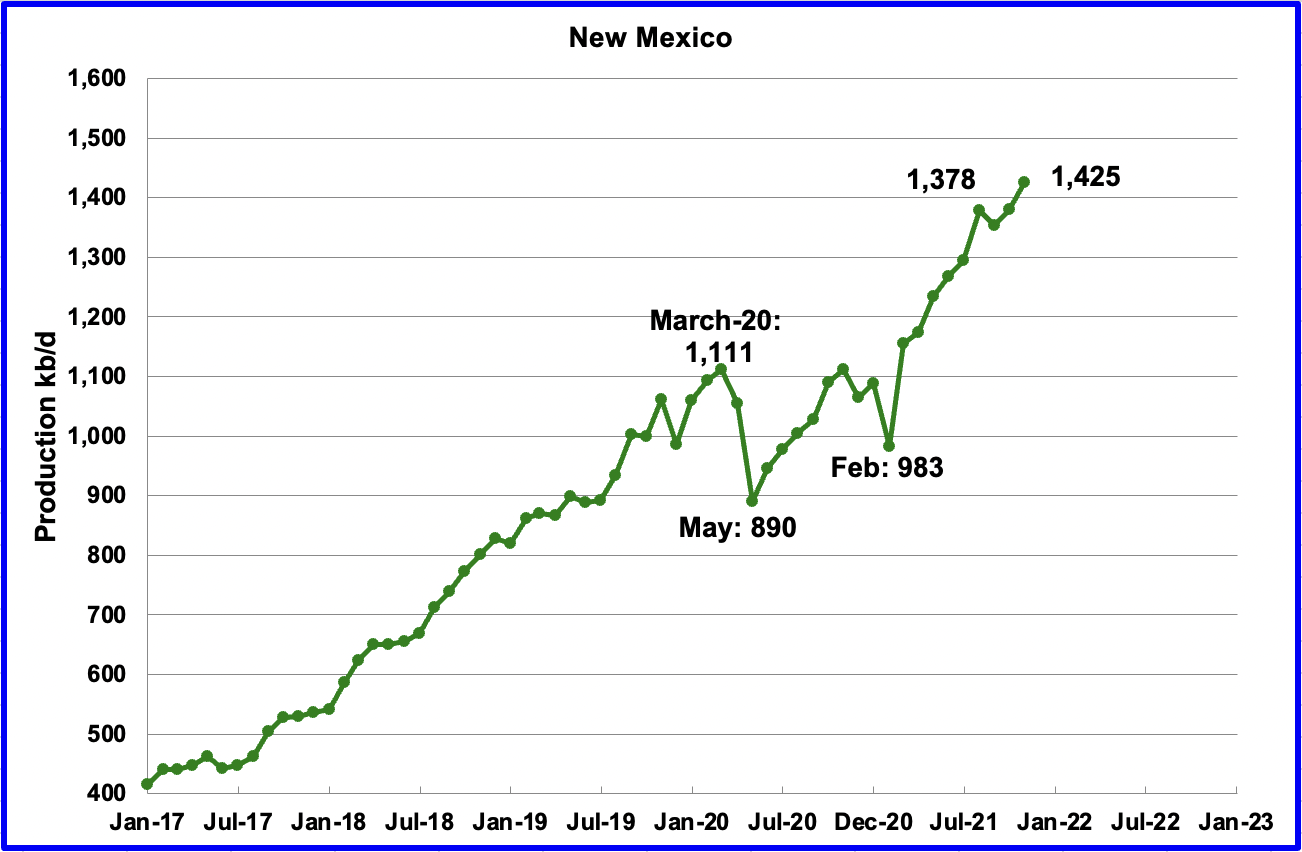
November’s New Mexico production rose by 45 kb/d to a new high of 1,425 kb/d. It should be noted the October output from the last report was revised up from 1,333 kb/d to 1,380 kb/d, so the overall increase relative to the October report is 92 kb/d.
On average since May 2020 with output at 890 kb/d, production has been increasing at an average rate of close to 30 kb/d/mth.
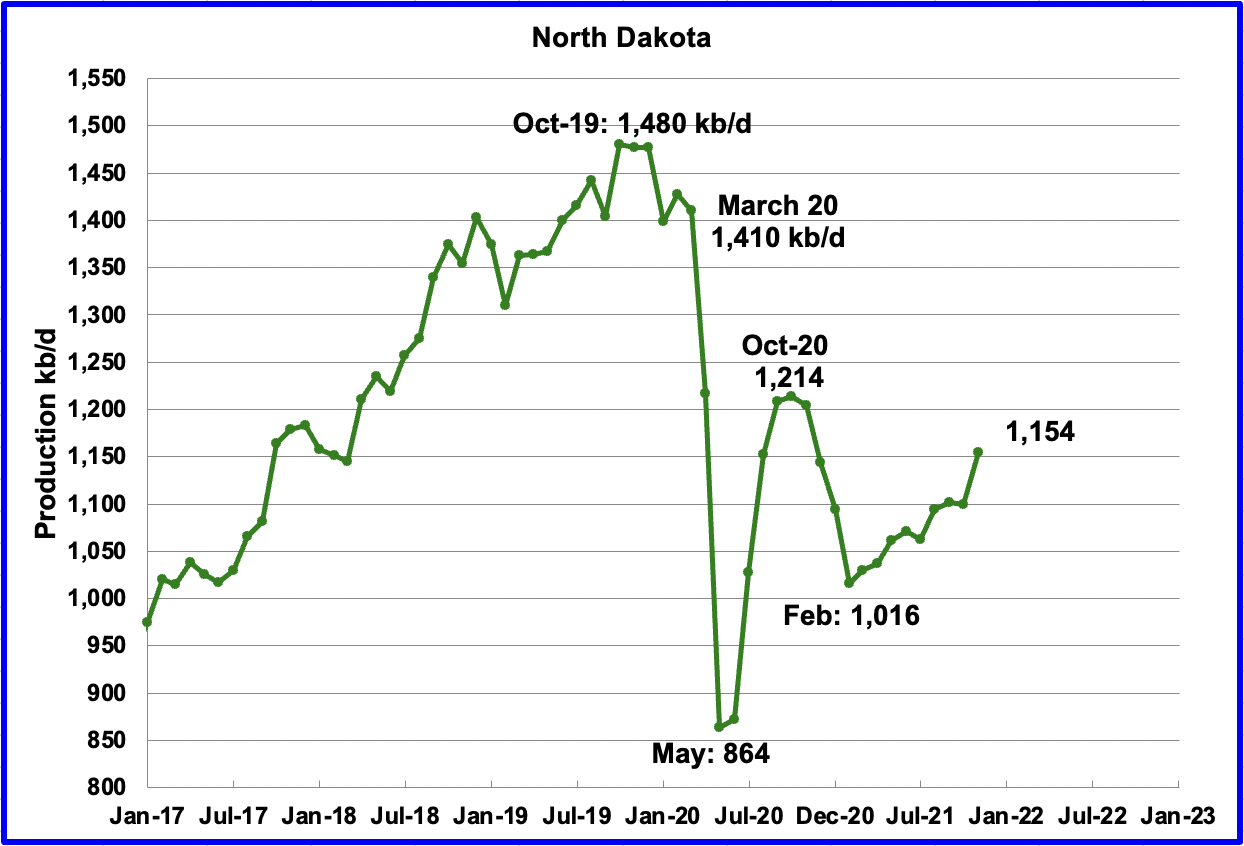
According to the EIA, North Dakota’s November output was 1,154 kb/d, an increase of 54 kb/d over October and an unexpected increase of 4.9%. North Dakota’s Oil and Gas website indicates it was 1,160 kb/d.
According to this source, “This is really the month we have been waiting for all year,” Lynn Helms, North Dakota’s mineral resources director, told reporters in a conference call. November oil production was the highest in North Dakota since December 2020.”
Another source reports that Helms said, “What we’re observing there is significant work in what we call Tier 2 and 3 areas outside the core areas as people are beginning to drill 3-mile laterals and different strategies to start developing that lesser developed area.”
A recent Rystad report also states that three mile laterals are becoming more common in the Permian. If this is also happening in the Permian, does this also imply/mean that drillers are moving out to Tier 2 and 3 areas in the Permian as a few of our contributors are saying? Also what is the trade-off of cost/revenue balance in using longer laterals in the Tier 2 and 3 areas?
Note this unexpected output increase in North Dakota was accurately reported in the EIA’s DPR and LTO reports below. At the same time, however, the DPR indicates that going forward, North Dakota’s output will increase at a more modest rate of less than 10 kb/d/mth over the near term.
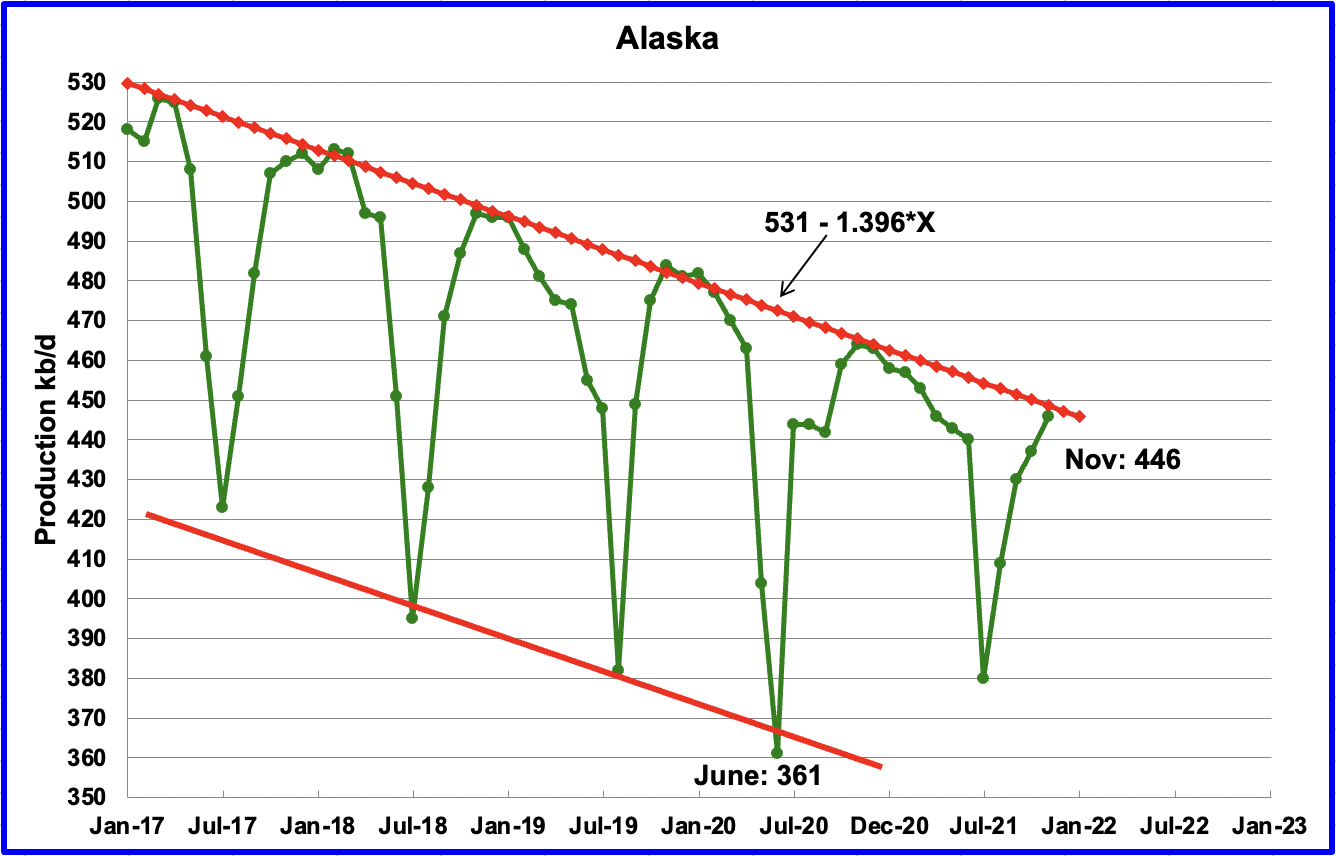
Alaskaʼ s November output increased by 9 kb/d to 446 kb/d as maintenance was completed. It will be interesting to see if December’s output exceeds the declining trend line.
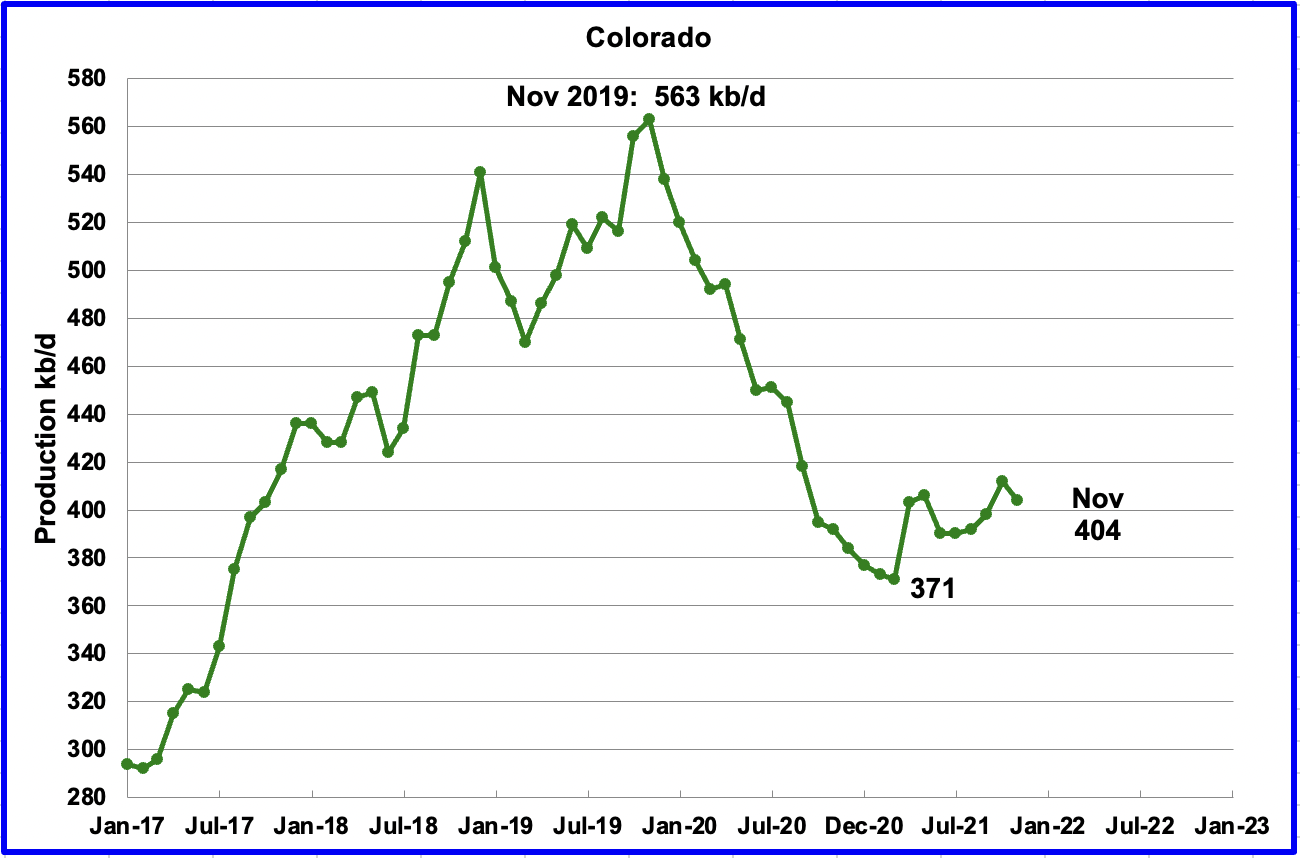
Coloradoʼ s November output decreased by 8 kb/d to 404 kb/d. Colorado had an average of 10 rigs operating in November up from 9 in September.
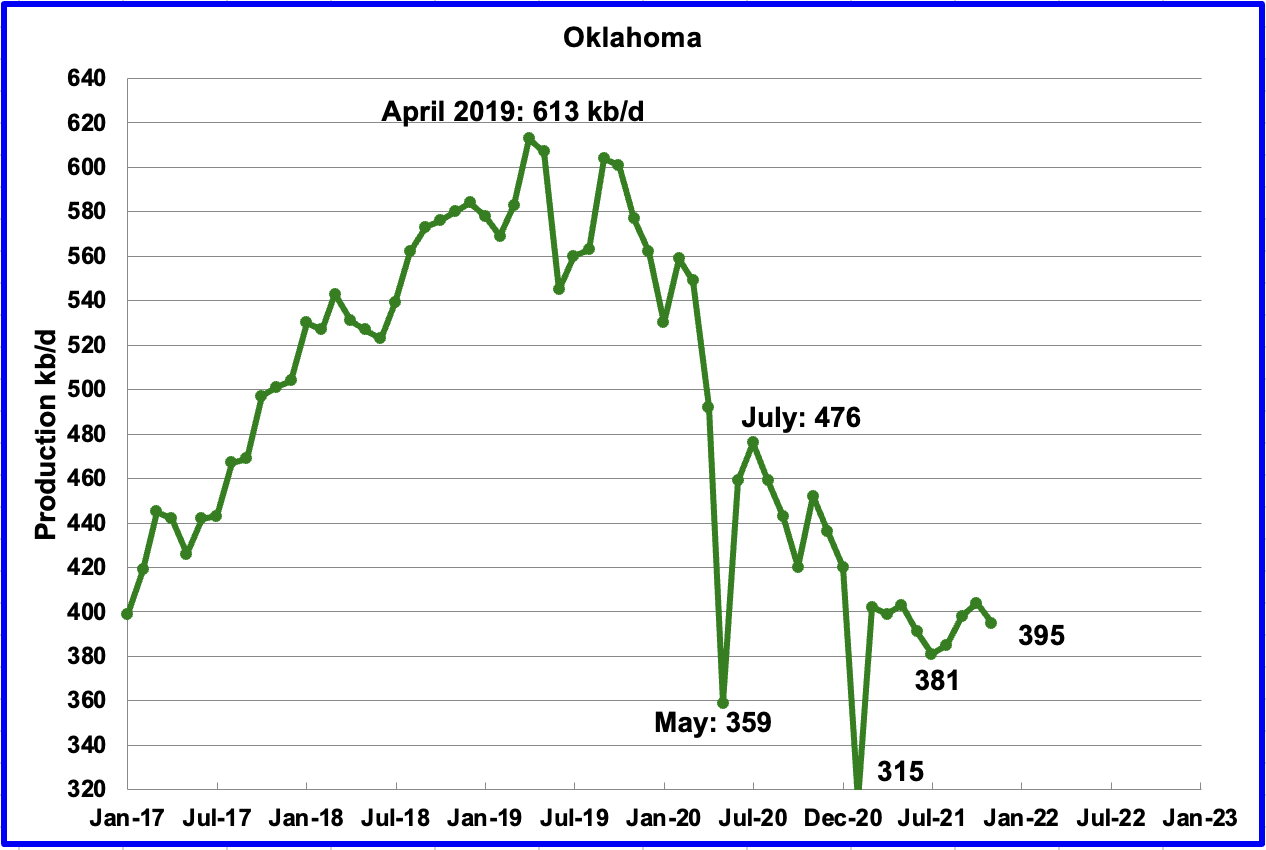
Oklahoma’s output in November decreased by 9 kb/d to 395 kb/d.
During August, Oklahoma had 29 rigs operating and by the end of January 2022 had increased to 50. The increase in the number of rigs has managed to stabilize the decreasing output trend which started in April 2019.
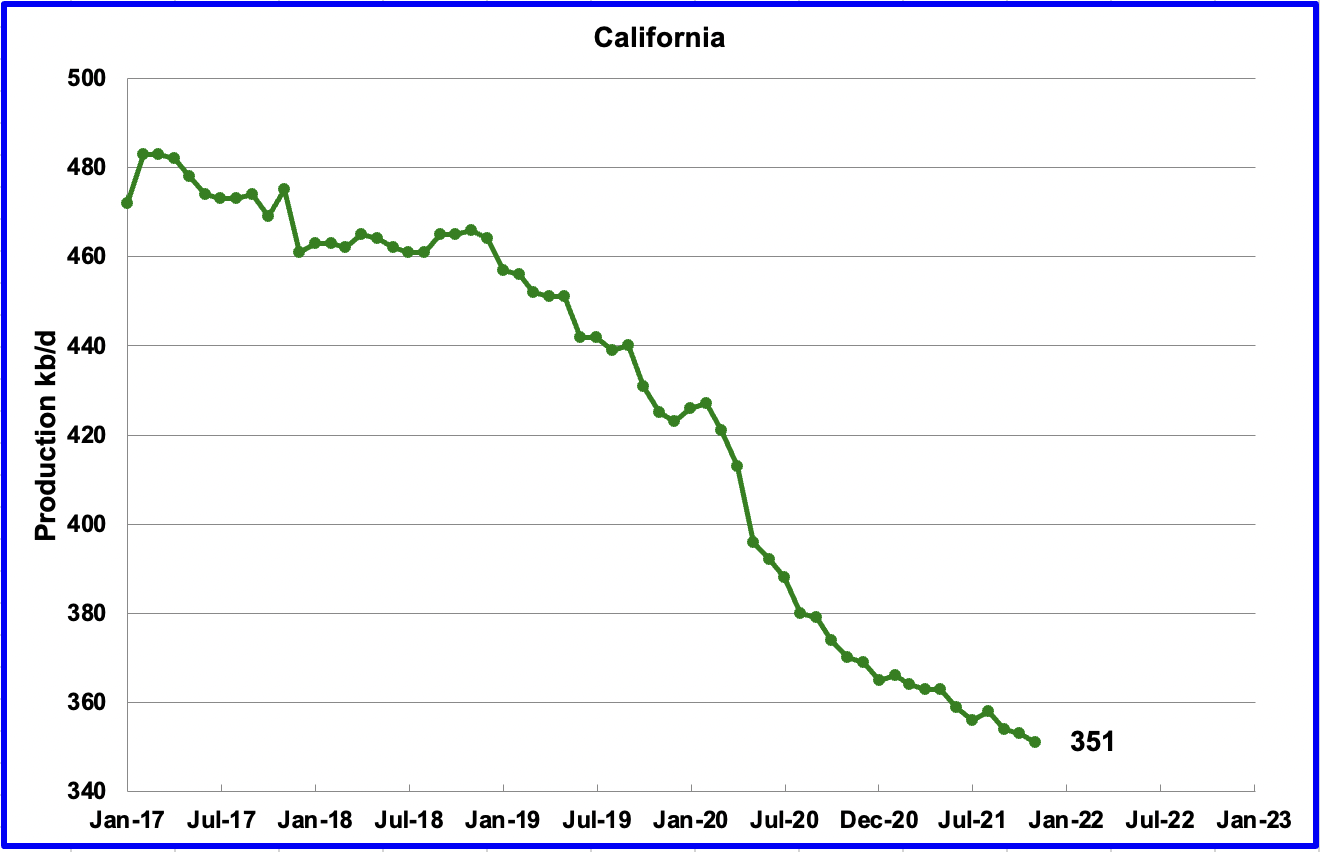
Californiaʼ s slow output decline continued in November. Output decreased by 2 kb/d to 351 kb/d.
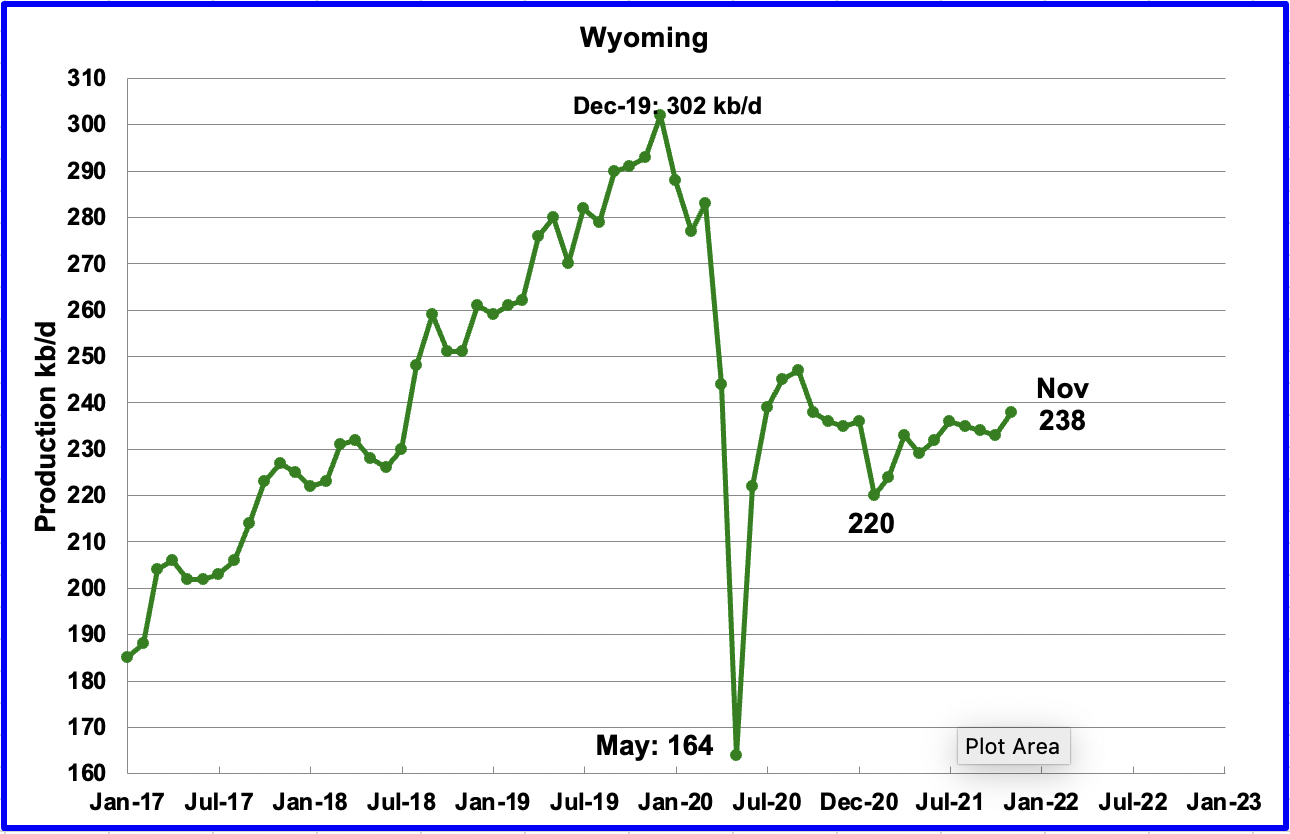
Wyoming’s production has been essentially flat since July when output was 236 kb/d. In November output increased by 5 kb/d to 238 kb/d.
Wyoming had 13 Hz oil rigs operating in September but by the end of January had decreased to 10.
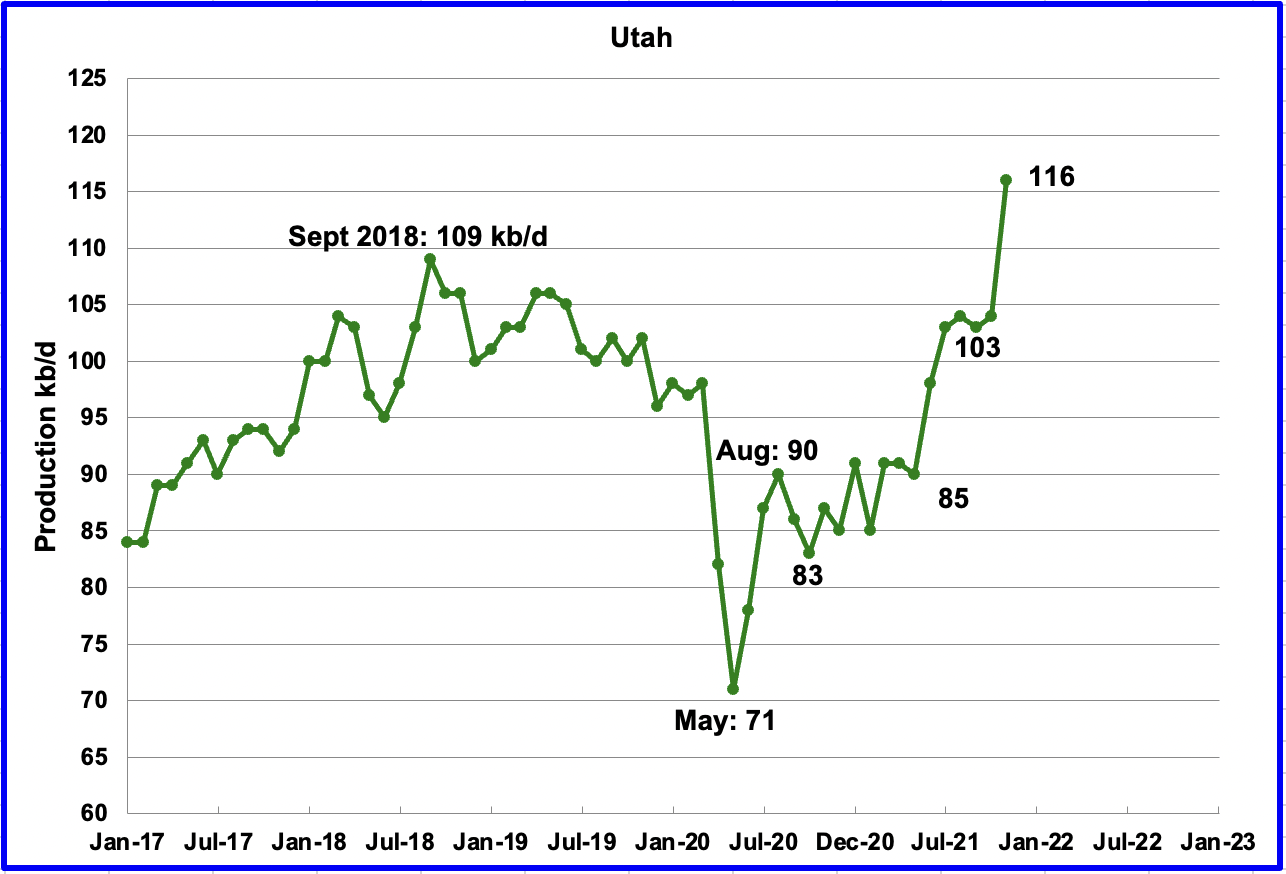
November’s production increased by 12 kb/d to a new record high 116 kb/d.
Utah had 6 oil rigs operating in September and for most of January had 5 operating. In the last week of January, operating rigs increased to 6.
While this is from an old article from August, it clearly states that Utah’s oil and gas industry is as busy now as it was during Trump’s ‘energy dominance’ era.
“While state and industry leaders forecast doom for energy development and rural employment from Biden’s moratorium, which they characterized as a “ban” on development, the exact opposite appears to be happening. Utah’s oil and gas sector is waking up from its pandemic-induced slumber despite obstacles put up by the climate-friendly Biden administration.
So what’s going on? The price of oil has shot past $70 a barrel. Energy companies are acting swiftly to increase production while prices remain high, said the Utah Division of Oil, Gas and Mining.“
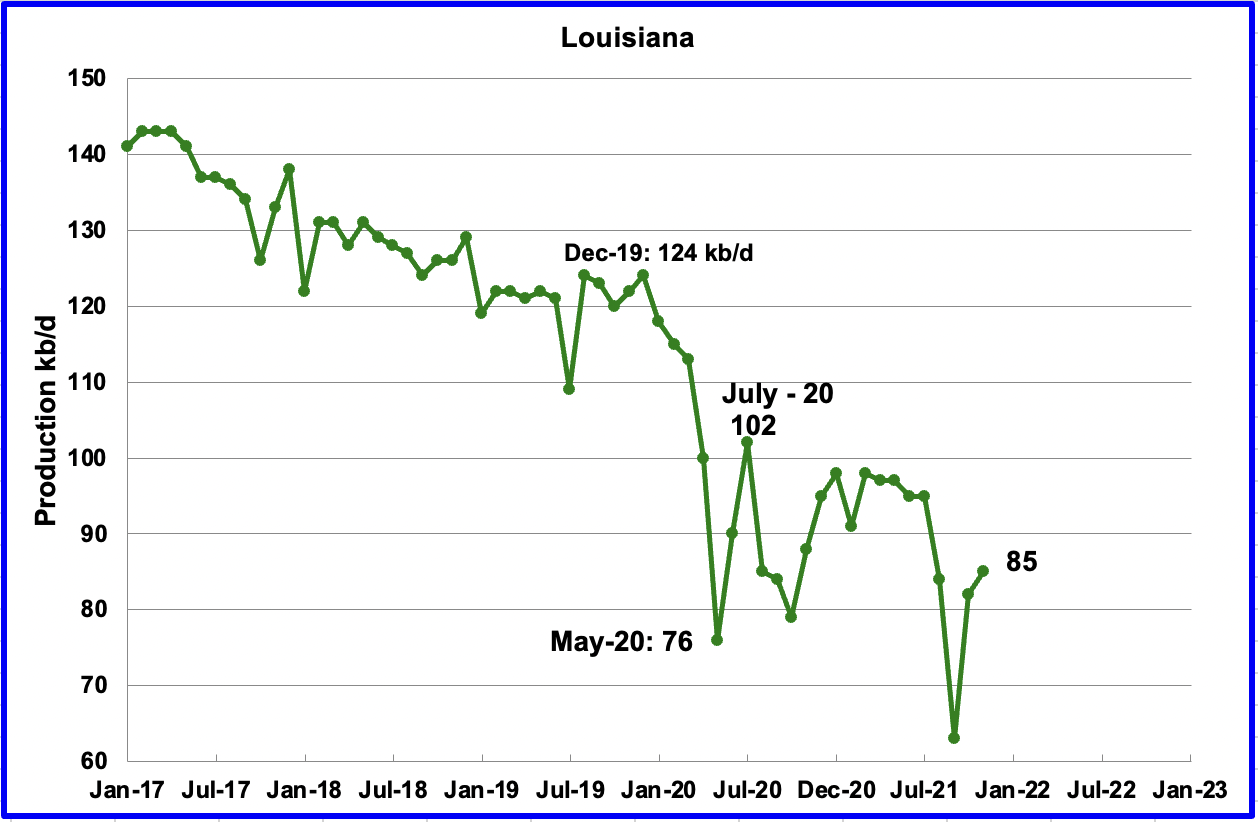
Louisiana’s output increased by 3 kb/d to 85 kb/d in November. Louisiana was one of the hardest hit states by hurricane Ida in late August. November’s output increase indicates that Louisiana continues its slow road to recovery.
Louisiana added 3 Hz rigs in January 2022 for a total of 4.
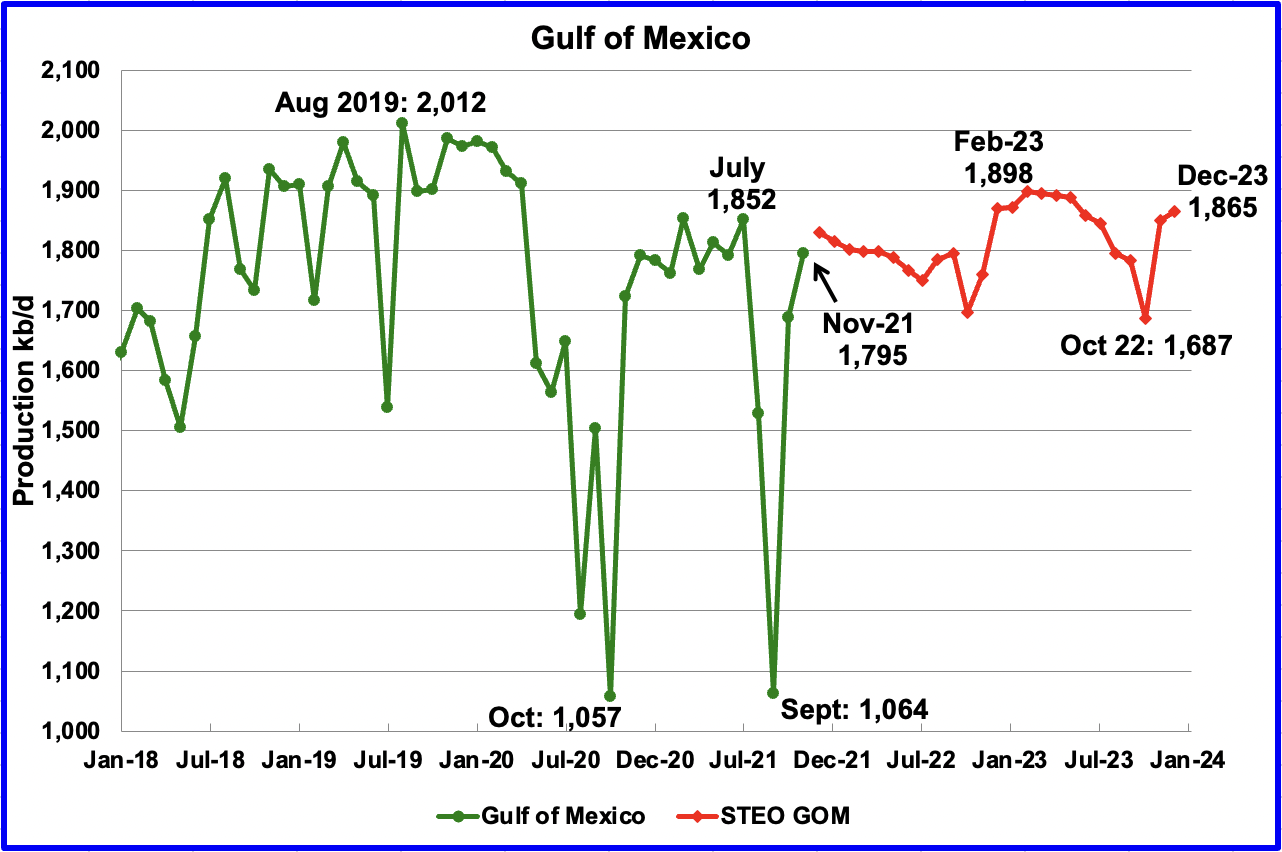
Production from the GOM increased in November by 107 kb/d from 1,688 kb/d to 1,795 kb/d. Note that October’s output was revised down from 1,744 in the previous report to 1,688 kb/d in the current one. If the GOM was a state, its production would normally rank second behind Texas.
The January 2022 STEO projection for the GOM output has been added to this chart and projects output will be 1,865 kb/d in December 2023. The January 2022 STEO forecast for the GOM output for November 2021 was 1,844 kb/d, too high by only 49 kb/d.
A Different Perspective on US Oil Production
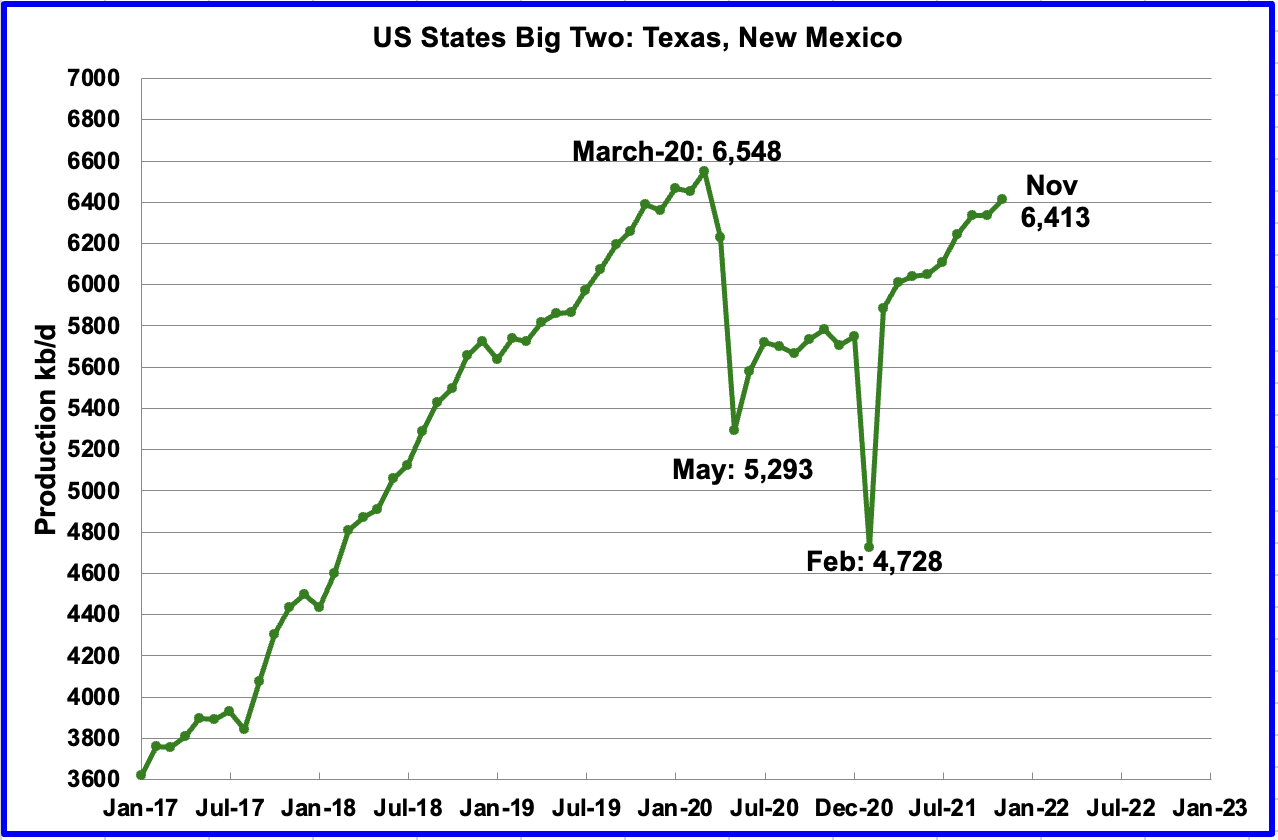
The Big Two states, Texas and New Mexico
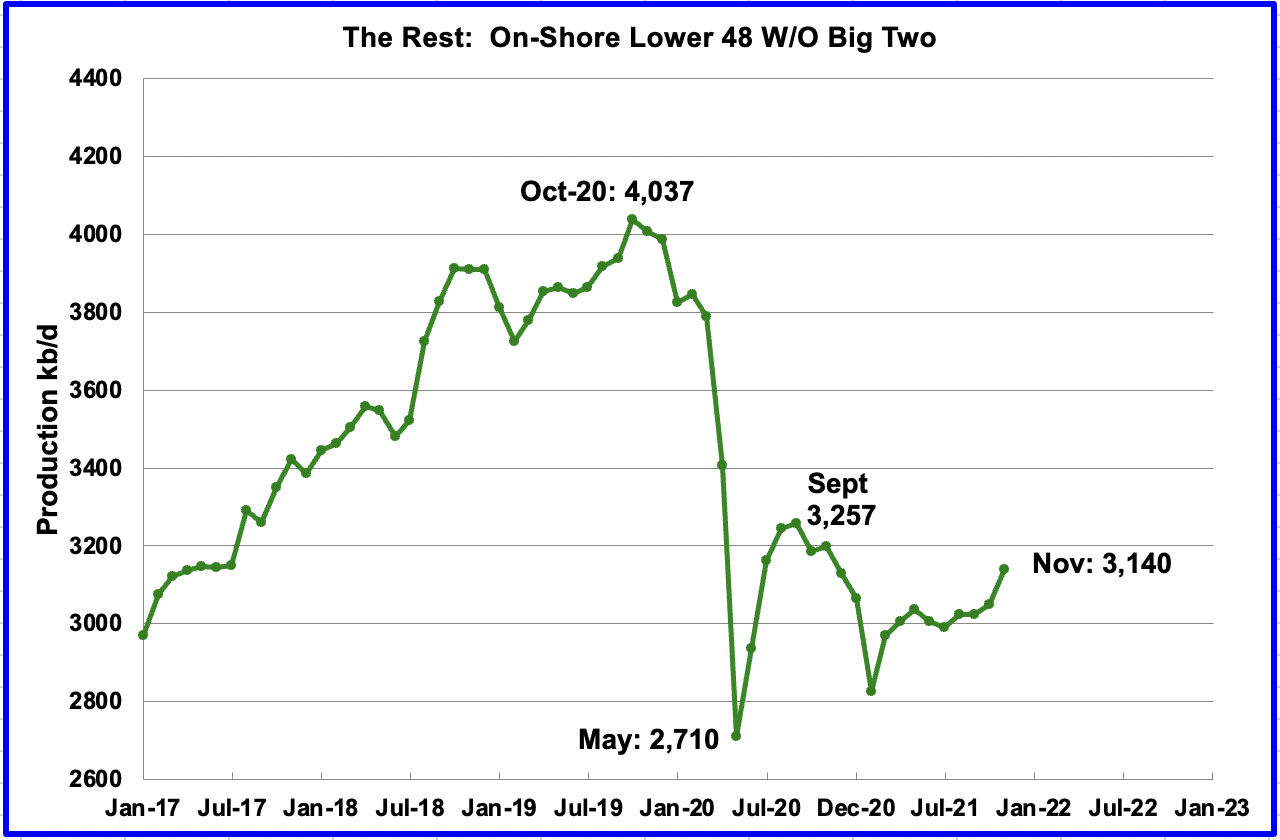
The Rest
To get a different perspective on US oil production, the above two charts have broken US production into “The Big Two” and the “On-Shore L48 W/O Big Two” or The Rest.
Increasing production has returned to the Big Two states. Last month’s drop may be related to delays in information updating. While October showed a production drop last month, updated data shows that September and October output were essentially flat.
The big surprise is the large increase of 90 kb/d in the Rest of the L48 states. The main contributors to the increase were North Dakota, 54 kb/d, and Utah 12 kb/d.
Rigs and Fracs
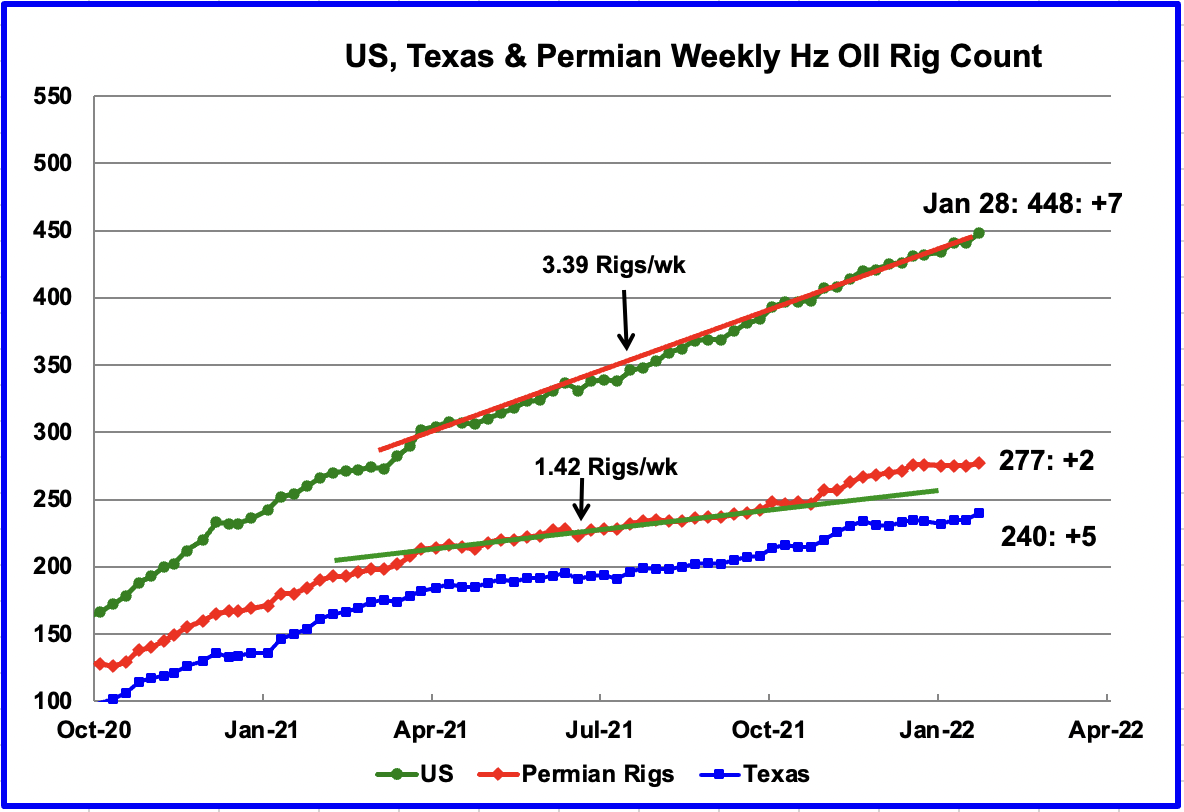
Since the beginning of April 2021, the US has been adding Hz oil rigs at a rate of close to 3.39 rigs/wk. Of these, the Permian has been adding 1.42 rigs/wk over the period April to October 2021. This means that more rigs were being added in other basins and states. The total Hz oil rig count for the week ending January 28 was 448, an increase of 7.
Since the end of October, the addition of Hz rigs in the Permian basin accelerated over the average rate as the red graph broke away to the upside from the green trend line. However the rate of adding rigs has slowed in January 2022. Could be related to a longer Xmas break. In the week ending January 28, the Permian Hz oil rig count increase by 2 to 277.
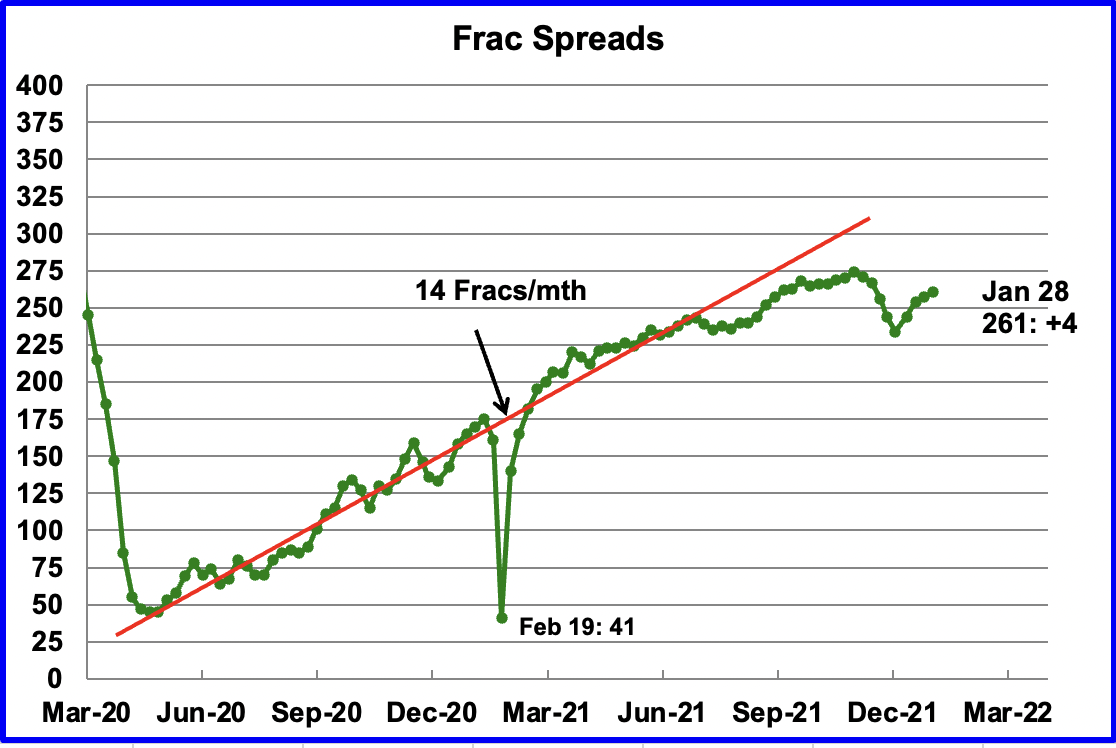
Starting from the week of July 23, 2021, frac spreads were not added at the previous rate of approximately 14 spreads per month. During December 2021, 37 Frac spreads were decommissioned primarily due to the holidays and dropped to a low of 234. During the month of January, 27 frac spreads were reactivated. In the week ending January 28, 4 were added for a total of 261.
Note that these 244 frac spreads include both gas and oil spreads, whereas the rigs information is strictly oil rigs.
WTI
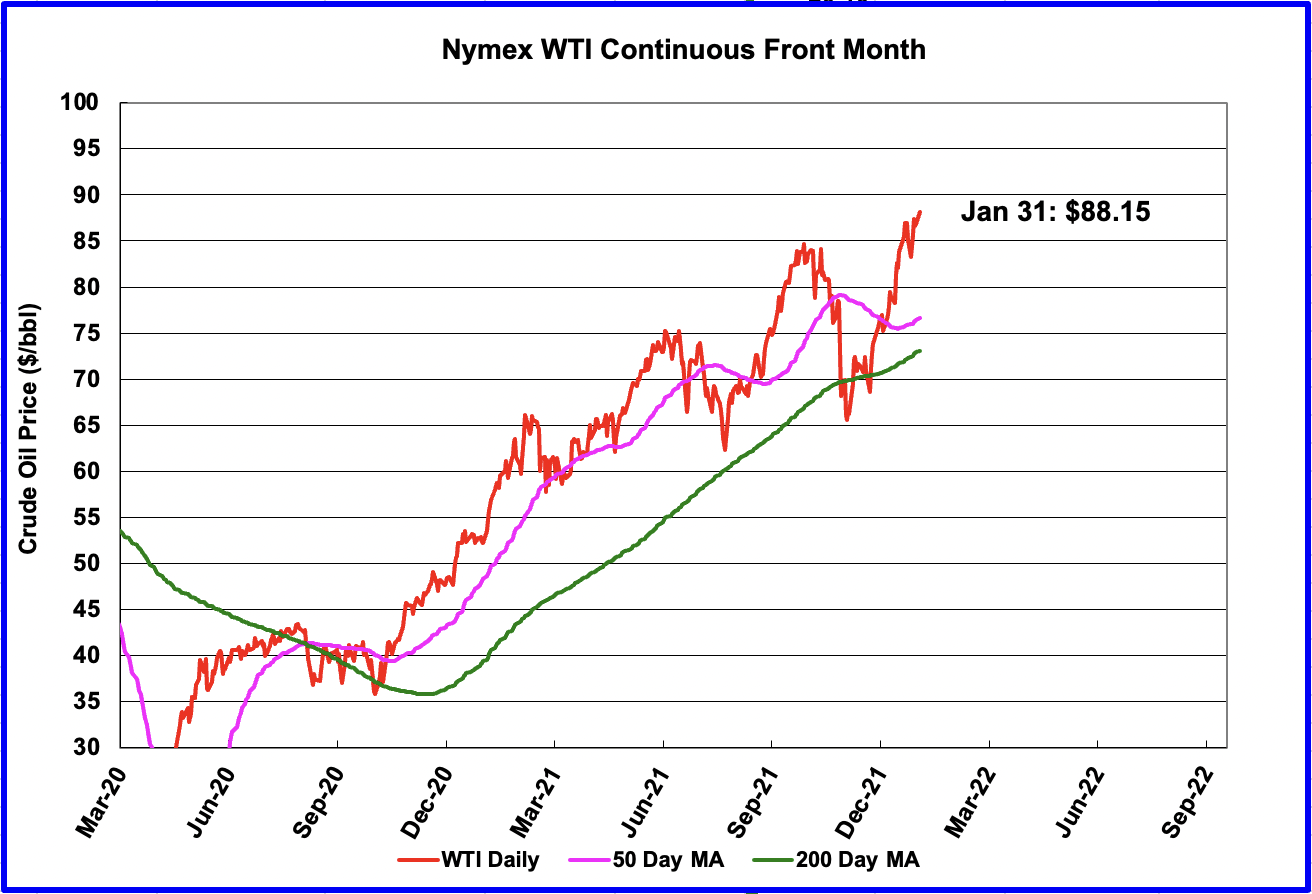
The WTI March contract settled on January 31 at $88.15/b, a new local high, last seen in 2014. See next chart.
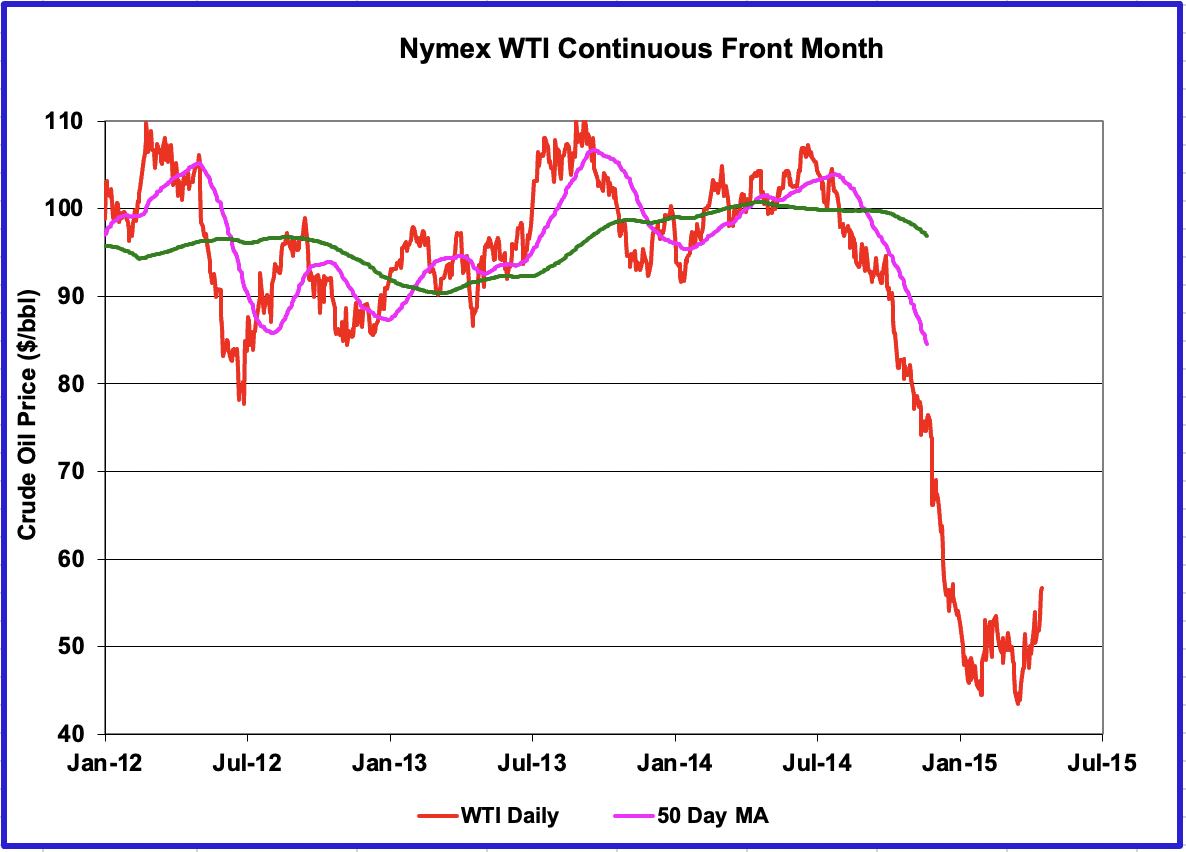
WTI rebounded to $110 in early 2012 and again in 2013. The $110/b level will provide major resistance to WTI’s upward trend.
1) Short Term Energy Outlook (STEO)
The January 2022 STEO extends the EIA’s projections out to December 2023.
It provides projections for the next 26 months, starting with November 2021 to December 2023, for US C + C, OPEC and other oil production related parameters.
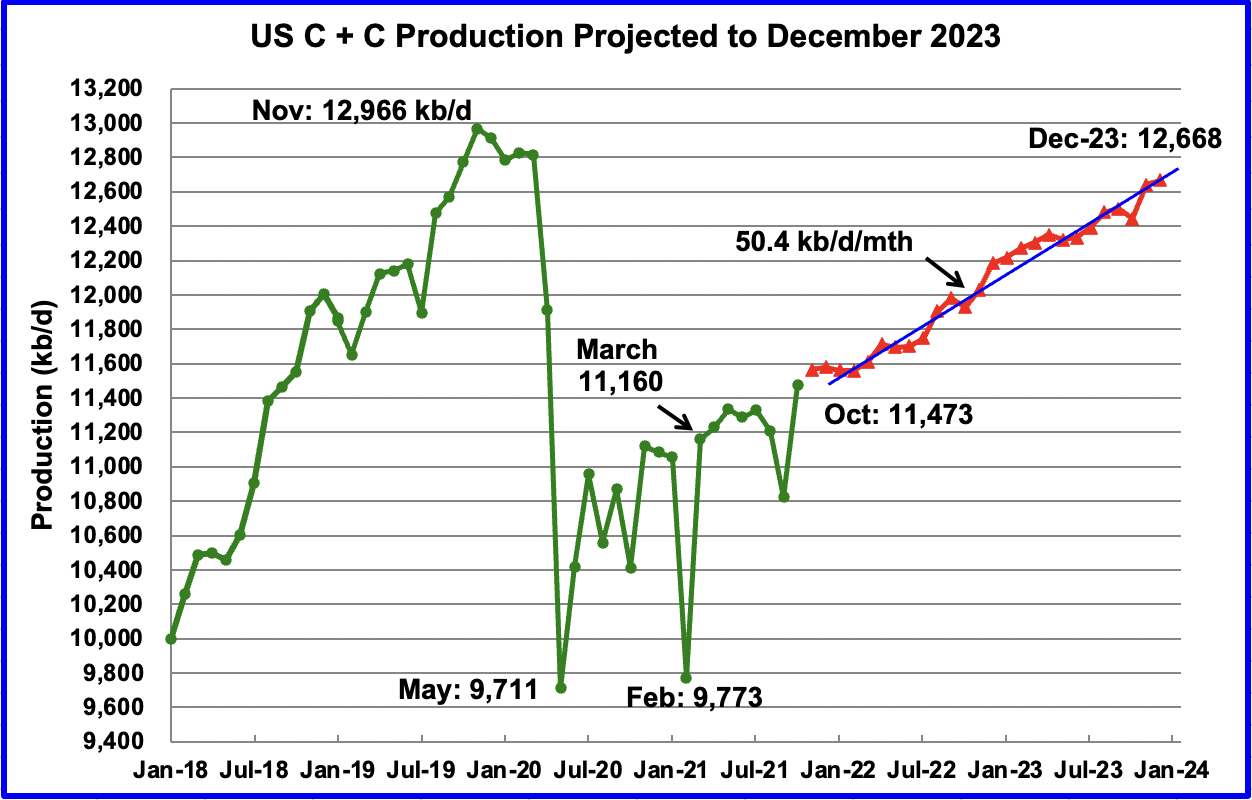
The January STEO has revised downward its projected US oil output from March 2022 to December 2022. Output from November 2021 to March 2022 will remain relatively flat at close to 11,550 kb/d.
From March 2022 to December 2023 production will increase at an average rate of 50.4 kb/d/mth, ending at 12,668 kb/d in December 2023. This monthly increase is down from the previous monthly increase of 83 kb/d/mth from July 2021 to December 2022 shown in an earlier STEO post.
If the lower rate of monthly production increase is correct, the projection is music to the ears of OPEC because if yearly demand growth rate returns to the expected pre-covid rate of 1.0 Mb/d by mid 2022, this means that OPEC can continue to increase their production without fear of lowering the oil price, provided they can increase their output.
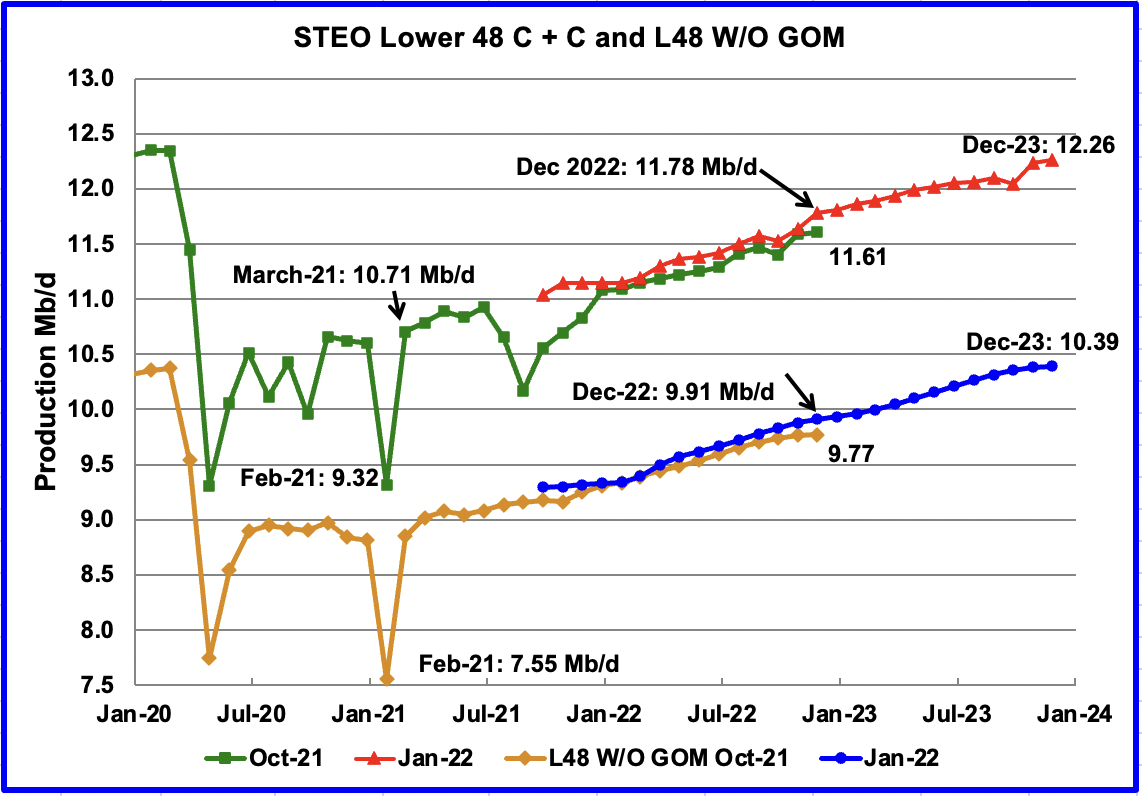
This chart compares the STEO’s forecast from the October report with the current January 2022 report to better illustrate how the January 2022 output forecast changed the October 2021 predictions. For the Lower 48, the December 2022 output has been revised up by 170 kb/d from 11.61 Mb/d to 11.78 Mb/d.
The January STEO output projection for the Onshore L48 states has also been revised to show increased production in H2-22. The output projection for December 2022 has been increased by 140 kb/d to 9.91 Mb/d from the previous forecast of 9.77 Mb/d. From February 2022 to December 2023 output is forecast to increase at an average rate of 47.7 kb/d/mth.
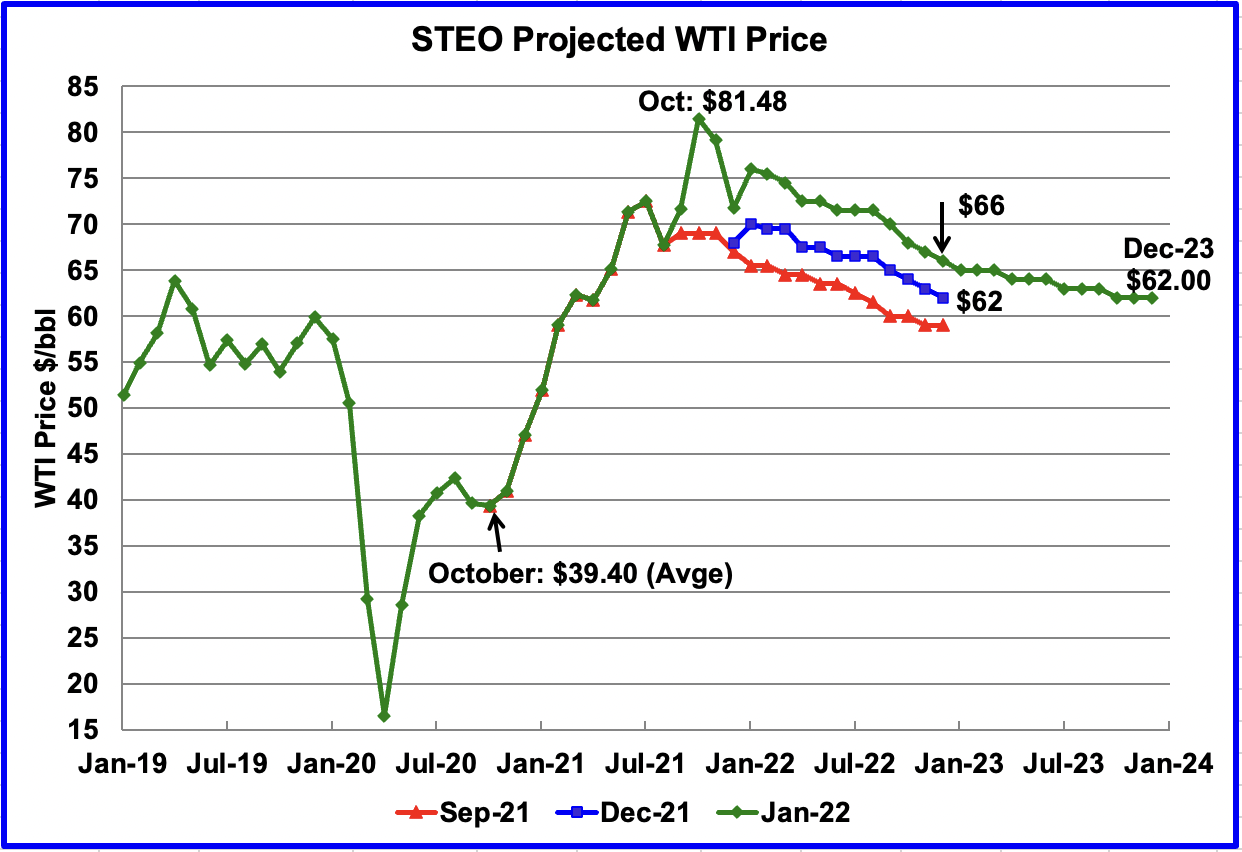
The January 2022 STEO oil price forecast continues to show a steady decline from the October 2021 peak of $81.48/bbl to $62/bbl in December 2023. Note that the STEO has just moved their $62 price target from December 2022 to December 2023. Essentially they are continuing to say that the only direction for the price of WTI going forward is down to $62.
The big forecast change for WTI occurred in updating from the September 2021 report to the December 2021 report to January 2022. The major change in the current January forecast is an increase in the average WTI price by approximately $4/bbl over the December report and moving their $62/bbl out to December 2023.
The March WTI contract settled at $88.15 on January 31, $13.65 higher than the EIA’s forecast of $74.50 for the March contract and higher than the EIA’s October peak of $81.48/b
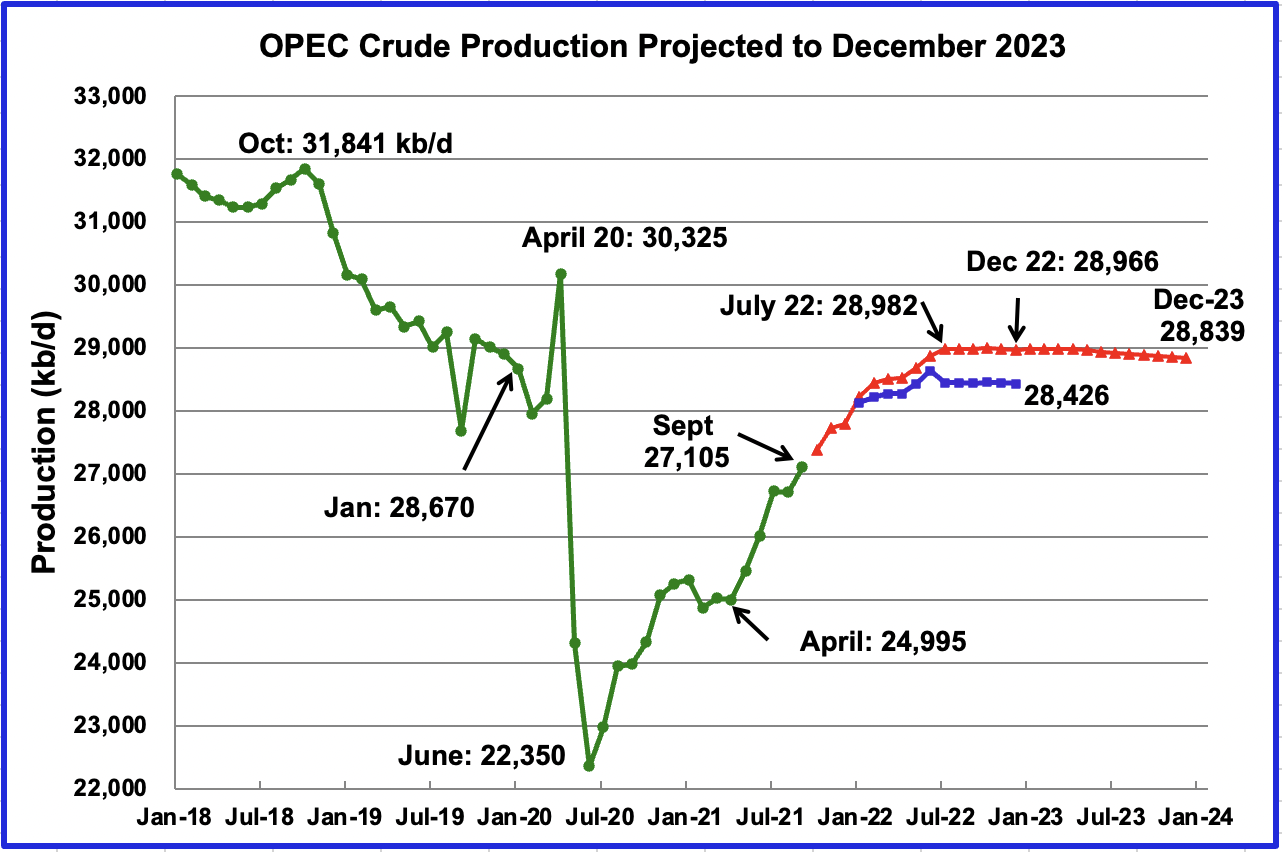
This chart shows the STEO’s January forecast for OPEC crude output to December 2023 compared to their December 2022 forecast. (Blue markers) The output from July 2022 to December 2022 has been increased by approximately 450 kb/d in going from the December report to January. No reason was provided.
OPEC’s output is projected to increase from September 2021 to July 2022 by 1,877 kb/d to 28,982 kb/d. After July 2022, output is essentially flat at close to 28,900 kb/d out to December 2023.
For December 2021, the EIA STEO forecast OPEC production to be 27,790 kb/d. Actual December production as reported by OPEC was 27,882 kb/d, higher by 92 kb/d. A reasonably accurate projection by the EIA.
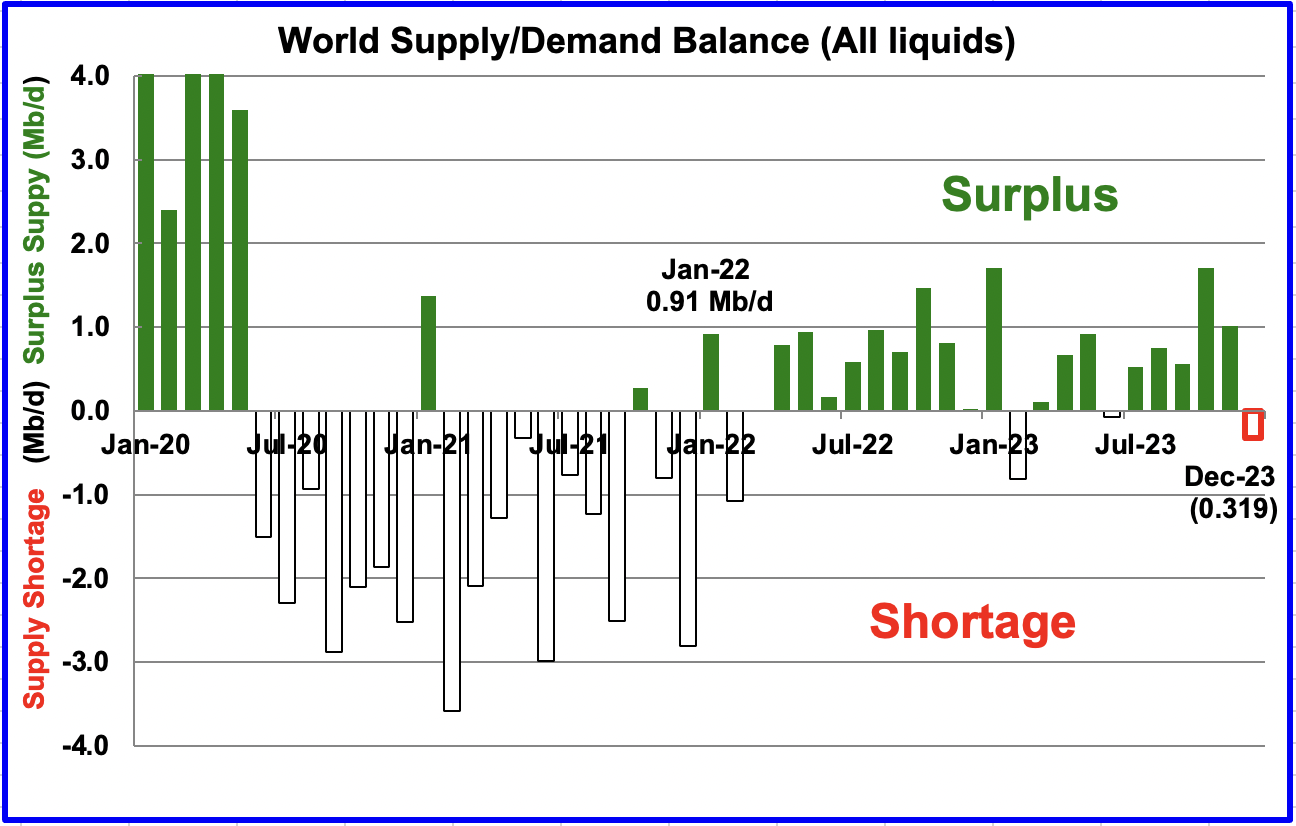
This chart shows the historical world supply/demand balance up to November 2021 and after that, the EIA’s forecast out to December 2023. From January 2022 to December 2023, the STEO is forecasting an average monthly surplus of close to 726 kb/d. However this surplus will be used primarily to refill the worlds inventory. For instance, US total inventory in late January 2022 is down by 107 M barrels from January 22, 2021
This expected surplus between January 2022 and December 2023, along with the variant, Omicron, and the US SPR release may make OPEC + reconsider their planned monthly 400 kb/d production increases somewhere in second quarter of 2022. However, as the price of Brent and WTI continue to increase beyond $85/5, there is no indication at this time that they are thinking of cutting back.
2) Drilling Productivity Report
The Drilling Productivity Report (DPR) uses recent data on the total number of drilling rigs in operation along with estimates of drilling productivity and estimated changes in production from existing oil wells to provide estimated changes in oil production for the principal tight oil regions. The January DPR forecasts production to February 2022 and the following charts are updated to February 2022.
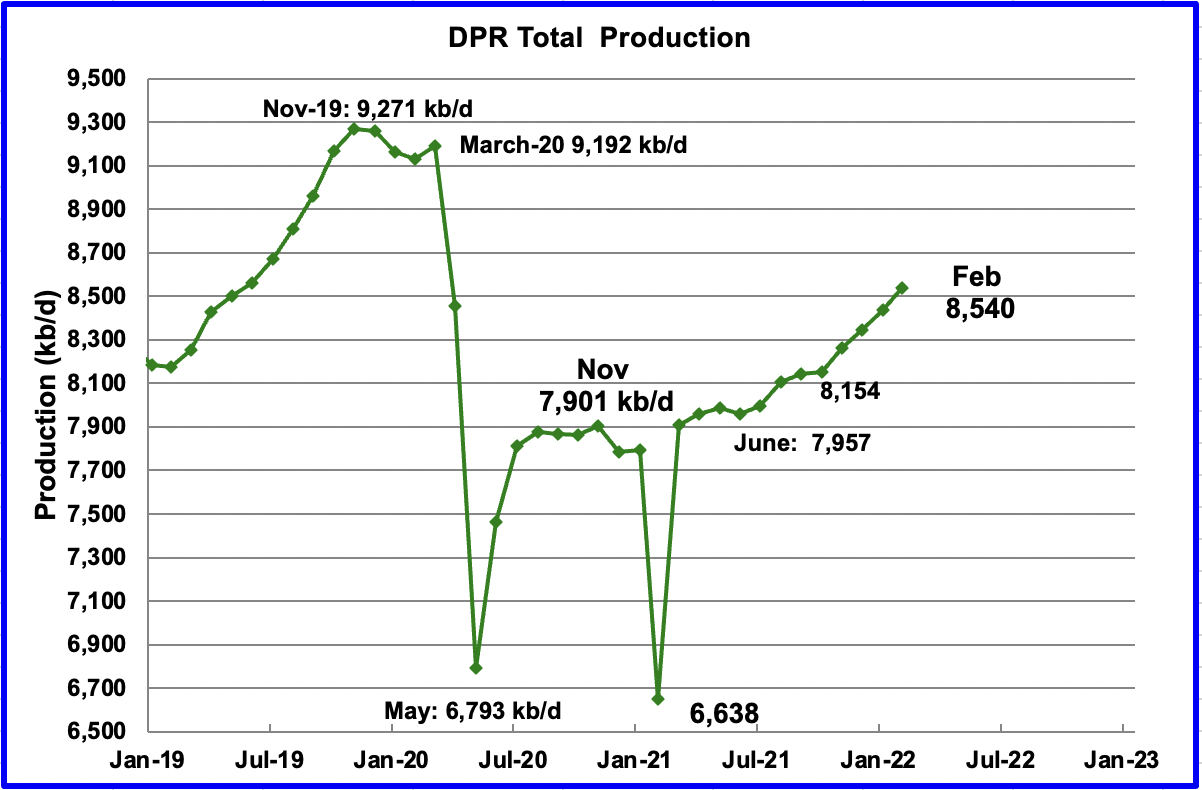
Above is the total oil production from the 7 DPR basins that the EIA tracks, projected to February 2022. Note that the DPR production includes both LTO oil and oil from conventional fields.
The DPR is projecting that output for February 2022 will increase by 105 kb/d over January to 8,540 kb/d. From October 2021 to February 2022, output in the DPR basins is forecast to increase by 386 kb/d or 96.5 kb/d/mth and appears to be accelerating since February added 105 kb/d. The Permian basin is the primary contributor to the US production increase.
If the average output rate of 96.5 kb/d/mth were to continue for another year, this would add 1,158 kb/d/yr to US production, which could potentially begin to disrupt world oil supply and cap the increase in the price of oil to below $100/bbl.
This output rate projection of 96.5 kb/d/mth is in sharp contrast with the STEO forecast above. It indicates that from November 2021 to March 2022, output will remain essentially flat at close to 11,550 kb/d and then start to increase at a rate of 50.4 kb/d/mth out to December 2023, essentially 1/2 the rate indicated in the STEO.
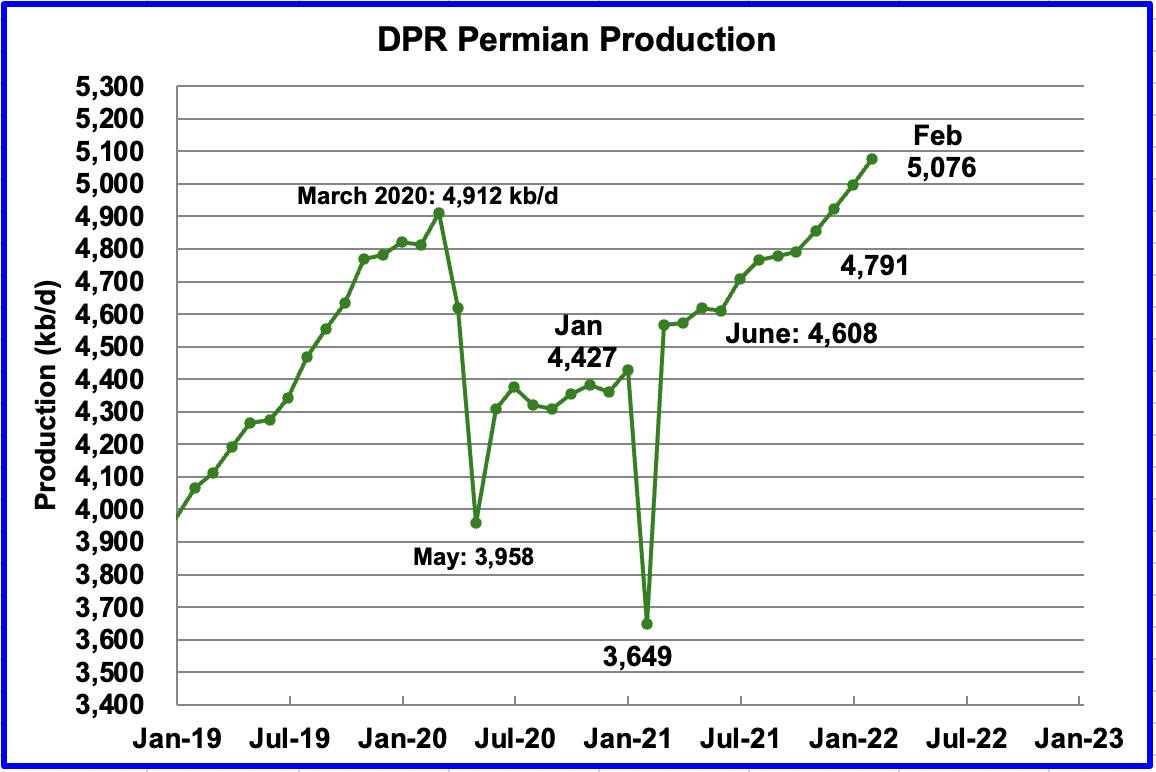
Permian output is projected to exceed 5,000 kb/d in February to a new production high of 5,076 kb/d. From October to February, production is forecast to increase by 285 kb/d or at an average rate of 71.3 kb/d/mth.
During December, 315 wells were drilled and 406 were completed in the Permian. The completed wells added 324 kb/d to the forecast December output for an average of 798 kb/d/well. The overall decline was 254 kb/d which resulted in a net increase of 70 kb/d. Of the 405 completed wells, 319 were required to offset the decline. It is the completion of the additional 87 DUCs, over and above those drilled, that accounts for the increase in the production in the Permian.
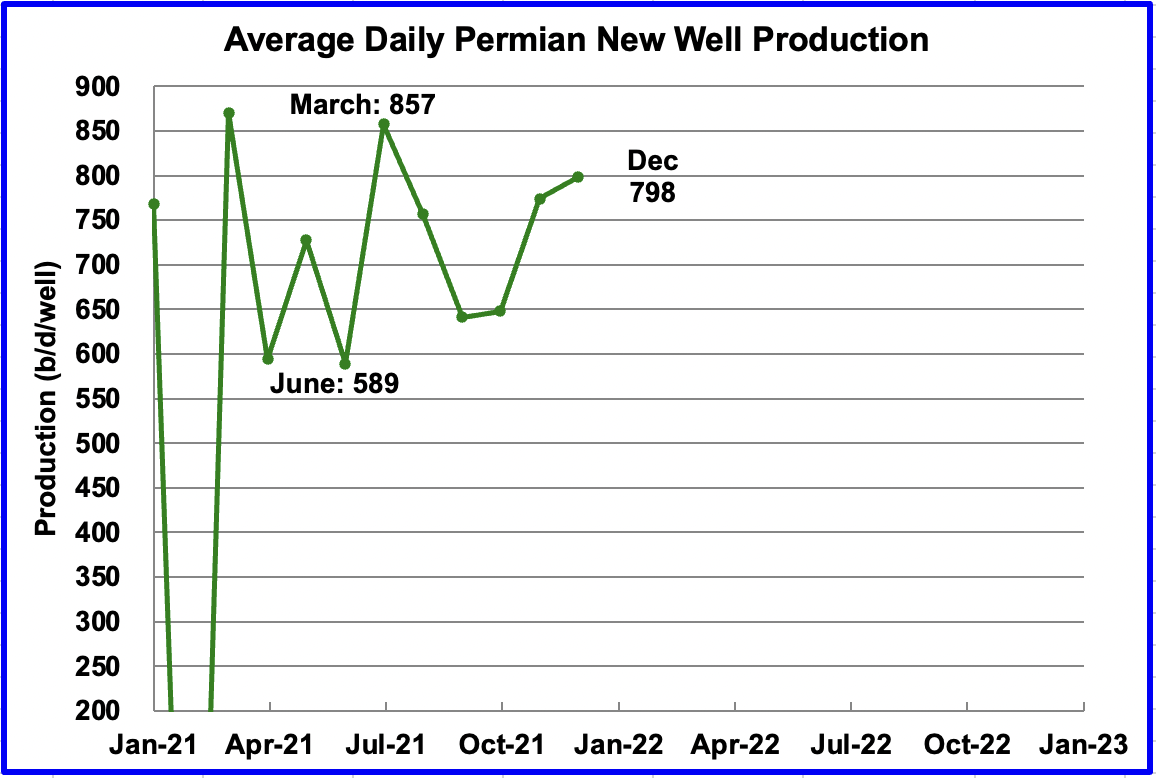
This chart shows the daily production from the average new Permian well tracked on a monthly basis. The daily output from new Permian wells was divided by the number of completed wells, as reported in the DPR and DUC reports.
For instance, during December, the new wells produced 324 kb/d from 406 wells for an average of 798 b/d/well. The DPR back checks their earlier estimates and it appears that the average first month output is increasing and moving closer to 800 kb/d. Well production data was only available up to December to make this estimate.
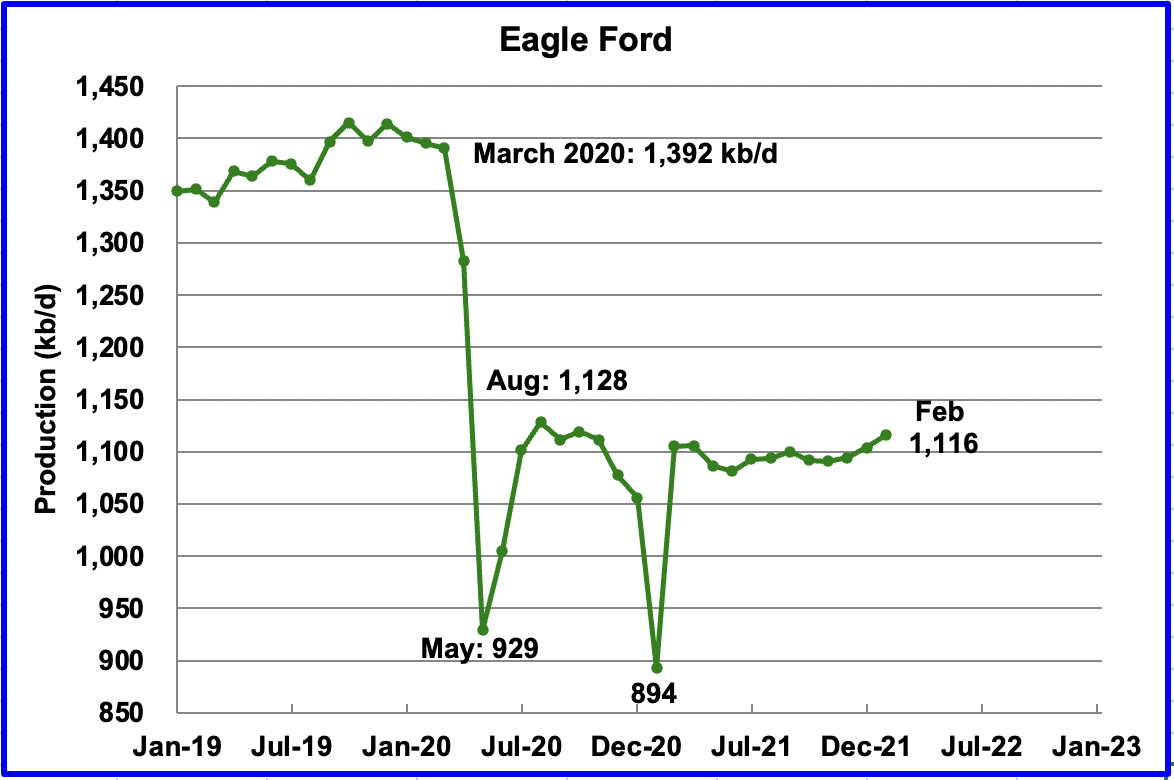
Output in the Eagle Ford basin has been showing an increasing trend since September 2021. For February, output is expected to increase by 12 kb/d to 1,116 kb/d.
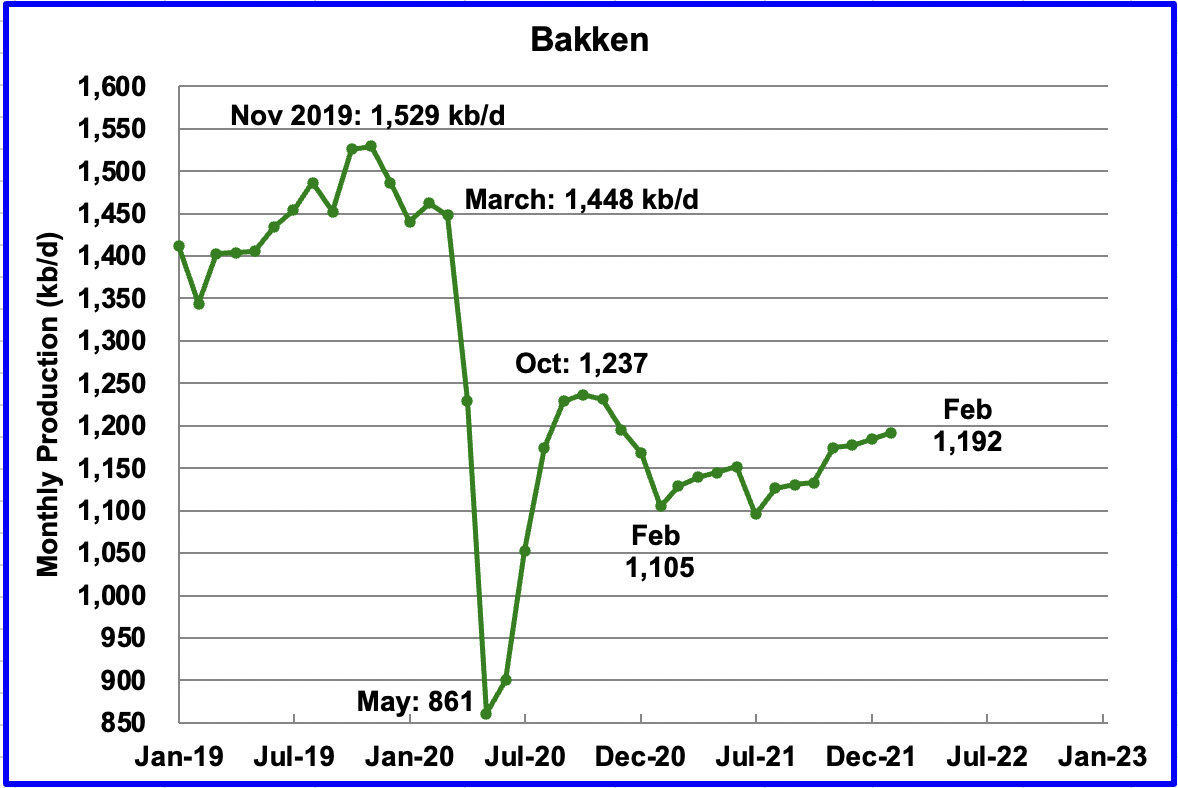
The DPR forecasts Bakken output in February to be 1,192 kb/d an increase of 8 kb/d over January. The step-up in output shown for November appears in the North Dakota state report above.
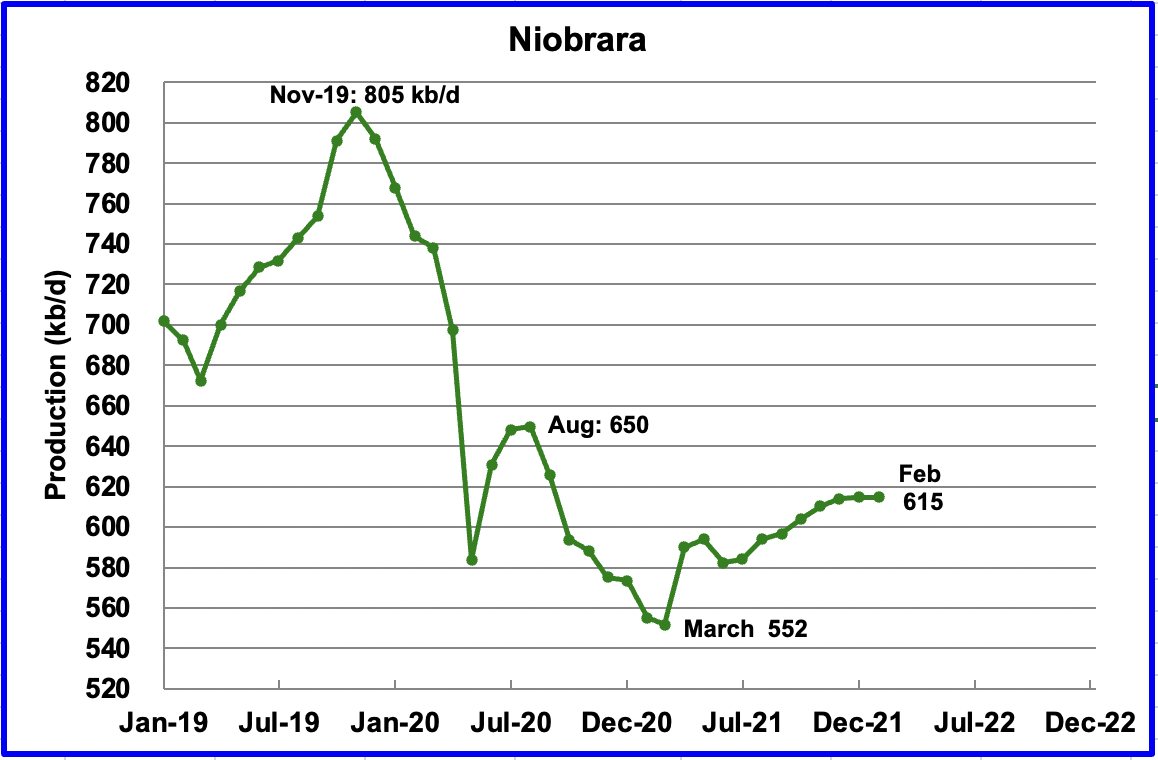
Output in the Niobrara has been rising since July but is now showing signs of starting to plateau at 615 kb/d.
DUCs and Drilled Wells
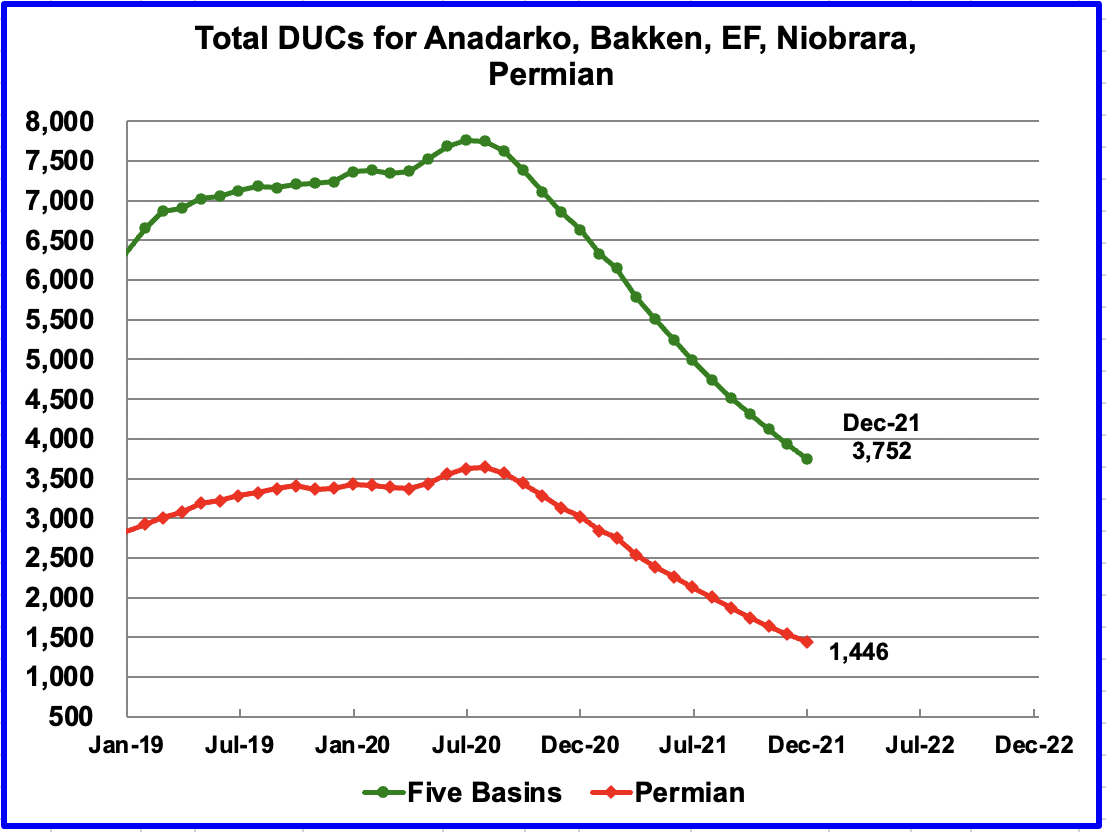
In these five primarily oil basins, the utilization/completion rate of DUCs started to slow after peaking in March. For example, in March 2021, 361 wells were completed. In December the utilization rate, i.e. completion rate was down to 179 from 191 in November.
In the Permian, 91 DUCs were completed in December, down from 105 in November. If Permian DUCs were to be completed at the latest rate of 91/mth, that translates into a 16 month inventory, assuming the remaining 1,446 are all commercially viable. Interestingly, this constant supply of 15 to 16 months of DUCs is not shrinking since fewer DUCs are being completed each month.
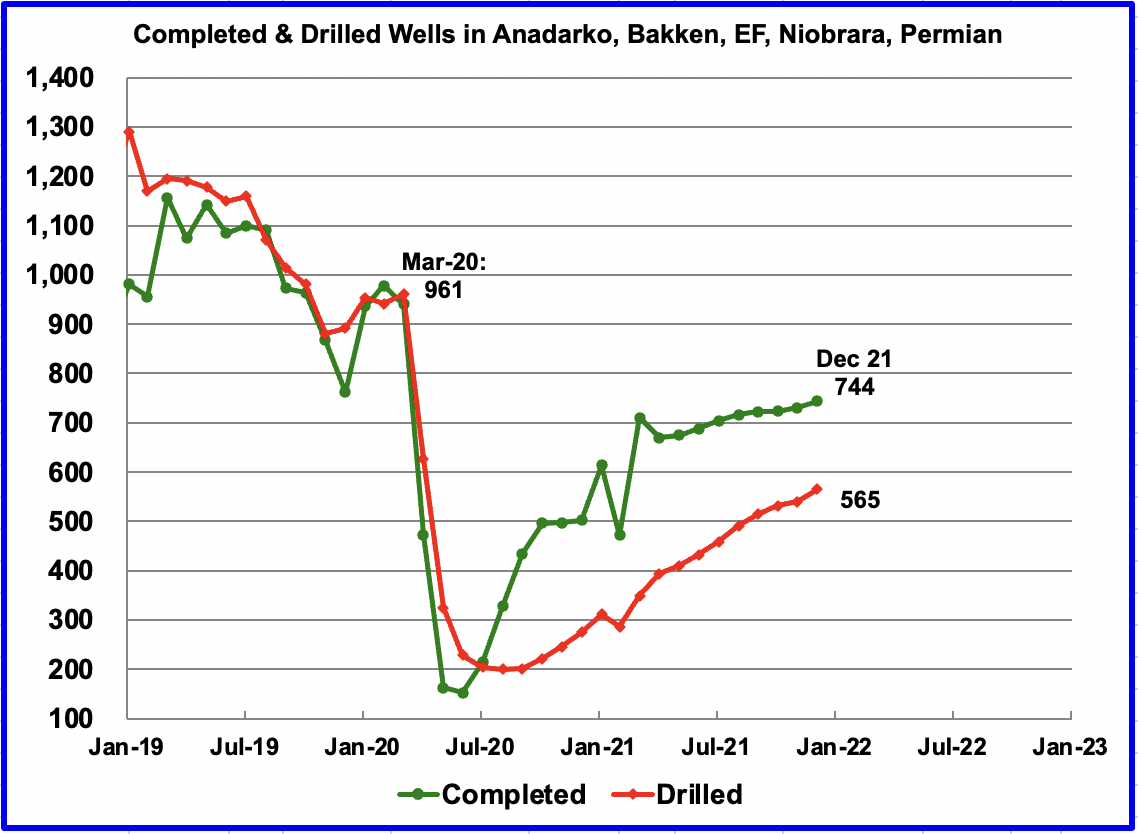
While the completion of DUCs has slowed, the overall completion rate of Wells has also slowed in these five oil basins. To compensate, the monthly drilling rate has been increased. From May to December, an additional 22 wells per month over the previous month were drilled. At the same time the monthly completion rate was also increasing, but at a lower rate of 11.4 wells per month.
For December, completions increased by 13 to 744 while drilled wells increased by 25 to 565.
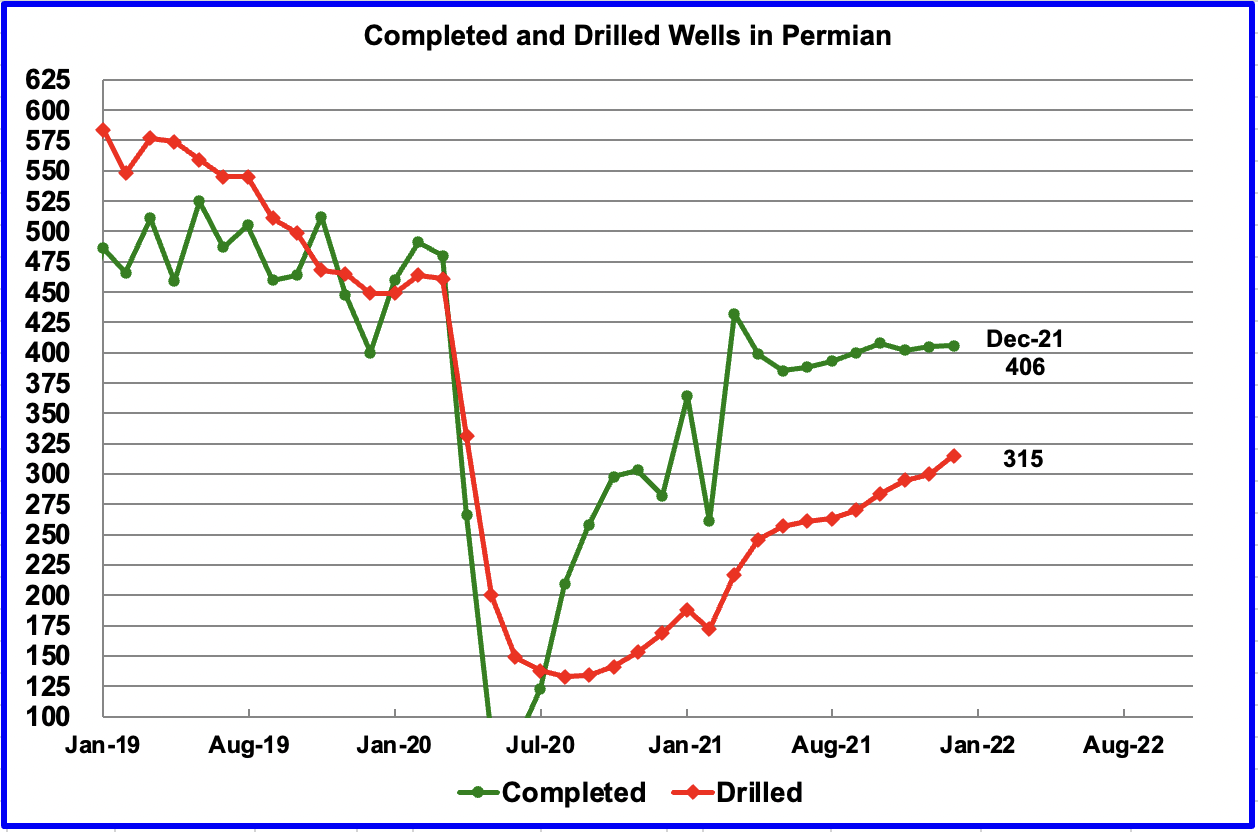
In the Permian, a similar trend in slowing completions is developing. In December 406 wells were completed, 1 more than in November. However, 315 new wells were drilled an increase of 15 over November.
What is noteworthy and perplexing at the same time in this chart is the number of monthly completions in the Permian from August to December were roughly constant at 403 +/- 2. What is the the lack of increase in completions signalling?
3) LIGHT TIGHT OIL (LTO) REPORT
The LTO database provides information on LTO production from seven tight oil basins and a few smaller ones. The January 2022 report projects the tight oil production to December 2021.
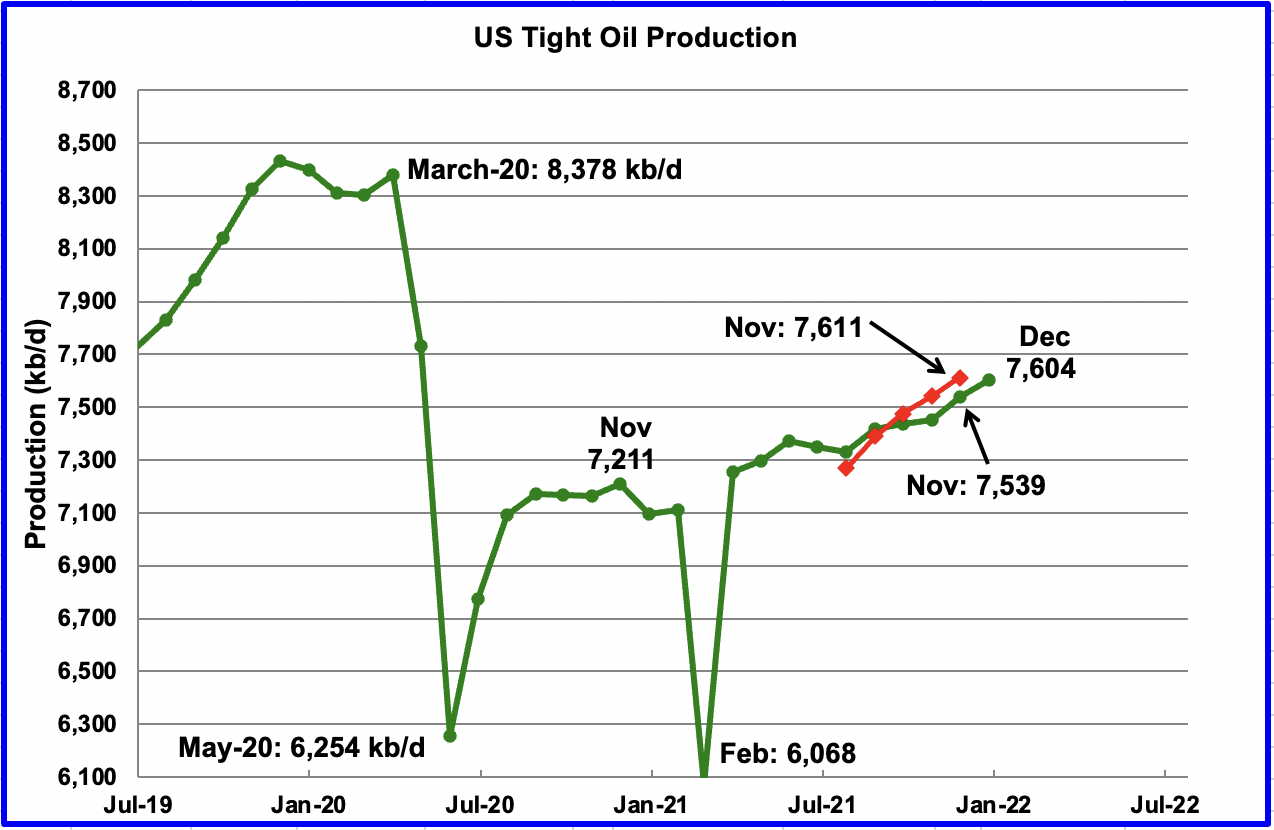
The January LTO report revised down the December LTO projections by close to 70 kb/d for October and November 2021. The five point red graph shows the previous December LTO forecast. As can be seen, November was revised down by 72 kb/d.
December’s LTO output is expected to increase by 65 kb/d to 7,604 kb/d. Again there is a difference in the outlook between the LTO and the STEO for December. The STEO is forecasting flat out for December while both the DPR and LTO are showing increasing production?
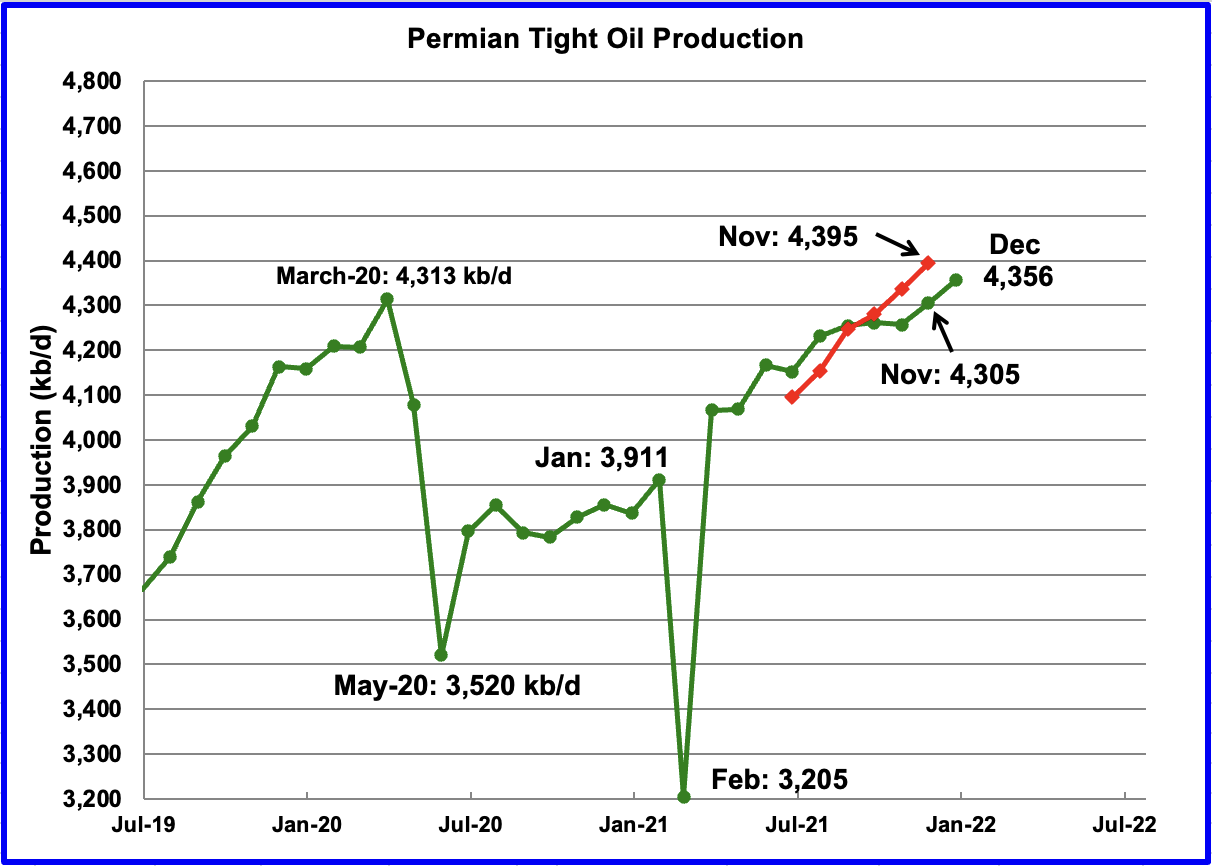
Permian LTO output reached a new high in December of 4,356 kb/d, an increase of 51 kb/d over November. The latest report adjusted November’s output down by 90 kb/d as was reported in the December 2021 report.. Note that the December output is lower than the November output of 4,395 kb/d estimated in the previous December report. Red Graph.
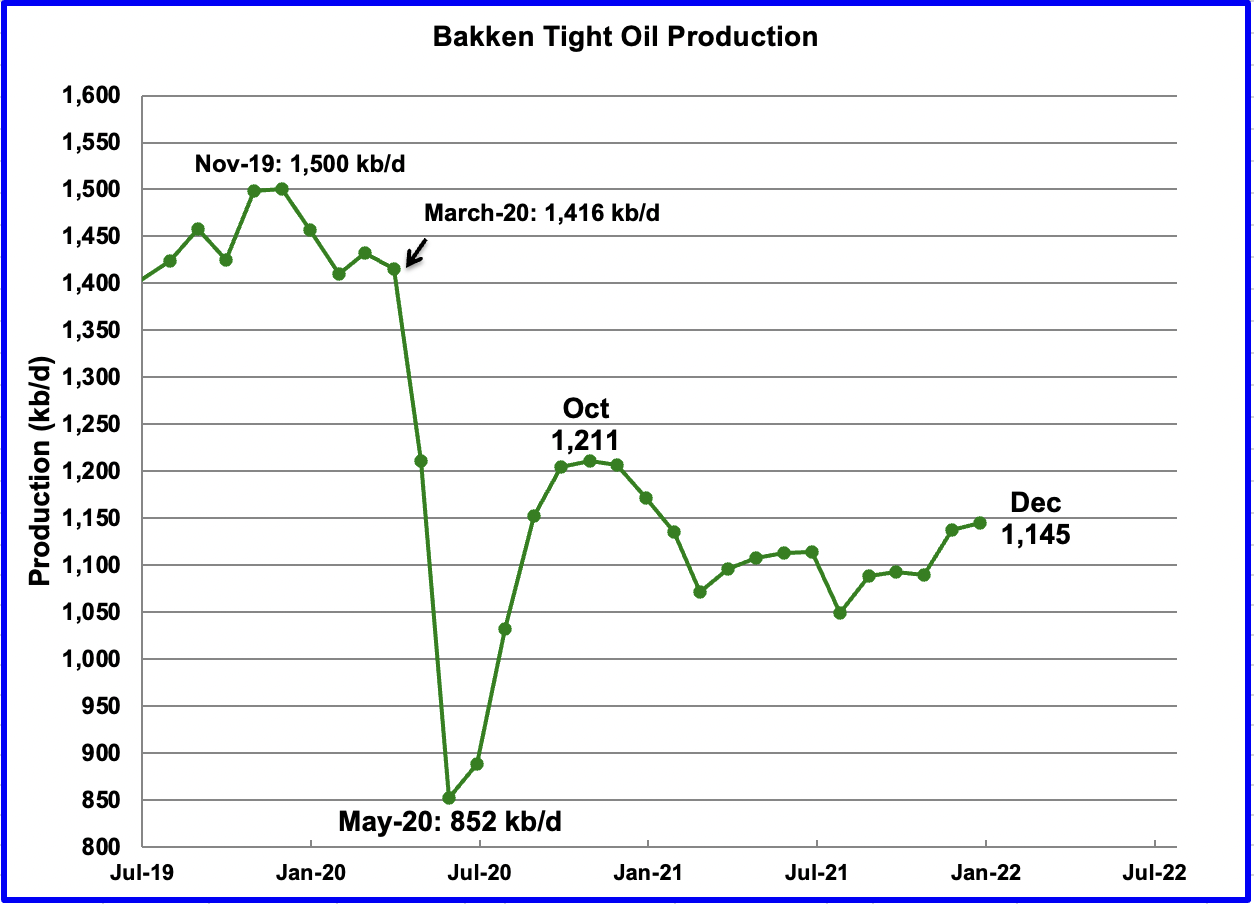
The Bakken’s December output increased by 7 kb/d to 1,145kb/d.
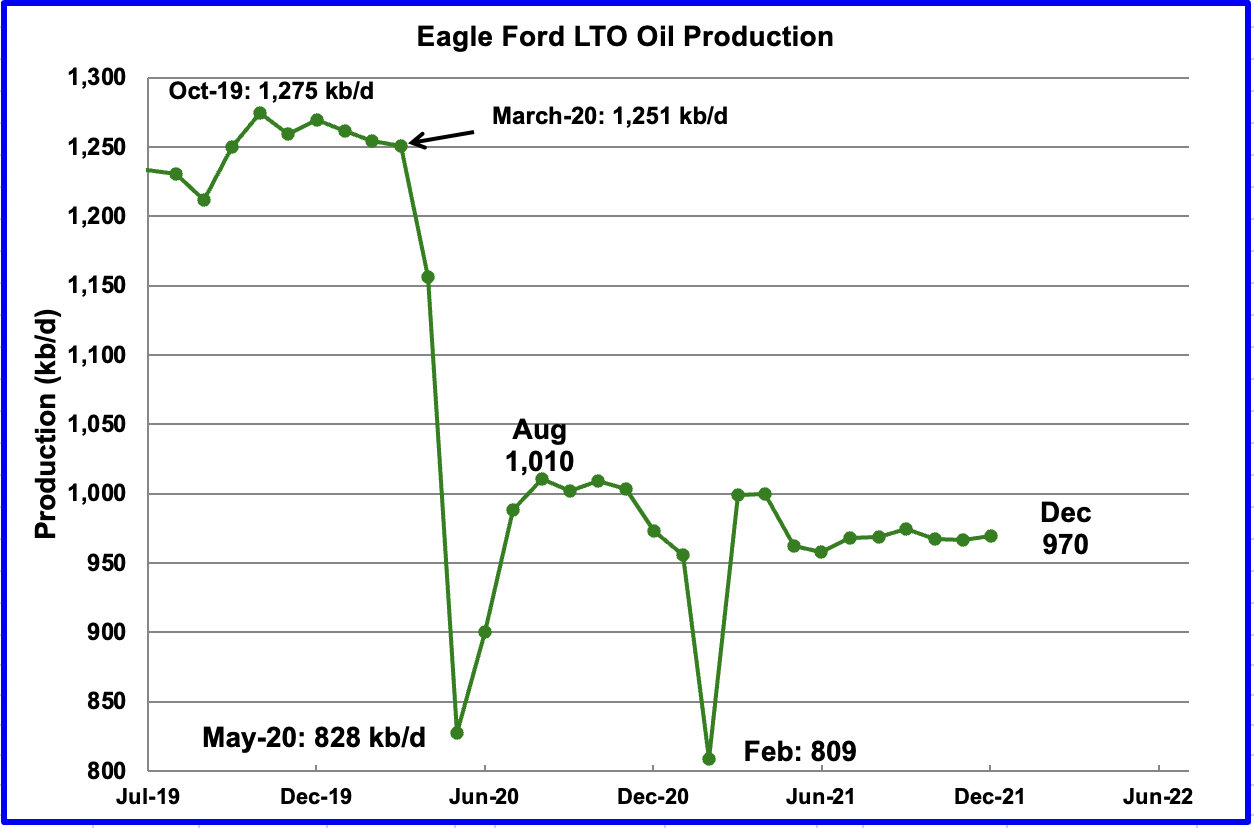
The Eagle Ford basin is expected to produce 970 kb/d in December, essentially flat since July, which came in at 968 kb/d.
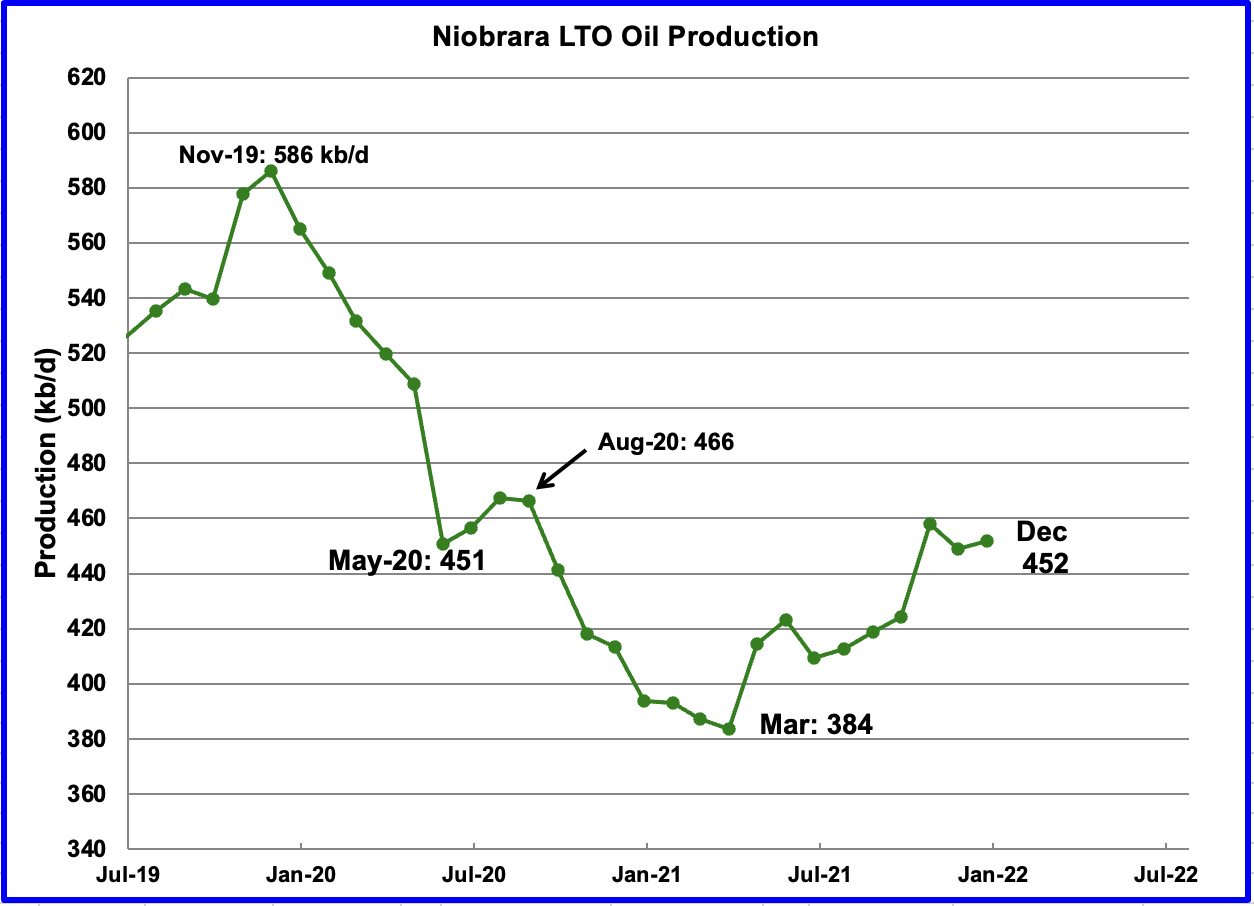
Output in the Niobrara in the latest LTO report in showing steadily increasing production from July to October to 459 kb/d. However, November and December output declined.
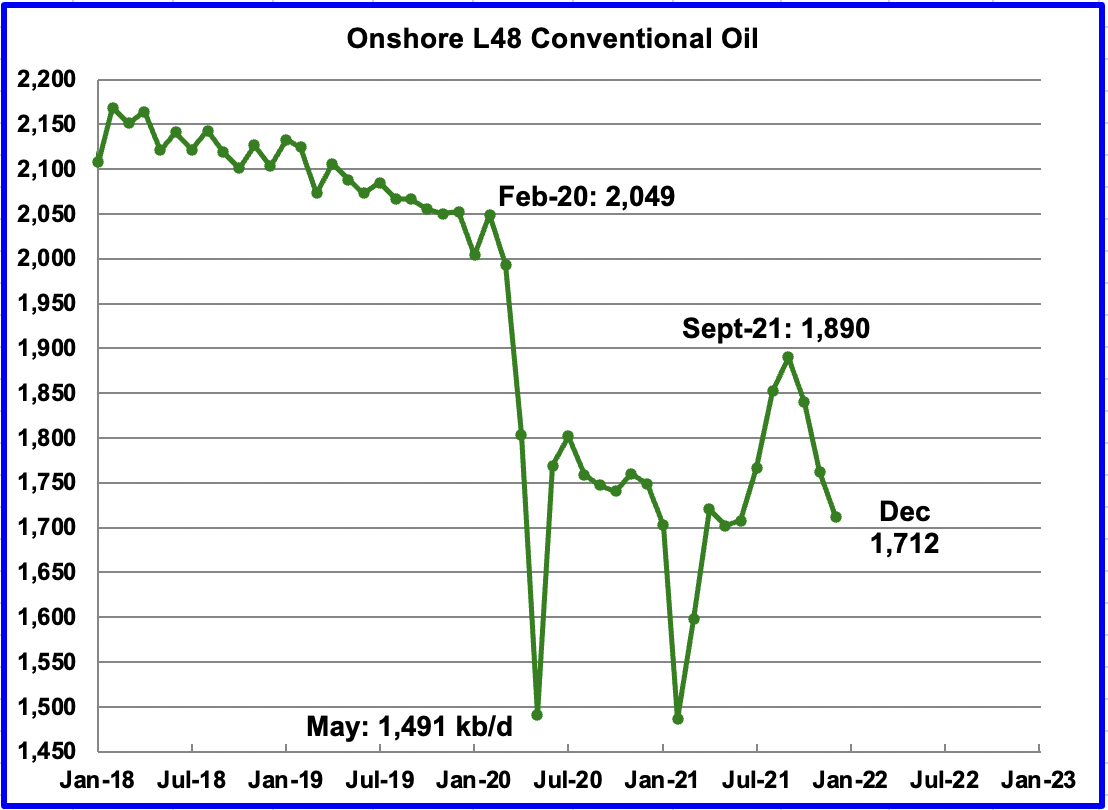
Conventional oil output in the Onshore L48 declined by 50 kb/d in December to 1,712 kb/d. This estimate is based on a combination of the expected December LTO output and the January 2022 STEO report that has a forecast for the US On-shore L48 output for December 2021. The average decline rate from September to December is 59.3 kb/d/mth.
A note of caution. This chart is derived by subtracting two large numbers which are subject to revision, particularly in the latest months, which greatly affects the output after September.
307 responses to “November US Oil Production Surprises”
Ovi, you are a champion. I could have never come up with a post this detailed when I was running things. I mean this post is the best I have ever seen. Thank you, thank you, thank you. I hope you around here for a very long time.
Ron
Ron
Thanks. Most of it was done shortly after each EIA report came out. Today I just had to add the state production data plus clean up a few loose ends.
Thanks to you for starting the site and for Dennis for carrying the big load on many replies. Many thanks also to the participants who provide a lot of insight and different perspectives.
Ovi,
I agree with Ron. This is a fabulous post and really great info. I still believe that the DUC completions in Excess of drilled wells are keeping the production number up in the Permian. Perhaps we will see an increase in drilling rigs but man is labor in short supply and the costs are through the roof. I think there is a limit to the drilling rig growth due to labor and lack of capital.
LTO Survivor
Much appreciated. Your contributions to this site are also much appreciated.
Wondering if you have any insight on those three mile laterals and whether they are being used in the Permian in Tier 2 and 3 areas?
Ovi, your post is big work, thank you. Here are a number of arguments to counter Rystad’s, ‘bigger is always better’ article on Permian lateral lengths: https://www.oilystuffblog.com/forumstuff/forum-stuff/rystad-s-record-breaking-permian-wells. Rystad’s piece I believe is designed to be deceiving from the standpoint of what defines “better well production,” (IP180?) and of course uses BOE as the metric… in areas where gassy oil wells are turning into oily gas wells.
85 % of drilling permits filed thru December 2021 in the Permian are all still in core areas of the top 10 counties.
Great piece Mike, thank you.
Everyone should take a loo at your chart at link below, very informative and read your post.
The chart comes from http://www.shaleprofile.com by way of http://www.oilystuffblog.com (link to post in Mr. Shellman’s comment above repeated below.) It includes the 6 largest producing counties in the Midland basin, new well productivity (cumulative barrels of oil produced at 6 months per 1000 feet of lateral)is not increasing when we normalize for lateral length in the Midland basin.
Link to chart (from full oilystuff post)
https://static.wixstatic.com/media/a27d24_5781158b1acd46ec8a8512ae136c1c6a~mv2.png/v1/fill/w_1408,h_647,al_c,q_95/a27d24_5781158b1acd46ec8a8512ae136c1c6a~mv2.webp
Full oilystuff post at link below
https://www.oilystuffblog.com/forumstuff/forum-stuff/rystad-s-record-breaking-permian-wells
Make sure to read the comments at Oilystuff, lots of great stuff.
Thank you Mr. Shellman for sharing your knowledge.
Thank you, Dennis.
Mike
Much appreciated. Your input and more importantly your insight and analysis are greatly appreciated. My task is fairly straight forward, try to repackage the EIA data as best I can.
In looking at your latest post and in particular the Texas RRC GIS map, I see that the drills/wells fan out in a linear pattern. Where are the laterals? Secondly could a rig be placed where the arrow is pointing and drill toward the top of the picture to get oil out of the empty area,
I hope these are not dumb questions. Appreciate that I know nothing about drilling and the oil industry.
Ovi, those are the laterals. The drill platform is in those pentagon shaped graphics. In the top center drill platform, they have drilled five wells, or laterals, from one droll platform. I have no idea what the green and red dots are.
Perhaps locations of previous wells drilled to assess the quantity of oil contained in the concerned bedrock.
The triangles are what happens when you graph a horizontal well using only the surface lat/long and toe location. It shows up as this chicken foot pattern. If you have the wellbore survey, then you can GIS three points, surface, heel, and toe. On a 2 dimensional plot, the laterals then show up as straight, usually parallel lines, with a second short, highly angled line from the heel back to the surface point. The line is short because it represents the distance of only the build section of the well, determined mostly by the DLS the engineer who designed it is willing to accept.
Ovi,
I also know far less than the oil pros. The laterals are the long lines on the chart, the pentagon shapes are the drilling pads. The two sections (2 square miles) near the top middle of the chart you show, have 9 wells per 2 square miles. LTO survivor has suggested that anything more than 4 wells is too tightly spaced, but there is the possibility that these 9 wells are spread between two different benches, the best benches in the midland basin are usually Wolfcamp A and Wolfcamp B (upper and lower) as well as Spraberry lower (based on USGS Midland basin assessments of Wolfcamp in 2016 and Spraberry in 2017).
Those with access to shaleprofile data or familiar with the details of the RRC data can determin exactly which benches are targeted by specific wells, I don’t know how to do that, but the experts like Mike Shellman, LTO Survivor, Tad Patzek, and geophysicists at the USGS have access to this data.
In the highest EUR areas of the Permian basin as of the end of 2017 there were about 31 million net acres that might be potentially developed in these higher productivity benches (lower Spraberry, Wolfcamp A and B in Midland and Third Bonespring and Wolfcamp A, B and C in delaware). The TRR for these benches might be as high as 49 Gb, but when we account for economics and potentially falling oil prices after 2029 (with oil prices assumed to rise to $100/b from 2024 to 2029) the ERR is more likely to be in the 28 Gb to 36 Gb range, depending upon maximum completion rates chosen by producers.
A lower completion rate (400 new wells per month maximum) results in lower ERR as the falling oil price assumed after 2029 leaves a lot of oil in the ground (ERR=28 Gb). A higher maximum completion rate (800 new wells per month with linear ramp from 400 to 800 from April 2022 to August 2025 and then constant competions at 800 per month up to Dec 2026 followed by a ramp down at an increasing rate. Scenario for Permian basin high completion rate scenario described above is below. All wells financed from operating cash flow after September 2020, all cumulative debt from Permian basin (starting from Jan 2010) is paid off by March 2025 for the assumptions of this scenario.
The economic assumptions: natural gas assumed to sell at $3.50/MCF at wellhead after August 2021, crude oil price ramps from $73/bo in Jan 2022 to $100/bo in August 2026 and remains at that level until July 2030, NGL sells for 35% of crude price per barrel (all prices in 2020 US$) and average well cost is $10.8 million (includes all costs including P and A), oil transport cost to refinery assumed to be $5/bo (refinery gate price assumed to be $5/bo above wellhead price), nominal annual discount rate 10%, nominal annual interest rate on debt 7%, royalty and taxes 28.5% of wellhead revenue.
It has also gone beyond just benches that the public is familiar with now. Designations of formation benches (A-B-C-D) has progressed to sub-bench designations (A-1, A-2, etc.). I know I had mentioned to you previously Dennis that I didn’t have access to about the only system in the country that does this kind of detail work, which was true at the time, but things have since changed.
Reservegrowthrulz,
No doubt there is more detailed information, I use the assessment units in the USGS assessments as that is all I have access to. I don’t have the funds to access expensive databases, so I so the best I can with limited data.
I have seen some information on the internet that 1760 foot spacing is ideal in the southern Delaware basin (3 wells per section width) to avoid well interference (I assume this is within a single targeted horizon). Does there tend to be more well to well communication in the x/y (horizontal plane) than in the vertical direction? It is not clear what the spacing needs to be between benches and whether for example we could target Wolfcamp B1 and Wolfcamp B2 in the same section or even Wolfcamp A and Wolfcamp B, are there impermeable layers in between Wolfcamp A, B, C, and D and between Spraberry and Wolfcamp and Bonespring and Wolfcamp that prevents interference in the vertical direction?
Ovi, thank you. There are no “dumb questions” by anyone genuinely wanting to understand the oil business better, and for the right reasons. I’ve been in it for a half century and I still ask dumb questions every day.
The section of TRRC GIS map you’ve shown reads like this: the octagon symbol at the very top, along the section line, is surface location (pad) for four laterals on the left, drilled north to south. The lines are the actual laterals and the little dots at the end of each line are the toes of the lateral, the terminus or TMD (total measured depth of the lateral). The laterals must comply with spacing distances at the point in which they enter the productive bench, in this case the Wolfcamp (what bench in the W/C we don’t know by this map). This is called Phantom (Wolfcamp) Field, by the way. Terminus points must comply with distances between wells AND lease lines.
All of these laterals (6K to 8K ft.) would have been drilled to the same bench, most likely to facilitate simultaneous stimulation (zipper frac’ing). So the exactly spacing of the laterals is a little confusing, except at the terminus. Its beyond the scope of the map mechanics to plot precise lateral tracks by lat/long coordinates that would find these laterals wander around quite a bit both up and down and sideways. The toes of the laterals, the little round circles, will be colored in some day, red for gas, green for oil. These wells on the left are Anadarko wells.
There is another surface location (pad) on the right that has five laterals in it, also drilled north and south into the Phantom Wolfcamp Field; one of those wells has already been classified as a gas completion by the TRRC. These are Cimerex wells.
So your arrow actually points to no place an additional lateral could be drilled unless field rules for spacing were changed and it would then have to be joint well between Oxy and whoever owns Cimerex now. Not likely, that, as most likely this has been drained.
At any given time there must be hundreds of lawsuits between operators in the Permian regarding incorrect spacing distances, mineral trespass, all kinds of shit goes on out there, ALL the time. Tens of thousands of different players, operators and mineral owners alike; it is all VERY complex. No two operators, nor the obligation they have to their Lessors/Assignors, have the same common goal; they don’t care about optimum spacing for benefit of America’s long term energy security; if somebody else’s ‘A” wells are going good next door, they’re going to drill ‘A’ wells on their minerals across the fence.
In this map section there are producing vertical oil wells, abandoned vertical oil wells, dry holes, and several SWD wells. It gives on an indication of how complex this tight oil stuff is and how much its development is designed/controlled by private mineral ownership. “Ideal” spacing between wells is one thing… who owns or leases the minerals is the controlling factor.
For that reason, and several others, working top down to determine how many locations are left in the Permian Basin, and future supply, from, for instance, USGS TRR estimates, is meaningless. I have a comment on that very thing in the Delaware Basin at my place. Nobody understands yet the economic meaning of Tier 1 v. Tier 3 (whatever that actually means); if you look at flank counties, the quality of flank wells, in flank benches already drilled, a lot of that stuff won’t work at $140, sustained.
I hope this helps. The TRRC GIS maps is available on the web. Please feel free to come by my place to ask questions anytime.
Thank you, Mike.
Mike, Dennis, Ron
Thanks for explaining the symbols and clearing up my confusion on the meaning of lateral wells.
When I read Simmons book Twilight in the Desert, he spoke of the development of Maximum Reservoir Contact wells. These were wells with a main central well and then wells that were drilled laterally from the main well.
So that is the picture I had in my mind when I kept reading of lateral wells in the Permian which I couldn’t relate to the picture provided by Mike.
Currently, some wells are targeting multiple formations/benches/sub-intervals and there needs to be a determination made as to which bench the well will be assigned to, with various folks working with the wellbore surveys having different ideas on how they do this.
I heard they are in Tier 2/Tier 3 and also in New Mexico where you have potash issues and need to avoid the potash mines while drilling the vertical section. It is highly unlikely that due to friction pressure any part of the last 5,000 feet of the wells get efficient fracks. I always though 7,500 feet of lateral created the best economics on a per foot basis while most drilled 10,000 foot laterals to hold more acreage by production.
High prices and demand .
https://www.reuters.com/business/energy/india-shows-early-signs-high-coal-lng-crude-prices-hurting-demand-russell-2022-02-01/
The article says that they have slightly lower imports for one month, but does not provide any info to support the headline of lower demand.
Longer term consumption (rather than import) data will tell the true story on demand.
Ovi,
This was an outstanding post that concisely, clearly presented much historical data with additional forward looking projections.
Great work.
Regarding Tier 2/3 economics involving 15,000 foot laterals, recent Appalachian Basin history may offer some guidance.
From 2017/18, it was common for the cost to D&C a well to run $1,200/$1,100 per lateral foot.
Today, most major operators claim costs are down in the $600/lateral foot range with some being even lower.
The lengthening of the lateral is the main reason. (Thus, a 3 mile lateral would run a bit over $9 million per).
As frac pressure management challenges increase the farther out towards the toe, hydrocarbon recovery tends to be somewhat proportionately less than with shorter wells.
Liquid recovery is far more difficult than gaseous product in longer laterals, but the ever evolving Artificial Lift processes continue to adapt.
As has been mentioned months ago, there may be a convergence with the growing implementation of high pressure gas injection (for AL), and underground pressure management as the significant capital costs for high pressure compressors may be offset with expanded use for re-injected field gas.
Time will tell, but the recent Bakken production profiles from Marathon, Hess, and Continental suggest that this may already be underway.
But as it is tier 2 and tier 3, if I am not wrong, there are less oil to extract and these areas are going to be more rapidly depleted than tear 1 area, especially if the rate of extraction is more important with the reinjection of field gas and the use of high pressure compresseurs : ? In other terms, they are doing what the Saudis have done : they maintain the extraction rate and by doing this, they accelerate the depletion rate : ?
Yes just when you thought the straw couldn’t get any bigger or complex and the slurping sound any louder. But we all know what tier 2 and 3 means. It’s the nooks and crannies behind the ice cubes as you suck the last remnants of your fountain drink.
Mr. Fleury,
As is conventional protocol, Tier 2/3 areas contain fewer/less hydrocarbons than so called core/sweet spots. (Original Oil/Gas In Place being the commonly used terms).
However, 3 distinct factors are now coming into play with longer laterals playing a contributing role.
First, the size of tier 2/3 areas is way, way larger than the core.
Secondly, while the recovery with longer laterals – percemtage-wise – is diminishing, the overall recovery rate continues to rise, and at somewhat reduced cost. (Seemingly mundane items like wet sand frac’ing are having outsized impacts on lowering development costs. Simulfracs, near universal use of Super Spec rigs, piped water in and out, large Central Battery Units … the list just goes on and on).
To emplace ~100,000 lateral feet of wellbore via 7 wells versus 10 is a huge savings. While the percentage of recovery will lessen versus shorter wellbores, this is more than offset with the financial returns.
(Years ago, the metric “percentage of OOIP recovery” was a hot topic, with 3%/5% the norm in the early Bakken years. Today, 12 to 15 percent is the average with recently retired Continental executive – Jack Stark – claiming 20% recovery was becoming routine).
Thirdly, (and Dennis seems to be one of the few who continuously emphasizes this), prospective areas at $100 WTÌ, $120 WTI will be enormous … not only in now-fringe areas in the main plays, but emerging regions such as the Powder River, Uinta, TMS, et al.
Much of the re-injected gas for AL is recycled as it is recovered at the wellhead, processed onsite, and then pumped back downhole. 60 to 120 thousand feet per day per well seems to be the norm according to public well production profiles for some Bakken operators.
When comparing Saudi extraction practices with re-injection of field gas for enhanced recovery (as distinct from Artificial Lift purposes), I will refrain from – what is now – conjecture.
My point in mentioning the deployment of expensive, high pressure natgas compressors for AL was to highlight that a crucial component for potential EOR – specifically, efficiently elevating formation pressure while simultaneously effecting a miscible sweep – was in the process of being implemented and may, ultimtely, be used for dual purposes (AL and EOR).
While I’d like to think WTI will be $100-120, something tells me it won’t be there much in the future, if at all.
Not that I am good at predicting the future. I’m no better than the others here at that, LOL.
I do think labor will be a huge issue going forward. There are some leases here operators want to give away. We won’t take them because we’d need help pumping them, and right now there is none to be had.
Shallow sand,
None of us knows the future price of oil. Only a few months ago I think I said maybe we would get to $80/bo in 2023, seems the oil is just not flowing like it used to, seems to suggest short supply, so maybe $100/bo is in the cards. WTI futures at $88/b as I write this.
Dennis.
My most recent prediction has been a range of $35-115. Trying to cover all the bases, LOL.
On conventional maybe increasing, there are some who are trying a new technique (or maybe not so new) with regard to re logging and re perforating old wells.
We have tried this recently. The original perforations only penetrated the zone about 19”. The new ones go out about 20’. In addition, before doing this, we have the well logged again. The new log indicated 6’ of zone that should have been completed the first time, but wasn’t.
Early results are favorable, but just one well and we shall see how long the additional production holds up.
There are a lot of re completion methods that can be tried in conventional fields when oil is priced right.
Shallow sand,
Thanks for the info, I did not know about this at all. My uneducated guess was that conventional onshore was simply rebounding after the crappy price environment and all the covid disruption and that it would then continue on the 2016 to 2019 decline trajectory. How long has this stuff been going on in the stripper well space, I am assuming it may be new as you have not mentioned it, but there is much I don’t know.
Shallow sand,
Glad to hear you finally got hold of a rig, maybe hold on tight and do some other wells?
At this price, I imagine it might pay out quickly, I am sure you will figure it out with folks that know far more than me.
Dennis.
Just one well. Rig laid well out, logged, re perforated and then ran back in and put on pump. No re frac or acid. All of original perforations were plugged.
Need to see how well performs for several months. This was just a test.
Would note many injection wells have used the same tech and lowered well head and plant psi significantly.
Thanks again for the information Shallow sand, hope oil prices hold for you and things go well.
Shallow Sand labor is a huge problem. Probably the worst I have ever seen. It takes days to get work over units and equipment.
Shallow. Please give me a call.
Coffee:
Good points. Not to be a cheerleader for the much-aligned Bakken but since you used it as your index, there are many areas in the Bakken where field gas is 20-30% ethane, a much superior lifting gas to methane or CO2. Maintaining reservoir pressure, improving liquids extraction via immiscibility of ethane in water, etc., is dramatically affecting production, even wells in Tier 2, 3 properties. A well in Dunn county–designated “condemned property”–was a monster, mainly due to the gas cut. Reservoir pressure manipulation is a feasible thing in some areas.
We have been running roughshod through the shale basins. People are noticing–all over the world. Precious water is being taken out of the life cycle. Contaminated water is being jammed down holes where it doesn’t fit, sequestered forever. In this crazy process, we are deflowering virgins and leaving them as spoils of war.
Consider this: with recovery rates of 8-16%. there are thousands of old wells that are chock-full of oil and gas. In the total scheme of things, re-injection of field gas is pocket change. Combine that with plasma pulse fracking and the hated shale fields may put America over the hump, and help supply the world. Pollyanna, I know.
Gerry,
The bottom line is whether these methods will be profitable, I don’t have an answer, but I am skeptical at any price under $90/bo. For a short time we may see high oil prices and such methods might be viable, longer term if plugin vehicle sales continue growing at 39% per year we may see demand for oil fall faster than the supply of oil and oil prices may start to fall after 2029. If oil prices fall these EOR methods may no longer be viable due to a lack of profits.
Law of large numbers. We won’t see 39% per annum growth for long.
The mineral mines alone are going to take decades
Tim the tiny,
I expect the annual growth rates in sales volumes for plugins will fall, last year the share of new vehicle sales in Europe was about 19% plugins, the F150 lightening will be interesting to watch, initially they will be in very high demand. GMC will have Hummer and Sierra EV to follow in 2023. Lots of options coming to market near term.
Mr. Maddoux,
Good to see you posting here. Hope all is going well for you.
Regarding ethane re-injection, the ND EERC folks have a fascinating report (viewable online) touting the benefits of ethane (and propane) for effecting miscible sweeps.
One of the more intriguing charts showed the larger hydrocarbon molecules (aka asphaltenes) being mobilized to an outsized percentage compared to the smaller molecules (H10 from memory).
The strong implication is that these larger molecules are being left behind in primary recovery and may, in fact, be largely contributing to the dreaded early decline via capillary blockage.
With the increasing use of microproppants, clearing these innumerable tiny pathways will be another benefit when effective EOR is employed.
Again, great to hear from you on this site.
OPEC+ Fails To Reach Production Targets In January
OPEC has again failed to meet its own production targets again in January as the group lifted production only 210,000 additional barrels per day for the month.
Looking at this through a monthly lens, the group increased production by just 210,000 bpd instead of the 400,000 bpd increased production that the alliance agreed to—creating a January shortfall of 190,000 barrels per day.
But the real shortfall is much larger.
Looking back at the base amounts that OPEC is working with, and factoring in each month’s planned increased production, January production cuts from OPEC show a much larger shortfall.
OPEC’s actual January production cuts still amounted to 2.803 million barrels per day short of the base levels when OPEC agreed to the cuts. This compares to the pledged cut for January of 2.129 million bpd.
This equates to an extra 674,000 bpd in cuts for January than what OPEC has agreed to.
In terms of actual production, OPEC produced 27.8 million bpd in December, lifting this to 28.01 million bpd in January. Noteworthy increases came from Saudi Arabia (+100,000 bpd), Nigeria (+50,000 bpd), and the UAE and Kuwait (+40,000 bpd each). These production gains were partially offset by decreased output by Iraq (-30,000 bpd) and Libya (-40,000 bpd).
Ron
Does this author have access to some data that is not publicly available. There is no reference. Articles should show up in a day or two with more info.
Ovi, her sources are the same “secondary sources” that the OPEC MOMR uses, but usually just one or two of them. The data is open to other news agencies who ask for the data. These early reports are seldom exactly right but they are usually pretty close.
secondary sources for oil production data, OPEC was careful to maintain a balance between the type of entity it would use. The secondary sources comprise two PRAs (Platts and Argus), one news agency (Energy Intelligence), one consultant (IHS Markit) and two energy agencies (IEA and EIA).
Isn’t this 700 kb/d shortfall just the cumulated shortfalls that OPEC+ has accumulated month after month, missing every time its target?
I didn’t do the math, but on average OPEC has raised its production by 200 kb/d each month, instead of pledged 400 kb/d. This trend has been on since last summer.
Ganesa,
OPEC and OPEC plus are distinct. The target for OPEC is a monthly increase of 250 kb/d, for the plus group from the DOC (Russia, and 9 other non-OPEC nations) the monthly increase is 150 kb/d, with Russia’s share being 104 kb/d). From June 2020 to December 2021 the average monthly increase for Russia plus OPEC has been 299 kb/d, the target for these nations was about 354 kb/d, so they have been 55 kb/d short of their quota on average each month, if we look at all OPEC nations (including Libya, Iran and Venezuela) plus Russia the increase over that period was 400 kb/d per month on average which is 50 kb/d above the target of 350 kb/d for OPEC10 (nations with quotas) and Russia.
The idea was to draw down excess oil stocks from the middle of 2020, the mission has been accomplished and oil prices are up which was the objective.
Ovi,
Nice work, thanks. Note the slow down in the rate of increase of tight oil completions in the Permian from September 2021 to December 2021 might have something to do with oil prices. Note that there is roughly a 2 month lag between changes in oil price and changes in completion rates and it is not the only factor as there are cost increases in supplies, equipment and labor that will influence business decisions by oil producers.
Dennis
I don’t understand why the oil prices in the chart are so different from WTI. Are these LTO prices.
Ovi ,
These are spot market prices. Different from futures prices. Data from EIA, monthly average spot market price for WTI.
https://www.eia.gov/dnav/pet/pet_pri_spt_s1_m.htm
Ovi,
The prices are spot market prices at Cushing, Oklahoma for WTI crude
Definition of spot price at EIA is
The price for a one-time open market transaction for immediate delivery of a specific quantity of product at a specific location where the commodity is purchased “on the spot” at current market rates.
For WTI-Cushing
A crude stream produced in Texas and southern Oklahoma which serves as a reference or “marker” for pricing a number of other crude streams and which is traded in the domestic spot market at Cushing, Oklahoma.
Definitions above from link below
https://www.eia.gov/dnav/pet/TblDefs/pet_pri_spt_tbldef2.asp
The chart you use is for futures contracts which can be different than market prices of physical barrels.
OPEC+ Is Being Way Too Optimistic About Its Supply Targets
Have these guys been talking to Dennis? 🤣
Ron,
Yes, they definitely give me a call before they set their targets. 🙂
Note that the 740 kb/d below target (target is about 40000 kb/d) is a little less than 2%.
This one is for my buddy steve for his negative narrative which helped make a more than 100% return on my purchases in ExxonMobil and Chevron of October of 2020. Click Click, didn’t have to even get my hands dirty. Thank you steve
Exxon, Chevron Hit Gushers of Cash — 2nd Update
9:12 am ET February 1, 2022 (Dow Jones) Print
By Christopher M. Matthews
The world’s big western oil companies are back in the money and once again attracting strong interest from investors as crude prices rise to their highest levels in years.
Exxon Mobil Corp. on Tuesday reported $23 billion in profit for 2021, its highest total since 2014, including $8.9 billion in profit in the fourth quarter. Last week, Chevron Corp. reported its most profitable year since 2014, earning $15.6 billion in net income in 2021 and $5.1 billion in the fourth quarter. The largest European oil companies, Shell PLC and BP PLC, are expected to also post resurgent annual results when they report in the coming days.
Exxon and Chevron are predicting a multiyear upswing for the industry as oil and gas demand surges from the depths of the pandemic and investment in new production slows. The strong results have lured investors to a sector many left for dead.
Exxon and Chevron have both said they would stick to more modest spending levels they laid out last year. Chevron’s planned capital expenditures for 2022 are down about 26%, while Exxon’s planned capital investments through 2027 are down 17% to 33% from its pre-pandemic plans. European oil companies have also said they would invest more conservatively in oil and gas production.
Chevron said last week that it generated $21.1 billion in free cash flow in 2021, its most ever. But it isn’t planning to plow most of it back into new oil and gas production, and expects its output could decline slightly in 2022. Instead, it increased its dividend by 6% and said it would buy back as much as $5 billion of its stock this year.
Exxon said it generated $48 billion in cash flow from operations in 2021, its most since 2012. Analysts expect it to raise its dividend later this year, and Exxon has said it would buy back as much as $10 billion in shares over the next 12 to 24 months.
The moves to return more money to shareholders instead of putting most of it back into new projects represent a reversal for Western oil companies, which have historically heavily reinvested cash in increasing oil reserves and production, a strategy that produced paltry profits over the past decade. Investors turned their back on the industry before the spread of Covid-19 and fled the space when the virus took hold. Chevron and Exxon’s shares fell nearly 50% in March 2020.
“The growth experiment is over,” said Jeff Wyll, senior energy analyst at Neuberger Berman. “Many of the leading companies have taken aggressive steps to win back investors.”
But what has benefited investors may not help consumers confronting rising energy prices. U.S. oil prices were trading at around $88 a barrel Tuesday. Chevron CEO Mike Wirth said last week that oil prices could top $100 per barrel in 2022. U.S. gasoline prices have reached their highest levels since 2014, averaging about $3.32 last week, according to the U.S. Energy Information Administration.
Exxon and Chevron have both said they would stick to more modest spending levels they laid out last year. Exxon plans to increase its 2022 capital spending by $4 billion to $7 billion from last year’s low levels. Even with the increase, Exxon’s planned capital investments through 2027 are down 17% to 33% from its pre-pandemic plans. Chevron’s planned capital expenditures for 2022 are down about 26% from its previous plans, while European oil companies have also said they would invest more conservatively in oil and gas production.
Exxon said Monday it is moving its corporate headquarters from Irving, Texas, to Houston as part of a business reorganization that the company said will yield $6 billion in structural cost savings by 2023.
Exxon’s oil and gas production unit had a turnaround in 2021, earning $15.8 billion in profit, up from a $20 billion loss in 2020. The company has focused its investments in Guyana, where it made six additional oil discoveries in 2021, and the Permian Basin of West Texas and New Mexico, where Exxon said it increased its oil and gas production by nearly 100,000 barrels a day last year and will boost it another 25% in 2022.
Both Chevron and Exxon plan to increase spending this year in some areas, including the Permian Basin, where shale wells produce rapidly, giving the companies flexibility to respond to higher prices. But overall, Exxon produced less oil and gas in 2021 than it did before the pandemic, while Chevron’s production is up slightly. Combined, the two companies represent about 6% of global oil supply.
The lower spending levels could lead to an even tighter oil and gas market in 2022, especially if the global economic recovery continues. Mr. Wirth said last week that some areas of fossil fuel demand, like jet fuel, have yet to recover.
“Even with the robust demand recovery that we’ve seen, there is still another leg to the demand improvement that is likely to occur here in 2022,” Mr. Wirth said on a call with analysts. “The issues, frankly, have been a little bit more on the supply side than the demand side.”
A different estimate of US L48 onshore conventional through November 2021 using EIA official tight oil estimate from Jan 2022 and latest PSM. The STEO is likely to be incorrect for October 2021 to Dec 2021, the PSM is likely to be more accurate. The chart below shows a strong recovery in US onshore L48 conventional output from June 2021 to November 2021 with output increasing by 265 kb/d or a 53 kb/d average monthly increase in crude output over that 5 month period. That is about a 2.9% increase in output each month, impressive.
Note that if we look at the trend for L48 onshore conventional from June 2016 to Dec 2019 the trend is exponential decline at about 2.43% per year, current output roughly matches that trend for November 2021 so if that long term ternd continues we would expect L48 conventional output to resume its 2.43% annual decline rate starting in December 2021.
Dennis
My original chart used STEO data and LTO data. The unexpected increase in the offshore would change the trend. However as I mentioned, the conventional oil numbers are the difference of big numbers and changes in the later months has a big impact on the results
Attached is a chart which takes the difference between the DPR and LTO output to gage how much conventional oil comes from the DPR basins. From June to November your chart shows an increase of close to 280 kb/d. The DPR/LTO chart shows an increase over the same period of 131 kb/d. Also there is close to 1,000 kb/d difference between the Onshore L48 and just the DPR basins. In what states are the 1,000 kb/d coming from?
Ovi,
It would be difficult to break out state by state as the tight oil data has basins that cross state lines (Williston, Permian, and Niobrara). Clearly there is conventional oil production outside the tight oil basins in the L48 onshore. Where exactly that occurs is less clear.
I guess you could tak groups of states such as Texas, New Mexico, and Louisiana(for Permian, Eagle Ford, and Austin Chalk), North Dakota and Montana (for Williston), and Colorado and Wyoming(for Niobrara) and deduct the DPR estimate from total C C output to get your answer, if you are interested. Breaking it down to individual states would require more research. You could probably ignore the condensate from Marcellus and other shale gas plays and focus on the five oil prone areas in the DPR (Bakken, Permian, Eagle Ford, Niobrara, and Anadarko).
DPR regions are designated by counties, and the EIA provides a list. Add up all production in those counties, within each DPR region, and call that “TOTAL” for each region. Now add up the formations designated as LTO or shale gas within each region, and the same counties, and subtract that total, by regional, from the TOTAL sum in each region. I presume you have access to well level formation designations?
No I do not have data on a county by county level, or well by well.
Isn’t this information available to the public through state websites and whatnot? I helped a state launch one of these systems back in the early 90’s, that one was still up and running last I looked, and I listen to other analysts often discuss the value to them of the North Dakota and Texas datasets available to them publicly. Perhaps, while accessible, it is difficult to be able to get it all at once?
Reservegrowthrulz,
The data is accessible, but it takes some skill to do it, that is how services like shaleprofile and enverus make money. Getting the data in a usable form takes some skill and we have 50 states, also the RRC production data is notoriously incomplete in early months, it takes 12 to 18 months for the data to become 98% complete. North dakota is much better, not sure about NM, CO, WY, etc.
I mostly rely on the EIA tight oil data and data from http://www.shaleprofile.com blog that is available for free.
US L48 onshore conventional, DPR region conventional, and other conventional oil (US L48 conventional not in DPR oil regions, which excludes Haynesville and Appalachia DPR regions).
The difference between Ovi’s estimate above and mine below for DPR conventional is that I exclude the “rest of tight oil” column from the tight oil estimate as we don’t know what formations that oil comes from (it may be regions very different from DPR regions). In addition, Ovi seems to be including all oil output from all seven regions of DPR report where I use only the oil focused regions from DPR (Permian, Bakken, Eagle Ford, Niobrara, and Anadarko).
Dennis
I am wondering why your DPR conventional crude is different than in my chart above. Your chart is showing close to 900 kb/d of conventional oil. Mine is showing 739.
December data I used: DPR 8,343 kb/d. LTO 7,604 kb/d. Difference 739 kb/d.
Ovi,
See my second paragraph. My DPR conventional is 5 DPR regions (not including Appalachia and Haynesville) minus EIA LTO (except for “rest of tight oil” because some of that is from Appalachia, Haynesville, Barnett, Powder River, etc which is not a part of the DPR regions I selected)
My DPR (5 oil regions) is 8117 kb/d, and my LTO (not including “rest of US tight”) is 7207 kb/d for November 2021, difference is 910 kb/d.
Dennis
OK. Got it. Missed that.
Ovi,
You ask the following:
The STEO is forecasting flat out for December while both the DPR and LTO are showing increasing production?
The STEO has a forecast for December 2021 of 11580 kb/d for US output and the PSM has November 2021 output at 11753 kb/d for US C plus C output. If the PSM estimate for November and the STEO forecast for Dec 2021 are both correct, this suggests a drop in output of 133 kb/d in December 2021.
Perhaps you are implying that the STEO is likely underestimating US output in the near term, if so I would agree. It is also possible the tight oil estimates will be revised lower next month as was the case this month. Estimates get revised both higher and lower as the EIA gets more complete information from other sources over time.
The STEO has US output reaching 11.75 Mb/d in July 2022, I think they may revise next month’s STEO as I doubt we will see flat output from November 2021 to July 2022 with crude priced at over $85/bo.
A big problem with the STEO forecasts is they consistently have been underestimating the price of oil, even the futures quote is at $73/b for Dec 2023, though I doubt oil will be selling at this price in Dec 2023.
Ovi,
You say:
This output rate projection of 96.5 kb/d/mth is in sharp contrast with the STEO forecast above. It indicates that from November 2021 to March 2022, output will remain essentially flat at close to 11,550 kb/d and then start to increase at a rate of 50.4 kb/d/mth out to December 2023, essentially 1/2 the rate indicated in the STEO.
Another way to look at this is the DPR has output at roughly 4580 kb/d in March 2021 and at about 5180 in Feb 2022 so roughly a 500 kb/d increase over 11 months, that would be about a 45 kb/d monthly increase over that 11 month period, which is similar to the STEO estimate.
Ovi,
Yes the July 2021 to Nov 2021 increase in L48 onshore is substantial, if we fit an ordinary least squares trendline to these 5 months we find the average monthly increase is about 94 kb/d. If we look at the 9 month period from March 2021 to November 2021 the average monthly increase in L48 onshore crude output is 75 kb/d. Going forward we may see something between the 50 kb/d monthly increase expected in the STEO and this 75 kb/d estimate, if it were an average monthly increase of 62 kb/d that would suggest an annual increase of 744 kb/d.
Note that my tight oil model has output of tight oil increasing by only 342 kb/d from November 2021 to November 2022, an average monthly increase of less than 30 kb/d. My model may be on the conservative side, despite what many think.
From Dec 2021 to Dec 2023 my tight oil model has an average monthly increase of 39 kb/d.
It is important to note that L48 onshore conventional output increased at an average monthly rate of 45 kb/d from March 2021 to Nov 2021, accounting for 60% of the increase over that period, tight oil output increased at an average monthly rate of only 30kb/d over that period. In the future I expect L48 conventional output will decrease so increases in L48 onshore output will be smaller than the tight oil increase by about 4 kb/d (monthly decrease in conventional L48 onshore).
Based on my modelling and the data, the 50 kb/d average monthly increase in L48 onshore output in the STEO looks optimistic, something close to this might be achieved from Dec 2022 to Dec 2024, perhaps about a 45 kb/d monthly increase in L48 onshore crude output.
Exxon and Chevron to Ramp Permian Output
Exxon Mobil Corp. said Tuesday it plans to boost output by 25% this year in the Permian Basin, the biggest U.S. oil-producing region. That comes four days after Chevron announced it will ramp up its own Permian supplies by 10%, from an even larger production base. Such aggressive targets from the Western world’s largest oil majors are a surefire sign that U.S. shale is back to growth mode after cuts in 2020 and a lackluster 2021.
Exxon’s 25% production increase will be “high-value growth” and comes on top of the 460,000 barrels of oil equivalent produced from the Permian Basin last year, CEO Darren Woods said on a call with analysts on Tuesday. Chevron, which produced an average of 608,000 barrels a day from the basin in 2021, also indicated that its Permian barrels are some of the most profitable anywhere in its global portfolio.
Exxon and Chevron “are resuming the ambitious growth plans of three to four years ago that were delayed by the pandemic,” Rystad’s Abramov said. And with more shale production now concentrated into fewer hands after a series of mergers over the past two years, “Exxon and Chevron will account for more of the forward growth profile than they did historically,” said Stephen Richardson at Evercore.
“U.S. production may surprise to the upside this year, but not by so much that it will significantly bring down oil prices,” said Elisabeth Murphy at ESAI Energy LLC. “On top of that, OPEC+ is having trouble lifting output to add the additional barrels.”
https://www.bnnbloomberg.ca/exxon-joins-chevron-in-permian-oil-surge-as-peers-preach-caution-1.1716902
I think Exxon and Chevron have more than enough locations to increase production but I don’t know where they are going to find the labor and equipment. The service industry is in a world of hurt
LTO Survivor
Do you think that since they are both big, that they can move their workers from other locations into the Permian. Any idea if they rent rigs and crews or do they own their own.
Nope. Plus I think it’s all talk. They CL tract out most of their field Labor which I have seen is either unqualified or in short supply. Plus it is easier and cheaper for Exxon and chevron to buy instead of drill. There so many zombie oil companies with lots of debt and no real future as a viable long term company.
A short abstract from some comments:
The bottlenecks for tight oil production increase:
– price of crude oil
– labor (workforce)
– equipment
I don’t have the knowledge to write something about the gravity of labor and equipment shortage and how long that could last.
Probably the worldeconomy can stand oilprices of $110-120 for some years. After that the consequences for the low income population will be terrible. Already now a lot of countries have problems because of this issue. Many hundreds of millions who struggle to survive each day. Social unrest will be one of the biggest problems this and the next decade(s). With high, but also with low oilprices. Anarchy is lurking in dozens of countries.
Russia Boosts Oil Output But Still Can’t Meet Its OPEC+ Quota
Russia ramped up its oil output in January yet likely pumped below its OPEC+ quota for a second consecutive month, as the nation’s producers struggle with a lack of spare capacity.
The Organization of Petroleum Exporting Countries and its allies, including Russia, will meet Wednesday to decide on production policy for March. Delegates from about half the coalition’s members say they expect the group to ratify another 400,000 barrel-a-day supply hike.
Ron
Russia’s comment on today’s increase.
“OPEC+ decision to enable Russia to resume oil output by 90%, says Deputy PM Novak”
“The conference decided to increase [oil production] by 400,000 barrels per day. For Russia it means that in March it will be able to additionally increase [production] by 100,000 barrels per day again. It will enable us to restore the level of reduced volume by 90%. As a reminder, in May 2020 Russia slashed production by 2 mln barrels per day, and considering the decision made we will see 1.8 mln barrels per day recovered as early as in March,” he explained.
https://tass.com/economy/1396813
Ovi, I have no doubt that Russia can restore production to 90% of their reduced level. They reduced by 2 million barrels per day so they are saying they can get to within 200K barrels per day of their pre-pandemic level. They are now within 300K bp/d of their pre-pandemic level. So they have another 100K bp/d to go before they get there. I think they can make it. But really all they are saying is that their production capacity has declined by 100K bp/d per year. Will that decline continue?
Ron,
The highest 12 month output that Russia has reached (post Soviet era) is 11.3 Mbpd. They do not expect to achieve that by March, but if condensate is 900 kb/d (a guess by Ovi) and they continue to increase output by 100 kb/d each month, they would get there by April 2022, unclear if they can do it but we will know by May 1 or so.
Dennis
This is what I recall reading.
” If condensate output was the same as in November — some 930,000 barrels a day — then daily crude-only production was around 9.973 million barrels, about 37,000 barrels below its December quota.”
https://www.worldoil.com/news/2022/1/3/russia-s-weak-december-oil-production-signals-lack-of-capacity
Dennis, the numbers quoted by both Ovi and I are C+C, not crude only. The numbers quoted by the Minister of Energy are also C+C. The numbers cut by Russia for the covid demand collapse was 2 million barrels per day, C+C. They are speaking of restoring 90% of that cut by March. That would be 1.8 million barrels per day C+C. That would put them at 200K barrels per day below their pre-covid level, or 100K barrels per day, C+C, above where they are now.
It is pretty clear what the Minister of Energy was saying, Dennis. And I stand by my math above.
OPEC just confirmed another 400 kb/d for March. Targets attached. Note that SA and Russia must both supply 10,331 kb/d. With Russian condensate around 900 kb/d, that implies 11,231kb/d of C C for March. About 231 kb/d more than in Ron’s chart above.
Saudi Arabia has historically had trouble maintaining production above 10 million barrels/day so they’re probably maxed out at the moment.
https://d3fy651gv2fhd3.cloudfront.net/charts/saudi-arabia-crude-oil-production.png?s=saudiarabcruoilpro&v=202201181548V20200908&d1=19220227
Frugal
I think from March going forward, we will begin to see increasing stress put on the SA supply capabilities. Every month their promised supply increment increases by slightly over 100 kb/d, 104 kb/d for March. Same for Russia.
I will be watching the SA stocks to see if they continue to fall.
At some point OPEC plus will need to adjust quotas to those that might be achieved. Otherwise the quotas mean very little. I don’t think they want to admit they are approaching or may have reached maximum capacity.
UPDATE 1-U.S. crude, distillate stockpiles fall; gasoline builds – EIA
Feb 2 (Reuters) – U.S. crude oil and distillate inventories fell last week as fuel demand increased to its highest level since August 2019, the Energy Information Administration said on Wednesday.
Crude inventories fell by 1 million barrels in the week to Jan. 28 to 415.1 million barrels, compared with expectations in a Reuters poll for a 1.5 million-barrel rise. Supplies have been declining over the past two months due to strong demand and as production struggles to keep up.
These weekly numbers are just a random walk. There are imports and exports of oil and products – and such a tanker hauls more than a million barrel. So nothing only the smoothed monthly curve is of any value.
I assume the SPR numbers are accurate.
If so, the SPR hasn’t been this low since 2002.
The long term is exact – in the weekly data there are wild swings. Depends much on if a tanker has unloaded or loaded, these weekly +2 or -2 million barrel storage change can be just one big tanker departing or coming extra. The biggest almost carry 4 million barrel of oil or products.
So it’s a random walk even when the data is exact. Too fine time scale to see anything – the most important thing for this data is the computerized oil future trading. Monthly smoothened averages are important.
The SPR data should be accurate.
For the real overview and the oil price prediction the world storage is important – oil can be transfered easyly, or stored floating or evade counting at all. This is not an easy job, the EIA just got 200 million barrels missing (That’s why I think oil prices will be strong short term).
Don’t know if anyone has seen this yet, but Russia, who produces just under 62% of the globe’s ammonium nitrate, has just banned exports for 2 months (at least)
https://www.fertilizerdaily.com/20220202-russia-stops-the-export-of-ammonium-nitrate/
They are holding on to it to ensure they have enough for themselves over the next year.
I shouldn’t need to explain how serious this is for global food production if this export ban is extended.
It also emphasises to me the importance of the Export Land Model to understanding how the downward descent will catch most by surprise as the Power Law kicks in on available exports of fossil fuels and their essential products.
The Western politicians seem to forget that sanctions can be reflected back too. Belligerent actions have consequences. So too does infinite growth magical thinking.
I hereby announce that the “Peak Fossil Fuel Age” descent has begun.
Buckle up kids.
Why Canadian gas prices have hit record highs
No obvious signs that high gas prices are reducing traffic on this side of the border, although some people are second guessing their purchase of a gas guzzler.
EIA reported inventory this morning. More interestingly is how their weekly production numbers peaked in the last two weeks of December at 11,800 kb/d and have dropped every week since to 11,500 kb/d last week.
I understand there is lot of skepticism about these numbers but they must be getting some kind of info indicating that production is dropping.
Ovi,
That is simply a reflection of the STEO which is the basis for the weekly estimate of L48 output (including GOM). Notice the weekly data vs monthly from March to July 2021 and in Sept 2021, I often say the weekly data for output is just not very good. Occasionally it is correct, mostly it is not.
Footnote from STEO
Domestic crude oil production includes lease condensate and is estimated using a combination of short-term forecasts for the lower 48 states and the latest available production estimates from Alaska… For more details see Appendix B, under “Data Obtained Through Models
From Appendix B (page 38)
EIA estimates weekly domestic crude oil production using a
combination of short-term forecasts and the latest available production estimates from Alaska. The four data elements contributing to the estimate are:
• the most recent Short-Term Energy Outlook (STEO) model estimate (including interim estimates) for average daily production for the lower 48 States and the Federal Gulf of Mexico (GOM) (STEO Table 4a: http://www.eia.gov/forecasts steo/data.cfm?type=tables);
• daily production volumes delivered from the North Slope of Alaska to the Trans-Alaska Pipeline System (TAPS) (reported to EIA by the Alyeska Pipeline Service Company);
• daily volumes of natural gas plant liquids produced on the North Slope delivered to TAPS (reported to EIA by BP); and
• daily production for South Alaska estimated from monthly production reports (lagged by two months) from the Alaska Oil and Gas Conservation Commission (AOGCC).
Most of the uncertainty in the weekly estimate is associated with
the STEO forecast for lower 48 and GOM production.
An STEO from Jan 2021
These get revised each month as you know.
Dennis
I think it could be a message that the November output number published on Monday is a bit high. The weekly October and November numbers are close to the monthly average. Maybe their methodology is improving.
Ovi,
Yes you keep suggesting their methodology may be improving and you have been saying this for quite a while. I would suggest a broken analog clock os correct two times per day, this analogy is fairly close to the weekly estimates, I see no improvement. The basis for the weekly numbers is the STEO which changes month to month. The PSM is somtimes off a bit and gets corrected, we will know in the future if that proves to be the case for the November 2021 estimate. Maybe there is something going on on the GOM or Alaska where output is down by 250 kb/d or the tight oil estimates are incorrect. I just think it more likely the weekly data is wrong as is often true.
I am sure we have discussed this before.
Where does the EIA obtain data?
The monthly should be accurate if EIA is receiving the data from the states and from the crude oil purchasers.
The monthly data should not be estimates, but hard data from sources that have a very strong motive to be accurate, as a lot of $$ depend on the accuracy.
IHS posted December, 2021 production for our field a week or so ago. I looked it up and compared it to our records. It is accurate. Both 12/21 and annual for 2021. Cumulative too. IHS buys the data from the crude oil purchasers. IHS lists the purchaser for each lease. This was also accurate for our leases.
Surely EIA obtains data directly from crude purchasers?
Shallow sand,
The EIA tries to estimate, there are a lot of people in the market, too many to collect all the data perhaps. The EIA surveys large producers that represent about 90% of the market and then estimates the other 10%.
See the following spreadsheet from EIA
https://www.eia.gov/petroleum/production/xls/comp-stat-oil.xlsx
Also check out methodology PDF at following page (right side of page just above FAQ and map).
This is how they do their early estimates and they also look at state data, but some states report production levels quite late (see Texas tab). Note that the EIA survey of large oil and gas producers is called the 914 survey.
https://www.eia.gov/petroleum/production/
When I use the 914 survey to estimate TX and NM output and compare with EIA tight oil estimates for Permian and Eagle Ford over the March 2021 to November 2021 period, I find Texas and New Mexico’s combined output of C plus C increased by 479 kb/d. Permian and Eagle Ford combined output increased by 206 kb/d over the March to November 2021 period, the difference (conventional output in the two states) is 273 kb/d or an average monthly increase of 34 kb/d for conventional vs an average monthly increase of 26 kb/d for Permian plus Eagle Ford output over the March to November 2021 period. Despite all the talk of Permian increased output, for most of 2021 the increase has been modest (a monthly increase of 30 kb/d from Mar to Nov 2021 or an annual rate of increase of only 360 kb/d). The increase in conventional C plus C output has been more impressive over the past 8 months in Texas and New Mexico.
Shallow sand,
It may be that the EIA can buy the data from IHS, but they may not be able to report proprietary data. The IHS database is very expensive proprietary data as far as I understand. If the job was easy, the data would be cheap.
Dennis
I think part of the answer lies in the eye of the beholder. When I look at the data from July 2021 to November, my eye says the correlation is damn good, considering they are 8 to 12 weeks ahead of the EIA monthly numbers.
Let’s see what happens over the next few weeks after the STEO comes out next week.
Ovi,
My main point is that most of the weekly estimate (aside from Alaska) is based on the STEO. You have correctly pointed out in the past that there are significant changes in STEO projections month to month, this is part of the reason the weekly estimates are not very accurate because it is based on a forecast which is by its very nature prone to error.
My expectation is that this will continue in the future, as the nature of statistics is not likely to change. The basic premise is an infinite number of possible future projections, pick any one of those possibilities out of a very large hat (it would be infinitely large), odds of success is exactly zero.
Ovi,
In short, there is no methodology which can improve projections of the future, they will always be incorrect, except by random chance for a few weeks where the projection may be roughly correct.
Found my old post from Jan 2021 and picked the medium price, medium TRR scenario with ERR of 64 Gb (note that based on my current expectations of future oil price this scenario would be revised to perhaps 33 Gb. In any case the model to Dec 2022 is compared with EIA tight oil data through Dec 2021 in chart below. I missed badly over the near term.
Old post at link below
https://peakoilbarrel.com/permian-basin-the-death-of-tight-oil-has-been-greatly-exaggerated/
Oil production in Russia grew by 7.9% in January
February 02 / 11:28
Moscow. The volume of oil and gas condensate production in Russia in January increased by 7.9% compared to the same period in 2021 and amounted to 46.53 million tons. Average daily production is fixed at 11 million barrels.
Since the beginning of the year, Rosneft has produced 14.31 million tons, LUKOIL – 6.82 million tons, Surgutneftegaz – 5.17 million tons, Gazprom Neft – 3.28 million tons, Tatneft – 2.44 million tons, Bashneft – 1.63 million tons, Slavneft – 990.1 thousand tons, NOVATEK – 660.18 thousand tons, ”Interfax reports the CDU TEK data.
Other subsoil users, including Gazprom and joint ventures with foreign investments, produced 7.83 million tons of oil and gas condensate in the first month of this year.
The CDU TEK still accounts separately for Bashneft’s production, despite the fact that since 2016 the company has been part of PJSC NK Rosneft.
Operators of the Production Sharing Agreement (PSA) produced 1.4 million tons of crude oil during the specified period
Is this growth in Russian oil production just a rebound from Covid cuts?
Yes, that is exactly what the Russian Minister of Energy is saying. And he is saying they will get 90% of the way there. That means they will still increase production by 100K barrels per day in the next two months, February and March. That is exactly what they have increased in the last two months.
They can probably increase 100K bp/d in the next two months. That will put them just 200K bp/d below their pre-covid level. They hope to hold at that level. I doubt they can do it.
These charts show the EIA reserve data for Eagle Ford and Bakken. In conventional fields there are usually upward revisions and adjustments to initial revision estimates often in just after the initial discovery (in appraisal) or just after start-up (these relative revisions have tended to be declining as technology has improved the accuracy of the initial estimates). In comparison these tight oil plays (including Permian shown previously) the revisions seem to get, on average, increasingly negative. Some of this is price – i.e. the biggest negative revisions were in 2015 and 2020, but the 2015 reductions did not get added back on as price recovered (we’ll see what happens in 2021). I think the larger effect is that the expected ultimate recovery from wells was not known when the initial reserve estimates were made There were no examples of fracked horizontal wells that had been run to end of life so everything was based on best guesses and unverified models. As wells are starting to exhaust the information becomes available and it is being shown that the initially estimates were overly optimistic (and more than a little so – the adjustments are continuing to be of the same magnitude as the yearly production and growing).
George Kaplan,
Note the difference in oil price between 2013 and 2015, the oil price never recovered to the 2013 price so we would expect fewer marginal reserves would ever return to profitability. In this case (2020 reserve adjustments and revisions) the oil price was $57/b in 2019, $39/b in 2020, and $68/b in 2021 so we might see cumulative revisions increase in 2021 and if oil prices rise to $90/b in 2022 we may see cumulative revisions continue to increase. I imagine by 2019 there was a pretty good understanding of new well EUR for Bakken/Three Forks, the drop in reserves in 2020 is likely a reflection of the drop in price. In 2014 the oil price was $98/b and in 2015 it was $49/b, there may be a threshold effect here where at $49/bo more reserves are barely profitable, but at $39/b very few tight oil reserves will be profitable and must be taken off the books.
The R/P numbers have remained stable or slightly falling so decline and depletion are pretty much keeping in step. Reserve replacement ratios have been falling as has the proportion of non-productive reserve (mostly made up of production in development that has been approved and funded but not yet bought on line (indicating the new development opportunities are being exhausted).
The negative revisions are more pronounced for EF. I don’t know how all the net sales can be positive in a closed region but I think it may be that EIA may not include all companies, especially some with non-productive resources, which are sold to larger companies for development. Almost all the real discoveries were made early in the basins’ development and the figures shown really just show the effect of FID decisions to develop the resource (steadily declining with a some wobbles added as the price changes, but with less of an effect than I’d have expected).
I don’t know why the R/P for EF is so much less than for Bakken. It implies that the wells and fields decline faster there, but it seems to be levelling out at about 7 years which is a reasonable value for majors and larger independents.
p.s. The IEA meeting that was due this week to decide whether to make all data freely available has been postponed to late March. There seems to be growing belief that the outcome will be positive as the argument that the IEA is funded by taxpayers and they should therefore have access to the product is quite strong.
Great stuff George Kaplan, thank you! The idea of overestimating EUR seems to ring very true for the Eagle Ford especially from 2014 to 2019.
From post above: I don’t know why the R/P for EF is so much less than for Bakken. It implies that the wells and fields decline faster there, but it seems to be levelling out at about 7 years which is a reasonable value for majors and larger independents.
My response: Actually, the converse is mostly true, at least in my experience. Mike Shellman wrote an article that highlighted the superior long-term productivity of Bakken wells (I know it was in 2019). I will try to find, or if Mike is reading along perhaps he can reference it.
I really like the Bakken, especially areas where a good couple of sections are HBP and the holding well has chugged along. Oddly, some of these old wells improve when child wells are fracked. And many of those wells are in areas where the field gas is 20-25% C2H6, which is not only a superior lifting gas but also seems to clean out the perforations down deep in the shale. The ethane onsite is mostly unwanted–since it’s a GHG with a much higher score than methane (and gave the Bakken a black eye), and the results of re-injection by far outweigh the cost. This seems especially true for the Three Forks Formation.
The Bakken is full of surprises. Another is that some of the biggest wells are coming in smack in the middle of Tier 3 property–especially in Dunn County. At least they were, prior to the pandemic. The Bakken hasn’t recovered much from the flooded market and that one negative day when you couldn’t give oil away free.
The Bakken has gotten pummeled by lack of infrastructure and also thicker shale in more stacks in the Permian. But refinement of completion techniques and new innovation continue to amaze me. I have no idea how well the Bakken will perform in the future, of course, but there are some thin layers that are exceptionally oil-dense.
My grammar wasn’t very clear. The “there” referred to with the faster decline rate is the EF (decline rate average for a year is the inverse of R/P so EF is around 14% and Bakken 8% over the whole basin).
You know me, Gerry, the cynical old bastard I am; I don’t believe the EIA’s estimates of PDPR is anywhere close to being correct; terminal decline rates in the EF at 50 BOPD seem to be 15% annually and might be accelerating. Estimating R/P is difficult, at best; is this EIA reserve estimating based on DCA, is it internal, so called “independent reserve” studies from companies (which we know were exaggerated by 30-40%), what companies and where? Personally, I reckon PDPR/P is much closer to 4.0-4.5
The article you reference I seem to recall was based on Rune Likvern’s work and the debate was that an average Bakken well was better than a average Wolfcamp well, something like that. It is; Rune is correct. Or was. When normalized for lateral length, proppant and water, 2020 and 2021 “Bakken” well productivity IS declining and the decline appears to be accelerating. GOR is flat going thru the roof. I hope the little surprises in the Bakken will make you some money and hope you are doing well, sir.
With Collin Eaton’s WSJ article finally out I am happy to say there are now seven of us in the entire world, it seems, that understand what declining well productivity in core areas of America’s tight oil basins actually mean. All those folks believing in tight oil “abundance” thru Tier 2, 3, multi-bench… hope, will find out soon enough how good all that goat pasture really is.
https://www.wsj.com/articles/fracking-oil-prices-shale-boom-11643824329
I am not an oil techie but have been around long enough to understand the conversation on tier 1 and benches . The gist is this , the technologies (3 mile laterals etc ) are only going to milk the ground faster . By the way who is going to buy the shale oil ? Export it at a discount . No mention of costs . What is needed is light or light/ heavy category to enable a good blend for refineries . Of course no need for me to elaborate as Mike S as written “All those folks believing in tight oil “abundance” thru Tier 2, 3, multi-bench… hope, will find out soon enough how good all that goat pasture really is.”
Putting lipstick on the pig is not going to make it Aishwarya Rai ( Miss World ) .
Mike:
Thanks for your response. I too think the shale oil business is headed over a cliff. But it would appear that the cliff is global–just different. Consider the major oil-producing areas around the world and you come up with one giant decline curve. This could hit all at once. Bam! No electricity or pharmaceuticals and hip joints.
I’m actually a big fan of conventional oil drilled in a common-sense way. But like oil itself, common sense seems to be on a declining curve, headed over the cliff.
The world is transitioning to renewables and EV’s, not because the world really cares but because there are too many subsidies to turn it down. The problem with that is that the REE’s needed for all those things are controlled by China, just as the nitrogen fertilizer for Europe is largely controlled by Putin. No REE’s, no new wind turbines, solar panels, EV’s, lithium battery storage units.
As far as credentials, I am all hat and no cattle. I inherited some Hogshooter formation, acquired in the Land Rush, and passively own quite a bit of shale (which is not making me all that much money) and am an active partner in some conventional wells. My musings these days are mostly hope bolstered by a little Sam Houston bourbon. I’m older and my white collar criminal attorney daughter thinks all of this is evil (as do the majority of the young), so I’m in the process of throwing in the towel.
Sounds pathetic, as I write it–like a group therapy session: “I’m Gerry and I’m an oilaholic.” “Hi Gerry.” “I don’t have enough Tier-1.” “Oh shit, Gerry!”
I watched my grandfather’s blowout gusher (1952 Ram blowout preventer; every Oklahoma well more or less blew out) peter out in the space of a month. This is deja vu. I find myself wishing for some damn virtual reality glasses that will make things the way I keep dreaming them.
Back to group therapy: “I am very hopeful that the plasma pulse fracking that the Russians invented will work to ‘dry-frack’ some of these lost causes.” “What about cost?” “The cost is very low, when you put it against water and proppants.” “Is it any better than electroshock for depression.”
Before I got booted out of the pay-wall, I read through several of the comments on the WSJ article https://www.wsj.com/articles/fracking-oil-prices-shale-boom-11643824329
Many retired commenters are claiming a cornucopia of oil riches await us. One said that since oil is seeping onto California beaches that there is abundance off the coast. Someone else said seepage is just seepage. So it may be lots of WSJ subscribers watching over and protecting their nest-egg investments.
Paul, you should post this on the latest post. This one is rather stale and no one is following it anymore.
Go here: US Recovery Boosts October Non-OPEC Oil Production If you post it there I will have a reply.
Mike,
About 90% of the reserves are reported to the EIA by large producers, the other 10% (from may smaller producers) is estimated by the EIA. From the reserves report: (page 2)
To prepare this report, we collected independently developed estimates of proved reserves from a sample of operators of U.S. oil and natural gas fields with Form EIA-23L. We use this sample to further estimate the portion of proved reserves from operators who do not report. We received responses from 371 of 404 sampled operators, which provided coverage of about 90% of proved reserves of oil and natural gas at the national level.
It is not clear how they estimate the other 10% of reserves based on the reports they receive from large operators.
Nigeria just taken another hit to production.
https://twitter.com/thecableng/status/1489159226958176258?t=s23c29JN7CgeM2YcM_92IQ&s=19
Seems to have happened while in a terminal so may have bigger impacts than just the loss of its relatively small production capacity – terrorism? accident (knackered old ship)? insurance? (owners are bankrupt). Ten missing at the moment.
From the WSJ:
https://www.wsj.com/articles/fracking-oil-prices-shale-boom-11643824329?mod=hp_lead_pos10
Oil Frackers Brace for End of the U.S. Shale Boom
Limited inventory leaves the industry with little choice but to hold back growth, even amid high oil prices
The end of the boom is in sight for America’s fracking companies.
Less than 3½ years after the shale revolution made the U.S. the world’s largest oil producer, companies in the oil fields of Texas, New Mexico and North Dakota have tapped many of their best wells.
If the largest shale drillers kept their output roughly flat, as they have during the pandemic, many could continue drilling profitable wells for a decade or two, according to a Wall Street Journal review of inventory data and analyses. If they boosted production 30% a year—the pre-pandemic growth rate in the Permian Basin, the country’s biggest oil field—they would run out of prime drilling locations in just a few years.
Shale companies once drilled rapidly in pursuit of breakneck growth. Now the industry has little choice but to keep running in place. Many are holding back on increasing production, despite the highest oil prices in years and requests from the White House that they drill more.
The limited inventory suggests that the era in which U.S. shale companies could quickly flood the world with oil is receding, and that market power is shifting back to other producers, many overseas. Some investors and energy executives said concerns about inventory likely motivated a recent spate of acquisitions and will lead to more consolidation.
Some companies say concerns about inventories haven’t factored into their decisions to keep output roughly flat. For several years before the pandemic, frustrated investors had pressured companies to slow production growth and return cash to shareholders rather than pump it back into drilling. Companies have promised to limit spending, though some executives recently said high prices signal a need for them to expand again this year.
U.S. oil production, now at about 11.5 million barrels a day, is still well below its high in early 2020 of about 13 million barrels a day. The Energy Information Administration expects U.S. production to grow about 5.4% through the end of 2022.
Big shale companies already have to drill hundreds of wells each year just to keep production flat. Shale wells produce prodigiously early on, but their production declines rapidly. The Journal reported in 2019 that thousands of shale wells were pumping less oil and gas than companies had forecast. Many have since marked down how many drilling locations they have left.
Some shale companies will eventually have to start spending money to explore for new hot spots, executives and investors said, and even then, those efforts are likely to add only incremental inventory. Few are currently doing so.
There is more but I don’t want to completely copy the article.
rgds
WP
WEEKENDPEAK —
If the largest shale drillers kept their output roughly flat, as they have during the pandemic, many could continue drilling profitable wells for a decade or two… If they boosted production 30% a year—the pre-pandemic growth rate in the Permian Basin, the country’s biggest oil field—they would run out of prime drilling locations in just a few years.
Is WSJ saying they can’t go on growing at 30% a year for decades? Well, I agree with that, because 20 years at 30% growth is about 190 fold increase. Not what I would call deep analysis though.
Iraq produced well below its OPEC+ crude quota in January
Iraq pumped 4.16 million barrels per day (bpd) of oil in January, below its allowed limit of 4.28 million bpd under a pact with other so-called OPEC+ producers, data from state-owned marketer SOMO seen by Reuters showed on Thursday.
Iraq, like several other OPEC members, is struggling to pump more even as prices trade at a seven-year high.
Its output actually fell by 63,000 bpd from December, the data showed.
Iraq’s January exports were affected by adverse weather conditions, technical issues, and maintenance on export facilities, an Iraqi oil official told Reuters.
Insufficient storage capacity forced Iraq to reduce production, the source said.
The SOMO figures included output from Iraq’s semi-autonomous Kurdistan region, which produced 425,000 bpd, according to a Reuters calculation.
OPEC pumped 28.01 million bpd in January, a Reuters survey found on Monday, up 210,000 bpd from the previous month but short of the 254,000 bpd increase allowed under the supply deal.
Production fell or did not increase in Angola, Congo, Iran, Iraq and Libya, the survey found, in many cases owing to a lack of capacity to produce more or because of unplanned outages.
https://www.reuters.com/business/energy/iraq-produced-well-below-its-opec-crude-quota-january-somo-2022-02-03/
OPEC+ Can’t Meet 400,000 B/D Output Hike Target: Yergin
A 5:43 minute video where Yergin says only Saudi Arabia and the UAE have any spare capacity. He says several of the countries have peaked out and cannot reach their previous level of production.
IHS Markit Vice Chairman Daniel Yergin says OPEC and its allies will struggle to fulfill the nominal increase of 400,000 barrels a day pledge that the group rubber-stamped on Wednesday. “The basic fact is that they’re not actually able to put out 400000 barrels a day — so what you really have is a very tight oil market,” Yergin said on “Balance of Power.”
Yes – a cap turns into a quota, then a goal, then a pipe dream…and somewhere along this spectrum, into a lie.
Copy /paste from Our Finite World .
As I have stated before, I work in the northern Alberta oil patch. I am maintenance support for 400 ton haul trucks, 7 million dollars each and burn massive amounts of fuels and swimming pool amounts of oil to work. There is an huge reserve of oil locked in the sand up here, it’s covered by a large bank of overburden, up to 60 meters thick. Shovels and trucks dig the overburden and truck it 15 KMs away at times. This mine is old and as the resource is chased further away the mining haul is also longer each year. Mining costs are always in the upward pressure.
Now add in supply chain issues. We are parking 7 million dollar assets so we can rob parts off of them to keep other 7 million dollar assets going. Hose parts, the fittings crimped on the end of hoses, are currently out of stock, everywhere. Coming from China with no ETA for replenishment. Wiring harness, filters, sub component parts to repair major components, oil additives, anything with electronics in it (sensors, modules, electronic controls) all in short or non existent supply.
So we have the second largest supply of oil on the planet locked a mere 60 meters underground and we are losing the ability to dig it up based on supply chain issues. This is just mining, the extraction and upgrading process is facing the same headwinds.
Just because it’s there doesn’t mean a damn thing until it’s in the pipe. ”
Read the last line and better get a tattoo .
Cue the movie where the West succumbs to China and Russia as more and more “supply related issues” cripple their economies. Midway through the movie, “We interrupt this program to bring you the latest climate disaster report.”
Funny, this was the answer of the socialistic DDR for excavating brown coal in round about 60 meters depth:
https://en.wikipedia.org/wiki/Overburden_Conveyor_Bridge_F60
They dug free one site, and deposited on the other with this giant behemoth (13000 tons drivable at 0.5 Mph). Coal was transported by mine rail to the power plant. When the power plant was more than 10 miles away, they rebuild it nearer.
Everything electric (powerer by the own electricity), and the plumbing and wiring looked like yours – in socialism spare parts have been, ahem, sparse…
I’ve visited it once, it feels like a steampunk fantasy fallen out of time when you stand in the uppest control room 50 meters above the surrounding land.
4 of these are still in work, after 50 years.
Really cool – thanks!
Rgds
WP
Frugal
WTI just punched a $90 ticket. Hasn’t settled yet. WTI has been down most of the morning but something must have happened with the last hour to make it move up.
So now I see a slow climb to $110 by year end and get to my guess of $100 average.
👍👍👍👍
Yes I saw that but I have no idea why WTI is spiking upwards — something must be going on? All of a sudden $90 – 100 oil doesn’t seem so far fetched anymore.
Frugal
Just saw this on CNBC and reported here
WTI crude fell as low as $86.75 today on negative risk sentiment but it’s completely turned around. The latest leg might have come on the reports that Russia is planning a false flag operation and propaganda video in Ukraine.
This is a fresh seven-year high and another example of the insatiable appetite for crude right now.
https://www.forexlive.com/news/wti-crude-oil-hits-90-as-the-drums-of-war-sound-in-ukraine-20220203/
Here’s some news:
WTI Crude Passes $90 a Barel for the First Time Since 2014
West Texas Intermediate rose as much as 2.4%, trading above $88 a barrel as traders doubted that all members of the OPEC+ coalition will be able to meet their quotas in full even after agreeing to add supply to the market. Meanwhile, extreme cold in the Permian Basin is halting some out in the U.S. most prolific oil field.
Dollar is down, bond interrest up and ECB wants to hike in autumn.
ECB is a nut case .
LAGARDE: INFLATION IS TOO HIGH BUT WE LEAVE THE INTEREST RATES AT 0% BECAUSE WE’RE NOT BEHIND THE CURVE”.
UK another one
Raise interest rates by 0.25% and inflation is 7% .
Cost-push inflation ain’t going to be solved by these monetary measures. We’re basically stuck in this until people just fall out of the market for things.
Fortunately, the UK treasury is doing its best along with the BoE to kill off discretionary spending ASAP.
WTI will settle around $90.07. That is where it is riding at 2:34 EST
WTI settled at $90.27.
Settlement must have been a tricky and difficult procedure today because as I noted above, WTI was trading at $90.07 at 2:34. Usually settlement is a few pennies away from where it is trading at that time.
I don’t believe a damn word of it. This article says peak oil demand could be here by the middle of this decade.
Peak Oil Is Coming
The latest note from Carbon Tracker warns that Peak Oil demand is coming sooner than most people think and could lead to stranded assets and massive losses.
It may not appear so at the moment, as energy in all forms is in massive demand, coming out of the economic doldrums of the covid epidemic. But climate change makes a case for a rapid fall in the middle of the decade as renewables outpace fossil fuels in supplying the world with energy.
SNIP
The Carbon Tracker analysis explores the financial implications of a scenario where oil demand grows in the short term before falling rapidly in mid-decade. Shareholders could lose $530 billion of capex this decade under a high-investment scenario — “as demand starts to decline and the oil price falls back to c.$40. This amount would double at $30/bbl
Ron
I agree. Oil will be in demand for a very long time for industrial purposes. The world is slowly beginning to wake up to the fallacy of peak demand. These people only see electric cars and think that will solve the problem. Slightly misguided.
Ovi,
Much of World demand for crude oil is for land transport, plugin vehicles may be 50% of the World light duty vehicle fleet. In fact demand may have fallen to below supply by 2025 and very likely this will be the case by 2029.
This does not mean there will be no demand, simply that it is likely to peak in the 2025 to 2030 period.
Dennis
I just don’t believe that PHEVs and BEVs will penetrate that fast. I still think that we hit 50% EV sales close to 2030 and 2030s might be a more realistic time frame for peak demand as the fleet of EVs increases. Not sure what the fleet mix will be by 2030s.
Ovi,
Yes many are skeptical, but as more people are exposed to EVs and plugins and as the price of petrol and diesel fuel rises, the transition could be swift. In 2021 plugin vehicle sales increased to roughly 6.1 million from 3.1 million worldwide in 2020, if we look back to 2019 to avoid the pandemic slowdown, worldwide sales were 2.17 million. So over the two year period from 2019 to 2021 the average worldwide annual growth rate for plugin vehicle sales was about 52% (found by fitting trendline to natural log of vehicle sales for 2019 to 2021).
The earlier trend from 2014 to 2018 was average annual growth of 45% in plugin vehicles.
Now we have most of the World’s car producers joining the fray.
You may be correct or I may be or the truth may lie between I am saying 50% of sales by 2027, you are saying 2030, maybe 2028 or 2029 will be correct, we are not that far apart.
I also assume much of heavy duty trucking will be replaced with batteries, natural gas, and or rail, with a 9 year lag behind light duty vehicles. If I adjust my scenario to 50% of plugin sales by 2030, peak oil demand moves to 2031. Some of this depends on oil supply, as high oil prices (say $120/b from 2025 to 2028) might lead to World C+C supply reaching 87 Mb/d by 2027 or 2028, even using your assumption of 50% of light vehicle sales in 2030 demand peaks at 86.4 Mb/d in 2026 and by 2027 falls to 86.3 Mb/d, supply may be over that level by 2027 or 2028 and oil prices may start to fall. Note that in my scenarios I make the conservative assumption that this does not occur until 2030 either because EV transition is slower than I have assumed (maybe 20 or 25% growth in EV sales) or oil supply is lower than I have assumed (peak of 85 Mb/d rather than 87 Mbpd).
Dennis
The doubling in sales of PHEVS from 2020 to 2021 is just a reflection of more middle class people with the ability to afford a PHEV and who are CC conscious stepping up and buying. That cohort will saturate in a few years and that doubling will start to slow.
The heavy market is a whole different story. Back in my younger days in the early 80s I was in charge of a group in the government that looked for alternatives for gasoline and diesel. We ran light vehicles on propane, NG, ethanol and methanol. An entrepreneur showed us a car that ran on Ammonia. I recently read he is still pushing ammonia for transporting hydrogen. The conversations and demonstrations for light vehicles was reasonably straight forward. We also demonstrated an electric van with a range of about 8 miles and realized that lead acid batteries would not cut it.
Then we turned to heavy vehicles. That was a different story. We took 275 hp light duty truck engines and put them in buses that used a 275 hp diesel. That didn’t work. The engines were not strong enough. Diesel engines are much stronger and are designed for a heavy duty work cycle.
We then converted diesel engines to run on propane and natural gas. Essentially the diesel injectors were replaced with spark plugs and the propane and natural gas were supplied to the engine through the induction system.
We also tried pilot diesel injection. In that version, the vehicles had a duel fuel system. The diesel injector just injected enough fuel to ignite the natural gas. I have a suspicion that is how LNG carriers are powered. Emissions were a problem.
The heavy trucks that ran on propane and natural gas worked but range was a problem with NG. What worked best in the end was natural gas powered transit buses. What made them successful was putting the tanks on the roof to get the 250 to 300 mile daily range requirement. They can be seen throughout the US and Europe.
GM got into the act with methanol transit buses. Unfortunately the methanol chewed up the engines and broke. They converted our methanol buses back to diesel. The new trend seems to be battery transit buses. Very expensive.
Bottom line. Short range heavy vehicles and delivery vehicles will be the first to shift to batteries. The long range vehicles will stick to diesel and possibly propane until a better lithium battery is developed.
Ovi,
Natural gas may have moved forward a bit.
https://www.naturalgasintel.com/ngvs-and-rng-set-to-make-inroads-across-heavy-duty-truck-fleets/
TCO is pretty low for EVs, and as oil prices increase the comparison will be better for EVs or plugin hybrids.
Ovi/Dennis,
You gentlemen have encapsulated some VERY significant data points in this conversation and you both may want to remember some of the presented info as ongoing developments will have huge impacts on this entire energy/hydrocarbon ‘story’ …
Ovi, what say you about a natgas engine with ~500 horsepower, 1,850 lbs ft. torque, diesel injection?
Cummins is now manufacturing one – the X15N – at their Jamestown, NY plant after a very successful roll out in China.
Dennis, your (over)focus on electrified transportation belies your ‘First World’ (aka expensive) bias in these matters. There are several (cost) reasons natgas vehicles outnumber electric on a global scale by ~5 to 1 (~30 million to ~6 million).
The pace of innovation in the adsorption field is matched by the rapid spread/availability of global natgas. FSRUs, in particular, are enabling far flung locales from Benin, Amazonian Brazil, Cyprus, et al, to economically access what has hetetofore been expensive fuel.
Bottom line, natgas continues to displace liquid hydrocarbons for transportation uses and – with an energy cost differential a factor of 3 – this transition will not only continue, it will accelerate in tempo.
Ripple effects will be tectonic.
Dennis
Yes NG heavy engines have come a long way.
Here is what Mr Nastri said.
“Wayne Nastri, executive officer of California’s South Coast Air Quality Management District, has touted near-zero emission natural gas trucks as “‘a readily available technology that can reduce nitrogen oxide emissions by more than 90%.”
Yes NG engines have come a long way but you have to be careful of how one interprets what is written and said.
For instance Mr Nastri throws in the words “Nero Zero emission natural gas trucks” and muddles it with nitrogen oxide. I think the average reader would notice Nero Zero and not nitrogen oxide. To say near zero emissions is no more true than there is a man on the moon or tons more of Tier 1 areas in the Permian.
Here is what the Cummins site says
For customers operating in non-attainment zones, the L9N Near-Zero (NZ) is the Smart choice and is certified to the CARB near-zero standards of .02 g NOx/bhp hr.
That was one of the big advantages we saw in the late 80s as we worked with Cummins to develop NG transit bus engines.
https://www.cummins.com/engine-applications/transit-bus
“Neandross also sees natural gas becoming a more viable option to diesel fuel in long-haul interstate trucking, thanks to the availability of more powerful and longer-range natural gas engines. Specifically, he cited engine manufacturer Cummins Inc.’s recent announcement that it would introduce a 15-liter natural gas engine in the North American market.
Yes Cummins is working to build bigger engines for long haul have trucks. The engine is the easy part now that they have many years of experience with NG engines. The problem is still where do you put all of the NG tanks to let the truck travel 400 to 500 miles.
I will tell you a bit of a funny story. I made my final pitch to Cummins management in the Mid 80s and to the head of research and waited for their questions. I answered a number and then the head of research spoke.
Vinod said “Ovi you are crazy”. My heart sank and my boss’ head dropped. You know how much more inefficient a spark ignited engine is over a diesel and you still want to go ahead. I said Yes.
Vinod said something along these lines. Here is the good news. As crazy as you are, I am going to tell management that we need to support your research because four years from now I don’t want to read an SAE paper detailing how well NG in a diesel turned out to be. I am paid to keep ahead of the competition.
Cummins then worked with a research firm to convert their diesel transit bus engine to Natural gas. GM went the methanol route and that didn’t work. The rest is history.
Mercedes in Europe then also offered a NG bus engine.
“Natural Gas Technology (NGT) from Mercedes-Benz is a perfect solution for highly burdened urban centres. The Conecto NGT and the articulated Conecto G NGT both supplement the variants powered by proven and powerful combustion engines as sustainable alternatives. This way it retains the characteristics of a diesel engine and combines them with environmentally-friendly natural gas technology and low consumption figures. Depending on the field of operation and gas quality, the Conecto NGT emits less CO2 than conventional diesel-powered buses. Thanks to its vertical installation position, the engine is additionally maintenance-friendly and reduces costs.”
Hey Coffee , I like your posts because they are in La La Land . So here we go .
” Bottom line, natgas continues to displace liquid hydrocarbons for transportation uses and – with an energy cost differential a factor of 3 – this transition will not only continue, it will accelerate in tempo.
Ripple effects will be tectonic.”
Where is the gas ? Europe and Asia living shipment to shipment ? So take a pick natgas for food production or for six pack Joe to go to the nearest Walmart to pick up a six pack of Budweiser ? In what world you live in , I frankly don’t know but I am based where 2/3 rd of the human race is living ( it is called Eurasia ) . Adois Amigo .
P.S : I find all your posts amusing because you talk of tech but never of costs . The golden rule ” What is technically possible may not be economically possible ” . Ever hear about gold mining the sea ? No , you have not . Just confirms ” Ignorance is bliss “
Ovi and Dennis , you are aware that I respect your views besides disagreements on some issues . Understand CNG/ LNG/ LPG will never transit to commercial fuels . The NSA in a
report after 9 / 11 built up a scenario where a tanker of CNG/ LNG/ LPG was blown up by
“terrorists ” in mid Manhattan . It was a disaster scenario . Understand for the politicians
” Better safe than sorry ” is the rule . QED . I rest my case .
Hole in head,
BEVs could be used in cities and CNG for longhaul trips from city edge to city edge, or electrified trains could be used for long haul land trips. There are options.
Coffeeguyzz,
Natural gas will also peak and NG is not a good long term solution for land transport, it may work as a bridge fuel while batteries for heavy duty trucks and possibly more electrified rail is installed. Despite what you seem to believe, natural gas is limited, just like oil. It also contibutes to global warming so we need to find better long term solutions.
Ovi , apologies . Normally I would not comment to this post , what got my antenna was the name ” Vinod ” . An Indian who probably got ” free ” education in IIT( Indian Institute of Technology ) at the taxpayers cost and then immigrated to the US . I have no problem with this . Talent will go where where the benefits are best . My problem is that he carries his caste / racial discriminations with him . Understand I have earlier commented on the other thread the problems with the caste / religion divides in India and how that is going to be fatal for the nation . The NRI ‘s ( Non Resident Indians ) suffer from an inferiority complex ( result of being ruled by the Brits for 300 years ?? ) .The ultra right wing followers of those who immigrated of the current regime feel it their national duty to take revenge . They must always prove that they are the furthest of the furthest in the new society they have adopted . Regret you were a victim . I hope you will understand what you were up against . Better, want to pick up fight with BLM ? The world is upside down .
Dennis , understand this . There are no more options . We are in deep DODO and the faster we recognize is , the better .
As a coincidence, Northvolt, which I´ve mentioned a few days ago, just announced a new battery factory to be built nearby Volvos Torslanda factory, which I´ve visited twice, as well as many Americans picking up their cars ex works to first take a european roadtrip and then get the car shiped to the US.
Anyway, the factory will employ some 3000 people, and produce 50 GWhs of batteries a year. So the transition moves forward, if it will be complete by 2030, who knows…
Disclosure, I own 5-6 Volvos, 142, 244, 245, S80 etc., but only one currently road legal, an S60 possibly up for conversion when the gasoline engine (Mazda/Ford ecoboost 2,0T) quits.
https://northvolt.com/
Coffeeguyzz
Thanks for the info. Somehow I don’t think that NG light vehicles would work in NA and Europe on a wide scale.
The road ahead is clear, electrification of light vehicles
Hole in Head
You need to distinguish between a truck transporting LPG or LNG vs a vehicle operating on NG.
In 2010, New York bought 475 NG busses. They are designed for a 20 year life.
http://www.ngvjournal.com/noticias/vehiculos-es/new-york-will-have-475-new-compressed-natural-gas-buses-4/?lang=es
Hole in Head
I am a bit thick at times and I hope I haven’t given you the wrong impression of Vinod. I worked with him for over 6 months before making the presentation. He was a very capable person and we had many discussions before I met with his management, which he arranged. I think his final comment “I am paid to keep ahead of the competition.” was a clever way of telling his management that they better approve this project.
Hole in head,
I agree there are many problems, we can choose to do nothing or attempt to tackle the problems that we recognize. These are very basic options. There are many possible paths that could be taken in the future, essentially an unlimited set of options.
So on the “no options” comment you completely miss the mark in my opinion.
Dennis,
What is the EV saturation/adoption % of Norway? And how much have their oil and gas consumption declined in %?
Could you perhaps put both in a chart so we can se the curves divert?
Its hard for me to believe that demand will be less than supply in this decade.
One big factor is the price of oil- if it stays high (say over $100/barrel) for 3-4 years there will be an incentive for people/companies to switch to plugin vehicles quicker, and it will also stimulate more oil production.
I suppose that could happen.
Hickory,
Yes the expectation in my models is $100/bo or more from 2023 to 2028, also assumed is 35% annual growth in plugin vehicle sales worldwide for 5 years (over past 7 years the average growth rate in plugin vehicle sales has been about 40% with relatively low oil prices over most of the period.) By 2030 clode to 100% of light duty vehicle sales will be plugins and by 2035 over 50% of the light duty vehicle fleet may be plugins under the assumptions of my electric vehicle transition scenario. In 2028 demand falls to 85 million barrels of C plus C per day which will be less than supply at $100/bo.
The growth scenario might be optimistic, but in the past despite claims by many that my scenarios are wildly optimistic, most of my best guesses have missed the mark on the low side. Except in the case of price crashes due to OPEC trying to regain market share (2015-2016) or worldwide pandemics, these I did not foresee.
I agree wholeheartedly that a high oil price scenario this decade will result in even faster transition to plugin vehicles.
Thanks for making the projections.
How does one project just how long it will take to retire the ICE fleet? People will hold onto ICE vehicles for longer than many suspect – if fuel remains available in their market.
IEA 2021 projections on the global light vehicle fleet are displayed in the chart below.
If you go to the link they have 2 additional charts, with one for OECD countries and another for non-OECD countries. The charts are dramatically different, with ICE vehicles already peaked in OECD countries, and ICE vehicles continue to grow for another 2-3 decades in non-OECD countries.
https://www.eia.gov/todayinenergy/detail.php?id=50096
A lot of this depends on the relative cost of petrol vs batteries, and you can guarantee that this will be rapidly changing. And the other big factor is the general level of global prosperity vs poverty. A more prosperous world will transition to plugin vehicles more quickly.
Hickory,
I assume light vehicles are retired at 19 years on average in my scenario, I also assume the light vehicle fleet tops out at 1.44 billion in 2051. ICE light duty vehicle fleet for World peaks at 1.37 billion in 2023 in my scenario. By 2036 the light duty ICE vehicle fleet falls to 0.73 billion with total light vehicle fleet at 1.44 billion, with 49% of all light vehicles being plugins. By 2033 100% of all new light duty vehicle sales ar plugins in the scenario.
In my view this scenario is conservative, as more people drive EVs they will realize the ICEV is inferior.
Hickory,
I took a quick look at the EIA projection, they have an average growth rate in the plugin fleet of 13.1% from 2021 to 2050. A very conservative scenario would have the World plugin fleet at 1.37 billion in 2050 roughly 2 times higher than the EIA projection. Note that my projection has an average growth rate of 15.9% over the 30 year period from 2021 to 2050 vs 13.1% for the EIA scenario, soa change of only 2.8% in growth rate over 30 years makes a big difference. Note that from 2014 to 2021the average annual growth rate in the plugin fleet was 75% per year (0.321 million in 2014 to 16.52 million in 2021) for plugin fleet size for the World.
I’d definitely vote with/for you on that. They are being slow on the uptake.
However I also believe that the chances are pretty high that global vehicle production (both ICE and EV) will encounter episodes of severe disruption in the next decade or two.
Material shortage, energy shortage, national instability- all affecting production capability.
Impossible to predict timing, severity or extent.
Get your battery vehicles before that. Gas supply disruption is a big part of the risk.
Hickory,
I agree there will likely be many bumps in the road, most of them unforeseen. Most assumptions I make (perhaps all of them) will be incorrect and the model is highly simplistic (it does not consider oil demand besides land transport). Lots of potential for disruption.
Two US output scenarios based on a revised Permian scenario with declining well productivity starting in Jan 2022.
I estimated a new well profile for the average 2020 Permian well with a similar shape as the 2019 well (same b and D for hyperbolic and a higher Q to match the first 11 months of data from the average Permian 2021 well), this allows the model to match output data more closely in 2020 and 2021. I also use the best (highest EUR per acre as estimated by USGS) benches in the Midland and Delaware basins which have a total net acres (acres times success rate) of about 31 million acres at the time of the Permian assessments. I assume about 300 acres per well which would lead to about 103333 total wells, then I apply economics to see how many will be completed, I assume a TRR for these 103333 wells of about 43 Gb, slightly less than the USGS F95 UTRR estimate (44 Gb) for the Permian basin.
Two Permian basin scenarios with same oil price assumptions are created where the only change is the maximum completion rate in the Permian basin, the first scenario assumes a maximum completion rate of 800 new wells per month from August 2025 to Dec 2026 followed by decreasing completion rates (the rate of decrease accelerates over time). The second scenario has a 600 new well per month maximum completion rate from December 2023 to July 2030 followed by linear decrease in completion rate at 10 fewer completions each month. The ERR for the first scenario is 47 Gb and for the second is 45 Gb.
Note that at the end of 2016 there was about 7 Gb of cumulative tight oil production and proved tight oil reserves in the Permian basin, which implies about 40 Gb of undiscovered TRR at that date if my 47 Gb TRR estimate for the Permian basin is correct. (this is 4 Gb less than the USGS F95 TRR estimate). I use Bob Meltz’s old estimate for GOM (mid case), and the trend in L48 onshore conventional and Alaskan oil to estimate non-tight oil. Tight oil is modelled in 5 models (Permian, Bakken, Eagle Ford, Niobrara, and other US tight oil.)
Both scenarios peak in 2027 at 15.6 and 14.1 Mb/d.
For scenarios above the peak in US output is 3000 kb/d above the US output level in 2018 (at World peak) for the low scenario and 4500 kb/d above the average 2018 US C+C output level in 2027. This would be an annual average increase of 500 to 750 kb/d in US output from 2021 to 2027 (6 years).
I have been watching the price of WTI and Brent since they opened a few hours ago. WTI, a few minutes ago, was at $90.75 a barrel and Brent was only 71 cents above that level. Why is the spread so close?
Yes Brent normally trades for several dollars more per barrel than WTI, probably due to the location where the oil is stored/priced.
Here’s a graph of the spread (several days dated):
https://ycharts.com/indicators/brent_wti_spread
Maybe the weather in TX has something to do with it?
7-12 F lows across the Permian Basin.
20-25 F lows across the Eagle Ford.
Unusually cold in some smaller oil producing areas also.
Ron
You have to compare the same months. Brent is on April and WTI is on March and there is currently a backwardation front month premium of $1.92 in WTI
So April WTI is 89.05 and April Brent is 91.60 which gives the more typical spread of 2.50
Yeah, I get it. However, WTI, closest month, March, is now $90.92. How long before it hits $100? And some idiots are still talking about peak demand. Supply, or the lack of supply, is what is driving the price up. How can anything be more obvious?
Ron
Their may be $5 premium in their due to the Ukraine issue.
Ron,
The stories about peak demand are for 2025 to 2030. Obviously if peak demand was now we would not be seeing rising oil prices, they would instead be falling.
Venezuelan customers are returning oil back to Venezuela. Too much sulfur.
Venezuela crude exports reverse course – hit multi-month low in January
Logistics bottlenecks and crude quality issues plagued the embattled national oil company of Venezuela last month, resulting in exports falling by ~1/3 (NYSEARCA:USO). The 200k/d decrease in export volumes, as reported by Reuters, comes at a time when the country is actually seeing strong diluent supply from Iran. Furthermore, production volumes reported to OPEC have been increasing of late.
Ship tracking data and internal documents appear to show customers returning crude last month, an indication that Venezuela is struggling to meet sulfur-content specs. The Country’s storage capacity is near tank-top levels, with nearly 8mb of high-sulfur inventories. Given relatively high inventory levels and limited loading infrastructure, the returned cargoes further reduced export capacity.
ConocoPhillips (NYSE:COP) Q4 2021 Earning Conference Call February 3, 2022 12:00 PM ET
we are guided in everything we do by our triple mandate. We must reliably and responsibly deliver oil and gas production to meet energy transition pathway demand. We need to generate competitive returns on and of capital for our shareholders and achieve our Paris-aligned net zero ambition by 2050. we’re also committed to further reducing our methane emissions and achieving our zero-routine flaring ambition by 2025.
At the end of the year, we had 20 operated drilling rigs and 9 frac crews working in the Lower 48, including those developing the acreage we recently acquired from Shell. there other unique opportunities with the Shell assets? I would tell you that the biggest opportunity in the near term is transitioning from 1-mile wells to 2-mile wells. that’s the low-hanging fruit. And just for a frame of reference, the difference between drilling a 2-mile lateral on those properties and a 1-mile lateral, everything else being held the same, is a 50 basis point improvement on rate of return on well economics, which generates about a 30% improvement in cost of supply.
I think companies like ours and other large companies kind of think more of a sustainable growth rate because that’s really where you get your efficiency is a disciplined kind of growth that allows you to move down the learning curve and lower your cost of supply.
back to the commentary about switching from the 1 mile to the 2-mile laterals, where you even heard talk of an increasing percentage of 3-mile laterals. Yes, Roger, we just — in the Southern Midland Basin, just completed a drilling project that included several 3-mile and one 3.5-mile lateral that we drilled in record time, and have been very pleased with the results and the production from that. So I think that’s a big opportunity for the future. It’s another challenge for your lease configuration, that’s why it’s good to have big blocky acreage blocks.
I want to come back to your comments about the Permian. And I just want to ask you philosophically, are you concerned about the U.S. going back to that level of growth, given the recent history of growth for growth’s sake? I think the one change maybe relative to late 2014 and ’15, the last time we were kind of at these levels is just what is the spare capacity sitting in the OPEC group. It was quite a different number back at that point in time, and you can — we can all debate what that number is. And the fact that the inventories are down quite a bit globally and certainly here in the U.S. So I think there’s a little bit of time that we have associated with that. But certainly, if we’re getting back to the level of growth in the U.S. that if you’re not worried about it, you should be and be thinking about.
Are you able to give us an update on a post-tax basis, given that you’re now back to paying full cash taxes? That all included tax modeling, of course, of the prices that we had there. So that we were in a mid-cycle price. We were about $30 WTI breakeven. So the higher prices, obviously, we’d have a little bit higher taxes. But I think that demonstrates the competitiveness of the portfolio.
In the press release, you gave some information on rig count and frac crews, but any additional color by basin and how you see things playing out as the year progresses? But right now, we’re at 20 drilling rigs and 9 frac spreads, and we would add approximately 4 more drilling rigs in the Lower 48 throughout the balance of the year. One of those standing up in the Bakken and I think the rest are in the Eagle Ford and the Permian. So it’s kind of a measured pace and we are being very disciplined and as we said in the last quarter, it’s a constrained pace in the Permian. And we have lots of flexibility and capacity. But we think this is — will give us the greatest efficiency. on our operated scope, we want that to be — we want them to know right at the beginning of the year what we expect them to go do and hope to execute that, that items that have flexibility.
If I think about that U.S. growth rate of 0.8 million to 0.9 million barrels a day and the lion’s share of that being in the Permian, you can start to see the day where Permian gas takeaway gets exhausted. How do you guys think about your gas takeaway to meet your growth targets? And how do you see the whole basin shaking out? I think we’re in really good shape based on the position that we have and the infrastructure we have. We can evacuate gas South, we can go West. And we can come into the Katy Hub and into the Gulf Coast as well. So — but we’re watching it pretty closely because we got to make sure industry-wide, we don’t go back to flaring as an industry and all those kinds of things. So we’ve got to build the gas infrastructure and offtake capacity has to be there to support these macro offtakes in the oil side coming out of the broader Permian Basin. watching the takeaway capacity out of the Permian Basin is something that’s important to do, particularly as more production is coming on and particularly as associated gas starts ramping up, we’re probably a couple of years away before you start hitting that capacity,
https://seekingalpha.com/article/4484126-conocophillips-cop-ceo-ryan-lance-on-q4-2021-results-earning-call-transcript?utm_source=dowjonesnewswire.com&utm_medium=referral
ConocoPhillips Swings To Nearly $3 Billion Profit From Year-ago Loss — MarketWatch
7:14 am ET February 3, 2022 (MarketWatch)
ConocoPhillips (COP) said Thursday it swung to a fourth-quarter profit of $2.6 billion, or $1.98 a share, from a loss of $800 million or 72 cents a share in the year-ago quarter. Adjusted earnings in the latest quarter totaled $2.27 a share. Revenue rose to $15.96 billion from $6.05 billion.
Art Berman calls it oil blindness , Mike S calls it oil illiteracy . Richard Heinberg is a good awakening call .
https://www.commondreams.org/views/2021/12/09/heres-fracking-truth-about-americas-last-fossil-fueled-hurrah
The Barnett is the shale basin nearest end of life and so, even though it was mainly gas, it may illustrate what is to be expected in the other main basins in the next few years (maybe a bit longer for Permian). “Discoveries” (really FIDs) have fallen to zero, non-productive (in development) is below 10% and falling and negative revisions are continuing to be around the same order as production. Overall the negative revisions amount to a 30% reduction in the original reserves (i.e revisions/revisions plus production plus remaining=30%). This will increase slightly as negative revisions are added through to exhaustion. Production from fracked oil wells seem to me to be more complex than for gas so the downgrade for oil basins may be higher (that’s a complete guess). This can be compared with a 50% upward revision that was often seen with early conventional fields (though not now where there have also been some significant initial overestimates for reserves in offshore fields such as Mariner, though it probably adds up to around zero overall).
George Kaplan,
Some of the revisions may have to do with changes in the price of natural gas.
Chart below from EIA for annual average Henry Hub Spot price for natural gas in $/million BTU. Chart from link below.
https://www.eia.gov/dnav/ng/hist/rngwhhda.htm
Oil Climbs to New Multi-Year Highs on International Tensions, Texas Weather
08:49 AM EST, 02/04/2022 (MT Newswires) — Oil prices surged to fresh seven-year highs early on Friday on continuing supply concerns amid high demand and geopolitical tensions as Russia, the world’s No.3 oil producer, continues to threaten Ukraine, while a Texas cold snap threatens to squeeze oil supply from the state.
West Texas Intermediate crude for March delivery was last seen up US$1.73 to US$92.00 per barrel, while April Brent crude, the global benchmark, was up US$1.67 to US$92.78.
The rise to the highest since the autumn of 2014 also comes as a winter storm pushes temperatures in central Texas below freezing, raising worries over potential power disruptions and frozen wellheads.
“The latest upswing was triggered by a cold snap in Texas, which is fuelling concerns about production outages in the Permian Basin, the largest US shale play. A year ago, a period of extreme cold weather had caused massive disruptions to oil production there,” Commerzbank analyst Carsten Fritsch said in a note.
Commerzbank on Friday raised its forecast for average Brent oil prices this quarter to US$90 per barrel from US$80 as it sees a risk premium remaining as Russia continues to threaten an invasion of Ukraine.
The rise has also come as supply remains tight, with OPEC+ continuing to raise its quota by 400,000 barrels per day monthly even as the bulk of its members are unable to boost production. US output also remains below pre-pandemic levels as companies remain reluctant to boost production as investors demand higher returns.
Saudi Aramco mulls up to $50 bln stake sale via fresh share listing – WSJ
Feb 4 (Reuters) – Saudi Arabia is planning to list more shares in Aramco (2222.SE) and is targeting a stake sale of as much as $50 billion, the Wall Street Journal reported on Friday, citing people familiar with the oil giant’s strategy.
The state-owned company has held talks with outside advisers about selling more shares on the Riyadh stock exchange as well as a secondary listing, possibly in London, Singapore or other exchanges, the report said, adding that it was still in the planning stage.
Aramco, which listed in Riyadh in December 2019 and currently has a market value of $1.97 trillion, did not immediately respond to a Reuters request for comment.
Ron–interpretation, please. Some of us are idiots (relatively speaking). I’m assuming it’s doomish….
Why would you want to sell the second most profitable company in the World (after Apple)? The insiders must know something that the rest of us don’t.
Frugal
Maybe a few of us also know something the rest don’t.
No Ovi , all of us know what is needed to know , but we turn a blind eye . Over the years I have said ” The balance sheet of Saudi Aramco is the balance sheet of KSA ” . When 90 % of the revenue of KSA is from Saudi Aramco and that cannot meet the budgetary demands of MBS then there is TINA ( There Is No Alternative ) . Heck they tried listing Aramco on NYSE and the underwriters threw their valuations in File no; 13 ( also called the waste paper basket ) . Hicks , yes the insiders know . What ? KSA is unsustainable at current oil prices . Yes even at $ 90 . The breakeven for Saudi Aramco is not the lifting cost as espoused and shouted by the bullhorn but what it costs MBS to keep his head on his shoulders . Believe in lies ? Go ahead , be my guest .
HIH
I think that Aramco walked away from the NYSE because the NYSE wanted their own team to properly assess how much oil was left, not SAs yearly quoted number around 270 B barrels
If those barrels were really there, they would have listed on the NYSE. For me that was a big clue that there was a big problem which we may learn about in a year or two.
If your oil company has 260bn bbl of reserves and you sell it for $2 trillion, doesn´t that mean you sell your reserve barrels for less than $8? Think about that…
Toby , this makes me go hmmmm . Tks . 🙂
France’s Macron will go to Moscow and meet with Putin on Ukraine
• France’s Macron will go to Moscow to see what can be done and negotiated to reduce Russia’s military buildup
• Will also discuss with Pres. Putin the future security of Europe
• Has coordinated with Europeans, other allies over Russia, Ukraine visit
• Will hold talks with Britain’s Johnson, NATO’s Stoltenberg ahead of Moscow visit
• Will reaffirm that Ukraine’s sovereignty must be respected
• No question of putting pressure on Ukraine, problem today is in Moscow and not Kyiv
No specific mention of the US. I guess they are other allies. One of the objectives of P to to break up the alliance.
https://www.forexlive.com/news/frances-macron-will-go-to-moscow-and-meet-with-putin-on-ukraine-20220204/
Side note, Stoltenberg just got a new job, as head of Norways CB, we´ll see how he manages the wealth fund?
Or maybe just a smart move career wise?
https://www.svt.se/nyheter/utrikes/trots-kritiken-jens-stoltenberg-blir-centralbankschef
BoJo btw. seems to have ducked partygate fairly succesfully, for now at least.
WTI crude oil settles at $92.31
Oh man. Eight more bucks and I’m going to have to just find thirty grand and buy myself an EV, install a Three Phase charging unit for a grand, and start saving so much money and feel better about the environment.
Have you got three phases at your house? Damn few residential areas do you know.
Not yet, but I may as well take an extra loan out for a transformer and heavy duty cabling job to go with the EV loans, buy off the neighbours for potentially complaining about the road being dug up. Sure beats paying for petrol, right?
But seriously, I actually did randomly look this up once and it’s apparently not that hard to get done if you’re needing the extra juice. Doubt many have, mind.
Serious question, do you not have three phase in to your house/apartment?
The load on one phase for an oven, a stove, some heating etc. should be like at least 20 amps, probably more, if only on one phase?
If in europe, to get a CEE socket after the meter might cost a bit but not that much.
Possibly a question for Van der Leyen to dig into in that case.
Edit: and in the US, you only have 110V, but at 60Hz? Not that it matters, power-wise.
The plot thickens…
Nope. Most UK residences outside former industrial units or large flat towers would be single phase. My little village has a few EVs charging in driveways and they all seem to have the standard tether fast charger configuration which gets you a full charge overnight.
I think we’d only really need more juice if it was for a petrol station wanting to act as a supercharger point or for on road charging where driveways aren’t available for long term charging without issues.
single phase is just fine for fast home charging, but you do need a spare circuit 40 amps
In my learning, 40A would need at least 6 mm2, i.e quite a low AWG. Would it not be better to use 400V, 3-phase (and the metric system, sorry…) to reduce the copper use etc.?
But you´ll get there, inch by inch : )
https://en.wikipedia.org/wiki/American_wire_gauge
Edit: charged a model X at the old house once, single phase, 13A/230v, around 10 km/6 miles/h, no problem. But will fix a CEE socket, 3x16A/400V for further use, in combination with a current controller to shut of unnecessary stuff when over utility limit, currently the same 3x16A/400V. (Was 3x20A/400V before the ground source heat pump installation, so the wires will handle an upgrade, if needed)
Edit 2: In mid and northern Sweden, most appartmentblocks etc. have parkings with outlets for engine and cabin heaters, 6 or 10A/230V, not supercharger values but enough to get you to work if you have an EV of some sort, hopefully. Not EU or UK standard yet, though…
Imma stay home with my Nissan Frontier in the dooryard. Don’t need to go nowhere anyway.
“ Over the anticipated 15-year lifespan of a vehicle, the electricity to run an electric vehicle can be as much as $14,480 cheaper than fueling a gas-powered car”
You’d pay for about half the price of your car. Also a tax credit of $7500.
Also they cost about 40% less to maintain.
But do what you like.
https://www.marketwatch.com/story/does-driving-an-electric-car-really-save-you-money-a-cheapskate-runs-the-numbers-11633119574
https://yaleclimateconnections.org/2021/09/electric-cars-can-cost-40-less-to-maintain-than-gasoline-cars/
That savings level assumes that gas prices don’t rise over the next decade.
It also assumes that electricity prices do not rise greatly over the next decade. With spot shortages of NG and Coal already this winter, it would be best not to count for that not happening.
Agree- some people will be paying much more, and other much less for electricity than at current market rates.
I think most of us are pretty confident that petrol products are going to be much higher this decade than last, and rising.
Uh huh. Or gov’t will recoup those costs another way, since the idea that EVs will be super cheap to run forever has no legs.
Already happening in the UK: https://www.autoexpress.co.uk/news/108123/uk-road-pricing-plans-gps-tracking-and-pay-you-go-could-replace-fuel-duty-and-ved
I had read stories only a couple years ago about the EV advantages in cost being whittled down quite quickly as tax revenues and infrastructure build out necessitates such pricing.
Also, everything seen so far with electricity prices and brownouts.
Kleiber , UK will be the first country in the devolped world to crash . When you import 80% of your energy and 60% of your food you are in trouble . Wait until April when the caps on energy bills for domestic consumption are lifted and households have a + 50% increase in a country where inflation is running at 7% and incomes are declining .
P.S : I know about the GBP 200 return but this is just smoke and mirrors .
https://consciousnessofsheep.co.uk/2022/02/08/in-brief-enemies-of-the-people/
I can’t wait to have this totally-not-a-loan handout given to me, only to pay it back next year with yet further increases in energy bill costs. Do we then just keep getting more and more loans off HM Treasury? Fun times.
Four rigs were added in the Bakken area last week, which was to be expected as the DUC inventory there was just falling below the 6 month point, though maybe not quite so many (so frac spreads might be added as well). The difference shown is completed minus drilled wells.
Something will need to be done in the EF pretty soon as inventory is at 7 months and falling fast; though it seems to be a less attractive area so it might be that completions are reduced instead (e.g. move fracing ops. to the Bakken or Permian).
Two rigs left New Mexco so the strong trend for increasing production in the Permian there might be starting to falter.
Addition of OPEC oil rigs, which showed pretty well continuous growth from April 2021, stopped in January with OPEC dropping 2 and Plus 4.
There are much less oil rigs in Russia than in nearly every other members of OPEC+, for example KSA, Oman, Algeria, Iraq… How do they imagine that they will be able to increase their production?
B-H doesn’t record numbers for Iran or ex-Soviet states even though they include them in the spreadsheet. When I remember I add a caveat to that effect.
So the Permian Basin has about 278 oil rigs operating, and ALL of OPEC+ has about… ~278 rigs operating?
What interesting conclusions can we draw from that?
Stephen , simple conclusion . We have run out of road . The Red Queen is killing the runner . By the way I like your last post — using the straw to suck up all the liquid around the ice cube hoping to get some taste of the juice . This is similar to the talk of Tier 2 &3 and benches and 3 mile laterals . The folks in shale are going to put a straw (pipe) in hope of getting some juice (oil) .
L.A., O.C. gas prices reach record-breaking levels — and may climb even higher
Gasoline prices in parts of Southern California hit all-time highs Friday, and as refineries begin switching over to a more expensive blend, costs could continue to soar at the pump in the coming weeks, AAA said.
In the Los Angeles-Long Beach area, a gallon of regular unleaded (87) jumped five cents over the past week to reach an average $4.72, the highest recorded in the region, according to Auto Club data. The previous record was set just last November.
Congratulaitions, you now approach european prices, but still got some ways to go. If my calculations are correct, with 18,5 SEK/L, 9,15 SEK/US dollar and 3,8 L/US gallon your price would be around 11,5 SEK/gallon, i.e around 63% of what I just paid…
But at least we get a few government systems like a badly strained public healthcare for the difference, whatever it is worth…
In other words you’re paying:
18.5 SEK/L * 0.10928783 USD/SEK * 3.785412 L/Gallon = 7.65 USD/Gallon
This price would kill the US recreational vehicle industry. These are the monster land yachts that you see on US highways.
I’m paying £1.489 per litre or $7.63 per US gallon here in W.Wales, UK…
In Europe you pay about double the US price. Do people complain as much about the fuel prices there?
Much more now than before in Sweden at least, but mostly about diesel being over 20 SEK/L. So now there´s some political debate about lowering fuel taxes, it is election year after all so we´ll see what happens, but will likely only be a minor change.
“This price would kill the US recreational vehicle industry. These are the monster land yachts that you see on US highways.”
This is just one of the many aspects of US and Canadian lifestyle that is in the last decade.
Recreational motor boating and flying in airplanes at a whim are two other easy to identify
soontobe ghost stories.
Water issues at Iraq’s giant southern oil fields could hamper output boost: BOC
Water problems at Iraq’s mega southern oil fields operated by international oil companies may hamper the country’s ability to pump more crude from the key region in OPEC’s second-biggest producer, a senior manager at state-owned Basra Oil Co. told S&P Global Platts on Feb. 3.
Currently, southern fields operated by BOC and international oil companies are producing around 2.95 million b/d, down from 3.3-3.5 million b/d prior to the historic OPEC+ production curbs imposed in 2020 with the onset of the global pandemic, BOC Deputy Director General Ahmed Adhem said in an interview.
Iraq pumped 4.162 million b/d of oil in January, down 1.5% from 4.225 million b/d in December, according to State Oil Marketing Organization figures seen by Platts.
The January production figure is below Iraq’s OPEC+ quota of 4.281 million b/d for that month. Iraq’s February quota is 4.325 million b/d.
Adhem said that the southern fields suffer from two problems with regard to water: the amount of water being produced alongside oil, and separately the lack of water needed for injection to support reservoir pressure in relatively old fields.
BOC is counting on a $27 billion deal with TotalEnergies, including a seawater treatment project to process 5 million water barrels per day, to help mitigate the water issues at the southern fields. The deal, which includes four projects, is expected to come into effect in the first quarter of 2022, after obtaining the necessary approvals and any needed review by the regulatory authorities, the oil ministry said Jan. 28, as the country’s outgoing government seeks to finalize agreements before its term is over.
The biggest water cut issue is at Rumaila, while the southern field most in need of water injection is Zubair, Adhem said.
https://www.spglobal.com/platts/en/market-insights/latest-news/oil/020422-water-issues-at-iraqs-giant-southern-oil-fields-could-hamper-output-boost-boc
I don’t see how Total is going to design and build a seawater treatment plant of 5mmbpd in 6 months (it’s hard to appreciate just how huge such a development is). The pumps are highly specialised and have maybe 18 months delivery times. Even in well functioning economies it would take 5 years minimum and the security and logistics issues in Iraq makes everything slower and sometimes impossible. It may be that a lot of the infrastructure is in place and the Total development is just t replace the front end from a feed of river water to one from treated seawater, but I doubt if it is that simple (and treating for 5 mmbpd seawater is still a massive project and will probably depend on continuous supply of some quite specialised chemicals once operating).
George
I think the wording is not clear. My reading is that the contract comes into affect shortly, before the current government exits. As you infer, it will be a while before the water starts to flow. The other interesting comment in the article was that XOM is exiting. I wonder if it is related to the lack of water.
On another subject. Could you explain what the water treatment plant has to do to the water. Does it just have to filter the water? Does it have to desalinate ocean water? Does it have to add chlorine to kill bacteria? I have always wondered what level of water purity was required before being injected into an oil field.
As a minimum it needs filtration (sometimes down to very fine particles but it depends on the nature of the reservoir – e.g. particles may block pores or they may act as proppants) and deaeration, which is a big vacuum tower to get rid if most of the dissolved gases and then sulphite addition to soak up the last of the oxygen. Chlorine might be used as a biocide but I think there was a drive to use lower levels of copper addition which makes the bacteria a bit dopey and unable to multiply (my memory is not clear on that). There might be treatments that reduce sulphate or nitrate levels in the seawater but that would depend on the reservoir chemistry, i.e. how the seawater would react with produced water (e.g. scaling) and how well it will penetrate reservoir pores to displace the oil. The water is not desalinated. Then there needs to be pumps and pipes to move the water around. The biggest pumps are the actual injection pumps which have to be high pressure and high volume and are usually very specialised with few suppliers. There might be existing pumps (currently injecting river water) that would work but I’d be surprised as seawater is highly corrosive to some steels.
XOM made a proposal to provide the seawater plant but for whatever reason it didn’t go ahead (if I had to bet is was because they wouldn’t pay the backhanders – I expect Total will face similar issues) and it’s very difficult for western IOCs to make money in Iraq as they only get paid a flat rate on production such as 1 dollar per barrel (that may have changed recently, I don’t know) and operating costs are really high because of security and logistics issues.
George
Thanks for clarifying what has to be done to different water sources. Clearly this is an additional cost for SA and Iraqi oil.
As an encore, what is done, if anything with water for LTO wells. Do they use readily available processed town water or water from other source.
With the caveat that I have never worked on any LTO projects: LTO wells don’t use water injection; oil is produced by pressure depletion. It is partly why decline is so fast and recovery factors uncertain. In conventional WI wells the water is injected in a dedicated well below the oil-water interface and sweeps up pushing the oil before it to the producing well while maintaining reservoir pressure. LTO wells only have one way in and out so this effect can’t be achieved. I think the produced water is mainly the fracking fluid, I don’t know if there is oil-water contact through any or all LTO well completions and fields.
George
Thanks. I guess I didn’t make my question clear. I did mean the fracking water. In your previous response, you noted that filtration was needed to prevent pores from being blocked. I assume the same would be true for a fracked well that used water with dirt mixed in. That water would shoot into the cracks along with the sand.
So maybe after writing the above I may have answered my own question. If there is sand and water in the well, a little extra dirt would not matter. A bit slow in the morning. 😕😕
As an example that core areas in LTO basins are close to or at saturation this is Bakken production by county. The highest concentration of wells is in the middle of McKenzie but that county is now in steady decline (faster than it’s pre peak growth). Williams too is declining; Mountrail is growing slowly but is not back to pre-covid rates and probably will not get there; Dunn, which has been the least productive of the big four, or equal with Williams, is the only one growing significantly at the moment. New drilling rigs are going to Dunn or Williams with the two other, larger counties steady or slightly falling in active rigs.
Thanks George.
From shale profile, Dunn, McKenzie, Mountrail, and Williams for ND Bakken/Three Forks. Chart at link below
https://public.tableau.com/shared/B2DFCTGPQ?:toolbar=n&:display_count=n&:origin=viz_share_link&:embed=y
120 million tonnes of LNG needed to be imported by Asia Pacific . From where ?
https://pbs.twimg.com/media/FK7Xlz3XsAM5gDI?format=png&name=small
From:
https://www.todayonline.com/world/us-asks-japan-help-lng-event-ukraine-disruption-1809441
“Japan imported 74.32 million tonnes of LNG in 2021 but gave up the world’s largest buyer spot to China, which increased its imports of the super-chilled fuel by 18per cent to a record high.”
so that about takes care of it and there is still South Korea and Taiwan !
Seppo , Asking for shoes from someone who has no feet . 🙂
WTI down 70 cents 9 minutes after opening at $91.61.
92.43
+0.12(+0.13%)
Slight gain now–
Lets see how things are in the morning
Vitol’s Muller says oil stocks `worrisome,’ OPEC+ spare capacity near `alarming’ level
Global oil stocks are at “worrisome” levels as waning OPEC+ spare capacity is expected to reach an alarming degree by next year amid higher crude demand outstripping supply, the head of Vitol Asia said on Feb. 6.
“Demand is currently making the headlines and supply is the problem,” Mike Muller told the Gulf Intelligence daily energy markets podcast. “Inventories continue to sit at levels that are worrisome.”
Fears over the 23-member coalition’s waning spare capacity could push oil prices to an even steeper rally after breaking a seven-year high of $90/b on concerns of tight supply and geopolitical market risks. OPEC and its allies on Feb. 2 decided to persist with another modest 400,000 b/d hike in crude production quotas for March. S&P Global Platts assessed Dated Brent on Feb.4 at $97.66/b. up by 4.5% on the day.
The 19 OPEC+ countries with quotas underperformed their production targets by 832,000 b/d in December, according to an analysis prepared for the group’s technical committee and seen by Platts. If this trend persists, the oil market is likely to swiftly move into deficit and push oil prices even higher at a time of soaring inflation.
Even China will need more oil, despite some doubts about demand in the world’s second biggest oil consumer, he said. As more refineries come on stream in China and inventories require restocking, Chinese demand will stay strong, he added.
“I think it’s fair to state that China is at bare minimum of operating levels in terms of the prescribed levels of mandatory stockholding that state-owned enterprises are meant to hold,” said Muller.
“All eyes are on what happens in China after the Chinese New Year because there is a feeling that some restocking will be required. I don’t think China is as price sensitive as South Asian nations are.”
Against this backdrop of higher demand, tight market supply and skyrocketing crude prices, Saudi Aramco decided to hike March official selling prices across Asia, Europe and the US, with the biggest increases for grades to Northwest Europe and the Mediterranean. This decision came as no surprise to the market, according to Muller.
https://www.spglobal.com/platts/en/market-insights/latest-news/oil/020622-vitols-muller-says-oil-stocks-worrisome-opec-spare-capacity-near-alarming-level
I have been saying this for years. Anybody who is in the hydrocarbon exploration business knows how hard and costly it is to find, develop and produce new oil fields. The shale revolution was a perfection example of how difficult it is to find new fields with reservoir quality rock. This article comes as no surprise to me. Larry Fink of Blackrock is now walking back his fossil fuel divestment policy. All of these ESG scammers should be tried for treason. It will be interesting to see how many people care about climate change when they have a pot full of energy poverty.
Here is the key phrase from that article: Demand is currently making the headlines and supply is the problem,
Peak demand is nonsense, peak supply is the problem. It happened three years ago and the world is, very, very, slowely waking up to that fact.
https://www.wsj.com/articles/blackrock-climate-change-doubletalk-larry-fink-esg-exxon-warrior-met-coal-sasb-stakeholder-capitalism-11644167948
As mentioned above.
Above Baggen asked for a chart showing EV adoption and liquid hydrocarbon use in Norway (presumably knowing fullwell the answer). Since 2011, with cheap hydroelectricity aplenty and tax cuts to spare the EV sales have risen from 1 or 2% to 65% and at the same time (to 2020 anyway) liquids consumption has … er … risen by 2.6% (surely shome mishtake). The peak was in 2007 and if jet fuel had not dropped by over half because of Covid it would have been equalled in 2020. Presumably there are still some pre-2011 ICEs still around that will gradually disappear but gasoline is now only 7% of total so the gains are getting increasingly marginal.
This is the EV sales trajectory from Reuters: https://www.reuters.com/business/autos-transportation/electric-cars-take-two-thirds-norway-car-market-led-by-tesla-2022-01-03/ (the screenshot of the chart is too big to post alone).
Thanks George, (your assumption was correct)
I find this interesting especially if it supposed to be the core function of a model predicting decline in demand.
Baggen- so what is the point you are alluding to?
That country replacement of ICE by plugin vehicles will not result in gasoline demand curtailment?
Or won’t happen fast?
Or fast enough?
Or isn’t a goal worth pursuing?
btw- as of 2020 Norwegian vehicles on the road were 78% ICE and 22% electric or hybrid. New car sales were up to 93% of market in 2021 (plugin vehicles)
https://www.energymonitor.ai/sectors/transport/weekly-data-why-norway-leads-the-world-for-electric-vehicles
Hickory
Not many countries have the resources that Norway has to incentivize buying BEVs and PHEVs. I think Norway should be classified as an outlier.
Also note that they continue to increase their oil production and invest in drilling and maintaining their fields. Not exactly what one would call a consistent policy. Money still reins supreme in Norway.
All true. Still unsure about the point Baggen was making.
Ovi,
We will see what happens in the rest of Western Europe going forward, sales growth in 2021 was pretty significant in Europe, US sales may be held back by uncertainty over build back better which includes ev incentives. In 2021 19% of Europe’s new vehicle sales were plugin vehicles (10% of all new vehicle sales were BEV’s). This compares to 11% plugin vehicle share of new vehicle sales in 2020 and 3.6% in 2019.
Article below reviews 2021 results for plugins in Europe.
https://cleantechnica.com/2022/01/30/29-of-cars-sold-in-europe-were-plugin-electric-vehicles-in-december/
OVI —
Actually any country that is a net importer of oil can’t really afford not to promote EVs, though a lot of them haven’t figured that out yet. Any country that thinks it “can’t afford it” needs to raise taxes on oil.
Baggen – all models are wrong, some are useful, and the rest aren’t. Take your pick.
Of course, point was to bring this little fly in the soup to the surface and perhaps get people to think a little about this dilemma and it seem to have worked.
Perhaps we should not just assume EVs is some magical bullet and that more EV adoption will reduce oil consumption as if it was some law of nature, if it aint working in Norway why should it be different in countries with less flex? Perhaps it will, but just ignoring this and base models on your own assumptions that goes contrary to what reality so far is reflecting seems a bit more like wishing, and then arguing based on the results of said models as it should be taken seriously rather than a personal wish of a future scenario.
Whit that said, i hope it works.. it better as we have now put all our eggs in this basket.
I don’t know about models,
but when petrol becomes too expensive or is simply unavailable
I do know it will still be good to have the ability to get
to and from the market, the port, the depot, etc.
Electric vehicles will give you, and your country, that ability.
Hickory,
Sure, but when we are wasting oil that gives us less time to transition. We are wasting the last of it now as we have all the confidence in the world EVs will save our bacon, well at least its better then robo taxis to the rescue haven’t heard that one now in a few years.
When petrol becomes that expensive there won’t be anywhere to go lol
Baggen-
“we are wasting oil”
I absolutely agree. As if there is no tomorrow.
Baggen,
No assumptions that it is a magic bullet. Do you have data on average fuel economy for the Norwegian vehicle fleet and the percentage of all registered vehicle that are plugins?
I would note that for EVs the energy for both production and electrical use for charging the battery are likely not provided by oil. So if the aim is to reduce oil consumption every EV that replaces an ICEV will reduce oil consumption vs the alternative of no electric vehicles of any kind being sold.
There are about 16.5 million plugin vehicles on the road in the World, at 10000 miles per year and 30 miles per gallon that would be 333 gallons per year per vehicle times 16.5 million vehicles or 130 million barrels of fuel, that does not amount to much only 356 kb/d. As the electrical light duty vehicle fleet grows to say 300 million, it becomes 6.5 Mb/d, at 1.3 billion EVs replacing ICE light duty vehicles (a level not reached until 2043 in my scenario) about 28 Mbopd of oil use is no longer needed compared to an alternative scenario with no EVs sold after 2021. I also assume commercial heavy duty vehicles are eventually replaced with EVs, but with a 9 year delay after light duty vehicles. Some heavy duty long haul may move to natural gas as well ( I did not model that).
Baggen,
The model focuses on diesel and gasoline demand, for the World this is roughly 62% of petroleum liquids consumption (I mean liquids at STP and do not include gases pressurized into the liquid phase.) Growth in the rest of petroleum liquids (grouped together) has been slow since 2005 (about 0.3% per year). In Norway this has not been the case, based on Mr Kaplan’s chart, it seems much of this growth has been in other petroleum liquids. land transport fuels are just one piece of the puzzle. Note also we don’t seem to have data on Norway’s EV fleet size and of course most heavy duty trucks probably use petroleum, which is a fairly large percentage of fuel use.
It is probably correct that peak demand won’t be until 2030 or later and if the EV transition is slow oil supply is unlikely to meet oil demand unless oil prices are quite high so that there is demand destruction.
A low oil supply scenario and slow EV transition might allow demand to outstrip supply even in a high oil price scenario(more than $130/b in 2020$) after 2025-2027.
Or it could be we are just shifting consumption around and virtue signaling. What does it matter if we burn the barrel in the engine or in the plant?
Perhaps the story will be different in the us, i actually believe it will but getting that ruler out and applying same logic to the rest of the world and global fuel consumption… Well..
“if the EV transition is slow oil supply is unlikely to meet oil demand”
Am i getting you right if i assume the above means you think/are sure EV transition will reduce oil consumption?
Are EV adoption a good way to determine future oil demand/decline (not gasoline)? Remains to be seen in my opinion.
baggen,
Yes I am sure if less oil is used for land transport, then overall oil consumption is highly likely to be lower. You can easily create a model to see what World demand looks like with no more EVs sold in the future. We could call it the no virtue signaling scenario if you wish.
By 2075 the difference between supply and demand for oil will be close to 80 Mbopd. I assume fleet growth is about 1% per year and fleet growth stops around 2064. Groeth in demand for air and water transport is not included in the model, flat consumption for those uses ( and all other uses besides land transport) is assumed after 2025.
Not clear that natural gas or coal will be able to fill the gap between supply and demand.
It makes no difference where fuel is burned, the idea is to transition to an economy where less stuff is burned, electricity can be produced with wind, solar, geothermal, hydro and nuclear power. Natural gas and coal are not the only methods that can be used to produce electricity as I am sure you are aware. Also energy can be used more efficiently by building better buildings and utilizing heat pumps for heating (ground source in colder climates).
I agree EV adoption is not a good method to determine future oil demand, in my simplistic model I assume all demand besides land transport remains constant at 2025 level, it is likely to increase, I do not know the future rate, it was not the focus of the scenario.
Note that the US vehicle fleet grew at about 1.44% per year from 1980 to 2019, I chose a conservative 1% growth rate for the World fleet (developed nations have been growing at only 0.5% per year in last 10 years the rest of the World is likely growing faster, 1.5% might be a better guess, that would lead to higher oil demand than the scenario in the chart below.
I don’t hear too much about Jevons Paradox any more. Fact is people are rational actors only to a point. We saw plainly that high oil price in the oughts reduced consumption but low prices in the teens caused it to go right back up. Per capita consumption is down but total use is right back where it was.
For every gallon that EVs reduce unleaded demand they reduce unleaded price. Lower fuel price as we’ve seen is a signal to buy a half-ton coffee cup hauler—perhaps just to coal-roll a Prius. EVs are great for those who have one, and can charge it, but they could prevent the high fuel price signal that most people will need to transition.
Add in the real possibility of a government opposed to the very idea of transition and I don’t feel all that optimistic.
Pops,
Even with a fairly rapid transition to EVs, we may see high oil prices over $100/bo in 2020 US$ from June 2022 until June 2042.
No Dennis , you won’t . I stand by my ” $ 25 by 2025 ” . Be patient . ” Patience is the virtue of an ass who trots beneath his burden and utters nothing ” 🙂
Dennis , you are on the wrong track . You are looking at things from the wrong angle . LTG / CC/ peak oil/ peak gas/ peak coal are in a synchronization . We are looking at what my favorite supply chain thinker David Korowitz calls a SSF ( Systematic Systems Failure ).
I have commented earlier ” Complexity connectivity are the Achilles heal of Industrial civilization ”
https://edition.cnn.com/2022/02/07/business/ford-production-suspended/index.html
“EV transition will reduce oil consumption?”
Absolutely Baggen.
We have close to 100,000 Ev and plugin hybrid vehicles in the state of Washington where I live.
That is 100,000 less ICE’s burning petrol on the road.
By the end of this decade the trend will be a very big deal, helping the state to handle survival in a world on the down slope of oil supply.
Same goes for most places that are pushing ahead rather than stuck looking backward.
Forget fuel source. Electric engines are about four times as efficient as internal combustion engines. Think about it. One quarter the amount of energy, same miles driven. And of course if you reduce the weight of the vehicle from 4000 lbs to 400, you get another order of magnitude efficiency gain. Folks gas cars are only 1% efficient at moving their human payloads around. The order of the day will be electric buses and bikes for most people. Once gas prices get high enough ICE cars will be abandoned on the side of the road.
https://electrek.co/2021/07/27/ev-vs-ice-how-far-can-you-travel-in-each-state-for-100/
But as Baggen is showing, private passenger vehicles are only a minor part of the economy so concentrating on making them ultra efficient is not doing much to make society resilient to oil supply decline, or to preventing climate change, and is possibly not the best way to reallocate the large resources they are taking, however good the politics look. We are obviously going down so a managed retreat is what’s needed not a last ditch all or nothing defence.
That may be so. But first of all I find it dubious to draw too many conclusions from one small example, especially Norway that is a large oil/gas producer. As far as I know a lot of that remaining oil use is to feed their hydrocarbon industry. Secondly, despite recent high EV sales Norway’s fleet is still largely ICE vehicles. Before you can figure out how to make effective electrical solutions for things like trains, trucks or planes (IF such things are possible, a big IF), in addition to improving the battery tech for effectively storing intermittent renewable energy sources like wind, solar, tidal etc, you have to do the easy low hanging fruit first, which is cars. The hope is that as the industry develops economies of scale and tech improvements occur to make these things affordable. Of course this may not happen and we could just as easily be headed for a Tainter-style collapse. But I don’t see at this point how you would allocate resources differently to attempt to transition the global economy away from fossil fuels, unless you’re hope is to replace capitalism.
What is your opinion on what we should be doing differently? How should we allocate resources for a managed retreat and how would we convince people to go along with such a program?
George,
I agree Baggen’s points are good ones. As far as oil consumption for the World, that is liquid oil products at standard temperature and pressure (STP), roughly 62% of World consumption in 2019 (data from BP stats regional oil consumption tab) was gasoil(diesel) and petrol(gasoline). Reducing consumption of oil by 62% is a worthwhile goal in my opinion while also reducing use in air and water transport and in addition increasing electricity production with wind, solar, hydro, geothermal, and nuclear power.
EVs are not a magic bullet, just one arrow in the quiver.
Stephen “Of course this may not happen and we could just as easily be headed for a Tainter-style collapse. ”
Nostalgic , but it reminded me of Yul Brynner’s dialog in ” The Ten commandments ”
when as Pharaoh he said ” So shall it be written and so shall it be done ” . Guess I am just an old fool who watched too many movies when young . 🙂
George- “a managed retreat is what’s needed”
Agree. Management would be good.
I consider electric vehicles, and non-fossil energy generation, to be excellent attempts at managing the retreat (retreat from the condition of severe population and energy consumption overshoot).
Stephen Hren –I think a rhetorician would call yours a “Complex Question” and I don’t have a solution. Our industrial civilisation cannot continue as it is and there’s going to be a great deal of suffering. I think the least bad future (i.e. the least suffering to people existing or yet to be born) would be for the collapse to start as early as possible and the decline to be as shallow as can be managed. But there’s no chance of anything like that being deliberately instigated. Where the few civilisations have survived by transitioning to something simpler it has mostly been by accident. Trying to prolong BAU by concentrating resources on EVS is probably going to be seen as a waste of limited resources and doing more harm than good in the long run but that’s not particularly why I object to arguments promoting EVs – it’s just that they are often wrong and reductionist.
Something might be possible by reducing consumption; emphasis on EVs probably does the opposite and promotes the idea that growth and consumerism can and will continue without there being any consequences. Norway, or at least Oslo, used to have a good light transit system, if it had as much money spent on it as the tax cuts for EVs it would probably be able to provide free rides for all over the whole greater city. I read recently that it had been losing passengers as EV use has grown.
To date Norway has been held up as an example as how EVs could address our predicament, not (if I understand your comment correctly) as a country where they wouldn’t have much impact. I think a reason why so much distillate is used is because it is really linearly spread out so logistics chains are long (there are similar issues in Canada). It is also a big shipping nation so marine diesel use might be high. It has a refinery and some petrochemical plants, but not relatively more than other countries and they don’t particularly use much liquid hydrocarbon (natural gas is likely to be the bigger feedstock).
I think there are plenty of ICEs still around because families tend to have an EV for day-to-day use and an ICE for longer trips. Most mileage is on EVs, which is why motor gasoline use has halved. Presumably the countries where the EVs were made have had a jump in their resource use and carbon dioxide emissions as a result. I’d guess the grooves in the roads from studded tires might have got worse with the heavier EVs.
I think this chart should shock you. It is OPEC less Saudi Arabia. The data is through December 2021. The arrow marks February 2020 production level. The spike just to the right of that is April 2020 production when they were positioning themselves for the OPEC mandatory cuts in May and June. Their quota would have been calculated from their April production level so they all made heroic attempts to raise production that month.
Looks to me like OPEC production (minus Saudi) was trending down for five years from May 2008. This was a period of very high oil prices, but Middle Eastern governments were still struggling to meet spending plans at the time. There was then a production binge as they attempted to force US shale out of existence. This didn’t work because lower price oil kept inflation relatively low, allowing interest rates to remain low and bond yields to remain low. Shale is basically a credit driven ponsi scheme.
OPEC minus Saudi production peaked around Sep 2016. By the fall of 2019, months before COVID reared it’s ugly head, production was already down over 3 million barrels from peak and was trending down with what appears to be an increasing gradient. It is still 1mb/day beneath it’s level before the beginning of the COVID crash, when it was already 3m barrels down from peak.
When coupled with a Saudi rig count that has fallen by more than half over the past three years and Russian production which they themselves admit is past peak; it is difficult to see how OPEC production can increase in future years. If the Iranian nuclear talks succeed, maybe growing Iranian production will cushion the decline for the next few years?
The problem I can see is that high oil prices could end up causing a rerun of the global financial crisis. This would crush discretionary demand reducing prices, whilst doing so much damage to institutional investors that the credit volumes needed for capacity expansion may not be available in sufficient quantity to expand supply quickly enough. To avoid a GFC, the world needs cheap oil that allows real goods (and their transportation) to remain affordable. Expensive oil might as well be no oil.
“Expensive oil might as well be no oil.”
Well, there really is a difference.
Expensive oil may strike hard at discretionary/optional uses of oil.
But critical uses, like food production or base industry, will readily purchase expensive oil rather than function with ‘no oil’.
Per unit of GDP the global expenditure on energy has dropped by about 30% from 1990 to 2020.
Expensive oil is surely a problem, but it is certainly not the same as no oil.
People seem to think that the world will be able to deal with a retreat from massive population and energy consumption overshoot without severe episodes of disruption to ‘normal’ life. That is just not in the cards.
TonyH,
The decline after 2016 was largely due to sanctions on Iran when Trump pulled out of JCPOA also some decline from sanctions on Venezuela imposed in early 2019 by Trump. I see a small amount of decline from 2005 to 2013, perhaps at an annual rate of 125 kb/, then OPEC ramped up production from 2013 to 2016, also keep in mind some of the decline up to 2013 was due to sanctions on Iran targeting oil industry from 2010 onwards until JCPOA was agreed in 2013, so most of the OPEC ramp from 2013 to 2016 was Iranian increases in output (about 1100 kb/d from 2013 to 2016). Also Venezuelan output fell from 2350 kb/d in 2013 to 2100 kb/d in 2016, offsetting some of the Iranian increase in output. Since 2016 Venezuela’s output fell to 1300 kb/d in 2018 and after US sanctions fell to about 550 kb/d in the most recent 12 months, Iran’s output fell from 3800 kb/d in 2017 to 2400 kb/d in the most recent 12 months.
Dennis , tell me what is new in your post that the regulars here were unaware of ? Now my next question . What do you expect that any of the situations will be change ? Answer none . Iran sells all it produces . Heck when was the last we heard of tankers stocking oil of the coast from Khorramshahr ? Venezuela is a catastrophe and Nigeria , Libya , Sudan are disasters . Get real .
P.S : An optimist is the one who says the glass is half full , a pessimist is who says it is half empty , the realist adds two shots of whiskey and two ice cubes and says ” Cheers ” . 🙂 . I belong to the third class . Adios amigos .
Hole in head,
The claim that Iran is not affected by the sanctions is bunk. They no doubt are selling what they can, the production numbers are real, or are you claiming that Iran’s output never decreasd after sanctions were imposed, in that case the reported OPEC output is too low by 1100 to 1300 kbpd (in December 2021).
Tony seemed unaware based on his comment.
According to your graph, OPEC -Saudi was on a downward spiral for about 3 years be fore Covid came along. Now they’re nearly back to pre-Covid levels and that will be the end of any increase.
Frugal,
There were sanctions imposed on Venezuela and Iran and a civil war in Libya, that accounts for the decline. In addition, in 2019 OPEC cut back output to support oil prices.
Ron and Frugal,
Dashed line is centered 12 month average in chart below for OPEC less Saudi Arabia, Iran and Venezuela.
Dennis, you seem to assume that Iran and Venezuela will be back to full pre-sanctions production any day now. That is not the case and will likely never be the case. Iran may, within the next few years, be back to full capacity. But that does not mean they will be pre-sanctions level. And Venezuela will never be back there. They can, with the help of some other nation, increase production somewhat.
Nevertheless, all this simply does not matter. Neither state is producing what they once were and will not be doing that for several years. In the meantime, many other nations are slipping into decline. But because Iran and Venezuela could, if sanctions were lifted, they could increase production, does not mean we should show their imaginary production in our charts as if it were real. The world is what it is, political problems and all. We just have to live with that.
Ron,
I do not make the assumption that you assume.
The point is simply that the decline in OPEC 13 minus Saudi Arabia was due in part to political decisions by the United States,
I assume exactly the opposite of what you think I assume about Venezuela’s and Iran’s future output.
Venezuela could likely return to 1000 kb/d if sanctions were removed and Iran could likely return to 3500 kb/d if sanctions were removed. In both cases it would take 6 to 18 months to achieve this in my opinion. Venezuela is unlikely to return to the 2000 kb/d level (last reached in 2016) in the next 5 years and possibly not ever. Iran is likely to be able to reach 3500 to 3800 kbpd with a removal of sanctions.
Biden badly wants to bring down oil prices before the elections and I would be surprised if an agreement wasn’t reached by summer with Iran
https://www.nbcnews.com/politics/national-security/u-s-restores-iran-sanctions-waiver-deadline-nuclear-deal-looms-n1288698
Venezuela on the other will stay a basket case for the indefinite future. At this point from what I can tell their oil industry would need to be built back up from scratch
Or the US economy will downturn badly in the 2nd Quarter (near 100% probability) and the Fed will kick a dying horse with a couple rate hikes (they say 5.33 but they won’t get past 2). That will get you your low oil price. Oil prices skyrocketed before 2008 collapse as well, long after the markets had peaked. Look for a rhyming verse here. When you can’t increase supply – crush demand.
True true. I also think China could take a spill with their high debt/zero Covid situation. And this could happen in conjunction with a lifting of Iran sanctions to really tank the price. Lots of possibilities.
Two cats,
The financial crisis had little to do with oil prices reaching a peak in 2008. It was a housing bubble/mortgage crisis due to poor regulation of the financial system.
Perhaps there will be a future financial crisis in 2022Q2, these are difficult to predict in advance, the only way to do this is to predict a financial crisis next quarter every quarter and eventually you will be right. If one had done that from 1929 to now in the US, you would have been correct about 2 times in 368 quarters, or about a 184 to 1 bet.
Stephen,
Doubtful that Iranian oil coming online will tank the price, it might keep it under $100/bo, but keep in mind it is only 1000 kb/d and will simply make up for the rest of OPEC reaching capacity, oil consumption has been recovering at a 5000 kb/d rate over the past 17 months and the long term trend in annual oil consumption growth (1983 to 2021) is about 757 kbpd, the World oil supply will be tight unless there is a recession, the world can afford $100/bo.
Comment above should say “…recovering at a 5000 kbpd annual rate…” (I forgot the “annual”).
d. coyne – didn’t say anything like that, not sure how you read that into my comments. I said that oil prices continued to rise even after or even because financial markets had already started to wobble. Russell 2000 has already crashed once, Nasdaq has been close a couple of times, and the S&P has already corrected. Yet oil prices continue to rise despite huge rattles in financial markets. Very similar to how 2008 played out. So in a sense you are agreeing with me – housing crash came first, then markets wobbled, and then, for whatever reason, oil prices continued to rise despite all the warning signs that the global economy was about to take a tumble.
d coyne – also didn’t predict a financial crises – again, for someone so detailed oriented you sure do read a lot into other people’s comments. I said downturn badly, which it almost certainly will, not a hard a prediction. The reason is that 2022Q2 will be compared against 2021Q2 which was compared against 2020Q2. I wonder what might have happened in 2020Q2 that would have made 2021Q2 look like one of the best quarters ever recorded in US history. Oh yeah, global pandemic. And this is with the biggest spike in inflation in 40 years rolling over (Fed is always fighting the last war). And one of the best 18 months for US markets in a long time (June 2020 to November 2021). It’s not petroleum engineering. This is just obvious.
If the Fed raises interest rates 3 times then yes, I’m predicting a global financial collapse similar to or worse than 2008, but that’s moot. Never gonna happen. See you in July.
Two cats,
I look at economic output when gauging the economy, not stock markets, oil prices started to fall before the financial crisis, they peaked in July 2008 and the financial crisis started in September 2008. Also I think you might mean economic growth will slow, the term downturn badly is open to many interpretations (from growth rate slowing from 6.9% to 2%, which I would simply call an economic slowdown versus a “bad downturn” to an fall in real GDP of 2% to 4% such as during a finacial crisis).
Sorry for misinterpreting your meaninig, I also missed which “markets” you were referring too (there are many).
Also note that the quarterly estimates for real GDP growth are based on the previous quarters’ GDP and then the result is annualized. For the past 5 quarters the average annual growth rate in real GDP has been about 5%.
I agree real GDP growth is likely to be slower in 2022 in response to Fed action to reduce inflation, probably slowing to an annual rate of 2 to 3% and one could claim this is a “bad downturn”, I would call it a mature economy returning to its normal rate of growth. Note that from 2010Q1 to 2019Q4 the average annual growth rate for US real GDP was about 2.2%.
The trump policy of pulling out of the nuclear deal has been an abject failure. Despite sanctions Iran is now close to nuclear bomb capability.
The US/EU and others have very little leverage with Iran now. The hand has been squandered.
“Iran’s nuclear program is on the verge of producing enough fuel for a nuclear bomb in just a matter of weeks and could have a device built in less than a year, US officials estimate.
Iran’s ‘breakout time’ – the time it would take to produce enough weapons-grade uranium for one nuclear weapon – has advanced greatly after Donald Trump withdrew the US from a deal with the country in 2018, officials claim.
The reduced breakout time is significantly lower than the 12-month period that formed the basis of the nuclear deal signed by President Barack Obama in 2015.”
Iran is completely surrounded by countries with nuclear weapons.
It might as well join the club. (sarc)
Aramco Hikes Oil Prices For Asia Again
Amid the continued rally in oil prices, Saudi Aramco raised its official selling price for crude exported to Asia, with its flagship Arab Light cargos for March up by $0.60 per barrel to a total $2.80 per barrel premium over the benchmark
Pemex appears to following through with its plans to stop exports by next year.
https://www.reuters.com/business/energy/exclusive-mexicos-pemex-sharply-cuts-oil-supply-india-it-readies-new-refinery-2022-02-08/
Running Out Of Sweet Spots: Shale Growth May Not Materialize Bold mine.
A few years ago, oil expert Art Berman warned that drillers in the Permian were running out of sweet spots. The WSJ again reported three years ago that many wells were underperforming, putting lenders on edge as their clients’ projections for well output failed to materialize consistently. The new report suggests things have not changed all that much, but there was a way to make the oil last longer: boost production more slowly.
While this is a straightforward approach, perhaps not all would be able to stick to it, with some opting instead to make the best of high prices while they last. But here is the thing. If the data about drilling inventory and Scott Sheffield are right, higher prices will last longer because of what effectively amounts to limited—and falling—production capacity in the shale patch.
Just a few years ago considered the biggest threat to OPEC’s global dominance, now the shale patch appears to be in a situation similar to that of many OPEC members: drillers might want to drill more, but there is only so much they can actually drill before it becomes prohibitively expensive.
Short-term forecasts remain upbeat, not just from data analytics providers but from the EIA as well. It is the long term that might need to be paid a bit more attention, not just in the shale patch. Underinvestment within OPEC and the nature of shale oil extraction might combine to play a really bad joke on the world before we have managed—if we ever do manage—to wean ourselves off fossil fuels.
Took a quick look at Pioneer’s Annual Report for 2020. At the end of 2020 they had about 760000 gross acres, if we assume all of this is undeveloped acres (probably not) and 273 acres per well (9500 by 1320 feet) that allow about 2784 wells to be drilled, in 2020 they completed about 255 wells and at that rate would allow about 11 years of drilling (the real number would be less because some of that 760000 acres is no doubt developed, I do not know the proportion.) Seems the 15 to 20 year inventory claimed by Sheffield must assume tighter well spacing than I have assumed, but as LTO Survivor has told us, tighter spacing than 1320 feet between laterals is likely to create well interference and lower EUR per well, I have read that in some places such as the southern Delaware basin that 1760 foot spacing is optimal, Pioneer mostly operates in the Midland basin, they have sold their Delaware basin acreage as of 2021Q3 (from 10Q).
What if the oil market bulls are wrong and this lonely bear is right?
The bear’s name is Ed Morse, the head of commodity analysis at Citigroup Inc. Last week, he stuck his head above the parapet, telling clients to sell oil. He avoided the front of the oil price curve, however, and instead recommended shorting the Brent December 2022 contract, which was trading at the time at US$82.39 a barrel. A few days on, the trade is well under water.
https://www.bnnbloomberg.ca/what-if-the-oil-market-bulls-are-wrong-and-this-lonely-bear-is-right-1.1720193
Ovi,
Good piece, thanks.
The part quoted below is not correct in my opinion.
OPEC too may do the unexpected. Nigeria, Angola and a few others may be at capacity but, if prices rise above US$100 a barrel, other members will come under domestic pressure to pump. Saudi Arabia, the United Arab Emirates and Iraq can easily add a total of 3 million barrels a day above their current output. While Russia may appear to be tapped out, it would be wrong to assume it could not produce more by June or December. Vladimir Putin needs as many petrodollars as he can get, and will push everyone to deliver.
The part about Saudi Arabia, UAE and Iraq being able to easily add 3 Mb/d of oil to the market is nonsense, these three nations might be able to add 1100 kb/d above their December 2021 level of output near term, much of the purported OPEC spare capacity does not really exist. If we add Iran to the mix they might in total be able to add 2200 kb/d (Saudi Arabia, Iran, Iraq, and UAE as a group), but there will be continued decline from other OPEC producers that will offset this. The World oil market is likely to remain tight unless central banks over do interest rate hikes and cause a recession, which will slow down demand growth.
I doubt we will see more than a 500 kb/d increase from Russia from December 2021 to December 2022.
Dennis , ” The part about Saudi Arabia, UAE and Iraq being able to easily add 3 Mb/d of oil to the market is nonsense, these three nations might be able to add 1100 kb/d above their December 2021 level of output near term, much of the purported OPEC spare capacity does not really exist.”
We are on the same page on this . Nonsense . Tks Ovi for the link .
Dennis
I agree. I don’t think that Mr Morris saw the piece on Iraq, posted above, not having enough water to increase production.
https://peakoilbarrel.com/november-us-oil-production-surprises/#comment-734698
Ovi,
Probably not. My estimate is simply the highest 12 month rate achieved to date minus December output, so accounting for problems in Iraq would reduce the potential increase even further.
He has likely read the claims from the IEA that OPEC has 3.5 Mbpd of spare capacity and assumes they are correct, they are not, claimed OPEC capacity is at least 1.3 Mb/d too high, and about 1.1 Mb/d of OPEC spare capacity is in Iran.
Damn Dennis, I think you are getting smarter every day. You are starting to talk like me. ☺️
One caveat that I see on the horizon is the lifting of sanctions on Iran. I think that will happen within the next 12 months. I think Iran may be able to increase production by from 1 to 1.2 million barrels per day, over about six months, if that happens.
Nothing is going to happen in Venezuela however. Well, at least not much.
Ron,
I agree with your 2/8/2022, 6:19 pm comment above almost 100%, exception is your first sentence.
Morse tends to be an oil bear, at least publicly. No telling how he has traded oil over the decades.
He was correct in both 2008 and 2014. Assuming central banks raise rates, consumption growth will likely slow.
The only thing I am certain about regarding oil price future is volatility. My annual WTI average price prediction ranges from $35-$115 over the next 7-8 years. It wouldn’t surprise me to see both.
There are analyst taking heads that are bears and bulls. Usually they aren’t both. But, not sure how they actually trade.
John Kilduff is another who tends to be a bear. Same with Steven Schorck.
Shallow sand, I agree oil prices will be volatile, but my range for the next 7 to 8 years (for average monthly WTI nominal oil price) would be $75 to $140/bo with the average price over the period 2022 to 2030 at about $100/bo. Note that with a slow transition to EVs as some favor or foresee this price range might apply to 2022 to 2041, though I would change to real oil prices in 2020$ and might bump it to $75 to $175/bo with an average price of $125/bo in 2020$ over that 20 year period. This assumes only garden variety recessions and no GFC2, Great Depression 2, global pandemic 3, world war 3, or large asteroid strike in the next 20 years.
A new Non-OPEC post should be up before noon
There are a group of people who are never mention, maybe a billion maybe more maybe less. Most know that there is a world out there where people are warm when it’s cold and comfortable when it’s hot. They know these people have faucets in their home that provide clean cold and hot water. They know there are boxes that can keep food cold and safe. They know there are rooms were a person can relieve oneself and wash themselves. These people want these life improving stuff. For the arrogant western elite to demand the end of the burning of fossil fuels dooms these billion people the hope of ever coming close to this standard of life.
Ervin,
The fossil fuel will deplete in any case and climate change will make life miserable for all if fossil fuels continued to be burned.
A new thread reporting on October Non-OPEC Production has been posted.
https://peakoilbarrel.com/us-recovery-boosts-october-non-opec-oil-production/
A new Open Thread Non-Petroleum has beed posted.
https://peakoilbarrel.com/open-thread-non-petroleum-14/