A guest post by Ovi
Below are a number of oil, crude plus condensate (C + C ), production charts for Non-OPEC countries created from data provided by the EIA’s International Energy Statistics and updated to October 2021. Information from other sources such as OPEC, the STEO and country specific sites such as Russia, Brazil, Norway and China is used to provide a short term outlook for future output and direction for a few countries and the world.
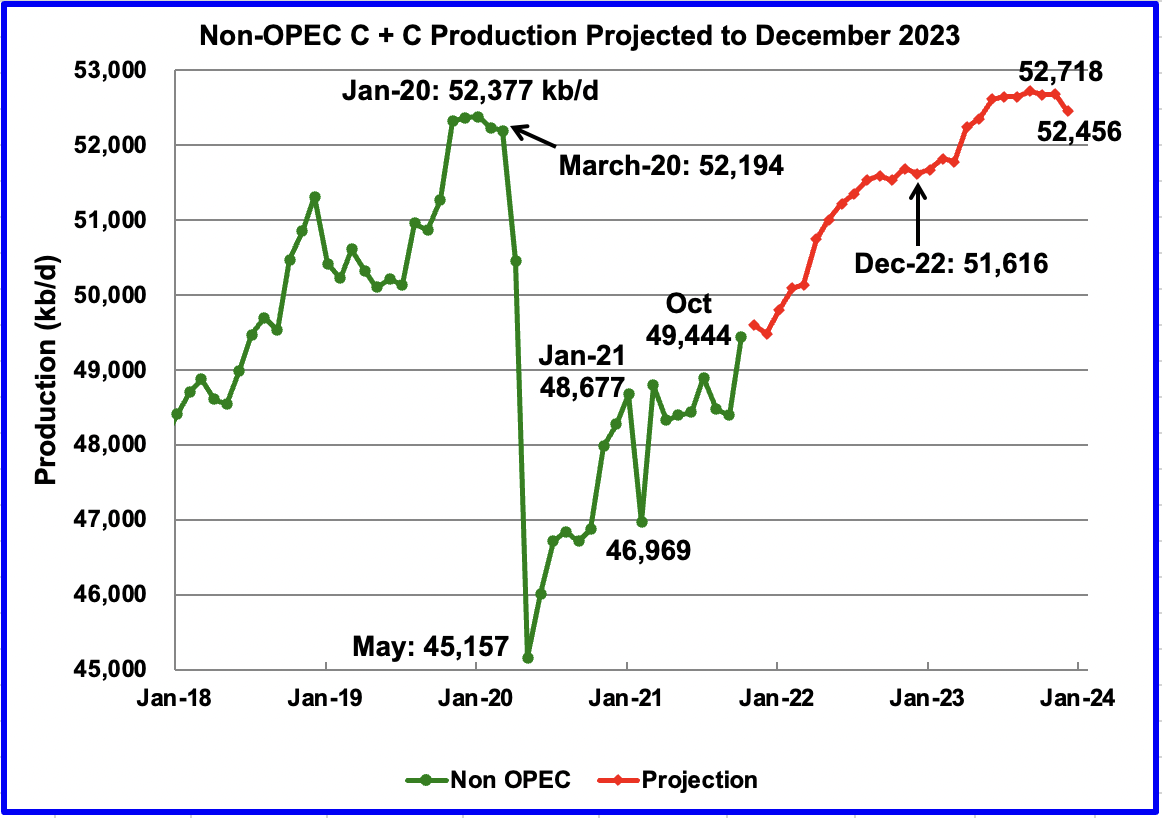
October Non-OPEC production increased by 1,047 kb/d to 49,444 kb/d. The biggest changes in production occurred in the US, 651 kb/d, Canada 286 kb/d, Kazakhstan 267 kb/d and Russia, 127 kb/d for a total of 1,337 kb/d. The biggest decline occurred in Brazil, down 223 kb/d.
Using data from the February 2022 STEO, a projection for Non-OPEC oil output was made for the time period November 2021 to December 2023 (Red graph). Output is expected to reach 52,456 kb/d in December 2023, which is 79 kb/d higher than the January pre-covid peak of 52,377 kb/d.
The current December 2023 output of 52,456 was revised up by 248 kb/d from the previous January report.
Output in December 2022 is expected to rebound to 51,616 kb/d, an increase of 2,172 kb/d from October 2021. The biggest contributors will be the US for 881 kb/d and 1,291 kb/d from the former USSR and other countries. Note that a big increase of 608 kb/d occurs in April 2022.
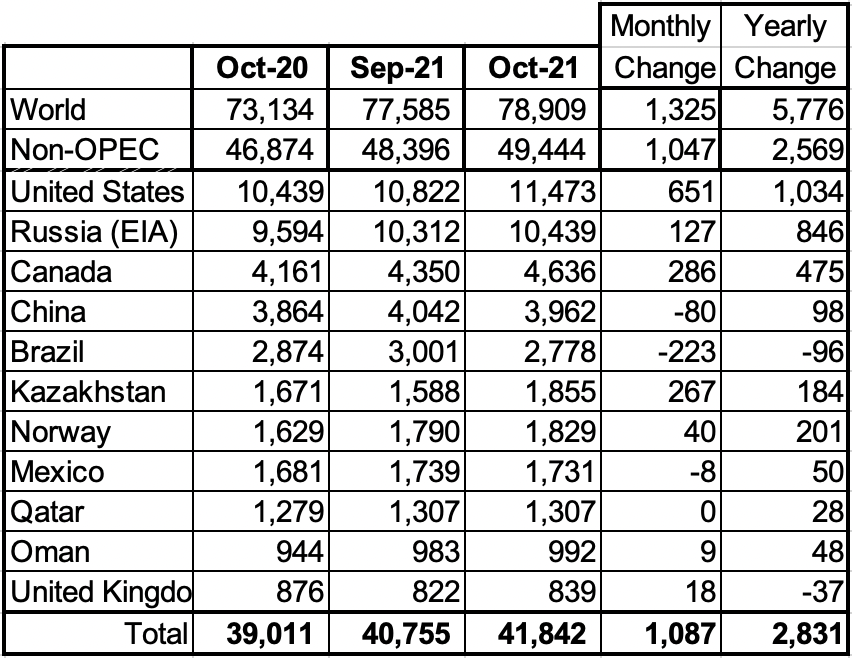
Above are listed the world’s 11th largest Non-OPEC producers. The original criteria for inclusion in the table was that all of the countries produced more than 1,000 kb/d. The last two have currently fallen below 1,000 kb/d.
In October, these 11 countries produced 84.6% of the Non-OPEC output. On a YoY basis, Non-OPEC production increased by 2,569 kb/d while on a MoM basis production increased by 1,047 kb/d to 49,444 kb/d. World YoY October output was up by 5,776 kb/d.
Production by Country
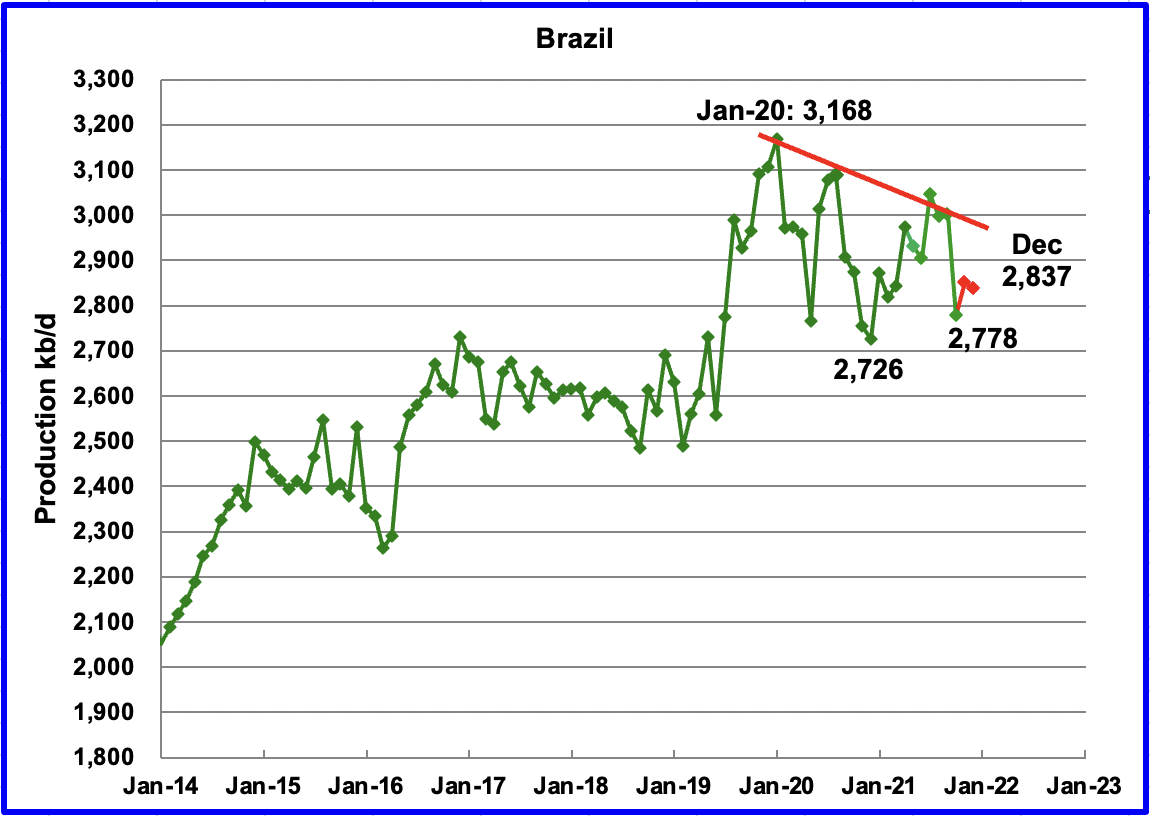
The EIA reported Brazil’s October production declined by 223 kb/d to 2,778 kb/d. The national petroleum association reported that November output rebounded to 2,852 kb/d and dropped in December to 2,837 kb/d. (Red Markers).
With regard to Brazil, the December OPEC report stated: “COVID-19-related health and safety measures at production platforms, delays in project start-ups and heavy natural declines at offshore mature fields, particularly in the Campos Basin, have also contributed to under-performance in production.”
Peak production was reached in Brazil in January 2020, followed by two subsequent lower peaks. The Brazilian pre-salt reserves are being developed by Petrobras, as well as multinational oil companies such as Royal Dutch Shell, British Petroleum, Chevron, and ExxonMobil. These companies are spending hundreds of millions of dollars to produce the oil. One has to wonder if these companies are cutting their production expenditures, leading to the decline in production that started in January 2020.
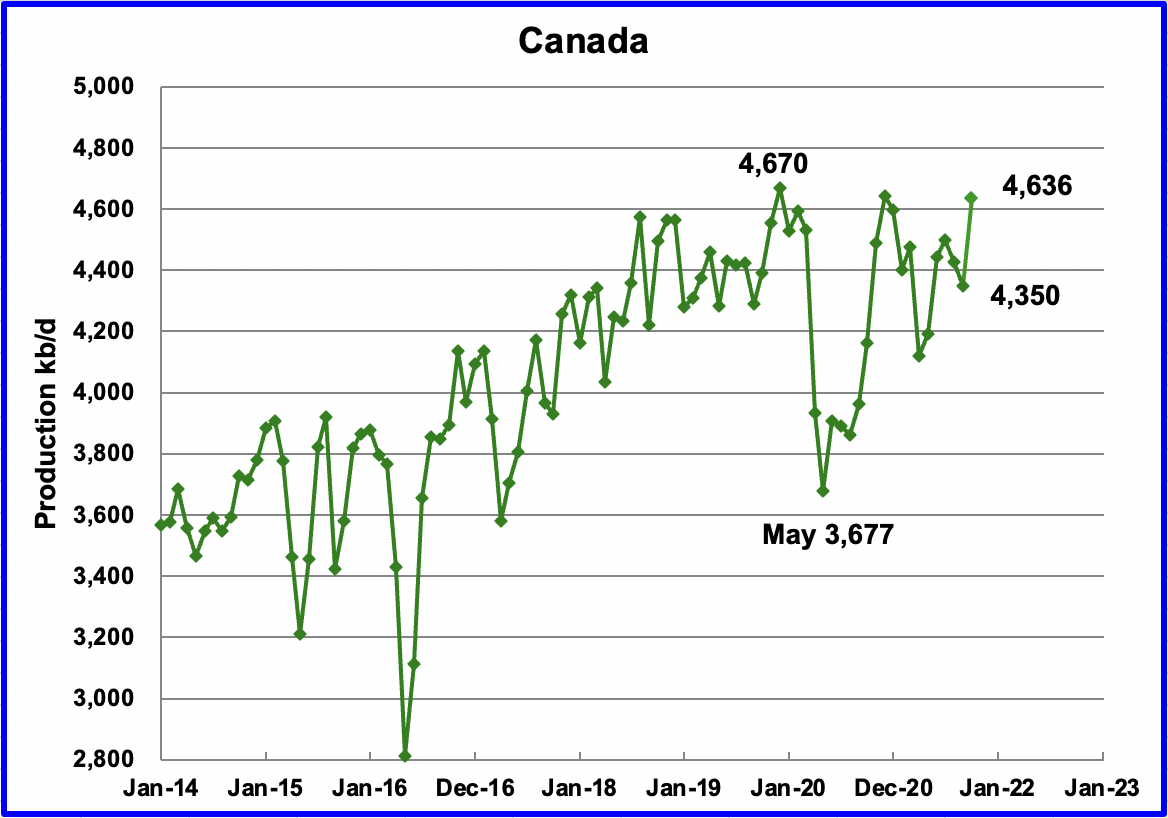
According to the EIA, October’s output increased by 286 kb/d to 4,636 kb/d. Canada is close to exceeding its pre-covid production level of 4,670 kb/d, achieved in December 2019. The main change for October was a 223 kb/d increase in output of upgraded bitumen.
With the addition of Line 3, Canada has gone from famine to feast with regard to pipeline capacity. In addition to Line 3 starting up, Marathon reversed the direction of its Capline pipeline from flowing South to North to North to South so that Canadian heavy oil now has access to Louisiana refineries
In November Canada shipped 132.3 kb/d by rail to the US, essentially unchanged from October which was 132.6 kb/d.
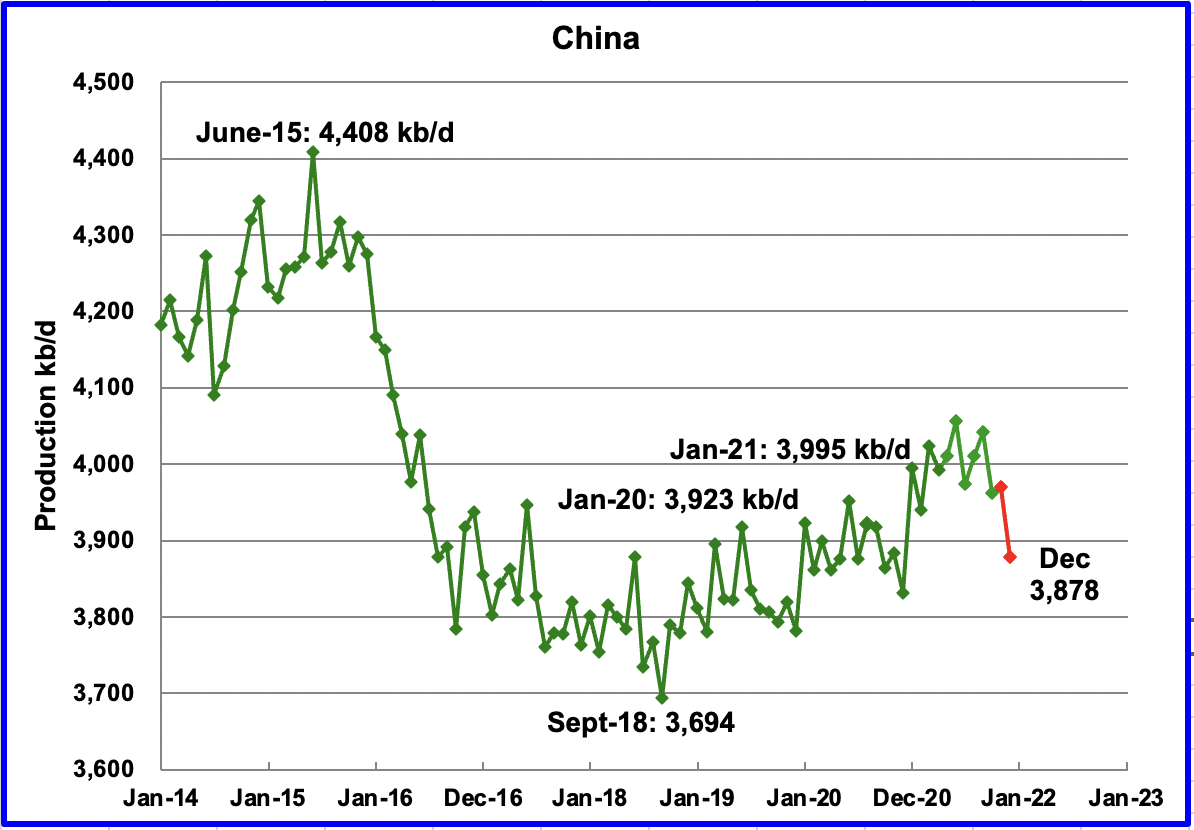
The EIA reported China’s October output decreased by 80 kb/d from 4,042 kb/d on September to 3,962 kb/d. November output increased slightly by 5 kb/d to 3,969 kb/d according to this source and then declined to 3,878 kb/d in December. (Red markers)
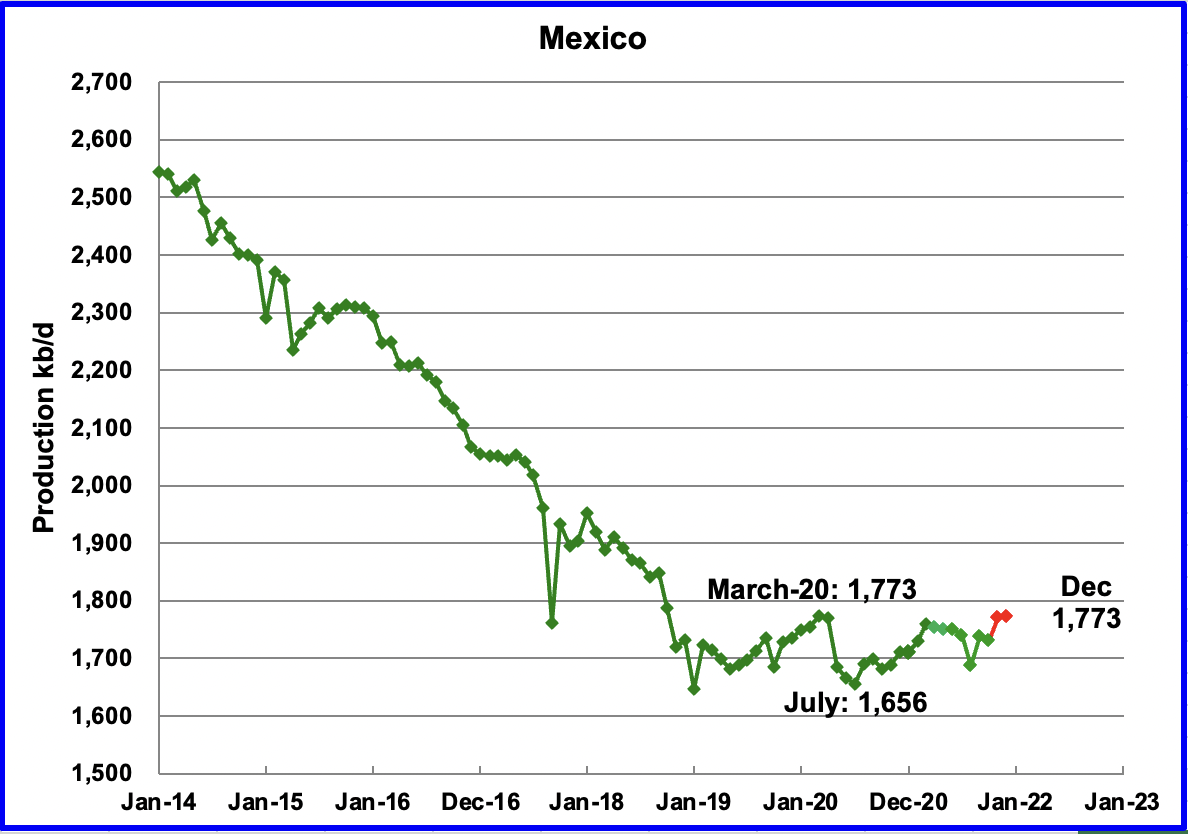
Mexico’s production, as reported by the EIA for October decreased by 8 kb/d to 1,731 kb/d. Data from Pemex shows that November’s output climbed to 1,771 kb/d and was essentially unchanged for December at 1,773 kb/d. (Red markers).
Production has been range bound between 1,650 kb/d and 1,800 kb/d since January 2019. Note that December 2021 production is the same as March 2020.
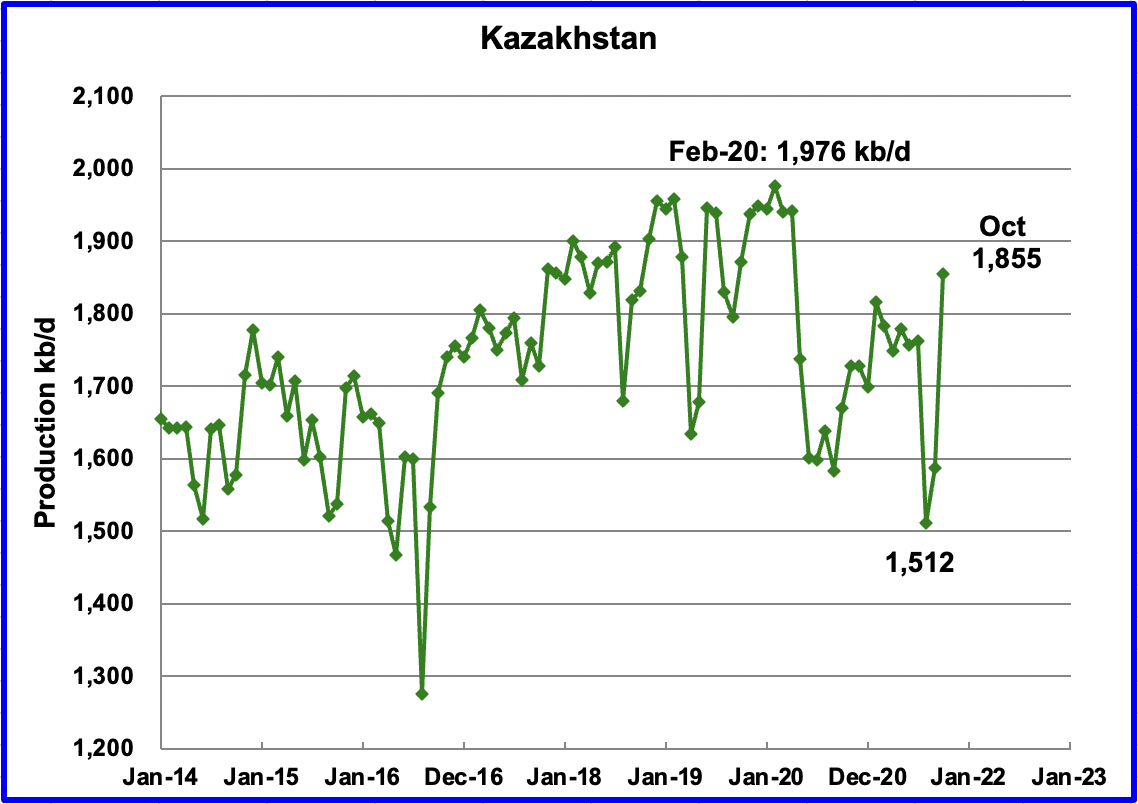
Kazakhstan’s output increased by 267 kb/d in October to 1,855 kb/d following the end of maintenance in the Tengiz field. October was the highest output since May 2020. Further gains are expected in November.
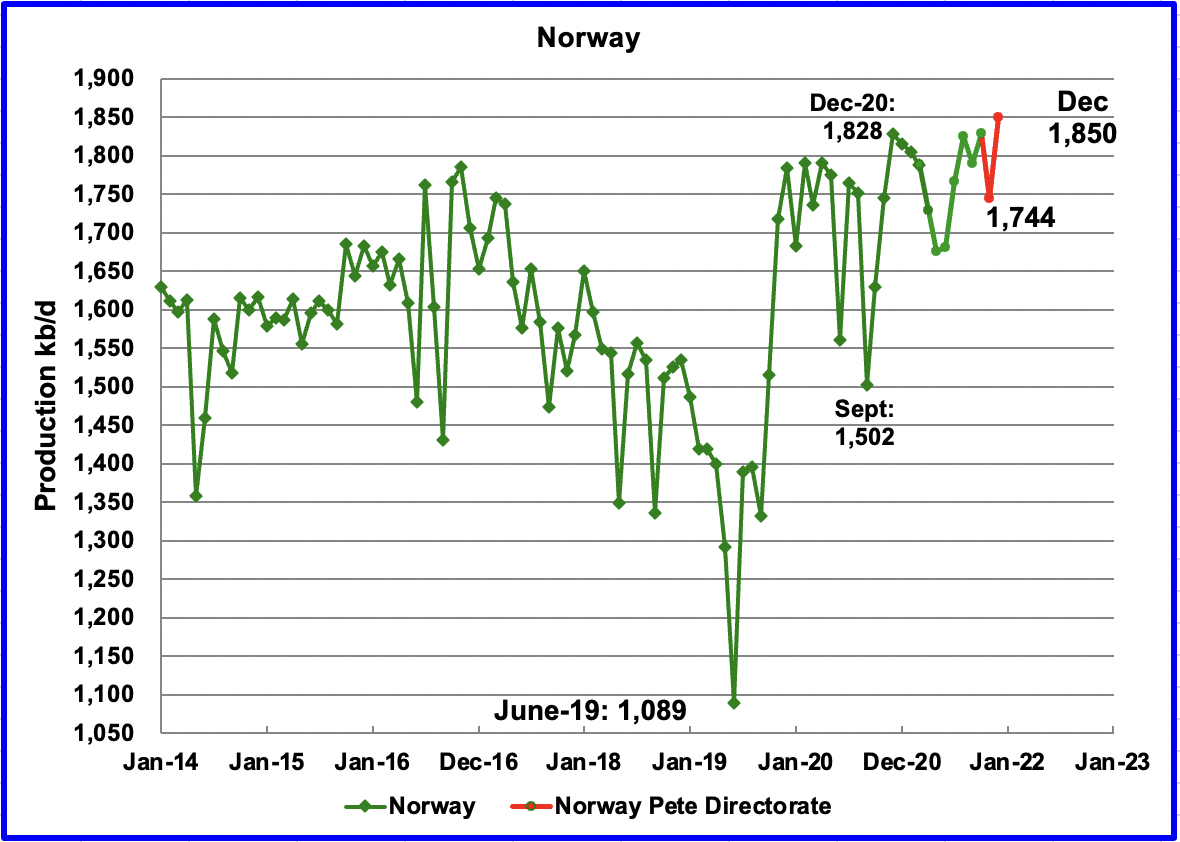
The EIA reported that Norway’s October production was 1,829 kb/d, up 40 kb/d from September. The Norway Petroleum Directorate (NPD) reported that production in November decreased to 1,744 kb/d and then rose to a recent record high of 1,850 kb/d in December. (Red markers.)
According to the NPD, November production dropped due to technical problems. The production level was 5% lower than the Directorate had forecast.
Earlier this year, the NPD implied that Norway’s production would exceed the December 2020 output in the latter half of 2021. Their prediction was validated in December 2021.
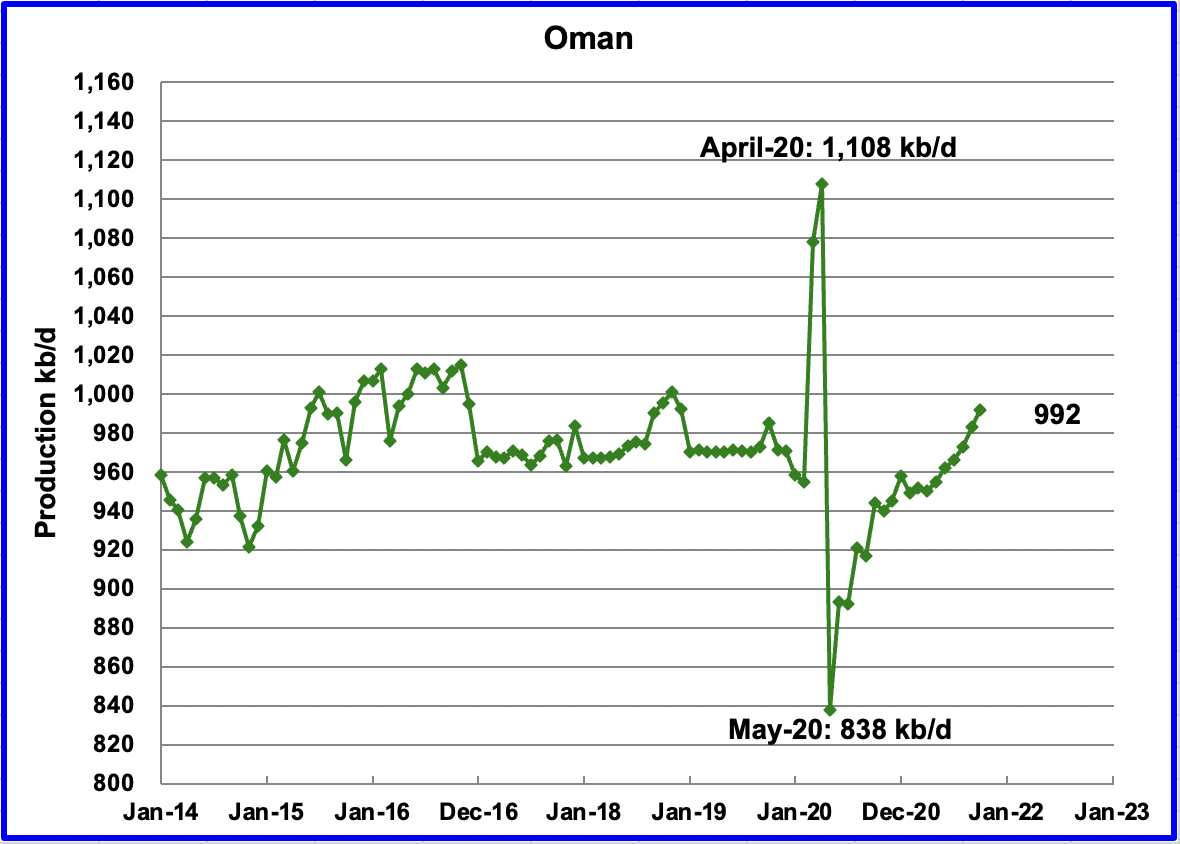
Oman’s October production increased by 9 kb/d to 992 kb/d.
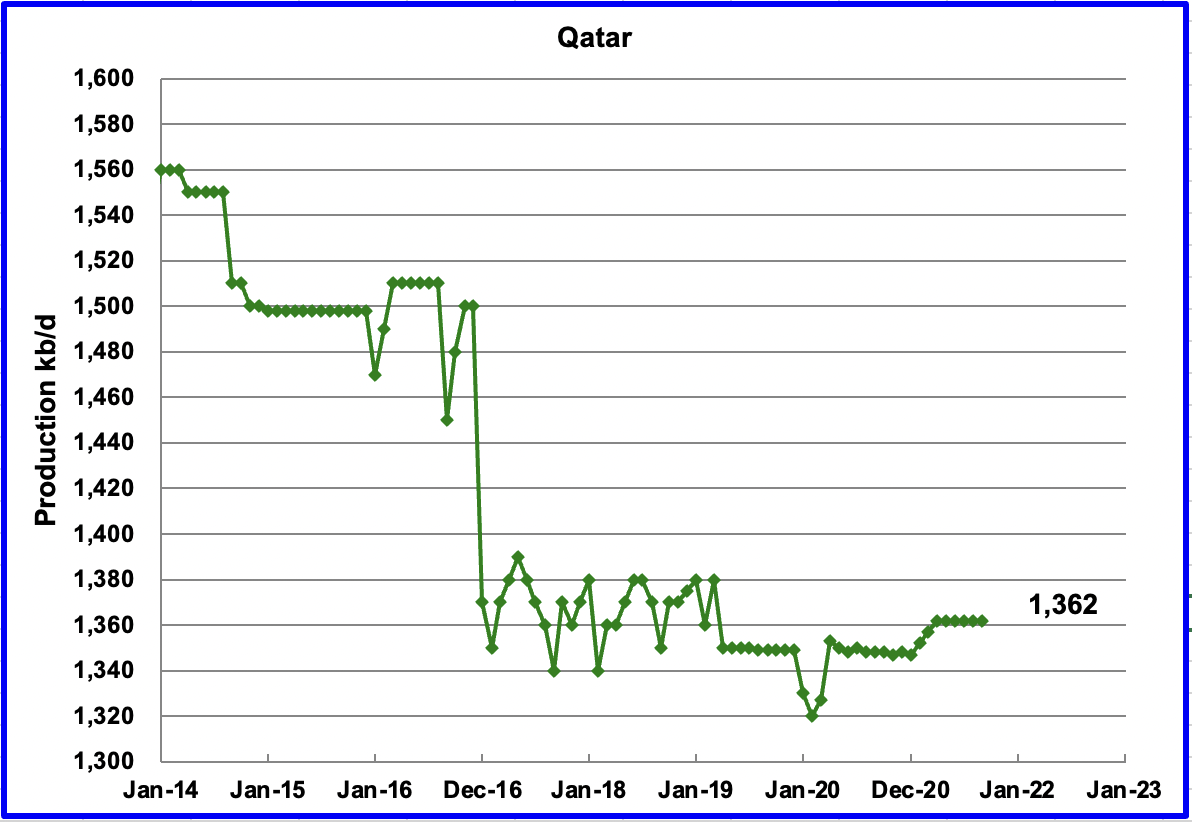
This chart appeared in the January report and has been repeated for comparison with the updated next chart.
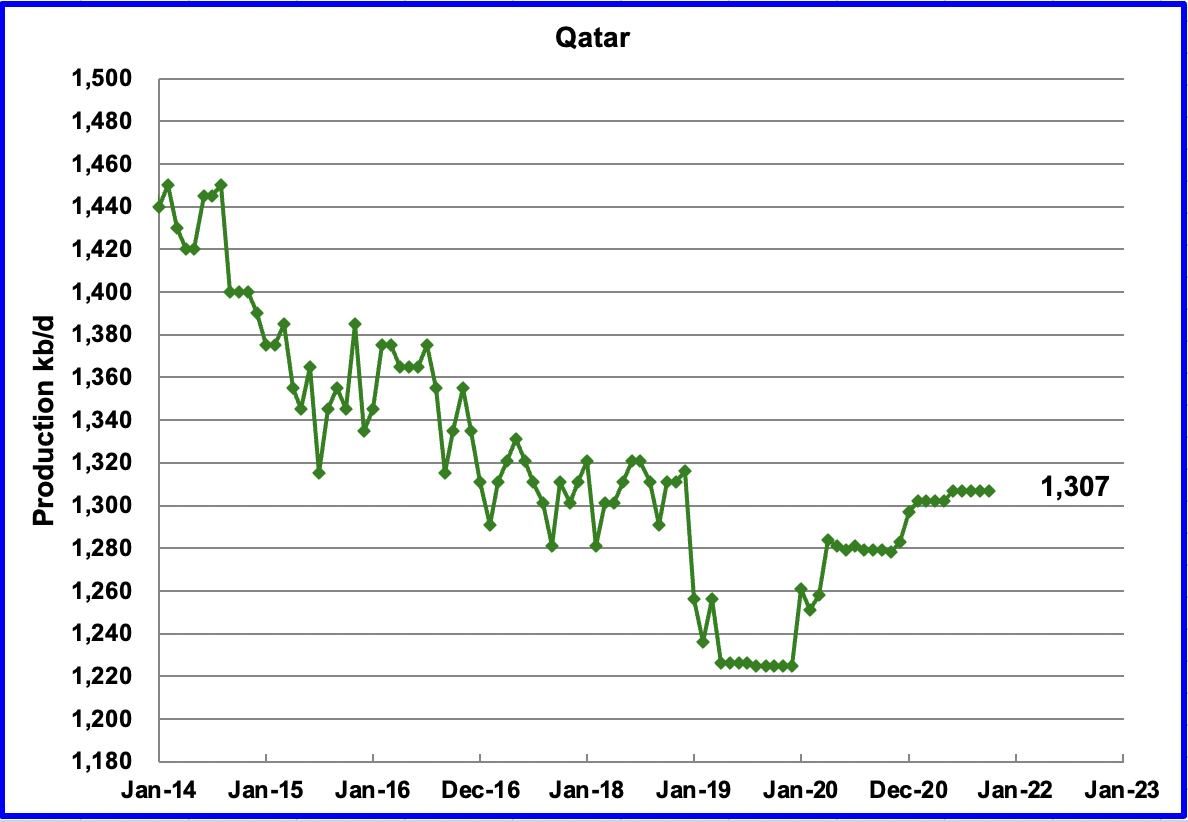
The EIA made a significant revision to Qatar’s oil output from January 2014 to October 2021. Compare the two charts above. January 2014 was revised down by 120 kb/d and September 2021 was revised down by 55 kb/d. October’s output was unchanged at 1,307 kb/d.
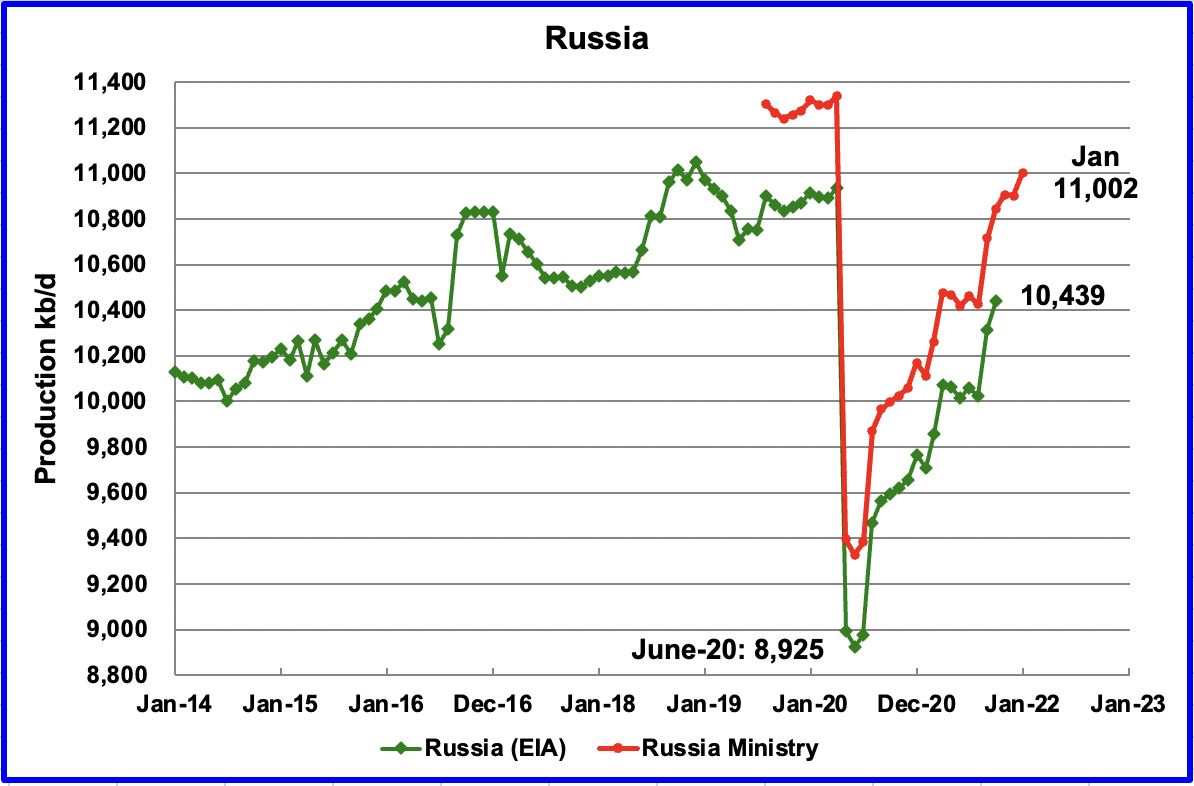
The EIA reported that Russian output increased by 127 kb/d in October to 10,439 kb/d.
This source reported that output in November increased by an additional 63 kb/d to 10,906 kb/d and declined to 10,903 in December and thinks that “Russia’s weak December oil production signals lack of capacity”. The sources numbers were confirmed by the official Russian CDU-TEK report.
This source reported that output in January increased by an additional 97 kb/d to 11,002 kb/d.
It’s difficult to fully assess Russia’s compliance with the OPEC+ deal as the CDU-TEK data doesn’t provide a breakdown between crude and condensate, a lighter type of oil that’s excluded from the agreement. If Russia’s condensate output for January was close to December’s level of 950 kb/d, crude-only daily production was around 10,052 kb/d, some 70 kb/d below its January quota of 10,122 kb/d.
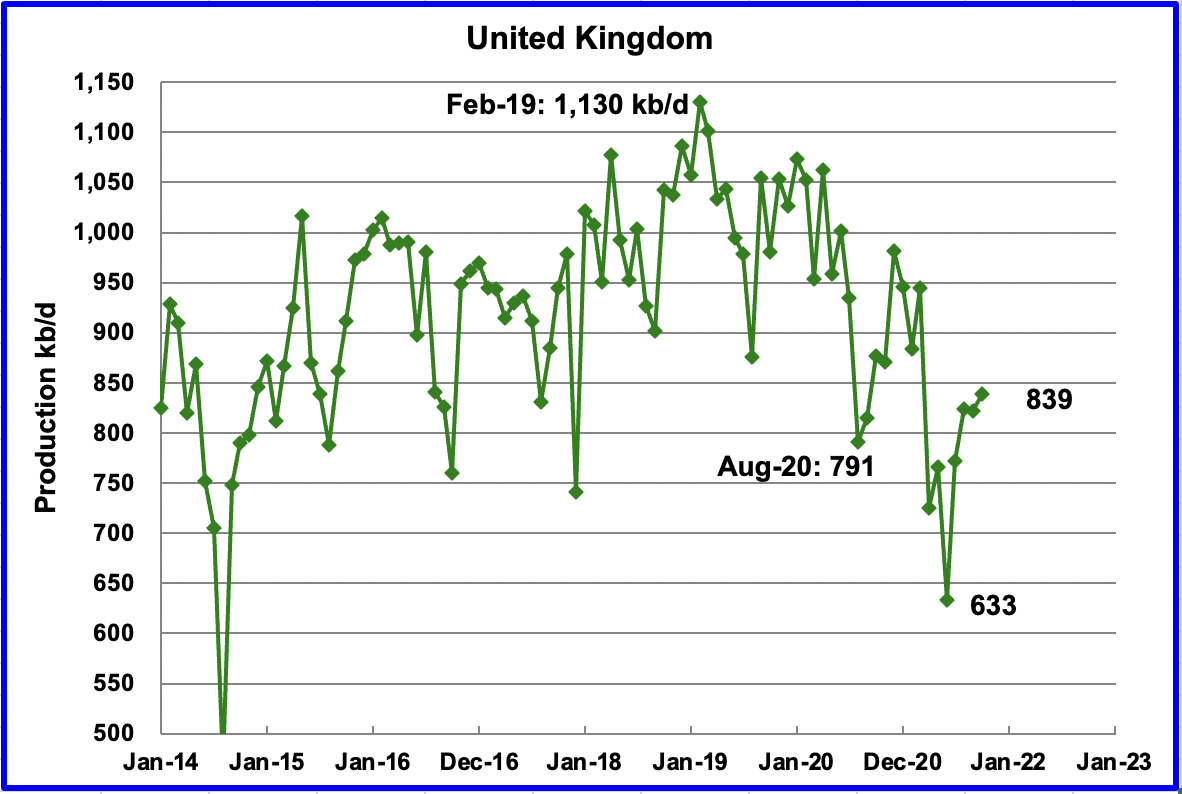
UK’s production increased by 18 kb/d in October to 839 kb/d.
Assuming that UK production can return to 850 kb/d by February 2022, that implies a decline rate of close to 90 kb/d/yr, relative to February 2019.
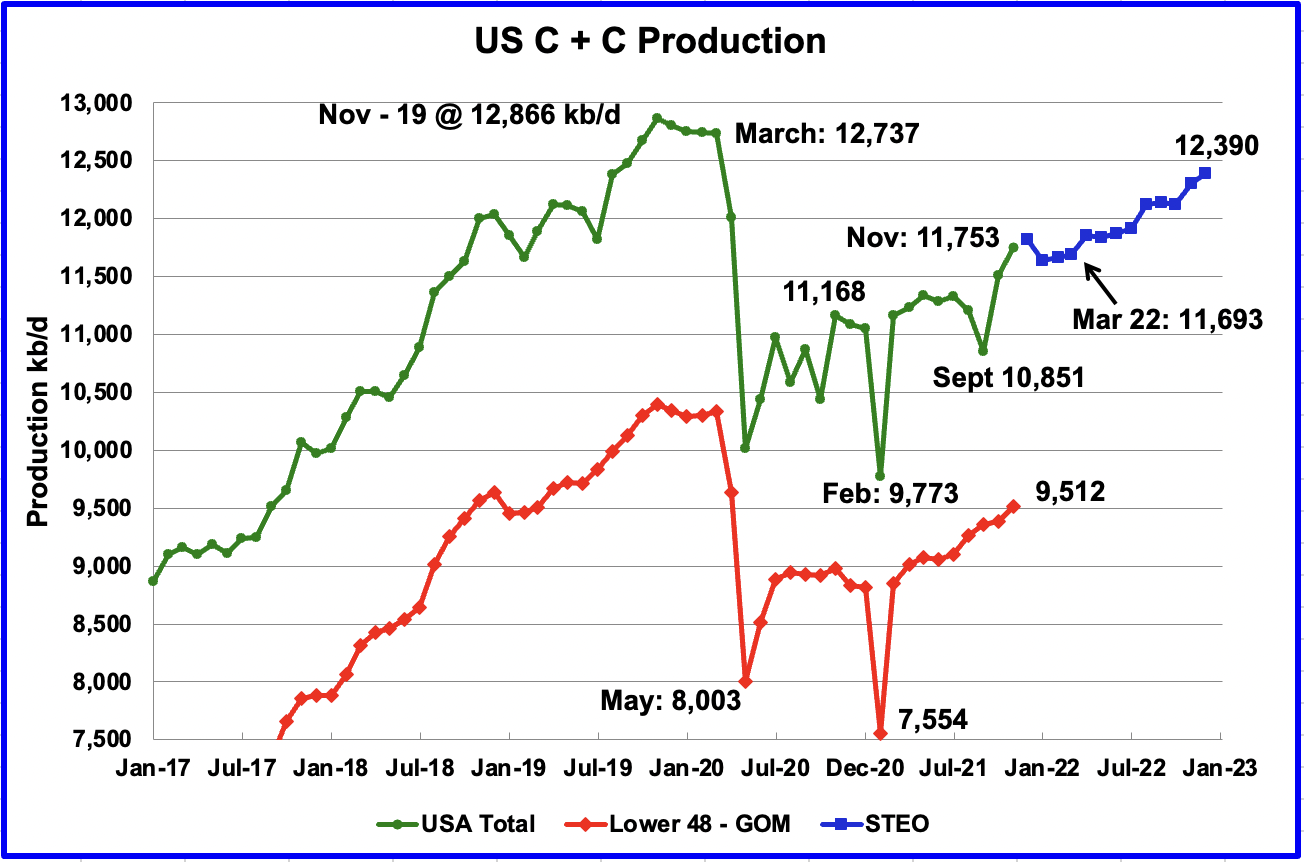
U.S. November production increased by a surprising 244 kb/d to 11,753 kb/d. The unexpected gain was due to a large production increase in the GOM, along with smaller gains in Texas, New Mexico and North Dakota. GOM output increased by an additional 108 kb/d over October after the damaged platforms were fully repaired and brought back on line.
The blue markers are the February 2022 STEO forecast for US oil output from December 2021 to December 2022. Over that period, output is expected to increase from 11,818 kb/d in December 2021 to 12,390 kb/d in December 2022, an increase of 572 kb/d.
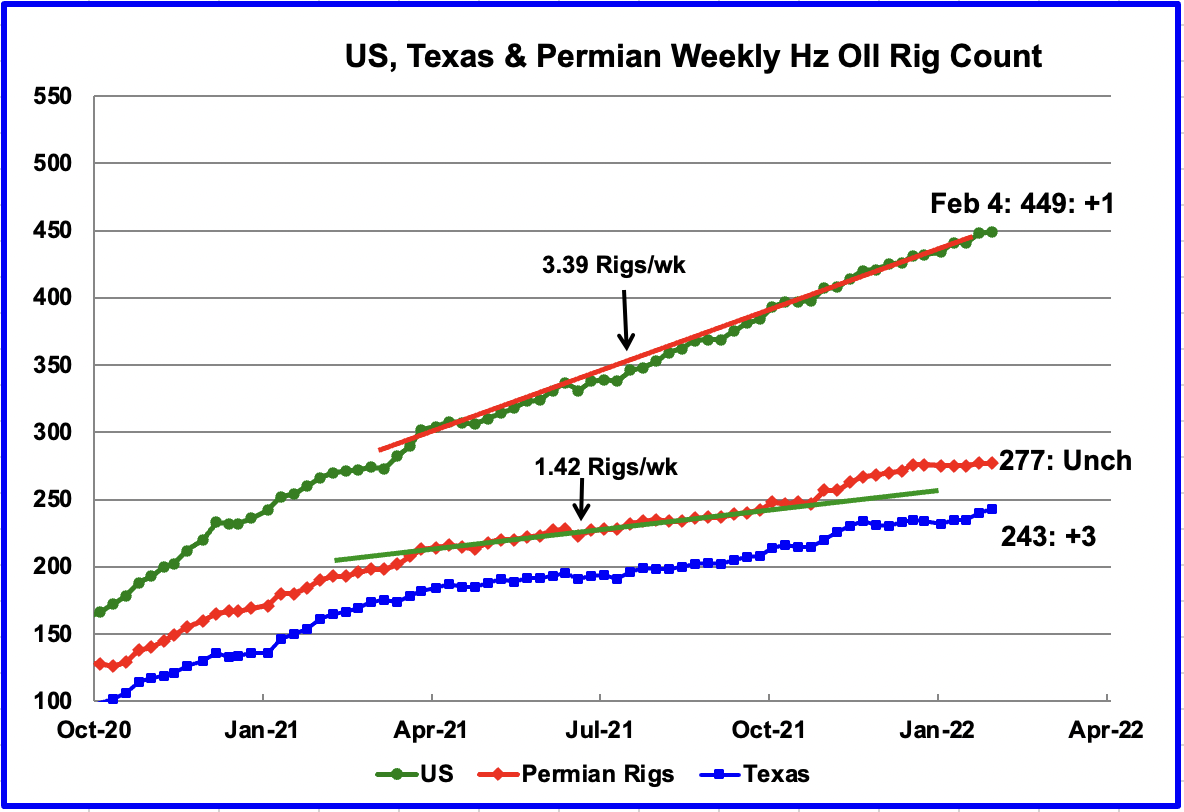
Since the beginning of April, the US has been adding horizontal oil rigs at an average rate of close to 3.39 rigs/wk. For the week ending Februsay 4, 1 horizontal oil rig was added for a total of 449. Permian rigs were flat at 277. In Texas, the rig count increased by 3 while New Mexico dropped by 3.
From late April 2021 to early November, the addition of horizontal oil rigs in the Permian had been rising at an average rate close to 1.42 rigs per week. However since Xmas the weekly addition of rigs has virtually stopped. The rig count was unchanged at 277 in the week ending February 4.
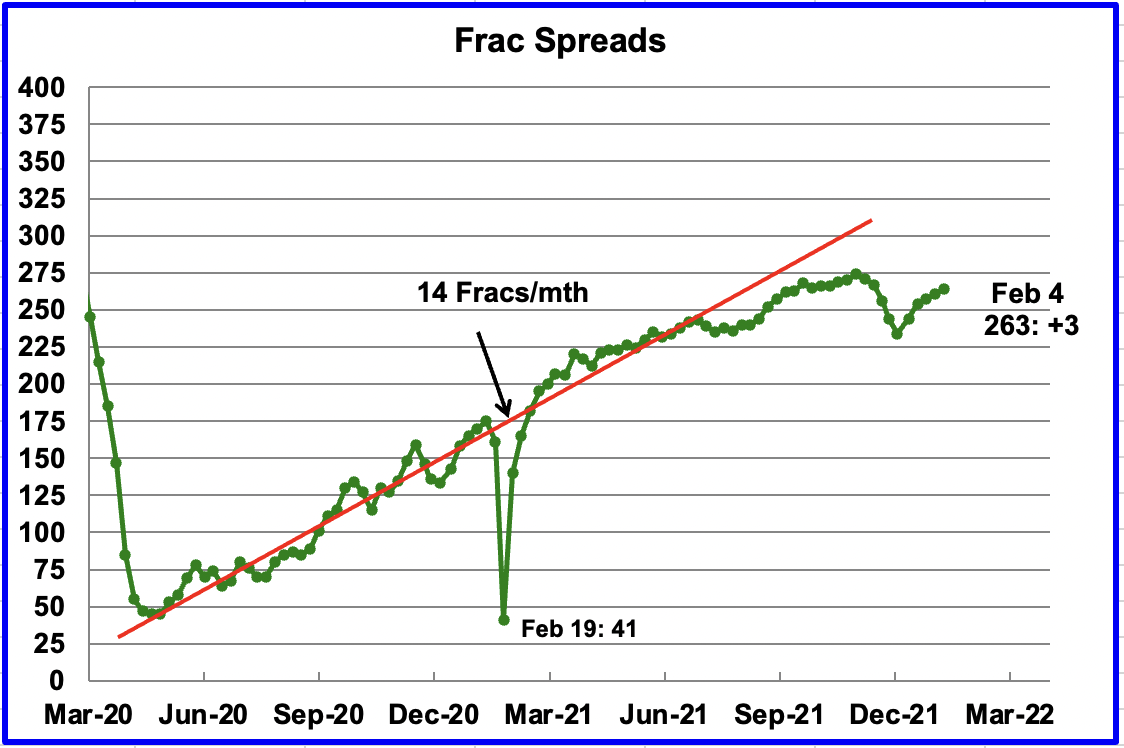
During December 2021, 37 frac spreads were decommissioned primarily due to the holidays. Starting in late January, frac spreads have been added at a rate close to 14 per month. For the week ending February 4, 3 were added.
Note that these 263 frac spreads include both gas and oil spreads, whereas the rigs information is strictly oil rigs.
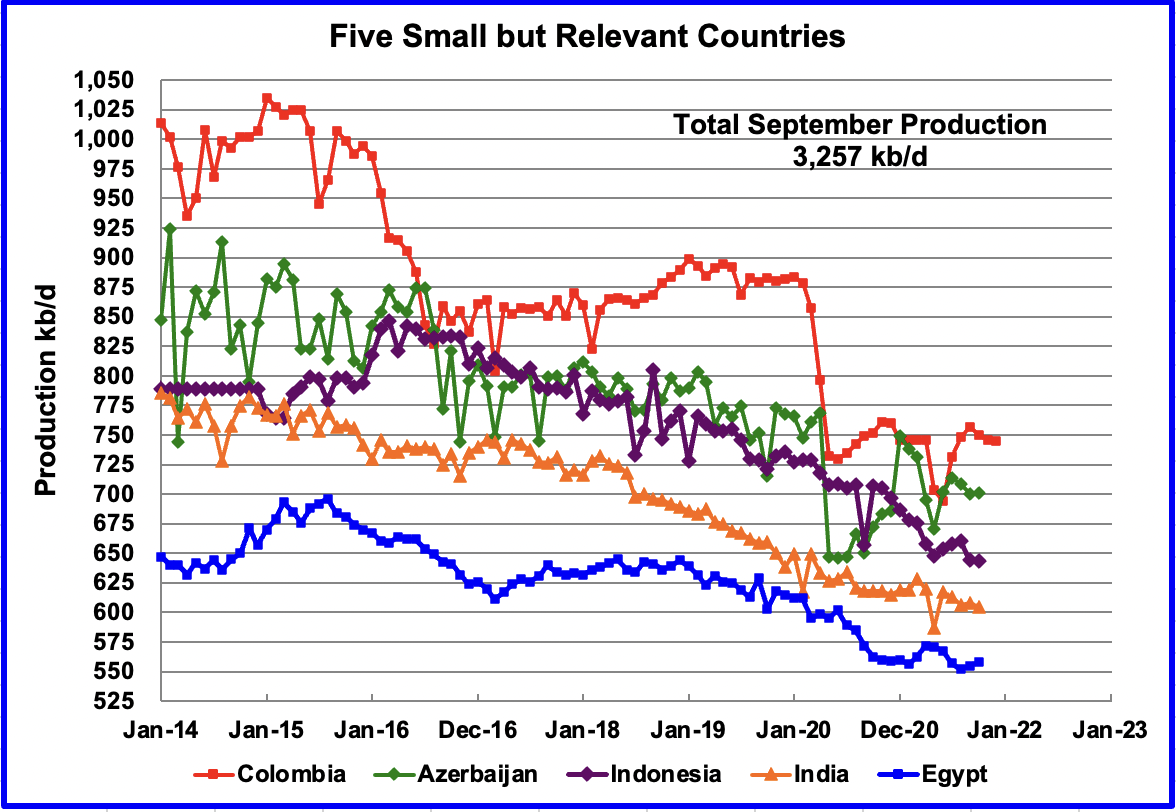
These five countries complete the list of Non-OPEC countries with annual production between 500 kb/d and 1,000 kb/d. Their combined October production was 3,257 kb/d, down by 7 kb/d from September.
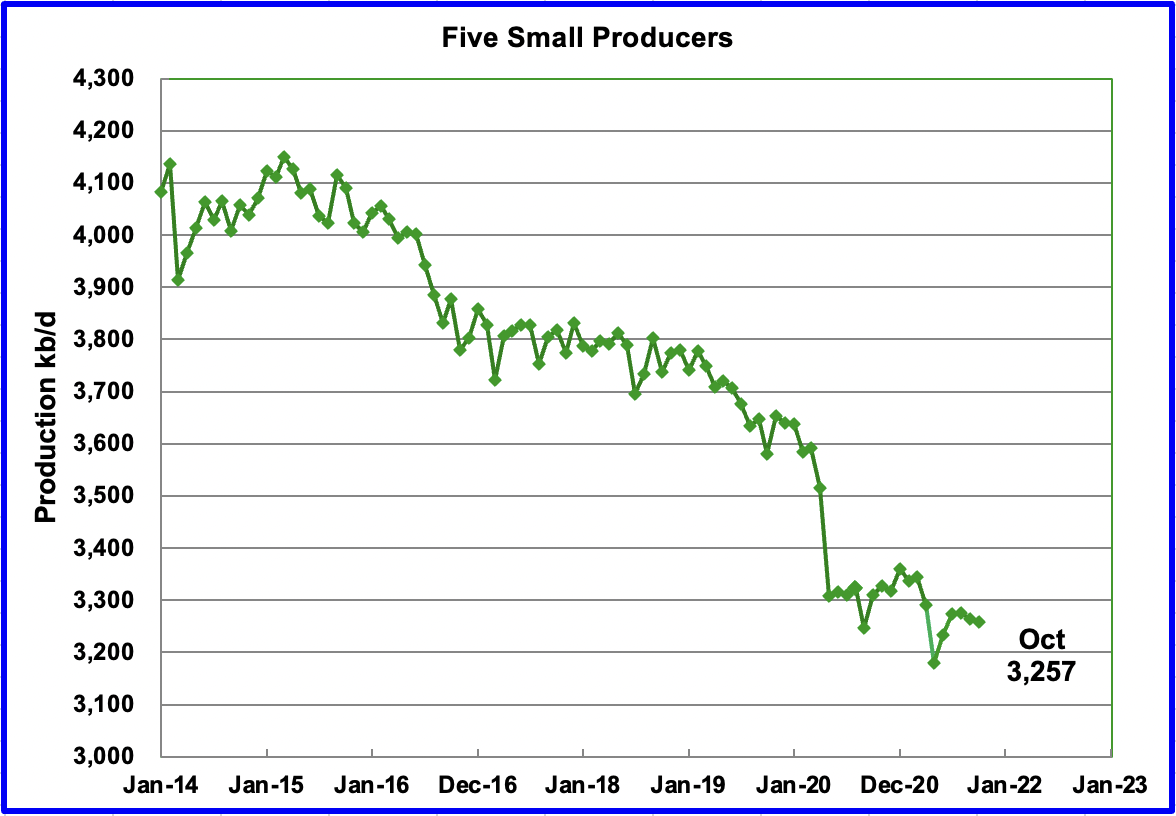
The overall output from the above five countries has been in a slow decline since 2015. The drop in May 2020 from 3,500 kb/d to 3,300 kb/d was primarily from Azerbaijan, 125 kb/d, which is a member of OPEC + and Columbia.
World Oil Production
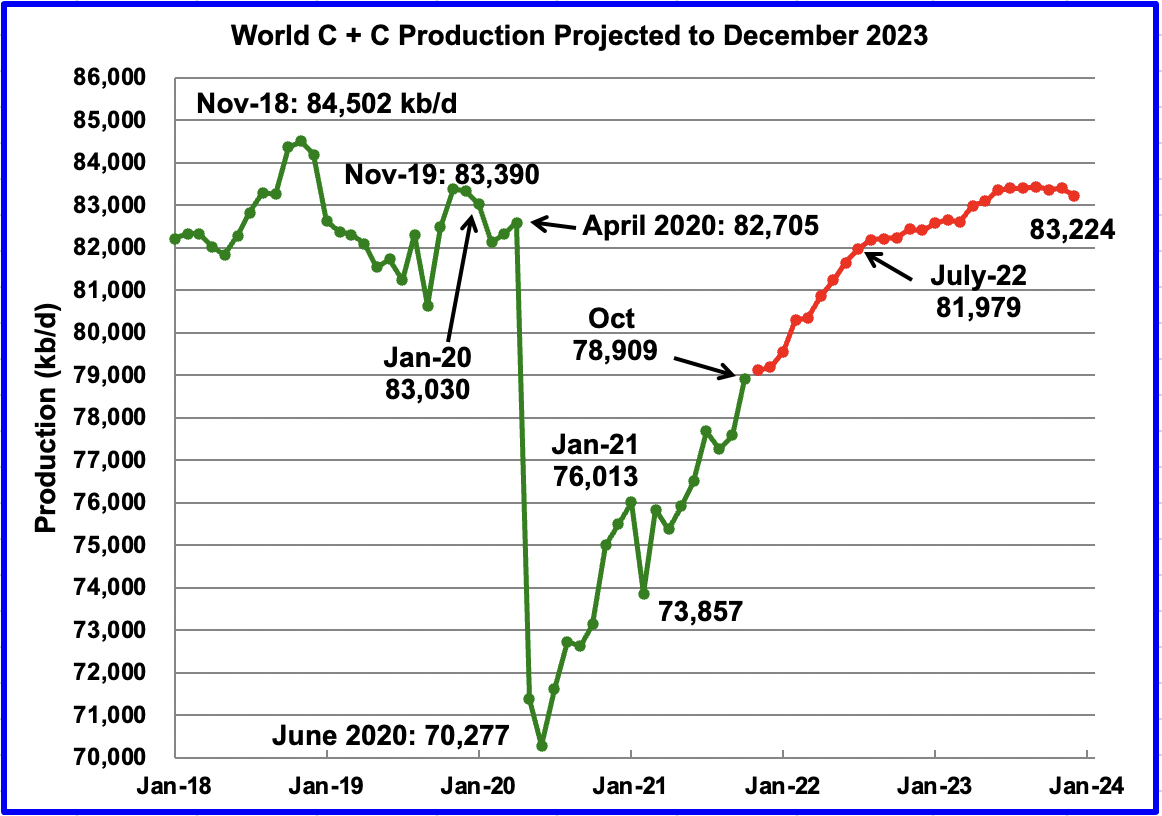
October’s world oil production increased by 1,325 kb/d to 78,909 kb/d according to the EIA. Of the 1,325 kb/d increase, the biggest production changes occurred in the US 651 kb/d, Canada 286, Kazakhstan 267 kb/d, Russia 127 kb/d, Saudi Arabia 152 kb/d and Iraq 76 kb/d. The biggest declines occurred in Brazil 223 kb/d and China 80 kb/d.
This chart also projects world production out to December 2023. It uses the February 2022 STEO report along with the International Energy Statistics to make the projection. (Red markers).
It projects that world crude production in December 2023 will be 83,224 kb/d, 412 kb/d higher than projected in the January report. It is also 194 kb/d higher than the January pre-covid rate of 83,030 kb/d and 1,278 kb/d lower than the newly revised November 2018 peak.
World Oil Decline Rates
This section of the report looks at the countries with declining oil production to assess the world’s net yearly decline rate. Two analyses were conducted to arrive at an estimate.
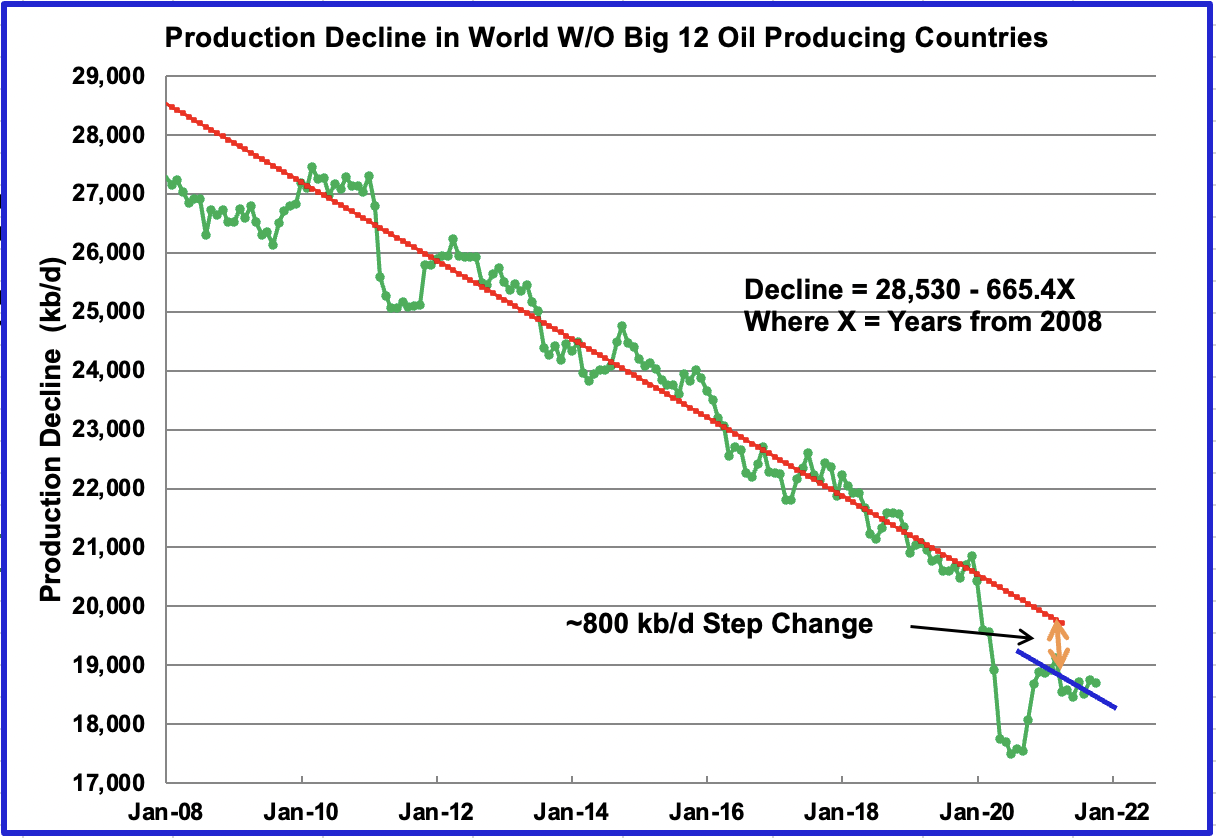
This chart was developed by removing the top 13 oil producing countries from the world’s total output. The years analyzed were from 2008 to 2020 to just before world oil production was cut by the OPEC + countries. The countries excluded were Brazil, Canada, China, Iran, Iraq, Kazakhstan, Kuwait, Norway, Russia, Saudi Arabia, UAE and US since these were the world’s largest producers in October 2021.
An ordinary least squares analysis was conducted on the data between January 2008 to January 2020.
This chart indicates that the average net decline rate for all of the remaining countries was 665.4 kb/d/yr. However, it appears that the rebounding countries output bottomed in mid 2020. Output then peaked in January 2021 before the decline resumed.
A blue line has been placed parallel to the main decline line for the 2021 data points. While the time period is short, it appears to fit the few months after January 2021. At this point, the the blue line seems to indicate that a production step change of 800 kb/d occurred during 2020.
This step change may be an early indication that damage may have been done to some of the oil wells that were shut down. It also means that this loss of production of 800 kb/d will have to be replaced.
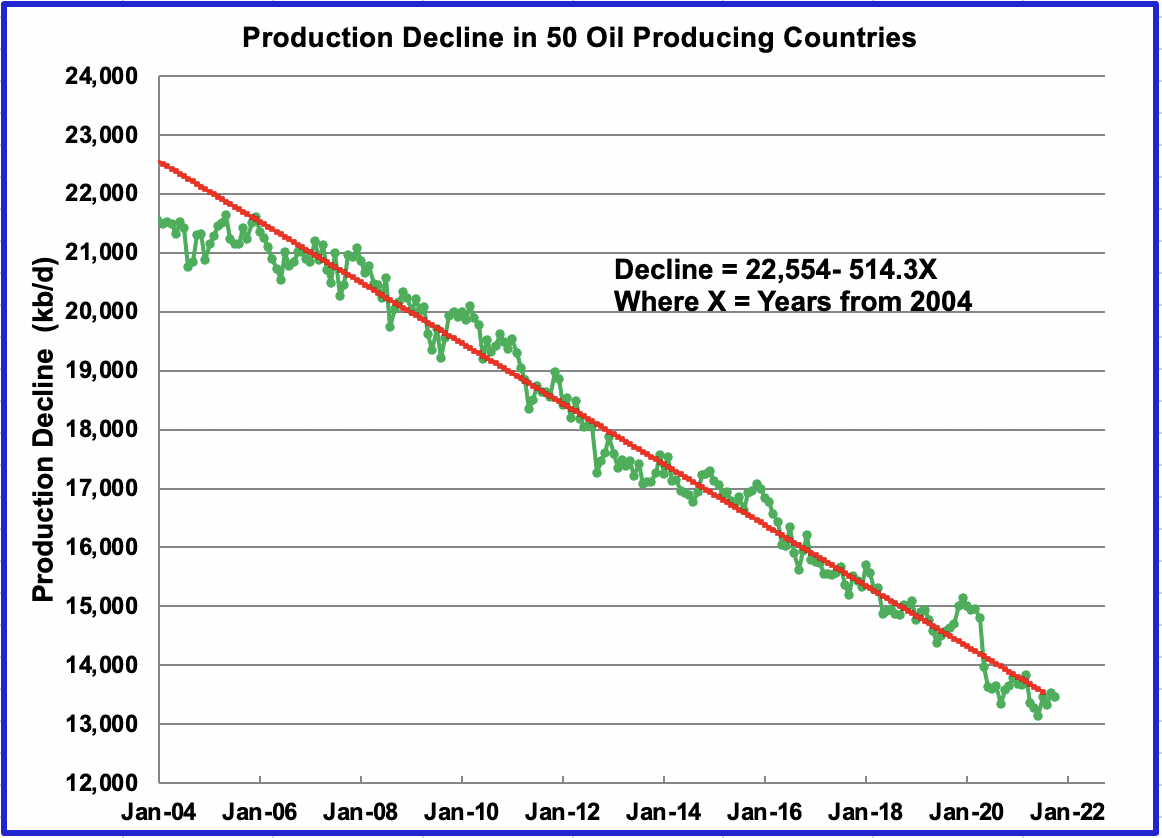
This chart was developed using a bottoms up approach. Each country’s chart was inspected and an “Eye Ball 1” decision was made to include or not include it in the list of declining countries. Many of the 50 countries included are small and are not reinvesting to increase production. Note that there is no major discontinuity associated with the March 2020 cuts, similar to the one that appears in the previous chart.
For this chart, a least squares line was generated for the data between January 2004 to October 2021. The fit indicates that the average net decline rate for these 50 countries was 514.3 kb/d/yr.
From these two charts, one might conclude the yearly decline rate is at a minimum, 515 kb/d/yr and on the upper end somewhere between 515 kb/d/yr and 665 kb/d/yr. Also there is an early indication that damage may have been done to oil wells that were shut due to covid. The damage is close to 800 kb/d and will also have to be replaced, in addition to replacing the loss from the decline that continues 24/7.
219 responses to “US Recovery Boosts October Non-OPEC Oil Production”
I find that the Administrations current statements lead me to believe that we have peak world wide on long term basis :
https://www.reuters.com/business/energy/all-options-table-oil-prices-white-house-says-2022-02-08/
Basically the Administration is suppose to be worried about cutting green house gases, yet we are asking producers to increase production and now we talking about a coordinated SPR release from world countries.
We wouldn’t panic if there isn’t sufficient oil over the next decade to run the planet.
Correct . Broken record .
World peak 2018
USA peak 2019 .
The music is playing but the party is over .
” We wouldn’t panic if there isn’t sufficient oil over the next decade to run the planet. ”
Panic now and head for the exit , avoid the rush . 🙂
Both peaks will likely be surpassed, but it will be a struggle to meet demand after the ultimate peak in 2027 or 2028.
World output has grown by 8632 kb/d over the past 16 months, an annual rate of roughly 6474 kb/d from June 2020 to October 2021. I doubt this rate continues much longer, we will see. November and December saw US, Russia and OPEC increase output at an annual rate of 5000 kb/d, but not sure if increases elsewhere offset declines in the rest of the World, we will have to wait for data.
Fortune cookie say…hear that one before….beware false prophets.
Reservegrowthrulz,
I am assuming tight oil resources are similar to the mean USGS estimates for those plays assessed and I use current costs and a $100/bo oil price assumption to arrive at the tight oil estimates using DCF to evaluate whether it is profirable to complete a well.
I suppose tight oil resources might be developed in Russia or China or OPEC could speed up development of resources, but lately not a lot is being discovered and a lot of reserve growth lately has been reserve shrinkage. Higher oil prices may change this.
Note that my model assumes oil prices may start to fall between 2035 and 2042 as the transition to elctrified transport proceeds. Certainly possible there could be some marginal growth in output at high oil prices which would push the peak to between 2027 and 2035, also an undulating plateau from 2028 to 2040 is possible, with a peak at any point between those dates. I doubt we will see much growth in World C+C output (12 month moving average) after 2030.
Of course we could also assume oil prices rise to $300/bo in 2020$, in which case there might be higher supply, but also we will transition to EVs faster and bring demand down and crash the price of oil.
If the format for conversation here wasn’t so limited, we could spend more than a little time going over the USGS methodology, limitations, and the knock on effects that then arrive in the numbers of their assessment outputs. Their scientists were quite open in discussing the good and bad involved, particularly to those on the AAPG CORE committee.
RGR, would you then say about those assessments of tight oil that the USGS DID actually “qualify” its TRR estimates and a few people, a few so called, “analysts,” and a lot of politicians !!! intentionally misrepresented those assessments to advance a certain agenda?
Asking as an AAPG member myself and as a rational human being that believes a top down estimate of future tight oil supply based on “technically” recoverable resources, and hope for higher oil prices, is beyond dumb… and lazy, pseudo science.
Reservegrowthrulz,
Just post your comment and people will respond, if you would like to do a post let me know here and I can contact you by email.
Could you point out some of the conversations by the USGS scientists that you are referring to?
It is not at all clear what you are saying.
Dennis you continue to quote the USGS. Number 1, I have a difficult time trusting any governmental institution, and specifically an a academic one that has never drilled a “child” well, or had trouble locating tubulars for a well being drilled or cannot find labor to haul off the water from a new completion. Theoretically they may be spot on but in practical terms there is no way they will be accurate.
The notion that EVs are coming and will crash the price of oil is a widely held belief by the mis-informed ordinary guy on the street. They believe that there will be “new magic energy bean” of an infinite green sustainable energy supply coming soon riding in on a white horse to save the day. Your prediction is that a uber high oil price will spurn a significant shift to EVs and will crash the price of oil. My take is a little different and I suggest a rapid move into EVs will crash our electric grid and it’s capacity long before it crashes the future price of oil.
https://www.oilystuffblog.com/single-post/technically-recoverable-does-not-mean-its-coming-out-of-the-ground
LTO Survivor,
I start with the USGS TRR estimates and then they are reduced based on an economic analysis. For North Dakota Bakken/Three Forks for example the mean Undiscovered TRR in 2013 USGS assessment was about 6 Gb and proved reserves plus cumulative production at the end of 2012 was about 4 Gb, so TRR would have been about 10 Gb.
Using that mean estimate and an assumption of about 47000 total wells completed at 300 acres per well on average. I exclude less productive areas consisting of about 13000 wells in low EUR per well areas and then apply a DCF analysis to arrive at an ERR of 7.4 Gb. This matches cumulative production plus proved reaserves at the end of 2020, which seems to confirm the analysis, it might be too conservative if there are some probable reserves or if the reserve estimate increases with rising oil prices.
Of course by 2016 to 2018 a lot more information was available to USGS geologists and geophysicists and I expect their estimates might have improved.
I also have the more recent analysis linked below based on data through mid 2021,
For a high oil price scenario with oil prices rising to $100/bo it seems 60 Gb from the Permian basin is a possibility.
https://www.researchgate.net/publication/336760524_Generalized_Extreme_Value_Statistics_Physical_Scaling_and_Forecasts_of_Gas_Production_in_the_Barnett_Shale
I think it unlikely that EVs will crash the grid, most are charged at night when grid use is low. I am talking about demand falling faster than supply in 2035, 13 years in the future. This transition does not occur overnight.
Mike,
Another great post thanks. It would be interesting to see something on all of the Delaware basin or just the entire Permian basin if that is easier. In my recent models I only assume the best areas of the Permian have wells completed (about 31.4 million of 50 million net acres identified by USGS). If we assume 300 acres per well on average (spacing about 1300 feet for 10k laterals) this would be about 103333 wells completed after June 2017 when there were about 13684 wells in Permian basin (from http://www.shaleprofile.com), so that would be a total of 117017 wells completed for a scenario with a TRR of about 50 Gb. If another 33000 wells are profitable to complete in a high oil price scenario we might see an additional 10 Gb for a total ERR of 60 Gb from about 150000 total wells completed (115700 wells completed after Dec 2021). A low oil price scenario ($75/bo maximum oil price) would reduce ERR to 50 Gb and wells competed to 117000 (82700 after 2021).
In all cases these are guesses, highly likely to be inaccurate. The well numbers are based on a 300 acre average well, longer laterals or wider spacing on average would of course reduce the number of completed wells, it would also change the EUR per well.
Average well has EUR of about 479 kb of crude output in 2020, this decreases over time as a function of completion rate.
LTO Survivor,
Read Mike Shellman’s post at the link to oilystuffblog. The title says that just because oil is down there, that doesn’t mean it’s coming out.
The second “S” in USGS stands for Survey. The Survey’s estimates are based on the geology known when the estimate is prepared. It’s saying Based on what we know about the geology, there could be x amount of oil down there that should be recoverable using currently available technology. That’s what the Survey is supposed to do. That does not involve oil price or any aspects of costs, not at all. TRR stands for Technically Recoverable Resources; note: resources not reserves.
Maybe time for a little Port, it isn’t quite 7 PM here…
LTO —
The notion that EVs are coming and will crash the price of oil
This notion is fueled by the shocking changes already happening in the vehicle industry. Manufacturers are switching to EVs with amazing speed and ditching plans for the next generation combustion engine.
But you are right, the huge number of traditional vehicles already on the road provide a comfortable buffer for the oil industry that should last a decade or so. EV production is limited by battery production, which is “only” growing at about 20% a year.
I suggest a rapid move into EVs will crash our electric grid
Probably not. For one thing, EVs use a lot less energy than combustion energy vehicles. Another point is that most cars are parked 90% of the time, and their batteries can be used to buffer the grid.
A bigger issue for is the arrival of ultra-cheap renewables, which don’t play nice with the current fleet of power plants. This year alone, the world will add more than 200 GW of solar. That’s about five times the average electricity output of France.
These panels will force power plants around the world to shut down during the day. Most of these plants were not designed to be so flexible and will perform badly. And solar panel production has doubled in the last five years, with no end in sight and prices continuing to fall. So the grid has bigger problems than EVs.
From a personal economics point of view I am hearing from folks I work with in the home building/real estate biz a strong desire to switch to EVs especially by those who drive the most. This weekend I was chatting with a realtor who was planning on turning in their Escalade for Tesla. They spend $700/month in gas and by switching to an EV their car payment will practically be covered by the switch. So the really high-end gas users of all varieties are champing at the bit to switch and in fact most of them already have orders in and are awaiting delivery. The point being that there is plenty of pent-up demand for EVs and that the first crop of actually functional ones now arriving (at least 250+ mile range) will have a profound effect on oil demand.
The second thought from a personal economic perspective is home solar. This allows you to lock in some or most of your home energy costs, assuming you have a suitable site, for the next 20-25 years. If, as many folks do, you think energy prices will be rising over the medium to long term, locking in stable prices for driving and your home for the next 15-25 years through a EV and/or PV purchase, looks like a good bet. It’s this personal economic decision making that will continue to drive huge increases in both of these technologies. I agree that both will be big headaches for grid operators for the indefinite future.
“allows you to lock in some or most of your home energy costs, assuming you have a suitable site, for the next 20-25 years. If… you think energy prices will be rising over the medium to long term, locking in stable prices for driving and your home for the next 15-25 years through a EV and/or PV purchase”
What else would be a more brilliant personal economic and personal security move?
[in a midrange solar location like Des Moines , Indianapolis, St Louis, Washington DC you can have 10 panels on the roof and get over 10,000 miles of charge/yr for a Ford Mustang EV]
Sent you an email.
That’s giving them too much credit. CPI print is coming out tomorrow and its going to show a pretty big YOY gain and much of that has to do with oil prices. They can’t see farther than that.
https://finance.yahoo.com/news/consumer-price-index-cpi-inflation-january-2022-210344769.html
https://www.argusmedia.com/en/news/2300201-opec-crude-output-800000-bd-short-of-jan-target?backToResults=true
Countries participating in the Opec+ deal raised output by 260,000 b/d to 37.94mn b/d in January, 800,000 below target for the month, according to Argus’ survey.
https://news.yahoo.com/exclusive-mexicos-pemex-sharply-cuts-100025058.html
If Mexico prospers……. and I’m cautiously optimistic in this respect……. how long will it be before they need to start cutting exports of refined oil?
Oil producing countries outside the top ten.
SloveniaMoroccoTajikistanSlovakiaIsraelGeorgiaBarbadosKyrgyzstanBulgariaBelizeLithuaniaCzech RepublicJapanBangladeshMauritaniaChileNigerGuatemalaAlbaniaAustriaCroatiaNetherlandsDR CongoSurinameSerbiaHungaryMongoliaSyriaNew ZealandBelarusUkraineTunisiaGermanyBahrainUzbekistanIvory CoastCubaPapua New GuineaPeruTurkeyTrinidad And TobagoBoliviaYemenCameroonRomaniaSudanItalyBruneiPakistanDenmark010002000300040005000600070008000900010000110001200013000Avg: 898.72
It won’t be very many years at all before some of these countries are net importers.
OFM,
Many of them probably already are.
Yes , Dennis and OFM . All are . As a sideline do all these even count in the larger picture ? . Can I include my grandsons piggy bank in my reserve for survival when I am old ? FUBAR all of them . Just not to waste cyber space ,tks Ovi . What would we do without you ? Twiddle our thumbs ? In India we have a saying roughly translated ” You sir are a gem ” .
Ovi,
Great post!
It remains possible that the 800 kb/d step change for the World minus 13 big oil producers, may be made up by this group of nations as oil prices rise, I would expect a plateau at roughly 18700 kb/d until this group returns to the trend line from Jan 2008 to Jan 2020 and then the 665 kb/d annual decline may resume probably by mid year 2022.
The question is can the 13 large oil producers increase output by 1400 kb/d to match the long term increase in World demand (Jan 1983 to Dec 2019 trend) of about 750 kb/d and make up for the decline in the rest of the World (around 650 kbpd).
When I look at the trend for your “Big 13” oil producers from Jan 2008 to Jan 2020 the annual rate of increase is about 1360 kb/d, but note that Iran was under sanctions from 2017 which reduced output and OPEC plus was also restricting output after 2018 in a bid to support oil prices. The chart below considers Jan 2010 to December 2017 for “Ovi’s big 13” and the rest of the world, the different slope for the rest of the world may be due to leaving off the rapid declin in Venezuela over the 2018 and 2019 period (from 1800 kb/d to 700 kb/d).
My guess is the 500 kb/d decline is likely more realistic and a 1250 kb/d increase for the big 13 oil producers will be reasonable up to 2027, after that supply will fall short.
Also note that I did an ordinary least squares on the Jan 2021 to October 2021 “rest of world” data and the annual rate of decrease is about 220 kb/d. Perhaps this is because the dceline in Venezuea has stabilized, I have read reports that they are actually increasing output with help from Iran and China.
https://oilprice.com/Energy/Crude-Oil/China-Is-Helping-Venezuela-Re-Establish-Itself-As-A-Major-Oil-Producer.html
Dennis , in the real world Venezuela cannot be resuscitated . China , Iran , Tom . Dick and Harry . They need USD’s and they are cut off from this . Until the sanctions are lifted it is nothing but a hell hole . I suggest you exclude it from whatsoever assumptions / calculations you make . If FUBAR is the acronym then Venezuela is it .
Hole in head,
I don’t really make any assumptions, I just crunch the numbers in this case. For the World minus Ovi’s big 13 the annual rate of decrease from Jan 2021 to October 2021 is 218 kbpd. What happens in the future is unknown, that is a given.
I agree Venezuela is highly unlikely to produce over 1000 kbpd in the future, but since June 2020 their crude output has been increasing at annual rate of about 200 kbpd.
Dennis
What has made you change your mind. Last time I read your thoughts on oil production and demand. You felt that due to electric vehicle sales increasing over the next decade, oil demand would fall quicker than production decline
Dave,
I developed the EV transition scenario a couple of years ago, folks have pointed out a number of projections that are significantly different from what I came up with. I looked a little more carefully at my model and it had a low number for maximum light duty fleet size of 1.3 billion (about the current number) most studies assume a maimum fleet size of about 2 billion with 1 to 3 % growth per year from today to when that size is achieved. I also revised my growth in sales to lower numbers, in addition I scaled back my oil supply model a bit in response to capital discipline currently seen in the tight oil sector. In my earlier models demand started to fall faster than supply between 2028 and 2035 for fast and slow EV transition scenarios respectively. For the current model it is 2035 for a high supply and fast EV transition and 2042 for a low supply and slow EV transition. To me this suggests very high oil prices from 2025 to 2035 (or 2042), but those high oil prices might lead to a faster transition to EVs which will tend to reduce demand and bring down oil prices.
Hard to figure how it will play out, maybe 2038 or 2039 will be the crossover point where demand starts falling faster than supply. The dynamics are complex because falling oil prices ( as will occur when demand falls faster than supply) will slow the rate of decrease in demand for oil and increase the rate that oil supply will fall, this could then slow or even stop the fall in oil prices if the market becomes balanced at the new lower oil price level.
Dennis
It is very difficult to predict when production will peak and exactly how much oil production will increase before it peaks. The most pessimistic predictions have already been proven wrong by several years.
It is equally difficult to predict demand growth much more than a year or so.
The U.K. intends to ban ice cars from 2030 and Europe from 2035.
This is good news for air pollution in those countries but many second hand cars are exported to South America, Africa and poorer Asian countries.
The average age of cars in those countries is between 15 and 20 years.
In the next ten years another 700 million people will be on this planet and all of them trying to get a share of the planets resources.
My guess is oil production will peak before demand peaks and prices will rocket until it destroys enough demand.
Dave,
I have revised my thinking and now tend to agree, it is difficult to guess how fast the transition to EVs will be and also difficult to guess how much of the oil resource will be developed and how quickly in a high oil price environment, the last time this occurred I was surprised by how much tight oil output grew and is the reason I focus on this. No doubt there may be future surprises in store.
Dave , don’t worry too much about Dennis . His heart is in the in the right place but his thoughts ? Hmmm . He has agreed to the EV ‘s and soon he will agree that
1. Permian story is over .
2. Russia cannot do any more
3. KSA cannot do any more .
4 . World peaked in 2018 .
He is like VLCC , difficult and slow to turn around . Be patient as this VLCC makes a U turn . 🙂
Hole in head,
I will be convinced when there is greater evidence that you are correct.
US oil demand has reached 21.9 Mb/d
I took a quick look at the EIA data set and defined declining nations as those whose most recent 12 month average was less than average annual output in 2004 and increasing nations where the reverse is true.
Of 217 nations and territories covered by the EIA from Jan 2004 to October 2021, 62 had declining output, 33 had increasing output and the other 122 nations or territories had no change in output (most of these had no C plus C output at all over this period.) In the chart below the red line and trendline is the 33 nation increasing group plus the 122 nation flat group and the blue dotted line and trendline is the 62 nation deceasing group.
Ovi used the 13 largest producers for his chart. However, the 13th of that group is Mexico. Mexico is clearly in decline. So I put them in the declining group in my chart below. That chart is the world less the world’s 12 largest producers. The combined production from these nations has been declining at the rate of 825,000 barrels per day per year for the last 7 years.
Ron
Thanks for waking me up. My big 13 actually are Big 12, no Mexico. I thought I had removed them and did but in writing the post I forgot. Post has been corrected.
If we exclude the pandemic period from Jan 2020 to October 2021 and use the 7 years from Jan 2013 to Dec 2019 we get the following for Ron’s big 12 and World minus Ron’s big12.
Dennis
To my point below, the producing countries in your chart are showing signs of plateauing starting in late 2018. I think a lot will depend on where OPEC production stands near the later half of 2022.
Ovi,
That plateau is due to OPEC quotas limiting output from KSA, Iraq, and UAE, in addition to sanctions being tightened on Iran.
Thanks for the post and the linear regressions. Now, let’s do the math. Let’s solve 28530 – 665,4X = 0,
28530 = 665,4X, X = 42,88. I must therefore conclude that for the oil producers without the big 12, the carbon neutrality will be roughly reached in 2050. In 2050, they will have complied with the agreements of Paris without problems!!!
Dennis/Ron/HIH
My intention was to generate some discussion on decline rates and it has brought out some new ways to look at it.
One of the more difficult issues is how well does the past foretell the future. Attached is the world W/O BIG 12 chart starting January 2004. As can be seen, the remaining countries plateaued between 2004 and 2010. That is why the decline chart in the post above started in 2008.
Also attached is a chart of the Big 12 W/O the US. Notice how it is showing signs of plateauing starting close to 2017. I seem to be always coming back to the same point, US production has been the major factor in avoiding peakoil. If the US yearly oil production increase stays in the 500 kb/d to 600 kb/d range, and demand returns to the 1 Mb/d range, it will fall to a few OPEC countries to keep up with the yearly demand increase. We could have an answer before 2022 is out.
We could have an answer before 2022 is out.
I believe we definitely will have the answer before 2022 is out. In fact, I think we could have the answer by mid-July. By then we will know what OPEC and Russia can really do.
Ron
We get our first clue tomorrow on SA.
Big 12 W/O US
Ovi,
The BIg 11 (excludes US) includes Iran which reduced output due to sanctions, also KSA, Iraq, and Kuwait has quotas for most of the period after 2018 which limited increases, Russia also supposedly had a quota in this period but seemed to ignore it. Your main point I agree with, much of the increase in World output since about 2011 has been due to a 7000 kb/d increase in US output. This is not likely to be repeated.
On growth in oil demand this is very much in question. The long term trend from 1982 to 2019 is an average annual growth rate of 800 kb/d, more recently from Jan 2010 to Dec 2019 the annual average growth rate was 1000 kb/d, more recently from 2015 to 2019 the average annual growth rate was 524 kb/d.
What will it be in the future? Difficult to say, it will grow quickly towards the previous trendline, but note that there are three trendlines we could choose (from an infinite set).
Looking at the three trendlines I mentioned in my comment above, it seems the 800 kb/d annual increase looks the most robust, if it varies from this I expect it will move lower towards 500 kbpd as the World uses oil more efficiently at higher oil prices.
1982-2019 is 808 kb/d annual growth
2010-2019 is 1023 kb/d annual growth
2015 to 2019 is 524 kb/d annual growth
Chart below is World C plus C output in kbpd
Dennis,
Just for fun. Please create a chart without the US LTO production. Essentially a chart for conventional oil production only. We all know the LTO production is going to fall off a cliff within the next few years. Some think shorter but others believe it may be 5 years away. I bet your chart would give you an interesting interpretation.
It is also an interesting mental exercise to think of what the price of a barrel of oil would have been over the past decade without LTO oil, and the impact of the higher prices on a global economy struggling to deal with the effects of the financial crises.
LTO Survivor,
Great idea! See chart below. The increase from 2014 to 2016 was mostly due to OPEC increasing output to take market share from tight oil. Most of the increase in World output from 2005 to 2018 was due to tight oil about 74% of the 12 month average total.
I agree US tight oil will peak fairly soon, my guess is in about 5 years, but it could be sooner, especially if completion rates in the tight oil sector remain low.
Dennis.
Very interesting chart and good idea of LTO to ask you to prepare it.
Are IEA/EIA projections for this oil up, down or flat?
Can you make the chart by also excluding Canadian oil sands?
Commentary by me. I cannot understand why any tight oil producer would want to drill up its acreage faster than it is required to at this point. The companies like PXD, EOG, etc need to be figuring out where they will be producing oil from next. as they are presently just like royalty trusts now. Their acreage is known, their future locations and production are known. The only variables are completion rate and price.
Faster completion rate drives up costs and drives down oil prices. The only reason to drill more than to offset decline would be lease requirements.
Shallow sand,
One explanation is that oil producers might foresee a time when enough EVs are on the road to reduce demand below the level of supply. If we assume a relatively slow EV transition and a medium tight oil scenario (peaks around 10.5 Mb/d in 2027) we may not see demand fall below supply at $100/bo (2020 $) before 2047. This scenario assumes the Permian completion rate rises to 600 new wells per month by 2025 and remains at that level for several years (this is about a 10% increase in completion rate per year for 5 years. An alternative scenario with lower Permian completion rate of 400 new wells per month ( and rising completion rates in other basins ) is shown below. Tight oil output peaks at about 8650 kb/d in 2027 in this scenario, and World C plus C peaks at about 83 Mb/d, just barely surpassing the 2018 peak. World demand for oil will likely be at least 88 Mb/d at $100/bo by 2026 and this scenario suggests very high oil prices, well beyond $100/bo, perhaps as high as $150/bo in 2020$ in order to destroy about 5 Mbpd of oil demand to bring the oil market into balance.
Dennis, how do you see the coming high interests referring to tight oil. In my understanding, the last fourteen years of low interest rates were the definite booster for tight oil. The actual inflation, that requires high interest rates, could be a real game changer. Do you think production will be choked due to investment restrictions, or do you believe basic investment has already been done and the damage will be limited?
Westtexasfanclub,
At current price level the wells can easily be financed from cash flow from operations so interest rates whould not have much effect directly, though a slower economy, reduced oil demand and reduced oil prices might result from higher interest rates and that would have an impact. If the FED gets it right there will be little impact, but usually they cannot pull off that trick.
Shallow sand,
Great idea!
EIA and OPEC project increased tight oil output and Canadian energy regulator under current policies scenario also projects oil sands output to increase.
Chart below an alternative title might be World conventional oil output (though a bit of Orinoco belt crude is included (data is harder to find for this, but lately it has been about 100 kb/d based on OPEC data).
Note that I believe the World will struggle to get back to 72 Mbpd for conventional output, probably 71 Mbpd will be the best that can be done. I think tight oil can get to 10 Mbpd and oil sands to about 3800 kbpd by 2027, not sure if we will see enugh of an increase elsewhere to get us to 87 Mb/d, perhaps big 5 OPEC producers, Brazil, Guyana, and Norway will add 2200 kb/d, plus make up for 2500 kb/d of decline from the rest of the World, seems a big ask.
Dennis. Thanks!
I wasn’t clear through.
What are the projections for world oil production less tight oil and tar sands by IEA and EIA?
Shallow sand,
I do not have access to IEA projections, but for the EIA the IEO gives World crude projections and the AEO gives tight oil projections, I use the Canadian Energy Futures scenario called the current policies scenario for oil sands. Note that the tight oil projection by the EIA assumes a plateau in tight oil output at 9.4 to 9.5 Mbpd from 2026 to 2050, it is not a realistic scenario. Also the scenario assumes conventional crude grows from 70 to 85 Mbpd from 2025 to 2050, this is quite far fetched. Up to about 2028 it looks fairly reasonable, after 2030 the World will see declining output as shown in my oil shock model (URR=2650 for conventional oil). The peak after 2020 for conventional oil for the shock model is about 71 Mbpd in 2025.
Dennis. Conventional growing from 70 to 85 during that time frame seems very far fetched based on what has occurred from 2005-2021.
Would sure like to see a detailed analysis of this projection, if same exists.
Shallow sand,
I agree it seems unlikely, note that it is from the EIA’s International Energy Outlook and the Annual Energy Outlook.
https://www.eia.gov/outlooks/aeo/production/sub-topic-01.php
and
https://www.eia.gov/outlooks/ieo/production/sub-topic-01.php
In each of these outlooks at the bottom of the page there is a link to model documentation, I will leave it to you to investigate.
I think in general the economists at the EIA assumes that demand creates it own supply. You have heard the joke about the physicist, engineer and economist standed on an island with cans of food and no way to open them. The economist’s solution is to assume a can opener.
I think the economists working on these outlooks have looked at GDP growth, population growth and changes in technology to estimate future demand for oil, then they have assumed crude oil supply will be available to meet that demand and at relatively low oil prices (oil price rises to about $95/b in 2020$ in 2050 and remains under $80/bo in 2020$ up to 2035).
These scenarios are even more far fetched than mine.
Shallow sand,
I took a very quick look at the model documentation and noticed a lot of the cost estimates are based on older data (2000-2008 is my recollection), seems the model may be out of date. There is also data for the hyperbolic well profiles they use for various counties and formations in tight oil basins, though based on basinwide data these profiles change year to year so I would think a singe well profile covering all years might lead to wonky results. It looks like they use an Arps hyperbolic and assume terminal decline at 10% per year, I do a similar analysis but assume 12.5% per year terminal decline with wells shut in at 20 bopd.
Similar chart to one above for Jan 2015 to Dec 2019, over this period World C plus C output only grew at an average annual rate of about 524 kb/d. This growth rate is significantly less than the long term trend of about 800 kb/d (1983 to 2019).
Dennis
This shorter time span is more realistic.
Ovi,
I wonder if excess stocks and low oil prices may have supressed the rate of growth over this period in total World C plus C output, or pehaps demand was just lower a shift from 1000 kb/d growth in the 2010 to 2014 period to 524 kb/d in the next 5 years is a pretty big change, though it does seem to coincide with a significant drop in oil prices starting in Sept 2014. It is not clear that the World will be able to grow at 1000 kb/d after a return to 82 to 83 Mb/d of C plus C output. OPEC plus will be at capacity soon (within 6 months or less) and it will be up to US, Canada, Brazil, and Norway to meet the increase in demand, 500 kb/d can be done for a few years, I doubt 1000 kb/d is possible (it would require 1650 kb/d annual increases from those nations if the big OPEC producers and Russia can remain on plateau.)
This is why I have been harping on tight supply and higher oil prices being very likely especially up to 2030 and perhaps to 2035.
Dennis
Two factors affected investment In oil development and production. Low prices in late 2010 and the ESG movement. The ESG movement is going to have to face: “Beware of what you wish for”. I’m not saying their objectives were wrong. They needed to better understand how the world economy depends on oil and help plan the transition.
I agree once we get back to 82 Mb/d, production increases beyond there will be difficult. Canada could produce from 100 kb/d/yr to 150 kb/d/yr. I think Brazil is in trouble because of reduced investments by the majors. Not sure how much more Norway could add because they have a decline rate close to 8%. The US Is the only temporary hope.
Let’s see what we learn from the OPEC report tomorrow.
Norway might add a bit when Johan Sverdrup phase II comes on later this year. I think Brazil will certainly grow eventually, even though exploration and leasing has been disappointing – it still has five or six big FPSOs in development (their timing has been spread out more now compared to original plans so the rapid decline from the existing deep water wells means there will be a lower new peak). Guyana has one (or is it two now) FPSOs operating and probably four to come so will reach over a million barrels per day production some time this decade. The may be some more from Uganda and elsewhere in East Africa but progressing developments there seems particularly difficult, whether because of geology or politics I don’t now.
Typically when there is a big chunk taken out of production like with Covid production comes back a bit stronger (i.e. production might be higher now than it would have been had a natural decline from 2018 been followed, and decline from a new peak would then be a bit faster) but the effects are quite minor in the grand scheme of things.
I don’t see any evidence that ESG is having much effect other than as PR. There was all that hoo-ha about ExxonMobil’s board but it has approved more new projects (in Ghana and Permian for example) than any IOC. In UK much was made of Shell pulling out of Cambo, but it is a risky project with a horrible reservoir and no upside (and still hasn’t been cancelled, just looking for different investors). No oil is being left in the ground because of ESG – it just isn’t there any more. For the last twelve to fifteen years discoveries have been steadily, and quite rapidly, declining despite three price peaks. High-risk high-cost frontier exploration is disappearing because they are running out of places to look with a reasonable chance of finds big enough to justify stand alone developments (despite the USGS trotting out useless “technically recoverable” estimates – a more meaningless term I doubt has been invented).
LTO companies are making money only because they have strict capital controls. The location of the oil has been well known for years, there are no wild cats being drilled because there’s nowhere to look. All the basins, despite being “unconventional” are showing standard logistic shaped production curves, the only difference with early conventional fields is that while they largely underestimated expected recovery the LTO companies did the exact opposite (I wonder if investors would have been prepared to lose so much money so fast had they not).
“… (despite the USGS trotting out useless “technically recoverable” estimates – a more meaningless term I doubt has been invented).”
Thank you. This term, “technically recoverable (resource) estimates,” presented in the unqualified manner that it was by the USGS, has done more to alter domestic energy policy in the US, done more to create the allusion of oil abundance, to dissuade conservation and prevention of resource waste, to make already stupid politicians stupider and allow 3.2MM BOPD of tight oil exports to foreign countries, including Russia and China, flaring and unregulated produced water disposal and corresponding seismicity events, than any reserve category, or reserve “term” in history. When US tight oil basins are dried up like old raisins in a few years, folks will finally get that.
“technically recoverable” estimates – a more meaningless term I doubt has been invented.
Totally agree. Once, when as a young engineer, I mentioned the phrase ‘technically recoverable reserves’ and my wise boss said: “Gold in sea water is technically recoverable and it will remain in that category long after you, your kids and grandchildren are dead. Permanently erase that utterly useless term from your vocabulary and we’ll get along just fine son.”
Gentleman,
As long as we only use TRR as a starting point and then apply a realistic set of economic assumtions to determine the proportion of resources that can be profitably produced it is a useful starting point for analysis. For the North Dakota Bakken/Three Forks when I do that for the USGS mean undiscovered TRR at the end of 2012 (from 2013 assessment), the ERR matches the cumulative priduction plus prived reserves at the end of 2020. So if used properly, knowledge of the TRR is a useful starting point for analysis.
This was my Brazil projection from a couple of years aro the shows a shallow decline (possibly a bit steeper now) until new developments catch up to decline in 2024/2025.
Ovi and Dennis , thanks for all the new charts . Decline is sure an issue but we must also look at quality and grades . If 4.5 mbpd is WCS (Extra heavy) and 5.5 mbpd is shale (Extra light ) = 10mbpd then 15 % of the total world’s production is in an area that needs a lot of exergy or other inputs ( light oil such as Libya or Nigeria ??) to enable a refine able blend . Something like a cocktail . We need all ingredients . Just saying we have 4.5 mbpd of WCS is not going to cut . The world has started believing its own lies and therein is the problem . Mike S has pointed that in his post . Americans still believe in ” energy independence ” and ” Saudi USA ” ( LTO ) . 21.5 mbpd consumption ?? Mexico will not export and who is next ? ELM is to watch .
I am surprised Mexico is still able to produce over 1.5 Mbpd. I wonder when their KMZ field, which is currently by far their most productive field (about half of Mexican oil), will start the same massive decline that the Cantarell field had. Nitrogen injection has been done for years now.
CNH is a good site for data but it changes format every few months so I haven’t found where the increase is from yet(deep water?) but it’s not KMZ.
There are no deep water producing fields yet. Mexico production has been maintained by a series of fairly small shallow water fields, which may be coming to an end as additions are reaching an assymptote and will then likely start declining – by which time some deep water projects might be getting going..
https://www.bloomberg.com/news/articles/2022-02-08/u-s-raises-forecasts-for-record-crude-oil-production-in-2023?sref=hEO85HQm
EIA raises O/G forecast to record high
U.S. oil production will grow even more than the government previously expected as a scorching price rally drives producers to boost drilling.
Oil output will average 12.6 million barrels a day in 2023, an increase from its previous estimate of 12.41 million, according to Energy Information Administration data. The current annual all-time high of 12.3 million barrels a day was set in 2019. This year’s production forecast was also revised higher to 11.97 million barrels a day from an earlier projection of 11.8 million, the EIA said in its monthly Short-Term Energy Outlook report.
So there you have – plenty of that stuff to go around!
Rgds
WP
Where do you want to drill in USA? The oil men of shale oil are leaving the Tier 1 areas to drill and extract oil in tier 2 and tier 3 areas where there are less oil to extract, the tear 1 areas being apparently saturated with laterals and drained.
For Your Enjoyment
Francisco Blanch (Bank of America) Bull vs Ed Morrse Citi bank. (Bear)
http://www.bnnbloomberg.ca/video/oil-could-crack-us-100-but-not-for-very-long-citi-research-s-ed-morse~2378706
http://www.bnnbloomberg.ca/video/oil-could-crack-us-100-but-not-for-very-long-citi-research-s-ed-morse~2378706
Here is a litany of economic issues mostly created by rising energy prices with a bit from climate and other reource shortages.
https://climateandeconomy.com/2022/02/10/10th-feb-2022-todays-round-up-of-economic-news/
In previous oil spikes I don’t remember natural gas having so many issues even though many Asia contracs are tied to oil price. Two LNG plants (Snohvit and Prelude) are of line, but the mai problems have been decline and depletion in legacy gas fields and increasing demand from new markets (much more so than happens with oil). God knows what’s going to happen when the US realses that it doesn’t have quite as much tight gas as it originally thought.
With a global economic crash becoming more and more of a probability it would take a brave CEO to invest in risky oil projects at the moment, especialy multi-billion multi year ones that cost a lot to stop onve they get going or any high risk exploration drilling where discoveries would likely just sit on the shelf and the initial capital outlay would not be recouped. And the longer things are delayed the more labour resources will be lost, the rare some material resources will become and the more major oil hubs get decommissioned making small tie-backs, that would rely on them, would become stranded.
Now the US 10 year bond has surpassed the 2% yield.
Junk level company lending is getting more expensive according – so is drilling on credit, and growing on credit for the oil supply companies – especially the bad paid ones.
The rate hike begins to cast it’s shadows.
I do wonder how much a hawkish Fed and global CBs in general will impact on investment with these rapid (and futile) rate hikes.
OPEC falls on its face:
https://oilprice.com/Energy/Energy-General/OPEC-Gets-Further-Behind-Oil-Production-Quotas.html
“OPEC raised its crude oil production by a meagre 64,000 barrels per day in January 2022.”
On ESG and oil capital expenditure
A range of opinions from commenters on this site-
Ovi- “Two factors affected investment In oil development and production. Low prices in late 2010 and the ESG movement.”
LTO survivor has repeatedly referred to ESG a scam [a dishonest scheme; a fraud]
George K- “I don’t see any evidence that ESG is having much effect other than as PR [public relations]… No oil is being left in the ground because of ESG – it just isn’t there any more… High-risk high-cost frontier exploration is disappearing because they are running out of places to look with a reasonable chance of finds big enough to justify stand alone development… LTO companies are making money only because they have strict capital controls.”
George has hit the nail on the head. ESG is an aspiration and a corporate ‘good citizen’ campaign.
ESG “investing assets currently total $17.1 trillion, according to the US SIF Foundation’s 2020 biennial “Report on US Sustainable and Impact Investing Trends”, released on November 16. This represents 33%, or one in three dollars, of the $51.4 trillion in total U.S. assets under professional management.”
Digest that- there is over $34 Trillion dollars of US capital with no ESG restriction or mandate looking for a good investment. And other countries have capital to invest as well, as do companies.
The attempt to lay blame on ESG concerns for lack of capital is just a mistaken or false politically motivated narrative.
Geology, economics, and the nature of risk is the reality of the situation.
You are right about the dismal prospects out there but also commercial banks have redlined the entire industry and have exited the business. One of my friends who leads an Energy banking group has told me that it is virtually impossible to provide credit for any “new deal” no matter how good due to the new ESG policy of the banks. He told me that they turned down financing a proved developed producing deal that would pay back the bank in one year with a well established operator who has a sterling reputation.
So Hickory while I agree with you regarding the dismal prospects, the ESG mandate has also taken a lot of “expansion” capital out of the business. There are a multitude of factors working together to create this shortfall in oil and will perpetuate an advancement towards energy poverty.
LTO survivor,
Seems this would create an opportunity for private capital and hedge funds in the energy space, there are a lot of investors that are mostly concerned with ROI.
If one bank, or a dozen banks, pass up on a ‘solid’ investment opportunity
then in just the USA alone there is over $34 Trillion in assets under professional management that
can step in to take advantage of the situation.
They key being solid.
I will be the first to say that abandoning fossil fuel before there is some roughly equal replacement is a naive gesture.
And just as naive is the failure to pursue an all-out electrification energy policy starting in the 1990s. And still we have barely begun.
Depletion will play out regardless of whether there is a climate catastrophe brewing.
We have overgrown our harvest potential.
I won’t deny that the corporate Environmental/Social/GoodGovernance trend will affect the behavior of a significant portion of world companies, and I am thankful for that. Human rights (and environmental protection) progress in behavior of industry is hard to come by. Just ask those who fought in the civil war to end slavery. Some people called that a scam too. [No, I am not equating fossil fuel to slavery].
Nonetheless, there is no shortage of funds for solid energy projects. Bangladesh will be commissioning a nuclear plant in a few years.
btw- i completely agree with the statement made by LTO survivor upthread
“The notion that EVs are coming and will crash the price of oil is a widely held belief by the mis-informed ordinary guy on the street. ”
I don’t know if many people believe that oil price will crash from low demand. If demand declines much, it will be in a long time from now, and will be very gradual- not a crash.
Ouch – also this:
https://www.cnbc.com/amp/2022/02/10/january-2022-cpi-inflation-rises-7point5percent-over-the-past-year-even-more-than-expected.html
“ Inflation surges 7.5% on an annual basis, even more than expected and highest since 1982”
I’ve been intrigued by the debate as to whether peak oil would cause severe inflation or deflation. It looks like that argument is starting to get settled.
Stephen Hren,
There are many supply chain issues suggesting many items are in short supply. This tends to result in higher prices in general, It is not clear why anyone is surprised. Market economies work perfectly only in introductory economics textbooks. So far a better solution has not been devised.
Dennis, the supply chain excuse is a bit pat, don’t you think? Broad-based inflation is occurring across the board in services, raw materials and finished goods. The world benefited from just-in-time inventory for a long time and that system seems to be coming apart at the seams. Labor now has expectations for higher wages and the leverage to ask for it (thankfully). But this all means an unstoppable cycle may be forming.
For a fuller discussion of the inflation scene I will defer to Mr Richter’s website:
https://wolfstreet.com/2022/02/10/whoosh-goes-the-dollars-purchasing-power-in-january-as-inflation-now-infests-services/
I’ve been buying the same dog food from a local mom and pop store for the last twelve years. Over that time it’s gone from about $35 for a 30lb bag to $45 the last time I went in a month ago. Yesterday it was $59. I definitely had the thought: I should buy six bags right now, although I didn’t act on it.
Stephen,
The explanation seems very sound to me. YMMV. Fewer people in the work force due to covid will effect the service industry. These are unusual times.
Opec are just a bit below where they were before the Covid correction. They’d been declining for a few months before that (except for the blip up immediately before the the quotas were set), and drilling activity is still down about 40%. I’d say there’s much more chance that they resume decline than that they can trying to increase quotas. It’ll be interesting to see how long they keep up a pretence or how long there’s continued discussion that they have any real spare capacity at all (I don’t count capacty that is there for maintenance or to allow fields to rest or that can be bought on line by temporarily neglecting to maintain reservoir mass balance).
This is an interesting one George.
TotalEnergies abandons deepwater Gulf of Mexico project to pursue better ones
https://www.offshore-energy.biz/totalenergies-abandons-deepwater-gulf-of-mexico-project-to-pursue-better-ones/
North Platte has always given the impression that it was more marginal than some of the other potential stand alone developments in GoM. SouLaGeo probably knows much more but I,d guess it is a very difficult reservoir and would require too many wells. Cobalt gave up on it before (I think something that got rid of early on to try to avoid bankruptcy). I wonder what Equinor will do – a few previous potentially stand alone hubs have been downgraded to smaller tie-backs if there are convenient production facilities around (like Buckskin, Leon) but where this is might mean they have to wai a bit before sufficient capacity becomes available (that is just speculation).
Total has had more problems than most after having to pull out of Myanmar and disappointing reserve write downs at West of Shetland gas fields (I haven’t heard the latest on Glendronach but it sounded like what had been cited as the biggest. UK gas discovery for years ended up a complete no-go). I don’t know if Mozambique LNG will ever progress what with insurrection, other politics and climate change impacts in the area. You’d have thought it must eventually given the growing global demand for gas but who knows; it might just prove impossible to opeate a complex plant like that in that environment.
As further evidence of some of the worsening problems with finding new discoveries that are worth developing (and also involving Equinor partly) these are all the future North Sea exploration wells that Wood-Mac had listed last year. The one with the largest potential target has yet to be drilled but six of the next eight in the Norwegian sector have all come up dry or non-commercial (the other two I think are also not yet drilled)..
OPEC Gets Further Behind Oil Production Quotas
OPEC raised its crude oil production by just 64,000 barrels per day (bpd) in January 2022, well below the 254,000-bpd increase in output allowed under the OPEC deal, as OPEC and its allies in the OPEC group continue to undershoot quotas and supply fewer barrels to the market than promised.
If you don’t stick to your quotas, what’s the point of even having them? And by extension, what’s the point of OPEC today?
To be a scapegoat for Biden? I guess we’ll finally see what happens when we’ve moved past the SPR releases planned and found they don’t change much of anything on the ground.
Hole in Head-
Your perpetual prediction for the terminal collapse of India and its energy demand does yet seem ready to come true yet-
“India’s Crude Demand Is Rising Despite High Oil Prices- Average refinery run rates at Indian refineries were 101 percent in January, compared to 87 percent in August last year. Most of India’s 23 refineries operated at above nameplate capacity in January. Indian refiners are scouring the spot market for cargoes in early 2022. Despite $90 oil prices, state refiners at the world’s third-largest oil importer, India, are scouring the market for spot supply…”
Keep hoping, maybe someday you will be right.
Hickory , India imports 4.2 mbpd of crude and then exports 1.3 mbpd of refined products . It is the fifth largest exporter of refined products since it has excess refining capacity just like USA . Further the increases are on a low base of 2020 when Corona was in action . Anyway collapse does not have to be an oil collapse . As I write I can see the collapse in 50% youth unemployment and slide into absolute poverty of the lower class . Understand the fact that 800 million survive on 5Kg of wheat/rice provided free by the govt . If this is not collapse then what is I wonder .
https://www.spglobal.com/platts/en/market-insights/latest-news/oil/122721-indias-10-month-high-in-crude-imports-signals-robust-demand-outlook
https://www.ndtv.com/world-news/over-16-crore-more-people-forced-into-poverty-in-2-years-of-pandemic-oxfam-2712904
16 crore is 160 million into poverty which means earning less than $ 2 per day .
https://www.epw.in/tags/youth-unemployment-india
I am right though early . Read 68.9% youth unemployment .
Interesting article about Alberta’s conventional oil situation.
https://economicsfromthetopdown.com/2022/02/10/a-case-study-of-fossil-fuel-depletion/
Great article – should be read by everyone who thinks there’s going to be much oil available, even from oil sands, in 25 to 30 years (and especially for export), and looks like a site worth exploring.
George
The article’s info does not apply to the oil sands. I am sure that you are fully aware that oil sands are a different beast.
The main actors in the oil sands are CNQ, SU, IMO (Owned by XOM) and CVE. These are all big players and do restore the land they disturb.
I recall about 10 years back seeing where an open pit mine was restored and grass was growing and deer were wandering around. Once the oil is removed from the sand, the sand was dumped back into the open pit.
The open pit mines use less NG than the SAGD operation. Initially hot water, heated by NG, was used to separate the oil from the sand. Now it’s a combination of solvents and warm water. I think XOM developed the process but I am not familiar with the chemistry. Cannot quote a current number. The original number was 1000 ft^3 NG to get one barrel of syncrude sweet crude/blend.
The SAGD operators use NG primarily to separate the oil from the sand in the underground well. They now also use solvents.
https://www.vistaprojects.com/blog/solvent-technology-promises-oil-sands-benefits/
With oil at $90/b, the oil sands are very cost effective. Similar to the LTO operators, they continue to make progress in reducing their carbon footprint and per barrel cost.
Their biggest issue is government policy. The current Cdn government is in the process of developing a net zero carbon policy. The oil sands are a major obstacle.
The greatest beneficiaries of Cdn oil are the US refiners. Currently only 1.3 Mb/d of the bitumen are upgraded to sweet crude and the price is close to WTI. The rest is mixed with lighter grades of conventional and syncrude sweet to Western Canada Select and sells for $14/b discount to WTI. Late last year the discount was $20/b. The recent opening of Line 3 and Capline has given these WCS producers access to Louisiana refineries and that has reduced the discount.
I think a reasonable estimate for the lifetime of the oil sands is 50 years. Others say more. It wiil all depend on the conflict between politics, CC policy and US/World demand for oil. The current Prime Minister once misspoke and said the oil sands must be shut down. Howls and a quick reaction ensued. The current Minister of Environment is now tasked with getting the oil sands to net zero.
The world’s appetite for oil and its ability to provide it may have some say in that policy in a few years.
The oil sands use about a third of all the natural gas consumed in Canada. Increasing production will inevitably increase that fraction. So in essence, oil sands production is limited by the available natural gas and the efficiency of the extraction process. And there’s always a limit to efficiency. There has been talk of using nuclear reactors to create steam/hot water for the extraction/upgrading processes but so far this has come to nothing.
And speaking of low hanging fruit. most future oil sand extraction will be done using SAGD because open pit mining is currently only practical down to a depth of around 100 meters, and most of the oil is deeper than this.
Yes that was my point. Natural gas is also needed for hydrotreaters and light petroleum components are needed as the dilluent in dilbit. Also as the gas and other oil goes Canada will be retaining more of the oil sands production for itself.
George
I am not not sure that they need NG for the hydrotreaters. The cokers reduce the bitumen volume by about 20% and in the process release a lot of hydrogen which is recovered and then used to upgrade the remainder to a synthetic sweet. Not sure if there is enough released to upgrade the remainder or if they need more from NG.
I don’t think any NG is used directly to make WCS.
https://www.oilsandsmagazine.com/technical/western-canadian-select-wcs
The problem gentlemen is we are past peak oil , peak gas and peak coal = past peak energy . Even more important is past ” nett” peak energy . We are up the creek without a paddle .
Hole in head,
We will see what BP stats has for 2021 in June, so far 2019 was peak fossil fuels and energy, we dont have 2021 data yet for World.
You can continue to make the claim, but by 2022 at the latest it will no longer be true.
Ovi – I’ve had only limited experience on cokers/crackers and never directly on flexicoke, though I’ve seen flow schematics for it – none showing a hydrogen stream. I’ve never seen a cracker/coker that produces hydrogen and can’t imagine why one would be designed to do so – it would only be possible by destroying some of the liquid product – or how (some kind of partial oxidation?). Cokers/crackers produce a low calorie fuel gas that is a mixture of gases that may contain hydrogen but it wouldn’t be worth separating it out. But I was really referring to hydro-treaters used on the bottoms of frac towers (which are ultimately fed from the cokers and some of which are currently as far away as the US, I don’t think any excess hydrogen is piped down there). I also thought (mistakenly maybe) that some bitumen bypasses dedicated cokers and is treated directly in refineries.
H in H wrote:
“Even more important is past ” nett” peak energy .“
Dennis,
The 2021 data for the world (or whatever other data) don’t take ERO(E)I into account because it is not measurable as pointed out in one of the previous threads.
Written earlier in this thread by H in H:
“Decline is sure an issue but we must also look at quality and grades ……..”
– It takes (much) more energy to extract the remaining resources
– The quality (energy-content ?) is often lower and the contamination higher.
The conclusion must be that the world is most probably past nett FF energy Peak, at least for crude oil. Sleepwalking into an energy-crisis that is
George,
It would seem that there is plenty of condensate available from US to use as dilbit input, at least through 2030, but it may drop quickly after 2030.
Han,
We do not have good data on net energy, so any comments about that are speculative. Net energy is only important when looking at total energy used by the World, looking a a single fuel tells us very little in my opinion.
We do have data on fossil fuel and non fossil fuel energy consumption so I focus on things we can measure, otherwise we can only speculate.
Very well said and pertains to the conventional oil production worldwide-
“The trends in Alberta [peak production oil and gas 1998] are a microcosm of the trends everywhere. For the last century, humanity has thrown a party built on abundant crude oil. It’s now past midnight, and the festivities grow closer to last call.”
Fig 10 bears close inspection.
“In the end, the most certain thing we can say about the future is that it will involve less energy from fossil fuels. The rest of the story has yet to be written.”
Contamination of fuel resurfaces . Earlier it was Sulphur in Venezuelan crude . Now Belgian gasoline returned by Nigeria . Last year was Russian crude contaminated by Vanadium .
https://allafrica.com/stories/202202130009.html
Nate Hagens and Art Berman in conversation . Thoughtful .
https://www.youtube.com/watch?v=pVkGc7dpduY&t=86s&ab_channel=NateHagens
Thanks H-in-H, two of my favorite dudes. I like Art’s Twitter feed.
My fav quote from petroleum geologist Art Berman at the 36:35 mark of this interview, linked here:
https://youtu.be/zkzQRiiN1Jw?t=2195
“I think we’re kinda done lol” ~ AB
IEA: Oil Market Report – February 2022
Global oil supply rose by 560 kb/d to 98.7 mb/d in January, but the uptrend was slowed by a chronic OPEC under-performance versus targets that has taken 300 mb of oil off the market since the start of 2021. If OPEC cuts are fully unwound, world oil output could rise by 6.3 mb/d in 2022. That would erode effective spare capacity, which could fall from 5.1 mb/d to 2.5 mb/d by year-end. A further 1.3 mb/d of Iranian crude supply could gradually be brought to market should sanctions be lifted.
A reassessment of historical data has resulted in a significant upgrade to our demand estimates. While the revisions lift baseline demand – primarily for Saudi Arabia (in LPG use) and China (in the petrochemical sector) – by nearly 800 kb/d, growth rates are largely unchanged. World oil demand is set to expand by 3.2 mb/d this year, to reach 100.6 mb/d, as restrictions to contain the spread of Covid ease.
Chronic underperformance by OPEC in meeting its output targets and rising geopolitical tensions have propelled oil prices higher. Benchmark crude prices rose by more than 15% in January to cross the $90/bbl threshold for the first time in more than seven years. Global oil stocks at multi-year lows and dwindling OPEC spare capacity have left the market with only a small cushion.
In January, producers outside the OPEC alliance were the ones driving world oil supply higher. Further increases are expected in the coming months as new projects start up and US shale continues to respond to higher prices. That has led us to raise our forecast for US oil supply growth for 2022 to 1.2 mb/d. Canada, Brazil and Guyana could add an additional 460 kb/d between them. By contrast, the gap between OPEC output and its target levels swelled to 900 kb/d in January. The bloc’s prolonged underperformance has effectively taken 300 mb, or 800 kb/d, off the market since the start of 2021.
That shortfall is expected to deepen as some OPEC members struggle with production constraints, exacerbating market tightness. OECD industry oil inventories plunged by a hefty 60 mb in December, to stand 255 mb below the five-year average and at their lowest level in seven years. Over the past 12 months, industry stocks have declined by 355 mb despite the release of more than 50 mb of oil from government reserves over the same period.
Meanwhile, our continued examination of historical demand data has gone a long way to closing the gap between observed and implied inventory changes apparent for some time in this Report. More complete information now available and new methodologies for capturing data continue to shed light on areas not well covered in official statistics. While the data revisions lift demand for Saudi Arabia (in LPG consumption) and China (in the petrochemical sector), overall growth rates are barely changed. World oil demand is set to rise by 3.2 mb/d in 2022 as restrictions to limit the spread of Covid ease, releasing pent-up demand.
Despite higher demand and the recurring failure of OPEC to meet its targets, the market is still set to shift to surplus in 2022. Non-OPEC producers could add 2 mb/d of supply, and if OPEC cuts are fully unwound, the bloc could increase output by 4.3 mb/d. Of course, that would come at the expense of effective spare capacity, which could fall to 2.5 mb/d by the end of the year and end up held almost entirely by Saudi Arabia and, to a lesser extent, the UAE. Iran, if released from sanctions, could add another 1.3 mb/d.
If the persistent gap between OPEC output and its target levels continues, supply tensions will rise, increasing the likelihood of more volatility and upward pressure on prices. But these risks, which have broad economic implications, could be reduced if producers in the Middle East with spare capacity were to compensate for those running out.
Only the summary is available.
https://www.iea.org/reports/oil-market-report-february-2022?mode=overview
WTI just jumped to $94.
Don’t know why
Yes, what is going on with WTI, currently up by $4?
My question also—
Not that I’m complaining
It looks like Putin has decided to invade Ukraine according to this source.
https://finance.yahoo.com/video/russia-reportedly-makes-decision-ukraine-185449983.html
Is he actually going to do it though?
Frugal , one word ” crap ” . No way and he has indicated this . Ukraine is ” 404 ” . MIC is in full speed and Eisenhower had warned about this just as Hubbert did with peak oil . Hey but how many read POB ?
Ovi , there is thing ( not thong 😉 ) called peak oil . No need to educate you . As Ron said ” the world is awakening very , very , very slowly ” .
Oil soars over 3% to new 7-yr highs on Ukraine jitters, tight supplies
Feb 11 (Reuters) – Oil prices rose over 3% on Friday to fresh seven-year highs on escalating tensions over Ukraine, and after the International Energy Agency (IEA) said oil markets were tight.
SNIP
Both benchmarks touched their highest since late 2014, surpassing the record highs hit on Monday, and were on track for their eighth weekly gains on growing concerns about global supplies as demand recovers from the coronavirus pandemic.
The IEA raised its 2022 demand forecast and expects global demand to expand by 3.2 million barrels per day (bpd) this year, reaching an all-time record 100.6 million bpd.
The energy watchdog also said in its monthly report that Saudi Arabia and the United Arab Emirates could help to calm volatile oil markets if they pumped more crude, adding that the OPEC+ alliance produced 900,000 barrels per day (bpd) below target in January.
Does the IEA really believe that Saudi and UAE have spare capacity or are they just saying this to calm the markets?
I have no idea but if I had to bet, I would bet that they really believe it. And I think the EIA believes the crap they publish. They really believe the reserves bullshit OPEC publishes. And they believe all that spare capacity nonsense also.
Chart with US and Permian Horizontal Oil Rig (HOR) count from Baker Hughes (I used pivot table to get this data)
https://rigcount.bakerhughes.com/na-rig-count
Permian HOR count up 7 from 277 to 284
US HOR count up 17 from 449 to 466.
These levels were last surpassed in week ending April 9, 2020.
At a horizontal rig count of 284 and a rig efficiency of 1.3 wells per rig per month about 369 wells could be drilled in a month.
For the past 6 months Permian horizontal oil rigs have been ncreasing at an averae rate of 9 per month ad US horizontal oil rigs have been increasing at an average rate of 16.5 rigs per month. If the rate of increase of past 6 months continues for another 3 months, then there will be enough rigs to drill 400 new wells per month, which has been the completion rate of late.
If that point is reached and completion rate remains stable then DUC count stabilizes or increases if rig count continues to increase.
This guy does a fine job: Oil Production by Country
https://www.youtube.com/watch?v=B12rzkP3VCk&t=442s
A new Global Report on EVs
Willingness to pay for advanced tech remains limited
A majority of consumers are unwilling to pay more for advanced technologies in most global markets as they have been trained to expect new vehicle features as a cost of doing business for brands looking to differentiate themselves from their competitors.
Interest in EVs driven by lower running costs and better experience
Consumer interest in electrified vehicles (EVs) centers on the perception of lower fuel costs, environmental consciousness, and a better driving experience. However, driving range and lack of available charging infrastructure remain barriers to adoption.
In-person purchase experience still preferred by many
Most consumers would still prefer to purchase a vehicle at an authorized dealership. However, a perception of increased convenience and ease of use will likely support continued growth of virtual purchase processes.
Personal vehicles continue as the preferred mode of transportation
Shared mobility services like ride-hailing and car sharing have been slow to return to their prepandemic pace of growth as people prefer using personal vehicles to satisfy their transportation requirements.
https://www2.deloitte.com/content/dam/Deloitte/global/Documents/Consumer-Business/us-2022-global-automotive-consumer-study-global-focus-final.pdf
Upstream it was stated that a shift to EV would crash the electric grid.
I don’t think that concern should be discounted.
In fact, if there was a complete or rapid shift to all EV without a serious upgrade to the nations grid infrastructure and electrical generating capacity I think it would be an expected outcome- in places and at times.
Grid infrastructure upgrades are underway, but pretty much in a haphazard and way and very slow pace. There is some increased effort at coordination with the new administration, but this kind of effort should have been a national priority over the past 30 years, rather than the poorly conceived wars, video gaming and sports aggrandizement.
It takes a long time to get these kind of things done, just as the building of a nuclear plant or refinery does.
To embark on such a big series of energy projects when the supply situation of the biggest fuel source is at peak is a severe example of being asleep at the wheel, or just blind to events beyond 2 feet ahead.
People who have raised these concerns have been brushed off by large segments of the culture (largely because they were perceived as threatening the profit potential of the fossil fuel industry), but should have been taken seriously all along. Not just now when a crises is verging.
How long does it take to build up nuclear industry?-
““EDF Flags Lasting Power Crunch as Atomic Woes Extend to 2023… Utility already said output this year would be at 30-year low…[in France]
“French reactors are the backbone of the European power system, but the fleet is becoming more unreliable. The shortfall in domestic generation has forced the nation to import electricity at times, tightening supplies in neighboring countries…”
And-
“Europe’s Dependence On Natural Gas Imports Hits 80%.
The European Union and the UK have seen their dependence on natural gas imports jump to 80 percent in 2020 from 65 percent in 2010, as regional production plunged”
And-
“Popular anger simmers in Turkey over ballooning electricity bills…
A wave of protests has spread across Turkey over whopping electricity price hikes last month as millions struggle to pay the ballooning bills and many businesses face the threat of going broke amid already galloping inflation.”
Coming soon to your country, likely.
According to tradeingeconomics.com, and after converting yen to dollars and tons to pounds. Lithium carbonate in December 2020 was $.50/lb, now the price is near $28.00/lb. I think it would be safe to say that for now, cheaper batteries are off the table. Electric cars have been chosen by government and are given billions of dollars to survive. And just wondering how far could a person successfully driven to work this morning in Minnesota, in their Tesla, when this morning temps were -25 to -35 degrees.
CATL is ramping up sodium ion batteries – more reasons for this to ise tech that is not mineral constraint.
Eulenspiegel
Sodium sulphuric batteries operate at very high internal temperatures, possibly over 250 C, I don’t remember.
A manufacturer in the mid 1980s brought a vehicle equipped with a NaS battery to my lab to test it on a dynamometer. They were taking a lot of measurements as it ran on the Dyno. On the third or fourth run it shorted out and died. The manufacturer gave up trying to improve it because in the end they did not like the the high temperature.
Maybe the current ones run at lower temperatures. As I recall they claimed the performance was very good but in the end the internal temperature was of concern. What happens in an accident if the case is broken. What is the ramp up time before drive-off? Many questions. Maybe that type of battery could be used as a storage battery at a wind or solar farm.
Its not sodium sulfur. Google CATL sodium battery. It works until -20 degrees without heating needed.
Eulenspiegel,
So the mentioned issues with Lithium are not relevant ?
Ervin- whats your fallback plan for transport once you can no longer procure or afford petrol?
You walk to work and the market?
This is not an either/or problem. It’s so much more than cars. Case in point, today February 12 at 12am the MISO or Midcontinent Indepenant System Operater had (approximation) a 73,000 MW load with 20,000 MW being supplied by wind. 22 hours later the load was about 83,000 MW with 3,600 MW being supplied from wind.
So simple math. +10,000 MW in load and -16,400 MW in wind generation. Most of Minnesota spent the day BELOW zero degrees so that 26,400 MW had to be produced or people would have died. As D Coyne feels we’re going to die because of the carbon atom or just freeze to death. Please do the math and figure the amount of lithium carbonate needed to provide the power for, let’s say 12 hours at a rate of 20,000 MW.
Ervin-
“This is not an either/or problem.”
On this we see eye to eye.
John-
“Hickory, the UK would need 33% extra electricity just to replace household cars with EVs. Not to mention commercial EVs. Or heat pumps.”
Not at all surprising, Replacing the energy of oil, as it depletes. is no trivial task.
And the task will likely only be partially achieved given the limp effort thus far exerted.
The extent to which nations accomplish some of this task depends entirely on the steps taken over the past ten years, and the over the next 10 years.
That’s why MSFRs (Molten Salt Fast Reactors) are much needed to cope with wind generation variability. Luckily for you, your government is helping the development of a msfr demonstrator with the corporation Terrapower (MCRE project or Molten Chloride Reactor Experiment with the aim of the MCFR, Molten Chloride Fast Reactor).
Ervin
More info on Lithium prices.
Fastmarkets’ price assessment for lithium carbonate, 99.5% Li2CO3 minimum, battery grade, spot price range, ex-works domestic China, was 400,000-430,000 yuan ($62,833 to $67,545) per tonne on February 10, up by 50,000-60,000 yuan per tonne from 350,000-370,000 yuan per tonne a week earlier.
Fastmarkets assessed the lithium carbonate 99% technical and industrial grades, spot price, DDP (delivered duty paid) Europe and US, at $45 to $50 per kilogram on February 10, up by 22% from the previous month.
https://www.mining.com/lithium-spot-prices-soar-in-lunar-new-year/
Hickory, the UK would need 33% extra electricity just to replace household cars with EVs. Not to mention commercial EVs. Or heat pumps. Tony Seba and RethinkX rely on a massive overbuild of renewables/storage?!
“Hickory, the UK would need 33% extra electricity just to replace household cars with EVs. Not to mention commercial EVs.
17% for both is more likely. Petroleum is about 40% of primary energy consumption in the UK, and it is almost all for cars and trucks. That chunk of the country’s energy consumption for light vehicles would fall maybe 80% if all ICEs converted to EVs. Average MPG for American cars is about 25, and Teslas are rated at 125.
So add that 10% to the 60% non-oil primary energy, and you get 1/6 or roughly 17%. Now some of the primary energy is for heating, but on the other hand the oil industry itself is a big consumer of energy.
When you pay a dollar to put fuel in your car, you spend 80 cents on waste heat. That heat has to be disposed of with a complex (and heavy) cooling system. Only 20 cents goes to hauling the vehicle around, and that includes the cooling system and the wind resistance it creates sucking in cool air.
Alim, your observations of relative efficiencies of EVs and ICE cars are interesting but irrelevant. The question is: how much extra electricity is required to power private cars as EVs rather than ICE? The UK answer is ~3,000 kWh per household per year. This is almost exactly how much a UK household consumes pre-EV so almost doubling household consumption of electricity. This would be an extra ~33% of UK electricity generation. Where do you get 17% from???
And also show me the copper ( how many miles/ tonnes) needed to implement this . Politicians will promise anything and everything .
John Norris —
My remarks are relevant because they impact the amount of electricity that will be needed. The point is that oil is less than half of energy use. If that less than half (say 40%) falls by 80%, it is about 8% of the previous total, which is less than 33% of the other 60%, which would be 20% of the previous total.
And that is not even counting the savings that would come from shutting down the energy hungry oil industry.
What is the source of your claim?
Alim, are you confusing energy and electricity? I agree EVs are way more efficient than ICE vehicles. However, I was answering the question “how much extra *electricity* (not energy) does the UK need to convert household cars to EVs”. The issue is electricity generating capacity and infrastructure, irrespective of the net energy benefits.
John Norris —
I am ignoring the part of the consumption on both sides, oil and non-oil, because it is a back-of the envelope problem. I guess you don’t have any source, but if you do find one, why are you so fixated on households and no the total electricity system? I mean, why should anyone care?
John,
Lets explore the choices.
If petrol supply or affordability drops by half, then your countries ability to achieve miles traveled will drop by a commensurate amount.
Or the choice could be made to replace the some of the petrol energy /ICE vehicles with electricity and EV’s.
The speed and extent of this transition/replacement effort at the discretion of your countries people and leaders, of course.
It’s a big risk to choose a path too slow.
And yes, plenty of additional electricity will need to be generated, transmitted, and stored.
How much?- The easy answer is to just assume it will be a massive project. One that your country (and almost all other countries) will fail to achieve fast enough to keep up with economic demand.
What would be worse for the economy is to make an even slower or weaker effort to get the job done.
You should mention inventory collapsing.
My version given last week to students at IIT Tirupati
https://www.youtube.com/watch?v=lGrZRFDHZOk
Seppo , very well done . Appreciated by all to whom I forwarded the link . An eye opener .
Hi Seppo,
some months ago we discussed about oil production and thermodynamics. I think, “oil enigma” would be a good name for the problem we discussed. Have you found own results ?
The image below shows
– a control volume for oil production,
– the steady state entropy rate balance corresponding to the control volume, which is to be solved
– and my solution.
The oil enigma:
As a minimum you have missed off electricity, fuel, combustion air and exhaust gases. More than that though you can’t analyse irreversible reactions as if they are reversible, you can’t treat multi phase systems as if they are single phase, you can’t treat multi-component systems with reactions as single components. I don’t see an enigma so much as complete misunderstanding.
George, the steady state entropy rate balance is the equation for analysis of irreversible processes, if mass flows inside are equal to mass flows outside. If anybody wants to include phase transitions, he should use adequate values for “s”.
Seppo understands the oil enigma.
There’s no enigma you just haven’t included all the terms in your equality. In particular you have missed the fact that a portion of the gas that comes up with the oil is burnt to power the whole process producing a lot of energy (and a lot of entropy if that’s your thing, though why anybody would start there I don’t know).
Set up your own solution.
There is no problem to include the gas coming up in the incoming mass flows and co2 and h2o in the outgoing flows. Put the terms necessary in the equation “To Solve”.
This equation is the base to calculate the arising entropy, which is included as “sigma”.
But first, have a look in book of Moran/Shapiro, which seems to be strange for you.
It’s not strange to me – I used to teach engineering thermodynamics to graduate level, in particular chemical engineering thermodynamics, which is more specific to oil the business, and had you been one of my students I think you’d have failed. The problem is that you don’t even know that you don’t know (that’s the Dunning-Kruger effect). Try doing some of the problems in that book – I think you will find them impossible, even to get started. As for setting up my own solution – why bother when it’s all been known for over a hundred years.
So you have best preconditions to find your own solutions. I’m curious for your result.
For most of us here (even us lay people), this presentation is very old news. But it is also a very fine presentation. It is clear and succinct (except for those of us with math disability).
This represents the view that was “hot” about fifteen years ago but which was roundly rejected by mainstream sources when US fracking “saved the day.” However, the facts did not disappear.
Now, it is even later in the day. Fifteen years of preparation have been squandered.
I sense that the decline and fall, having been exacerbated by our intransigence and collective denial, is going to be UGLY.
This chart is not intended as a projection but as an indication of the challenges facing the Mexican oil industry. For each offshore field and all onshore fields collectively the future production is assumed as an exponential decline based on the 2021 production and the proven plus probable reserve estimates from CNH from the end of 2020. The offshore fields are plotted by start up year. Evidently if this process is followed then process is followed then production will crash, which isn’t going to happen, but it does illustrate the efforts needed to prevent it.
For fields from Zaap and older the exponential decline is approximately being followed and the curves are fairly smooth between past and future. For younger fields a few, mostly the smaller ones, are in end of life exponential decline, some are still ramping up, some on plateau and some in decline, but at lower rates than I have shown. The longer these slower decline phases are then the more rapid the later decline phase will be (in recent years Mexico hasn’t had much success with reserve growth, but the may be some, which would ameliorate the declines).
Other than developed fields any overall decline would have to be staved out by bringing on new fields, either discovered and undiscovered. In he last two years several small or smallish fields, mostly short lived tie backs, have been bought on, partly from outside operators like Eni and Repsol, and have kept overall production level. There are signs that the ready supply of fields that can be bought on line easily is growing thinner (smaller fields and larger gaps between their start ups).
However there are larger developments in the works from the outside IOCs. The reserves shown in future declines amount to 2.9Gb proven and 4.5 Gb proven and probable. CNH estimates 0.9Gb proven and 2.5 Gb proven and probable in undeveloped offshore fields. These numbers have a negligible amount from deepwater, which will grow considerably.
Overall it seems to me Mexico is going to find it difficult to maintain the plateau it has achieved over the last couple of years, will certainly not be able to grow as its public announcements predict, by 2025-27 is likely to return to the steady decline it had seen since 2014, and may well see a couple of years with dramatic falls. As seen in the annual oil production chart there was a similar plateau 2008 to 2012, beween periods of steady and almost matching, linear declines.
Mexico ol production history.
George, I concur with Ovi’s comment and always look forward to you graphs. They are informative and the color coding make them beautiful as well.
Appreciated, and thanks for the presentation and for shutting down the “not right, and not even wrong” entropy sets oil price crappola.
George
Thanks for the great work you have done on this Mexico projection and the previous ones.
I wish that you would consider doing a couple every so often and publish them as posts. They would be easier to find if one wanted to go back and look them up.
I agree that Mexico is struggling to increase production. They have made no progress over the last three years.
Thanks, but I was just trying to answer somebody’s question above. I might do a post if something interesting occurs in the annual statements. Also the second Guyana FPSO, 220 kbpd nameplate, has just started up.
George
Looking forward to your next one. Russia would be interesting if you could find the data.
WTI at $94.24 +$1.14
Why Russian Invasion Peril Is Driving Oil Prices Near $100
The threat of a Russian invasion of Ukraine is shaking up a fragile global oil market, pushing prices closer to $100 a barrel as traders calculate that supplies will struggle to cushion the effect from any significant disruption in Russian fossil fuel exports.
Is Venezuela Lying About Its Oil Output?
“While some estimates peg flow as high as 750,000 b/d, these likely include gas liquids and tend to overlook sizable water content and sediment. Even where data is considered more reliable, a tendency by local managers to embellish performance to meet unrealistic targets imposed by Caracas headquarters and the erosion of measurement expertise and functional metering equipment remain distorting factors.”
Frugal,
Note that here at peakoil barrel we focus on secondary source data for all OPEC producers including Venezuela.
In addition the crude output reported by OPEC includes only conventional crude, Venezuela has been producing about 110 kb/d of Orinoco belt of late, according to OPEC data, in the MOMR this is called OPEC non-conventional and is listed with the OPEC NGL data (for Feb 2022 MOMR see Table 5-6 on page 45). So for Jan 2022 Venezuela’s output would be about 780 kb/d if Orinoco belt output was 110 kb/d (conventional crude was 668 kb/d in Jan 2022), there may also be some condensate output which is not included in the OPEC data for individual nations (this is likely a part of the OPEC NGL estimate for all OPEC producers), this probably is under 50 kb/d for Venezuela.
Saudi Arabia transfers Aramco stock worth $80B to kingdom’s wealth fund
Saudi Crown Prince Mohammed bin Salman, the assertive son of King Salman, made the decision to transfer the stock, the state media report said. It will go to the Public Investment Fund, the kingdom’s sovereign wealth fund, which has been Prince Mohammed’s vehicle to invest in everything from Uber to British soccer team Newcastle United. The fund is also part of the prince’s Neom project along the Red Sea coast.
“His Highness added that the transfer of these shares is part of the kingdom’s long-term strategy aimed at supporting the restructuring of the national economy,” the report said. That will include creating private-sector jobs in the kingdom, it added.
Not sure what’s going on here. The prince is siphoning money from Aramco to the government, which is essentially the same thing. The result may mean less money available for extracting oil, but maybe they’ve given up on maintaining production.
North Dakota oil production fell slightly in December. North Dakota Oil Production
Production fell by 21,156 bp/d, a little less than half what it gained last month. That put their barrels per day at 1,137,466. Their rig count was 33 in November, 32 in December and 32 in January.
Just my opinion but if the Bakken cannot increase production at $90 a barrel, it cannot increase production.
Ron:
I’m no expert on the subject but I hold interest in quite a bit of property in the Bakken. In the mad rush to the deeper shale of the Permian, the Bakken was more or less deserted. And then here came the pandemic, with the negative day for oil, and Mr. Hamm shut down production. I don’t blame him for doing it but it was a psychological blow to the basin.
Despite the average Bakken shale well outproducing the average Permian shale well by quite a measure, the Bakken is painfully lacking takeaway infrastructure, petrochemical plants, refineries, and even gas utility plants. Add to that the shortage of talent: frac crews, stereo drillers, etc. The cancellation of the Keystone Pipeline was an almost fatal blow, as was the problem with the Dakota Access. In short, as the Permian “came back” in 2021, the Bakken faltered badly–it was given up to be an exhausted field. Only now have rigs begun moving back in. Basically, the Permian Basin just sucked all the oxygen out of the room. A limited supply of workers were paid better for working in the Permian, under better conditions.
The Bakken is blessed with a few necessary ingredients for the unseemly process of coaxing oil out of shale. One is that ethane is in high concentration–up to 30% of NG in places. It is a superior oil-lifting gas and also seems to “clean out” capillaries, pores and penetrations in the shale upon re-injection. They have gotten good at maintaining reservoir pressure. Another plus is that it is not uncommon in my experience for child wells to be as good as their parents, and for fracturing of the rock in the child to not infrequently rejuvenate an aging parent well. The third is the availability of water for fracking and the accessibility of disposal.
There is no doubt, however, that the Bakken Tier-1 locations have been exploited. For some reason, this seems less important in select areas, but people are just now waking up to that. In Dunn county, one of the so-called monster wells was drilled on previously condemned property (Tier-3). Parts of the shallower shale benches are attractive for three-mile drills as there is uniform oil-rich rock, it’s just not very thick. It doesn’t have to be thick, just oil dense for the limited distance of frac perforations.
Again, I’m no expert on this but I do follow it as carefully as possible. Compared to my Niobrara, Eaglebine, and Granite Wash wells, the Bakken holds its own, and then some. The ultimate percentage harvest of resource is going up fairly dramatically with this ethane re-injection technique. The slower pace in the Bakken–forced by circumstances, not by choice–has made for an effort to milk each well for all it’s worth, which in my estimation is a good thing.
I personally want to see limited flaring and venting of natural gas, a grateful attitude toward the land, and some semblance of respect for the contribution of oil and gas to the benefit of mankind. Sounds soupy, I know, but I hate all this drill, produce 10%, run on fecklessness that is so prevalent in the shale basins.
Treat this stuff right and it, along with some carefully thought-out conventional onshore wells and big offshore wells, just could see us through. Race through it too fast and it’ll be twilight in the desert. It may take a global oil shock to wake up the world to the fact that without oil and gas, civilizations will collapse.
some weather
WTI closes at $95.46. Spitting distance. And a far cry from April 2020.
Dennis once posted that peak oil would be a time of high oil price. I disputed this. Peak oil would be in a time of oil abundance, therefore a low price. High price oil would come after peak oil when supply no longer meets demand. I think that we are there right now. That is we are post-peak oil. Prices are rising because supply can no longer meet demand.
EF added five horizontal oil rigs last week but with each rig averaging slightly less than two wells per month it will need at least the same again to stop the DUC decline. Bakken added one horizontal rig. However it has already has a low rate of drop to the DUC inventory and only needs a few more rigs over the next six months. Permian added seven horizontal rigs, all in Texas, but only net four were in the main oil producing counties. Wells per rig there is only about one per month (and slowly falling) so I think a lot more are needed to be added quite quickly or the DUC inventory s going to fall below three months and completions will have to be cut back. By the EIA DUC report completions were steady in Bakken, down three in EF and up three in Permian. In all regions the DUC count fell by a lot more than the difference between drilling numbers and completions would suggest, implying that non-viable DUCs are being abandoned.
George
I guess there are different ways at estimating the remaining months of DUCS. With regard to the Permian, I prefer to look at the difference between drilled and completed, or said a different way, how many extra wells were completed than drilled.
For January, 89 more wells were completed than drilled. With 1,355 DUCs remaining, that works out to 15 months of DUC inventory in the Permian.
What is interesting is that number has been fairly steady for the last six months. Every month, fewer DUCs are completed so that the inventory months has remained fairly constant between 15 and 16. I wonder if the number of DUCs being completed is being done intentionally to keep the remaining months at 15 for some reason possibly related to bank loans,
Latest on DUc’s . Shrinking inventory .
https://www.aogr.com/web-exclusives/exclusive-story/duc-inventories-decline-to-levels-on-par-with-2013
The industry uses the way I have shown as it indicates how much leeway it has to plan logistics for completions (i.e. on average the inventory shows how many months are available to organise fracking crews and how much money is being lost because of non-productive wells with sunk drilling cost). I’m not sure what your way indicates, for a long time it would have been negative and at equilibrium, as all te basins are approaching with Niobrara almost there, it is infinity.
George
I think the number of months showing in your chart reflects the number of months it would take to use up all of the DUCs, if all drilling was stopped and DUCs were completed at the latest rate. Not quite sure how that is useful information to the industry since drilling is not going to stop.
When the monthly drilled and completed wells are equal, that is correct, the inventory months become infinite because if the DUCs are not being completed, their supply is infinite. Looking at a more informative case, if the monthly completions are just 1 more than drilled, and there are 1000 DUCs left, that would make the inventory months 1,000. Not quite infinite but heading there,
When the parameter goes negative it means the DUCs and inventory months are increasing, which is the opposite of what is happening now. When you drill 500 wells and complete 450, DUCs are on the increase.
Looking at the current Niobrara data, between 9 and 10 DUCs are being completed each month and there are 345 DUCs remaining. Assuming 10 are completed every month going forward, that makes for a 34 month inventory.
So from my perspective, I want a more realistic number that tells me how many months before the DUCs are exhausted in a BAU drilling economy. In my mind I cut that number in half, thinking that only 1/2 are economic. However that may not be true now that WTI is at $90.
I thought I’d given two reasons it is useful – it indicates when they need start thinking about changing the balance of rigs or completions. As to whether they do find it useful then apparently they must do as that is how things are discussed (I’ve never worked directly on shale but known people who have and attended presentations and meetings in which it has been on the agenda). I predicted they’d start adding significantly more rigs when inventory approaches around six months with the aim of keeping t above three, and that appears to be what is happening, must indicate something. It is the same with maintenance warehousing, where there is usually a tighter balance of input and output: the inventory time is a good measure of whether supplies are too tight (for smooth operation)or too high (for economics).
George
Maybe we should revisit this discussion about 6 months from now to see how the inventory months look.
Note in Ron’s chart below, the EIA posts how many DUCs were completed in the latest month and how many DUCs are left. This info is not published in the DUC report but is readily calculated. I think it is interesting that the EIA summary pulls that number out for the reader to see.
I will add a chart in the next post showing how the inventory months have changed over time when one divides DUCs completed vs DUCs remaining
Don’t remember if this was posted . Excuse if duplication .
https://bisoninterests.com/content/f/bison-2022-oil-outlook-record-year-2022-outlook-duc-dilemma
U.S. DUC Count Drops 48% In Two Years
According to the EIA, crude oil production in the seven most prolific U.S. shale basins is set to increase to 8.707 million barrels per day in March—a 109,000 bpd increase (1.3%)from February’s 8.598 million bpd, and an increase of 271,000 bpd from January’s tally.
The largest increases are expected to be seen in the Permian basin (+71,000 bpd in March) and the Eagle Ford (+24,000 bpd).
The EIA’s Drilling Productivity Report also showed another decrease in the number of Drilled but Uncompleted wells (DUCs). In January’s report, the EIA had estimated that the number of DUCs had fallen to 4,616 in December from 4,830 in November. The EIA’s current report shows that January’s DUC count has fallen even further, slipping 191 to 4,466.
That data came from the the EIA’s Drilling Productivity Report. The DUC data in that report is quite interesting.
Ron
Dividing the change column into the January numbers, gives the number of remaining inventory months, as discussed in my response to George above.
EF has 23 months of inventory, the largest among the primarily oil basins. I wonder if the slow utilization rate of 28 per month is an indication that many are not economic.
Ovi , bullseyes . I have long commented that DUC’s are nothing but smoke and mirrors to hide the underlying problem which is as Ralph Nader said about the auto industry ” Unsafe at any speed ” my take is ” Loss making at any price ” . They keep on deflecting their poor performance by technical jargon viz we just did a 3 mile lateral , we just increased the wells per pad , we just pumped a few cubic meters of sand less since our last frac and so we are now going to be billionaires . ( If a beggar earns $ 10 today and then earns $ 20 tomorrow , then he can say ” I am on my way to become a billionaire ) . 🙂 . Ovi , we will wait until this fraud goes mainstream just like EV ‘s ( posted on the other thread ). Be Patient . Patience is the virtue of an ass who trots beneath his burden but says nothing . A saying from where I come . Relax .
Have you modelled this Dennis.
https://twitter.com/Josh_Young_1/status/1493588914086498305?t=HPa1s39K0QcNWV-pjIlolA&s=19
The US has an excellent rail network. But unlike other nations, it is optimised for freight. The fuel consumption per tonne-mile for rail freight is one-twelfth that of a heavy road truck. The disparity is similar for passenger transportation if trains are at least half full. The US could power its railways system using biofuels if necessary. That is achievable. Powering the road vehicle fleet with biofuels is not achievable. I suspect that 21st century will see the US shift from being a road based to a rail based society. This suggests a more nodalised pattern of urban settlement.
There are other freight transportation options that are now almost forgotten because they are not futuristic and exciting.
https://www.lowtechmagazine.com/2011/01/aerial-ropeways-automatic-cargo-transport.html
Ropeway transportation is slow, about human walking speed. But it is energy efficient and lean on the amount of infrastructure needed. You could couple the hoist that drives the rope directly to a vertical axis wind turbine. It wouldn’t even need gears. Something like this could transport freight from rail hubs to outlying towns and villages. Short range freight transportation could also be electrically powered, using technologies like this.
https://www.lowtechmagazine.com/2009/07/electric-road-trains-in-germany-1901-1950.html
At the factory and home level, wind power can provide both electricity and mechanical power. But neither can be practically stored. So consumption needs to rise and fall in line with supply. Wind power is affordable and has a respectable EROI if used in this way. Try and store energy on any significant scale and the EROI and economics deteriorate rapidly. This suggests that people need to work when energy is available and take time off when it isn’t. Labour laws need to adapt. We will all be living like doctors on call in the future.
All of these solutions are possible, but they all represent a dramatic departure from the status quo. The sooner governments stop denying the increasingly obvious fact of life of fossil fuel depletion and start planning for what needs to come next, the easier the transition will be.
Ropes?
If you want you can electriefy your rail network as every big nation has done.
Even the transiberia runs full electric.
Or you can unearth steam engines and run them on timber…
TonyH
You say say that wind power is affordable. I say with as much passion I can muster, if you don’t included the cost of the fossil fueled power you have to build to provide electricity when the wind doesn’t blow.. Build me a coal or gas plant and it will still be productive after 40 years. After 20 years the wind farm will be near junk.
I am not too sure.
The giant offshore mills being built can stand some beating. The cost of maintenance, including replacing turbine blades after max 20 years, are going to be costly. But I bet you they can stand for 50 years. The main reason being the longevity of inter connector lines and just the quality of the few(er) Eiffel Towers being built offshore. Some components must be replaced. The increasing cost of infrastructure is going to be a problem not just energy related, but in any aspect of life.
But then again, if the offshore projects for wind are not built for longevity we have a problem (but I think they are). Sooner or later people in the UK and the Netherlands are going to root for wind power saving the day somewhat. The interesting questions; how much is it going to cost, just how much energy in total can you get out of offshore wind and how much stable electricity is going to be the floor. These can be estimated better in the future.
The EROI (and rate of return) of wind power infrastructure will never be as high as coal, oil or gas of yesteryear. A nuclear power reactor programme could in principle outperform any renewable energy source and even legacy fossil fuels, on a return on invested energy basis. But achieving this EROI requires scale economies that are proving difficult to achieve in the nuclear sector. It would require building up supply chains and expanding scale rapidly and I just do not see the requisite level of commitment at present. We are building expensive one-off powerplants, that need to be supported by entire industries doing piecemeal work.
Whilst I may hope for a nuclear renaissance that allows prosperity to survive, one must plan for scenarios where this does not materialise. We have wind powered machines that have lasted for many centuries with maintenance. These are modest scale devices with stone or brick towers and wooden blades and nacelles. Such infrastructure can be built on land, at least partially using local resources and labour. Whilst it does not have the power density of a nuclear reactor, it is technologically simple and can be fabricated easily at a local level in ways that nuclear power reactors cannot. To power a ropeway capable of transporting goods over distances of several miles, a wind driven machine need be nothing more complicated than a set of vertical sails coupled to a vertical wooden shaft. Very simple and easy to build. The same is true for any wind driven application that is purely mechanically driven. No need for expensive rare earth magnets or complex electrical systems – power can be harnessed by coupling mechanical loads directly to the rotating shaft without intermediate electricity generation. It is technically easy to build systems like that. Using rope drives and line shafts, some really quite complex products can be fashioned in machine shops powered by directly coupled mechanical wind power. Even more flexibility is available with hydraulics.
But to use wind power efficiently without trashing the EROI, we need to forget about energy storage and instead adapt our demand to the reality of intermittent supply. That means doing lots of work when the wind is at high strength and taking time off, servicing equipment or doing labour intensive work when wind power is low. Demand must adapt to supply, not the other way around. Wind driven transportation must also run fast when wind power is abundant but more slowly when it is weak. Wind power exploited on this basis (without storage) and used as a direct mechanical energy source, could be resource efficient. But using it in this way implies dramatic changes to our ways of living and working. It means using systems that are simpler, slower and generally less flexible. We do not live in a perfect world.
A few rambling comments here although this is not strictly an oil/gas related discussion.
You are right that rail is an energy efficient form of transportation. Let’s say you are right about a 12-1 theoretical advantage compared to heavy trucking. If you count in the cost of infrastructure to build rail for a certain speed and to build/maintain locomotives and tracks, it is less appealing. But still superior. To gain the full advantage of rail in a long term perspective, it has to be combined with electricity from renewables. It is costly to build and maintain electric railways, so there is a limit to what can be built. If new lines have to be built/rebuilt it can take decades, with the same problems as high voltage lines (e.g. land use).
In Europe; Germany and Sweden, for example, have a state of the art electric railway network already in place. They are pretty far ahead when it comes to planning for the future regarding just rail. It is a competitive advantage if electricity are coming from renewable sources. In Norway we have a decent electric railway network in place (not as good as Sweden or Germany). We use about 0.9 twh electricity annually towards rail transportation. Still we have plans towards using 15 twh to completely electrify ALL transportation (except some of the air and sea transportation) by 2030++. With heavy usage on rail transportation to the main cities we end up with maybe 2 twh (up to 3) a year, with probably a energy gain of 5/1 comparing it to trucks. Much less compared to sea fright, but the again.. it does not as easily run on renewable electricity. Total electricity usage in Norway is about 140 twh at the moment to clarify the picture.
All kinds of energy sources can be used for rail; coal,diesel, LPG, biomass, hydrogen and electricity from renewables. It can always make sense because the theoretical energy advantages to trucking (12-1) are so high.
A lot of countries are thinking about renewing their railway strategy. Take countries like Canada and Australia. The costs and timetable to electrify the wast railway lines are just to huge. So they are thinking that to fuel trains with hydrogen (or ammonia maybe) may be a justifiable solution based on sufficient wind/hydrogen resources. In the US the case would be to use more rail for transport whether it is using diesel, LNG or electricity to replaces trucking along the main transportation lines. In densely populated ares, mass transit based on electricity is always on the cards. Definitely the solution east coast US, UK and the Netherlands (and a lot of other places). Electrifying rail is so costly that it is kind of smart to limit its scope, but mass use it for the long term.
Kolbeinh , your comment is Ok . You seem to miss the point , that what worked pre war II cannot work now . OBOR is crashing and BBB would have also had it been passed . We are now over the tipping point which is” nett surplus energy ” available for growth . We are at a crux ” maintain what we have or crash ” . Forget growth . Now I come to the corollary to theorem ” The end of growth is the beginning of collapse ” because that is how are financial and economic system is designed . Reminds of the movie ” No way out ” starring Gene Hackman and Kevin Costner .
HIH
I limited my comment to railway. Even in India the aim is for the most part an electric railway by 2030 on the surface. The net surplus energy problem for “growth” is well known btw.
Kolbeinih , ”The net surplus energy problem for “growth” is well known btw. ” Yes , at least both of us are in agreement . My problem is the difference between ” Knowing ” and ” realizing or recognizing ” . We all “know ” junk food is bad for health but ” realizing and recognizing ” ? I will get back when I am thru with my Big Mac Menu . 🙂
‘Net surplus energy’ is an interesting theoretical issue, and someday the ramifications may actually bring growth, and maintenance of existing projects, to a slowly grinding halt.
Until then, people and companies and countries will do what they can afford to and adapt to. That includes replacing fossil fuel based industries with more efficient engines or mechanisms, or ones that are less expensive to operate than oil products in a post peak world.
Such as further electrification of trains.
Peak oil does not mean that oil disappears all at once one day. There will be a long period of higher pricing, and that will be the incentive mechanism to use oil for more important uses than just routine light vehicle transport (which is the big majority of oil consumption).
From ten years ago- Nov 10, 2012
“Oil is too Precious to be Used as Transportation Fuel”
https://oilprice.com/Energy/Crude-Oil/Oil-is-too-Precious-to-be-Used-as-Transportation-Fuel.html
Tidbit.
Ukraine’s primary refinery (only one of signif) is in Kremenchuk on the Dneiper river. Capacity 368K bpd. Ukraine burns about 243K bpd. The river runs down to the Black Sea, though not into Odessa.
Kremenchuk is southeast of Kiev, nowhere near the Donbas.
No evidence Russian or Ukraine tanks run on solar.
Watcher ,”No evidence Russian or Ukraine tanks run on solar. ” Not a problem for Mr Putin , all he has to do is cut the supply of EU and top up his battle tanks and fighter jets . What is Ukraine’s option ? Wait for a 47API tanker from the Permian ? ROFL .
Bakken Comes to Terms With Maturity
North Dakota’s oil and natural gas regulator expects flat investment and production growth in the Bakken Shale in the coming years as operators increasingly view the field as mature.
Speaking to reporters on Monday, North Dakota Department of Mineral Resources (DMR) Director Lynn Helms said most of the 10 operators he had spoken to the previous week had roughly a decade of drilling inventory left in the play.
“It does mean that we have flat to maybe 1% or 2% growth for the next 10 years,” Helms said. “But at that point, drilling drops off.
https://www.energyintel.com/0000017e-fe2f-dfa7-a5ff-ff3fc16a0000
The question is how long before the Permian reaches this stage?
Frugal , the Permian is on its way . They are now on to drilling Tier 2 and Tier 3 .
Mike S just posted this .
https://www.oilystuffblog.com/single-post/cartoon-for-february
Hole in head,
Yes Reeves county is not doing well. This is an incomplete picture, normalized well productivity for the entire Permian basin might look different.
If we look at other counties in the Permian basin we get a different picture. See post below by Enno Peters.
https://shaleprofile.com/blog/permian/permian-update-through-october-2021/
also
https://shaleprofile.com/blog/permian/permian-update-through-september-2021/
Hole, the “drive by shooting response,” above, to my post on declining well productivity in the Delaware Basin implies I have intentionally picked a bad county to prove my point, as if Reeves County is not representative of the rest of the Basin. That is a blatant falsehood; well productivity, often on an IP6 Mo. basis, always on an IP24 Mo. basis is falling when HZ wells are normalized for lateral length and proppant loading in ALL counties. I can prove that all day long with either welldatabase, shaleprofile, or IHS data. When looking at the top operators in each county, and what they are doing to their core areas, it is alarming.
The point remains a valid one, when an operator moves 330 away from an existing 2018, Wolfcamp well, supposedly then of Tier 1 well quality, on the same unit, and its new well appears on a path to produce 30% less because of pressure depletion, initial GOR has tripled, WOR has doubled, to me that meets the definition of Tier 3. EUR’s appear to be declining, THAT is what we should be focused on anyway.
I get argued with all the time by petroleum engineers with decades of actual oilfield experience and of tons of data; I’ve learned to never bring a knife to a gun fight. Well productivity is changing in the Permian and top down analysis based on 5 year old technically recoverable resource “estimates” serves no one interested in our nations long term hydrocarbon outlook.
Thanks Mike S for saving the trouble . Top down analysis does not work . It is akin to making up a nett profit figure on your balance sheet in advance and then start working down to top ( top down) to justify the nett profit .
In physics, thermodynamics is a top-down analysis, while statistical mechanics is a bottoms-up approach. Both are useful and in the end they agree. That should be the goal for oil analysis as well.
Problems galore for shale producers .
https://www.reuters.com/business/energy/oil-prices-soar-us-drillers-scramble-find-sand-fracking-2022-02-15/
Hole in head,
The fact that sand supply is short suggests things may be ramping up in the Permian basin.
So Dennis , they are going to ramp up drilling but they don’t know if sand will be available for fracking ? Wow . Geniuses in action . Now I understand why shale is a ” flop show ” .
100 million barrels: UAE’s Dragon makes huge oil discovery in Gulf of Suez
Dubai-headquartered Dragon Oil has made a significant oil discovery in the Gulf of Suez offshore Egypt, its first find in the region.
The company announced the new discovery on Tuesday, terming it as one of the largest discoveries in the region in the past two decades.
“The estimated reserves of the new discovery are about 100 million barrels, and it is one of the largest oil discoveries in the Gulf of Suez in 20 years,” it said.
100 million barrels! Hell, that’s enough to supply the world with oil for one whole day! And that’s one of the largest discoveries in the last two decades. Errr… how many days in two decades? 🤣
Yeah the multi-billion barrel finds don’t seem to be happening anymore.
One tweet from today is from a veteran journalist claiming that a lack of quality technical editing means that many times the millions/billions/trillions gets mixed up
https://twitter.com/johndefeo/status/1494000823201931267
I don’t think that’s the situation in this case but something always to keep in min
Listen carefully when UAE oil minister says at 1:30 minute mark “we are fighting with declining production”.
https://www.cnbc.com/2022/02/14/oil-prices-and-russia-ukraine-crisis-ministers-fear-a-return-to-100.html
The sudden drop in price today was caused by US saying that we are at the final stages of negotiations with Iran
Total petroleum products supplied
Seppo, I think CNBC change the video on you. I got a totally different video on that link.
Yes, it appears that the clips are shortened and somehow that segment is omitted from this video although the attendants are the same.
Iran’s additional oil production won’t save the administration by balancing supply and demand. In this market I would expect there is plenty of black market oil being moved and sold to China and others. I think that the world population is truly stunned at the prospect of Peak Oil.
https://www.argusmedia.com/en/news/2302097-opec-cant-substitute-russia-says-uae-energy-minister
I can’t find the video but the quote is included in the above.
Reading between the lines:
“OPEC has no spare capacity.”
One of these months this spring when OPEC+ is suppose to raise output by 400K we could easily see a monthly decline. Then what will folks be saying.
George
Good hunting. At least the quite clarifies the decline to be in other countries, not the UAE.
Ron
The best hope for a new basin appears to be Namibia offshore the Shell exploration well came in and it looks like Venus-1 (Total) could be significant.
Gazprom storage facility in Germany is now approaching zero .
https://pbs.twimg.com/media/FLy521sXMAIK-Eg?format=jpg&name=small
New posts up
https://peakoilbarrel.com/opec-update-february-2022/
and
https://peakoilbarrel.com/open-thread-non-petroleum-feb-17-2022/