June Non-OPEC and World Oil Production

By Ovi

This month’s report is a shorter version of previous posts because the EIA’s International Energy Statistics update for June is not available. Information from other sources such as OPEC, the STEO and country specific sites such as Brazil, Norway and China is used to provide a short term outlook for future output and direction for a few of these countries and the world.

Where STEO data was used, the ratio of C + C to All Liquids was calculated. The average for the last four months was used to project June, July and August production for a few countries.

World oil production and projection charts are presented at the end of this post.

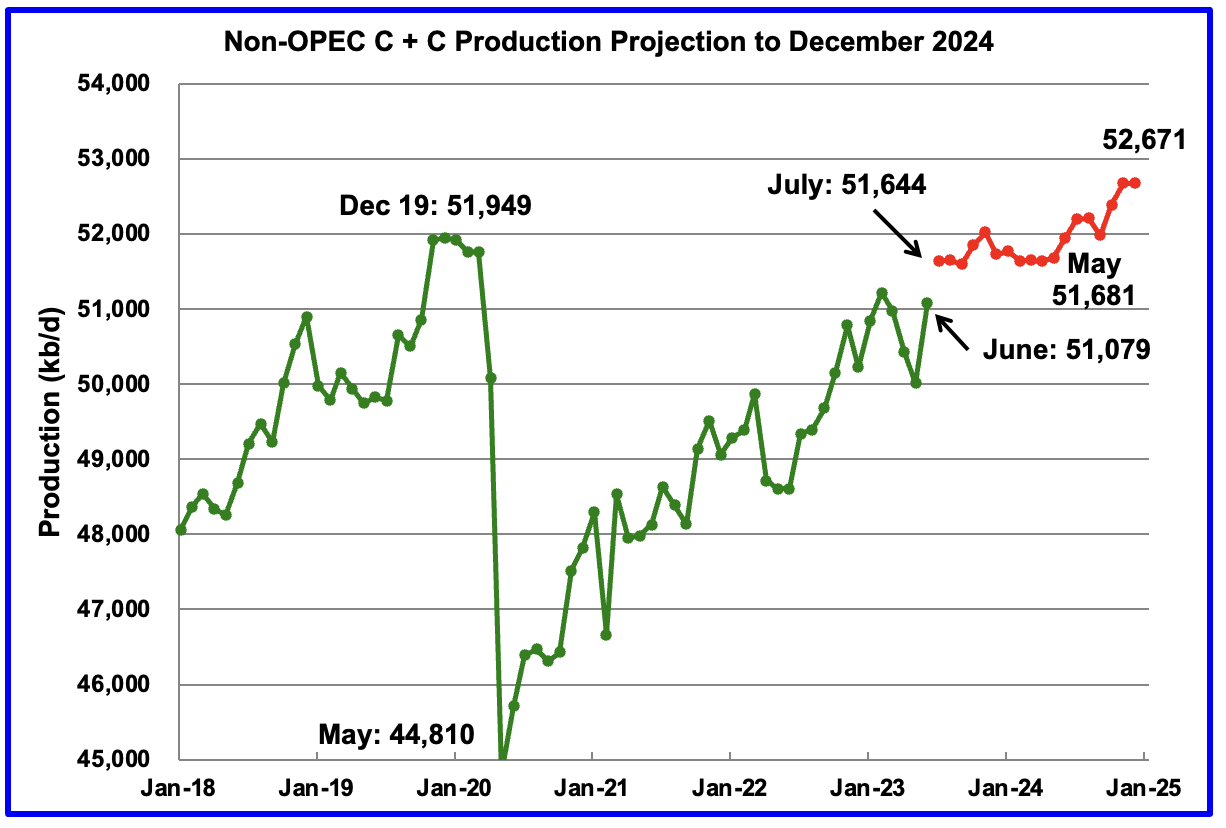
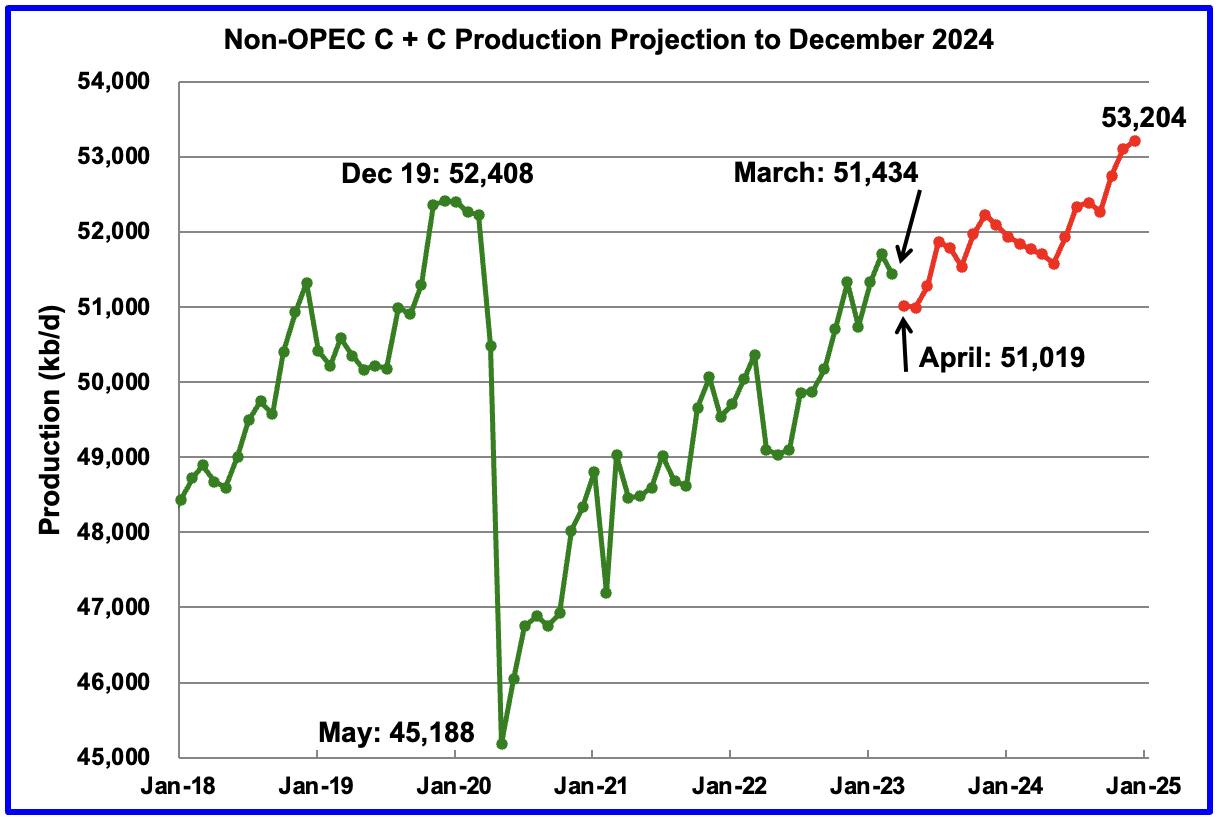
The October STEO is projecting June Non-OPEC oil production to increase by 1,069 kb/d to 51,079 kb/d. Close to 500 kb/d of that increase is associated with the upward revision of Russian output from last month. In the previous EIA May report, Russian condensate was not included in Russian production.

Read More

March 2023 Non-OPEC Oil Production Drops

A post by Ovi

Below are a number of Crude plus Condensate (C + C) production charts, usually shortened to “oil”, for Non-OPEC countries. Normally the charts are created from data provided by the EIA’s International Energy Statistics in the first week of the month. Unfortunately the EIA was not able to update the production information for March until today. Consequently the charts below are produced from a mixture of country specific sites such as Brazil, Norway and China and the July STEO and the International report. The International report was used to update the March production data.

Where STEO data was used, the ratio of C + C to All Liquids was calculated. The average from the last six months was used to project the March production numbers and extended to May in a few cases.

World oil production charts are found at the end of this post.

March Non-OPEC oil production dropped by 268 kb/d to 51,434 kb/d. The largest decreases came from the Russia, 300 kb/d and Brazil 146 kb/d.

Read More

Non-OPEC’s December Oil Production Drops

A guest post by Ovi

Below are a number of Crude plus Condensate (C + C) production charts, usually shortened to “oil”, for Non-OPEC countries. The charts are created from data provided by the EIA’s International Energy Statistics and are updated to December 2022. This is the latest and most detailed world oil production information available. Information from other sources such as OPEC, the STEO and country specific sites such as Russia, Brazil, Norway and China is used to provide a short term outlook for future output and direction for a few of these countries and the world. The US report has an expanded view beyond production by adding rig and frac spread charts.

December Non-OPEC oil production decreased by 317 kb/d to 50,784 kb/d. The largest decrease came from the US, 276 kb/d.

Read More

OPEC Update, November 17, 2022

The OPEC Monthly Oil Market Report (MOMR) for November 2022 was published recently. The last month reported in most of the OPEC charts that follow is October 2022 and output reported for OPEC nations is crude oil output in thousands of barrels per day (kb/d). In most of the OPEC charts that follow the blue line is monthly output and the red line is the centered twelve month average (CTMA) output.  I also show a number of charts from the recent World Energy Outlook 2022, published by the IEA in October. I focus on a selection of charts from Chapter 7 of that report which covers oil.

Figure 1
Figure 2
Read More

Russia Oil Drop Collapses April Non-OPEC Production

A guest post by Ovi

Below are a number of Crude oil plus Condensate (C + C ) production charts for Non-OPEC countries created from data provided by the EIA’s International Energy Statistics and updated to April 2022. This is the latest and most detailed world oil production information available. Information from other sources such as OPEC, the STEO and country specific sites such as Russia, Brazil, Norway and China is used to provide a short term outlook for future output and direction for a few countries and the world.

April Non-OPEC production decreased by 1,294 kb/d to 48,925 kb/d. Of the 1,294 kb/d decrease, the biggest decreases came from Russia, 965 kb/d, Kazakhstan, 175 kb/d, Canada, 95 kb/d and Norway, 78 kb/d. There were no significant offsetting increases. The April 2022 output of 48,925 kb/d is 3,295 kb/d lower than the March pre-covid rate of 52,220 kb/d.

Read More