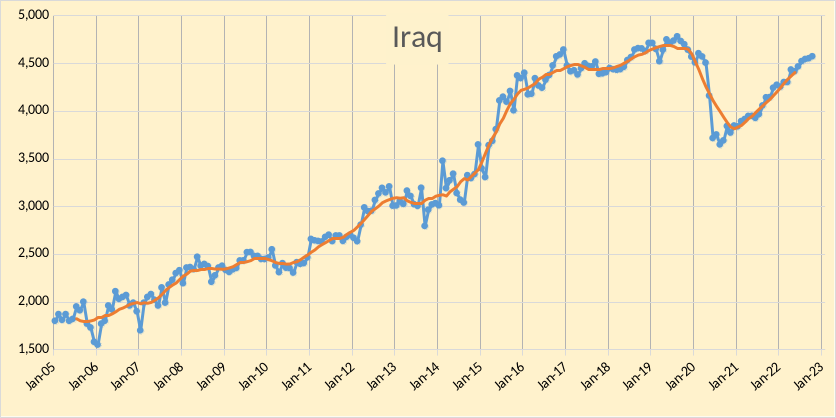
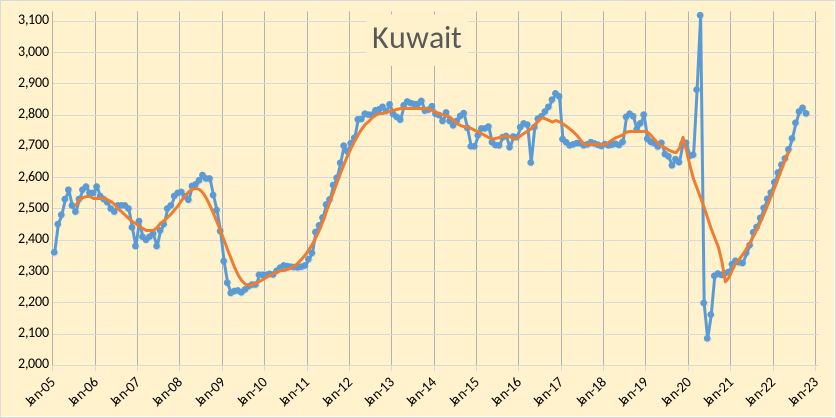
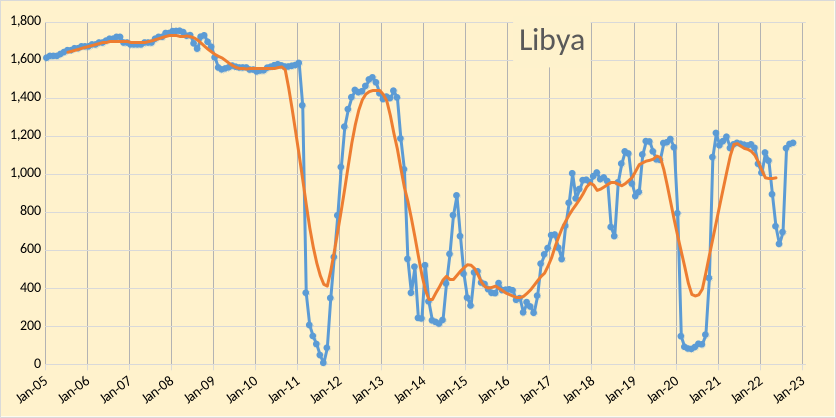
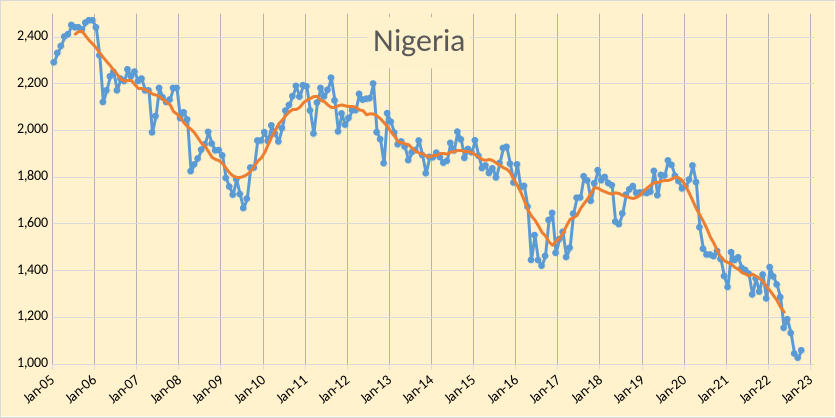
The OPEC Monthly Oil Market Report (MOMR) for November 2022 was published recently. The last month reported in most of the OPEC charts that follow is October 2022 and output reported for OPEC nations is crude oil output in thousands of barrels per day (kb/d). In most of the OPEC charts that follow the blue line is monthly output and the red line is the centered twelve month average (CTMA) output. I also show a number of charts from the recent World Energy Outlook 2022, published by the IEA in October. I focus on a selection of charts from Chapter 7 of that report which covers oil.
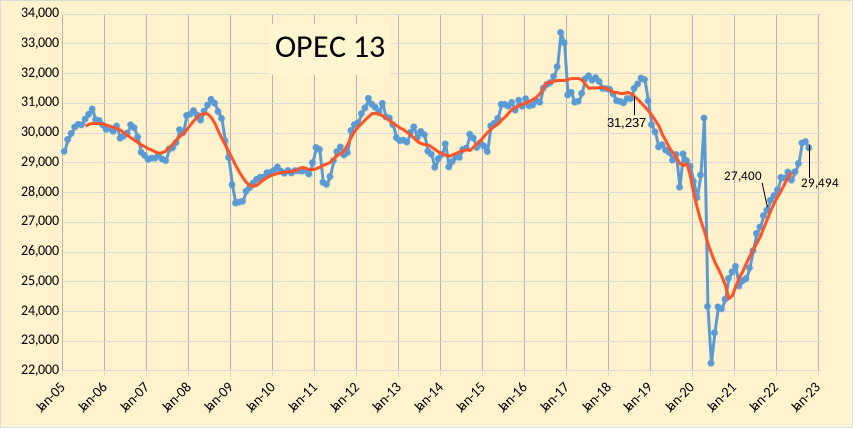
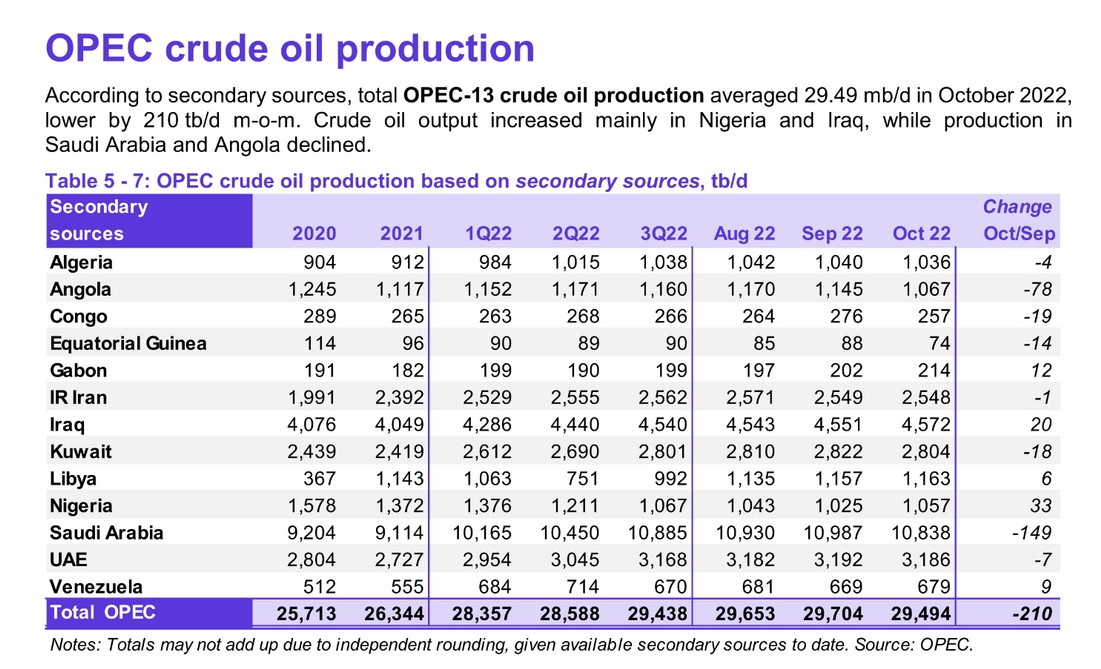
OPEC crude output was revised lower in September 2022 by 63 kb/d compared to last month’s report and August 2022 OPEC crude output was revised higher by 83 kb/d. OPEC output has increased by 2094 kb/d since Sept 2021, from 27400 kb/d to 29494 kb/d. When the World was at its centered twelve month average peak for C+C output in August 2018, OPEC crude output was 31237 kb/d (as shown on the chart), September OPEC crude output was 1743 kb/d below that level.
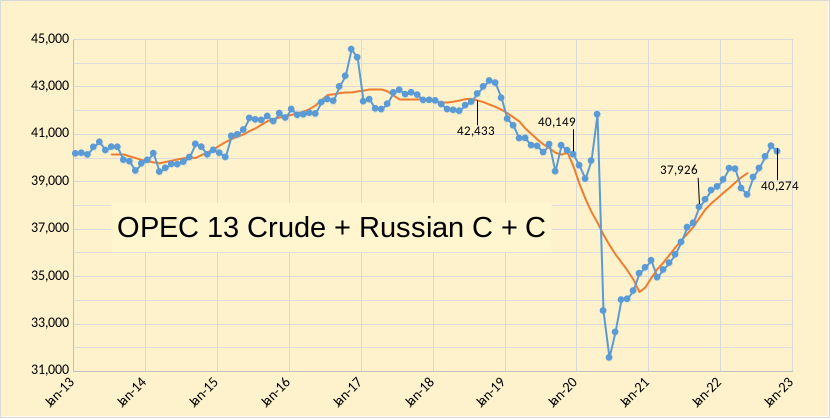
In the chart below we have Russian C + C and OPEC crude oil output. Output for OPEC13 crude and Russian C+C was 42433 kb/d in August 2018 when World C+C output was at its centered 12 month average peak, output for Russia and OPEC was 2159 kb/d below the August 2018 level at 40274 kb/d in October 2022. In the past 12 months OPEC and Russian output has increased by 2348 kb/d from 37926 kb/d in October 2021.
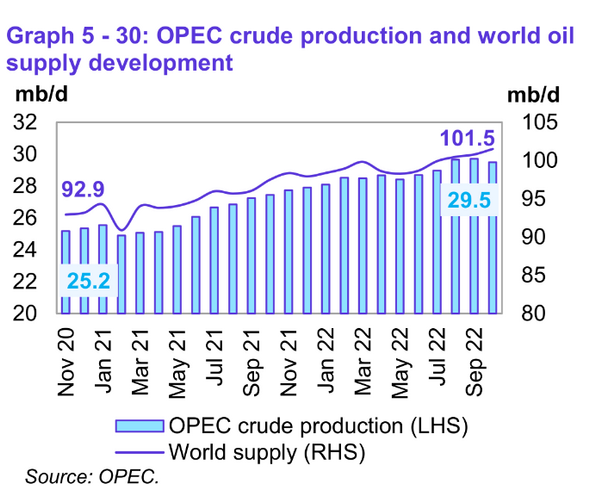
World Oil Suppy (including NGL) was 101.5 Mb/d in October 2022, 8.6 Mb/d higher than output in November 2020, about half of this increase was due to the 4.3 Mb/d increase in OPEC crude oil output from 25.2 to 29.5 Mb/d over the same 23 month period.
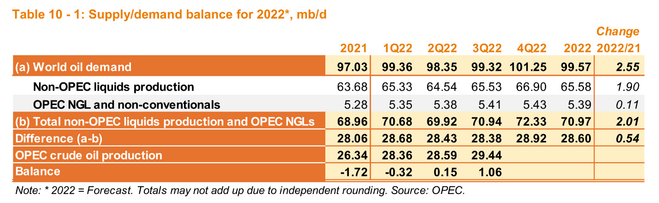
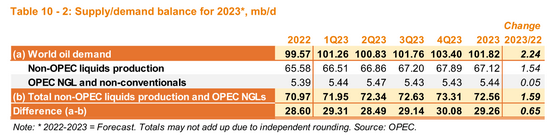
The demand estimate for 2022 was revised from 99.67 Mb/d last month to 99.57 Mb/d this month and 20224Q demand was revised lower by 390 kb/d, with the call on OPEC falling to 28.92 Mb/d for the fourth quarter of 2022, with October output at 29.49 Mb/d, it is clear why OPEC believes that a reduction in OPEC output is necessary. In 2023 the World oil demand forecast was reduced by 200 kb/d from last month’s OPEC report and the call on OPEC remains below the October 2022 output level until the fourth quarter of 2023, with the average level for the year being 230 kb/d below the October output level.
Note also that in the recent Oil Market Report from the IEA demand growth in 2022 is expected to be only 2.1 Mb/d and 1.6 Mb/d in 2023 vs OPEC’s estimate of 2.55 Mb/d in 2022 and 2.24 Mb/d in 2023. If the demand estimates by the IEA are correct, this suggests that OPEC cuts may need to 640 kb/d larger, if the OPEC estimates for non-OPEC supply are accurate.
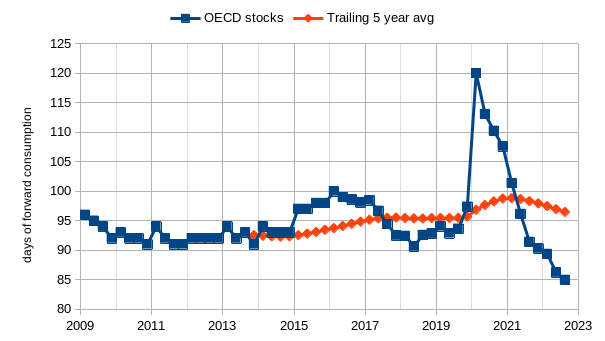
OECD total stocks, including both SPR and commercial stocks have fallen even lower than last month’s estimate to 85 days of forward consumption (last month we were at 87 days). Perhaps stocks will build in the fourth quarter of 2022 and in 2023 as the likely recession may reduce demand for oil. If not, we should expect oil prices to increase.
Based on BP data on NGL output and the recent trend in natural gas output and the barrels of NGL produced per MCF of natural gas production recently, I estimate that the peak for the APS scenario in 2024 corresponds with World C+C output of about 84.5 Mb/d. I did not try to estimate for the STEPS scenario as it does not seem realistic, likewise I am skeptical that the NZE scenario can be achieved, but hope I will be wrong. Something roughly midway between the APS and NZE scenarios might be achievable in my opinion.
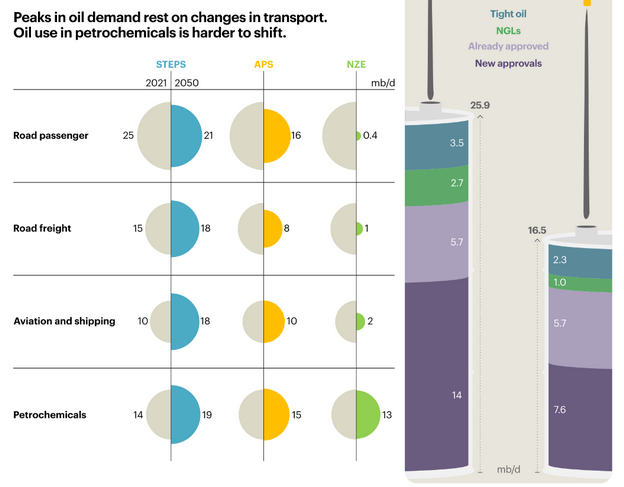
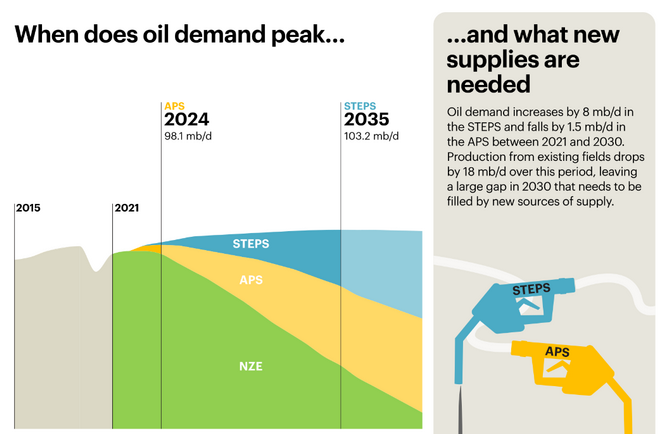
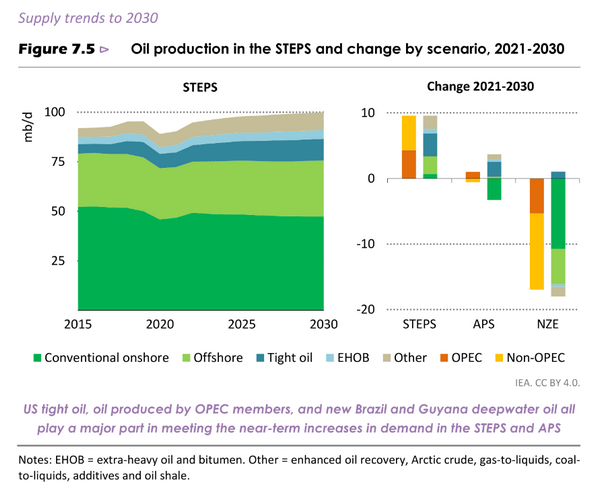
About 26 Mb/d of new oil output is needed between 2021 and 2031 (see right side of figure 8) and in figure 9 on the right side it shows how this supply gap will be filled for the STEPS and APS scenarios. On the left side of figure 9 it shows how demand is expected to change in various sectors from 2021 to 2050 for the 3 scenarios.
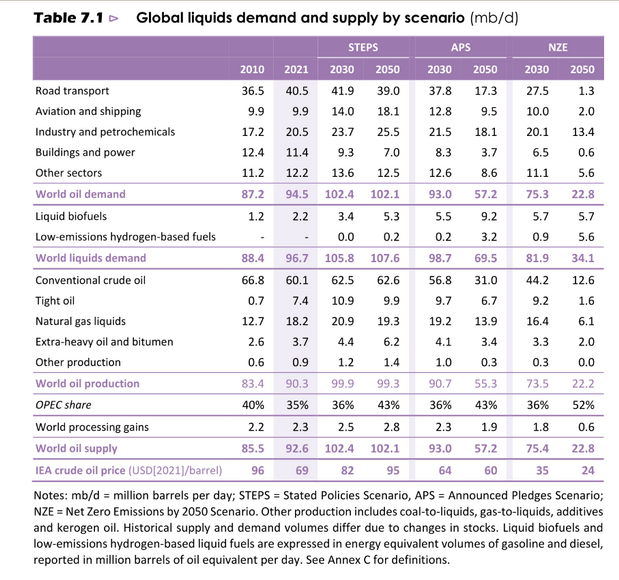
Demand and supply for oil for the 3 scenarios is covered in figure 10 above.
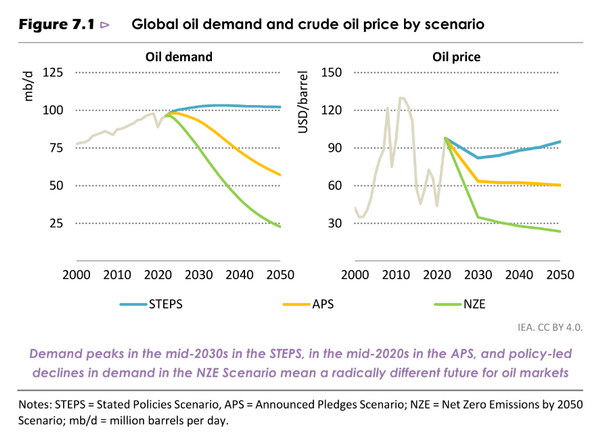
Oil demand in figure 10 includes NGL, at the peaks C+C output would be roughly 14% lower. Note the difference in oil prices in the three scenarios in the right panel of figure 11.
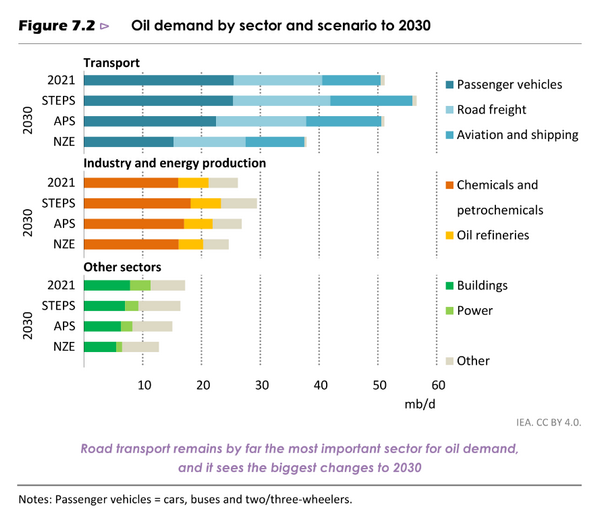
Note that by 2030 only the NZE scenario has a significant change in oil demand in the transport and Industry and energy sectors relative to 2021, there is a slight decrease in oild demand in the “Other Sectors” demand in both STEPS and APS, with the highesr reductions in the NZE.
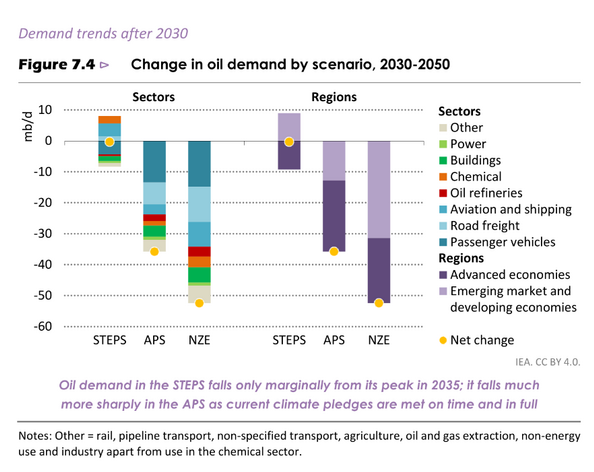
Chart above focuses on changes from 2030 to 2050 where the previous 2 charts looked at changes from 2021 to 2030.
The panel on the right looks at changes for the 3 scenarios from 2021 to 2030.
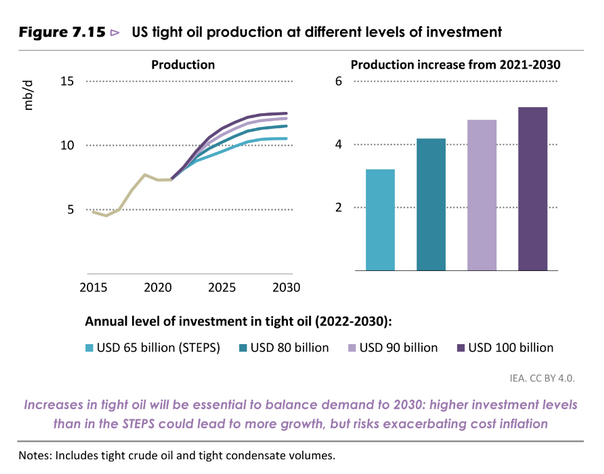
My best guess scenario has US tight oil output at 10.7 Mb/d in 2028, between the two lowest scenarios shown in Figure 16 above with the difference that my scenario has output decreasing to under 10 Mb/d by 2030.
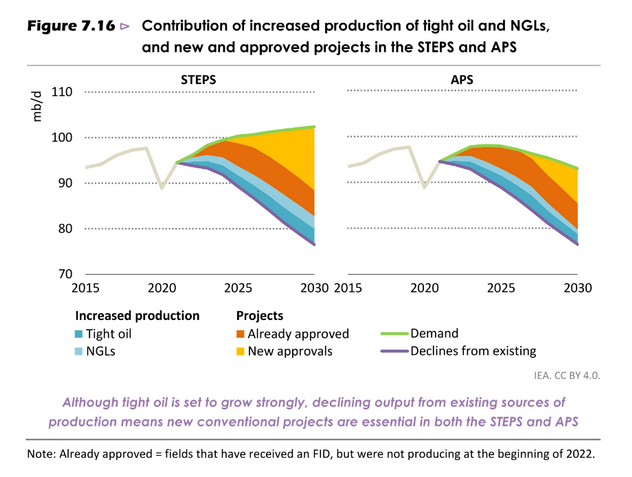
To me the APS scenario with no new approvals looks reasonable, that would put 2030 output at about 73 Mb/d for C+C (85*.86=73 Mb/d). Between 2030 and 2040 I expect demand for oil may be falling eevn more rapidly and the decline curve may steepen.
239 responses to “OPEC Update, November 17, 2022”
Earlier today oil futures for DEC 22 and JAN 23 slipped 6 cents into contango. Now think about how tight supply is right now.
Just another sign inflation isn’t what we should be worried about.
HHH
That is just a one day event. The WTI contract flips on Monday. Once January becomes the front month, it will be back into full backwardation.
There appears to be a discrepancy of roughly two million barrels per day in the production/consumption data between Table 10.1 and Fig. 7.
Am I missing something?
Old Chemist,
The difference is biofuels and liquid hydrogen. Look at the oil demand and oil supply rows in table 10 and the numbers match.
Fig 7 is oil only, biofuels and hydrogen are excluded.
Dennis
Sorry, I did not explain my question very well. From table 10.1 the 3Q balance is 1.06 million barrels per day of total liquids surplus over consumption, which should lead to an increase in liquids inventory of close to 100 million barrels, but in figure 7 oil inventory decreased by roughly 4 days of consumption which is roughly 90 million barrels. There is surely no storage capacity for that quantity of biofuels and hydrogen, nor any commercial incentive to do so. It is that two million barrel per day gap that has me puzzled.
Old Chemist,
Sorry I misunderstood your question.
The chart with OECD stocks in days of forward consumption only covers OECD. Unfortunately we do not have good data for World petroleum stocks.
You are absolutely correct that if OPEC estimates for World Supply and Demand are accurate for 2022Q3, then World oil stocks would have increased. If we assume OPEC estimates for oil production and consumption are correct and that the OECD stock estimates are also accurate, then this would suggest that non-OECD stocks increased in 2020Q3.
Old Chemist,
A correction to my second comment from 11/20 (2:35 pm USET). I missed oil on water as outlined below. World petroleum stocks increased in the third quarter of 2022, this explans both the fall in oil prices and OPEC’s decision to reduce oil output.
If we look at total barrels rather than days of forward consumption it is easier to make a comparison. OECD total stocks decreased by only 7 million barrels from 2022Q2 to 2022Q3, but oil on water (in transit on tanker ships) increased by 96 million barrels so we have a net stock increase of 89 million barrels in the third quarter of 2022. This matches fairly closely to the OPEC estimate for supply and demand changes from the second to the third quarter of 2022 of about 97 million barrels, the 8 million barrel difference may be due to an increase of 8 million barrels in non-OECD petroleum stocks which are less transparent. This assumes the OPEC estimates for third quarter 2022 World supply and demand for petroleum are accurate.
PeterEV posted a link from ExxonMobil and stated:
According to Exxon Mobil, we will be peaking in **world** crude oil production around the year **2032 ** (was 2040 for many years prior to this). The link:
Energy supply
He was mistaken. Peal oil supply was not mentioned in the text but there was a graph titled:
Liquids supply highlights the need for investment
Global liquids supply by type – million oil-equivalent barrels per day
The chart clearly showed that C+C peaked in 2018. That is conventional crude, plus deepwater, oil sands, and tight oil.
“Liquids supply highlights the need for investment …” – says the company which has committed thirty billion dollars over 2022 and 2023 to share buy backs (enough to add about 500 kbpd if the sort of projects from the 2013 bonkers period were still available, but they aren’t because discoveries have virtually disappeared, but that is never acknowledged, and never will be, in any of these glossy future scenario brochures from the majors.
Ron, looks like a honest graph till present, then the lines are getting straightened and the volumes are blown up. Especially – but not only – conventional oil will diminish much faster. So again, the peak took place exactly four years ago. We are watching in real time how societies are working their way out of this mess. And it’s not a nice exhibition of reason and common sense.
true
‘philosophers have only interpreted the world, in various ways; the point, however, is to change it’.
-Friedrich Engels
The rest of that shit above “tight oil” ain’t even oil, amirite?
Yes, and condensate is combined with crude under tight oil, and you can’t sell that stuff as oil either.
I think this chart should shock everyone. Just look at the slope of the chart below tight oil. That slope peaked around 2016 and will never get anywhere near that 2016 point again. However the chart also shows tight oil holding at about 10 million barrels per day until 2050 without any decline whatsoever. In fact nothing declines after about 2024 except conventional oil. And NGLs and biofuels both increase. Is that reasonable? We will turn all that food producing land into fuel producing land. And we just hit 8 billion population this month.
Ron
Below is an attempt to get an estimate of the decline shown by XOM for conventional crude plus condensate. On the attached chart, a red line has been placed over the post pandemic decline period. Note that I have chosen the post pandemic period to estimate the decline rate since there is a step drop in production in the order 2 Mb/d to 4 Mb/d between the pre and post pandemic periods due to damaged wells.
The red line in the attached chart shows a steady decline from 2022 to 2050. Production in 2022 is close to 60 Mb/d and in 2050, 50 Mb/d. A 10 Mb/d drop over 28 yrs or 0.357 Mb/d/yr. This is smaller than the 0.5 Mb/d/yr to 0.7 Mb/d/yr when using EIA data.
It is also much smaller that the 7% decline rate XOM mentions in the article.
“The natural decline rate of existing oil production is 7% per year. Significant investment is needed to offset this decline and meet the projected demand growth.”
Assume that the 7% applies to fields that are past peak. If half are past peak, 40 Mb/d, that means decline is 2.8 Mb/d in these fields. With the red line showing decline of 0.357 Mb/d, that implies that “significant investments” noted by XOM are needed to find/add at least 2.5 Mb/d/yr to stay on the low decline rate of 0.357 Mb/d.
The blue line tries to pick off the Post Pandemic peak for C plus C where it intersects the tight oil contribution and is lower than the November 2018 peak. It is in the 2032 to 2033 period.
The chart indicates that XOM thinks that all liquids will peak around 2035 due to growth in NGLs, excluding biofuels.
I tried to upload a small graph (jpeg) but it didn’t work. Can anybody give me a hint?
Westtexasfanclub,
save file as a jpg or gif and reduce the size to less than 60 kB.
Thank you Dennis, I gave it much more compression. I also “compressed” the graph from 2022 to 2050 about 10%, nothing scientific, just by gut feeling. But we know theses predictions are mostly on the rosy side of the probabilities, and now it looks a bit more realistic to me. Just my 2 cents …
Wes, a gif can be posted when the same-size jpeg cannot. Gifs use less than half the data of a jpeg, so therefore you can often post a graph or anything else as a gif when you cannot post it as a jpeg.
Westtexssfanclub,
I agree the Exxon scenario and the STEPS scenario from the EIA are not realistic, I think APS is pretty good, but I think it may be lower if good policy is adopted to reduce demand.
This is a similar graph but published in 2016:
Nov 17 (Reuters) – The Organization of the Petroleum Exporting Countries (OPEC) is “back in the driver’s seat” as the top swing producer amid slowing U.S. shale growth, Hess Corp (HES.N) Chief Executive Officer John Hess said on Thursday at an investor conference in Miami, Florida.
https://www.reuters.com/business/energy/hess-ceo-says-opec-back-drivers-seat-us-shale-growth-slows-2022-11-17/
Ron, I am afraid solar panels are already competing with corn and soybeans.
I’m stunned there is almost zero planning as to where all the solar panels will be installed. I have seen solar farms covering the most highly productive soils in Indiana, Illinois and Iowa.
These solar landmen offer a ton of dough. It’s more Wild West than leasing shale, I bet I have received offers from over 20 different companies. Many with Washington DC addresses.
“I’m stunned there is almost zero planning as to where all the solar panels will be installed.”
I agree. It is similar to how all other industrial uses of land goes- money over ecology, so maybe it shouldn’t be too surprising.
On the other hand, not too many people seems concerned about corn ethanol landuse. Roughly 30 million acres of prime farmland is diverted to ethanol production with a very poor net energy yield/acre. Solar on 1/140th as much of marginal lands (sparse grazing) could yield the same amount of net transport energy/yr.
According to SHift Project, the peak of gas production will be around 2030. This graph is also irrelevant for this.
another chart from exxon
The space in the gap reads: “New oil supply required to meet global needs”. Hell, no one could possibly argue with that. In fact my guess would be we would need a lot more than that. It all depends on world economic expansion and the progress of renewables.
But what we will need says nothing about what we will get. That is another story altogether. 😫
Dennis
Using 92 Mb/d in 2021 and 15 Mb/d in 2050, gives close to 6% annual decline rate. A slightly lower rate than stated by XOM above. Maybe the numbers I guesstimated are wrong.
Ovi,
I cannot find the data behind the charts,
Often it is difficult to estimate from the charts accurately.
Dennis
I agree. I just made a rough guess at the numbers to see how close it was to 7%.
To meet that sort of development pattern would require about 600 to 700Gb of new production coming on line. Last year we discovered just over 3Gb. This year has been better but a linear trend of discoveries over the last ten years reaches zero before 2030. This year has also been just about the worst ever for lease sale uptake.
George,
Based on data from Laherrere there are 800 Gb or so of TRR, his estimates tend to be conservative and there may be some reserve appreciation, if oil prices are high and as resources are developed. I doubt demand will be high enough to support the Exxon scenario.
That Exxon projection jives with the observations/prediction that Ron has been making for the past years regarding peak oil production.
What may be very surprising to most is just how long and thick that tail of liquid fuel production potential is.
I have no idea what is underground, but that shallow decline rate for global liquids production
is pretty shocking. My ‘belief’ is that is it wildly optimist, but belief isn’t worth a dime.
For one thing- this graph of supply means a huge amount of carbon still to be injected into the atmosphere.
Secondly- the yellow segment of Biofuels is an utter shitshow for the environment and habitat.
Hello Ron,
I just responded to your comment from the other post with this
Hi Ron,
I agree but 2018 & 2019 are past and there is an increasing amount of supply according to Exxon although less than the 2018 & 2019 period. Since we have “survived” that peak so far, I’m focusing on the 2032 secondary peak. After 2032, I appears it’s all downhill and appears to be “permanent” with no tertiary peak insight .
I’m wondering how the electrification of transportation will affect the curve due to the uptake?
We also have about a third of the world’s oil shale where a third of that is supposedly recoverable but needs a lot of water. Will we build pipelines from the Missouri river and/ or Great Lakes to the western Colorado and Utah areas? or will we have enough EVs not to worry about it. Somewhat like OFM, this takes sharper pencils and calculators than I have.
***
With that, Ovi’s presentation details a lot of the underlying dynamics. Very good job!!!
By 2030 there will be another 700 million people on the planet. Double the population of the United States.
With only 7 years to go, how many electric and hydrogen trucks are being made?
Those 700 hundred million more people will need food, clothing and fridges delivered just like Americans expect.
This year an additional 20 million diesel and petrol vehicle are driving in the world and who knows how many more motor boats ships and planes.
700 hundred million people will want their share and will strive for it.
China now uses half the coal in the world 15 million barrels of oil and ever increasing gas.
In order for these 700 million people to have the same electricity as Americans the equivalent of all U.S. wind power would need to be built every 6 months. If they drove electric cars and there were electric trucks just for those 700 million then that would need to be done every 3 months.
People simply do not understand the scale of the problem
Americans consume about twice as much energy per capita as EU countries without having a higher standard of living.
Depending on how you view it, it might actually be quite a bit lower, on average at least…
Part of living standard is home size and many people want to live in larger homes. That is why we have over 100,000 extensions built in U.K each year. Which take more energy to heat.
I am not sure that the population will keep on growing at this rate. Several factors are going to slow this : the impact of the increasing number of droughts/floodings in the world with the climatic change; the decrease of oil, gas and coal supply. We are post peak for oil production; we are in the middle of the coal peak production (every categories) and the peak of gas production should be in 2030. We are going to be in a swamp of economic stagnation which will not be favorable for birth, including the third world countries.
Population growth is falling by About half a percent per year, only 80 million more people this year.
Even if they used half the electricity that Americans use all the installed wind production in Europe would have to be built each year just to meet population growth. This assumes all electric transport to prevent 2.5c warming.
There have been terrible famines poverty in the past, which did not stop global population increasing from 1 to 2 billion etc
The ghost of Joseph Goebbels. Repeat a lie often enough. “Increasing floods and droughts due to climate change “. The truth. Output per acre of all, I repeat, all food stuffs has grown steadily over the last 20 years world wide. India has had 5 record harvests the last five years. Sorry to say but your not going to get what you wish for.
A more careful analysis of the data yields definite limits to growth in food production:
https://theproudholobionts.substack.com/p/a-limit-to-growth-in-food-production?utm_medium=email&utm_campaign=cta&utm_source=substack
Industrial food production has probably peaked:
https://theproudholobionts.blogspot.com/2022/07/why-agroecology-is-future-of-food.html
Charles, in 2030 there will be much less cars produced than today. The number of electric and hydrogen trucks will be very small, and most of them will be produced in China.
Transportation will rely mostly on cars produced before 2030, powered by ICEs.
My extrapolation of car production numbers reach zero about 2035.
Berndt
I do not see why car production should go to zero. However once oil production starts to fall in a few years then there simply will not be enough fuel for all the vehicles. Many people will start to drive less but eventually there simply will not be the diesel and petrol for cars no matter what price.
Governments will probably prioritize ships, planes and trucks to ensure global trade in goods continues.
Because the global population increase wind and solar, after 20 years of investment is still only 5% of total energy used.
Demand for gas and LNG is already very high and the likes of China and India will need much more. The global LNG trade is increasing which means gas will go to the highest bidder.
https://www.eia.gov/todayinenergy/detail.php?id=52139
Every country are either using more or in serious decline
http://www.geni.org/globalenergy/library/energy-issues/saudi%20arabia/index.shtml
As oil production falls, those who can afford to will buy electric cars. However they will be competing with homes and businesses to charge their cars.
It will be an interesting decade
Will there soon be a blog site called Peak gas tank? According to French think tank The Shift Project, the peak of gas production should be around 2030. They will make a webinar about this December 6. https://theshiftproject.org/article/invitation-rapport-gaz-2022/
Thanks for all that info Dennis.
There is much confusion regarding the term Demand.
Up to the current day it actually means Consumption.
I don’t know how the poor choice of terminology came into common use.
Consumption level of petroleum products reflects various factors including status of the economy, supplies available, end user behavior, population size and prosperity. and a new factor is just starting to come to play- EV replacement of ICE vehicles.
When we look at these future projections- there is no distinction made between product available for purchase vs product desired for purchase.
Demand is the amount of a product consumers are willing to buy at a given price. That’s the economic textbook definition. It is not a constant value. Demand rises when the price falls and falls when the prices rises.
Alim- yes that is the economic definition, but that is not how the term is used in the oil supply/consumption context.
That point seems hard for people to grasp.
As I write this comment it’s 4 degrees Fahrenheit in Thunder Bay, Canada. Those 100,000 people’s demand for fossil fuels is a mater of life or death. And it’s only November.
“fossil fuels is a mater of life or death…”
So, what will people in these cold winter areas areas do when fossil fuels no longer are available or affordable to import to their region?
After the lignin box cars sit empty in the rail yards, they will go back to wood.
All out.
With todays population levels it will take less than a decade to strip the north woods bare.
A terminal deforestation event.
I dunno, insulate their homes maybe?
Well, people lived there for many thousands of years without oil—
Our limited view, and declining genetic fitness, has repercussions.
Well, people lived there for many thousands of years without oil—
Eight billion people most certainly did not live anywhere for thousands of years without oil.
Yep, over 200,000 years, our population was 1-5 million, with a near ET 65,000 ago.
We don’t have the ecosystem health for those levels now.
Hickory,
You’re welcome.
These projections assume that supply and demand will be balanced at the projected oil price level. Note the figure that shows oil prices for the 3 scenarios along with C plus C plus NGL output for each of the scenarios, figure 11 in the post( IEA figure 7.1).
I think there is a big disconnect on this aspect.
The charts of predicted production look far too high for the given price levels expected in that Fig 11,
as I see it.
I think it will take considerably higher pricing to get that level of production, with either the steps or aps projections.
https://www.youtube.com/watch?v=DcxPB_kekn8
Peter Zeihan is bullish on Houston. 2 minutes and oil focused.
Recharging a Tesla in Kyiv
Recharging a Tesla in Kyiv
Sums up our current situation to a tee
If he has to recharge using a generator, it’s likely the gasoline stations are without power too.
Dennis
Thanks for the IEA outlooks charts.
I don’t get STEPS in Figure 11. Is STEPS BAU since demand stays steady at above 100 Mb/d and the price of WTI rises after 2030.
In APS, It appears the world is at peak demand/consumption now and drops going forward. Also the oil price is falling out to 2030. Is this because supply exceeds demand and prices drop trying to increase demand?
Ovi,
You’re welcome.
Prices drop because of too much supply at STEPS scenario oil prices. Prices drop to balance market, reducing output and increasing consumption relative to higher oil prices, essentially a chabge in policies reduces demand in APS and a different set of policies for the NZE scenario reduces demand by mre than the APS.
STEPS is more or less BAU, the World peak for C plus C is 2024 for APS about 1 Mbpd above 2018. I doubt that is realistic as 2022 will probably be about 80 Mbpd for annual average C plus C and that would require a 2 Mbpd increase for 2023 and 2024. A more realistic scenario in my opinion is for oil output to reach between 83 an 84 Mbpd by 2027/2028, CTMA peak in Jan 2028.
A rough summary of the WEO 2022 oil price scenarios after 2030 is
$90/b for STEPS
$60/b for APS
$30/b for NZE
NZE is not even worthy of a comment by a reasoned intelligent person.
Ervin,
NZE is aspirational to limit damage from climate change.
Intelligent people think this is the best of the three scenarios, though it will be difficult and perhaps impossible to achieve.
See Great transformation by Tony Seba on You Tube.
Many think his projections are absurd, but some of his projections from 2014 have proven fairly accurate.
Time will tell if his current projections are as good as those in 2014.
Dennis wrote: I doubt that is realistic as 2022 will probably be about 80 Mbpd for annual average C plus C and that would require a 2 Mbpd increase for 2023 and 2024.
Okay, so a 2 million bp/d increase would be required for 2023 and 2024. But what is your prediction for the world average of C+C for 2023 and 2024? Will that requirement be met? If not, how close will the average come to that requirement?
Remember, I am predicting a decline in world C+C production in 2023 compared to 2022.
Ron,
Just saying that in order for the APS to be correct the average increase in oil output would need to be 2 Mb/d, if my guess of 80 Mbpd for 2022 is correct.
I believe I said 83 to 84 Mbpd by Jan 2028.
So 2024 might be 81.3 Mbpd with average annual increases at about 636 kbpd in World C PLUS C up to Jan 2028. This is folled by decline in output as demand falls below supply and oil prices start to fall in 2028.
Dennis
So you have changed your mind again? Now you think global demand will start falling before geological Peak Oil?
In other words, you think the extra 400 million people on the planet in 2028 will effectivley use no oil.
Looking around my house and office, the computers are made of plastic, the double glazing is made of plastic, TV, carpets etc. All the food grown for the 400 million extra people will need fertilizers and pesticides. Only diesel tractors and combines can work all day to plant and harvest all that food.
How much more shipping will we need and only a diesel truck can drive 500 miles and take 5 minutes to fill up. Anything else would add hugh costs which people already cannot afford.
Charles,
The parts of the World with growing population tend to use less oil per capita, the areas with higher oil use are using less oil.
Yes I have changed my mind. When I see new evidence I adjust my expectations. I have gradually come to the conclusion that the progress in replacing oil used for land transport might lead to demand falling faster than the supply of oil. I do not think it will happen as fast as the APS scenario, but I also do not believe that supply will grow as fast as predicted by the IEA in the STEPS or APS scenarios.
Note that the fall is output predicted in the scenario below is due to lack of oil demand as the World shifts to other forms of energy for land transport (including both private and public transport). Oil price start to fall by 2029 due to demand growing less than supply at 2028 oil prices.
There will be plenty of oil for farms and plastic. Note that the main petroleum input to plastic is ethane and propane (these ar part of the NGL stream) which mostly is associated with natural gas production.
Click on chart for larger view
Dennis-
that updated projection, which reflects a combination of supply and consumption factors, looks entirely reasonable.
I applaud your continual search for reality, rather than being one who is stuck in their preconceived mire.
I take no sides on whether peak global production was a few years ago or a few from now, since I can’t see underground or predict the behavior of nations. Regardless of that small point, the big point on this remains the arrival of peak plateau by around 2015. We are there. The clock is ticking on making the big adjustment.
Hickory,
Thanks, yes it is roughly a plateau from 2013 to 2031 with output between 76 Mb/d and 83.5 Mb/d and average World C plus C output over those years of 80.8 Mb/d (if my scenario is correct and that is highly unlikely).
I agree the World recognizing this and adjusting policy goals to reflect this reality is the important point. Whether the peak was in 2018 or some future year (2027 in my most recent scenario) will be of little consequence.
Putin’s war sabotages Russia’s energy future Bold mine
Russia’s share of internationally traded energy is projected to decline more than 7% over the coming decade, thanks to economic shifts resulting from Russia’s war against Ukraine.
In a recent report, the International Energy Agency (IEA) says that Russia’s war sparked a global energy crisis that will significantly reduce Russia’s own future energy exports.
“Russia has been by far the world’s largest exporter of fossil fuels, but its invasion of Ukraine is prompting a wholesale reorientation of global energy trade, leaving it with a much-diminished position,” IEA says in an October 27 statement announcing the release of its report, World Energy Outlook 2022 (PDF, 13MB).
“Russia’s share of internationally traded energy, which stood at close to 20% in 2021, falls to 13% in 2030,” the IEA statement adds.
In its 2022 outlook, IEA projects Russia’s oil production in 2025 will be 2 million barrels per day lower than in its 2021 outlook, issued prior to Russia’s full-scale invasion of Ukraine. That’s a 17% drop in projected production from 11.45 million barrels per day to 9.46 million barrels per day.
Meanwhile, Russia’s projected natural gas production for 2025 is 23% lower in the IEA’s 2022 outlook than in its 2021 report, with projected production levels dropping 200 billion cubic meters, from 859 billion cubic meters to 656 billion cubic meters.
The IEA also estimates that by 2030, Russia’s share of internationally traded oil and gas will have fallen by half compared to 2021 levels. “Russian fossil fuel exports never return — in any of our scenarios — to the levels seen in 2021,” the report adds.
Russia’s oil exports never return because their oil production never returns to 2021 levels.
Russian C+C 2021 production was 10,275,000 bpd according to the EIA and 10,514,000 according to the Russian Minister of Energy. The levels cited above by the IEA are obviously total liquids. A 2 million barrel per day drop in C+C production would put Russian C+C production at from 8.25 to 8.5 million barrels per day.
Ron,
I guess we can pick and choose which IEA projections to believe. The Oxford Institute for Energy Studies has a different projection for Russian output.
https://www.oxfordenergy.org/publication-topic/oil-monthly/
OIES expects Russian Output in 2022 to average 10.67 Mbpd in 2022and fall to 9.83 Mbpd in 2023. Not sure what their long term forecast is, much depends on the state of future oil sanctions.
The Last Time This Happened
In December 1991, the Soviet Union collapsed. At the time, Russia, less the rest of its empire, was producing about 8.3 million barrels per day. But a lot started happening; their production began to decline. In the following six years, Russian oil production dropped by over 2.5 million barrels per day. It took them another eight years to fully recover. That was twelve years from the day all their foreign expertise pulled out to recover fully.
To anyone who believes that if the war ends soon and sanctions are lifted, Russia will go right back to producing as much as before, then you are badly mistaken.
Ron,
The transition from socialism to capitalism takes time. The situation is not comparable to today.
Of course, it’s comparable to today. The political system had very little to do with it. Russia, under socialism, treated the oil fields just like a capitalist would have done.
The repair of the Russian oil system will take at least a decade. The destruction has only begun. That will take at least half a decade. You will see, at first, a sharp decline because of sanctions. Then there will be a further slow decline due to the lack of imports of spare parts as well as a lack of Russian expertise in the oil patch.
Ron,
You seem to think there was a seamless transition from the Soviet Union to the current state of affairs.
I think you need to review the history, maybe a historian can comment. There was a large degree of social turmoil and corruption that occurred in the 1990s in Russia.
I disagree that the situations are even remotely comparable.
https://en.m.wikipedia.org/wiki/History_of_Russia_(1991–present)
There was a large degree of social turmoil and corruption that occurred in the 1990s in Russia.
What we are talking about, Dennis is turmoil that could affect oil production. And just what do you think is happening right now in Russia? You seem to think that the major oil companies and oil service companies all leaving will have no effect on oil production. And Russian oil field workers are leaving as fast as they can. And many of the ones that are staying are being conscripted into the army. And of the few that are staying, food and supply shortages are deeply affecting their lives.
But I do agree with you on your last point: The situation today is not comparable to what happened in 1992; it is far worse.
We can’t have it both ways. The name of this place is Peak Oil, which most people seem to think has already hit and we’re now experiencing a decline in global oil. Ad infinitum we have heard testimonials about the misery in Europe. Fertilizer is scarce. Electricity to modulate temperature extremes is expensive. In America, diesel is in short supply, the SPR has been tapped.
If and when the time comes when we are truly going over the Seneca Cliff that the Italian think tank came up with, it won’t make a damn where the energy comes from, there will be a market for it. At that point the pressure will be on Exxon to send its crack engineers back to Sakhalin Island. The Europeans will be quick to forgive and forget Putin’s treachery.
After all, because of the U.S. administration’s quest for cheap and abundant oil, it has been decided that Mohamed bin Salmon cannot be held accountable for the atrocious murder of Jamal Khasshogi. This is only one murder, not hundreds as in Ukraine, but still, the analogy is obvious.
Neither you nor I can say it out loud without a beef-fed, steroid-pumped meathead in a lifted, quad cab, dually diesel pickup yelling at us but we know we’re mostly wasting a one time bonanza of the most useful substance ever discovered by humans. Well, clay might come close.
Many of us are going to miss the worst of the Seneca cliff (I’m around your age and just bought your book) but good goddamn, I’d like to give the kids some hope. The ones that survive, I mean. Almost certainly, billions of them won’t but millions might. Have you ever looked at Devon cob dwellings on the English coast? Some have withstood North Sea gales for 600 years. They’re small but constitute a large thermal mass that tends to retain heat unlike a stick frame house with fiberglass insulation.
Nothing close to a solution, I know. Just something I’m interested in. For the kids.
Teholder, much is going on with cob and I will post this here even though it’s not oil related, please excuse me. New international residential codes were approved for cob in 2021 (www.cobcode.org). I am a general contractor building inspected cob homes in North Carolina, feel free to reach me through my website and I can get you up to speed on this topic if you want to learn more as I agree building with local clay has vast potential for affordable energy efficient housing for much of the worlds population. (www.kthonik.com)
GERRY MADDOUX,
Just for grins, here’s the link to your (I think) book which I just bought because I think so highly of your comments here and am of the age to possibly benefit from it: https://www.amazon.com/gp/product/0978543653/
I think I’ll pick up MikeB’s book while I’m at it: https://www.amazon.com/gp/product/1736009885/
This is not related to your comment but I wonder why there is no “REPLY” button under the comment of STEPHEN HREN. I’d like to thank him for the link to his website and will be contacting him regarding Piedmont cob.
I slept in and worked on cob dwellings in Oregon and they were magical for the short time I spent in them, extremely thrifty, heated with only sticks burned in a rocket stove. I don’t know about long term comfort or suitability for climates colder than the Willamette Valley in OR.
The Russian fields were badly run under communism, which meant there was a big margin for improvement when the western service companies moved in (e.g. in many cases as easy a decision as adding water flood). That opportunity is not there now, the fields had been optimised as much as possible and appeared to have entered decline. That decline is still ongoing, even if it is masked by the cut backs due to sanctions. In fact it is almost certainly accelerating without western expertise, equipment and software, and as the Russian engineers are conscripted (and I’d expect have a fairly short life expectancy if they are sent to the front), or try to leave the country as soon as possible. This year that were no lease sales in Russia after several years in which it had the largest single leased acreage, presumably much of it to western IOCs and therefore now void. If the sanctions last long enough the decline will eventually catch up and there will be small chance of recovering any lost production, the best may be just to be able to balance the decline with new developments on some plateau, at a lower level than the recent peak, and all that is likely to depend on how quickly and how well the Yamal deposits can be developed. Ukrainian sabotage, permafrost melt and the exponential growth in wild fires may also have negative impacts that are difficult to foresee at the moment..
Thanks, George. I am glad someone else on this blog understands Russia’s current problem. If Putin had any idea of the problems he would cause when he invaded Ukraine, he would never have done it. But now he is in a real pickle. He is too proud to back down and too weak to finish the job.
And the whole world will suffer. It is not just the oil that the world will lose but also the food produced in both Ukraine and Russia. I have seen many predictions of famine in Africa and possibly many Asian nations.
“If Putin had any idea of the problems he would cause when he invaded Ukraine, he would never have done it ”
Certainly. Russia would have been much better off just riding the global fossil fuel dependency for another decade or two. But Putin wanted to begin the restoration of the Empire for the sake of his personal legacy.
Huge mistake for the nation.
Careful when you vote- for those who favor the drift toward autocracy folks.
As economic growth reverses, oil decline really sets in, climate change accelerates and the bright green revolution is shown up to be a rather sickly chartreuse (https://go.ind.media/webmail/546932/1196565636/37fe2e51f16e0e16c33bd2ffc0eceb1409604fabfbd15f982c8092685091087a), a lot of world leaders are going to be seen to be making horrendous mistakes or shown up for their true incompetent, venal selves – look at the endless “worst PM ever” kakistocracies we have in the UK. Thatcher is much lauded but she just got lucky (or unlucky for the rest of us as she and Reagan stuck us with neo-liberal economics, financialisation of everything etc.). She had the benefit of: the take off of North Sea oil and gas; a very high and rising ratio of tax payers to dependents as the baby boomers were moving from education to earning, women increasingly entered the workplace and the few new retirees were from a small cohort born, and often quickly killed off, during WWI through the early twenties; the early effects of the technology revolution; and at the end maybe the beginning of the influx of dodgy money from Russia and elsewhere as London became the world’s money laundering centre – though it didn’t help her much, more so Blair. If she was around now she’d be floundering as much as the rest of them.
George- I had come across that linked article before seeing your post, and had thought of you when I read it.
If I understand your perspective- I think they cover it well. Yes?
Near the end they say the following. Not sure if you agree with this point.
” In essence, we need renewables for a controlled soft landing. But the harsh reality is that, for now, and in the foreseeable future, the energy transition is not going well and has poor overall prospects.”
I find this viewpoint has a lot to take seriously. Unfortunately… and there are no other good or better options.
Another path to the same article. Worth the read for the sake of digesting reality.
https://www.resilience.org/stories/2022-11-22/the-renewable-energy-transition-is-failing/
We need renewables for a soft landing but we don’t have enough to even maintain our present growth rate as our infrastructure decays away, assuming adequate fossil fuels continue to provide the necessary energy, therefore we are not going to have a soft landing. We don’t have enough resources in the ground and we certainly don’t have enough mines or processing plants, or the time to build them. We are not just short by a bit, it is orders of magnitudes for some metals. And this is just to build out the first generation replacement power generation for fossil fuels. The ERoI of renewables is not enough to allow us to live even close to our present standard and we are not going to collectively accept that, so violence is inevitable.
However, a soft landing actually requires much more, in particular raising the world’s poor to middle class status so they, in theory, have fewer children and consume less, and building out from scratch the largest industry ever seen to remove carbon dioxide from the air. We are heading for three degrees warming and I think that is incompatible with a steady supply of cereals at scale, which means without removing the CO2 there is no civilisation in the long run.
All this is supposed to happen while we are running out of water, soil and fish; poisoning every living thing with everlasting plastics, acidifying the oceans, killing ever larger parts of the oceans and lakes with fertiliser run off and wiping out most of the ecosystems on which we almost certainly rely but in ways we barely understand (and probably never will before they are gone). Presumably a soft landing also implies building out some kind of technology to cover for all those losses too, and hence a whole extra pile of minerals and renewable energy suppliers are required.
The secular millennialist eschatology that we all have an awakening and start helping each either isn’t going to happen. We are going to be at each others throats as soon (i.e. it’s already happened) as we think someones getting something that should be ours. In times of growth we could accommodate psychopaths, sociopaths and malignant narcissists; during contraction they are going to take a horrendous toll and further hinder any hope of ameliorating climate change, resource depletion or any of the other planetary boundaries that have been, or soon will be, exceeded.
Thank you for your commentary George.
Very few could say so much in so few words.
How much military spending will it take to protect each grid substation, transformer bank, water pumping station and grain terminal? Ask Ukraine for a rough estimate.
Saudi Arabia cuts oil exports 6% in month
“Saudi Arabia cut oil exports sharply this month as the kingdom delivers on an OPEC agreement to shore up global crude markets.
Saudi shipments were down about 430,000 barrels a day, or roughly 6%, by mid-November compared with the previous month, according to data from energy analytics firm Kpler Ltd. An even bigger slump of 676,000 barrels a day was observed by another consultant, Vortexa Ltd.”
While the above article refers to “shipments” and not production, the average of those two numbers is 553 kb/d. The official drop for SA production in November is 526 kb/d to 10,478 kb/d and the same for December, 10,478 kb/d.
Note that SA produced close to 10,600 kb/d in the later half of 2016 and averaged close to 10,500 kb/d between June 2018 and December 2018.
If WTI can maintain a price range between $75/b and $85/b, it will be difficult for OPEC to justify a change in their production commitments in the first half of 2023. That will give us a chance to see if SA is comfortable producing 10,500 kb/d for a period of over 6 months. However if Russian sanctions kick in and production drops by more than 500 kb/d, OPEC and SA may be forced to increase their commitment and that will begin to stress their capability.
https://www.arkansasonline.com/news/2022/nov/18/saudi-arabia-cuts-oil-exports-6-in-month/?business
On the other hand, this article is saying that seaborne shipments are rising, “Russia’s Shipping Crude Oil Like Mad Ahead Of Sanctions”
https://www.baystreet.ca/commodities/5934/Russias-Shipping-Crude-Oil-Like-Mad-Ahead-Of-Sanctions
Bloomberg explains why Russian oil production will nosedive next year.
IEA Sees Russia Oil Output Nosediving in 2023 on Lack of Markets Bold mine
(Bloomberg)
Russia may struggle to find new markets for its oil once a European import ban kicks in, potentially pushing the nation’s average output below 10 million barrels a day next year, according to the International Energy Agency.
Russia has redirected more than a million barrels a day to India, China and Turkey since many of its traditional customers fell away following the invasion of Ukraine, the agency said Tuesday. Yet flows to those countries have steadied recently, raising speculation they may not be able to ramp up imports further.
Should their purchases remain stable, the rest of the world would need to triple Russian imports to around 3.3 million barrels a day by February, the IEA said in a report. “We do not think this is feasible,” it said, predicting Russia may lose close to 2 million barrels a day of output by the end of March, compared with prewar levels, and pump an average of just 9.6 million barrels a day next year.
Russia’s production in January through October averaged about 10.7 million barrels a day, according to Bloomberg calculations based on media reports and data from the Energy Ministry’s CDU-TEK unit.
The European Union is set to ban imports of most Russian crude on Dec. 5 and refined products from Feb. 5. The move will not only create production risks for Russia, but exacerbate a supply headache for the region as alternative fuel sources may not be enough to fill the gap.
SNIP
Based on October data, the Kremlin will need to find new markets for roughly 1.5 million barrels a day of crude and 1 million barrels of oil products, according to the IEA.
Slick use of loophole keeps Russian oil flowing into Britain
At least 39 cargos, worth more than £200m, have not been declared
A cat and mouse game the IEA may not be aware of.
https://www.thetimes.co.uk/article/slick-use-of-loophole-keeps-russian-oil-flowing-in-798j805mp
Crack spreads must be near a record?
WTI tanking again, while locally gasoline is $3.92 and Highway diesel is $5.69 per gallon.
I assume OPEC+ will cause physical shortages to reverse this trend given the lack of liquidity in the paper markets appears to be the primary driver of cratering crude oil prices?
If that happens, maybe a wake up call?
Chatter going of OPEC production increases.
Saudi denies oil output hike discussion, says OPEC may cut if needed
Nov 21 (Reuters) – Saudi Arabia on Monday said that OPEC was sticking with oil output cuts and could take further measures to balance the market amid falling prices, denying a report it was considering boosting output, according to state news agency SPA.
You have to wonder how much money was made and lost on this rumour
https://www.reuters.com/business/energy/saudi-arabia-eyes-opec-production-increase-wsj-2022-11-21/
Dennis
For global oil demand to fall by 10 million barrels per day by 2035, just under half the cars of the world would have to be fully electric.
https://peakoilbarrel.com/wp-content/uploads/2022/11/749100-1.png
Globally only 40 million ICE cars a scrapped each year, that means by 2035 a maximum of 500 million ICE vehicles are scrapped. Why would anyone scrap as valuable ICE car before it’s time?
Lets say in 2025 out of 70 million cars sold, 34 million fully electric cars are sold and the rest are ICE. This is optimistic as manufacturers are mainly promising to make half of all cars electric by 2030.
pg32
https://iea.blob.core.windows.net/assets/ad8fb04c-4f75-42fc-973a-6e54c8a4449a/GlobalElectricVehicleOutlook2022.pdf
In 2026 if fully electric car sales reach 40 million and 40 million older ICE vehicles are scrapped then for the first time we we see the number of ICE vehicles start to fall.
The only way poorer people will scrap their older ICE cars is because they cannot afford the petrol. Which means peak oil happened before your peak demand.
The most optimistic outlook is for 350 million electric vehicles in the world by 2030 and sales reaching 70% of all vehicles sold. pg99
https://iea.blob.core.windows.net/assets/ad8fb04c-4f75-42fc-973a-6e54c8a4449a/GlobalElectricVehicleOutlook2022.pdf
By 2035 there will still be 1 billion ICE cars and trucks on the road. Also their will be another 1 billion more people who I assure you will use some oil products.
I think geological Peak Oil will hit us first.
Charles,
You may be right, it might not be possible for demand to fall as fast I had in my previous scenario.
I took a quick look at an ev transition scenario and for demand to be reduced we would need greater fuel efficiency for ICEVs, more public trnasport to reduced miles travelled with ICEVs and possibly the greater use of EV Robotaxis which might reduce ICEV use in urban areas. This might occur (AV approval) by 2030, if not supply would need to remain on plateau. In addition, people can simply drive less, ride bikes and walk in urban areas, also car sizes may be reduced and more 2 and 3 wheeled vehicles powered by EVs may be used.
Sales may grow faster than you believe, I expect about 880 million ICEVs may still be registered in 2035 (if there is no approval of AVs) and demand for oil would remain about 76 Mb/d, this also assumes no increase in the use of public transit, also I have not accounted for less use of oil due to the growing number of EV buses and motorcycles (2 and 3 wheel) in the World. Including those factors would reduce demand somewhat, but I have not tried to model that, I focused on light duty passenger vehicles and heavy duty trucks in my analysis. Also the commercial heavy duty truck analysis is quite conservative, once costs reach a lower level for EV heavy duty trucks, the change to EVs may be very quick. When autonomous vehicles are approved the passenger vehicle fleet will very quickly drop by a factor of 4 or 5 and Heavy duty trucks will also switch more quickly at that point.
Revised scenario below, always possible this is too optimistic as well, much depends on the pace of innovation which is difficult to predict.
I don’t look at rates that vehicles are scrapped I look at past pugin sales and project to future at rates of sales growth seen in the past until all vehicles sold are plugins at about 93 million per year in 2030. Cars can remain in driveways and not driven much without being scrapped. I also assume average fleet efficiency of ICEVs increases and for heavy duty trucks I assume this as well.
Heavy duty trucks are assumed to ramp up at a similar rate as personal vehicles with a 10 year lag. As to why one would scrap a car, it will lose its value as fewer petrol vehicles will be used, many petrol stations may close as there will not be enough sales to justify the number of existing locations, driving a petrol vehicle will become less convenient as charging stations proliferate and fuel stations become more scarce. Many ICEVs will become a stranded asset with very little value and if they cannot be sold (the market will become very small) they will be scrapped.
One other thought is that prices rising does not necessarily mean we have reached the geological peak in oil supply, simply that demand is growing faster than supply, if we see declining output with rising oil prices then the peak may have arrived. I agree for this scenario it looks like the peak will be due to geology and scarce supply, much depends on what policies are adopted, how fast the prices of EVs decrease, how much public transport is built, whether autonomous vehicles are perfected, and the decisions of oil companies on whether to invest in new production. The number of possible future scenarios is infinite, only one scenario will be correct and the chances of creating a scenario that perfectly predicts the future is zero.
Thanks, Dennis. I find your charts rather interesting. I always save them for future reference. Of course, they change over time. That is wise. It is precisely what I do also. New data causes us to adjust our predictions. I have three of your past predictions. Unfortunately, I did not date them. But your first has peak oil In 2031 at 84.9 million barrels per day. Your next prediction had the peak in 2028 at 85.0 Mbp/d. You moved the peak three years closer but kept the level about the same. And now this prediction has the peak in 2027 at 83.5 Mbp/d. You moved it a year closer and dropped the peak by 1.5 Mbp/d, just half a million bp/d above the current peak in 2018. If you drop it by another .6 Mbp/d, you will get the peak year spot on, 2018, but you will still be a little high with your data.
Oh, I haven’t changed my peak year prediction; it is still 2018.
Ron,
Thanks. Predicting the past is easier, I can usually get that right.
No, you completely misunderstand my prediction. I am predicting the future. I predict that future production will never reach the level it attained in 2018.
Ron I know what your prediction is. Note that it is a much easier prediction to say output will be less than this known amount from 2018 in the future. We know there was a peak in 2018 and we know what output was. I can make a similar prediction that at some point in the future 2018 output will be surpassed.
Note that for your prediction you make no specific output claims. You say for example that in 2023 output will be less than 2022 (which last time I asked you estimated at about 80 Mb/d). What specific output do you expect in 2023, 2024,…, 2029, 2030?
If you gave those, you would be out on a limb with me, different branch though, lower on the tree.
Dennis, I have no idea what World oil production will be in 2023 or any year thereafter. I know world oil production will be in decline, and I have already stated several times that 2023 production will be below that of 2022. I may be wrong, but no big deal if I am.
But other than that, I will not make a prediction as to exactly what the production level would be. Anything can happen. And I do not have a crystal ball like you apparently do.
But I do enjoy reading your predictions even though I think they are foolishly too high. But please keep it up. And don’t look for any such specific predictions from me because they will not be forthcoming.
It’s great to see Dennis adjust in real-time, we should plot the change in his predictions, they may trend towards a realistic value…
I still think Dennis places way too much importance on effect of Covid on world supply/demand. The minor demand drop only delays peak by a couple months at most, not years…however, damage to supply side issues (refining) was likely significant.
I think almost everyone in the tight oil game realizes the growth phase is over, now it’s just keeping it all running (well replacements).
Hopefully the current setup can keep going for 5-10 years with minimal drop in production, but that seems like a lot to ask…
Ron,
That’s fine. I will note that often you specifically ask how much I expect output to increase, so I think it is fair to ask you in return how much you expect output to decline.
That is fine if you do not have an answer or are unwilling to reveal your expectation.
I have no crystal ball, I make a guess, that is all. The guesses are wrong 100% of the time as we would expect. Number of possible scenarios=infinity, chances that the one scenario I choose from the infinite set is correct=zero.
Dennis, forgive me but I did make a prediction some months ago. I am sure you remember it. But in my dotting old age, I just forgot. Here it is again.
Best Guess Yearly C+C Production
…….. Denniis ……. Ron
2020 ….. 76.0 ….. 76.0
2021 ….. 77.0 ….. 77.0
2022 ….. 78.7 ….. 80.0
2023 ….. 80.6 ….. 79.0
2024 ….. 82.3 ….. 78.0
2025 ….. 83.5 ….. 77.0
2026 ….. 84.3 ….. 76.0
2027 ….. 84.8 ….. 75.0
2028 ….. 85.0….. 74.0
You have revised your predictions somewhat since then. I will stick by mine, for whatever that means. But, as you say, they will clearly be wrong. But I am far more confident of them in the near term than in the long term.
But there they are. Sorry I completely forgot that I had made that prediction months ago.
Ron – Oh, I haven’t changed my peak year prediction; it is still 2018.
RON PATTERSON
01/27/2015 at 10:21 am
I am expecting prices to rise to $90 a barrel or more by the end of the year. And I am still calling September 2014 thru August 2015 as the all time peak.
https://peakoilbarrel.com/rig-count-drilling-less-oil/#comment-485991
Ron- we should just watch C C because that is the only really good data we have.
https://peakoilbarrel.com/rig-count-drilling-less-oil/#comment-486109
Okay, I missed twice. The third time is the charm. 🤣🤣🤣
Huntington beach,
That thread is interesting, I forgot how conservative my estimates were in January 2015.
My comment from
https://peakoilbarrel.com/rig-count-drilling-less-oil/#comment-486068
Hi Jeff,
Texas and OPEC account for 43% of World C C output. Is it possible that in the other 57% of the world that the condensate output remained the same or decreased? We don’t know. The important metric is energy and energy output should be reported in GJ not by the barrel or by the tonne. Though mass is probably tracks a little closer to energy content than volume.
I do not dispute that there will be a peak and that we are getting closer to it. I disagree that we can determine the peak of crude only output and think the 2014/2015 call on peak oil is too early I think 2017/2018 is more likely and we won’t fall below 74 mbpd before 2020, I also think it unlikely that the 12 month average C C output for the world will rise above 79 mbpd (we are at 77 mbpd now). As always, time will answer these questions.
I was wrong, my prediction in Jan 2015 was that the 12 month average for World C plus C would not rise above 79 Mb/d and that the 12 month average would not fall below 74 Mb/d before 2020. I was correct that output would not fall below 74 Mb/d before 2020 (in 2020 it fell to 76 Mb/d), but obviously the first part was wrong as World annual C plus C output rose to 83 Mb/d in 2018.
My main mistake was underestimating future tight oil output.
See the following from July 2015, the Permian basin wasn’t even on my radar at that point, I expected a peak in tight oil (Bakken and Eagle Ford) of about 2600 kb/d in 2017/2018, this proved to be about 3 Mb/d too low in Jan 2018 (actual tight oil output was 5600 kb/d in Jan 2018 and the 2018 average was about 6500 kb/d). So this accounts for most of my underestimate for World output in 2018 (3900 of 4000 kb/d).
https://oilpeakclimate.blogspot.com/2015/06/eagle-ford-permian-basin-and-bakken-and.html#more
Another estimate from May 2018
https://peakoilbarrel.com/us-light-tight-oil-lto-update/
In the post linked above I was a bit closer to reality (except I did not foresee the covid 19 pandemic) for 2018 I had average output at roughly 5700 kb/d or about 800 kb/d too low and for 2019 I estimated about 6700 kb/d which was 1062 kb/d too low. Note that this estimate was before we had the update from the USGS on Delaware basin TRR which was published in late November 2018. This increased my mean estimate for Permian basin TRR by 30 Gb (from about 45 Gb to 75 Gb) and has increased my URR estimate for US tight oil from 54 Gb to 71 Gb and moved the peak up from 8100 kb/d in 2022 or 2023 to about 11000 kb/d in 2029, part of the shift forward in time is due to low output in 2020 and 2021 during the pandemic and recovery, also the slow ramp up due to operator capital discipline has lead to a slower ramp up in the completion rate than foreseeen in 2018. This scenario assumes oil prices start to drop due to oil demand falling faster than oil supply after 2030, if that is incorrect and oil prices start to fall later (after 2035) then a higher scenario with slower decline from 2030 to 2035 is likely with an ERR of 84 Gb rather than 71 Gb for US tight oil.
Dennis,
“… the Permian basin was not even on my radar …”.
Exactly, Dennis, and this ties in with your demonstrated inclination to do extensive modeling primarily on what currently available data can be utilized.
Under the radar (outside the box?) scenarios do not much come into your projections.
To that end, EOG’s CEO just made a comment regarding their new Utica operation as “reminiscent of the early Delaware”.
Info is available online, but the fact that EOG bought – not leased – ~135,000 mineral acres supports the theory that field gas re-injection may occur without the royalty concerns in traditional leasing.
The mere fact that hundreds of thousands of Ohio goat pasture is now deemed very viable according to EOG’s exacting criteria ought to give pause to the hydrocarbon supply pessimists.
Coffeeguyzz,
I will note that it was not on the EIA’s radar either in 2015.
Here is the EIA’s AEO 2015 tight oil projection, with the peak output shown.
click on chart for larger view, peak was 5.6 Mb/d in 2020.
Dennis, a lot has changed since 2015. But, I think from 2008 to 2015 was when the real change happened. Tight oil and electric vehicles became reality. A bridge to the future as we know it became apparent. The first poster here to see it, that I remember was Nick G and he got run off the website because of it. Yourself Dennis, your mother must have dipped you in Teflon some time during your childhood. Because nobody here takes more incoming than you and you seem to weather it well. Just keep sticking to your education of economics and you will out weather them all. I discount all the others and keep betting on Dennis projections. You haven’t let me down yet.
The future of ground transportation is electric and there is no turning back. It was around 2015 and I thought optimistically the world could stop building light weight ICE by 2030. I don’t think I ever posted it in fear of being laughed off this site. But the reality is, its going to happen sooner than most anyone ever expected back than.
AV/Robo Taxis, I see this a little different than yourself. I see it lowering the cost of a taxi, but in most cases not replacing personal vehicle ownership. I do see a major impact coming to the truck industry from it. Without the need of a driver cab, tractor trailers use will mostly disappear with 40 foot long three axle trucks replacing them with nearly the entire truck used for cargo. With no driver, the cost function per mile completely changes. Fuel/energy becomes the main factor and refueling the only factor from not running 24/7. Slow those trucks down to 50mph from 70mph and your energy cost is cut in half. That’s before the advantages of drafting with autonomous vehicles.
In economics we learn humans have unlimited wants, but in a finite world I was hoping autonomous vehicles could be used as a restraint for rational speed behavior.
Here’s a prediction for you. Tesla’s market value will never again be worth more than the day Musk closed his purchase of Twitter.
Huntingtonbeach,
With fleet owned AVs costs per mile will be reduced by roughly a factor of 8, and by a factor of 16 for pool type services, I think many will find these costs attractive, it will also reduce miles travelled with ICEVs much more quickly than privately owned EVs, basically 6 times fewer vehicles would be needed tor the transition to electric transport. An EV will be able to last 500 thousand to one million miles, fleets which use the cars 100 k per year will have far lower depreciation costs than a private owner who might drive 15 k per year (it would take 30 years to reach 500k miles).
Many do not see this, and perhaps AVs will never become a reality (though Waymo seems pretty close), but the model works even with fleet owned EVs who hire drivers to drive the vehicles, though costs would be a bit higher.
Coffeeguyzz,
I agree that often my scenarios have been too conservative. Besides you, most have suggested that my scenarios are unrealistically high.
They might be too high if demand for oil and natural gas fall as wind solar batteries and EVs drive demand for fossil fuel to very low levels by 2050. Resources will be stranded because prices will be too low to allow for profitable production of oil and natural gas. Expensive resources like tight oil and oil sands will become unprofitable first, then Arctic oil, then deepwater offshore and finally the more expensive onshore resources.
It may be that my scenarios prove too high due to peak demand around 2024 to 2026, especially if Transportation as a Service takes off.
said
Delusional. 135,000 acres is the size of Mille Lacs Lake. Pin your hopes on that donkey.
You say: I think geological Peak Oil will hit us first.
It already has, we are on the undulating plateau at the peak. If, as some predict, oil prices drop substantially, ICE vehicles will be economically very competitive.
Old Chemist,
With the expected future prices for electricity and EVs, the price of oil would need to drop to about $30/bo in order for ICEVs to be competitive, once AVs are perfected, the price of oil would nee to be about $10/bo for ICEVs to compete with robotaxis. There will not be a lot of oil produced if the price of oil falls to $10/bo in 2022 US$.
Hello Dennis. I still don’t buy into the AV/Robo Taxi movement as being a major influence on energy demand… yes in highly urban areas it will be useful and popular but will most likely just cannibalize Uber and Taxis like I said before. Most people in urban areas take the subway/bus for their daily commute anyway, so the best use of AV’s/Robo Taxis is highly concentrated in urban areas that will be largely energy neutral in my opinion.
I also still strongly believe that humans that currently own personal vehicles will continue to do so (whether EV or ICE) for the foreseeable future. AV/Robo development will not likely have a major impact here.
The reasons for humans outside of high-density urban areas to still own a personal vehicle are numerous, but here are a few highlights…
-Freedom and control to go where they want when they want… on demand.
-Freedom to break the rules and speed, drive aggressively and get creative to get where they want when they’re late or stuck in traffic, etc. We are too emotional to sit in a Robo when we are late.
-Style and expression… a personal vehicle is a powerful expression of style, choice and pride to many people, especially here in Texas.
In any event, most people I know here in Texas would never give up their transportation independence and rely or wait on a robo taxi when they have instant, on demand transport with all their gear and stuff in their car. Plus, the radio is already on their favorite station. AV/Robo’s, just like Uber, certainly have a great specialty use when destination parking is bad, or for a boozy night!
I still go back to the Lime and Bird electric scooter phenomenon from a few years ago… those things were littered all over the ground, everywhere… it was pure mayhem… then poof! They are now almost gone. Novelty wore off and practical reality set back in.
Gungagalonga,
Well Kodak thought digital cameras were a novelty. I expected I would never have a need for a cellphone or a smart phone, or a computer at various points in my life.
See https://www.rethinkx.com/transportation-report
I respectfully disagree and see the future utilization of AV/Robos very different.
AV/Robo Taxis will certainly gain ground, but mostly just at the expense of Uber/Human Taxis… therefore no real impact on energy demand. To your point… Just like digital cameras replaced film cameras, one gained while the other lost… the transition to digital was likely more or less neutral on the total number of active cameras out there (until every cell phone came with a camera, of course). There is no real utility difference between an AV/robo taxi, human taxi or Uber…. all are simply point A to point B. The total demand for this type of third-party vehicle transport will remain more or less neutral it just adds another option with AV/Robo’s.
I also do not see mass transit folks migrating to third party vehicles… they all take the bus and rail which are far cheaper for a daily commute. Plus, logistically, there would not be enough road infrastructure capacity to handle all the Uber/Robo’s if everyone wanted to use them instead of mass transit.
On private car ownership disappearing… I just do not see any compelling reason why humans that currently own a private vehicle would give that freedom and convenience up just because they can take an AV/Robo. AV/robo doesn’t add any value above taxi/Uber. Proof of this is in the fact that even after introducing human taxis then Uber and Lyft… none of these third-party transport options have had much of an impact on slowing the growing total number of private vehicles owned, so why would AV/Robo now change that? Yes, we will use a human taxi, robo taxi or Uber for special purpose transport as needed, but we will also continue to own private vehicles for many other uses and reasons.
Apologies on rambling a bit!
Gungagalonga,
Cost savings will drive the change, a robo taxi will be considerably cheaper than owning and driving a car, it will also free up time for people to relax or work during their commute, reduce parking needed in urban areas freeing up valuable space and reduce the need for charging infrastucture spread all over, fleets would charge at charging areas just outside of cities.
Did you read the rethinkx piece or even the executive summary?
People in 1905 thought of cars as fast horses, but they were much more than that. AVs will change transportation fundamentally in ways you do not appreciate.
You can disagree, but be careful spending a lot on a vehicle in the future as it will become a stranded asset (if it is an ICEV and not AV capable).
As more people reach this conclusion it will destroy the ICEV industry and in addition the number of passenger vehicles needed will be dramatically reduced.
Dennis, you are making a similar kind of logical error that has been used by those who have said that, if the engine efficiency had been increasing at the rate of microprocessor speed, we would be able to get 5000 miles per gallon by now (actually the number is much larger than that, but I am using this for the sake of argument). The fundamental issue is thermodynamics. We still rely on fossil fuels for 86% of our primary energy needs. The energy conversion devices have thermodynamic limits and in addition there capacity factors for wind and solar. The bottom line, let’s avoid false comparisons.
Seppo,
Respectfully disagree. The initial issue at hand is replacing oil use for land transportation. The electricity to power these vehicles can be produced by wind, solar, (with battery backup), nuclear, natural gas, or coal, as well as geothermal, and possibly tidal power. Of course there is a capacity factor for wind and solar, when I look at the growth of these I look at TWh produced, so capacity factor is accounted for.
An EV at the wheel uses 25% of the energy of an ICEV and when the electricity is produced with wind, solar or nuclear power is very low emission.
There is also room to increase ICE efficiency, my Prius typically got about 50 miles per gallon vs average ICEV efficiency in the US of under 25 MPG, my Camry hybrid got about 40 MPG over its life, my guess the 50 MPG is close to the practical limit for a hybrid drivetrain. My model 3 have averaged about 4 miles per kWh over 70k miles of driving, the Camry is more comparable in terms of the size of the vehicle.
Camry for 10k miles uses about 29 million BTU (250 gallons gasoline), Tesla M3 for 10k miles uses about 8.53 BTU (2500 kWh). This is somewhat less than a factor of 4 because that comparison uses an ICEV (not a hybrid) which would get something like 30 MPG using 333.3 gallons of gasoline in 10k miles or 38.7 million BTU ( a factor of 4.5 higher energy use for the typical ICEV.
Dennis
Does table 7 include the drawdown in OECD SPR’s?
Old Chemist,
I assume so in 2021 (I assume you mean Table 7.1 which is from the IEA’s WEO 2022, in the post this is labelled Figure 10) as the demand for (consumption of) oil is higher than the supply (production) of oil by about 1.9 Mb/d. Some of this may be from SPR and some from commercial stocks, I don’t think the report breaks it out.
Dennis, I appreciate the debate and will look at that link. Thanks for sending. I will review and respond after reading it… meanwhile, here are my “raw” thoughts…
Yes, a year of robo taxi rides will be cheaper than a year of owning a private car. That is clear, but irrelevant. I never brought that up because it doesn’t matter. People who currently own private cars will still want to own private cars out of lifestyle, independence and convenience priorities. It’s a luxury expense and humans are vane and inefficient with money and resources. Humans have made it very clear that owning their own private transport is a major priority in life for many decades. The cost savings of taking third party vehicle transport like robo taxis has never been compelling enough to replace private car ownership. Proof of this is in the ever-rising number of privately owned cars that goes up year after year on average. Even with the convenience of Uber and Lyft the past 10 years, private car ownership continues to grow year over year on average.
Robo taxis offer nothing more than an Uber… they are the same… so Robo Taxis are also unlikely to penetrate the private vehicle ownership wall. They simply become part of the options for point A to B when going out for a boozy night with bad parking.
Gungagalonga,
Currently it is not cheaper to use uber or lyft than owning your own vehicle, when that changes due to autonomous vehicles that are fleet owned by transportation companies, cost per mile for transport may fall by a factor of ten ( a factor of 20 for those that choose “pool” type services.) So we will continue to disagree about how the future will look if autonomous vehicles become a reality.
Dennis, I read the Rethinks article on robo taxis. It is a mildly entertaining extreme fantasy thesis by another group of over-funded algo-academics in my opinion. Probably just to push eyeballs to their website with a “what if” extreme teaser scenario to explore. It offers me nothing more than a 1980’s civilization disaster movie like Escape from New York or Planet of the Apes. It also appears that this analysis is already getting dated and the clock is ticking on their thesis while the trends still have not changed in their favor. Private car ownership is still increasing.
Not looking good for Rethink on this one. Rethink needs to rethink their thesis… sorry, had to jab with that. Anyway, I appreciate their efforts at the scenario, but it paints a highly speculative and unlikely reality in my opinion.
Among other reasons… Rethink fail to recognize the human element in their models. Humans are inefficient, vane, emotional, passionate, inconsistent, rash, impatient and selfish and Robo will not penetrate the human transport experience much beyond the current Uber style use for these reasons and others. Robos will not replace private car ownership for the reasonable future.
Examples of why for discussion….
-Will the plumber, painter, electrician, carpenter or pool guy use a robo to get to a jobsite? No, they need all their gear and don’t want to unload and load all of it out of a Robo twice a day. Their truck is their tool box.
-Will the parent of one or more children want to schlep their kids around in a robo and pull all of their gear, school stuff, child seat, sports equipment, etc in and out of a robo multiple times a day? No, they want their transport to be predictable and on-demand immediately with all their gear at the ready. I have three boys who all play different sports, I know this scenario daily. A robo would never work.
-Will the hunter or fisherman want to give up their truck and take a robo out to hunt and fish? Never in a million years. The truck is the most efficient tool for their purpose and driving it to the ranch with their dog is part of the joy of their hobby.
-Will the sweet old rich lady down the street give up her Rolls or Bentley for a robo? Never, she loves the comfort and showing it off to her friends. This also goes for the doctors and lawyers with their Porsche, BMW and Benz, etc….
-Will the millions of car enthusiasts give up their joy of driving to sit like a drone in a robo? Never, driving is a passion for many and sitting in a robo staring at your phone buying junk on Amazon will not satisfy that passion to drive.
I could go on, but it seems like Rethink bases their thesis on the premise that humans are static drones that will fall in line for robos like stoic ants following each other in a socialist pathway. I strongly disagree and feel humans are too dynamic to be contained in this way. Cost savings will not drive robo growth as humans love to waste money on inefficient luxury and style. Expensive clothes….art…. jewelry… cars… houses are all examples of the tools of personal expressions of humans and are core to individuality. None of these tools are really good at cost savings, yet we pursue these things like rabid animals.
… Continuation…. wouldn’t let me post, probably too many characters so clearly I am being too long-winded, will trim it back in the future….
———-
Personally, I am real happy to continue driving my 4th Chevy Suburban when I want and where I want with all my dogs, kids, gear, style, seat settings and even a cooler with drinks for the kids. I will continue to purchase new Suburbans every 10 years, whether ICE or EV. My oldest of three drives a big Tahoe and he and his friends only Uber when necessary… he is 17 and loves his private car independence… which is also very much alive and well with his generation. My younger two will inherit my old Suburbans and the private car cycle here in Texas will continue…. Robos will simply be an Uber like utility use and that’s about it. Rethink has written an entertaining extremist fantasy, but private car ownership will persist with or without robos.
Gungalonga,
I agree that tradesmen will continue to drive their own vehicle and rich people, many will prefer the independence of being able to work or relax when they commute to work and they will prefer to save money with robo taxis being considerably cheaper than owning a personal vehicle.
In the future, personal vehicle ownership will be for tradespeople (carpenters, electricians, and plumbers, etc) and the very wealthy. If things go as I expect, I probably will never buy another vehicle. The future is difficult to predict and AVs may never be approved, though Transportation as a Service (TaaS) could work with EVs owned by Uber or Lyft that simply pay their drivers low wages by the hour (or give them a cut of the fees charged on rides they drive) and it may still be lower cost than owning a private vehicle that sits in the driveway depreciating.
Monday a friend of mine drove us 30 miles on the local Interstate to the LA Auto Show. It was very apparent EV’s were the focus of the new technology. I didn’t see anything on autonomous vehicles. Also Tesla didn’t even have a showing, but my friend made a statement that Tesla styling is looking old.
At one point on our trip to the show. We were traveling at more than 80 mph and other vehicles were passing us in a 65 mph zone. This is the norm. It’s also my understanding from others who commute on the Interstate at 6 in the morning. Traffic moves at over 90 mph.
Question Dennis, how is an autonomous vehicle going to deal with a flow of traffic that excesses the legal limit ? Are the auto manufacturer going to be responsible for a death or speeding tickets if the vehicle is speeding ? Are autonomous vehicles going to be limited to the legal speed limit ? I would estimate more than 99 percent of all drivers in my area exceed the speed limit on a daily basis.
Huntingtonbeach,
I imagine the self driving vehicles will go with the speed of traffic flow and would tend to stay out of the left lane on freeways with 3 or more lanes of traffic per direction of travel.
Tesla Full self driving allows the user to set the travel speed higher than the speed limit, as is the case with most adaptive cruise control. The driver is responsible as is the case when using various driver assist features available from most manufacturers. When Level 4 or level 5 autonomy is reached (Waymo is probably Level 4, but tesla is not there yet), the company will be liable I imagine if there is an accident where it is found that the robotaxi is at fault.
If the oil price drops and stays low for awhile, whether we are talking about 2023 or 2031, the result will be further drop in E & P capital investment followed by lower production. That will cause the price of oil to rise again.
Big chance for mismatches between supply and demand.
Old Chemist
It is not possible to repeat every point made. I did say a little while ago that we are on a plateau.
Ron or Dennis my be right about a very temporary peak of production but there will not be much in it.
What really counts is when oil production will start to fall year after year. That will happen once U.S tight oil has peaked and Saudi are at max production.
The world can cope with the current bumpy plateau. Adding a Few million electric cars, bit more public transport.
Falling production by nearly a million barrels per day with each passing year will be very difficult.
That equates to 75 million ICE vehicles being removed from the roads of the world each year. Double the scrappage rates at the moment. Sales of 75 million electric vehicles per year is not the same thing, as people sell on their old ice vehicles.
I think geological decline will start before Dennis peak demand prediction by a year or two
Charles,
That could be, but note that if demand is not falling fast enough so that prices rise, it might lead to more investment by the oil industry and higher output (relative to a lower oil price scenario) as well as lower consumption of oil. So decline rate won’t be as fast in a high oil price scenario. I recently have been expecting peak demand about 2027 or 2028, but on considering your objection to that scenario, believe that you are correct and that peak demand will occur after peak supply by 2030 to perhaps 2035. This will be a period of uncertainty and volatile oil prices, oil companies will see that future demand will be falling a may choose not to invest (this will reduce oil supply). On the other hand National Oil Companies in the Middle East may decide to produce all out for fear of having stranded oil assets, we could see overproduction by Middle East Producers as they attempt to steal market share from each other, in this scenario oil prices would be low and most new investment in tight oil, deep water offshore and Arctic oil would likely cease. Difficult to know how this plays out. I expect from 2028 to 2035 (and perhaps beyond) we may see wild swings in oil prices (even worse than the past 15 to 20 years).
Dennis
Once a few more countries go into decline, OPEC spare capacity would soon go down to zero.
After that oil prices will start to rise, but high investment would take years to produce more oil. This new production will always be chasing incresing decline rates everywhere.
Oil prices were over $100 for several years yet did not reverse the decline in the North Sea. It just slowed the decline. The North Sea is producing less than half what it did at it’s peak.
Trouble is 2 billion of the richest people can afford $200 barrel oil, it is the poor that will be in a terrible condition. The Indian and African farmers who need diesel for irrigation etc. Most of these countries cannot afford to subsidize fuel they cannot afford decent hospitals.
In the U.K. we already pay over $200 per barrel at the pump and have done for years.
In a few years the world will be chasing ever declining oil production and it will take everything to get even close to demand falling at the same rate. High oil prices will do the rest and that is where the pain will be.
Charles,
We need to look at World output, not just the North Sea. Price of oil will adjust to balance supply and demand, demand may be reduced far faster than you believe if Transportation as a service takes off and as heavy duty trucks start to move to alternatives to diesel.
Chart below shows what happend to World C plus C output from 2010 to 2015 when oil prices were over $90/bo in 2022 $. This is the relevant metric, not individual basins. Over the 5 year period from 2010 to 2015 World output increased by 5600 kb/d or an average annual rate of increase of about 1120 kb/d.
Also note that for the tight oil producers it takes about 6 months to a year for high oil prices to lead to higher completion rates that will increase oil output.
Tight oil data can be found at link below (to a spreadsheet from EIA)
https://www.eia.gov/energyexplained/oil-and-petroleum-products/data/US-tight-oil-production.xlsx
From Jan 2010 to December 2014 US tight oil increased at an average annual rate of 40%. Oil prices dipped in 2015 and 2016, but when they recovered tight oil output grew at an annual rate of 27.5% from Jan 2017 to December 2018.
Note that the scenario I have for US tight oil output from July 2022 to June 2027 has US tight oil output increasing at about 6.7% per year.
Charles
I think your view of the future is most probable, but we are in a little bit tougher situation for the near future as well, because OPEC + can prevent any decrease in the price of oil with production modulation of a few million barrels a day .
Charles,
A different way to think about EVs is in terms of ZEM (zero emission miles) instead of ZEV (zero emission vehicles.)
https://rethinkdisruption.com/2018-3-21-why-leaders-are-driving-climate-policy-in-the-wrong-direction/
also government incentives could be leveraged to provide 4 times more zero emission miles per year by paying the subsidy by the mile see
https://rethinkdisruption.com/2018-3-26-zero-emission-miles-how-to-decarbonize-road-transport-quickly-and-cheaply/
In this model the transition to EVs reduces oil use by 4 times the traditional subsidy model.
Dennis
These self driving cars will be a reality at some point. Starting with places like Abu Dhabi and areas of California where there is no snow or bad fog etc.
But these systems work on recognising road signs and markings. In conditions such as this;
https://www.tommoody.us/archives/2013/02/09/10-years-of-snow-covered-cars/
They would not move, there are places that have snow like that for weeks and months. People drive carefully and get to work and to the shops. Humans can work out what cannot be seen. A lead company in this technology said remote backup drivers will be needed for years even in the best conditions.
This will not help Peak Oil decline which is just a few years away.
Dennis lives where they get a lot of snow and I think he disputes this?
Shallow sand,
The autopilot of the Tesla does not work that well on snow covered roads. The car works fine, but in heavy snow, Charles is correct that the current Tesla full self driving software would not work for a robo taxi, it will improve over time to the point where it will work as well as human drivers, not clear when.
Shallow
You and Dennis take a ride in one of those things in the snow at 6pm in December.
Let us know how you get on.
Charles. Count me out.
I’m not into self driving nor into EV’s. I live too far away from many places I need to get to, plus live a long way away from anyone who can service an EV.
My wife has some driver assist functions on her vehicle that help. It’s not an EV.
Right now I see EV as a good commuter car in metro areas, particularly ones that are warm most of the time.
Charles,
As I said, I don’t think they will work currently on snowy roads, that’s a pretty small proportion of time in the World where most people live.
Shallow sand,
The Tesla works fine in rural areas and the Supercharging network is extensive, soon it will be open to all makes, only an adapter is needed, though you would want to buy a model that can charge at a 150 kW rate minimum and preferably 250 kW. The problem with buying a new truck now is that in 10 years nobody will want it, trade-in value will be close to zero. The same may be true for EVs as TaaS becomes the norm in a few years. AVs are a few years (2 to 5) from being perfected.
Dennis.
I’m just going to have to take my chances on that.
Heck, I can’t get a new truck now anyway at our local dealership. ICE or EV.
Charles,
In San Francisco there is fog and Waymo has robo taxis there with no driver.
See
https://www.youtube.com/watch?v=iscXVcxnhMU
For now the Tesla Full self driving does not work well on snow covered roads. Note however that TaaS could still replace most driving with fleet owned EVs with a driver.
Dennis
It was a sunny dry day with no snow and hardly any cars at all
Try this out with you sitting in that car take some nappies 😂
https://m.youtube.com/watch?v=-2RCPpdmSVg
Charles,
There are some places that would be more challenging than others, the roads will likely be safer with fewer human drivers.
It is obvious at this point that Tesla FSD will never function. The first 90% of self driving is relatively straight forward and Tesla has this mastered. The last 10% though is beyond the ability of visual cameras only as light and weather conditions are too dynamic. Waymo and Cruise are more likely contenders.
For developing nations it’s important to consider smaller EVs such as scooters, electric bikes, and electric rickshaws, which are rapidly expanding but don’t show up in the usual EV statistics. Self driving in these areas is not important as there is plenty of labor. And this is where much of population growth is occurring. Many people in rural Texas will not ever drive EVs but this is not significant. EVs will dominate in all these other areas by 2030 because electric engines are vastly superior to internal combustion engines for the usual reasons:
– 4-5 times as efficient
– better acceleration and smoother driving
– widespread availability of electricity
– much lower maintenance
– last much longer etc
Post by Tony Seba from March 2018:
In my last blog, I talked in some detail about the need for leaders to rethink their road transport climate policy. This involves focusing on zero-emission miles (ZEMs) rather than zero-emission vehicles (ZEVs).
But how would a ZEM-incentive policy work?
Here’s an example. Say you have a $50m budget. Within the existing policy framework, you would offer a $2,000 incentive for each ZEV. That would enable the purchase of 25,000 vehicles. Assuming they drive 10,000 miles a year, that would produce 250 million ZEMs each year.
But there is another way. A far more productive way. If you really want to leverage that budget to best effect, you need instead to offer a ZEM incentive. This could be 1 cent per vehicle-mile travelled (VMT) over five years. An individually-owned ZEV would get about $500 for driving 10,000 miles a year for five years. At $100 a year, that’s unlikely to be enough of an incentive for an individual to purchase a ZEV.
But a fleet-owned ZEV would get $1,000 a year. This is because utilization rates are 10 times higher than individually-owned vehicles, so each ZEV would be driving 100,000 miles a year, or 500,000 miles over the five years, receiving $5,000 in total for the period. Most of this ZEM incentive would be snapped up by fleet companies that would lease these cars to ride-hailing companies like Uber or Lyft, or even taxi companies.
In other words, the traditional ZEV incentive program – just like the ones currently being implemented by governments across the world – would put 25,000 individual cars on the road that would drive a grand total of 250 million ZEMs a year. The ZEM incentive would put 10,000 fleet cars on the road that would drive 1 billion ZEM miles a year – four times more clean miles for the same money.
The ZEV program would mean swapping 25,000 individually-owned gasoline cars for the same number of individually-owned ZEVs. These ZEVs would need a far larger number of charging stations spread over a larger geography, would cause more congestion, need far more parking space while barely making a dent in emissions. The 10,000 fleet ZEVs would need far less parking, cause less congestion, and would need a far smaller, more efficient charging infrastructure outside central business districts.
So, a simple policy adjustment with the same budget for a massively more-effective outcome.
“So, a simple policy adjustment with the same budget for a massively more-effective outcome.”
My first thought was is this a trick question. Then I realized it’s a statement. My gut tells me Tony has it wrong and looking at this short sighted. It’s not about this years emissions or next years emissions. What it’s really about is the total life cycle of the vehicles produced and sold. Those 25,000 privately owned ICE vehicles who didn’t get an incentive are going to emit emissions for many years after the 10,000 who got the incentive are long retired. If the 25,000 EV’s are actually replacing ICE, then there would be 15,000 less ice ever produced. That’s what would really be important.
Of course in the real world today, the manufacturers have a back log of EV orders up to two years and pretty much can sell every EV they can produce. So there is really no good reason for the incentive in the first place.
Huntington beach,
I respectfully disagree. We need to transition as fast as possible to maximize the number of zero emission miles (ZEM) travelled. The ability to produce new EVs is limited, If each EV produced travels 100k mile per year (as an Uber fleet car) vs a typical US driver travelling 15k miles per year, then the transition to a higher ZEM happens about 6.7 times faster. Adjusting policy to make this more likely to occur makes sense to me.
Good government policy can make a difference, but sometimes we need to think outside of the box.
Dennis,
We will just have to agree to disagree. Maybe five years ago Seba’s idea made sense if EV’s weren’t being accepted by the public. But today, I just see it as moving around the chairs on the Titanic.
“Good government policy can make a difference, but sometimes we need to think outside of the box.”
Now here is something we can agree on. There are some billion ICE registered vehicles already in service. I would advance policy that minimizes the production of new ICE until the manufacturers have transitioned to EV’s. Maybe the best way of doing this is to set an early manageable date of the end of production and sales of new ICE. Forcing the use of current ICE and accelerating transition now to minimize future use of poor emission vehicles later. Also, renewable policies have to be advanced to make EV’s a real plus in reduction of emissions.
When you have dug yourself into a hole. The first thing to do is to stop digging. Myself, I will delay my next vehicle purchase and run the clock out on my current ICE. Selling it and buying another ICE would just be wrong.
An interesting Blog post by RethinkX
https://rethinkdisruption.com/jpmorgan-misinformation-clean-energy-disruption/
Dennis –
Any theories why US oil production has been stuck at 12 MBpD for 8 months?
During that time oil crept up from ~$80 to $120 and is now back at $80…strange that a 50% price increase had no effect on US oil production…
I know your models are predicated on ever increasing US oil production for the next 5 years…so why aren’t we seeing any increase????
As Ron likes to say the losers keep losing, but what about the countries that should be increasing?
I guess we should expect to see Rig counts jump before an increase in production, right?
Kengeo,
For the past 24 months US output has increased at an annual rate of 589 kb/d, it takes time for producers to respond to higher oil prices and my theory is that tight oil companies have chosen to return cash to shareholders through higher dividends and share buybacks, and to pay down debt, so less is left to invest in drilling new wells. Also OPEC has been ramping up output and World petroleum stocks were increasing in 2022Q3 by roughly 90 million barrels (based on OPEC’s estimate of the supply demand balance in 2022).
Chart below shows US output based on monthly US C plus C data from the EIA, the line is based on ordinary least squares regression on data from September 2020 to August 2022. Data at link below
https://www.eia.gov/dnav/pet/hist/LeafHandler.ashx?n=PET&s=MCRFPUS2&f=M
If US output continues to increase at about 600 kb/d for the next 5 years that would bring US C plus C output to about 15 Mbpd in late 2027. We will also see higher output from Canada, Guyana, Brazil, possibly Suriname and Argentina along with potential increases for the Middle East over the next 5 to 7 years as higher oil prices may lead to more aggressive development of their resources. It is also possible that nations choose not to invest due to fear that demand will peak and their investment becomes a stranded asset. So far Exxon and most OPEC nations do not believe that demand will peak before 2035, so this may not affect investment decisions for them. European oil majors may choose not to invest as much in new oil output.
Kengeo,
See link below for rig counts
https://oilprice.com/rig-count
Oil rigs feel from 682 in March 2020 to 176 in August 2020 and on Nov 18, 2022 the oil rig count had recovered to 623, about 91% of the March 2020 level and up by a factor of 3.53 from the August 2020 low.
The simple average rate of increase has been an annual rate of roughly 199 oil rigs per year.
Horizontal Oil Rig count in US. On Dec 27, 2019 the US horizontal rig count was 597. The average horizontal oil rig count in 2019 was 681 and in 2018 the average horizontal oil rig count was 742.
If the annual rate of increase for the next 52 weeks is 195 per year, then one year from now we would be at 767 horizontal oil rigs (higher than the 2018 average).
If we look at only the past 105 weeks, the annual rate of increase is lower at 155 horizontal oil rigs per year. If we see that rate for the next 52 weeks we would be at 727 horizontal oil rigs in 12 months, just 15 shy of the 2018 average horizontal oil rig count, and 46 more than the 2019 average.
Anecdotal from the conventional oil patch.
The best we can tell there are only 8 rigs running in our field. That’s not oil rigs, that’s workover rigs. For over 2,500 oil wells and over 1,000 injection wells.
Related, read an article that the US birth rate collapsed in 2008 and hasn’t recovered. US colleges are bracing for a big drop in enrollment and several will likely close.
So, sure, US has the up and coming labor to “ramp” oil production.
The only answer I see is immigration. But immigrants are also needed to harvest and process the US food supply.
In 2024, if the R’s sweep, then what happens with immigration?
“Global Long-Term LNG Contracts Are Sold Out Until 2026-“Competition between Europe and Asia for limited LNG will be intense until a new supply wave arrives after 2026. Prices will inevitably remain elevated until then.”
This is why predicting Peak Oil is so difficult..
https://oilprice.com/Energy/Crude-Oil/Are-Iraqs-Ambitious-Oil-Production-Goals-Feasible.html
creaming curves and depletion curves are meaningless when corruption, incompetence run right through a country. No one knows what Iraq will produce, it is simply a guess based on what has happened in the past.
It could be 10mbld but more likely 5 mbld. The same is true of Nigeria, Venezuela, Mexico, Russia.
These countries could get better but equally they could get worse.
You can add Iran to that mix.
Politics has always been part of the oil production problem. And it always will be part of the problem. But politics is not just a problem with production, it is a problem with reported reserves also. The article states:
Iraq holds a very conservatively estimated 145 billion barrels of proven crude oil reserves.
That estimate was made by crooked politicians, not geologists.
That is one reason why i consider projections by diligent people like Laherrère or Dennis to be an attempt to predict the economic/geologic best case scenario.
Unpredictable human factors are the big downside risk on global production.
Policies, sanctions, funding, regulations, invasions, sabotage, inebriation… you name it.
Hickory,
There are both downside and upside risks. Historically if we look at either my scenarios or those of Jean Laherrere, the future scenarios have mostly been lower than actual, with the Covid19 pandemic being a notable exception. The speed of the transition to solar wind batteries and EVs is another possible downside risk to future oil output. Tight oil was an upside risk in 2012 which I underestimated, many continue to underestimate future tight oil output in my opinion, and perhaps I do as well, the future will tell us.
Good point about tight oil, and its a huge one.
No one had that upside component as part of their outlook.
PLEASE COMMENT ON THE DIESEL-POCOLYPSE
-much reported recently, but apparently forgotten now.
Is OPEC+ mulling an oil production increase? Saudi says previous cut will stay in place till end of 2023
Saudi Arabia has refuted a report that oil producers were considering raising output after an oil production cut last month.
According to a Wall Street Journal report from Monday, Saudi Arabia, which co-chairs OPEC+ with Russia and other countries, was mulling an “increase of up to 500,000 barrels” per day. The Kingdom however said that the cut would stay in place till the end of 2023.
The official Saudi Press Agency on Monday quoted the nation’s energy minister Prince Abdulaziz bin Salman who said that the nation “categorically denies” the report.
“It is well known, and no secret, that OPEC+ does not discuss any decisions ahead of its meetings,” he said.
The next meeting as per AFP is scheduled for Deceember 4th.
“The current cut of 2 million barrels per day by OPEC+ continues until the end of 2023 and if there is a need to take further measures by reducing production to balance supply and demand, we always remain ready to intervene,” he added.
In October OPEC+ announced a production cut of two million barrels per day, a move that had heightened tensions between Riyadh and Washington.
Dennis
The large increase in production was only possible due to US tight oil and others
https://tradingeconomics.com/iraq/crude-oil-production
https://tradingeconomics.com/brazil/crude-oil-production
They are all running out of steam despite high oil prices.
Charles
Below is a sneak preview of what will appear in the August Non-OPEC post.
Brazil is possibly on the cusp of becoming Venezuela 2.0
Charles,
Yes that is correct, tight oil was a big part of the increase about 4000 kb/d from Jan 2010 to Dec 2015 and most did not see that as a realistic estimate in 2010. World output increased that is my only point. At some point even high oil prices may not increase supply any further, my guess is around 2030 to 2035, if oil demand remains robust. My expectation is that oil demand will start to wane before we reach peak oil supply (where oil output decreases in a high oil price environment (say oil prices higher than $100/bo in 2022 US$). That scenario assumes autonomous vehicles are approved within the next few years (by 2024), if that does not occur we might reach peak supply before peak demand.
Charles,
We will see, currently prices are not that high (they have been falling of late) and 3Q2022 saw World petroleum stocks rise so we may see a pause in oil output growth until demand catches up to supply in late 2023, based on OPEC’s forecast for supply and demand. World output increased by about 8560 kb/d from July 2020 to July 2022, roughly an annual rate of 4280 lb/d. For the past few months (July to Sept) OPEC, Russia and US combined C plus C output has increased by about 967 kb/d, an annual rate of 3868 kb/d. We do not have data yet for the rest of the World, but the impending decline seen by some may not amount to much.
Dennis
If oil prices matched pay rises since 1998 it would be 36 dollars a barrel. The reason why oil prices have been 200% to 400% higher then this is because the world cannot meet demand at that price.
For 20 years oil companies had no problem meeting global demand at an oil price of around $20.
There were loads of new options, Mexico, Angola, Nigeria, North Sea.
Where are the new options now?
The high price tells us new oil is getting very difficult to find.
What was the discovery last year? 5 billion was it?
Best year of discovery was 70 billion I think
We are still 3 million barrels short of 2018 peak.
I see production starting to fall around 2026 after reaching perhaps 84 or 85 max
Dennis
Your high oil prices did not result in higher oil finds, they just pumped more of what they had already found
https://www.iea.org/data-and-statistics/charts/global-conventional-resources-discoveries-and-exploration-spending-as-of-total-upstream-investment-2010-2020
Charles,
I do not believe I said more oil was found, I said more investment and meant (but did not say explicitly) investment developing already discovered oil resources. So we agree on that point, though it is also likely that there may be more exploration in a high oil price environment than in a low oil price environment and few new fields will be discovered without exploration, success is not guaranteed, but there have been some offshore discoveries, particularly in South America offshore.
Charles, thanks for the link. That chart is amazing. Beginning in 2011, exploration spending dropped by only 1% but total oil discoveries dropped by more than half, from 27 billion boe to 12 boe. In 2019 oil discoveries were down to 7 boe. in 2010 exploration spending was 21% of upstream investment; in 2020 it was down to 9%. Why? Because they are not finding enough oil to justify the money they are spending on exploration, that’s why.
Chart below:
Global conventional resources discoveries and exploration spending as % of total upstream investment, 2010-2020 Click on chart to enlarge.
High oil prices correlate most closely with money used on share buy-backs by the IOCs, then on dividend payments, hardly at all with drilling activity, especially for conventional wells, and if there is any effect on total capital expenditure then it is only to slow the steady decline. The constant warnings on the importance of oil investment from the likes of ExxonMobil are aimed mainly at deterring windfall taxes.
Charles,
Our predictions for supply are not that different. I agree costs for oil production of the marginal barrel are likely much higher today. Note that there is a lot of undeveloped resources that have already been discovered, much of that resource is more expensive inconventional oil (extra heavy resources in Canada and Venezuela and tight oil) and deepwater offshore and Arctic oil.
Dennis
You have mentioned 2028, 2030 and 2035 as geological peak oil, I think it will be around 2025.
In terms of time the gaps are tiny. However in terms of the rollout of electric vehicles between 2025 and 2035 is vast. If global production starts falling in 2035 then the world will be well ahead of it with electric cars, van and buses etc. In fact we may never realise a geological peak as demand is falling ahead of it.
If geological Peak Oil starts in 2026 the world will be far behind the curve and there will be catastrophic consequences to people’s lives as people face daily life with less oil than is needed.
Very high prices will force very difficult decisions and inflation will be difficult to control.
Tar sands and heavy oil are very difficult to increase in the time needed and some years oil production could fall by over a million barrels per day.
You know Dennis I hope you are closer to date than I am.
Charles,
If you are right about a geological peak in 2026 (and that does not seem unreasonable) and my estimates of World oil resources are roughly correct (around 3000 Gb for World URR), then this would be what World oil output could look like in a high oil demand scenario (no autonomous vehicles approved before 2035). My expectation is that demand for oil will start to fall below supply before 2035 due to a rapid uptake of transportation as a service (TaaS) with EVs providing most of this service, at 100k per vehicle per year (for fleet owned TaaS EVs) this could replace a lot of passenger vehicle miles travelled quite rapidly with electricity rather than oil, even without approval of AVs.
Extraction rate is for conventional oil and producing conventional reserves at end of 2022 are about 495 Gb with about 700 Gb of discovered resources not yet producing, future discoveries and reserve growth expected to be about 180 Gb. URR conventional oil about 2800 Gb. The conventional oil output peak for this scenario was in 2016 at 73.5 Mb/d, unconventional (extra heavy oil plus tight oil) oil peaks in this scenario in 2031 at 14.3 Mb/d, all C plus C peaks in 2026 at 83.4 Mb/d with conventional oil at 70 Mb/d and unconventional oil at 13.4 Mb/d.
Click on chart for larger view.
When you guys talk about geologic peak realize that you are really referring to the combined geologic/geopolitical peak.
Keep in mind that significant geologic potential oil production from Russia, Iran, Iraq, and Venezuela is currently off the markets as a result of geopolitical factors. I suppose you could add Libya and Nigeria to that list of significant producing countries that are under-performing geologic potential for ‘management’ reasons.
Hickory,
Probably true. I am defining a geological peak as a final peak in World C plus C 12 month average output where the peak occurs during a time of high and/or rising 12 month average oil prices, whereas a peak demand scenario would occur with falling average 12 month oil prices.
The guesses will certainly be wrong.
… and Canada.
Dennis
I am sticking with this forecast. Post pandemic peak in C + C occurred in October 2022. I think that peak will remain unchallenged until mid 2024.
Nope, I am betting September will be the post-covid peak. OPEC crude only was down 210,000 barrels per day in October. Non-OPEC will not make up that gap.
Kazakhstan will have a big rebound in October that will push the post pandemic peak into October. 😁
Yeah, I saw what the EIA was projecting, an increase from September of 390,000 bp/d. But that will greatly exceed their quota.
Kazakhstan Receives Oil Production Quota for October After OPEC+ Meeting
BY STAFF REPORT in BUSINESS on 6 SEPTEMBER 2022
NUR-SULTAN – Kazakhstan will produce 1,706 million barrels per day as part of the virtual meeting decision of the Organization of Petroleum Exporting Countries (OPEC), reported the Kazakh Energy Ministry’s press service on Sept. 5.
That would be an increase of 200,000 barrels per day.
Ron,
10 kbpd is statistical noise for World production at 80000 kb/d, about 0.0125% (and that is not a typo we have 10/80000=0.000125.)
Output might decrease as the World market is currently oversupplied and stock balances are increasing, that along with recession fears is the reason oil prices have been trending down.
Dennis, I do not understand what 10 kbpd has to do with anything. The difference in what the EIA is predicting is and Kazakhstan’s quota is 190 kbpd, not 10 kbpd.
Oil production is declining, and will continue to decline, regardless of what causes it. As I have stated many times, politics has alwayse been a part of it, and always will. Yes, a recession may depress prices and production. We have had many recessions in the past, and they will continue.
Ron.
OPEC output decreased by 210 kb/d and you said Kazakhstan is expected to increase by 200 kb/d, the difference is 10 kb/d, that is where I got the 10 Kb/d.
Reservegrowthrulz,
Is it possible that you could be less clear?
I will assume you mean the various scenarios I have created for World output. Or you might mean for oil prices, or tight oil, or all of them. I will go with World output.
The RP scenario is based on Ron Patterson’s scenario, the dates for the various scenarios are in the legend, range of cumulative production from 1870 to 2050 is 2131 to 2244 Gb. The scenarios from November 2022 assume an early peak in World Demand for Oil around 2028, earlier scenarios from September and October 2022 assumed a later peak in Demand for oil around 2030 to 2040 (mostly 2035). Basically the assumption was that autonomous vehicles do not get regulatory approval before 2035. My expectation has changed on when that will occur (currently it is 2025 /-1).
Click on chart for larger view.
Charles,
So everyone gets a complete picture, the text from the report is below:
Oil and gas exploration spending has been on a consistent downward
trend in recent years, with only a slight bump in 2019. With investment
budgets under renewed pressure in 2020, the share of exploration
spending in total investment may hit historic lows.
Exploration is being tested by more than a cyclical downturn: many
companies and their investors do not attach the same importance to
reserve replacement as they have in the past, especially given the
relative abundance of onshore unconventional resources (for which
there is no formal exploration process as such). As a result, while
incentives remain for companies to seek out more advantaged
resources and upgrade their portfolios, there is not the same impetus
for companies to explore and discover as there once was. This is
especially true given that the remaining prospective or underexplored
areas in the world are increasingly remote or difficult to access.
Exploration often finds itself in the firing line when companies are
looking for ways to cut costs. In our estimate, exploration spend is
likely to be down again in 2020, both because of cuts in allocated
investments and because of practical difficulties in moving personnel
and equipment to the desired areas. Planned exploration wells across
Africa and Latin America could be delayed as a result.
That said, 2019 was a moderately successful year for conventional
discoveries. The countries that added the most to their conventional
resources were Iran, Russia, Guyana, and Trinidad and Tobago, and
there were also significant discoveries in China, Malaysia, Indonesia,
Norway and South Africa . This made 2019 the most successful year
for oil and gas discoveries since 2015. The trend in discoveries is
towards natural gas, and 2019 was another significant year with large
finds in Russia, Mauritania, Iran and Cyprus.
The record of discoveries thus far in 2020 is some 40% below the
same period in 2019, although notable finds have included the Jebel
Ali gas discovery in the United Arab Emirates, which opens up the
possibility of reducing the country’s reliance on imported gas, and
further finds in the Guyana-Suriname basin.
Chart is below with legend.
HHH Monthly update:
Attached is some updated info on recoverable oil from Rystad
Total recoverable oil worldwide is now 9% lower than last year, threatening global energy security
According to Rystad Energy analysis, global recoverable oil now totals an estimated 1,572 billion barrels, (See attached table) a drop of almost 9% since last year and 152 billion fewer barrels than 2021’s total. Recoverable oil corresponds to the industry term “remaining technically recoverable crude oil and lease condensate”, i.e. expected volumes including fields, discoveries and risked future discoveries.
“While the drop in oil availability is positive news for the environment, it may threaten to further destabilize an already precarious energy landscape. Energy security is a matter of redundancy; we need more of everything to meet the growing demand for transport and any action to curb supply will quickly backfire on pump prices worldwide, including large producers such as the US. Politicians and investors can find success by targeting energy consumption, encouraging electrification of the transport sector and drastically improving fuel efficiency.”
https://www.rystadenergy.com/news/total-recoverable-oil-worldwide-is-now-9-lower-than-last-year-threatening-global
Is this the fourth year in a row Rysted has reduced reserves by around the same percentage? I seem to remember the sequence including an 11% drop for the year 2019 or 2020 when it switched from field to well based analysis.
Below is a bit more info. on this year’s discoveries. High impact normally means targeting greater than 100 mmboe. No mention on why gas is so low, but interesting that frontier areas are becoming less attractive (I think this reflects continued increasing risk aversion but may also show that in these areas, where there is no existing infrastructure, new finds are showing too low an ERoI to be commercial – i.e. they need a billion plus barrel field as an anchor hub to get started, which haven’t been forthcoming).
https://www.offshore-energy.biz/rystad-2022-high-impact-oil-gas-drilling-activity-on-track-to-yield-one-of-the-most-productive-annual-volumes/
And RIP Wilko Johnson, under appreciated genius axeman and Game of Thrones sort of axeman.
Why do you think I’m interested? Or any of us here?
Reservegrowthrules, I think you are mistaken. I don’t think Dennis has ever banned you. And I know I haven’t.
Ron Patterson,
This is the guy we keep on banning who posts as mustang or some such name at peakoil.com.
He is posting under someone else’s name to get by moderation.
Something happened because I can’t find this comment by RGRZ which appears in a RDF blog feed
Is ReserveGrowthRulz banned from commenting?
Paul,
Yes the imposter called reservegrowthrulez (note the e before the z) who has been banned many times before (under many diferent names) has again been banned.
Dennis, so ReserveGrowthRulz (w/o the e) is still ok? He’s been at it long enough, but I think he was banned a reddit
Paul,
Yes the “real” Reservegrowthrulz has behaved himself here, as far as I have seen, though he prefers to post at peakoil.com as AdamB.
To answer my own question the estimate for undiscovered oil has dropped from 1000Gb in 2018 to 350 now. At present rates that is still going to take 70 years, but as the trend is to zero discoveries by 2030 I think we may only find about 50Gb at best. The 1500Gb “technically recoverable” that Rystad give is 1200 “economic” by its estimates, but could easily be as low as 700 to 800 given current risk aversion by the IOCs and the ERoI issues with developing small pockets or new frontier areas. If so there is a rapid decline coming sometime in the next few years, followed by panic and violence leading to even lower recoveries.
“The real problem of humanity is the following: We have Paleolithic emotions, medieval institutions, and godlike technology. And it is terrifically dangerous, and it is now approaching a point of crisis overall.”
-Wilson
“risk aversion by the IOCs and the ERoI issues with developing small pockets or new frontier areas. If so there is a rapid decline coming sometime in the next few years, followed by panic and violence leading to even lower recoveries.”
Add to this the natural tendency for countries to restrict export when supply gets tight internally, you have the recipe for the global oil market to far underperform delivery projections based on recoverable reserves.
If peak demand arrives by 2030 for C plus C, we might only need a little more than 2500 Gb and no future oil discoveries would be needed.
Colin Campbell thought long time ago total recoverable with technology at the time was 1800 Gs… that was mostly 1P (no heavy, no deepwater, no CO2 etc.) In theory 2P with all missing recoverable means is about 3000G… that is 50K altitude view.
Global oil and gas exploration shrinks as companies shift focus to lower-risk core assets and regions
This article corroborates the IEA article above.
Global oil and gas exploration is set to falter this year as the number of licensed blocks and total acreage fall to near all-time lows as the sector struggles to shake off the effects of the Covid-19 pandemic and the ensuing oil market crash, Rystad Energy research shows. Only 21 lease rounds were completed globally through August this year, half of the 42 rounds held in the first eight months of 2021. The acreage awarded so far this year has shrunk to a 20-year low of 320,000 square kilometers. Global lease rounds are expected to total 44 this year, 14 less than in 2021 and the lowest level since 2000.
https://www.rystadenergy.com/news/global-oil-and-gas-exploration-shrinks-as-companies-shift-focus-to-lower-risk-cor
Ovi,
Note that about 1437 Gb of cumulative crude plus condensate had been produced on the third rock at the end of 2021. Add the 1572 Gb of expected future TRR by Rystad and we have a URR=3009 Gb. All of my recent Oil Shock models have a URR of less than 3000 Gb, no future discoveries needed, if we assume the Rystad analysis is correct.
After 35 gb is produced in 2022, that means we have produced about half of all the recoverable oil, even if your URR is correct, which I think is too high. Nevertheless, even if it is correct, we have produced half of all the oil, at which point we would expect the peak.
But we have already produced all the low-hanging fruit. The second half of the oil crop will be a lot harder to produce and come in a lot slower.
Ron,
80 Mb/d is about 29.2 Gb annual output. 1500 Gb cumulative in early 2026 for a recent scenario, peak conventional in 2016, peak unconventional in 2031, peak oil in 2026. The 3000 Gb ustimate for URR is pretty conservative, Laherrere et al recently (2022) estimated URR at 3500 Gb for World C plus C. See figure 6 and table 1 in paper linked below.
https://www.sciencedirect.com/science/article/pii/S2666049022000524
Dennis
I still think that your 3,000 Gb is a good number to work with. A ± 100 Gb is not worth arguing about. There are more discoveries coming , but not major ones. See post below.
I don’t get this “produced on the third rock”. Possible typo?
Third rock from the sun. Get it now? 😂
Got it
Ovi,
Thanks, I agree the precise number is not important, note that my assumptions about extra heavy oil are pretty conservative at about 180 Gb for Canadian and Venezuelan extra heavy oil combined. My tight oil scenario at 84 Gb is far lower than EIA or IEA scenarios and my conventional oil estimate at 2800 Gb is much lower than the USGS World Pertoleum Assessment from 2000 at about 3000 Gb. Estimated proved reserves for Canadian and Venezuelan extra heavy are about 400 Gb, US EIA tight oil estimate from AEO is about 120 Gb. Thus my estimate is 200 plus 220 plus 35 or 455 Gb less than mainstream estimates, but consistent with the Rystad estimate (within margin of error).
I only point this out because many here believe that my estimates are far too high, with the possible exception of Reservegrowthrulz who may think the opposite is the case.
Namibia Will Consider Joining OPEC If It Has Big Oil Discoveries
While it is not clear how big the discovery is, Total hints it could be big.
“The international companies each found oil offshore in February and plan to start appraisal programs to determine their size over the next few months. While the explorers have cautioned against speculation about the scale of the resources, TotalEnergies Chief Executive Officer Patrick Pouyanne said last month that its discovery could be a giant.”
https://www.bnnbloomberg.ca/namibia-will-consider-joining-opec-if-it-has-big-oil-discoveries-1.1837453
Exxon has also discovered new oil in Angola.
Exxon Mobil Makes First Oil Discovery In Angola In 20 Years
Last month, the oil major announced that it had made two new discoveries at the Sailfin-1 and Yarrow-1 wells in the Stabroek block offshore Guyana, potentially adding more barrels to one of the most closely watched new oil discoveries. ExxonMobil has now made more than 30 discoveries on the block since 2015, and has ramped up offshore development and production at a pace that far exceeds the industry average. In contrast, Exxon’s exploits in Africa have been few and far between, with its last discovery on the continent coming nearly two decades ago. But Exxon has now announced that it has, together with its partners, discovered hydrocarbons in Block 15 off Angola in the Bavuca South prospect. This was the block’s 18th discovery, but the first since 2003. According to Exxon, the Valaris DS-9 drillship drilled the Bavuca South-1 well 365 km northwest from the coast at Luanda in 1,100 m (3,608 ft) of water, encountering 30 m (98 ft) of good-quality, hydrocarbon-bearing sandstone. Exxon owns a 36% interest in the block, with BP Exploration Angola (24%), ENI Angola Exploration (18%), Equinor Angola Block 15 (12%) and Sonangol P&P (10%) being its partners.
https://www.marketwatch.com/press-release/exxon-mobil-makes-first-oil-discovery-in-angola-in-20-years-2022-11-17-61975729?siteid=bigcharts&dist=bigcharts&tesla=y
The above two discoveries could make 2022 better than 2021, but not enough to offset the depletion of 30 Gb of crude in 2022.
For reference, attached is a Rystad chart that was posted last year showing 2021 discoveries. Note that only 3.1 Gb of liquids were discovered in 2021.
Ovi,
Correct… Exxon’s newest oil discovery in Angola will produce 40,000 bd, and the company stated that this will OFFSET Declines in the Block. So, it’s not really positive news, even though many believe it to be.
Furthermore, you are correct… these new discoveries are PEANUTS compared to what the world dicovered decades ago.
Since 2011, the world found 76 billion barrels of oil but consumed 320 billion. At this rate, we hit the ENERGY CLIFF by 2025.
steve
Steve,
We may have already discovered what the World needs for oil, if peak demand arrives by 2030, we might only need another 1100 Gb, Rystad estimates we have have discovered 1200 Gb of oil that remains to be produced.
Dennis,
I don’t trust Rystad’s figures, and of course, you realize a lot of the 1100 Gb of oil has a much LOWER EROI than what was found 1950-1980s.
Peak demand… LOL.
steve
Steve, keep in mind that when people here say the word ‘demand’ they are actually meaning consumption.
Peak consumption could come few a few reasons.
One being that they sum total of humanity doesn’t need the fuel. I am certainly not holding my breathe on that, as we are on the path to grow another billion people within 15 years.
Secondly, the sum total of people might not be able to afford purchase of as much fuel as in 2018.
Third, there simply isn’t as much fuel brought to the global market for sale.
Any of those factors could result in peak “demand”, as the term is commonly deployed.
Hickory,
Agreed with your overall assumption of demand. However, it seems to me that Supply is demand. Why? Because every person in the world DEMANDS a better standard of living. Very few people want to be POORER.
So, humans will BUY all the Oil Supply they can because they don’t want to be some POOR SLOB.
Thus, the TRUTH is that Peak Oil Supply = Peak Demand.
steve
Steve,
Yes supply is equal to demand, that is a basic tautology of economics, we can only consume something once it has been produced.
The difference between peak demand and peak supply is the rate of change of the price of crude oil. In a peak demand scenario the rate of change in the price of cruse will be negative (prices will fall). In a peak supply scenario the rate of change in the price of crude oil (real prices in 2022$) will be positive (oil prices will be rising).
I believe that 3,000 million/month is the level needed to replace 100,000 million/day consumption.
So right now we got contango from Jan contracts all the way out to April.
The tragedy of drilling everywhere.
As the oil production of one country after another goes into decline global decline comes ever closer.
Ideally there would have been many unexplored areas which would have cushioned the decline rate to a manageable amount.
The opposite has happened and very difficult and expensive areas are already being produced pushing global production ever higher and higher.
Deep offshore Gulf of Mexico, deep offshore Angola, Nigeria, Namibia, Brazil. Siberia, shale oil.
What a pity shale fracking and some of the above did not start ten years later.
We would have had peak oil 10 years ago and these new sources would have provided support to ease the general decline rate.
A decline rate of half a percentage point per year would have been difficult but doable.
Electric trolley buses are quick to install and are great at reducing traffic and pollution.
We would be much further ahead with electric cars.
The opposite has happened, all the difficult areas are already producing pushing global production higher and higher.
The consequence will be a higher decline rate and hardly any new oil to cushion that decline.
Idealised decline rates are unlikely we have seen too often what happens Iran Iraq war, Libya, Russia etc.
In the past OPEC spare capacity and new supply smoothed the way.
OPEC capacity is small now and all those difficult oil sources are close to full exploitation.
Declines of 2% due to political idiocy is very likely.
The damage the will do is beyond description.
Charles, I am afraid you might be right. With the shale “revolution,” I thought, “why are we not using this as the transition period”? As Mike S. keeps repeating, why are we exporting our future?
Perhaps because we don’t have one.
I agree with Charles on this matter of how the US tight oil phenomena might have offered a far better bridge to a rational and economic (for ALL Americans) bridge to renewable transportation fuels. Tight oil’s gross mismanagement, least of which is the exporting of 70 % of Permian tight oil, is an atrocity on our nation and our long term energy security. Most of this has occurred for lack of regulatory guidance on the State(s) level, politics and poor policies. The use of US tight oil as a foreign policy tool has failed miserably.
https://www.oilystuffblog.com/forumstuff/forum-stuff/exports-are-no-different-than-draining-the-spr
Mike, we don’t believe in cancelling oilfield culture around my place; I enjoyed your piece about your family and Ohio. It was good.
In point of fact, the United States had not had any true semblance of energy policy since Harold Ickes, the “Oil Czar” in the FDR administration, pounded the table.
Here is a direct quote from Mr. Ickes, from the late thirties: “Our total dependence on oil is undeniable. Our low-cost oil resources, known and unknown, may last for ten years or twenty years or even for thirty years, but they will not last indefinitely. Inevitably there will come a day of scarcity of cheap oil. We must, with prudent thrift, conserve our rapidly dwindling low-cost reserves.”
And in the words of his biographer, “When Ickes wrote that article . . . his warning were ignored. Ickes, champion of the public, was widely despised within the American black gold industry.”
Gerry
People did not want to listen to wisdom and curb consumption as a result people have no idea how much energy they use. A gallon of petrol has around 30,000 kcal.
We get the equivalent of 8 men days of work for $4
Mike B and Mike S
Am afraid the U.S has done with shale oil what the U.K. did with our North Sea oil.
We sold most of it when oil was $25 a barrel and less.
So much shale was produced at a loss, what a shame.
I´ve been harping about Swedens electricity exports to continental Europe for quite a while, but instantanious as it is compared to oil, there are similarities that will present itself later. So you either produce it by yourself or you do without when things heat up. Or, as always, use less…
Regarding North sea, I posted a graph earlier (courtesy Rune I think) that shows the same thing for Norway.
Oil policy whether in 1930, 1980 or 2010, would involve government intervention in the market.
Generally government regulation has been met by scorn in this country.
Generations of us have been told it is a perpetual drift to communism, as sound-bite form of brainwashing to enable a ‘free for all’ exploitation (as rapid a growth as can be grabbed) of the nations resources, without regulation.
Boom and Bust has been the resulting pattern.
I prefer a heavily regulated economy… With democracy, so that you can get rid of sub-optimal management, every 4 years. The booms and busts are less dramatic in this setting. Things last longer.
Mike, a hearty thank you for your compliment about my article. That gig at 3 Quarks Daily is my sole stab at remaining a “writer” in my advancing years.
Your blog article linked above is a hoot. Thanks for being America’s Jeremiah.
Mike – “Those people that import LTO will never pay us back in kind”
Over the last century the U.S. has imported what, hundreds of billions of barrels of oil. Why do you think the U.S. is entitled to import oil it will never pay back in kind ? Isn’t this a double standard ? Also, what’s your solution to the long term U.S. and world energy crisis ? Because not exporting LTO is not a real solution, it just delays a major U.S. crisis a couple of years(kicking the can down the road) and creates a bigger world shortage today.
Isn’t the best solution to lower dependence on oil ?
https://mishtalk.com/economics/the-ridiculous-reality-of-the-russian-oil-price-cap-debate-in-one-picture
Western allies to cap Russian Oil
Q: Why not cap the price of everything and end inflation?
A: Figure it out.
https://www.zerohedge.com/energy/us-shale-boom-officially-over
https://mishtalk.com/economics/president-biden-makes-oil-overtures-to-venezuelan-dictator-nicol%C3%A1s-maduro
Biden to get Venezuela to produce more oil.
Monroe Doctrine?
“You Can’t Be Neutral on a Moving Train”