Get this out of the way first. Making a prediction and then waiting 20-30 years to gather sufficient data to validate the prediction is not the way to do science. Yet this is the expectation in geoscience and earth science, where quick-turn-around of controlled experiments is not possible. The result of this lack of experimental control is that progress in climate science is glacially slow — since most models will fail to some degree, a geophysicist or climate scientist working in a specific domain may only get one chance in their career to test a long lead-time hypothesis. Feedback on results occurs over decades and breakthroughs are rare (see plate tectonics). So what I want to get out of the way first is: don’t expect any predictions from me. And I guarantee someone will ask for one.
However there are ways around having to do a prediction. One option is to consider the application of cross-validation of a model against existing data. As I was trained in the lab world of controlled experiments, this seems quite reasonable. One gets a fast turnaround on evaluating a model so you can try something else, or move on to another problem.
With that as a context, the problem I have been working on is finding a physical model of natural climate variability. This includes behaviors such as El Nino or La Nina or the multidecadal AMO, but excludes more random events such as arising from volcanic activity. I do have a working model, published in the book Mathematical Geoenergy (Wiley/AGU) back in 2018. Since then, I’ve spent time trying various cross-validation approaches to evaluate its overall merit. Judging by the ongoing research elsewhere, no significant progress is being made, so it makes sense to keep going forward.
The model is a straightforward extension of an ocean tidal model, first developed by Pierre-Simon Laplace in 1776. The idea is that the ocean’s thermocline is sensitive to tidal forcing and that solving the fluid dynamics determining its subsurface level would enable a better model than is currently available (the distance of the thermocline from the surface is roughly proportional to temperature at the surface). The guidance is only that the solution has to be clever, otherwise tidal analysts would have figured it out long ago. After all, conventional tidal analysis is something a high-schooler can do — but such a simple approach doesn’t work on the thermocline. Solving for the sloshing of a fluid involves computational iteration, as the key math is non-linear and thus non-amenable to conventional math approaches.

To speed the solution, the global tidal forcing is already known, calibrated from sensitive measurements of the Earth’s rotation rate deviations. This is known as the delta Length-of-Day (LOD) time-series, archived since 1962. The figure below is a tidal factor fit to the daily data, separated in three 20 year segments.
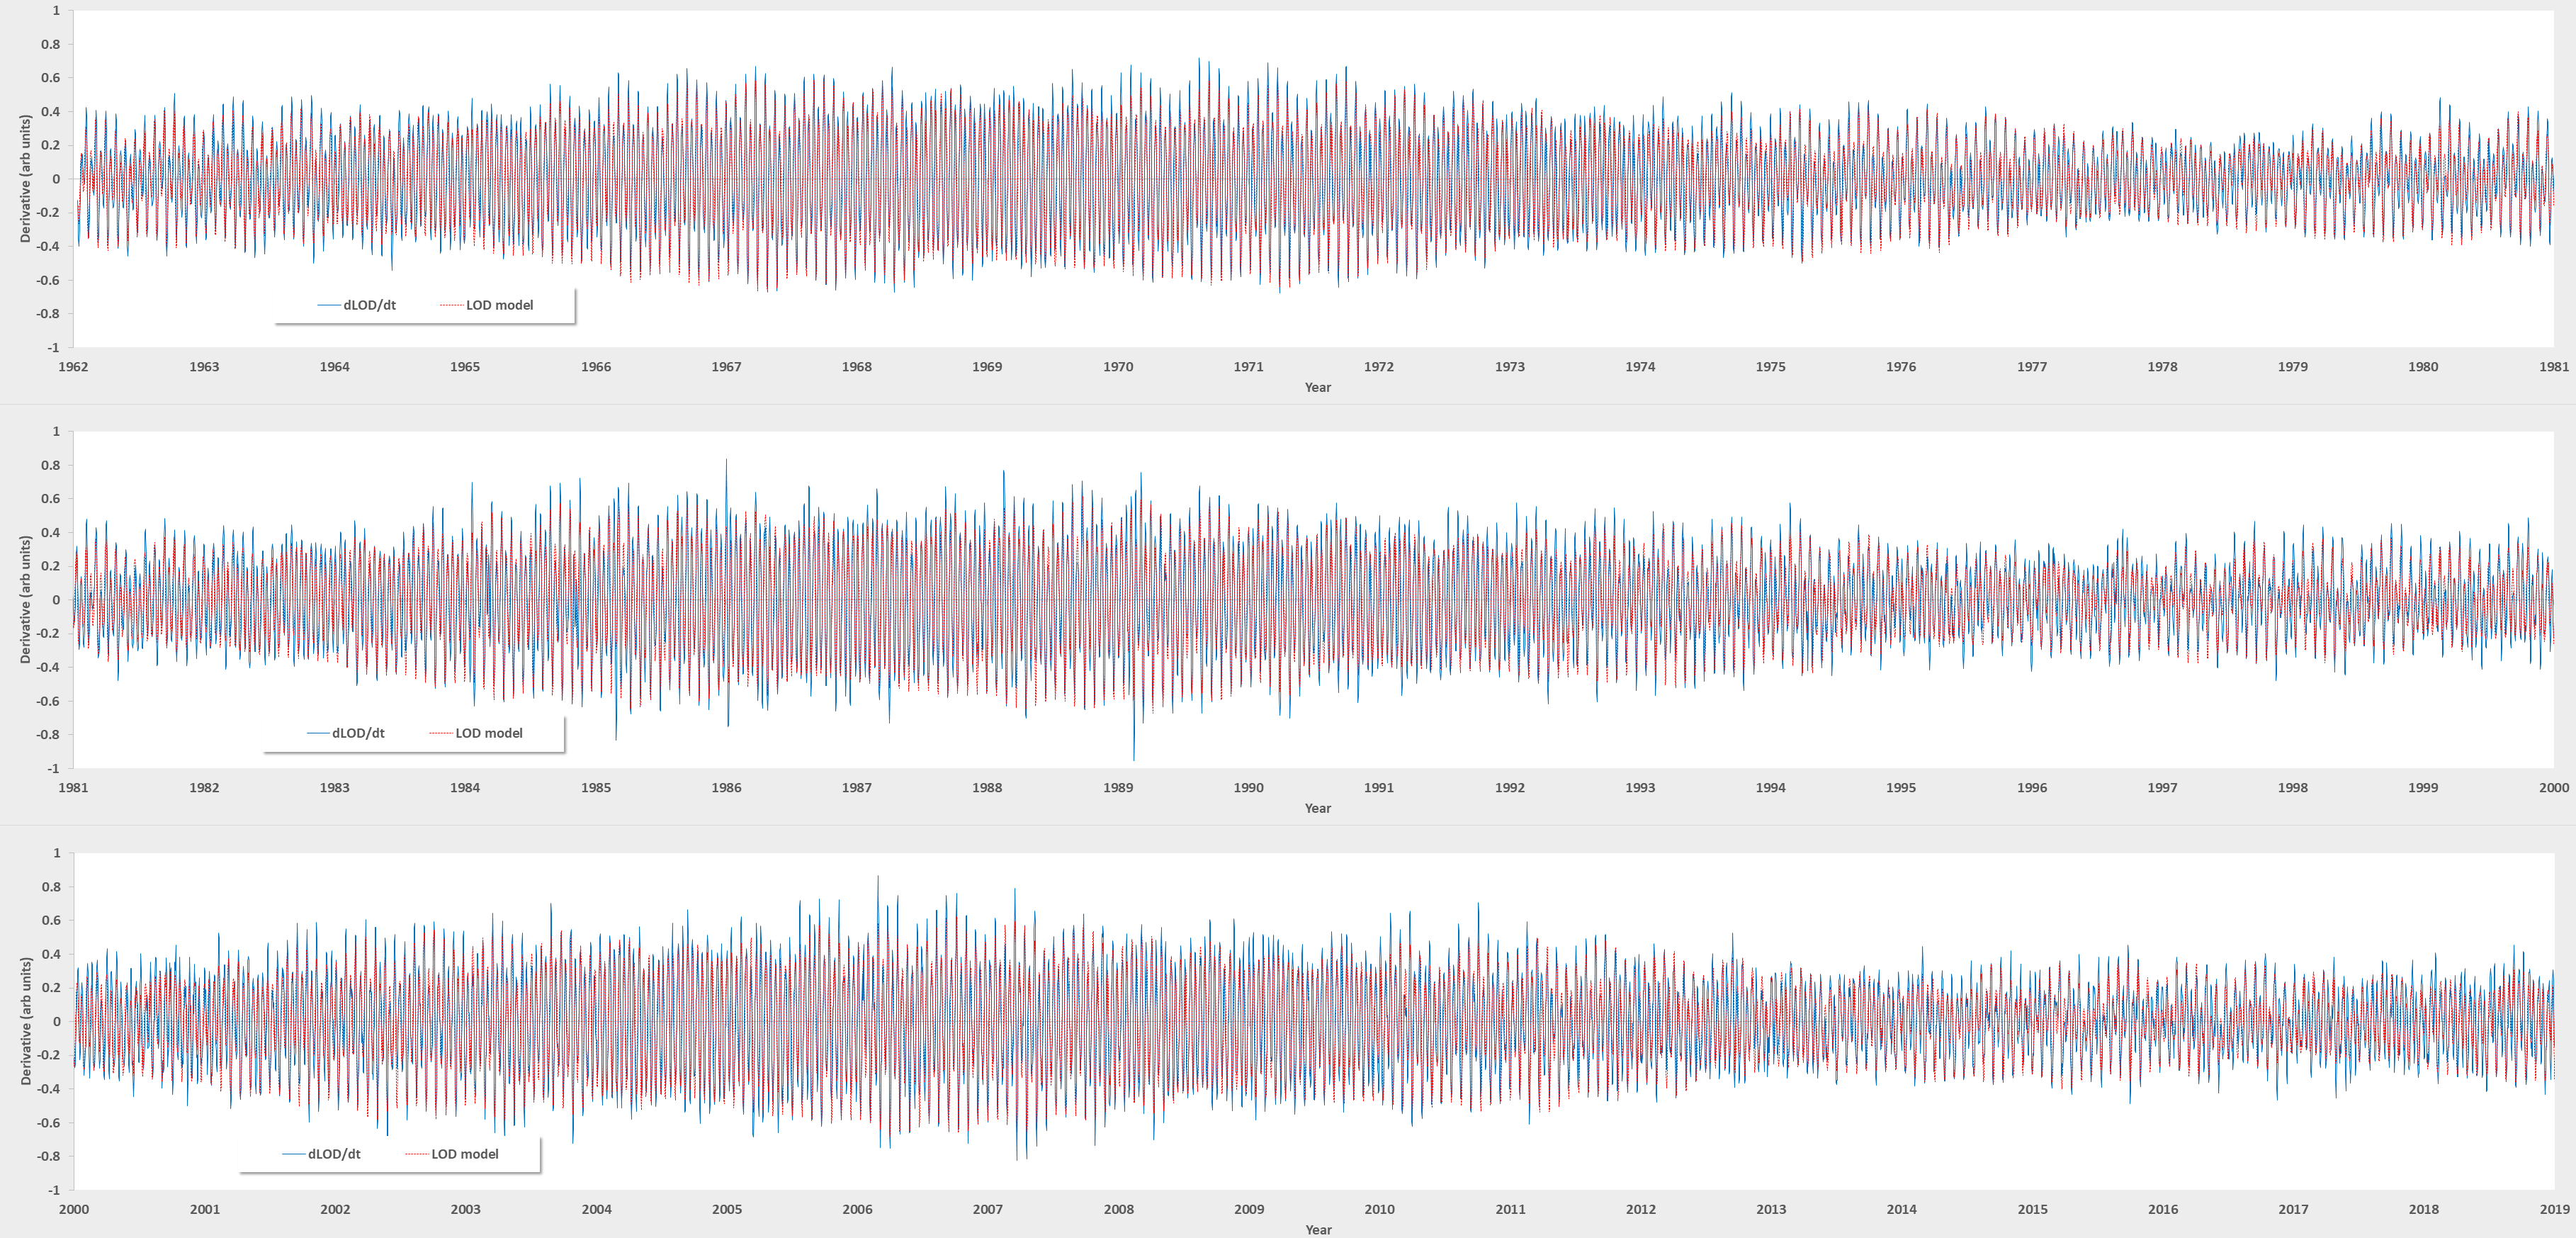
The reason a model is needed here is to back-extrapolate the time-series to dates before 1962. Some climate indices go back to 1855 and so we need every bit of data to validate a model fit.
Importantly, the above dLOD shows what is called stationarity in the time-series. There is clearly a pattern, with an envelope based on the 18.6-year lunar nodal cycle — this is an interference between the 13.66-day Mf tide and the 13.63-day Mf’ tide. There are other tidal factors as well, and I use a couple dozen for calibration, with the other important tidal factor the 27.55-day Mm tide, which follows the lunar perigean cycle.
The physical model I assume is that the thermocline undergoes an instability once or twice a year, corresponding to a well-known overturning cycle that occurs in fresh-water lakes [1]. Importantly, the tidal forcing at that instant is what provides an impulse to the thermocline sloshing response, and leads to a gradual relaxation until the next annual or semi-annual event, typically occurring in the next spring or fall, whichever comes first.
Well, you may or may not believe this as a valid physical model, but that’s the hypothesis I made and what I evaluated from the solution to Laplace’s Tidal Equations (LTE). The schematic for the solution is shown in the following figure — the last stage comprises the non-linearity (complete explanation in Mathematical Geoenergy). This leads to one or more spatio-temporal standing-wave modes for the ocean’s thermocline height and thus a temperature response leading to inter-annual climate variation.

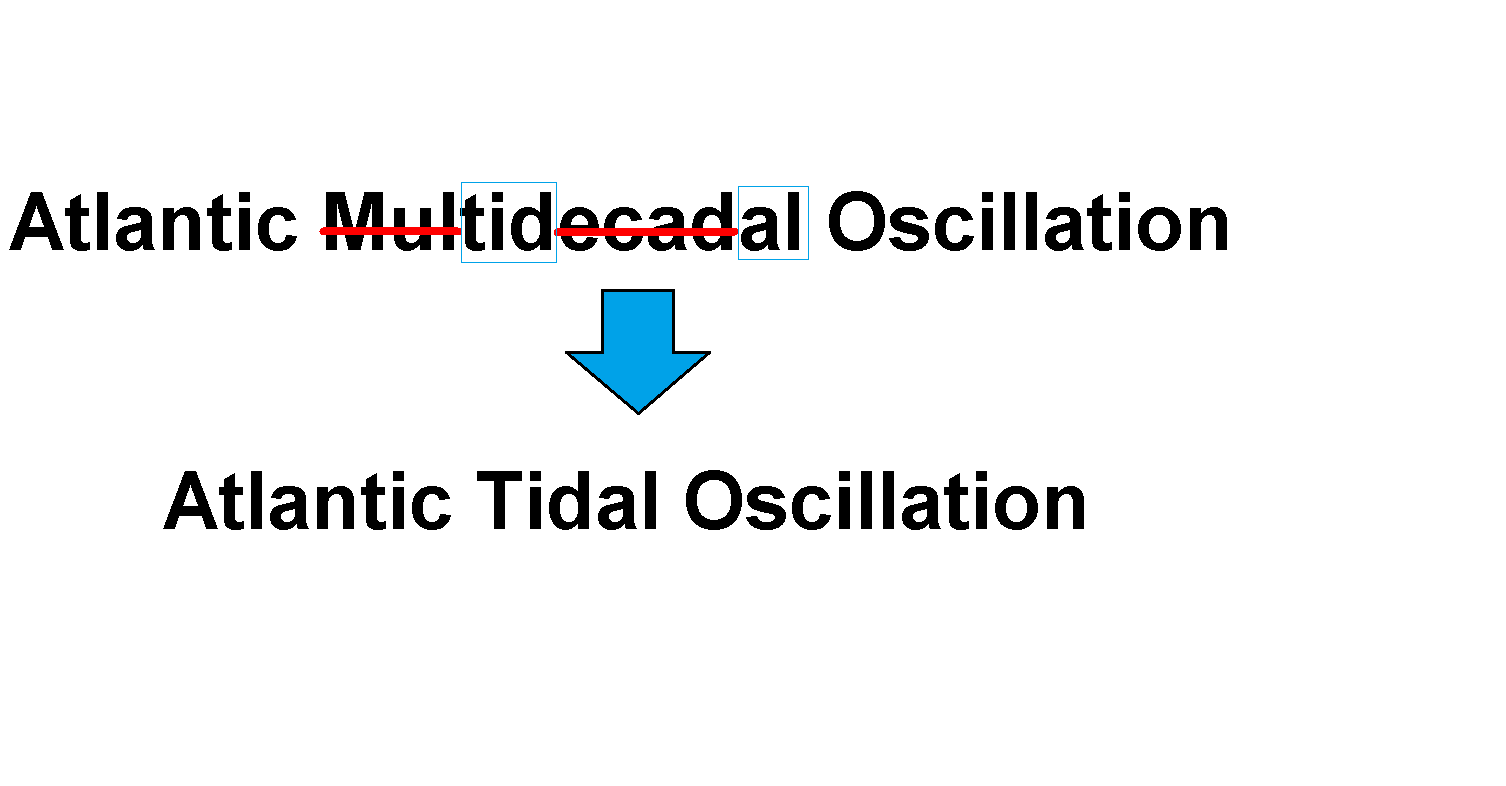
The results of fitting a model of the Atlantic Multidecadal Oscillation (AMO) is shown in the following figure. The cross-validation is in the BLUE interval that was not used in the iterative fitting process.

The significant multidecadal variation is straightforwardly explained by the Mt tide constructively interfering year after year until it flips into a destructive interference phase. Almost precisely 40 Mt tidal cycles (~39.99) will fit into a year and the difference leads to the long term variation [2]. That’s the left inset in the figure above. The LTE modulation in the middle inset leads to the observed ~67-year cycle in the AMO data. So the ORANGE arrow indicating a slow variation in the spectrum leads to the observed cycle.
A portion of the faster variations are caused by a higher-frequency standing wave mode. These modes are keyed to an annual and higher harmonic frequency and show a phase dependence depending on the level of the tidal forcing at the impulse time.
This is strange and non-intuitive behavior but fluid dynamics is renowned for strange patterns. If further validated, this research represents an explanation for a class of behaviors that has remained elusive over the years. How far can we go with the behavioral modeling? It appears to be extremely structurally sensitive, similar to the sensitivity of GPS calculations whereby if a satellite location is only slightly off, a GPS position is way off. But this also has the property of providing extreme accuracy if it is calibrated correctly, including leap seconds and all the other details that go into orbital dynamics. Thus it is conceivable that AMO, ENSO, and other climate indices can be predicted years in advance if enough effort [3] is put into further cross-validation runs. It may even approach the quality of conventional tidal calculations, which improve with the addition of smaller tidal factor cross-terms – a subtle non-linear correction. The following chart is of an AMO scratch fit that ends at 1985 and extrapolates to the current time. This time the BLUE interval is used for training and the more recent is cross-validation. It identifies AMO peaks for the following 10 years and then degrades.

The question now is:
Notes
- Raised and residing in the land of 10,000 lakes and having taken a limnology class in college, that’s my sole academic credential in the earth sciences.
- This property of the Mt tide is missing from a literature search. Apparently no one else has noted this from what I can find on Google Scholar.
- There are at least 3 former NASA JPL geophysicists working on the lunar/climate connection on their own time and independently. Claire Perigaud spun off a site called moonclimate.org which documents her efforts during her tenure there. James Shirley has several papers describing his torque climate connection model based originally on his research on the Martian climate. Steven Marcus is pursuing the lunar connection to climate variations through LOD analysis. NASA JPL employs the scientists most adept at solving the physics but clearly are not funding the research.
Commentary
Commenter asking about traveling waves

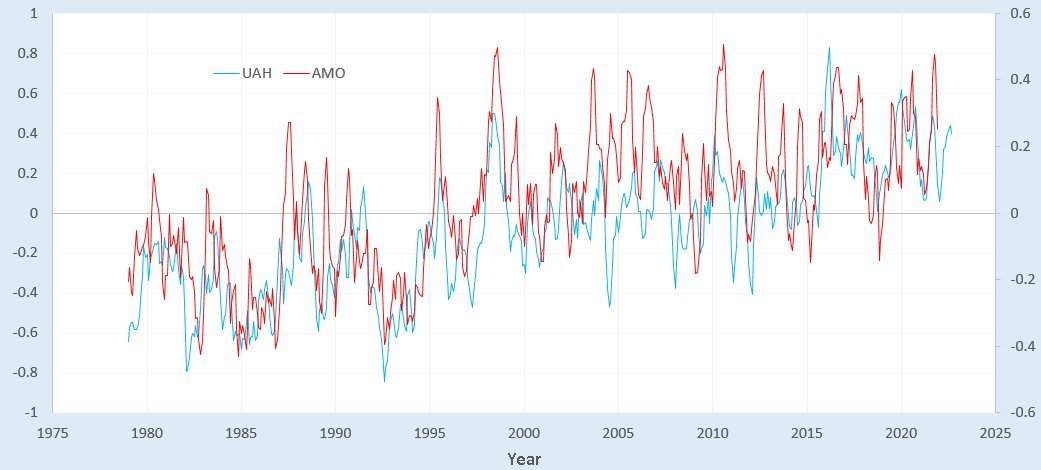
Same commenter asked about global climate variations — note how closely the AMO tracks global climate from the UAH satellite time series:
Comment for explanation of sloshing. Here is the YouTube of a wave machine in action
Ron comments:
“No, the earth does not slow down because the moon applies torque to it. And if it did, it could not possibly speed up again”
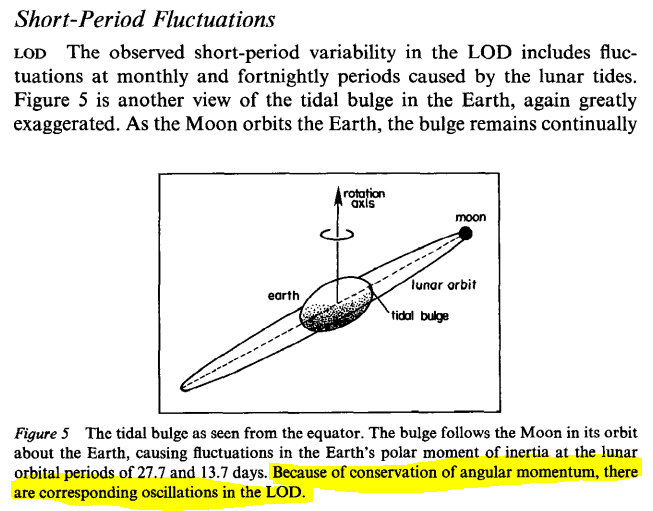
From a 1988 review article titled The Earth’s Rotation
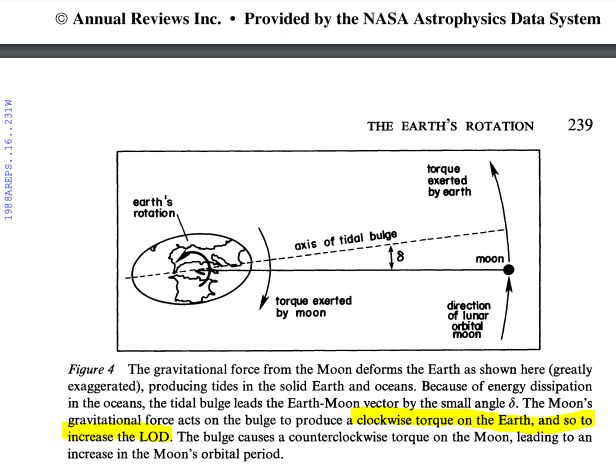
And it will then speed up because angular momentum of the closed system has to be conserved according to Newton’s law. The cyclic nature of the torque is simple to understand when you consider that the moon cycles in a fashion that produces more and then less torque on the earth.
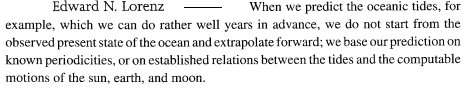
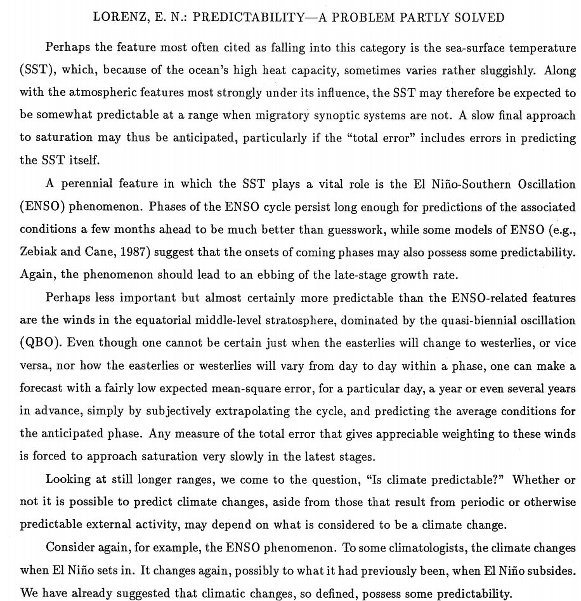
Comment on the Butterfly Effect context. Lorenz wrote
98 responses to “Explaining Natural Climate Variations”
Well the paper has convinced me that there are sufficient caveats in the conclusion to allow the authors to give any answer they like, even as they acknowledge that they are far from any useful solution today.
It appears to be extremely structurally sensitive, similar to the sensitivity of GPS calculations whereby if a satellite location is only slightly off, a GPS position is way off. But this also has the property of providing extreme accuracy if it is calibrated correctly, including leap seconds and all the other details that go into orbital dynamics. Thus it is conceivable that AMO, ENSO, and other climate indices can be predicted years in advance if enough effort is put into further cross-validation runs.
“If…” Indeed. Which is why, I guess, the global climate models are so hard.
Next!
I got paid working on GPS calibration for my previous employer so know what I speak. Progress was made by multiple teams improving the system incrementally. You done anything close?
Didn’t mean that to sound disparaging of your efforts, just that you are essentially trying to fine tune the fluttering of the allegorical butterfly’s wing, and then to detect significance in the resulting storm. I know its hard, and progress is incremental. Made harder, no doubt, by the fact that you are working with a constantly changing (probably for the worse) real climate. (Crawls back into my dank hole for a bit.)
scroll to the bottom to see response
Also, there’s a brand new thread on RealClimate discussing attempts at modeling climate variations: https://www.realclimate.org/index.php/archives/2022/11/serious-mistakes-found-in-recent-paper-by-connolly-et-al
I added a comment to the thread concerning AMO. The author of the top level RC blog post is NASA JPL scientist Mark Richardson, who says:
Premise: The AMO is not a real oscillation with a strict period. It’s been pointed out that if it was then the global temperature record would soon show a cooling since the AMO historically tracks HADCRUT4. This is explained well by Euan Mearns here: http://euanmearns.com/the-atlantic-multidecadal-oscillation-and-the-temperature-record/
So is that AMO cycle of ~66 years real? It certainly isn’t caused by sunspots as the cycle doesn’t match — throw that out since 11 years /= 66. Several NASA JPL scientists, C. Perigaud, J. Shirley, S. Marcus, have independently suggested gravitational/tidal effects from the moon and sun influencing the climate on a periodic basis. It’s not known at all that the two strongest long-period tidal factors Mf (fortnightly nodal) and Mm (monthly perigean) will create a long-term 134 year cycle when interacting with an annual impulse. In other words, the Mf and Mm create the nonlinear Mt tide so that an almost integral number of Mt cycles occur in a single year, and the period at which this will go through interference cycles is 134 years (assuming the length of the year = 365.25 days). This is readily apparent and plausible based on length of day (LOD) measurements of the Earth’s rotation. The point is that tidal fluid mechanics is capable of creating harmonics. Can’t throw this out since the first harmonic of 134 years is 67 years.
So why doesn’t NASA JPL fund this line of research, as it would be directly in their wheelhouse?
Thanks for the post Paul.
To everyone,
An update on OPEC will be posted later today. Any non-Petroleum comments should be under this post which will take the place of the Open Thread Non-Petroleum post this week.
Thanks.
Just a copy and paste from TAE .
“OK. I give up. Somebody tell me just who we are then.”
Pick the problems that you did not cause.
Pick the problems that you can fix with the solution.
1. Great Depression 2.0./recession
2. Inflation100% .
3. Great Stock Market Crashes, FTX bankruptcy
4. Supply line disruptions/delays/failure
5. Bank failure/financial crisis/rising interest rates/credit card failure/lending failures/rising taxes
6. Increase Death and misery/drug overdose/suicides/vaccines/long covid/addiction
7. Restructuration
8. Real estate crash/re-evaluation
9. social instability
10. Wars (trade/information/propaganda/chemical/biological/emp)
11. Mass migration
12. deindustrialization
13. pension funds totally collapse
14. layoffs/bankruptcies
15. Jubilees/canceling debts
16. increase in crimes
17. increase police activities
18. freeze and seize assets
19. censorship
20. increase emergency use/war measure acts
21. Failure of educational institutions
22. unreliability/fudging/lying of statistics
23. Increase of wrong opinions and lack of facts
24. increase of disinformation/misinformation
25. Increase of …. Quiet Quitting, decrease of assuming responsibilities, increase of fault pointing, avoiding responsibility
26. loss of electrical energy. ( Too many functions to list that are needed/required for the operation of war, finance, and the operation of social/economic/political structures
27. Decreasing cheap natural resources
28. Global weather extreme/fluctuations
29. Worldwide food insecurity
30. Political instability
Things that make me go hmmm.
27. Decreasing cheap natural resources
My work in retirement years is to capitalize on my background in chemistry, robotic software, and geology by research into improving on the return from mining here in Mina, Nevada. It involves reducing the human effort in mining, increasing electrification and use of low temperature processes, and increasing the utilization of mined rock.
So far it is all experimental in the lab and in the field.
Hi Paul,
I appreciate the efforts you have gone through. They are quite extensive.
I attended an American Meteorological Society meeting in Phenoix, AZ (1985?). Outside the presentation was a moving graphic not unlike some of your work. As I studied it for some time, I could see a wave cross the Pacific from west to east, sort of appear in the Atlantic but was there very faintly and then reestablished itself in the Indian Ocean. It’s anecdotal.
Have you looked at the Polar Science Center? Since 2012, the ice volume has gone “sideways”.
http://psc.apl.uw.edu/wordpress/wp-content/uploads/schweiger/ice_volume/BPIOMASIceVolumeAnomalyCurrentV2.1.png I wondering if a Maunder Minimum is not effecting the ice volume; keeping it “constant” since around 2012.
We are in the midst of a mega-drought in our US desert southwest similar to the droughts around 1100-1250 AD. Any thoughts??
Lots of unknowns.
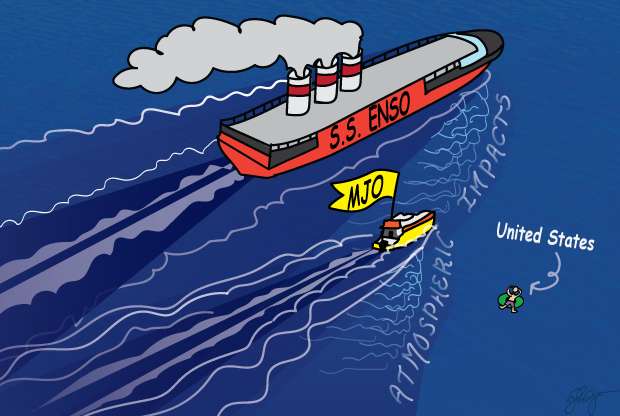
That’s likely an MJO traveling-wave (Madden-Julien Oscillation), it travels around the world quickly. Climate scientists don’t realize that MJO is a triggered offshoot of ENSO. It lags the SOI (which is an ENSO index) by 21 days.
https://imagizer.imageshack.com/img923/8939/lzIRem.png
https://imagizer.imageshack.com/img921/7305/bXNFwm.png
(as it’s a pain to add images to comments, I will display these on the main post, stay tuned)
As for global climate variations, remember how closely the AMO tracks global climate. Consider the UAH measure, which is from satellite observations. The peaks and valleys track each other.
https://pbs.twimg.com/media/Fg1WR3sXwAA20j2.jpg
Hi Paul,
Your post is way over my head.
But I’m interested in hearing anything more you have to say at any time about the implications of this work.
You’ll have to dumb it down a few notches, lol.
OFM,
I’d say the bar to clear in understanding the research is to have some intuition about the way that tides work, and also the thermocline.
The subtlety in the tides is that I am not using the well-known daily tides, as those are too short in duration, but using the so-called long-period tides, which directly follow the monthly lunar cycles, such as full moon, blood moon, etc. Those are long enough to have an impact on the mass of the ocean, so as to be able to slosh it.
Why does the ocean slosh? Well, any time that the earth slows down — as when the moon applies a torque to it — the volume of the ocean wants to keep moving. So in that case, the volume of water will want to start to build up at the western end of the ocean. By the same token, as the earth speeds up as the lunar torque is reduced, the water will want to reverse and it will build up in the eastern part of the ocean. That is the physical behavior behind the “motion in the ocean” . However, it’s complicated as anybody who has ever tried to carry a large bowl of soup around. Often it’s hard to anticipate which way the soup will slosh.
But, get this — the impact is orders-of-magnitude larger on the ocean’s thermocline. The property here is that the thermocline consists of a heavier, cooler layer sitting below a lighter, warmer layer on the surface. If anyone has seen one of these WAVE MOTION MACHINE gadgets that you can purchase at Sharper Image stores, you can gain intuition on what is happening. The wave machine has an oil layer and water layer of different densities, so this difference in density creates a reduced gravity environment, kind of like what would occur on the moon. This means that slight movements will cause that interface to fluctuate wildly. This is a YouTube that may not show up in the comments — if not I will post it above in the main text.
https://youtu.be/4Y7c6fxZmqA
That is all well and good, but what does that have to do with the climate? Quite simply, as you can see from the sloshing video — as the colder deeper water below the thermocline nears the surface, it starts to cool the surrounding atmosphere by acting as a huge heat sink. That is essentially a La Nina behavior. An El Nino is the converse. Either will have a huge impact on the climate. Same with AMO in the Atlantic Ocean.
So far it all makes sense. But do climate scientists or geophysicists understand this? In short, most do not. A few that work at NASA’s Jet Propulsion Lab seem to be on the right track, as I wrote in NOTE #3 in the post. One other group at Ohio State U is also working on it.
But there is still one last deal with the thermocline that North Country freshwater lake-people such as myself understand. Twice a year (spring and fall), the water above and below the thermocline goes through a “turnover” process whereby the density difference becomes smaller as the upper layer heats or cools. At that point in time, the interface becomes even less stable and that’s where the ocean sloshing can REALLY kick in. And depending on the torque of the moon at that point in time, the sloshing will tend to go in one direction or the other, and sustain until the next turnover event.
The rest is just working out the applied math. The issue is that the climate scientists won’t work out the math until they get past the first hurdle of understanding the mechanism.
The wider implications in all of this operate on many levels.
Paul, you are talking nonsense. The earth does not slow down or speed up. It actually slows down by 1.4 milliseconds to a day over the course of a century, according to the U.S. Naval Observatory. This is due primarily to tidal drag. But it never regains that 1.4 milliseconds. 70 million years ago, in the Late Cretaceous, a day lasted only 23.5 hours. 70 million years from now, a day will last 24.5 hours.
In Earth’s early history, a day was 23.5 hours and a year lasted 372 days
“The earth does not slow down or speed up.”
Ron, The Earth’s rotation rate slows down and speeds up as I plotted in the 2nd chart in the post. As the length of the day (LOD) is defined by how long it takes the Earth to complete one revolution, they refer to it as a LOD change. Perhaps it is kind of silly to call it this since the clock time doesn’t change, just the rotation rate does, with a predictable cyclic behavior governed by the lunisolar tidal periods. The strongest period is 13.66 days, which is the Mf tidal factor.
Paul wrote, in a reply to OFM: Why does the ocean slosh? Well, any time that the earth slows down — as when the moon applies a torque to it — the volume of the ocean wants to keep moving. So in that case, the volume of water will want to start to build up at the western end of the ocean. By the same token, as the earth speeds up as the lunar torque is reduced, the water will want to reverse and it will build up in the eastern part of the ocean.
Paul, I am deeply sorry to have to disagree with you on this point. But this is total, absolute nonsense. No, the earth does not slow down because the moon applies torque to it. And if it did, it could not possibly speed up again. And sloshing has nothing to do with the tides.
Paul, that shit just does not happen. Where did you read such nonsense?
Please post a link explaining this slowing down and then speeding up of the earth’s rotation. Yes, the moon, with a little help from the sun, causes the tides to rise and fall. But it all has to do with gravity. Spring tides (the highest tides) come when the sun and moon are in line or on the exact opposite sides of the earth. That is during a full moon or new moon. Neap tides (the lowest tides), come when they are 90 degrees apart. (First quarter and last quarter). But the moon has a far greater effect on tides than the sun. It is all about gravity.
Ron said:
Links are added to the end of the blog post. These are good questions to ask because the stuff that is well understood does not normally come up in conversation. Only the stuff that is still being worked out, such as the long-term meandering drift in LOD, gets pushed in science press releases.
There is also a recent paper by a professor that I have been conversing with
[Lin, Jialin, and Taotao Qian. “The Atlantic multi-decadal oscillation.” Atmosphere-Ocean 60.3-4 (2022): 307-337], where Lin states:
Lin has another paper where he discusses the huge subsurface waves the Pacific as being due to tides. He says it can’t be due to wind because the wind lags the wave front: https://www.nature.com/articles/s41598-019-49678-w
Paul, you completely misunderstood that article: The Earth’s Rotation. The article explains that there is a linear change of about 2 milliseconds over a century. (It is actually 1.4 milliseconds). But because the earth’s core rotates at a different speed than the mantle, there are sometimes a fluctuation of 4 to 5 milliseconds over 20 to 30 years. (Bottom of page 233).
This has nothing to do with the tides. It does not affect the tides at all.
Also, the total angular momentum of the total earth (core plus mantle), does not change at all. That would be impossible because the angular momentum could not “catch up” if it ever slowed down. It does slow down, however, by 1.4 milliseconds every 100 years. And it never catches up.
Last sentence on page 233: “Note that even 150 yr of data is inadequate to clearly separate the linear increase in the LOD from the decade fluctuations.”
Ron,
Paul is talking about the short term variability in length of day, the part of that paper after page 233.
Paul understood the paper quite well.
What Ron is discussing — this long term wandering of the LOD over the decades does exist, but it’s not a strong impulse over a short period of time. Go to Wikipedia and click on the graph where the length of day will change by a millisecond over the span of two weeks, all due to lunar tidal forcing. (The annual and semiannual change is also of the same order)
https://en.wikipedia.org/wiki/Day_length_fluctuations
https://upload.wikimedia.org/wikipedia/commons/5/5b/Deviation_of_day_length_from_SI_day.svg
Now remember (from the thread above) that bowl-full of soup that you are carrying around. If you make sudden movements, it’s likely to slosh more than if you move gradually. I am writing this to improve your intuition as to what is happening.
Dennis, Thanks, the paper that does an in-depth analysis is by Richard Ray of NASA
“Long-period tidal variations in the length of day”
I used Ray’s results to cross-check my own analysis. Will place that chart in the post above.
From your link. The dark line is the variation of the length of day in milliseconds over 48.5 years.
From your link. The dark line is the variation of the length of day in milliseconds over 48.5 years.
Notice this line: Red line is the contribution to LOD from all tidal lines longer than 1 year, which is primarily the line at 18.6 years. According to Table 3, its amplitude is 0.160 ms. In the observed LOD series, the 18.6 year line is obscured by decadal variability from nontidal processes [cf. Chao et al., 2014].
An amplitude of .160 milliseconds! 🤣
Nuff said!
Click on the chart to enlarge.
Ron,
5 milliseconds over 25 years would be an average change of 0.2 milliseconds per year. In figure 5 we have about a 2 ms change over roughly 11 years, roughly the same as the core to mantle interaction you reference. Based on the 1988 paper the tidal contribution is understood much better (as of 1988). It is a basic application of classical physics and astronomy.
Also note that the long term lengthening of the day of 1.4 ms per century is a very slow rate of change in comparison only 0.014 milliseconds per year. Remember that for changes in forces it is acceleration that matters. F=ma is Newton’s Second law.
Dennis said:
And then there’s the change in acceleration, which is referred to as jerk. A jerk impulse, say due to an earthquake, will lead to a tsunami, which is another intuitive way to think about it. So essentially the mass of water that is prone to sloshing is subject to a measurable acceleration or deceleration every two weeks, and the response along the subsurface thermocline generates waves that can reach 100’s of meters in height.
It could be that Ron thinks the gray line in the LOD chart he posted is just noise. Well it’s not, and if one zooms in on it, it’s composed of annual, semi-annual, monthly, and fortnightly tidal signals. The derivative is what I posted in my 2nd chart.
It doesn’t really matter. The variation from one to the next is in the fractions of a millisecond. That is not going to cause the oceans to slosh very much. And it will definitely not affect the tides.
The subsurface thermocline sloshes. The reason that the oil-water wave machine works the way it does is because of the slight density difference in the oil layer and water layer. This reduces the effective gravity and makes the interface extremely bouyant. I placed a YouTue of the wave machine in the top-level post — note that the surface isn’t changing much.
But all this does is explain the mathematical model, which works better than one can imagine given that it only features a few degrees of freedom.
Exxon has revised their graph on peaking crude oil!!!!!!
According to Exxon Mobil, we will be peaking in **world** crude oil production around the year **2032 ** (was 2040 for many years prior to this). The fourth graph at:
https://corporate.exxonmobil.com/energy-and-innovation/outlook-for-energy/energy-supply#Liquids says their current analysis has shifted to much sooner than later and it is very pronounced.
Hi Peterev,
I took a look at the link , but I didn’t study it closely.
Where’s the part about conventional world crude production peaking in 2032?
The chart labeled “Liquids supply highlights the need for investment” seems to be saying Exxon thinks oil peaked several years ago.
Hi OFM,
I just did a screen capture and have it loaded up here.
Looking at the fourth chart down in the original reference, the one labeled “Liquid Supply Highlights the Need for Investment”, and placing a ruler parallel to the X-Axis and over the top of the “Tight Oil” Curve, you can see a peak around 2032. As Alimbiquated said, the actual peak was earlier but then Covid helped screw up the curve.
The big news is that Exxon has revisited their thinking on supply and the news is that instead of a vague 2040 peak that they have maintained for at least 7 years, the curve is more definitive and occurring sooner by roughly 8 years.
Thanks!
what about india and africa and their growing middle calss? india – especially – has just 30 million cars now and is projected to have hundreds of millions in next decades!!! can all of them be electric? do we have enough lithium and rare earh? then the lithium will be the next war for energy and prices will be much much much more than cars running by gas !! ok Europe and US consumption will be flat up to 2030! what about china , india , africa , indonesia and… which are growing fast> any wind/ solar energy in china is for coal replacement .. about 50% of china electricity is from coal… india is about to consume 100% more oil in 2040!! I think peak oil demand will be beyond 2030s and may be 2040 and about 130-140mbd. and definitely we have no more capacity to increase production… why do you say oil demand is at its peak when just as an example china and especially India will consume at least 15 MBD more!! up to 2030!! what about other african and asian countries? please !
Your eyeballs are deceiving you, Peter. Slowly move the chart to the top of your computer screen and you will clearly see that the point before the covid demand cut will clearly touch first. That is 2018 and 2019. That was the peak, according to this chart anyway. If you mouse over the chart and click to enlarge it, then this fact becomes obvious.
There is a discussion of this over on the OPEC post. Check it out.
Hi Ron,
I agree but 2018 & 2019 are past and there is an increasing amount of supply according to Exxon although less than the 2018 & 2019 period. Since we have “survived” that peak so far, I’m focusing on the 2032 secondary peak. After 2032, I appears it’s all downhill and appears to be “permanent” with no tertiary peak insight .
I’m wondering how the electrification of transportation will affect the curve due to the uptake?
We also have about a third of the world’s oil shale where a third of that is supposedly recoverable but needs a lot of water. Will we build pipelines from the Missouri river and/ or Great Lakes to the western Colorado and Utah areas? or will we have enough EVs not to worry about it. Somewhat like OFM, this takes sharper pencils and calculators than I have.
What are you proposing we ship in those pipelines, oil or water? You did not make that clear. But the answer is no, in either case. There is not enough oil left in the Bakken to support such a pipeline. A pipeline from Canada to ship oil sands oil would be economical, but that will not happen.
There is just no way to build a pipeline large enough to ship water from the Missouri River to Colorado to make much difference.
“We also have about a third of the world’s oil shale where a third of that is supposedly recoverable but needs a lot of water”
Peter- what shale field are you talking about?
These are fields in Western Colorado and Utah. It has nothing to do with the Bakken which is in North Dakota. Here is a map of the general areas:
(This probably should be moved to the petroleum discussion.)
Shell had a pilot program back about 10 to 15 years ago on a branch of the Colorado River. The manager was trying different techniques to see if one or more might be doable in producing Shale Oil from Oil Shale (or maybe its the other way around). His comments were:
1) The needed water from east of the Continental Divide because the water in the Colorado River was spoken for (and then some).
2) It would have to be a “political decision” because of cost and where the water would have to be taken from
3.) In his pilot project, he was using 2.5 barrels of water to produce 1 barrel of Shale Oil. He thought they might be able to reduce that to 2 barrels of water.
I’ve stated my calculations a couple of times but I’ll restate them here:
1) We are importing approximately 5 million barrels of oil more than we produce at home (give or take a few million barrels of oil).
2) If it takes **3** barrels of water (there is purpose in this in setting it to 3 instead of 2), then we would need 15 million barrels of water.
3) For a 10 year period, the Alaskan Pipeline transported 1.6 million barrels of oil per day. That’s close enough to 1.5.
4) from statement 2 & 3, 15 divided by 1.5 is 10 Alaskan Pipeline. Easy math.
5) If the Shell Manager achieved his goal of 2 barrels of water, you’d need 6&2/3rds pipelines. Since you can’t have 2/3rds of a pipeline, you’d need 7 pipelines and that’s just to bring water to the field.
6) You’d need 5/1.5 or 3.33 pipelines and as in statement 5, you’d need 4 pipelines; 11 in all.
Like Ron said, it’s not likely to happen especially now with the uptake of EVs.
I was wondering this is what you had been referring to.
Perhaps I am wrong, but I thought that the limiting factor was poor energetics of the liquification and extraction process rather than a lack of water in this big Oil Shale deposit (different beast than Shale Oil such as Bakken Permian, etc).
Here is the story I had read from about a decade ago on it-
” A significant challenge to the development of oil shale lies in the uncertainty surrounding the viability of current technologies to economically extract oil from oil
shale. To extract the oil, the rock needs to be heated to very high
temperatures—ranging from about 650 to 1,000 degrees Fahrenheit—
in a process known as retorting. Retorting can be accomplished
primarily by two methods. One method involves mining the oil shale,
bringing it to the surface, and heating it in a vessel known as a retort.
Mining oil shale and retorting it has been demonstrated in the United
States and is currently done to a limited extent in Estonia, China, and
Brazil. However, a commercial mining operation with surface retorts
has never been developed in the United States because the oil it
produces competes directly with conventional crude oil, which
historically has been less expensive to produce. The other method,
known as an in-situ process, involves drilling holes into the oil shale,
inserting heaters to heat the rock, and then collecting the oil as it is
freed from the rock. Some in-situ technologies have been
demonstrated on very small scales, but other technologies have yet to
be proven, and none has been shown to be economically or
environmentally viable at a commercial scale. According to some
energy experts, the key to developing our country’s oil shale is the
development of an in-situ process because most of the richest oil
shale is buried beneath hundreds to thousands of feet of rock, making
mining difficult or impossible. In addition to these uncertainties,
transporting the oil produced from oil shale to refineries may pose
challenges because pipelines and major highways are not prolific in
the remote areas where the oil shale is located,…”
Shale oil= tight oil
Oil shale= kerogen.
I prefer to avoid the use of the term shale oil because it is easily confused with oil shale.
The two sound the same, but the difference is that one (tight oil) is a viable resource, while the other is not.
From wikipedia:
The Green River Formation contains the largest oil shale deposit in the world. It has been estimated that the oil shale reserves could equal up to 3 trillion barrels (480 billion cubic metres) of shale oil, up to half of which may be recoverable by shale oil extraction technologies (pyrolysis, hydrogenation, or thermal dissolution of kerogen in oil shale).[14][15][16][17][18] However, the estimates of recoverable oil has been questioned, back in 2013, by geophysicist Raymond T. Pierrehumbert, who argued that the technology for recovering oil from the Green River oil shale deposit had not been developed and had not been profitably implemented at any significant scale.[19]
Even when you see it in print, it’s still confusing but I am talking about Kerogene in the Green River formation.
This Shell manager was trying various techniques and what Hickory found may be from his results. Some of the problem was keeping up the “fire front” due to the inconsistency of the kerogene within the formations. Most of this extraction is in mountainous areas and extracting it is going to be tough but whatever is extracted will need water brought in from east of the Continental Divide.
Interesting news from reneweconomy.com.au (Australia)
Western Australia sets new renewables record of 81% – in world’s biggest isolated grid
Give us more load! Why South Australia is trying to switch off everyone’s rooftop solar
Another inane comment about the world’s largest coal exporter. Top exporters in 2021:
Australia: US$43.9 billion (35.7% of total coal exports)
Indonesia: $26.5 billion (21.6%)
Russia: $17.6 billion (14.3%)
United States: $9.7 billion (7.9%)
South Africa: $6.08 billion (4.9%)
Greenwashing at its finest. You deserve a prize Islandboy.
https://www.worldstopexports.com/coal-exports-country/
“most of the renewables came from rooftop solar (61 per cent) installed on the homes and businesses within the state’s main grid”
that is impressive!
Doug- with all due respect, IslandBoys post is about solar. Solar is part of the reason that countries can scale back on coal, if they choose to.
And his post is not an example Greenwashing “disinformation disseminated by an organization so as to present an environmentally responsible public image”
An example in this context would be if the Australian Coal Exporting Assoc painted their ships green and put some solar panels on the terminal shed and hung a sign “Coal going Green”
Rather, the article he links points out- “It is also a sign that Australia’s grid is rapidly changing from a centralised, fossil fuel based system to a renewable and increasingly distributed grid. Consumers are now producers too, and rooftop solar is chasing base-load coal and other fossil fuels out of the grid.”
Give the man some credit where credit is due, or at least give a break.
Oh dear, and I thought greenwashing was: The dissemination of misleading information that conceals abuse of the environment in order to present a positive public image. Sorry.
Same thing as I said Doug.
He was talking about progress in the sector which can replace coal, if people choose to use it as such.
Realize that in Australia there is big coal business which has a big lobby and often heavily influences policy. But many citizens are not proponents of the coal industry. Just like in the US or Germany, both of which are also big coal countries.
A global tax on carbon would really help.
There has been a big shift in Austrilaian citizen views on climate, energy and the coal industry over the past ten years- you can read about here in the black side column.-
https://poll.lowyinstitute.org/charts/attitudes-to-fossil-fuels/
btw- Canada ranks higher than Australia on the the top ten list of global combined fossil fuel production
adjective: inane – lacking sense or meaning; silly.
I would be interested to find out how a comment outlining developments in a country that used to generate almost all of it’s electricity with fossil fuels can honestly be described as inane. The COP conferences have been focusing on emissions targets for dates like 2030, 2040 and 2050. The developments in Australia have profound implications for these targets regardless of what the fossil fuel lobby in Australia does or wants to do.
I will admit to being a dreamer but, is Tony Seba also a dreamer? If wind, solar and storage push fossil fuels out of the market for electricity generation in Australia, what does that say to the countries that are buying Australian coal, especially if those countries have good renewable energy resources? Most forecasting of energy consumption has underestimated the growth of renewables and overestimated fossil fuel consumption. Seba has leaned towards overestimating the growth of renewables but, his projections have been far closer to reality than most of the so called experts.
Seba is not exactly alone in his optimism. Below is a chart produced by Dutch academic (Senior Advisor in Electric Mobility at the Eindhoven University of Technology) Auke Hoekstra, showing the appalling record of the IEA when it comes to the projections for the adoption of solar PV. The Twitter thread from which the graph was extracted can be found at https://twitter.com/aukehoekstra/status/1507047932226375688?lang=en
By now it should be obvious to the dimmest bulbs that we will soon transition to solar and wind powered grid with battery backup (SWB grid). It is also obvious that by 2030 every new car/scooter/motorcycle sold in the world will be electric.
What is a big unknown is how bad global warming will get in the meantime and whether it is too little, too late. At any rate we owe it to ourselves to put pedal to the metal and get to the finish line as quickly as possible. My guess is that humans and industrial civilization will survive but there will be widespread suffering in many parts of the world.
https://www.dailymail.co.uk/news/article-11447127/Explosion-hits-Russian-gas-pipeline-amid-suspicions-sabotage-linked-Putins-war-Ukraine.html
Another Gazprom pipeline explodes?
Oh well, maybe in 2026 then.
UN chief Antonio Guterres said the UN climate talks had “taken an important step towards justice” with the loss and damage fund, but fell short in pushing for the urgent carbon-cutting needed to tackle global warming. “Our planet is still in the emergency room,” Guterres said. “We need to drastically reduce emissions now and this is an issue this COP did not address.”
Australia hopes to host the 2026 COP summit, Prime Minister Anthony Albanese said Saturday, seeking to overhaul his country’s reputation for foot-dragging on climate change. “It is a good opportunity, I believe, for Australia to show and to host what is a major global event,” Albanese said during a visit to Bangkok.
https://phys.org/news/2022-11-australia-aims-host-climate-summit.html
This is way off topic, but I’m unable to make any sense at all about what Musk is doing with Twitter.
At first glance he seems to be entirely off his rocker, but maybe there’s some method in his apparent madness.
I have no respect for him as an individual, but until now I’ve never seriously considered that he might actually be ………. intellectually challenged to such a degree.
Thanks in advance for any and all opinions and insights.
Twitter from a technical perspective isn’t very difficult. It is just text messaging.
The challenge it has is scalability ( lots and lots of users ) and targeted advertisements.
You could really achieve this with a couple hundred developers.
NOTE: Twitter is still running fine after all the firings and resignations.
Unlike brick laying, software coders can disguise how hard they are actually working.
True. With a distributed systems programming language it takes a couple lines to write a chat application. I remember doing this well before Twitter was released. At the time Twitter came online I thought — What’s the big deal?
This is what I wrote from 2001, rescued from the Internet Wayback Machine:
https://web.archive.org/web/20010129063700/http://www.tc.umn.edu/~puk/glade/chat.txt
To make it into a starter Twitter app, just have to store a hash table with all the nicknames (i.e. @ handles).
But now years later, the big realization is that the amount of information being stored from all the tweets accumulated over the years. A few days ago, I downloaded my Twitter history (@whut) because it is impossible to search any other way.
I suspect Twitter writes all their own stuff from scratch, to have control over it.
But a skilled programmer at home ( as Paul has demonstrated ) could write a simple version of Twitter by themselves leveraging existing libraries, modules, APIs etc.
I worked for an enterprise software company and everything was written in house otherwise you were at the mercy of the company ( Oracle bought JAVA ) that owned the code.
This being said, I don’t see how Elon justifies 44 billion for this purchase. Targeted Advertising (Twitter’s revenue) annoys people and creeps them out.
Who likes it when you are talking to your wife about back pain, and then you see an advertisement for back relief???????
Server storage is what would scare most off, otherwise it’s SnapChat where everything disappears in a day IIRC
Nothing ever disappears. You just can’t see it anymore.
Storage is redundant and effectively permanent. It gets moved to cheaper tape storage as it gets less useful and stored in multiple disaster recovery centres in case one gets blown up by a nefarious actor.
SnapChat is a lie, they still have all the photos, you just can’t see them anymore.
Yet, somebody has to lord over all that storage.
Since the Twitter data structure is essentially a directed graph, or triple store, every Twitter account can potentially connect to any other account. This is not conducive to a relational database which can be more easily chunked into partitions and stored that way. Very difficult to partition a triple store graph, so essentially the whole thing needs to be backed up.
It looks as if Twitter started with a relational database (MySQL) and then switched to NoSQL (Apache Cassandra) https://blog.twitter.com/engineering/en_us/topics/infrastructure/2017/the-infrastructure-behind-twitter-scale
Interesting. Thanks for sharing that Paul.
A Terabyte of data storage costs me about 100 bucks. In an IT center it is more along the lines of $20k – $30k per Tbyte cause you are also paying for the humans that are managing it and admin overheads.
The Bank of America probably processes 600 million+ transactions a day ( I have worked for banks before on transaction processing ).
Terabytes are nothing.
How you synch such distributed systems I am not sure….but it would be interesting to learn about.
thanks!
Here’s an AI hacker/CEO combing through the Twitter SW architecture about a week ago
2 hour video
https://twitter.com/realGeorgeHotz/status/1593109753579786240
OFM,
I’m an infrequent commenter here but Musk is such an interesting mover and shaker. I used to be fascinated by the hypergolic thrusters on the Dragon capsule, the efficiency and power of the full flow, staged combustion methalox Raptor engines and the stainless steel Starship/Superheavy that may go to orbit soon. Viewing a dual RTLS landing of Falcon Heavy boosters with their kerolox engines was, to me, as inspiring as watching the moon landing in the middle of the night when I was seven years old.
Musk could not have accomplished any of this without the help of Gwynne Shotwell and hundreds (thousands?) of talented engineers but as I read from people close to Musk like Eric Berger and Tim Dodd, Musk really is the brains that makes the final engineering decisions at SpaceX. The switch from carbon fiber to stainless steel for Starship for instance was recommended by engineers but the final decision was Musk’s.
I think where I’m going with this is that engineering, while hard (it makes your brain sweat/hurt), comes naturally to humans. Cultivating a multi-racial, multi-cultural, multi-species Terra-arium is hella hard. Musk has thrown his lot in with the autocrats/authoritarians/fascists.
I really do not want a future Terran overlord who trades horses for handjobs and space launch contracts.
“Musk has thrown his lot in with the autocrats/authoritarians/fascists.”
Yep…whatever he thinks will profit him the most.
“Musk really is the brains that makes the final engineering decisions at SpaceX”
His auto-pilot Teslas are brainless. The one “feature” I read about yesterday is they don’t recognize that the Tesla needs to stop behind a yellow school bus unloading kids. A person driving through that would be chased down and beaten with a baseball bat.
No testing at his companies. How many SpaceX rockets malfunctioned before they had a success? 3, 4, 5?
Regarding the top-level post on climate variations — I have spent the last 4 years off-and-on doing cross-validations on the fluid dynamics model. I do that because what matters is to get it right. Musk flaunts testing, user juries, etc because he can still make money. That may come to a head with Twitter as all software regression testing has likely gone out the window.
Paul,
The autopilot is a poorly named “feature”, it is dynamic cruise control plus lane keep assist, that’s about it. The full self driving is better, but still just level 3 automation where the driver is responsible for not running over children or driving into other cars or fixed objects.
It takes about 30 seconds using the system for any sane person to realize the need to pay attention.
Not a great system, but human drivers are not very good so the bar is low.
Dennis, Forgot you owned a Tesla 🙂
One thing about Twitter to keep in mind is that the company loses hundreds of millions — sometimes more than a billion — every year.
Facebook is a similar company in many ways, but it has been immensely profitable. Twitter’s main asset is its huge user base. Musk thinks he can use that to make the company profitable.
My guess is that he will radically change what the service does while keeping the name (and trying to keep the users) and try to turn it into something that makes more money, like TocToc or Meta or whatever the next great thing is. The heaviest users of Twitter are porn and cryptocurrency. Porn is here to stay, but cryptocurrency is not looking all that great these days.
I predict Twitter As We Know It is dead. Maybe the company is dead too, or maybe it will evolve into something new. It’s extremely risky, but it’s only risking bubble money anyway.
EDIT: A couple more points to consider: Twitter has tried in the past to add services like music and video, but failed. Also, the number of active users on Twitter has fallen by about a third from its peak.
Musk buying twitter is interesting. He’s all on about free speech on twitter, like it’ll save western civ from collapse or something, but what I think he fails to grasp is that Twitter is, perhaps, a $40 billion company that makes 90% of its money selling ads, and Proctor & Gamble will not permit its ads for Pampers to appear next to berserk anti-Semitism content. Ad revenues are gonna tank.
Musk buying Twitter was an EGO buy.
Selling ads is a risky business. Mainly because people don’t like them!!!
Musk is surrounded by YES men, so he thinks he is a genius. He is a smart guy, but not that smart.
Musk likely has a cluster b personality disorder. He’ll make better fertilizer than he ever did a human being.
It started as an ego trip, but in the end, Musk was also forced to buy Twitter. He tried to back out.
His best bet now is to turn it into a porn site.
The crypto crash is hurting social media a lot, because crypto generated a lot of advertising income. Twitter was hit particularly hard. It’s pretty clear that Musk doesn’t have a plan.
Musk is narcissistic. Sometimes this helps him. For example, the Tesla roadster was something he personally wanted. Because there were other people like him that wanted something similar, it was a success.
Sometimes Musk’s narcissism hurts him. His ideas about pickup truck design reflect the fact that he doesn’t drive a pickup and doesn’t really give a crap about the sensibilities of people who do.
Steve Jobs was like this too. He designed computers to be what he wanted a computer to be like for his own personal use. It worked very well for him. For example, he got annoyed at some design weaknesses of his own Sony Walkman, so he pushed for the iPod. Jobs stuck to personal devices, so he was successful.
Where Musk fails is trying to design systems. For example, never having experienced good public transportation, he hates public transportation. The Hyperloop and the Boring company are intended to undermine public transportation in America. He even got Las Vegas, famous for poor city design, on board. He can’t understand that public transportation might be a good idea even if he doesn’t want to use it, or that adding more lanes doesn’t fix traffic problems.
With Twitter he is making the same mistake. He isn’t interested in understanding how the system works as a company and a service. He doesn’t care how other people use it and what they want from it, or why. He just wants it to be the thing he wants to use. His chances of successfully fixing the company are fairly slim, because most people aren’t like him (or what he thinks he is).
Maybe some disagree,
but just as I prefer a capitalism that is heavily and intelligently regulated,
I prefer a ‘free speech’ that is also heavily and intelligently regulated.
Too many fools and cruel people to just have an open mike.
Sure, the decision makers can makes big mistakes on these regulation decisions,
but the mob and the clergy simply can’t be trusted, any more than one can trust the big companies and their profit hoarders.
I don’t think E. Musk has demonstrated any better judgement on these things than would any subpar Joe. He might be rich, but he has shown that he is unqualified to be a decision maker on policy issues affecting anyone else but himself.
Dennis, thanks for the permission to reproduce your chart. My flyspeck of an essay, As Goes Ohio, is no match for what I learn here at POB daily, but it’s my contribution to the discussion. Investigating the careers of two grandfathers in Ohio’s oil industry led me to a dismal conclusion, but one familiar to readers here:
As Goes Ohio.
Great writing Mike. I enjoyed reading that this morning, and then was pleasantly surprised to find that I *know* the author. Looking forward to part 2.
Edit: also looking forward to reading Mike’s book:
https://www.amazon.com/Metazoan-Variations-MIKE-BENDZELA/dp/1736009885/ref=sr_1_1?crid=1HC19NWY7E9T7&keywords=mike bendzela&qid=1669045734&sprefix=,aps,106&sr=8-1
Hmm, Bob, when did we cross paths?
Thanks for plugging my book. My mom, my editor, and a couple of my friends thought it was brilliant, but it has been a flop, mostly.
We haven’t. I only know you from this forum.
Hi Mike
Thanks for this link. It’s great. I’ve passed it along to half a dozen other people.
That’s nice to hear, thanks!
Imagine my surprise to find that Franz de Waal was part of the same venue at 3QD this morning!
Mike B,
Nice piece. A birdseye view of World Crude plus Condensate output (with my current best guess for future output from 2022 to 2110), total output for this scenario is 2580 billion barrels from 1910 to 2110. Feel free to use it if you wish.
Hi Paul,
Thanks profusely for your explanation of the nature of long term tidal effects and the interactions associated with the ocean thermocline.
I don’t have any problem at all seeing what you’re getting at now. Given that I’m a layman, it’s impossible for me to estimate how much understanding this phenomenon will contribute to our overall understanding of climate………
But I’m acutely aware of tipping points, and the way seemingly minor changes in input data can result in truly major changes in end results. You don’t even need a technical background to understand tipping points.
(Charles Dickens, in 1849, on the relationship between money and happiness: “Annual income twenty pounds, annual expenditure nineteen six, result happiness. Annual income twenty pounds, annual expenditure twenty pound ought and six, result misery.” These figures, extended out for a period of years, tell the whole story. Respectable prosperity versus starving on the street. )
It would appear to me that what’s needed most, as a practical matter, for now, is a research program that actually maps the motions of the thermocline layer of the world ocean in great detail over the approximate one hundred forty million square miles .
How fine grained, or detailed, such data would need to be is a question far above my own pay grade, but I will hazard a guess that if it’s collected often on a regular basis at distances of fifty to a hundred miles that would be enough to draw some hard conclusions.
It’s possible to deploy enough automated buoys to get it done, if your preliminary work, and that of the other people you mention, attracts enough attention to secure funding. Such buoys can be cheaply mass produced, and the satellites necessary to collect and down load the data are already in orbit, assuming there’s spare capacity available.
A lot of data involving thermocline behavior is already available as the result of oceanographic research already done over the last few decades, and a great deal MORE information is available, if modern navies that routinely operate nuclear submarines are willing to make it available.
Commercial ships could also be equipped with sonar systems capable of collecting such data at reasonable cost, in terms of the potential benefit, and some of these ships run the same routes routinely for years on end. But this seems unlikely, because releasing this data would be seen as dangerous to the military security of the countries in possession of it.
Plenty of data available. Terrabytes daily from satellites. Machine learning running on the data constantly. I’d suggest that they need to work smarter.
Interesting Twitter thread on discovering mid-Atlantic Ocean ridges
https://twitter.com/Ri_Science/status/1594683585587720194
Yesterday Google celebrated Marie Tharp. She was doubted about her sonar findings, even Jacques Cousteau didn’t believe it, until he went down to have a look for himself.
Video
https://youtu.be/TgfYjS0OTWw
Discussion on skepticism
https://twitter.com/wrathofgnon/status/1594550710275756032
Google doodle for that story
Hot off today’s press.
ALL SIGNS POINT TO WORLD BLOWING PAST THE 1.5 DEGREES GLOBAL WARMING LIMIT
“Attempts at the climate talks to get all countries to agree to phase out coal, oil, natural gas and all fossil fuel subsidies failed. And countries have done little to strengthen their commitments to cut greenhouse gas emissions in the past year. There have been positive moves, including advances in technology, falling prices for renewable energy and countries committing to cut their methane emissions. But all signs now point toward a scenario in which the world will overshoot the 1.5 C limit, likely by a large amount. The World Meteorological Organization estimates global temperatures have a 50-50 chance of reaching 1.5C of warming, at least temporarily, in the next five years.”
https://phys.org/news/2022-11-world-degrees-global-limithere.html
Back to Twitter for a minute.
I have a hard time believing Musk is actually so clueless as to destroy Twitter unnecessarily.
So……. maybe his game plan is to purge just about everybody, which would apparently leave him still owning the physical and intellectual assets of the company, plus all the accumulated data provided by account holders free of charge.
Maybe he thinks he can reorganize the company so that it WILL perform satisfactorily with a professional staff ten percent or less the size of the staff when he bought it.
Could this be his game plan?
Could it work?
I don’t think Musk is clueless, but he clearly talks above his knowledge level. Many of his tweets show he doesn’t really have a solid grasp of the subjects he’s talking about. Whether it’s cave rescue, Ukraine, Taiwan, tunnels, infectious diseases, pandemics, statistics, managing, etc. He call’s himself an engineer but doesn’t have an engineer’s knowledge.
I’ve know a number of people like that – argue a point that they don’t really know anything about, and when someone knowledgeable shows that they’re wrong, it just passes over their head because their arguing a completely different subject now. In Musk’s case, he just goes back and deletes his tweets. (There is a website that lists all of Musk’s tweets that he’s later deleted. Some within hours, and some within minutes of his original post.)
But it has occurred to me that the Musk we see now, must have been like this all along, we just didn’t see it until he started tweeting. I was curious about that, and did some googling, and sure enough, he has been like this all along.
There are people who’ve worked with Musk at SpaceX and Tesla, and describe working with him. There’s no doubt he’s a little ‘fragile’. SpaceX apparently has a group who’s job is to ‘manage Elon’ – heading off his dumber ideas and working around his dumber suggestions. Tesla managers cringe when Elon spouts off on technical issues – they have friends in other auto companies who make fun of Musk’s misunderstandings of the technical issues.
His management style is consistent with someone who doesn’t have a long work history. He started his career by creating his own companies. In the first two companies he created, he was fired from the CEO position. For SpaceX and Tesla he apparently learned, and it’s harder for the Directors to fire him now.
Musk did however hire some good managers, and they’ve done a good job managing the business of developing rockets, and maybe a slightly less-good job developing electric cars. (Tesla seems to have a very well-regarded drivetrain, but everything else is of sometimes spotty quality.)
There may also be something else at play. Someone who worked with Musk at Tesla a few years ago, said that the Elon Musk of today isn’t like the Elon Musk of five years ago. So maybe he’s got other issues developing.
Set of viewpoints worth chewing on. George had posted a link to this article on the oil thread.
https://www.resilience.org/stories/2022-11-22/the-renewable-energy-transition-is-failing/
This article has a good link to a Simon Michaux paper.
This article says it well-
https://www.foreignaffairs.com/world/not-just-another-recession-global-economy
The crypto crash is killing the GPU market.
https://www.tomshardware.com/news/gpu-market-nosedives-sales-lowest-in-a-decade
Good news for AI, I guess.
These models are complicated!
The model here looks so too except it’s focused on 1 variable(sun) & that 97 % is stunning (off by 10%who cares)
It hasn’t been retracted probably because math is hard to deny. Every year that passes seems to support the sun is entering a grand solar minimum. Good luck with green.
And as Pukite says we don’t have to wait for this one.
https://www.nature.com/articles/srep15689
The accuracy of fit of the both PC curves is better than 97%. ….
Hence, cycles 25–27 marks a clear end of the modern grand period that can have significant implications for many aspects of solar activity in human lives including the current debate on climate change.
AGAMEMNON, You are talking nonsense. Sunspots have little impact on climate in comparison to the annual variations caused by the earth’s orbit around the sun … maybe you’ve heard of the seasons?
That’s a fit to the sun’s magnetic field, and I see no fit to the Earth’s climate variations in that paper, only some vague claim that it does have some role.
Thanks. I do have to say these researchers are making bold claims. I interpreted it as less sunspots mean lower sun energy output.
They also show the correlation to a 300 year cycle.
I’m sure they’d be surprised by their blunder since they’re on record of the earth entering a cold spell.
In any case we’ll definitely know more in the next few years (not 30 or 1000) if they’re right.
AGAMEMNON said:
They are very aware of the blunder since the primary author ( Zharkova) had to face an embarrassing retraction of another paper on the topic.
“Heavily criticized paper blaming the sun for global warming is retracted”
https://retractionwatch.com/2020/03/04/heavily-criticized-paper-blaming-the-sun-for-global-warming-is-retracted/
Retractions only occur for the obvious or odious blunder. My approach to using the tides as a root cause of natural climate change could be subject to criticism but the climate science community seems to be ignoring it in the hope it would go away. On the other hand they took Zharkova head on because the argument was silly.
For anyone interested in further reading, there are a bunch of posts at Paul’s blog at link below
https://geoenergymath.com/
Thanks, Dennis helped a lot during the initial evaluation of the spreadsheet models. I have since moved on to using software to produce the results.
Also all of the software and simulation results at my GitHub repository under /pukpr. The top post here is about AMO, but I have recent results which describe the minimal change required to model ENSO, which is the climate behavior that gives rise to El Nino and La Nina events.
https://github.com/pukpr/GeoEnergyMath/discussions/17
Just a couple of parameters are needed to flip the behaviors from AMO to match that in Darwin, Australia (SOI measure of ENSO) on the other side of the planet.
How sanctions are curing Cuba’s oil addiction.
https://techxplore.com/news/2022-07-electric-motorcycles-havana-diesel-shortages.html
https://techxplore.com/news/2022-06-petrol-cars-cubans-electric.html
Castro died of old age—
This is a ridiculous argument and one that Lorenz (who coined the butterfly effect) didn’t even believe when applied to a large scale. We are talking about the sloshing of the oceans and the immense amount of inertial change required to keep that in motion.
from “Predictability of Weather and Climate”