A guest post by Ovi
Below are a number of Crude oil plus Condensate (C + C ) production charts for Non-OPEC countries created from data provided by the EIA’s International Energy Statistics and updated to April 2022. This is the latest and most detailed world oil production information available. Information from other sources such as OPEC, the STEO and country specific sites such as Russia, Brazil, Norway and China is used to provide a short term outlook for future output and direction for a few countries and the world.
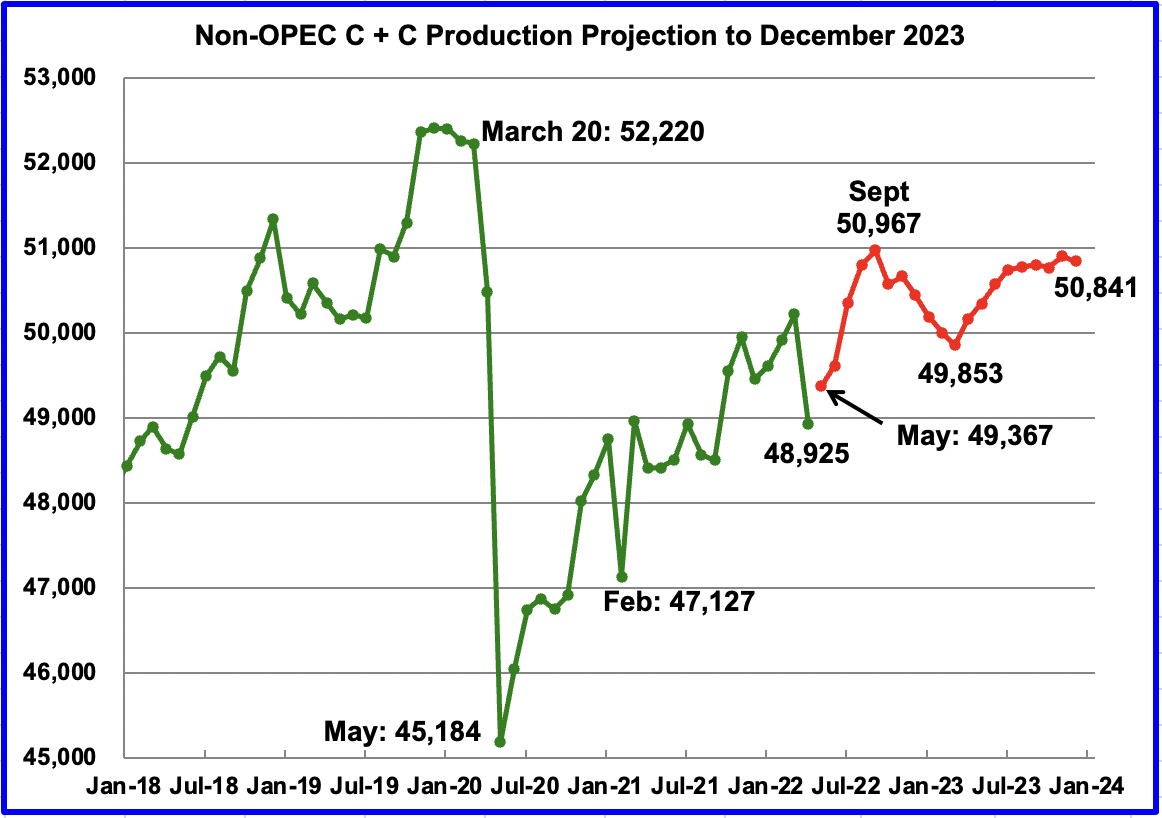
April Non-OPEC production decreased by 1,294 kb/d to 48,925 kb/d. Of the 1,294 kb/d decrease, the biggest decreases came from Russia, 965 kb/d, Kazakhstan, 175 kb/d, Canada, 95 kb/d and Norway, 78 kb/d. There were no significant offsetting increases. The April 2022 output of 48,925 kb/d is 3,295 kb/d lower than the March pre-covid rate of 52,220 kb/d.
Using data from the August 2022 STEO, a projection for Non-OPEC oil output was made for the time period May 2022 to December 2023. (Red graph). Output is expected to reach 50,841 kb/d in December 2023. This forecast is 456 kb/d lower than predicted in July. The production rise to 50,967 kb/d by September 2022 is due to projected increases by OPEC + and the U.S. Note that the September 2021 high is the high for 2022 and 2023.
Oil Production Ranked by Country
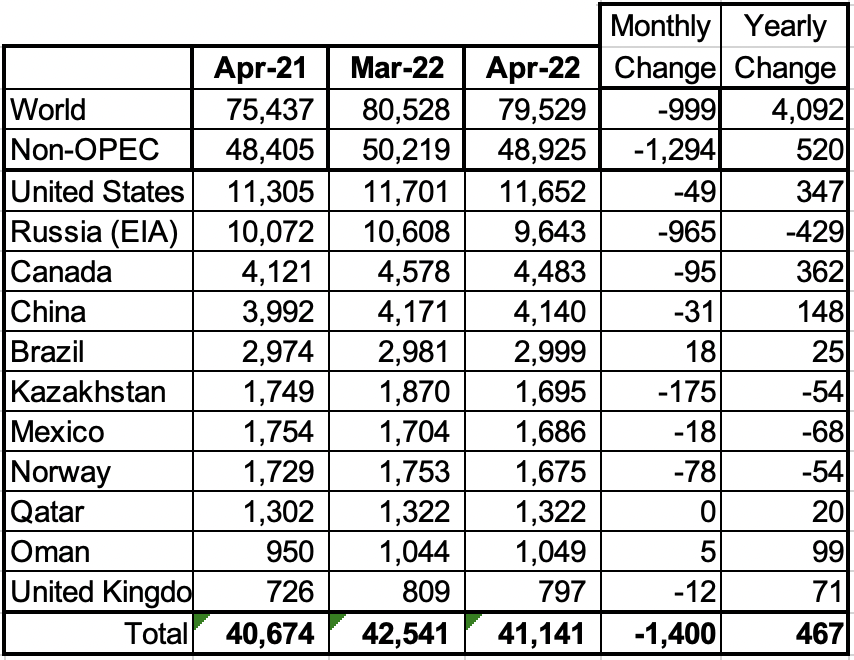
Above are listed the world’s 11th largest Non-OPEC producers. The original criteria for inclusion in the table was that all of the countries produced more than 1,000 kb/d. The UK has been below 1,000 kb/d since January 2021.
In April 2022, these 11 countries produced 84.1% of the Non-OPEC oil. On a YoY basis, Non-OPEC production increased by 520 kb/d. World YoY April output increased by 4,092 kb/d.
Production by Country
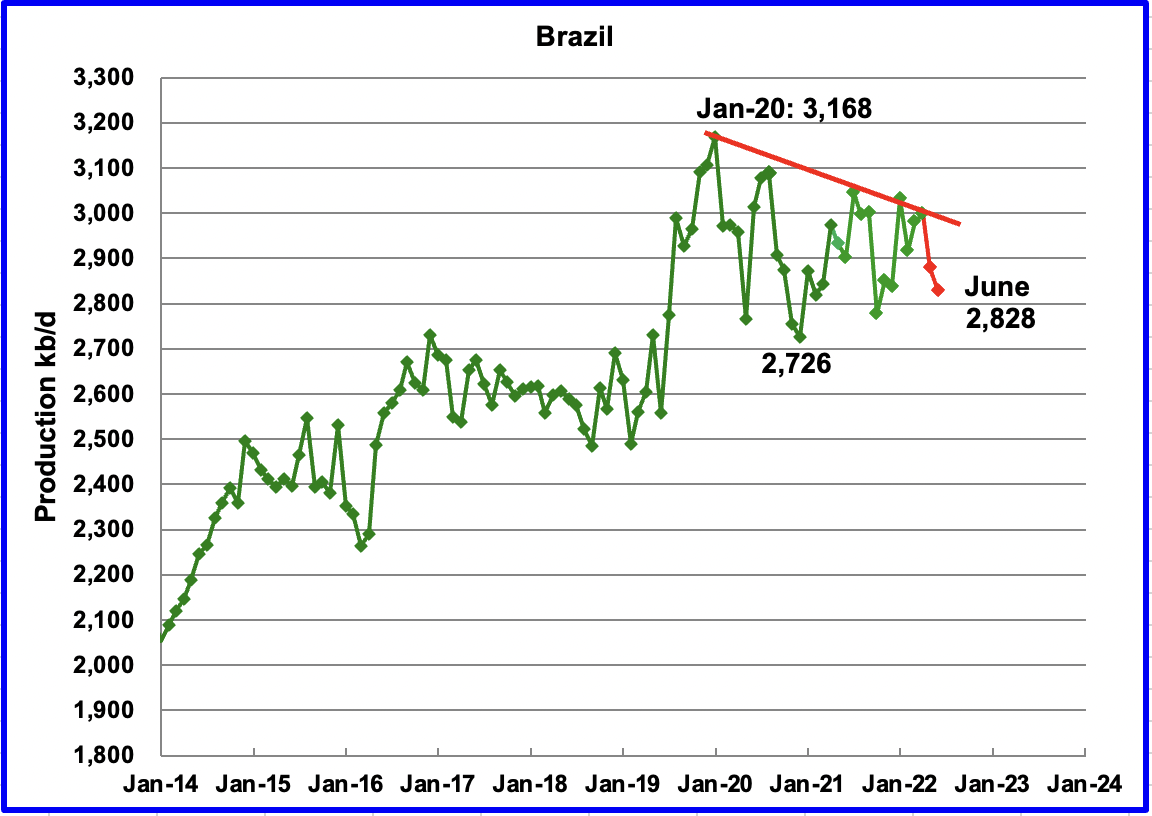
The EIA reported Brazil’s April production increased by 18 kb/d to 2,999 kb/d.
Brazil’s National Petroleum Association (BNPA) reported that May’s output drop was 120 kb/d. The drop was mainly due to interruptions in offshore maintenance at the Tupi field, according to OPEC.
On July 20, 2022, the BNPA reported that June production dropped again. No information on the June drop to 2,828 kb/d is available. However, a new field came on line on May 1, 2022 and it is surprising that no production increase was reported for June.
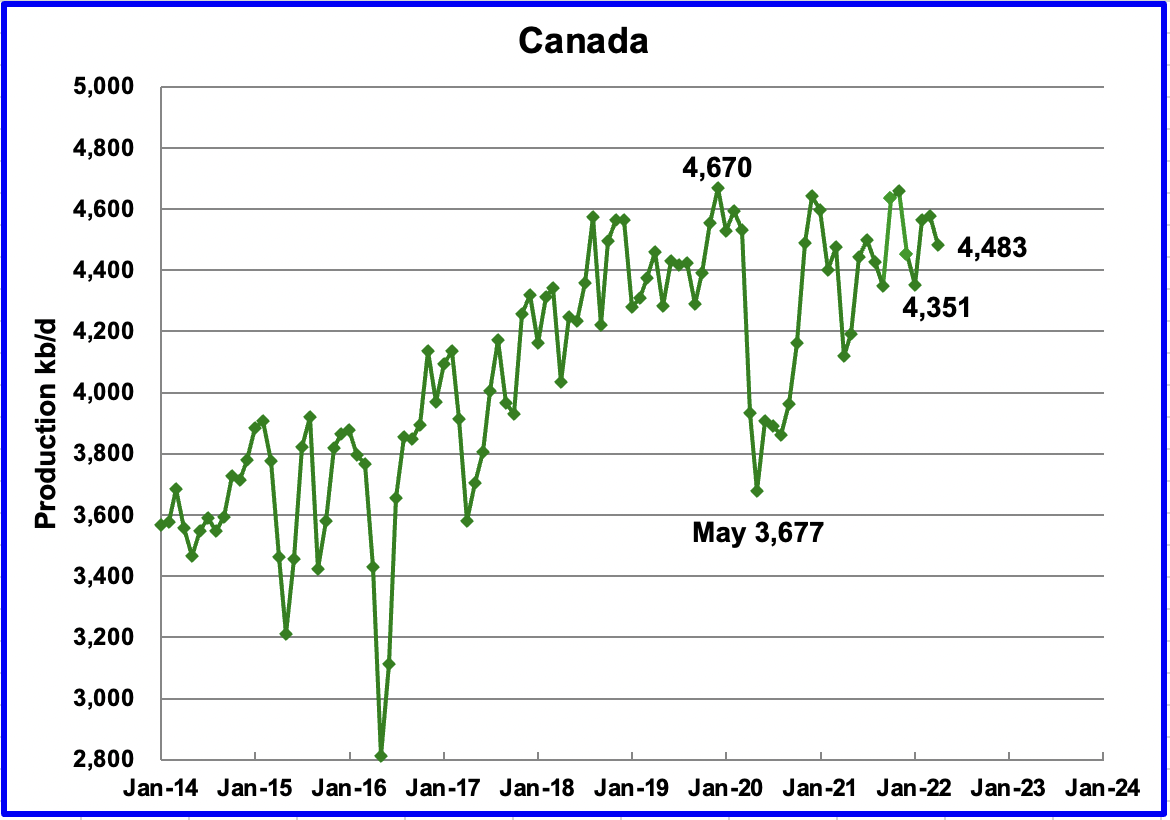
According to the EIA, Canada’s March output decreased by 95 kb/d to 4,483 kb/d. Preliminary data from the Canadian Energy Regulator indicates that synthetic crude production was down by 100 kb/d in April.
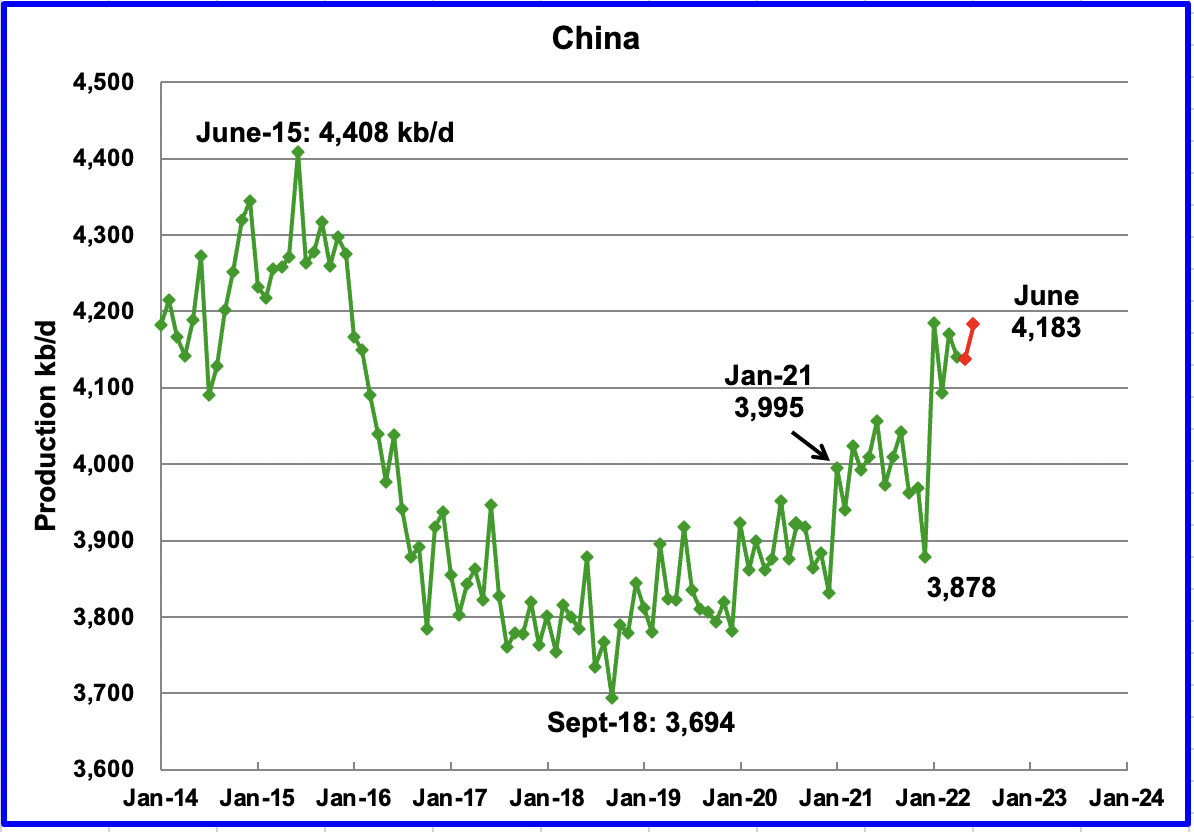
The EIA reported China’s output decreased by 31 kb/d to 4,140 kb/d in April. China reported that its output dropped in May and then increased in June by 46 kb/d to 4,183 kb/d. (Red markers).
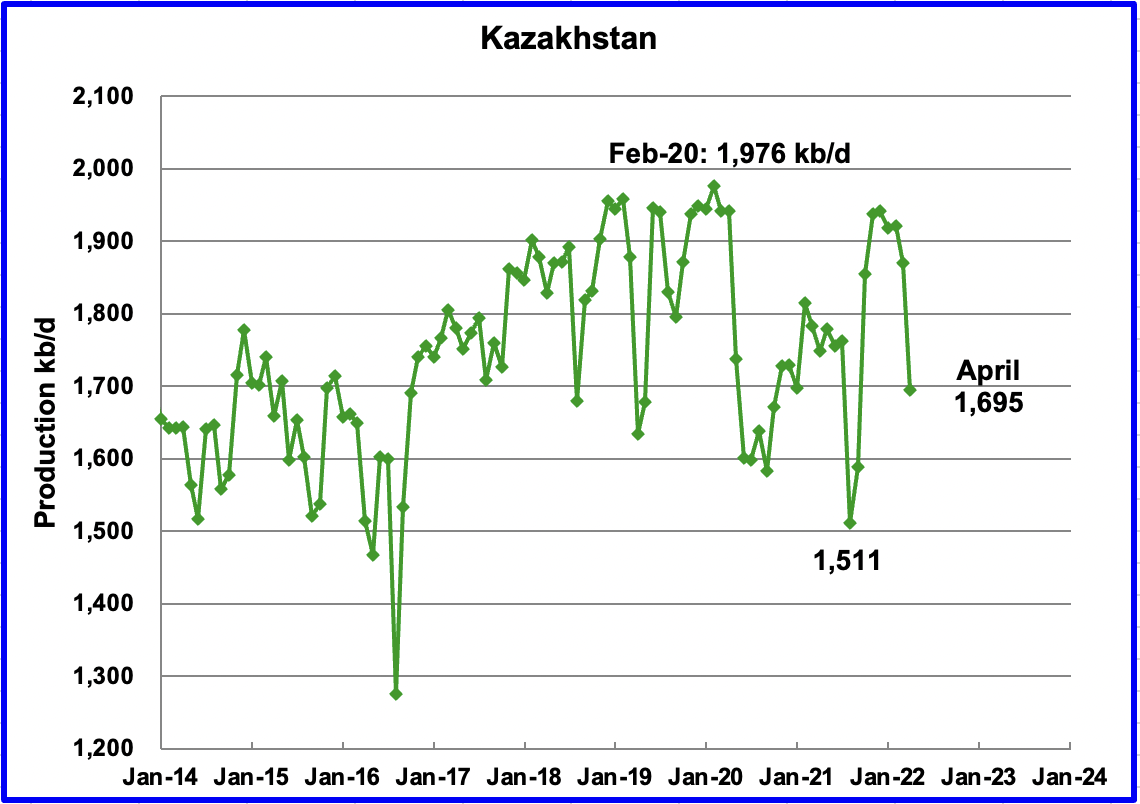
Kazakhstan’s output decreased by 175 kb/d in April to 1,695 kb/d. April output was projected to drop due to required repairs at a damaged loading terminal in a Black Sea port in Russia, according to this source. The projected drop was 320 kb/d but actually came in less at 175 kb/d.
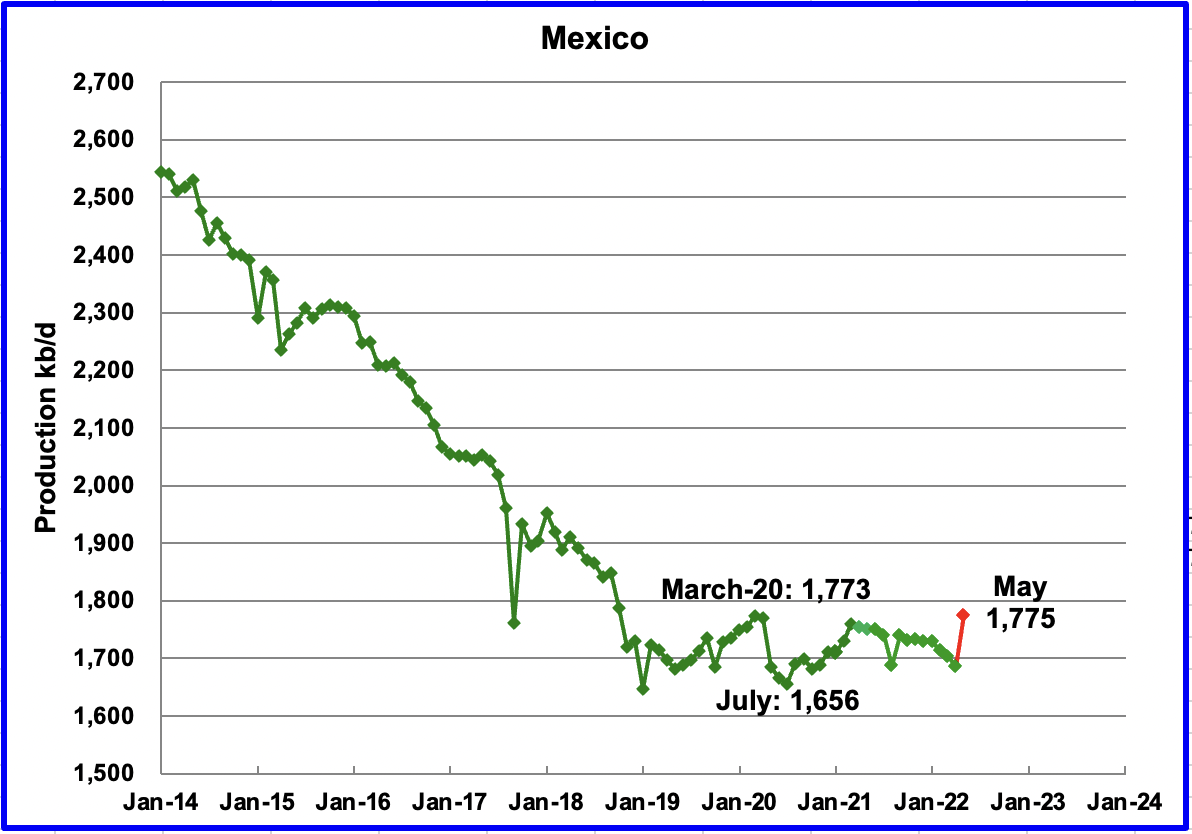
Mexico’s production as reported by the EIA for April dropped by 18 kb/d to 1,686 kb/d.
Data from Pemex showed that May’s output was 1,775 kb/d. However, the EIA reduces Mexico’s official oil production by close to 70 kb/d each month due to a different definition for crude plus condensate.
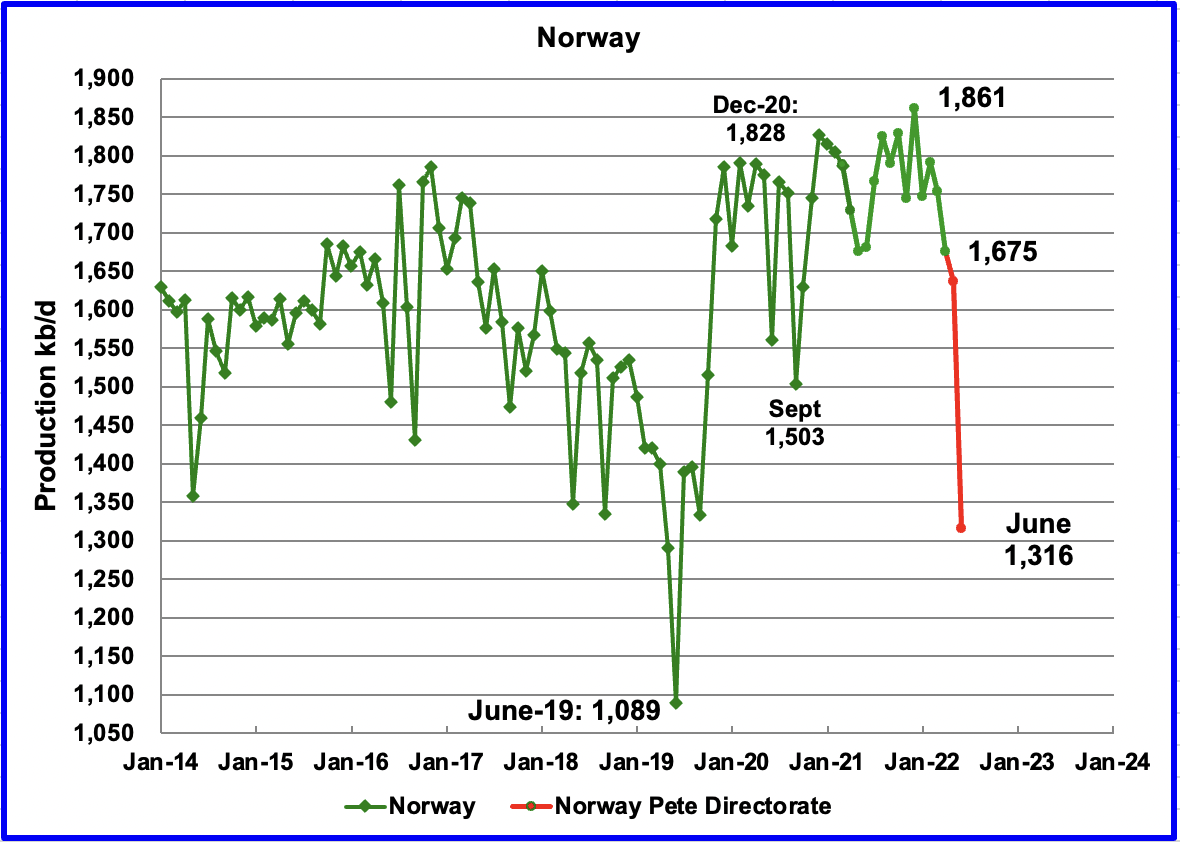
The EIA reported that Norway’s April’s production decreased by 78 kb/d to 1,675 kb/d.
The Norway Petroleum Directorate (NPD) reported that production decreased from April to June to 1,316 kb/d. (Red markers.). According to the NPD: “: Oil production in June is 0.2 percent lower than the NPD’s forecast and 4.2 percent lower than the forecast so far this year.
According to OPEC, the continuing drop was due to summer maintenance in offshore platforms and some operators prioritizing gas production.
Growth is expected in late 2022 when the second phase of the Johan Sverdrup field development starts production.
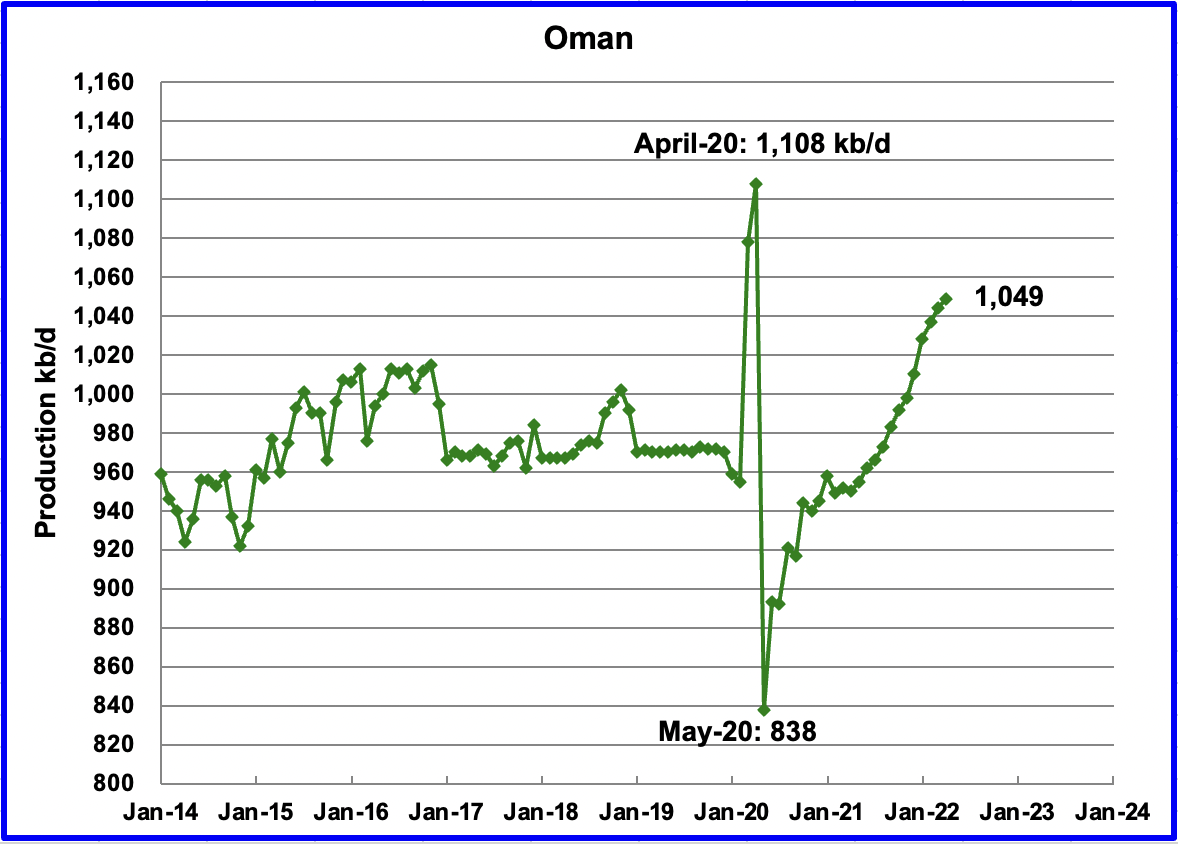
Oman’s April production increased by 5 kb/d to 1,049 kb/d.
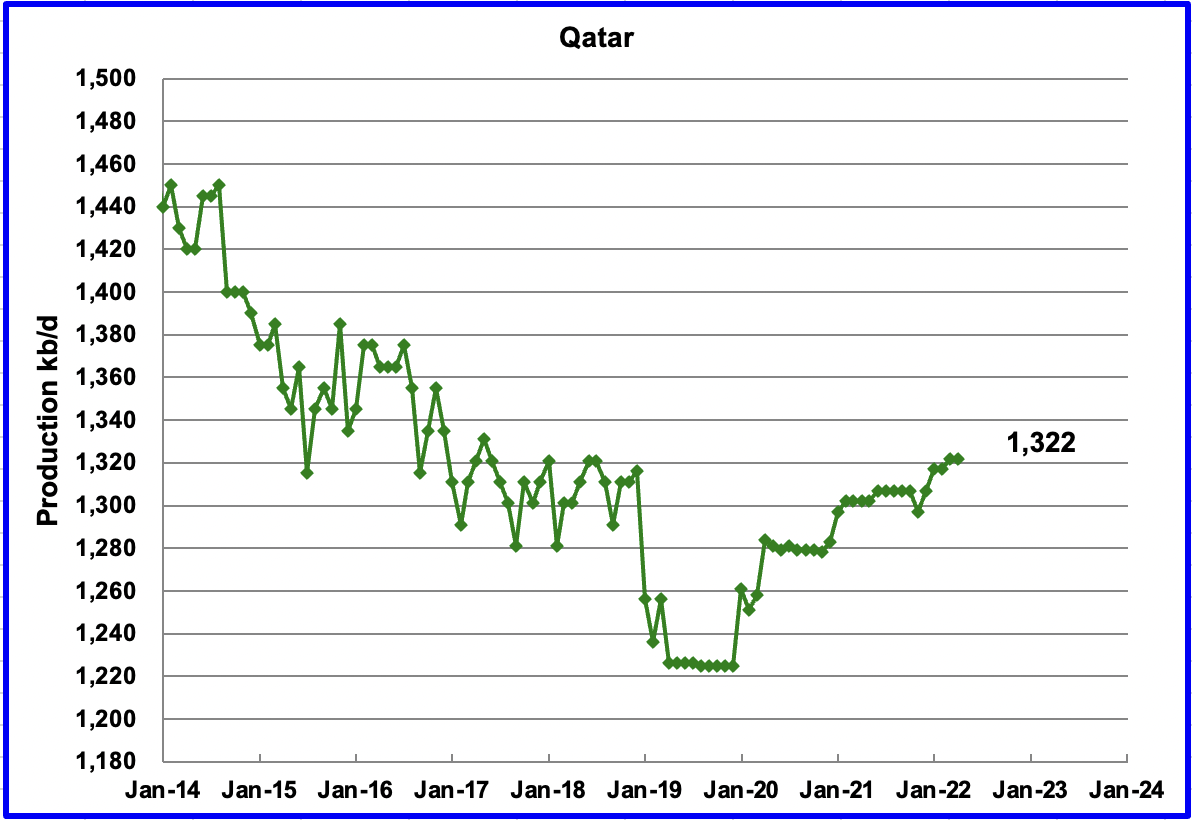
April’s output was unchanged at 1,322 kb/d.
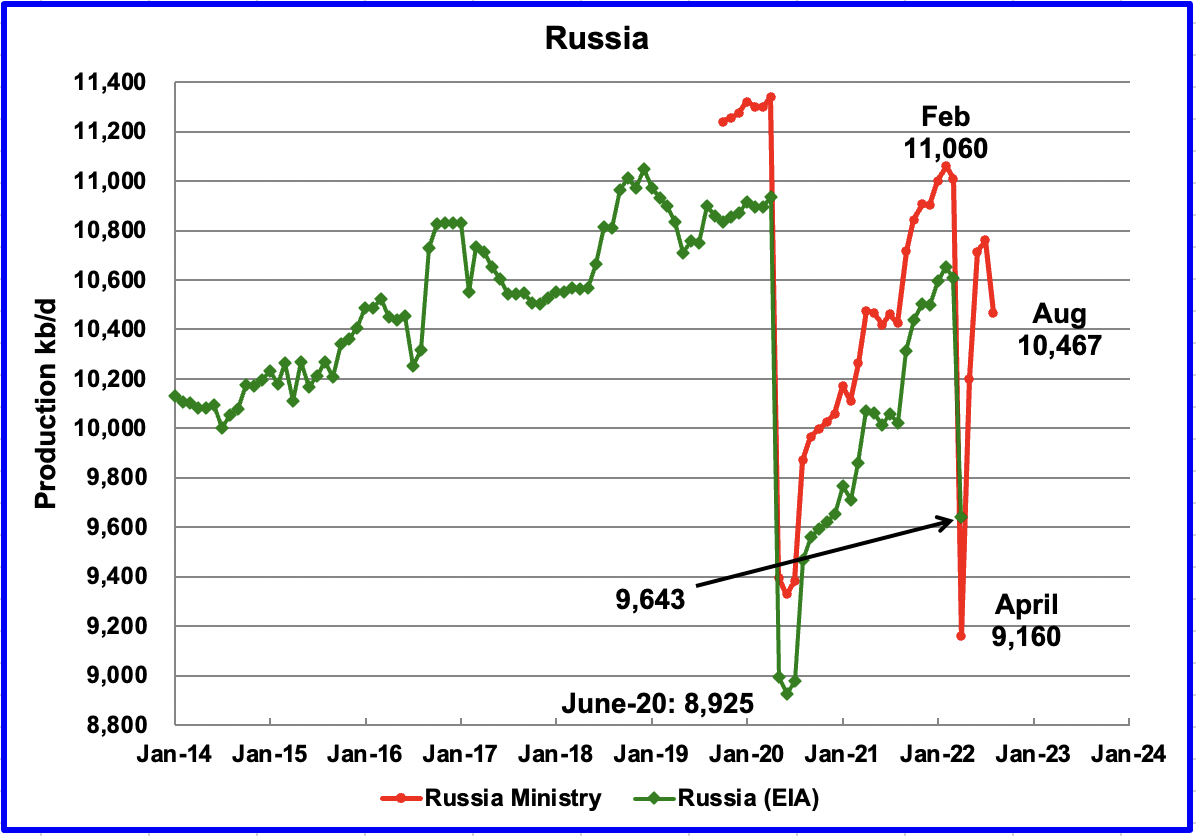
The EIA reported that Russian output decreased by 965 kb/d in April to 9,643 kb/d. According to this source August’s (first week estimate) production decreased by close to 300 kb/d to 10,467 kb/d. (Note the 1.428 million tonnes per day reported in the article was converted to kb/d using 7.33 barrels/tonne)
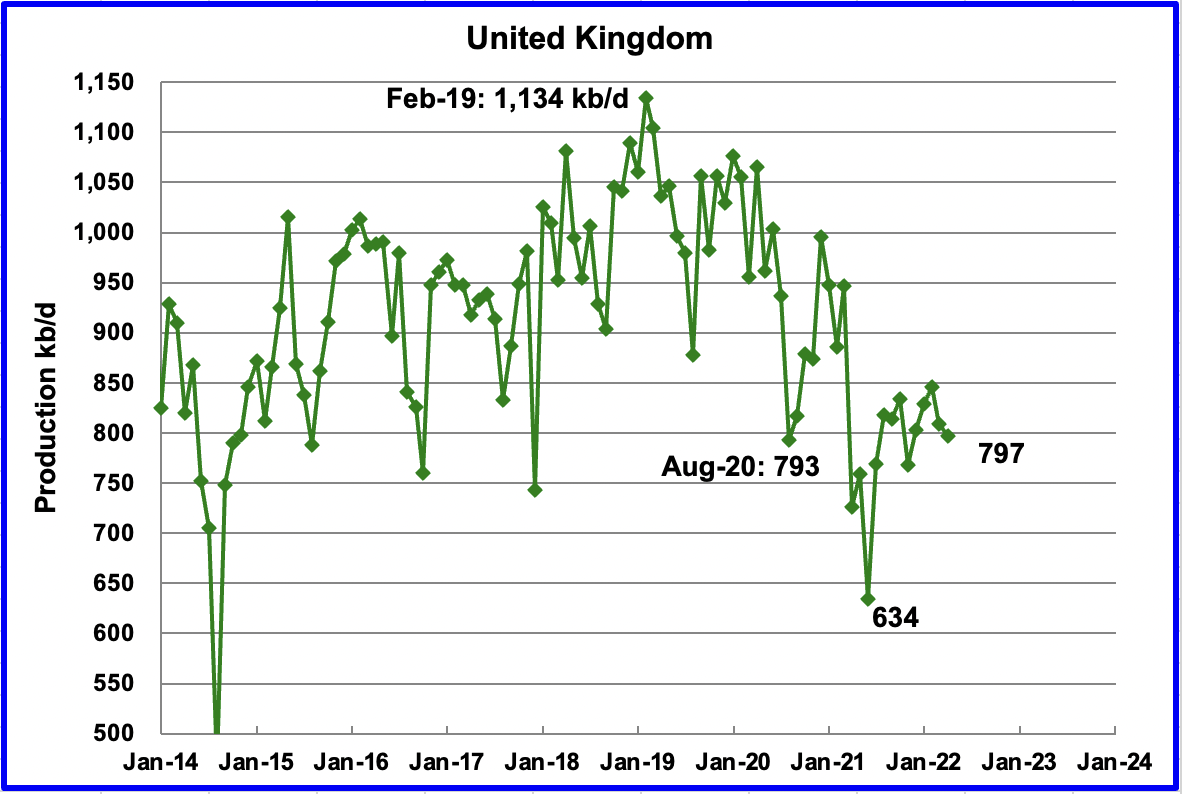
UK’s production decreased by 12 kb/d in April to 797 kb/d. The chart indicates UK oil production entered a steep decline phase starting in February 2019. On a YoY basis production is up 71 kb/d.
June output is expected to be essentially unchanged according to OPEC.
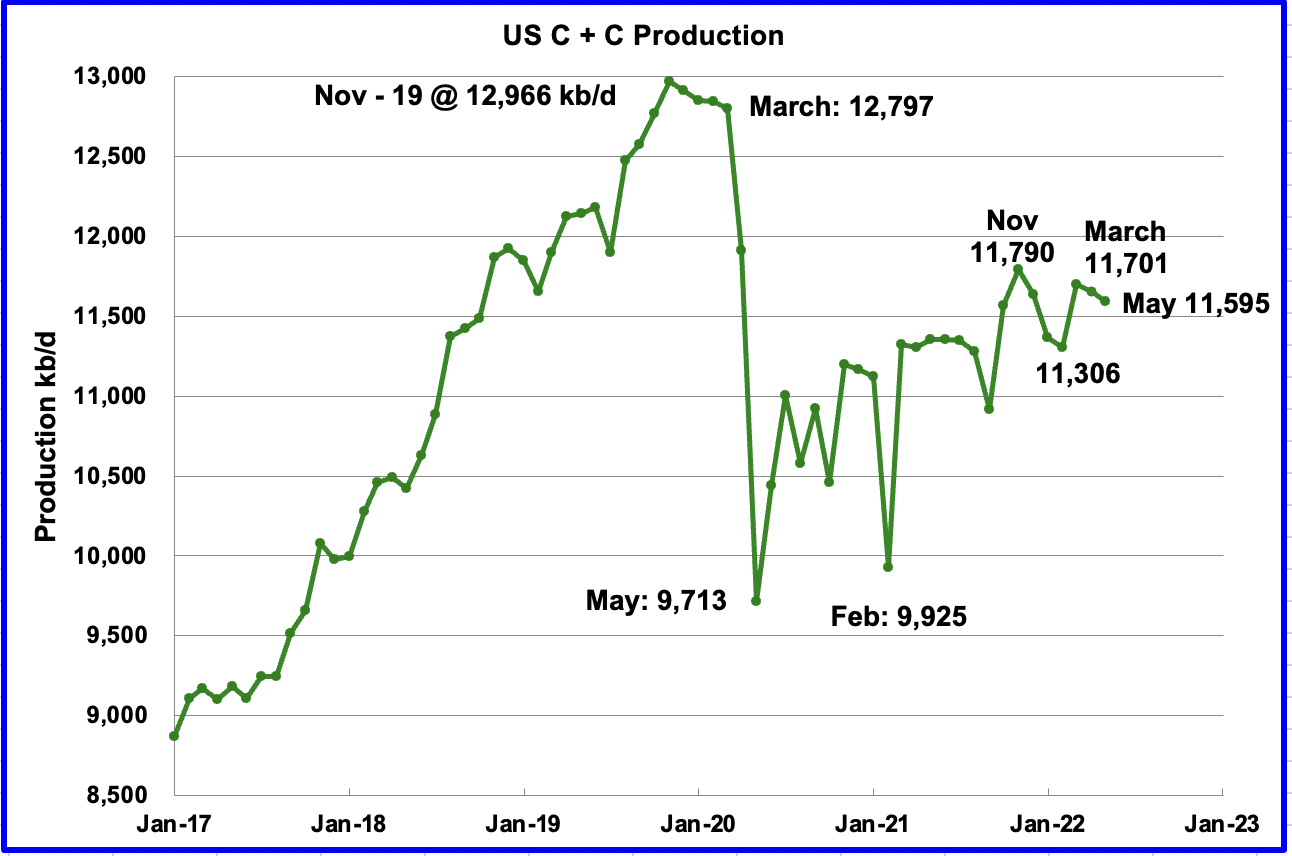
U.S. May production decreased by 57 kb/d to 11,595 kb/d due weather.
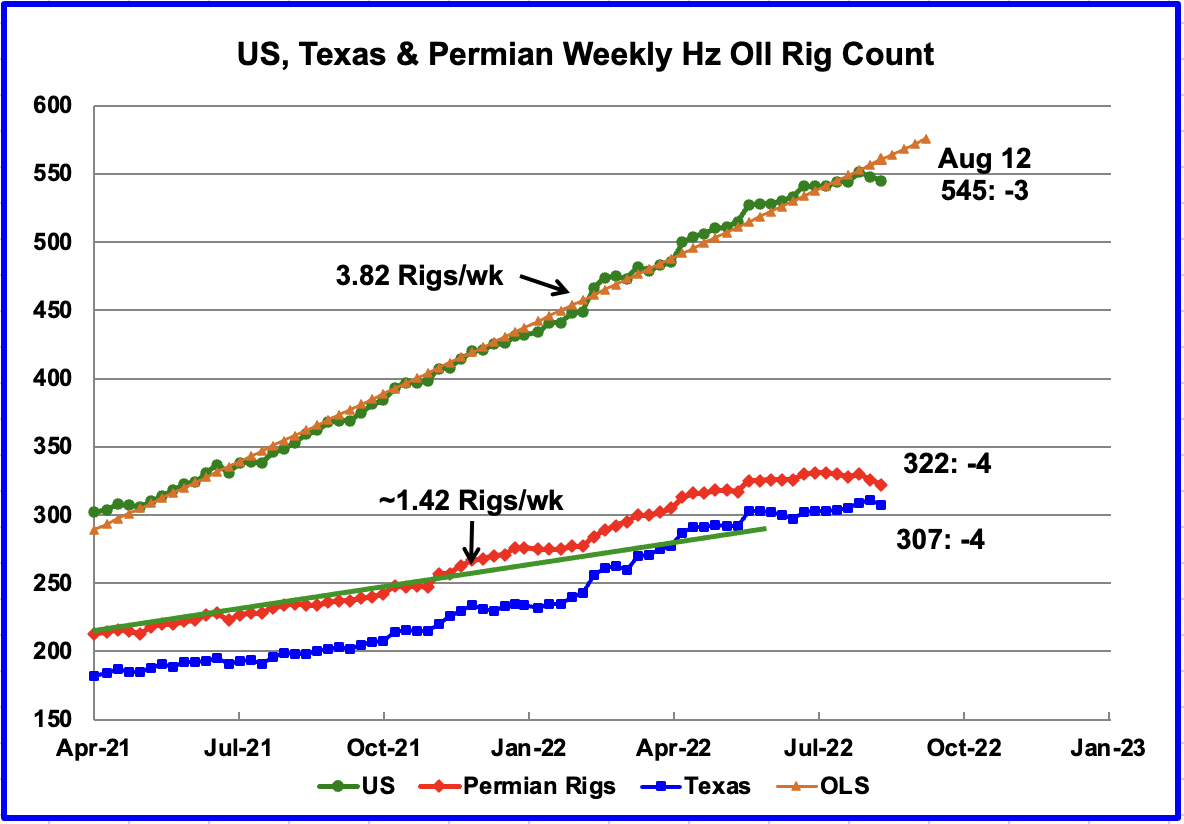
While there was a small drop, 6, in the US rig count over the last two weeks, the bigger story is occurring in the Permian (Texas and New Mexico). The number of hz oil rigs in the Permian has been essentially unchanged since mid May when 320 were operating.
Rig Count for August 12
US Tot: Down 3 for the wk. Down 6 from the high of 551 two wks ago.
Permian: Down 4 for the wk. Down 8 from the high of 330 two wks ago.
Texas: Down 4 for the wk from 311 last wk.
New Mexico: Down 1 for the wk. Down 10 from 6 wks ago.
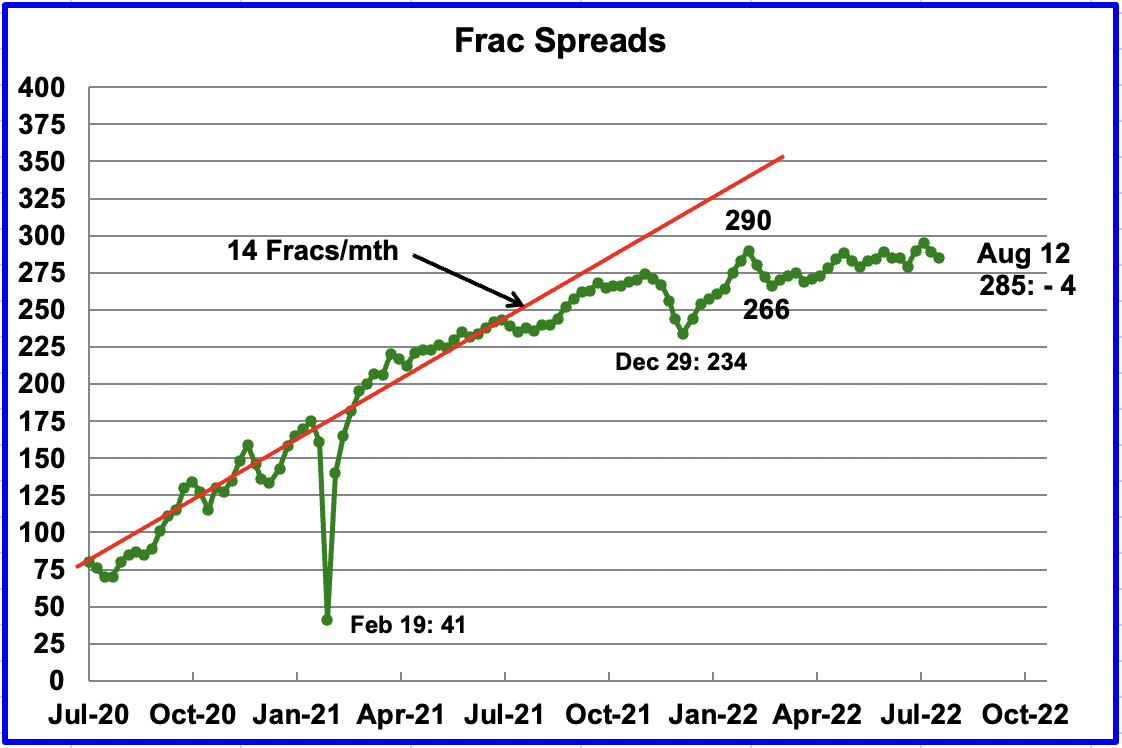
For the past 6 months, the growth in frac spreads has not been keeping up with the growth in rigs. In the week ending August 12, 4 Frac Spreads were deactivated for a total of 285. The 285 are 5 fewer than the 290 operating in the week of February 25 and 10 more than were operational in November 2021.
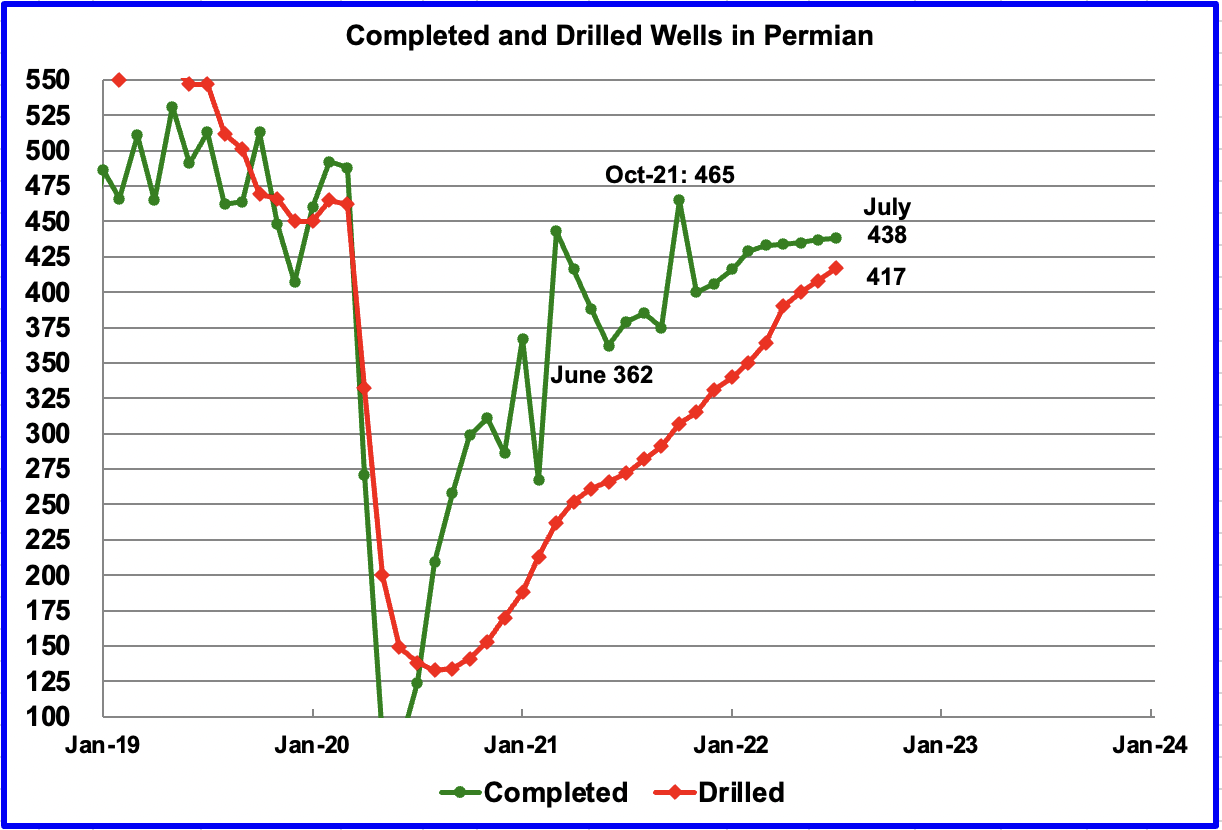
The impact of the slowing growth in Frac Spreads since last November can be seen in this chart. From November 2021 to July 2022, the monthly completion rate of DUCs/wells has slowed relative the rate in 2021. More wells were completed in October 2021 than in July 2022, 465 vs 438. Over the last five months, monthly completions have been essentially flat at 435 per month.
Drilling continues to increase to replace the additional DUCs that were completed. The gap between drilled and completed wells in the Permian has reached a new current low of 21 DUCs.
Considering how completions in the Permian have slowed since February and the little change in Frac spreads since November, one needs to consider the following question: Have the rig and frac crews arrived at a comfortable equilibrium for a slow and steady pace for drilling and completions? Costs and a shortage of parts and equipment may be forcing a new reality, along with the renewed push to return more capital to investors.
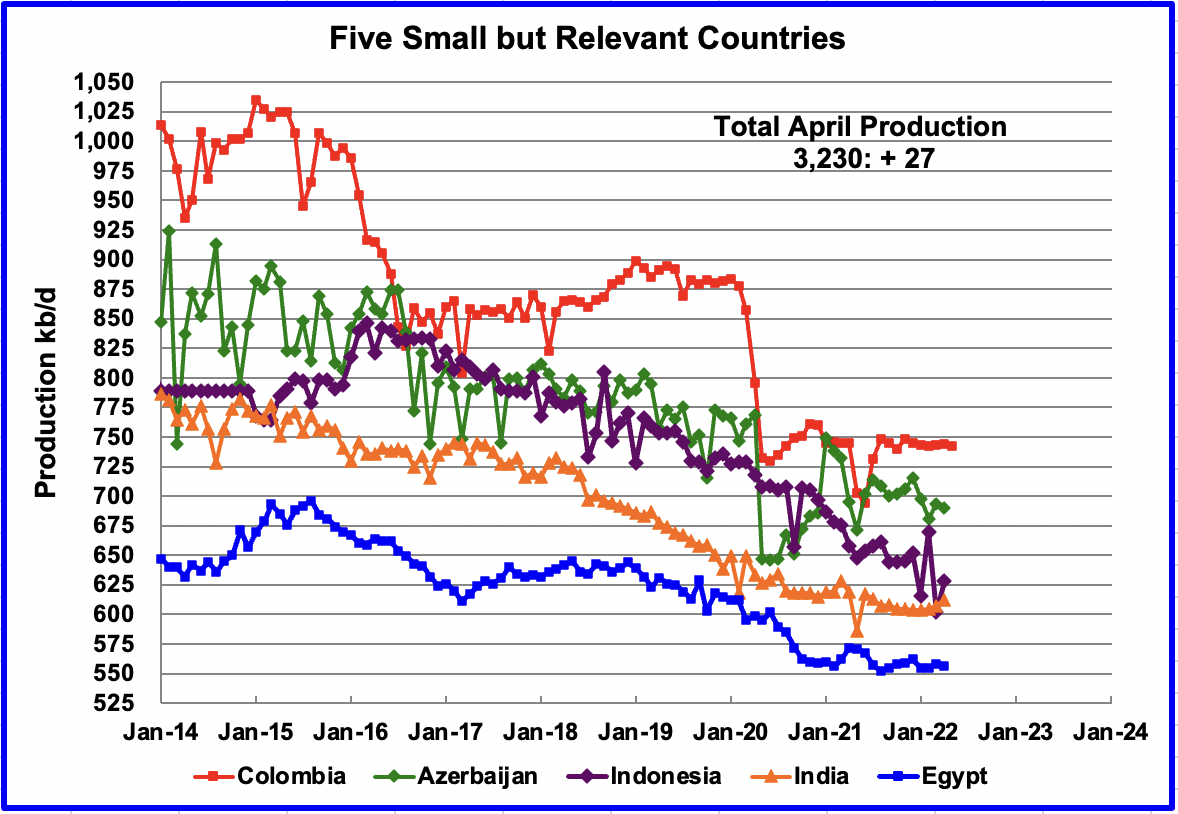
These five countries complete the list of Non-OPEC countries with annual production between 500 kb/d and 1,000 kb/d. Their combined March production was 3,230 kb/d, up 27 kb/d from March’s 3,203 kb/d.
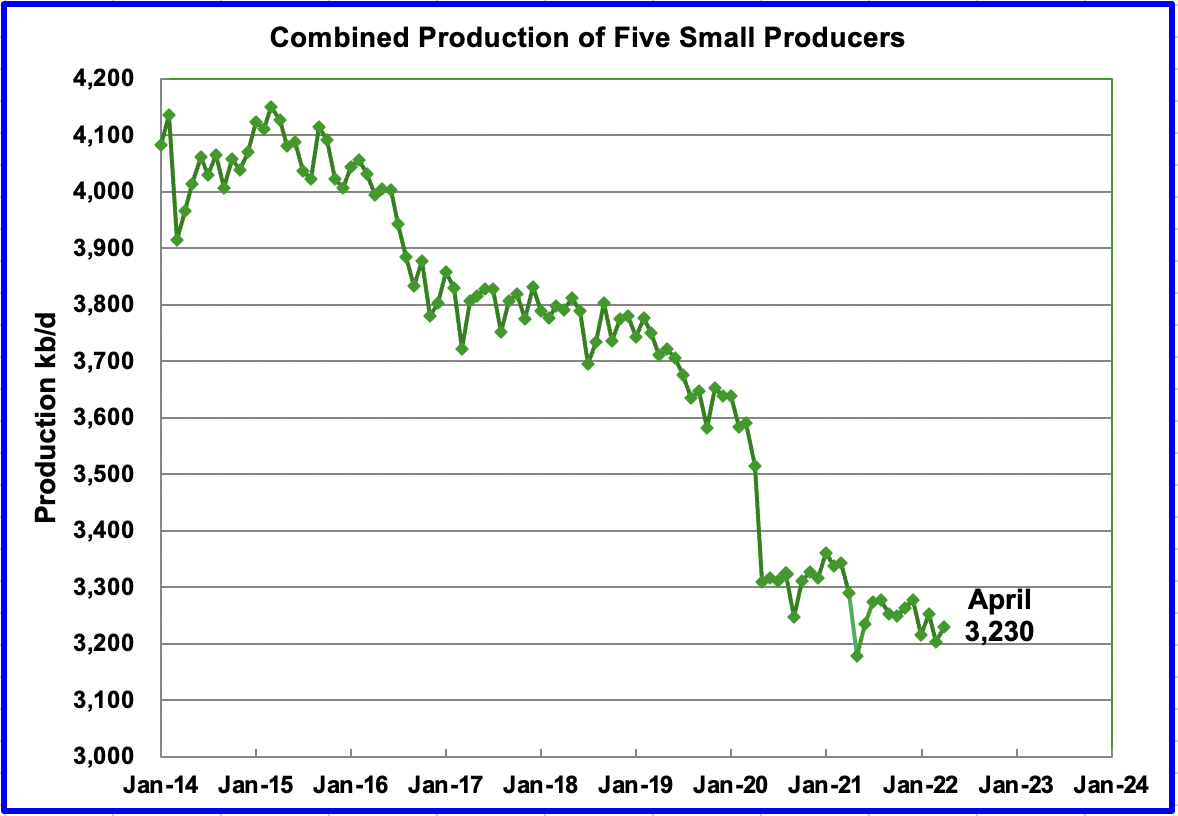
The overall output from the above five countries has been in a slow steady decline since 2015 and the decline continues.
World Oil Production
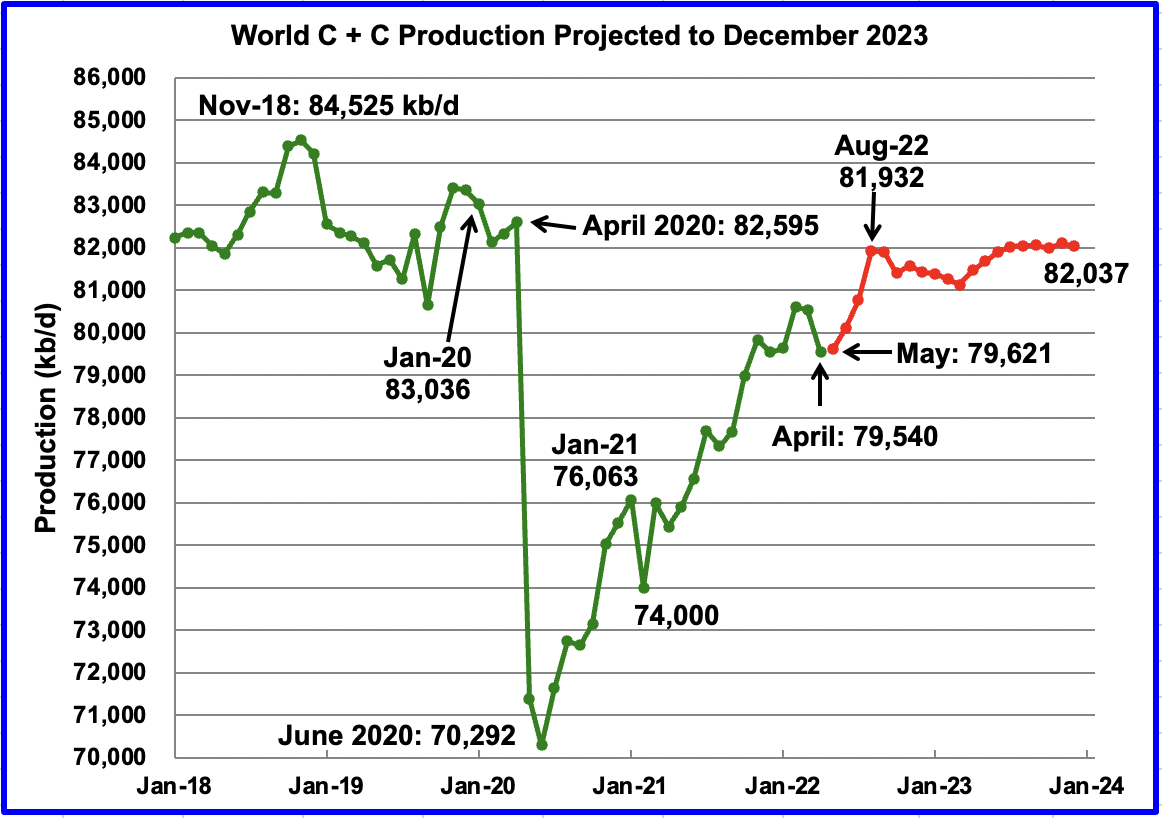
April’s world oil production decreased by 999 kb/d to 79,540 kb/d according to the EIA (Green graph).
The biggest decliner was Russia at 965 kb/d. The biggest offsetting increases came from from Saudi Arabia at 300 kb/d and Iraq at 100 kb/d.
This chart also projects world C + C production out to December 2023. It uses the August 2022 STEO report along with the International Energy Statistics to make the projection. (Red markers).
It projects that world crude production in December 2023 will be 82,037 kb/d, 398 kb/d lower than projected in the July report. The rise of close to 2,300 kb/d from May to September seems aggressive but is associated with projected US and OPEC + production increases. After August 2022, World production is essentially flat at 82,000 kb/d out to December 2023.
Considering the upcoming production losses shown above in Brazil, Kazakhstan and Norway, the smooth production increase from April to September appears to be optimistic.
Decline Rate
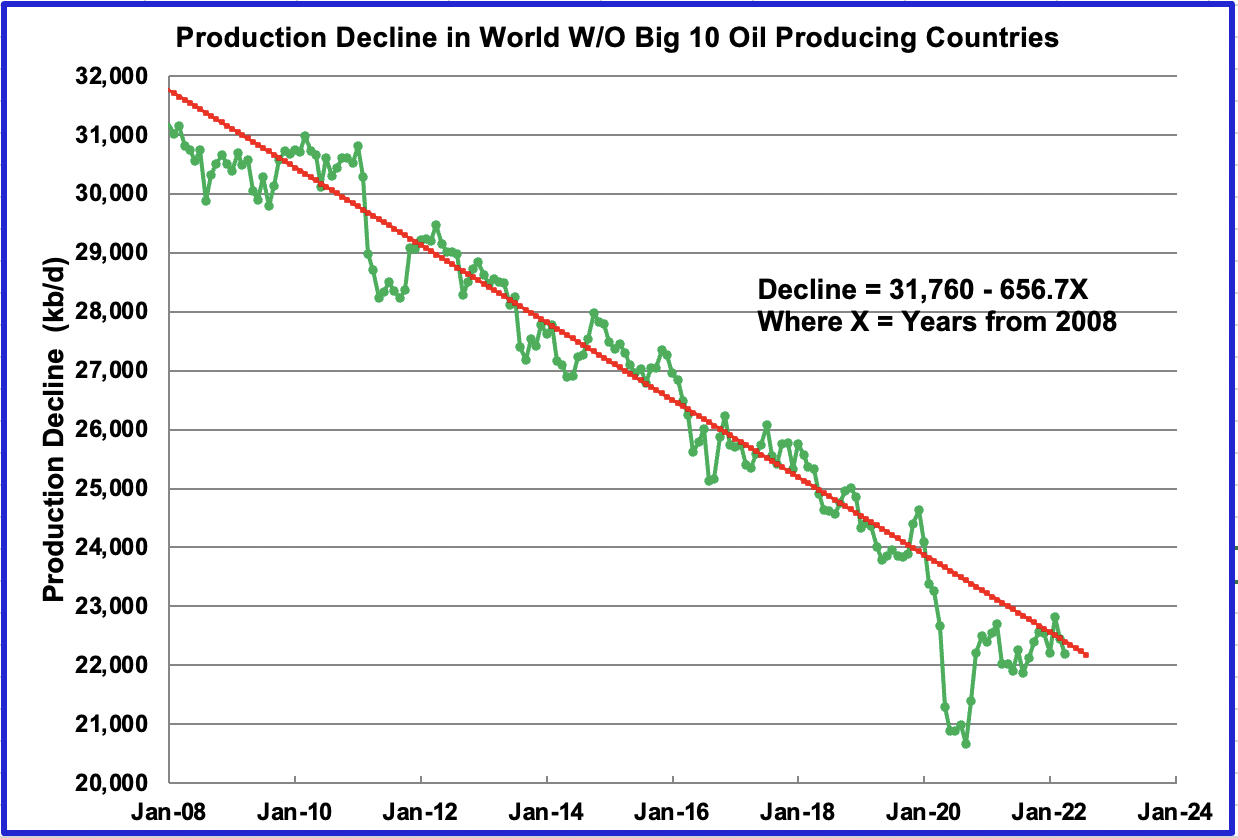
This chart shows the decline rate of World oil production, not including the World’s big 10 oil producers. The OLS line covers December 2009 to April 2022. The analysis does not include the data points during the big covid drop but does add in the latest 3 months since production in most of these countries has returned to normal. The decline rate continues to be close to 650 kb/d/yr and has remained unchanged for the last 12 years.
1) Short Term Energy Outlook
The August STEO provides projections for the next 20 months, starting with June 2022 to December 2023, for U.S. C + C and All Liquids for other countries.
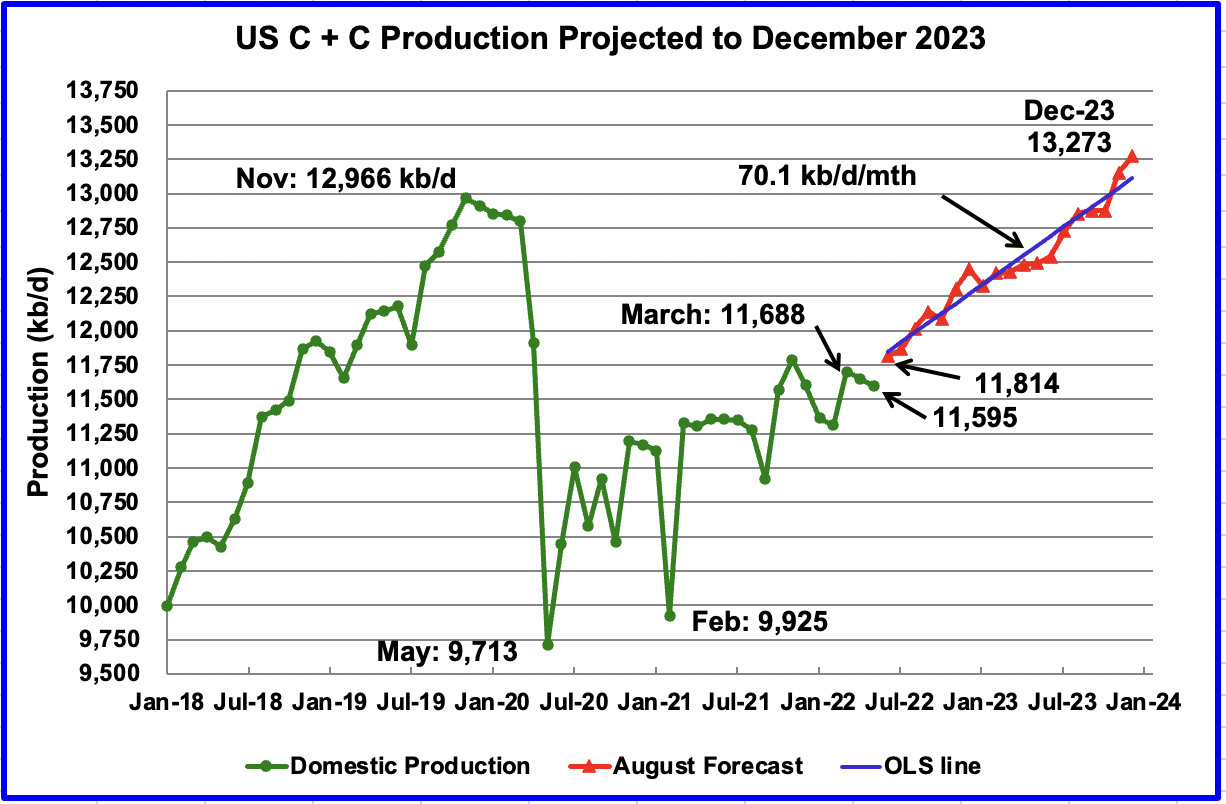
The August 2022 STEO revised down its projected US oil output from June 2022 to December 2023. In December 2023 output is expected to reach 13,273 kb/d, 64 kb/d lower than reported in the July report.
June production is projected to be 11,814 kb/d, an increase of 219 kb/d over May. However it should be noted that the average of the June weekly EIA production numbers is 12,033 kb/d, 219 kb/d higher. Clearly this indicates that the STEO has their own independent sources. It will be interesting to see which organization gets closer to the actual June output numbers.
Using only the projected data from June 2022 to December 2023 to fit an OLS line, the STEO is forecasting production will increase at an average rate of 70.1 kb/d/mth. If the December 2023 output is achieved, it will be 307 kb/d higher than the November 2019 record. The monthly rate of 70.1 kb/d translates into a yearly increase of 841 kb/d.
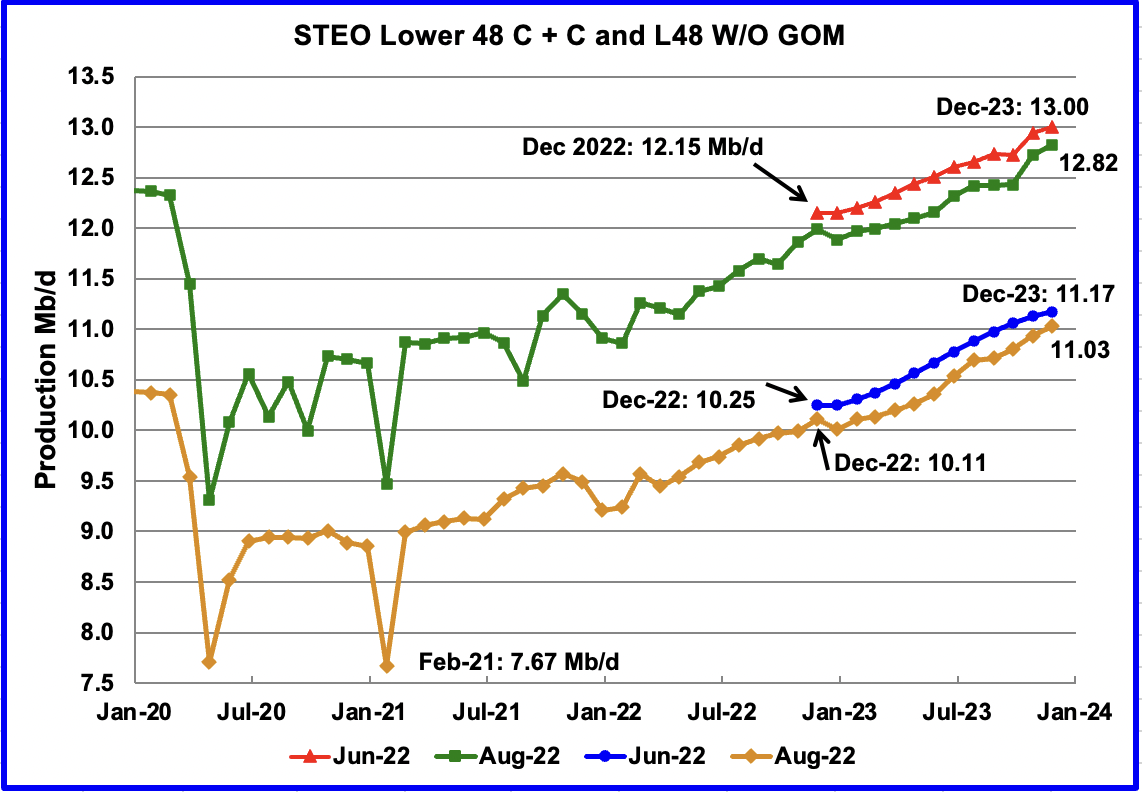
This chart compares the STEO forecast for the L48 from the June report with the current August report to better illustrate how the output forecast for August 2022 changed. For the Lower 48, the December 2023 output has been revised down by 180 kb/d to 12.82 Mb/d.
The August output projection for the Onshore L48 states has also been revised down from the June forecast. For December 2023, output was lowered by 140 kb/d to 11.03 Mb/d.
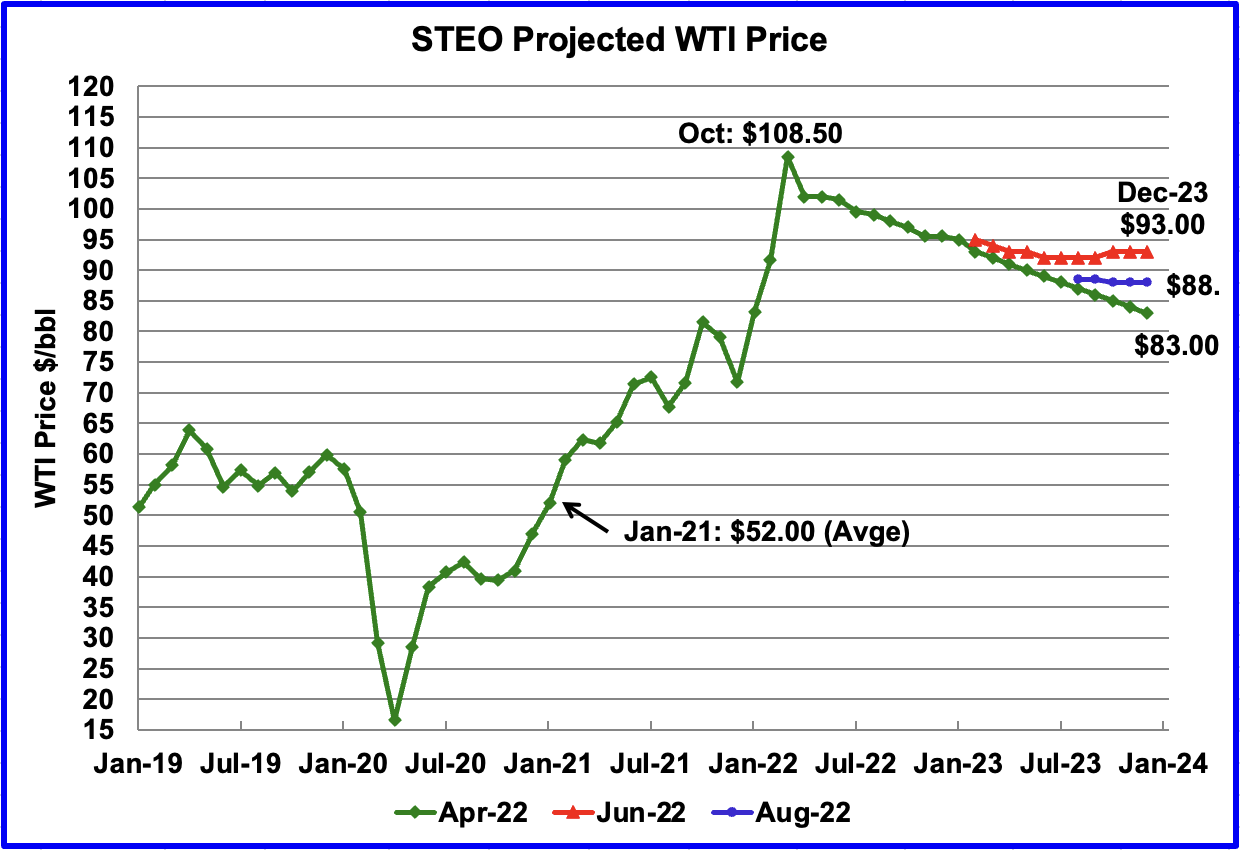
The August 2022 STEO oil price forecast continues to show a steady decline from the EIA’s March peak of $108.50/bbl to $88/bbl in December 2023, blue markers. Essentially the EIA is continuing to forecast that the only direction for the price of WTI going forward is down to the $90/b range. However what is different with their latest forecast is that the price of oil stabilizes in the $90/b area during the later half of 2023.
The August forecast has been added to the chart to show how the STEO WTI forecasts from April to June have converged on a year end 2023 WTI price in the $90/b range.
The September WTI contract settled at $86.53 on August 16, $11.47/b lower than the EIA’s forecast average price of $98.00/b for the September contract.
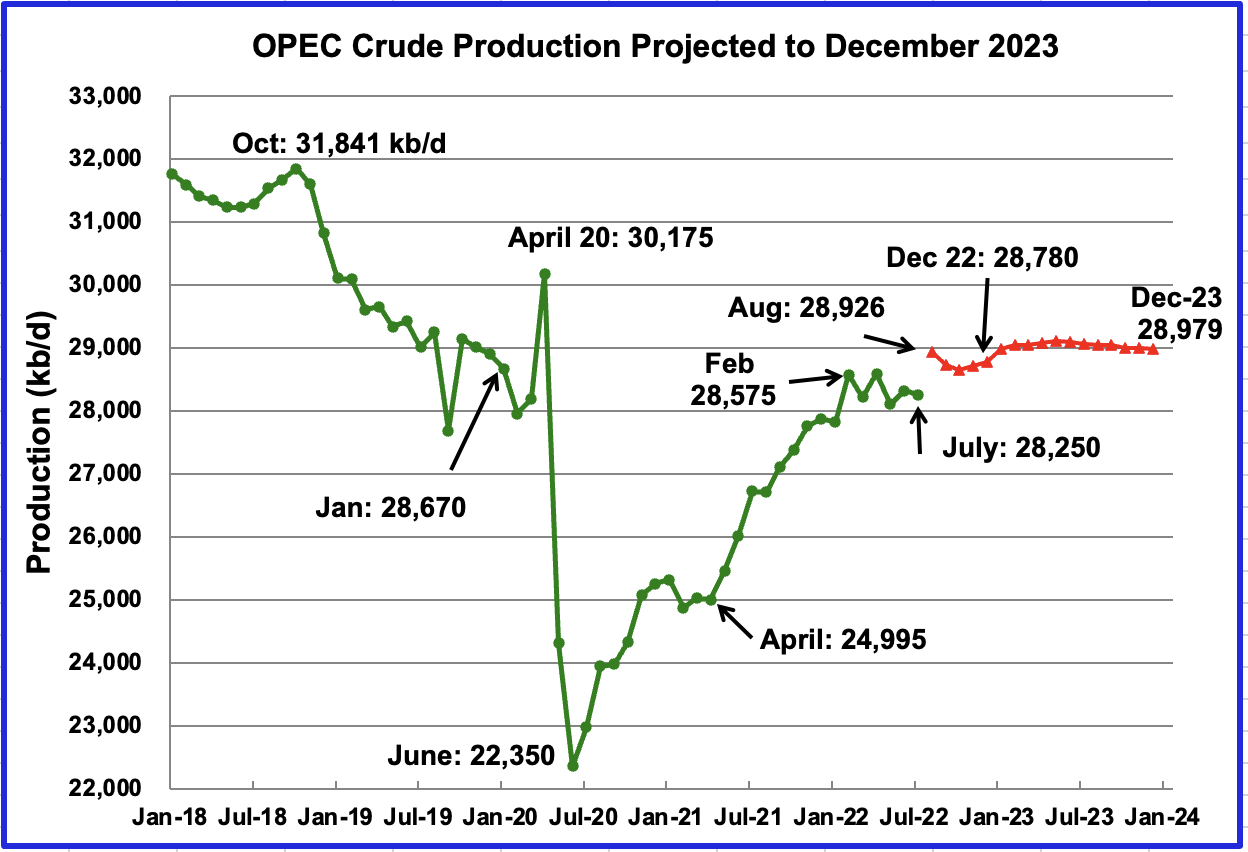
This chart shows the STEO’s August forecast for OPEC crude output from August 2022 to December 2023. OPEC’s output is projected to be essentially unchanged from August 2022 to December 2023, except for the dip in October and November. The July forecast of 28,250 kb/d was actually 650 kb/d lower than the reported OPEC production.
August could be closer to reality since OPEC reported July production to be 28,896 kb/d.
The August OPEC report indicates that the call on OPEC in Q4-22 is 29.79 Mb/d, which is 1.01 Mb/d higher than the STEO is forecasting for December 2022, 28,780 kb/d.
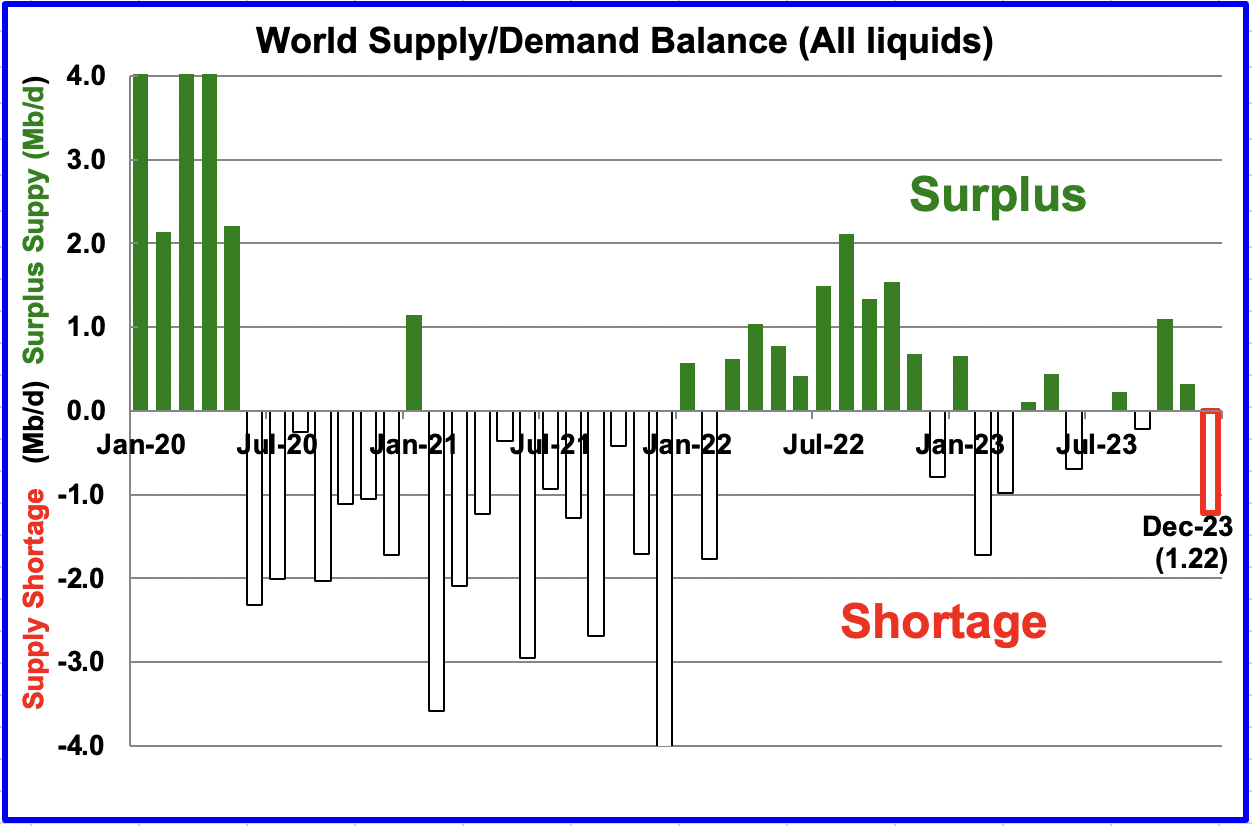
This chart shows the historical world supply/demand balance up to June 2022 and after that, the EIA’s forecast out to December 2023. The surplus of over 1,000 kb/d between August and October is over done with the current tight market and expected increase in demand heading into winter. The supply demand situation for 2023 is expected to be very tight with December 2023 showing over 1,000 kb/d shortage.
309 responses to “Russia Oil Drop Collapses April Non-OPEC Production”
Ovi, great post, thanks.
Of note. Your chart “Oil Production Ranked by Country” shows World production up by 4,092 K bp/d for the year. Of that 4,092 K barrels, 3,441 was OPEC Big 5, Saudi, UAE, Iran, Iraq, and Kuwait. The rest of the World was up by 652 K bp/d for the year.
Ovi, you wrote yesterday: ” Let me clarify, my 2025 ±2 is for the second peak.”
I would have agreed with you before the Russian invasion. However, now I don’t think there is any doubt that 2022 will be the post-pandemic peak.
Of course, one might say, “But Russia will recover.” Yes, they may recover in a few years, but to nowhere near their pre-pandemic level. My guess is that, after the war, whenever that may be, they may recover to perhaps 9.5 million barrels per day. But that would only be if the war is over in the next six months or so, and then only if all sanctions are removed. The war could very well be over in six months, but I don’t think there is a snowball’s chance in hell that sanctions will be over for years.
Ron
Thanks
There are three charts that tell the overall growth story in this post. The Non-OPEC chart shows no growth after September 2022 out to December 2023. Similarly for the World chart and the OPEC chart in the STEO section. Decline and production growth are balanced.
I am not sure if it is a coincidence, but you note that the rest of the world was up by 652 kb/d. This is also the decline rate shown in the decline chart. So with your big 5 near peak, the rest of the world’s increase being offset by decline, next month September 2022, could be the monthly peak for the next 16 months.
In January, the STEO will extend their world oil production forecast out to December 2024. I think that will settle the discussion on whether 2022 or 2023 was the second peak. SA, UAE, Iraq and Guyana combined could push the second peak into 2023, depending on how Russia holds up.
Thanks, Ovi. I never get tired of looking at your charts. They are always great.
You wrote above: next month, September 2022, could be the monthly peak for the next 16 months.
Sorry, but you missed that one Ovi. You are forgetting about Russia. Russia will likely be down 400 K bp/d in August and down even further in September. Peak Month for 2022 will either be February or July, most likely July. And that month will very likely be the post-pandemic peak from now on.
Looking at your chart, “World Oil Production”, you show where the EIA STEO predicts world oil production will be up by over one million barrels per day in August. Where does the EIA get these guys? That prediction is laughable. I know you convert their “total liquids” estimate to “C+C” but they get everything wrong. They show, in the STEO, total liquids to be up 1.34 million barrels per day in August. They have OPEC up .7 million bp/d and OPEC crude only up by .68 million bp/d in August. They even have the Former Soviet Union up by .14 million barrels per day, and that includes Russia.
No, it is far more likely that World oil production will be down slightly in August but far from up by over one million barrels per day. But at least the EIA STEO makes for a good laugh.
Ron
The increase is a mix of OPEC and the US. Note in the OPEC chart in the STEO section that they got July wrong and the August increase of 675 kb/d is just correcting that error. I think they finally checked their forecast by looking at an OPEC report.
Yeah, I see your point. They did get July horribly wrong. With all the great prognosticators the EIA has, how could they possibly get something that wrong? 🤣
The same thing happened in their International data for Saudi Arabia. They got March data wrong by a quarter of a million barrels. Instead of correcting the data, they just posted their April estimate as if nothing happened. That still left their March data a quarter of a million barrels too low. Everyone else, including the OPEC MOMR, and North Dakota, corrects their historical estimates. The EIA apparently doesn’t bother and just posts the new estimate as is.
At any rate, when we finally get the world August data from the EIA, they should show a decline in August and a further decline in September for the total World.
Our oil Bro, Art Berman stipulates that oil (the all everything category) reaches 101.85 in 2023 then dies off after that. https://www.artberman.com/2022/08/15/paradigm-shift-end-of-the-oil-age/?utm_source=rss&utm_medium=rss&utm_campaign=paradigm-shift-end-of-the-oil-age
His chart would very likely be correct had Russia’s oil production never declined. It did. His May 2023 prediction is about 2 million barrels per day too high.
He does not mention Russia once in his article, but talks about a lot of other things. Here is just a sample. He writes a lot about the end of the oil age.
The real crisis today is that oil is the economy. The oil age has been ending for 50 years but there is no substitute for oil. Wind, solar and nuclear only address electric power generation which accounts for only 18% of world energy consumption. Even if we could magically transform 100% of electric power to non-fossil energy sources, this would not address the other 82% of energy use that society needs.
The medium- to long-term should be increasingly affected by limited supply growth (Figure 4). The market will send price signals to producers based on its sense of medium-term supply urgency. Prices will rally until inflation and a fragile economy end the rally. This is the dialectic that I expect will dominate oil markets in 2022 and probably beyond. There is great opportunity for those who understand this pattern.
On the other hand Berkshire Hathaway keeps buying Chevron and Occidental because, as Charlie Munger said, “Oil is absolutely certain to become incredibly short in supply and very high priced.” Munger has said “I can’t think of more impressive people than the petroleum engineers and geologists that create new oil supplies.” What nice people!
Ron –
Even if we could magically transform 100% of electric power to non-fossil energy sources, this would not address the other 82% of energy use that society needs.
This kind of calculation confuses how much stuff we burn with how much energy we use. for example, 85% of the energy produced by a car burning oil is not “used” at all. It’s waste heat that has to be disposed of to prevent the engine from self destructing. This involves dragging a radiator through the air, itself a major waste of mechanical energy, further reducing the efficiency of the system.
Berman’s calculations are not realistic. And his claim that we need to use the energy we use is silly, since inefficiency abounds.
For starters Alimbiquated, those are Art Berman’s words, not mine. We know that the way we must use fossil fuel means that most of it is wasted heat. However, that changes nothing. That energy still must be replaced even though it may take less energy to replace it, that is still a herculean task.
Also, the most serious problems with an all-electric world seem to be ignored. What about all the battery banks to supply power when the sun is not shining or the wind is not blowing? Then there is the problem of the air travel industry. And ships at sea will still need bunker fuel.
However, that had nothing to do with why I posted the article along with Art’s world oil production graph. I was stressing the fact that he also thinks peal oil is in the past.
Ron, those batteries are going to be EVs. V2G (vehicle to grid) technology is here and people will be making money off their EVs while parked to supply the grid.
https://fortune.com/2021/10/07/vehicle-to-grid-technology-could-ease-europes-energy-transition-woes/
Thanks for posting Art Berman’s link! I always like reading his articles and listening to his interviews & discussions, and never miss a chance to do so. The man def has his finger on the pulse. But hey, WTF do I know.
OPEC Chief Sees High Risk of Oil Squeeze
Fears over slowing consumption in China and the wider world — which have pushed crude prices 16% lower this month — have been exaggerated, OPEC Secretary-General Haitham Al-Ghais said in an interview with Bloomberg Television.
At the same time, producers in the Organization of Petroleum Exporting Countries and beyond are running out of extra supplies they can bring to market, Al-Ghais said at OPEC’s Vienna headquarters. The Kuwaiti oil executive was appointed as the group’s top diplomat this month.
“We are running on thin ice, if I may use that term, because spare capacity is becoming scarce,” Al-Ghais said. “The likelihood of a squeeze is there.”
https://www.rigzone.com/news/wire/opec_chief_sees_high_risk_of_oil_squeeze-17-aug-2022-170008-article/
Kengeo,
That was an interesting chart that you posted at the tail end of the last thread.
While I do not follow too closely the non US hydrocarbon developments, I am very much in sync with Pops’ comment regarding the crucial roles of politics, financials, and technologies as well as the geology in these matters
Politics may be – by far – the dominant factor in restricting production in Libya, Iran, Venezuela, Iraq, Nigeria, Argentina and now Russia. Thattsa heckuva lotta earl.
By promoting extraction from the Bowland and Weald basins, the UK could conceivably alleviate its energy concerns in very short order and be self sufficient in natgas for a century. One could argue that the vast Canadian hydrocarbon bounty is also greatly constrained by political, not geological, factors.
Regarding financials, only Dennis – to my eye – has ever put the proper emphasis on what the impact $100/$130 bbl has on future development. (Likewise $5/$9 mmbtu for natgas).
A piddling 100,000 barrel per well output at $100/bbl throws off $10 million gross revenue.
There are countless wells doing that in their first few months.
Again, to enter the ‘natgas realm’ might blow your mind. Appalachian Basin wells doing a paltry 5 Bcf first year throw off $25 million (and rising).
Vast, vast amounts of Tier 2/3 become economical when ‘the price is right’.
Final note … linear projection seems to be a near universal human trait.
That, coupled with Mr. Patterson repeatedly noting the adage ‘Humans believe that which they wish to be true’ (paraphrased), inexorably leads to the conclusion that the future unknowns will continue to surprise.
My best ‘bet’ is that the downsides to peak oil production are grossly overplayed.
Alternatives such as nuclear, natgas, coal, will continue to supplant oil as myriad factors push humans into embracing that which is deemed necessary and available.
Sumptin’ like dat.
Just trying to see where everyone thinks we are at…it’s very interesting to me the polarization.
I try to keep an open mind but I also feel like there are too many lines of evidence to ignore…
I’ve moved Hickory to a more appropriate spot based on his input…lol
Kengeo, you have Ovi’s position wrong. He wrote yesterday, “Let me clarify, my 2025 ±2 is for the second peak.” That means he belongs on the right with all those really smart guys. 😁
Several months ago Ovi was projecting a new peak late 2020’s…maybe he has changed his mind?…sounds like he is good with the 2023 – 2027 range…No more room on the <2020 peak area!
lol…
The US has somewhere between 8-12 years before oil runs out completely.
Being a top 3 oil producer means that oil scarcity is getting worse by the day and it's really unlikely that we will see another peak near/above the 2018 peak.
I also think it would be a truly bizarre coincident if EVs decrease oil demand to the point where it makes a difference in oil production…if that were the case the US and other countries would export more oil or pricing might lower slightly… I would imagine that by 2030 a best case scenario would be US saving 1-2 MBpD…but it's more likely to be significant depletion over next 7-8 years, so EVs won't make any impact on oil price/supply…
In ~5 years where will US get 5-10 MBpD of oil from, Russia? I imagine Canada will increase supply to US, but can't really count on that…what about late 2020's will the US really be importing 10-15 MBpD?
In 2032, where is 18-20 MBpD of oil coming from, Russia? Between now and then the US will consume 73 Gb…meaning that 2P reserves for Canada and US will be exhausted (36* Gb & 41 Gb, respectively)…Canada 2P reserves to last ~15 years based on current production levels..But US to last <8 years at current production levels…
From a global perspective, only ~5 years of 1P remains.
After 1P is gone, there MAY be an additional 2P-1P of around 5 years.
At this point 2032 we are running on fumes, the "mean contingent recoverable oil resources in yet undecided projects/discoveries, including noncommercial volumes"!!! ie 2PC-2P-1P…it works out to 20 years but likely hood of it actually being recoverable is extremely low…
The following countries have more than 10 Gb of 1P:
*Saudi Arabia – ~50
*Russia – ~40
Canada – 30
US – 25
Iraq – 18
UAE – 16
Iran – 13
Kuwait – 11
China – ~10
Excluding some overestimates (Russia & Saudi Arabia) that translates to ~160 Gb, or roughly 4-5 years until the primary 1P runs out for the top 9 countries…
Maybe a couple more years when adding the 2P-1P for these countries…
To make a very long post short…We can expect significant disruption to oil supply/production between now and ~2027…
There's not much time left
Kangeo
That was a post that looked at using the Logistic function on past production to forecast the future. The point was made that in going from two logistic functions to three, the peak year could be pushed out by 10 years. Below is the original two logistic fit showing a 2019 peak.
Ovi,
Great post, thank you.
The question is, what URR for World C plus C seems reasonable to you? Also it is a bit unclear what you mean by a second peak in 2025 +/-2 years, do you mean a new higher peak, a secondary lower peak, with 2018 being “the” peak in World C plus C output. I forget your position and it may have changed.
There are many who have predicted World C plus C URR of 2900 Gb to 3500 Gb, my best guess scenario only has a URR of 2920 Gb. Of course we cannot predict the future, but if your guess is 2025+/-2 years, that sounds fairly reasonable (though 2027+/-2 might be a better guess).
Dennis
The only way I have for estimating URR is by fitting the Logistic function to past production and then solving for the three unknowns, URR, peak date and the shape factor. Using the two and three model fits, the URRs were 2,799 Gb and 3,148 Gb. Those numbers are within your range.
As for the second peak, I meant lower. Actually it could be a third one that is lower because there is already a second lower peak in November 2019.
I chose 2025 ± 2 for the second/third peak because I think it is closer to 2023.
Attached is the three logistic fit with a URR of 3,148 Gb
Yes!
We in the US need to be the last man standing and do not ship off our oil, sell it to others, and consume all other countries’ before our own dwindling supply. Russian oil shouldn’t be boycotted, it should be welcomed here in the US in as much quantity as possible. Depletion never sleeps, and ELM is fact.
It is time to end altruistic platitudes – giving helping hands to those who aren’t hedging their own bets – take advantage of the nonbelievers of the oil age’s end – and prepare for a cataclysmic deneument. Close the borders, arm the guards, and grab what popcorn’s left.
I sense a little bit of /s and humor in there, if not I will put in a bet on the next US President : )
Kengeo,
You forget that there are a lot of contingent resources that get developed over time, Rystad’s estimate of about 3000 Gb of total resources (with roughly 1600 Gb of remaining resources is very reasonable). Laherrere et al, who tend to be quite conservative estimate about 3500 Gb for World C plus C URR.
You should play with my spreadsheet from the last post, you will see that, if you use the URR estimates of many experts (Laherrere, USGS, and others) you need to make very unreasonable extraction rate assumptions to arrive the crash in oil production that you assume.
Is part of your scenario that a World Economic Depression causes oil demand to fall?
Why would you expect a steep drop in extraction rates for conventional oil? This is not at all clear. Have you looked at historical oil reserves for the US? They continually increase each year with oil that is produced being replaced with newly developed reserves. This happens worldwide.
See spreadsheet at link below for EIA data for US crude oil reserves
https://www.eia.gov/dnav/pet/xls/PET_CRD_PRES_DCU_NUS_A.xls
This has data from 1977 to 2020.
Dennis, there is one thing that you fatefully fail to understand. URR is an estimate of what oil is left underground. It can be wrong. It can be horribly wrong. Oil production above the ground can be measured, not estimated. What is produced is a hard fact. You can know if it is either increasing or declining.
You are basing everything on what is estimated, or guessed, on what is let in the ground. Hard facts on what is being produced and whether or not that production is either increasing or declining. For a tiny fraction of the world it is increasing. For the vast majority of the world it is declining.
Hard facts outweigh wild-ass guesses every time. We are post peak Dennis; wake up and examine the facts rather than look at guesses as to what if, what if, what if may be produced in the future.
Ron,
As I have pointed out before, I look at reserves, discovered resources and estimates of future reserve growth based on reserve growth in the past as well as historical C plus C output.
You use only the latter information.
Generally speaking when we use all available information rather than a small subset of available information we get a more accurate estimate.
We will see in a few years which approach is more accurate.
Steep drop is from supergiant fields that have been depleted >70% (Ghawar for example is around 75% depleted with a 2004 peak of ~5 MBpD…currently around 3.5 MBpD and expecting to lose 0.25 MBpD annually for next 6 years.
In 10 years Ghawar will be close to 1.5 MBpD.
The most significant fields are super giants that are way beyond 50% extraction…
That’s the problem with Peak oil, depletion starts slow but then grows until fields are depleting by almost 10%…
In the case of the Burgan field in Kuwait, it peaked in 2005 at 2.4 MBpD and is currently producing about half that amount, annual decline rate is likely above 10%…not sure about depletion but based on operating for ~75 years depletion must be over 80%…
So just between this 2 supergiants we have >5 MBpD that is quickly fading away…
At a glance many of the Russian fields are in the 70-80% depletion phase…
For the top fields accounting for ~400 Gb, the average peak was the mid to late 1990’s…
This makes sense in the context of the early 2000’s oil prices moving higher…
The health of almost all oil reserves is in question…
From a high-level, likely only 2-3 years of ‘cheap’ oil left (~100 Gb)…that’s the elephant in the room…
Dennis – More of your hogwash…if true, please tally up all the Gb from new fields that have been brought online in last 25 years…presumably it’s >500 Gb??????….still that doesn’t even cover 20 years of production, right?
When supergiants go offline the effects will be devastating…
Kengeo,
No not hogwash, did you look at US reserves? The data is there, about 63% reserve growth over the 1980 to 2005 in the nation with the most mature reserves in the world. The World is constantly developing oil reserves, in the oil industry this is called reserve replacement.
Next time try a rational argument.
Note also that my scenario has a URR that is almost 600 Gb less than a recent estimate by Laherrere et al in 2022( 2900 Gb vs 3500 Gb).
Rystad’s recent estimate was about 3000 Gb, USGS estimates conventional oil resources at about 3000 Gb.
Dennis – You are fighting a losing battle…take a look at all of the mega & supergiant fields that makeup the top 50 fields (~1,000 Gb with average depletion of ~75%)
Some cases it’s likely much higher: –
Ghawar (~80%)
Marun (95%)
Ahwaz (86%)
Kirkuk (99%)
Manifa (80%)
Since you couldn’t produce a list of new fields that have come online in the past ~20 years I’ll help you out. It’s only ~25 Gb since ~2001 that I could easily find…I really think you know better than this…believing that reserve growth is happening when in fact it’s been shrinking for past 5 years is truly bizarre. I like your approach though, you make broad claims with 0 backup…what is your background?
If it were 10-15 years ago I would understand your reluctance to this, but the data is in!
You do realize the US shale flood will end as abruptly as it began, right?
Anyhow, more than half of the 3,000 URR has been extracted and the other half is questionable at best…
Here’s a figure that shows the ‘Super-14’ where the vast majority of the super and mega giant fields were found between 1910s and 1950s…and have on average been producing since 1960 or earlier…
Kengeo,
There are thousands of smaller fields in the World. It is easy to make a list of a couple of supergiant fields. About 789 Gb of new producing reserves have been added to World proved developed producing (PDP) conventional oil reserves in the past 25 years.
Note that Rystad’s estimate for remaining resources is 1572 Gb, 1218 Gb is resources discovered and expected to be recoverable at present, more oil will be discovered and reserves are likely to grow. So we have not reached 50% recovery at this point in time.
Also nothing magic about 50%, peak could happen after 50%.
Cumulative C plus C output to the end of 2021 was 1436 Gb, add the 1572 that Rystad estimates and we get a URR of 3008 Gb.
Dennis –
I wonder if the chart below helps you? These are the top 14 countries (less US – so top 13 really), they account for the top 50 largest fields in the world (minus US). Notice the trend established in 2016…do you think it is going to flip?
Annually this group has been losing ~2% since 2016. The peak in 2016 was ~52 MBPD…Since that time they have lost 5.3 MBPD into 2021 (46.65). Right now in 2022 they are producing 46.0 MBPD. The average for 2022 is likely to be around 45.7 MBPD…Russia situation obviously will have an impact…
URR is very well established for conventional oil at 2,500 Gb.
Literature suggests that the reserves reach peak production at 40% URR. 40% URR is equal to 1,000 Gb. Low and behold the exact year that global URR hit 1,000 Gb…what do you imagine happened (2007-2008)?
In order to get a peak all the way out in the late 2020’s URR would have to be significantly more than 2500, likely more than 5000…it would also need to be of a certain quality (conventional).
Reserve Growth Does Indeed Still Rule. 🙂
KenGeo, thanks for including me in such an august list of names. I’m very much in the pre 2020 peak camp.
Got it, figured but wasn’t sure…
Kengeo,
Not sure that either Reservegrowthrulz or Coffeguyzz has ever made a prediction about when peak oil will occur.
It’s a guess but they haven’t refuted yet…
Is there no one besides Dennis that thinks a future peak is possible?
I really thought there would be more than just Dennis and a couple others?
Slightly surprised but maybe the optimists are just being quiet?
Fwiw I think there’s a 50% we could see a new peak in the 2-5 year timeframe.
Stephen Hren,
What do think the probability is that peak oil will occur after 2021?
My guess is 70% possibly higher, I would say there is about a 50/50 chance the ultimate peak will occur before or after July 2028 in terms of the centered twelve month average of World C plus C output.
Kengeo,
My guesstimate would be that physically available supplies of liquid
hydrocarbons sufficient to supply global needs will exist out to at least the 2040 timeframe.
The fact that oil is now ~$95/bbl with all the ‘manmade’ (aka geopolitical) constraints should be instructive.
That said, oil will continue to cede its prominent position as an energy source as alternative options arise.
FWIW, events such as depicted in Longtimber’s linked ZH article (displacement of US$ as global reserve currency) have a great probability of happening.
The tectonic scale ripple effects will be disruptive to an unimaginable degree.
Dennis, I’m on the fence. It’s mostly about what happens in the Permian, and anecdotally and based on recent rig count stagnation…also Russia looks to be in a slow grind downwards due to both sanctions and depletion. My best guess is we will match the previous November ‘18 peak by 2023-24 and maybe hold it there a year. Oil prices are so volatile it’s hard to make any real guesses.
I think there could be quite a few countries that fall out of the game permanently unfortunately like Sri Lanka, Haiti, Cuba etc due to debt crises. Perhaps even the majority of the world’s population. The more developed countries will likely make the transition okay but with lots of volatility. There are big things happening with electric and autonomous vehicles that could be massively transformative by the end of this decade and could genuinely produce a peak in oil demand by 2030-35, but of course some of this peak in demand will be coming from the collapse of less developed countries I just alluded to.
Of course no one who posts here regularly actually knows the answer because when you know the answer you stop paying attention and we are all very much paying attention lol.
My best guess is we will match the previous November ‘18 peak by 2023-24 and maybe hold it there a year.
Damn, you are a horrible guesser. On what data do you base that estimation? The data to the contrary is overwhelming. Almost every country in the world is either plateaued or in decline. Russia will be down by 2 million barrels per day in 2023. OPEC says they are completely out of spare capacity.
Stephen, it is not about oil prices. Of course oil prices count but they come in third place. First place is geology, second place is politics, and third place is oil prices. But then, oil prices is dictated by geology and politics.
Yet…. Words fail me.
Ron, I think we have 2-3 years while the system does maximum effort to hold it all together. There will be quite high oil prices, $120-150 and many will see this as the last good time to rake in the dough and produce all out.The geopolitical pressure from all this will be too much after a few years and we’ll have a major step down in the complexity of the globalized system by 2025-26. The globalized era of 1990-2020 will be firmly in the rear view mirror and we’ll be back to more regional economies with perhaps about 10% of the trade we now have. I’m sure there are a few more wars flaring up that are unforeseeable. The second half of this decade will see a massive fall off in oil production due to this collapse in complexity until a new lower level can be found, perhaps 20% or so lower. Everyone who can will have gone electric or in the process. Peak oil will be as obvious as it will ever be at this point, but most people still won’t get it…
Thanks Stephen Hren,
Lots of unknowns to be sure, your guess seems reasonable, generally oil output has been pretty resilient, which is why I think it might be a bit later than your best guess (I have tended to guess too early in the past). The optimist in me hopes you are correct due to environmental concerns, the realist thinks oil output will peak later because the transition to alternative land transport will not reduce oil demand to less than supply until 2040 which will lead to a lot of environmental damage,
Haven’t been involved in this topic professionally for nearly 20 years now for nuttin. 🙂
Stephen wrote: . The globalized era of 1990-2020 will be firmly in the rearview mirror…
The globalized era first peaked its head up in 1957 when the Toyota Crown became the first Japanese car sold in the states. Ten years later, globalization was in full swing. No, it did not begin in 1990 but before 1970. Globalization has been a factor for over half a century. I am likely one of two or three people on this blog who can remember a time before globalization.
Stephen, no nation has any idea how to live without globalization. We get copper from one nation, potash from another, and precious metals from still another. The world is our shopping cart and our retail store for everything we sell. Gigantic containerized cargo ships ply the seas with loads of cargo coming and going from every nation on earth. The site at import-export ports like Long Beach is a site to behold.
Globalization has us trapped. We cannot live without it, but it is bound to collapse. The serious decline in world oil production will only exuberate a very bad situation.
Totally agree with you Ron: globalization and with it the western economies are bound to collapse. But I think Steven is right that things will stabilize on a lower level. This could be a pretty rough ride down the hill. Steve‘s 20% would be on the upper side of my own estimates, but it might be just enough without doing too much damage. From thereon, things might go on rather smoothly: the world has always been global for goods that otherwise were not available: silk always came from China.
Ron, I used the 1990 date because of the collapse of the iron curtain and the opening up of China. What were more regional economies became truly global during the last 30 years. I think we are seeing a pullback already in this globalized model with the Russian sanctions and efforts to detangle the US economy from China which both Trump and Biden have been pursuing. What I imagine is a return to a more regional set of trade areas, with many countries falling out entirely due to various crises, as we have already started to see.
Very interesting chart.
For what it’s worth I am calling peak human population right now and definitely reducing by 2030.
What do you know that the population reference bureau, the UN, and just about every other orginization around the world who makes population projections does not know?
Click on chart to enlarge.
I have never looked it up in detail, but I presume these population predictions take the good o’l BAU as a given for the time coming, alowing for a nice and steady demographic transition (high natality/high mortality to low natality/low mortality) as countries develop.
What makes the population boom is the missmatching natality and mortality rates, with natality reduction trailing mortality decrease by 10 to 20 years.
So what makes the peak population earlier is the crash&burn of the BAU due to peak oil, energy and material constraints and the resulting end of globalization.
Thanks KenGeo. Terminal Deforestation Event gets its place.
By 2033 US oil demand will be about 8 Mpbd.
And I’ll side with Dennis that the US will likely be able to meet that demand.
Might depend somewhat on how well we treat our Canadian neighbors.
Many other countries are not going to meet demand.
OVI,
Another excellent post. Indeed, it does seem as if the ultimate peak in global oil production was back in 2018. But, what’s a few years between friends… anyhow? We may see another peak, but when the world is losing between 10.5-11 mbd of production each year that it now has to make up; well then… GOOD LUCK trying to stop the RED QUEEN for much longer.
Then some say we have plenty of that wonderful Oil Sands & Heavy Oil that we can ramp up to make up the difference. Thus, we could possibly increase Oil sands and Venezuelan heavy oil production by another 5-10 mbd.
This sounds nice on paper or when folks have resorted to HOPIUM for a way of life in the future, except if you are going to ramp up oil sands or heavy oil, you better have GOBS of NATGAS to do it.
According to the Canada Energy Regulator, it takes roughly 1 billion cubic feet per day of natural gas to produce 1 million barrels per day of oil sands. So, with Alberta oil sands at 3 million barrels per day, it is consuming 3 bcf/d of natural gas.
Thus, Alberta In-Situ & Mining Oil Sands Operations are consuming nearly ONE-THIRD of Alberta’s total natgas supply… LOL. So, if we want to ramp up that GARBAGE OIL SUPPLY, we need GOBS more NATGAS.
Alberta Oil Sands, what a wonderful thing.. turning GOLD (natgas) into LEAD (oil sands).
steve
Steve
Thanks
Let’s do the numbers.
3×10^9 ft^3 Ng used to make 3×10^6 barrels of oil
6,000 ft^3 is the energy equivalent of 1 barrel of oil
So that NG is the equivalent of 500 kb/d produces 3,000 kb/d of crude oil. So that makes for an EROEI of 6 or 5 if the ER is net as opposed to gross. 👍👍👍
I understand that companies are now using solvents is different parts of the process to reduce the use of NG.
Bottom line. I don’t agree that Canada is turning gold to lead. Right now Canada is home to two of the World’s most valuable assets, Water and Oil.
Thanks for that Ovi. The price of natural gas and the price of WCS is, then, perhaps ‘the rock and the hard place’, so to speak, in terms of a large part of the profitability for Canadian Oil Sands, although I imagine they burn a lot of diesel and whatnot on site also.
Does anyone here have a forecast in terms of how future natural gas prices, perhaps going up in Canada due to global shipping of LNG, might impact profitability/viability of oil sands?
If NG equals A and price of WCS equals B, at what reasonable values of A & B might oil sands fail the investment returns test?
I suppose that’s what the nuclear power in Alberta plan is all about; to power the extraction of oil sands without NG?
Natural gas is used for heating across much of North America and is in increasingly scarce supply. This will make for a very rocky business model for the tar sands as more nat gas gets exported and becomes a global commodity, likely pushing its price up fourfold over the next few years. You can say that this will increase gas production and that’s true but the extra will all get exported and the price will stay high. EVs will be dominating car sales by the end of this decade and WTI is unlikely to be above $80 consistently.
Survivalist
Attached are some numbers to look at. The attachment gives the operating costs for Canadian Natural Resources (NYSE: CNQ), one of Canada’s big oil producers. The current price for NG is $Cdn5/1000 ft^3 for contract delivery. Spot is closer to $2.
So the look at the operating expense and add in extra $ for a higher gas price. Appreciate that this company also produces NG.
Ovi,
Indeed… CNQ is now making money HAND-OVER-FIST. Actually, the Canadian Energy Companies, including oil sands companies, are more profitable than many of their U.S. counterparts, especially many shale energy companies.
Not only is CNQ making nice profits, it’s paying out more than $2 per share each year in dividends.
I think the Canadian Energy Space is the better place to be for a while before things get hairy in the Energy Sector. It’s a much better value than U.S. Energy Stocks.
steve
Ovi, great stuff. Thanks for your time on that!
OVI: Bottom line. I don’t agree that Canada is turning gold to lead. Right now Canada is home to two of the World’s most valuable assets, Water and Oil.
You are completely right, sir. Almost 15% of the fresh water in the world is in Canada. And long after all the oil has been exploited in the United States, the Athabaskan oil sands will still be chock full of bitumen.
IMO, the most important pipeline from Canada to the U.S. will carry water. The Keystone XL will probably go in as a last-gasp maneuver.
After the 2020 annual report was issued there was a lot of hoo-ha about ExxonMobil writing down almost all of its oil sands reserves. As prices recovered in 2021 most of these were added back on, without much hoo-ha. However despite prices rising higher than before not all were reinstated, and the difference is a lot more than a year’s worth of production (this is something I’ve noticed happening a few times with unconventional reserves).
The reserves lost were mostly already developed, meaning that at the average local oil price of just under $30 the bitumen could not be mined at a profit despite all the infrastructure being already in place. The remaining (profitable) reserves were down to only two and a half years R/P ratio – i.e. low oil prices render the Kearl oil sands plant pretty much a white elephant. There are no significant undeveloped reserves so the next phase for Kearl development is not on the table, and would presumably need consistent prices well above $30 for it to go ahead (that is $30 WCS, WTI and Brent would be higher again, in 2020 WTI was about 50% higher than WCS).
Right Steve, as I have said many times here, the value of oil is not really its value as a source of energy. It can’t compete with coal, let alone renewables.
Oil is primarily a convenient way to store energy in a moving vehicle. It’s main competitor is batteries, not other energy sources.
That is why it may make short term economic sense to waste energy making liquid fuel out of tar sand.
When I corrected the EIA’s Saudi estimate for March, that made March the highest post-pandemic production month. It also made the April decline in world production to be 1,149,000 barrels per day instead of 999,000 barrels per day. The EIA may make the correction next month as I think they have made some corrections in the past. But I am not counting on it.
Thanks Ovi for the information. Great effort.
I think you mean Russia oil production collapses in the title ?
What is your prediction on world c+c ? Do you think we are in a plateau which could last many years or do you think we will see a new peak around 2030 as Dennis thinks ?
I myself rather like the term extraction instead of production, since oil is not “produced” per se, but instead sucked out of the deposits made a long, long time ago.
Laplander
Oil is pushed out by natural pressure or by pumping water or gas down into the reservoir .
Quite ironic, I´m well aware of water floods etc. yet misformulated myself… But I still think the general public might think twice (not likely though…) if it`s labeled correctly.
Btw, another thing thats been bothering me is EROI and EROEI that some people seem to equalize/misinterpret, yet they are by definition/unit completely different.
Ovi, as far as I’m aware, virtually no contemporary oil and gas wells flow once they are completed, even those that are fracked. They need to have a bottom hole pump installed to start producing, and those are either electric down-hole pumps or mechanical sucker-rod types. And then, most of what they initially produce is frack water that has to be disposed of before oil starts coming up. I have not heard of a free-flowing oil well in decades, at least in Alberta. They might exist, but in Alberta was far as I know -anything that produces oil- has a pump jack on it. There are some wells that produce high pressure natural gas at the wellhead without the need for any pumping equipment (obviously), but those wells tend to bring up large amounts of water that needs specialized equipment to deal with it.
Iron Mike
Thanks
Titles are tricky and often not explicit. I am trying to covey the notion that the Oil DROP in Russian production was so big that it collapsed Non-OPEC production.
My best guess for World C + C is 82,250 kb/d ± 250 kb/d.
Ovi,
Is it correct to assume you mean the peak in World C plus C output will be 82250 Plus or minus 250 kbpd?
Interesting, I assume that is 12 month average output?
If we consider the centered 12 month average for the World C plus C, the current peak is 82997 kb/d based on EIA data, so we are already nearly 500 kb/d above your prediction, if I understand it correctly, thugh perhaps you expect a secondary “lower” peak at about this level some time in the future.
Dennis
That is a one month peak that I am looking at, possibly in 2023 or 2024. Not sure what the 12 month average will be.
Ovi,
Thanks.
If we assume my unconventonal scenario is correct (not likely) and the extraction rate for conventional C plus C remains at the 2022 level (4.32%) until 2040, we get something close to what you predict. To me it seems unlikely the extraction rate would remain this low if oil prices remain high. Note that in 2019 the extraction rate for conventional C plus C was 4.65%.
Dennis
What is the extraction rate? 4% of what?
Ovi
extraction rate is 4% of producing conventional oil reserves. See spreadsheet I linked for Iron Mike which was also linked at the end of my previous post.
Dennis
That number may be useful in your spreadsheet but I cannot relate to it. I think for most readers, a percentage relative to todays production might be more meaningful.
Ovi,
This is producing reserves of conventional oil for scenario above.
From 2021 producing reserves in Gb
565.62
565.46
564.79
563.63
562.01
559.95
557.46
554.56
551.28
547.63
The problem with modeling a nice smooth “half-bell-shaped” curve of post peak decline is there is no rule that says it will be so—in fact the upslope since 1970 has been anything but a smooth Hubbert curve. If one considers the “low fruit” phenomena that’s typifies extraction, it almost guarantees the second half to be harder and slower going.
Especially with a larger percentage of production coming from LTO with it’s jaw-dropping decline rate I think a fast decline to a long tail is entirely possible. Much of supply is from large fields 50, 75, 100 year old. Think Cantrell or Prudhoe Bay decline multiplied by 5 or 10.
I don’t know if that is plausible but I do think a nice smooth Hubbert ending is less so.
Ovi,
The idea is not very complicated, there were about 566 Gb of producing conventional reserves for the world as a whole on Jan 1, 2021 and 23.93 Gb of conventional C plus C was produced in 2021, so 23.93/566 is the extraction rate or 4.23%.
Pops,
Every model is an approximation, extraction rates in my model are assumed to change slowly, in reality they might jump around a bit, but it is not possible to know how they will move in advance. The chart below has historical conventional oil extraction rate % on right axis and producing reserves in Gb on left axis. Conventional output in Gb per year is producing reserves times the extraction rate. Future extraction rate is unknown, but the model assumes it moves smoothly because I cannot anticipate future shocks (that is I do not know when they will occur, I fully expect that they will in fact happen).
Pops,
Future scenario with a guess for future extraction rate.
Output for scenario below
DC: “Every model is an approximation, extraction rates in my model are assumed to change slowly, in reality they might jump around a bit, but it is not possible to know how they will move in advance.”
Thanks for the plots, Dennis. I appreciate the uncertainty and why your plots are smooth—even as I rant about their smoothness. Point is, a nice smooth production decline is not the worry, just the opposite. Price gyrations are the worry. Speculation in the market increases volatility headlines which combined with corporate oil propaganda and normalcy bias to mask any price signal, delaying transition. The result is peak oil satire and political “oil is evil” carbon-based greenwashing that makes transition appear a thing that tree-huggers do rather than a necessity dictated by our dependence on depleting fossils.
I isn’t the peak that matters or even the rate of decline, it it the speed of transition.
Pops,
Yes the speed of the transition is important, but the rate of decline in oil output will influence oil prices which might also affect the speed of the transition. The topics are tied together. My best guess scenario for a land transport transition has oil demand falling below supply around 2040.
Peak oil was November, 2018. Conventional peak was November, 2005.
Dennis,
Can you please link me to your excel world C+C data and projection. Thanks
Iron Mike,
See my previous post near end and also below for spreadsheet link
https://peakoilbarrel.com/wp-content/uploads/2022/08/shock-model.ods
You can change the extraction rate column to whatever you wish and also change the tight oil or extra heavy oil scenarios if you wish to create your own scenarios, the possibilities are endless. The assumption for conventional C plus C URR is 2750 Gb which is the average of a recent Laherrere estimate (2500 Gb) and the USGS estimate (3000 Gb).
Ovi,
Is it correct to assume you mean the peak in World C plus C output will be 82250 Plus or minus 250 kbpd?
Interesting, I assume that is 12 month average output?
If we consider the centered 12 month average for the World C plus C, the current peak is 82997 kb/d based on EIA data, so we are already nearly 500 kb/d above your prediction, if I understand it correctly, thugh perhaps you expect a secondary “lower” peak at about this level some time in the future.
Thanks Dennis,
Just one final question. Where did you get the extraction rates from ? Is that a calculation based on production data ?
Iron Mike,
Yes extraction rate is this year’s output divided by producing reserves at the end of the previous year. More details in the August 8 post. So extraction rate is based on the producing reserves estimate and historical production based on EIA from 1960 to 2021 and carbon emissions from liquid fuel from 1870 to 1959.
A more common term for extraction rate would be “Reserves to Production Ratio.” However, in the OPEC world, that is a useless number. OPEC claims reserves of 1,242 billion barrels. They say non-OPEC has reserves of only 303 billion barrels. So to get the R/P ratio, you would simply divide reserves by annual production. You can see using this metric would give you a totally unbelievable R/P ratio for both OPEC and non-OPEC.
Ron,
I am not forgetting about Russia, I just disagree with your forecast for future Russian output.
Ron
No the extraction rate is not the same as the R/P ratio. It is output divided by proved developed producing reserves at the end of the previous year.
Iron Mike
After 2021 the extraction rate is unknown and you can choose any rate that seems reasonable to you.
No the extraction rate is not the same as the R/P ratio. It is output divided by proved developed producing reserves at the end of the previous year.
Dennis, how does “proved developed producing reserves” differ from “reserves”?
I am not forgetting about Russia, I just disagree with your forecast for future Russian output.
Then by all means Dennis, please tell us what your forecast for future Russian output is then.
Ron
See EIA reserve data and look for proved nonproducing reserves subtract the nonproducing reserves from proved reserves and you are left with proved developed producing reserves. Basically these are the proved reserves that have been developed and have started production. There are lots of reserves which are not yet developed and are not producing oil.
For Russian output I expect we will see 10.25 plus or minus .25 Mbpd through 2028 with gradual decline after 2028.
Dennis wrote: For Russian output I expect we will see 10.25 plus or minus .25 Mbpd through 2028 with gradual decline after 2028.
Thanks, Dennis; I am recording that quote for posts next year. 🤣
Ron,
Paper below expects about 2.6 Mb/d lower output from Russia by mid 2023 from 11 Mb/d in Feb 2022 to 8.4 Mb/d in June 2023. I had seen earlier estimates of only 1 Mb/d disruption, which was the basis for my estimate. The presentation was from June 8, 2022.
https://www.oxfordenergy.org/wpcms/wp-content/uploads/2022/06/Russias-Invasion-of-Ukraine-and-Oil-Market-Dynamics.pdf
This forecast looks to be a worst case scenario to me, I think some of the crude that does not flow to Europe and North America will be absorbed by China, India, and some other Asian nations.
Based on this presentation I would revise my expectation for Russian C plus C output to 9.5 plus or minus 0.5 Mb/d over the next 2 years or so, but expect the Ukraine war will be settled and sanctions will be removed allowing higher output after 2024, perhaps as high as 10.5 Mb/d some time over the 2025 to 2028 period.
Dennis, thanks for the update. I have noted your revised expectations. I think they will be much closer to reality than you earlier believed. I do hope you will change your charts to reflect this change of expectations on your part. After all, a change of three-quarters of a million barrels per day should change them a bit.
However, I still think your long-term, after sanctions, prediction is way too high. 10.5 million barrels per day would be about where I would expect Russian oil production to average in 2023 had there been no sanctions at all.
Even if Russia stops fighting next week, I do not expect sanctions to be lifted until every soldier is out and the reconstruction of Ukraine, by Russia, has begun. They have destroyed half the country and that scar will not heal quickly.
Oil fields in the Urals and Western Siberia were already in steep decline and this will greatly accelerate that decline. After all this Ukraine mess is over, I do not expect Russian oil production to ever rise above 9.5 million barrels per day. Vostok ramping up late in this decade will slow down the decline and may even increase Russian production a bit. But that will not bring those old dying giants back to life.
“but expect the Ukraine war will be settled and sanctions will be removed allowing higher output after 2024”
That is a possible outcome, but I would put it on the lower end of probability.
I expect sanctions including against the Russian energy production industry to last for a long time.
Just a thought, maybe Putin thinks “we`d just as well keep it to ourselves, no oil (or gas) for you! As proposed by others.
Ron,
I have long thought Russia would plateau at about 10.5 Mbpd. Now due to war I think 9.5 Mbpd may be more likely. This changes my long term outlook from a peak of 87 Mbpd to 86 Mbpd, it might be lower, depends on demand oil price and many other factors. It might be as low as 83 Mbpd or as high as 86 Mbpd, not possible to predict accurately.
Dennis, you are doing the right thing by adjusting your expectations as more and more data, and information becomes available to you. It is great that your expectations are not set in stone.
Winston Churchill once said to a woman berating him for changing his position, “When the facts change, I change my mind. What do you do, madam?”
Yeah, I think we can both agree with old Winston. Anyway, I think that if you keep reading up on world oil production you will soon be in complete agreement with me. 😆
Ron,
Thanks. A few months ago you said something like my scenaios were starting to sound reasonable, which is something I never expected. So you also adjust your thinking over time, at this point we aren’t very far apart on our expectations of oil output, but our views of how it affects the world are different.
Two scenarios with lower and higher extraction rates for conventional oil. The high scenario has a maximum extraction rate of 4.59% and the low scenario has a maximum extraction rate of 4.44%, in 2021 the extraction rate was 4.24% and in 2018 the extraction rate was 4.81%.
You’re welcome, Dennis. Extraction rates are something that is not even on my radar. I concentrate on production rates instead. We know exactly how much oil we pump out of the ground and whether not the rate is increasing or decreasing.
What is still left belowground cannot be known with any great degree of accuracy. However, we know when an oil field starts to decline and when new discoveries start to drop off to near nothing. Also, I pay a lot of attention to what other prognosticators have to say. When the vast majority of them are pessimistic, as they are now, that tends to influence my opinion as well.
However, URR and extraction rates are the horses you choose to ride. We will soon see which of our two different methods of projection is the most accurate.
It is hard to see how Russia will win the war in Ukraine and avoid Western sanctions afterwards. And rerouting to Asia is an expensive pipe dream — won’t happen in a big way before 2030.
So I think pessimism about future Russian output makes sense.
Ron,
Note that we have data on backdated discoveries and it is that data that is used by the oil shock model to estimate proved developed producing(PDP) reserves. Extraction rate is based on historical C plus C output and PDP reserves. I believe using production data and discovery data yields a better estimate, but as you said time will answer this question.
What ever happened to the ‘bumpy plateau’ of oil production? Are we there yet? Is there a measurable definition of the moment we drop off the plateau? Any sense of how long it will take the world in general to recognize the transition?
Bumpy plateau was 2008-2016, better known as the Obama Bumpy Peak Oil (OBPO) plateau…once the US shale fizzles it will all be crystal clear…likely sometime end of this year or early next year…
Yes , we are in the ‘bumpy plateau’ [ +/- 7%] 2017 to 2027 or so is my guess, for global oil production.
It will take about 5 yrs of sustained decline to know the plateau is breaking down.
For me, the bumpy plateau stretches from 2005 to present. Take the fracking and oil sands production off the graphs and it becomes quite obvious. Once conventional oil starts to decline, things will go south. As this production was held stable in many places by water injection, count with a rapid drop when the water reaches the wells.
Westtexasfanclub,
Chart for conventional oil below (subtracts tight oil and extra heavy oil from World C plus C. Plateau from about 2004 to 2019.
The exact timing is debatable, but we are riding on the plateau.
Unlike many others here, I’m guessing it goes on longer than just a few more years, considering how high prices will stimulate production.
Time enough to get electrified for those who are awake to the scenario and have the capability.
Iran likely coming back to the market with another 1-2 Mbpd over the coming 5 years?
I suppose the oil price price will temporarily drop on the news of the deal. Good buying opportunity for those so inclined.
https://www.dailymail.co.uk/news/article-11121479/US-shows-China-military-training-missions-tension-Nancy-Pelosis-Taiwan-trip.html
“The key to a successful invasion, is an invitation” – Peak Avocado
The two US B-2 Spirit stealth bombers and four F/A-18 Hornet Fighters were pictured alongside an Australian E-7A Wedgetail spy plane.
“regarding the crucial roles of politics, financials, and technologies as well as the geology in these matters”
add war, slowing economic growth and Leverage overhang … hydrocarbons will be bid/transacted for with “something real”.
https://www.zerohedge.com/news/2022-08-17/visualizing-world-trade-post-petrodollar-bw-3-prep
In the chart below the blue lines show three cases from the recent EIA World Energy Outlook for projections for production of C&C in GoM (in mmbpd). The black markers are recent average annual production, with the average to May shown for 2022 (the final yearly average is likely to be less as we have yet to have the hurricane season, Mad Dog II start-up is delayed and some largely wells, notably at Mars-Ursa, can decline at up to 25% or more). The green line is a projection I did a couple of years ago based on 2P reserve numbers from BOEM for 2018. The curve was generated bottom up with,, for each main field, typical plateau and decline values used so that total production equalled remaining reserves . Discoveries not yet evaluated by BOEM were included in the same way using estimates based on press releases etc. Some such as those from BP and Murphy have predicted values from P10/P50 production profiles issued by the operator. New discoveries are not allowed for.
With modern estimation methods there isn’t significant revision of initial (conventional) reserve numbers, certainly not after first couple of years production, and there’s not much EOR being employed in the Gulf, therefore the difference between the green and blue lines represents required new discoveries from 2020; therefore I’d have to conclude that the EIA numbers are complete bollocks. Assuming there is a 10% decline after 2050 (however EIA seem to be indicating there may be a possibility of further increase) and 5 to 10 years from discovery to production this would require discoveries of 462 mmbbl per year for the reference case, and 722 for the high case, each year for the next twenty five. Only twice this century has 500 been exceeded and only six times since deep water production began. The most recent new field discoveries listed by BOEM (I.e. that would be main fields found in new leases rather than near field finds in already producing lease) are a couple of small ones in 2020 but the most recent that might be developed as stand alone hubs were in 2017. This year there has been one probable discovery at Huron, but the operator, Hess, has been fairly muted so it may not be particularly big. Even to approach the low case would require discovery rates that have rarely been achieved for even one year recently sustained for decades.
I’m not sure the current position on drilling permits but in the recent past all the available leases have been put up at every leasing round and fewer and fewer are taken each time. There are simply not many targets for exploration remaining. Even if there were then assuming an average find of 40 mmbbl (recent ones have averaged more like 10 to 15, but there are a couple of large ones waiting to be added), a 30% reserve growth (in fact in the last twenty years revisions have been slightly negative overall), a one in four success rates for commercially viable projects (its been less this year) and rigs drilling three wells a year, then 12 full time rigs would be needed for the reference case and 19 for the high case. BH reports about 15 total operating rigs on average this year and I think only one or two are for exploration from the BSEE deep water activity reports. Including appraisal and development wells might require up to 100 total rigs to meet the EIA projections. The rigs would mostly be 7th of 8th generation drillship and semi-submersibles with wells costing maybe $100 million. It is not going to happen.
There are six other cases in the EIA WEO. Why would you run all these nuanced sensitivities when your basic assumptions are so wildly bonkers? What service is the EIA actually providing by producing such crap, and why would anybody with a professional qualification agree to have their name put against it?
P.s. The EIA present projections for shale basins that are similarly wide of the mark. There aren’t really any new fields to be discovered there so somehow the existing producing areas would have to suddenly inflate (there is more detail in David Hughes’ Shale Reality Check at the Post Carbon Institute, for which I’ve only just become aware or the 2021 edition, but it may have been discussed here before: https://www.postcarbon.org/publications/shale-reality-check-2021/).
George,
With all the new projects set to come on line over the next 1-6 years, I’m quite sure we will see another peak in GOM production. Below is Figure 8 from my recent GOM post with my low-mid-high projections of future GOM production, as well as an EIA projection that I had at the time. Below is a link to the post as well.
https://peakoilbarrel.com/gulf-of-mexico-update/#more-37130
After 2030 or so I have production dropping off steeply in all cases partly because I don’t think future discoveries are going to amount to much. For example, my production ranges from 2040 are .3 – .8 – 1.3 mmbopd, while the EIA estimates from George’s chart above are around 1 – 1.5 – 2.4 mmbopd.
I don’t see it like that at really, but as I said the green line does not include new discoveries (i.e declared after 2018. I included almost all the projects under development in my projection. Some may be bigger than I assumed but equally those like Rydberg and Dover might be limited in capacity if they are tie-ins. The only ones I know I’m missing are Blacktip, and some small ones like Shenzi North, Spruance and Dome Patrol. Leon and Castille are larger than I assumed but will be later as they have a dedicated (revamped) production platform. But against that North Platte is likely to be quite late with Total pulling out and Equinox cancelling drilling. There are Tigris and Guadeloupe by there’s not much data. The bigger and older platforms are coming off plateau quite quickly and the only one I know that has some project to boost production is Jack/St. Malo water injection. So new production is up against 15% average well declines. The more realistic, than WEO, EIA short term outlook seems to get lower each time it comes out. Either way I was questioning the EIA WEO, not whether there’s going to be a new peak. It is predicting a 20 year plateau for the high case.
Just wondering does anyone know what the impact will be when the spr sells the 180 million barrels. Looking at the chart US production should rise to cover the difference?
Sean
US production will not rise to refill the SPR. The EIA will put out tenders to buy about 150 million barrels. Imagine what that will do to an already tight oil market.
Enviromentalists will prevent refilling the SPR, claiming it isn’t necessary anymore.
Anyway – no US president will pull this stunt shooting up the oil prices. It can be only refilled with oil prices under 50$, for political reasons.
I posed this question in the last thread.
I don’t look for the SPR to be refilled anytime soon, if ever.
If it is refilled, it will take years to build back what was released over 6 months.
I shouldn’t be surprised, but gasoline prices seem more important than ever politically.
USA is going to have to do a lot better with charging stations. Heard on Bloomberg that one in five are defective.
Shallow – That sounds about right…I’ve been to many many stations and out of 10-20, there’s almost always a couple not working or not working at the correct power level…not sure why they are so finicky…
Thanks for feedback all. USA policy seems hard to fathom to me at the moment so really helpful to get your input.
Hopefully, the transition works without decreasing nodes of complexity.
Exactly, an empty SPR is great insurance to keep oil prices high! So in that context it will be very unlikely they get refilled…possible they get used hundreds of years later if a new civilization makes it to a high enough level of complexity…don’t really see that happening, they would hopefully learn from our mistakes…
Why is everyone forgetting about Russia? Art Berman, Dennis, and even Ovi, states, That is a one month peak that I am looking at, possibly in 2023 or 2024.” I think it is because of their June and July recovery, circled in the chart below. It was assumed that Russia simply found a way to sell their oil to India and China, so they would just recover all their production and go right along, producing at around 11 million bp/d or more. That is not going to happen.
Russia will continue to find it difficult to get its oil to potential buyers, but that is not its main problem. Russia’s real problem is two fold, technology and geology. Russia was already in decline before the invasion. Their old Ural and Western Siberian fields, 60% of their production, was already in serious trouble. Russia drilled some 5,000 infill wells per year in those fields to keep production up.
And all the Westrn oilfield service companies have pulled out. They have no source for spare parts that is always in continious demand. And they have a real brain-drain problem since those service companies pulled out. Those 5,000 annual infill wells will likely drop to near zero.
On top of all that The IEA sees Russian production dropping by over two million barrels per day as new European sanctions kick in next year.
The walls are closing in on Russia. Their production is going to drop. The only question is by how much.
10million barrels per day…bankrupt…that is the use of biden sanctions.
CC, the oil sanctions placed on Russia were put there by G7 and the European Union. The US is only part of that group. Biden did place sanctions on US investment in Russia and on Russia’s largest bank and several of its most critical state-owned enterprises and on Russian government officials and their family members.
You can call those Biden sanctions but not the oil sanctions. On those, Biden just went along with the rest of Europe. So please don’t call the oil sanctions Biden sanctions. Doing so just makes you sound like an ignorant Trumpite. And I am sure you do not wish that. 😂
Ron
I keep seeing articles on this Russian Vostok project. Will that be affected by US sanctions? Also I see another discovery in Russia. Does Vostok impact your views on Russian production?
Russia Announces 82-Million-Ton Arctic Oil Discovery
https://ca.finance.yahoo.com/news/russia-announces-82-million-ton-160000444.html
==============
Rosneft begins production drill at Vostok Oil project’s Payakhskoye field
https://www.business-standard.com/article/companies/rosneft-begins-production-drill-at-vostok-oil-project-s-payakhskoye-field-122080100470_1.html
Ovi, they hope to be producing about 2 million barrels per day by 2033. That is 11 years from now. They may make that goal, but I doubt it. At any rate, current Russian oil production will decline much faster than Vostok increases production.
That being said, sanctions is currently throwing a huge monkey wrench into Russia’s Vostok hopes. This will very likely delay the project by years.
Deep crisis looms, but here comes Russia’s biggest ever Arctic oil project
However, also Rosneft is feeling great pain from sanctions. The tankers that are to ship the Vostok Oil from the Sever Bay terminal to the world markets include vast number of foreign technology that is increasingly hard to replace.
As the European market closes for Russian oil, Rosneft will also have to deliver the Arctic oil to other markets. East-bound shipments on the Northern Sea Route is seen as a prospective alternative. However, the remote waters are ice-free only few weeks during the year and massive icebreaker operations are needed to keep the route open.
Rosneft is also experiencing major problems with investors. Recently, partner company Trafigura sold its 10 percent stake to Nord Axis, a company registered in Hong Kong. Also Vitol is planning to sell its stake in the project, Kommersant reports.
Ron
Thanks for putting this in perspective.
I used to work for a major oilfield services company (ofs) and my wife still does. She is dealing with the Russian issue on a daily basis. It’s not correct that the ofs are pulling out. They have severed their Russian operations, not terminated them. You are correct that parts will be an issue, but current ops continue with the still in place personnel.
I suspect brain drain will be an issue long term, but right now it’s against sanctions for a company to facilitate an employee (former employee) leaving Russia to take a position in the west. The only way for that to happen is for the Russian employee to resign, obtain legal working residence in the west entirely on their own and without current employment, and apply as a mid-career hire. My former company wouldn’t be able to talk with someone from Russia for at least two months.
Jgittes, thanks for the post. As to brain drain, I was not speaking of Russians leaving, I was talking about foreign workers in Russia. I am sure, as you say, Russians leaving will be a problem down the road, just not right now. But maintenance requires parts. New wells require parts. I am sure they have an inventory of parts but that inventory will not last forever.
Could you comment on which ofs are maintaining operations in Russia, that you are aware of?
Thanks
The best source for this type of information is the website yalerussianbusinessretreat.com. Google Yale russia list.
The database is searchable by industry and sortable by level of retreat. Just glancing through, SLB and Weathford have severed their Russia operations and don’t provide additional investment. Halliburton is actively scaling back operations and suspending contracts. Baker Hughes is withdrawing, not just severing.
All major US and UK oil companies have withdrawn or suspended ops.
Thanks for the link to the database!
https://www.yalerussianbusinessretreat.com/
When I sort it for Energy sector companies I see that as of the most recent mid-August update
that certain companies have withdrawn operations from Russia-
Exxon, BP, Shell, Equinor
and other companies have scaled back or suspended new operations-
Total, Eni, Schlumberger, Baker Hughes, Halliburton, Wetherford, NOVarco
ex. Hal- “suspend future business in Russia and wind down certain contracts”
ex. Sch- “stopped new investment and technology deployment to our Russia operations”
ex. NOV- “suspend all new investments in Russia”
ex. Weatherford- “suspend new investments/deployments in Russia”
Overall, this looks to be far from a withdraw of operations for many of these oilfield development and service companies. The information provided at the website is based on press releases by the companies.
And many other companies have not changed policy.
Things not looking good for Russia.
However, is there a country that is in a better position to decouple from the global economy?
Things won’t be good in Russia. But they will have enough resources for themselves.
And 4000 nukes aimed outwards.
I remember Putin doing a test a few years ago to see if Russia could disconnect from the global internet and still function on their own “intranet”.
Peak Avocado, there is no doubt that Russia has enough oil to last itself many years if they stop exporting anything. And they also have a lot of coal and natural gas. They also have a lot of nukes. But hey don’t manufacture computers or computer chips. They don’t manufacture electronics though they do make a lot of heavy armaments their technology is just not there.
Yes, they do have enough agricultural capacity to feed themselves. However, I am not sure how they would fare if they completely exited the global economy. I think their citizens would be very unhappy with only Russian-made products.
Actually, I think the world is so dependent on globalization that hardly any country could completely close its borders from all imports and exports and survive with anything like the current standard of living.
All good points Ron.
How can Russia develop space sattelites and Inter continental ballistic missiles if they can’t develop electronics?
Maybe they can trade gas to China for the electronics.
thanks!
Don’t forget, that Russia, along with the rest of the world, lives in a global economy. What we, or they, don’t have, can just be imported. Did you actually believe that all the computer chips and computer technology used in the Russian space program, actually originated in Russia?
We live in a globalized economy. When it is cheaper to import labor, technology, or whatever from another country that is what we do. And it is what we have been doing for over half a century. We are so dependent on globalization that neither we nor any other country can carry on business as usual without it.
The collapse of globalization means collapse of civilization as we know it.
“The collapse of globalization means collapse of civilization as we know it.”
No doubt about that.
I was just suggesting that Russia was in a better position to absorb the damage.
And I have seen hints that Putin has been preparing for it.
https://www.defensenews.com/industry/2022/06/08/russian-microchip-maker-eyes-taiwan-exit-in-response-to-sanctions/
“Shpak, has described the potential decision to leave Taiwan as “not a tragedy.” And the departure would likely benefit Rostec, which has long lobbied to create a domestic microchip-industrial base.”
Micron is jointly controlled by AFK Sistema and Rostec, two Russian industrial conglomerates, and produces microchips for both military and civilian use.
They do give the US rides to the space station and back, until recently.
For a major nation, Russia imports little.
The total value of exports (FoB) was 426,720 million.
The total value of imports (CIF) was 247,161 million.
At the HS6 digit level, 4,385 products were exported to 198 countries and 4,426 products were imported from 224 countries.
Russia is the No1 exporter of wheat.
PA, I write you here as the site doesn’t let me drop an answer to your last post. Russia definitely was prepared. The actual conflict exists at least since 2014 and they used those eight years very efficiently. Almost everything Russia doesn’t produce, she can get from China, and China is happily swapping its products for Russian goods. These two countries reached a level of simbiosis difficult to break. And they are not isolated at all on the global stage.
The actual conflict exists at least since 2014 and they used those eight years very efficiently.
After the coup in 2014 in the Ukraine, Russia could see the writing on the wall.
https://moderndiplomacy.eu/2018/06/04/how-and-why-the-u-s-government-perpetrated-the-2014-coup-in-ukraine/
Putin is keenly aware of his and your weaknesses.
I am purely speculating,
but I believe he is a control freak who would love nothing more than to have you by the balls depending on him for something.
I would bet he obsesses about resources, and has thought thru about every scenario.
And he has the money and resources to do that kind of analysis.
Europe Paying 30 Times More For Natgas Than Alberta… LOL
Few realize the massive DAMAGE being done to the European & Asian Economies. With Natgas prices 6-8 times more than the U.S. natgas price, watch as more European & Asian companies go bankrupt.
And then there is the HUGE Disparity between the Dutch TTF Gas price & Alberta. As of August 17th, the Dutch TTF spot price was $67.44 vs. $1.98 in Alberta… LOL.
Those Albertans have no idea how GOOD they got it.
steve
yes but volume is not enough to offset sales to Europe to offset Russia…Quatar ships to Britain?
German have no Rhine, no coal, no power, no nucs, just solar that snowed in last year…
Steve
There appears to be a difference between Spot and contract delivery. Contract is closer to $Cdn5 for 1000 ft^3. I wonder if the price drop in August is related to low summer demand in Canada and will begin to rise as winter returns.
I want to bring your attention to the reply I posted above to Survivalist. The operating costs for Thermal is $Cdn18.93/b. I assume this is a SAGD operation. Assuming it takes 1/6 of a barrel equivalent of nature gas, i.e. 1000 ft^3, to produce that barrel of oil, that would put the NG portion of the operating cost somewhere between $2 and $5. Not a bad return for an operating Net Back of $63. I can now understand why many commentators say that CNQ will be a cash cow generator once they get their debt down.
https://peakoilbarrel.com/russia-oil-drop-collapses-april-non-opec-production/#comment-744656
OVI,
There seems to have been one of the gas pipelines in Force Majeure, that has now fully reopened. That may have been part of the issue as Canadian Natgas exports to the U.S. have fallen in the past weeks.
https://twitter.com/PipelineFlows/status/1560609936857513985
steve
We in the US are ever looking to expand our export capacity and are doing our best to help raise prices here. One of our facilities is working with FERC to fast track approval for another two trains…gotta export all that gas as quickly as possible. Wait til Freeport starts back up again. Throw a hurricane or two in there and it’ll be an exciting winter.
Ovi – this is what a recent ramp-up profile for an FPSO in Brazil looked like. Start-up might have been announced any time for the first three months if they got some power from a diesel emergency generator to start commissioning. After the first well is bought on line there would be a period of flaring, with low and possible interrupted production, while the fuel-gas system and compressors settled in. Ramp-up to plateau then takes a year or more depending on how any production and injection wells are needed. The plateau might be interrupted, as in the dip shown in the final month, by planned turn arounds or unplanned outages. It is no surprise that a recent start up is not impacting overall production figures for two or more months.
George
Thanks for the update and explanation. I am sure this will be helpful and interesting for all of our participants.
I will probably get a Brazil update in the next few days. It will be interesting to see its direction.
More Whitehouse Oil Price Inflation Help On The Way… LOL
According to the DOE, there are another 20 million barrels of SPR Oil up for bid from 16 different companies, which will be released between Mid-Sept & Mid-Oct. Nicely timed before the upcoming Nov Elections.
Also, the U.S. Treasury estimates the SPR Release has helped bring gasoline prices down by $0.33-$0.38 for Americans. Thus, now that the DOE has drained 160 million barrels from the SPR, or 25%, it has saved Americans about 35 cents per gallon… LOL.
https://home.treasury.gov/news/press-releases/jy0887
steve
On the flip side of the fall in Russian production is the recent rise in production from China, likely most or all from shale/tight oil. Like the US, China has the incentive and wherewithal to frack its old fields and China is making it a priority to do so.
https://www.reuters.com/business/energy/petrochinas-gulong-shale-project-may-bolster-chinas-oil-output-2021-09-30/
https://oilprice.com/Latest-Energy-News/World-News/Chinas-Oil-And-Gas-Production-Hits-Record.html
Mr. Hren,
For those of us who experienced the jolting price hikes – and scarcity – of oil during the 1970s, the current disruptions in the energy world may foreshadow familiar future pathways, the expansion of China’s shale production being just one.
Argentina’s Vaca Muerta output increased ~40% yoy this May.
Should that country’s decision makers continue on a course of positive development, Argentina will flip from spending almost $20 billion on imported LNG to becoming a global natgas supplier.
India is investing $2 Billion to kickstart ‘shale’ production in West Bengal.
By applying the latest US-led technologies (especially locally mined sand for proppant and re-use of produced water for frac’ing operations), this nascent industry may surprise as to the swiftness of its being developed.
A topic hardly mentioned one time on this site over all the years is Coal Bed Methane extraction.
When natgas is is fetching $10/$40 per mmbtu, coal resources all over the world are apt to be (re)examined on the viabilities of implementing this relatively inexpensive process. Indonesia, India, South Africa and China being prominent contenders for leading in this field.
Interesting times prompt interesting outcomes.
Coffee , ” India is investing $2 Billion to kickstart ‘shale’ production in West Bengal. ”
Please stop the BS . You know nothing about anything about West Bengal and the financial and federal structure of India and how finance is shared between the centre and states . Fools rush in where angels fear to tread . By the way ” kickstart ” ?. There is and never was any shale production in any Indian state . Adios .
HIH,
Yeah, must be a figment of my imagination that the Great Eastern Energy Corporation announced a few weeks back that they were prepared to invest ~$2 Billion to explore/recover ~7 Tcf of OGIP.
A statement corroborated by the state government confirming that a lease agreement has been signed.
Seems like the GEECL is a leading Coalbed Methane producer in that region also, looking at ~10 Tcf OGIP.
Unsurprisingly ignorant comment from one who still puts credence in Art Berman despite a decade’s worth of non stop inaccuracies from that so called ‘expert’.
Dennis I made four scenarios one of which I believe is your own. I did not use extraction rates.
With your one I made the decline rate the average YoY production % from 1979-2019 which was more or less BAU.
The other scenarios are also guess work, I set a random number generating for % increase and decline rates. I used area under the curve (AUC) to estimate URR up to 2100.
For the pessimistic scenarios a bias towards decline since TRR and ERR would dictate there isn’t much more low hanging fruit left on the blessed oil tree even with the technological advancements in the field.
The optimistic scenario did not have this bias and the random number generator was set between a 5% increase YoY and a 5% decrease YoY which significantly affects URR up to 2100.
For everyone else looking at this, look at these plots with an extremely large grain of salt.
My own view is that peak oil will most likely occur between 2019-2025. With 2019 being the peak with a 33% chance, 33% chance it will be after 2019 and finally a 33% chance it will be after 2025, 1% chance it will be after 2030.
So as you can see I am very much biased towards the pessimistic view.
First plot is very similar if not the same as Dennis’s scenario.
Optimistic view. With potential for a huge URR if we extend time beyond 2100. Also potential for another peak within the error margins.
Pessimistic view 1.
Doomsday scenario for all the doomer porn lovers. Cliff.
Mike, great graphs, thanks. One caveat, however. 2019 was not the peak month, the peak year or even the peak 12-month average. All three of those belong to 2018 as shown in the graph below.
Hi Ron,
Thanks for that information, you are 100% correct. I think when i was cleaning the spreadsheet I would have dropped a row which would have mistakenly moved the peak to 2019. So that was definitely a mistake on my part and the peak should be 2018 at just over 30 Gbl/year production.
Iron Mike,
Thanks. Note that most reasonable estimates of World URR are between 2700 and 3500 Gb. Probably better to extend the scenario out to 2200 or 2300 to get a URR and if you did that I imagine the “optimistic scenario” would give unrealistic results above 3500 Gb.
Likewise scenarios with a URR less than 2700 Gb for World C plus C output are not very realistic, unless one assumes some doomsday scenario that causes demand for oil to evaporate. It is very likely that at least 2700 Gb of crude plus condensate has already been discovered that is recoverable at $80/bo in 2022 $, it is quite unlikely that there will be no further discoveries in the future and no upward revisions of discovered resources in the future.
Iron Mike – Nice work, I think you’ve done a great job capturing the debate. I subscribe to the pessimist view unfortunately. It’s not even a question in my mind that another peak could occur, if there was ever a chance the Russia situation completely eliminated any it. The core fields that make up the vast majority of oil supply are in extremes decline, with top 50 mega and supergiants approaching 70-80% depletion on average. Growth would require replacing so much oil that it’s unimaginable.
Unimaginable for any one individual, yet there are 8 billion and they are cumulative. People are not understanding the rate of change in technology and science that this many human brains produce. The human brain is the most complicated thing in the universe and we have 8 billion of them working simultaneously on all of these issues on this tiny planet. To pretend to know the outcome under these circumstances if the height of hubris. Guessing is fun, but let’s remember that that’s all we are doing.
Stephen,
I couldn’t agree more, it’s more or less pure guesswork especially on my part regarding the plots.
Thanks Kengeo,
Hard to predict how it will actually play out, but all the 4 scenarios presented are almost 100% going to be wrong.
I .Mike-
if you display these charts in a shorter timeframe (2010-2030 say)
I think I’m seeing the big Covid related downturn on all 4 charts.
The last two pessimistic charts show no recovery off of that trough,
yet we have already seen a roughly 60% bounce off that bottom (despite the Russian invasion).
Is there an adjustment that could be made to update the projections taking the recent production recovery into account?
The error margins account for the 2021 rebound (even possibly 2022), but looking at 2021 according to Dennis’s spreadsheet it doesn’t seem like much of a rebound on the world C C dataset.
2020 – 76.02Mbl/day
2021 – 77.04Mbl/day
I can make any adjustment to the code people like (already fixed the error Ron pointed out). Just have to double check whether the 2021 data for world c c is correct. I’ll let Dennis answer that when he can. I am thinking the 60% bounce might be tight U.S oil maybe not world C plus C.
I’m not going to sweat the details. Thanks for the work and the visuals.
I like the 10% error margin feature.
Iron Mike,
The 2021 data reflects the EIA annual average C plus C output as currently reported, it is possible this estimate will be revised in the future, but typically by 2% or less. It is fairly likely the 2022 output will be at least 79 Mbpd.
If they’re going to open a serious shale operation in China they’d better get ready to rock and roll. The Indo-Asian fault extends deep into western China (Xinjiang) and that’s where the shale is. It’s one of the most seismically active places in the world. India is almost as bad. Shell quit the Vaca in 2020 b/c of seismic activity, but fracking still goes on, though the quakes are getting stronger and more frequent (60/10 days).
We were lucky in the U.S., in a way. Our shale basins were deposited in the stable interior craton, where seismic activity is almost unheard of. Even with that, the quakes got bad enough in the STACK basin of Oklahoma to attenuate methodology, and that’s happening in the Permian too.
Not a gentle sport, fracking. And the saltwater disposal means putting a great amount of water into an area that can’t readily accommodate it. Better China stick to coal bed methane, though if the Paris Agreement had one small set of balls among them they’d condemn that process straightaway.
Shell temporarily suspended one of their operations in Vaca Muerta in 2020, but continues on strong there
“Shell has interests in seven unconventional areas in Vaca Muerta and is operator at four of them”- 11/2021
Like Coffeeguy says, Vaca Muerta is in the early days of big growth story
https://www.naturalgasintel.com/vaca-muerta-shale-driving-natural-gas-production-surge-for-argentinas-ypf/
And it is a huge resource, will be a long story.
Well, I should have known better than to question Coffeeguyz, who is on top of this stuff like no one else.
Even Art Berman.
🤣
Lads,
Peak Oil goes mainstream.
https://www.ft.com/content/25451156-434a-4c36-96ef-774d99c89688
Tick tok …
https://oilprice.com/Energy/Natural-Gas/Europes-Gas-Price-Is-Now-Equivalent-To-410-Per-Barrel-Of-Oil.html
… and the gas peak isn’t it?
Hz Rig Count for August 19
US Tot: Up 1 for the wk.
Permian: Unchanged for the wk. Down 9 from the high of 331 six wks ago.
Texas: Down 2 for the wk to 305 and down 6 from 311 two wks ago.
New Mexico: Up 2 for the wk. The Texas Permian rigs moved to NM.
Frac Spreads for the week Aug 19
For the past 6 months, the growth in frac spreads has slowed.
In the week ending August 19, 5 Frac Spreads were deactivated for a total of 280.
The 280 are 10 fewer than the 290 operating in the week of February 25.
It is noteworthy that while completions have remained relatively unchanged for the past six months, LTO production in the Permian and the other basins has continued to grow.
Ovi,
You stated, “It is noteworthy that while completions have remained relatively unchanged for the past six months, LTO production in the Permian and the other basins has continued to grow.”
Why do you believe this? From the EIA Drilling Productivity Report Data?
According to Shaleprofile.com, the Bakken, Eagle Ford & DJ Niobrara do not seem to be growing, while the Permian is.
steve
Steve
The US May report shows an increase of 236 kb/d to 6,462 kb/d since February for the Big 2, Texas and NM.
Checking the DPR for the Permian and EF over the same period shows increases for the Permian, 236 kb/d, and EF 76 kb/d for a total of 312 kb/d. If we add in half of Haynesville, 18 kb/d, for a total of 330 kb/d.
So the DPR numbers are a bit optimistic, as we all know, but production is growing.
Ovi,
For the Bakken, Eagle Ford & Niobrara for May 2022, Shaleprofile shows 164 wells without production yet reported, but I don’t believe when these wells are added, will they surpass the overall TREND LOWER.
If you look at the BAKKEN on the bottom (RED AREA), its data is accurate as of May 2022, and it has not surpassed its previous production.
I believe the EIA Weekly Oil Production estimates are likely 400,000 bd higher than actual production by JUNE 2022.
steve
Steve
Compare apples with apples. I looked at the DPR Permian, EF and Haynesville to compare with the US official production numbers for Texas and NM. Shale profile is always late with Texas production numbers and revises numbers up every month. Not sure about NM.
Ovi,
True, but I don’t see any growth in the Bakken or DJ Niorbrara. So, when Shaleprofile comes out with updated figures for May 2022, I will post them. However, I don’t believe we will see any growth in the Eagle Ford, but we will in the Permian.
steve
Ovi,
With Bakken completions being constant, adding approximately 53 wells per month, oil production IS NOT INCREASING… hence the Dennis Shock Model is not working. Will it work over the next 12 months… we will see.
I see the same thing taking place in the DJ Niobrara.
steve
Steve
The Bakken has probably used up most of their Tier 1 sites and I expect holding production flat is the best expectation.
Ovi,
Should you spend ~2 minutes looking at the 9 page, graphic-rich pdf from a few months back from the NDIC’s Justin Kringstad (‘North Dakota Drilling Inventory Assessment’), you would see the increasing expanse of productive Bakken/TF acreage.
You may well be correct in assuming a somewhat flat North Dakota production profile, but you may be surprised at how many decades the Bakken/TF will produce over 1 million barrels per day (along with 3 Bcfd highly valued associated natgas).
Steve based on my Bakken model about 90 wells per month need to be completed each month to keep Bakken output increasing in 2022.
Recent North Dakota Bakken Model update, the model tends to underestimate output relative to NDIC data. For June 2022 model output is 938 kb/d, NDIC data is 1056 kb/d. After June 2022 the scenario assumes completio rate is contant at 74 completions per month until November 3031, then completion rate gradually decreases to zero in Jan 2038 with no wells completed after that date. Total horizontal wells completed is 27450 for this scenario, with 16387 total wells completed through June 2022. Click on chart for larger view.
Steve
I should mention that I am not surprised that production continues to increase when the number of completions remain constant.
Many years ago Dennis sent me a normalized Bakken well curve with a peak production of 1 b/d and I did the following analysis.
Assume that one of these wells is added each month to a basin. The chart shows how production would grow over 36 months and then what happens when no more wells are added. At the 36 month production point, production growth is increasing at 0.17 b/d and would continue to get smaller each succeeding month if more wells are added. I think Dennis calls this a Shock Model.
Ovi,
I would just call it a tight oil model and is the convolution of the average well profile with the monthly completion rate.
I think output from tight oil basins other than the Permian may be fairly flat until 2025 followed by gradual decline. I think Steve might believe that most of the increase in future tight oil output will come from the Permian. I tend to agree with that analysis.
Normalized Bakken Curve
Ovi, it is all a mathematical algorithm. It is all about new production versus legacy decline. The increase in production is all about new production from each new well. But the legacy decline is about the total decline rate of all previously drilled wells. Legacy decline is a percentage of total production from previously drilled wells. If both stay constant, then new wells will continue to increase production. But as new production is added, the legacy decline, as a percentage of total production, will increase. The percentage will not change but the barrels per day decline will increase. New production, in barrels per day, stays constant while legacy decline, in barrels per day, increases a little each month. Sooner or later, the legacy decline will overtake the increase from new wells. Then production will start to decline.
Ovi,
We haven’t had any tight oil data except NDIC data for quite a while.
Will civilization collapse because it’s running out of oil?
Will civilization collapse because it’s running out of oil? That question was debated hotly almost 20 years ago; today, not so much. Judging by Google searches, interest in “peak oil” surged around 2003 (the year my book The Party’s Over was published), peaked around 2005, and drifted until around 2010 before dropping off dramatically.
SNIP
There are plenty of technical issues to geek out on, if that’s your thing. For example, energy analytics firm Rystad recently downgraded world oil reserves by about 9 percent (from 1,903 to 1,725 billion barrels), but the authors of the new research paper suggest that reserves estimates should be cut by a further 300 billion barrels due to long-standing over-reporting by OPEC countries.
Downgrading reserves by 300 billion barrels would put estimated reserves at 1,425 billion barrels.
Dennis, what are your URR estimates again? I know you have posted them but I really never paid much attention to them, sorry. But I was just wondering how this estimate matches up with your estimate.
Ron – It depends which day you ask him. And every day it’s a little bit more because of the magical compounding reserve growth…lol
But Dennis usually likes URR somewhere around 3,000…
In contrast it’s very difficult to find any papers/groups that go above 2,500…discoveries fell off the cliff back in 70s-80s…took another 20 years to figure out URR (early 2000s). Not much change since then, and no change in past 10 years (except now we are revising downward due to lies and/or errors). Dennis will try and disagree with 10-90% of this (as always).
Kengeo,
https://www.sciencedirect.com/science/article/pii/S2666049022000524
A recent analysis by Laherrere et al in 2022 has URR at about 3500 Gb. The USGS estimated conventional C plus C at 3000 Gb in 2000.
Many people have underestimated World C plus C, including me. In 2012 my estimate was 2500 Gb to 2800 Gb, I was wrong.
In 1998 Laherrere and Campbell estimated conventional C plus C URR at 1800 Gb, recently Laherrere’s estimate for conventional C plus C URR was 2500 Gb. My estimate is 2750 Gb for conventional C plus C URR.
Also my estimate for URR has decreased from about 3100 Gb to 2900 Gb.
Forecast from recent Laherrere paper in chart below
Despite the geologic potential,
I expect the URR to be much less than 2500, because of
-rapid replacement of light transport ICE vehicles by EV’s over the next decade or two, and
-geopolitical instability degrading oil export/trade
These effects will be more evident after 2030, and global oil production cliff drop this decade is a low probability event.
Opinion.
Hickory,
I am less optimistic. I think URR of 2500 Gb might be very good for the environment, but realistically 2700 Gb is about as low as it will be and it could be as high as 3100 Gb, if the transition to electric transport is slow, 2900 Gb remains my best guess based on the progress made so far, if climate change gets taken as seriously as it should in the near and long term, then maybe we see a URR of 2700 Gb, only in a perfect world would it be as low as 2500 Gb. Alas we do not live in a perfect world.
Thanks Dennis,
your level of understanding on this is far greater than mine,
and your level of trust in the stability level of the global economic and social systems is greater than mine as well.
Hickory,
The World order has been maintained for most of the past 150 years or so with the exception of WW1 and WW2. Perhaps this will end abruptly in the future with a Third World War, I am hopeful this will not occur, but am powerless to do much about it.
I am not specifically worried about a world war even though that is always a possibility.
More likely in my opinion is a growing trend toward failed states. Often that condition spills over borders.
Along with that, a trend towards increasing nationalism, trade ‘wars’, border isolationism, and fragmentation of the globalized trade that we have all grown to take for granted.
All these things combined have high risk of denting the potential oil URR, as I see it.
Hickory is correct, a world war is extremely unlikely. What is very likely is social anarchy, starting in the undeveloped world. When half the world is starving and begin rioting, things could go to hell pretty quickly.
Some have argued that history shows that starving people do not resort to anarchy and chaos. That is the case for people who have never had anything and just accept their fate. However history also shows that is not the case for the newly disenfranchised. Those who have lived a lower or middle class life without hunger who suddenly finds themselves with no means of survival will get desperate and blame the government. Then all the new have-nots will blame all “havs” and go after them with a vengence.
Hickory and Ron,
You presume this problem of failed states occurs everywhere or becomes more widespread than in the past. The World has weathered many crises in the past, I suppose things may get worse over time, but to assume this must be true worldwide runs counter to historical experience of the past 77 years. The future remains unknown, the possible number of scenarios of the future remain infinite and any chance of predicting a correct scenario of the future is exactly zero.
You presume this problem of failed states occurs everywher…
No, I never made any such assumption. Of course, it does not occur everywhere. It is occurring in several places but not of the same severity everywhere. People are already starting to starve in Sri Lanka, but soup kitchens are helping. But as it gets worse, the soup kitchens will not be able to keep up. Pakistan will be next. In a few years, several countries will fail. Each year several countries will fail and add to the world chaos.
or becomes more widespread than in the past.
Of course, it will be more widespread than in the past. The world has never had 8 billion people in the past. In the past, the world was mostly agrarian. Most people lived off the land. Now, most people live in the cities. In the cities, nothing grows that you can eat.
he future remains unknown, the possible number of scenarios of the future remain infinite and any chance of predicting a correct scenario of the future is exactly zero.
Baloney! The world’s environment is being destroyed, and the destruction gets a little worse every year. To predict that this will continue does not take a genus. The world is already in deep overshoot. The world is already using far more of its natural resources than is replaced each year.
Just look around you, Dennis. Do you see that? That will continue; that is my prediction. And the chance that this will continue are 100%, not zero!
Reserve growth is neither magic, nor compounding. The USGS completely revised the “slap a decay curve on it and call it a day” method awhile back. From the time they declared it a research topic of the highest priority in the late 20th century to the time they solved the problem in the early 21st century and applied it in their global resource update in 2012, it took about…12-14 years or so? Better late than never I guess.
Ron,
My best guess is about 2900 Gb, about 50 Gb higher than cumulative output plus 2P reserves.
The recent Rystad estimate plus cumulative production is about 3000 Gb.
Ron,
That estimate of 2900 Gb is for World C plus C URR and is about 100 Gb less than the Rystad estimate (3000 Gb) and about 600 Gb less than the recent Laherrere et al estimate (3500 Gb). My estimate is on the conservative end of recent URR estimates.
It sounds as if these new NG reserves might blow predictions out of the water, so to speak. There’s little doubt that the source rock in the Vaca Muerta is some of the thickest and richest in the world. If it proves to be as accessible as portrayed, then it alone could change the calculus. LNG acts as a great feedstock for a wide array of petrochemical products, A plus is a byproduct called ammonium nitrate, which has become scarce and expensive. LNG may become the new crude oil, and it is cheaper to transport, what with using boil off gas as fuel.
I’ve never been to Argentina, but as best I can tell from keeping occasional tabs on Vaca Muerta news, there is a steadily growing capability to develop the widely dispersed resource. It will go on for decades.
Between that and great agriculture resource/capita (and outstanding wind and solar reserve), Argentina has strong prospects- if managed well.
I’ve never been to Argentina
I have, and it is one of favorite places.
Are you a fly fisherman?
Plus, beautiful women, if that is a priority.
I look for the price of oil to soon confirm what the US treasury and Eurodollar yield curves are telling us. Which is prolonged and deep recession is here.
If oil heads back in contango. It will be a third huge market telling us recession is upon us and demand is falling faster than supply. Which equals lower price. Which will also mean lower production for 2023.
Just from a technical standpoint if you pull up the weekly WTI or Brent weekly chart. Price is about to fall off a cliff. Nobody in their right mind would buy in based on the charts.
From a technical chart point of view the uptrend has already been broken.
Fundamentals and technicals are lining up for traders to short the oil market.
HHH
It will be interesting to see what OPEC announces on Sept 5. My guess is “No Change”. Then on October 15, the US SPR sales stop. So OPEC will be happy with $80 oil and that is the lowest it goes.
OPEC does not want to see a recession and oil at $80 is fair for eveyone.
Alberta Natgas Companies Giving Their Gas Supply Away For FREE… LOL.
Crazy dynamics taking place in these ENERGY MARKETS, and that will continue as we head over the ENERGY CLIFF. Imagine Europe paying $71 spot price for Natgas while Alberta is basically giving it away for FREE.
Alright… for a QUARTER.
LOL,
steve
Steve
Who would have Thunk? 🙁🙁🙁🙁🙁
Canada’s yield curve is grossly inverted. 3 month bills are yielding more than 10, 20 and 30 year bonds.
Not going to end too well for them. And yes funding for tar sand oil will dry up as we move into this recession.
As home values come down in US demand for Canadian lumber is also going to tank.
Dark clouds over Canada.
HHH
They don’t need funding. They are buying back shares, reducing their debt and paying out bonus dividends.
The company info I posted above, link below, pays a regular dividend of 75¢ a quarter. At the end of August they will pay a bonus dividend of $1.50.
Canada always does well, rain or shine.
https://peakoilbarrel.com/russia-oil-drop-collapses-april-non-opec-production/#comment-744656
Yeah that’s all going away.
And it only a matter of time before The Chinese repatriate all their cash out of Canada real estate.
People seem to believe collapse only happens to others. That they will be spared. Somehow?
Well, Canada isn’t going to collapse anytime soon.
I’m not sure where it’s gone but there seems to be a general shortage of water. The Ganges is so low they’re seeding the clouds. The Rhine is too low for tours and some commercial transportation. The Colorado is at a record low. The UK is in drought. So is Sri Lanka.
Faithfully, Canada possesses 14% of all the fresh water on earth. That’s a massive percentage!
And by the way, where has the rest of the water gone? It is a dictum that planet Earth came with its ration of water. We have been told that, during the eons of time, when polar ice was excessive, the ocean levels were low. And conversely, when the polar ice was all melted, sea levels were very high.
But today, even though polar ice has melted substantially, ocean levels have risen negligibly, and everyone seems to be short of water. So where is it?
Canada is sitting on a gold mine. In water.
And oil
Maybe collapse is too strong of a word. Canada is going to experience a depression as demand for their exports vanishes and their currency gets trashed.
When dust settles with property values 50-75% less than they are currently maybe they get to rebuild from a much lower level. As they do still have resources.
There is a spread of 60 basis point between the 1 month bill and 3 month bill in Canada debt markets. Why is that?
1 month bills are the best of the best of collateral used in Canada’s REPO market. And everyone is willing to pay a premium to get that collateral. The fact that there is a 60 point basis point gap between yields while the rest of the curve is grossly inverted should set off alarm bells if you live in Canada.
Everywhere you look even In Canada the signs are there. Shit is going to hit the fan and soon.
When is the $25 oil you predicted a month ago going to happen?
I said within 8 months. This is playing out as we speak. It’s not some hypothetical scenario.
Maybe it only goes to $30 and maybe it takes a few more months than 8 months. But I got direction right and I’ll be close on price.
I know I’ve said this a hundred time. This is all about dollar liquidity. It’s not just 2nd and 3rd world currencies that are getting smoked.
Europe, UK , Japan and China, Australia, New Zealand, and Canada. Just watch all these currencies.
HHH,
We will see if we hit $25 to $30 per barrel for Brent by April 2023, doubtful we will see a monthly average Brent oil price at that level in the next 8 months in my opinion. Perhaps in the next 18 years this will be correct ( a $25 to $30 per barrel Brent average monthly price in 2022 US$.)
Sorry, the water is still there. There is even more sweet water due to hotter climate (more evaporation).
It’s the wetter patterns where it comes down. It can happen like in Austria where last weekend came down up to 20 cm in one day.
Northern hemisphere summer weather pattern is mostly dominated by the jet stream.
It looks extreme this summer – but when you look into the history books since the median age, it’s still very calm compared to things possible.
For you US people, this happens every 100-200 years on the west coast:
https://en.wikipedia.org/wiki/Great_Flood_of_1862
Imagine the damage to silicon valley today, this could be the first trillion $ damage weather event.
I’m glad to hear about the water!
And I also agree with OVI: the rich oil sands represent a great long term resource.
One thing about having a precious resource that is difficult to mine, you can’t just tear its heart out and walk away.
Through the history of oilfields, there has been this uncontrollable rush, a boom, followed of course by excessive production resulting in a bust.
Athabaskan oil sands is one of a kind—at least on a grand scale. It may be almost as important as the water.
There is a shortage of fresh water.
Empirically it has been observed that no forest no rain. There is now a theory explaining why:
https://en.wikipedia.org/wiki/Biotic_pump
I do notice a lot more cloud build up once the deciduous trees have greened up.
Its amusing to observe the credence some people here give to HHH financial prognostications.
Sure we could have a depression with all sorts of gyrations, at any time.
But that doesn’t mean that a perpetual bet on that outcome won’t lose all of your capital as you wait.
Has he gotten anything right in past two years?
‘Not going to end too well for them [Canada].
And yes funding for tar sand oil will dry up as we move into this recession.
As home values come down in US demand for Canadian lumber is also going to tank.
And it only a matter of time before The Chinese repatriate all their cash out of Canada real estate.’
Hickory you add nothing to the conversation. You have no original thoughts. You google and repeat stuff as if it’s the truth just because you read it somewhere. Not going to waste anymore of my time with you.
Its just a personal inclination…
I lean heavy toward reality rather than speculation.
I’m going to point out to you the obvious. Everyone on here is speculating on what future production and prices with be.
I just happen to know a little more about the monetary system than most people do.
If you don’t like me then don’t read my shit. I don’t read your.
A lot of action in the oil price this day.
Shooting up and down in the 5$ range – traders are very active, and perhaps some have problems.
This is no way a result of demand and supply, it’s action in the paper world.
Saudi’s try to verbally hold prices from dropping off the cliff.
Energy minister: OPEC+ has the means to deal with market challenges including production cut
Minister of Energy Prince Abdulaziz bin Salman, said that volatility and thin liquidity send erroneous signals to markets at times when clarity is most needed.
In an interview with Bloomberg, Prince Abdulaziz pointed out that OPEC+ has the commitment, the flexibility, and the means within the existing mechanisms of the Declaration of Cooperation to deal with such challenges including cutting production at any time and in different forms as has been clearly and repeatedly demonstrated in 2020 and 2021.
Referring to the current state of the oil market, the minister said that the paper oil market has fallen into a self-perpetuating vicious circle of very thin liquidity and extreme volatility undermining the market’s essential function of efficient price discovery and have made the cost of hedging and managing risks for physical users prohibitive.
“This has a negative impact on the smooth and efficient operation of oil markets, energy commodities and other commodities creating new types of risks and insecurities. This vicious circle is amplified by the flow of unsubstantiated stories about demand destruction, recurring news about the return of large volumes of supply, and ambiguity and uncertainty about the potential impacts of price caps, embargoes, and sanctions.”
Reacting to the impact of the current volatility on the functioning of markets, Prince Abdulaziz said that this is detrimental because without sufficient liquidity, markets can’t reflect the realities of the physical fundamentals in a meaningful way and can give a false sense of security at times when spare capacity is severely limited and the risk of severe disruptions remains high. “Nowadays one need not look far for evidence of this.
https://saudigazette.com.sa/article/624167/SAUDI-ARABIA/Energy-minister-OPEC+-has-the-means-to-deal-with-market-challenges-including-production-cut
Thin liquidity. Sounds like something I keep saying.
He is talking prices up because he sees all the same shit I’m see in the markets
Is the underlying argument you are making is that governments won’t keep printing like they did in 2008 and 2020 in the face of the next big recession?
Shallow sand,
High money supply does not help much in a recession. What happens is the velocity of money falls by the same proportion as the increase in the money supply and there is no effect. It is spending by consumers, business investment spending and government spending that drive the economy. In a recession spending falls, sometimes lower interest rates can boost spending a bit, but it does not always work during a recession.
Let’s see what HHH posts about my question?
I have seen oil crater several times. 2008 it did, and massive stimulus followed. The price shot back up.
2014 it cratered but there was no stimulus. There wasn’t a recession. The price traded low for several years. Oversupply issue.
2020 was just a bigger shock and awe than 2008.
2022 I’m not seeing many argue the market is oversupplied. Demand destruction is alleged, but a lot of skeptics out there on that.
My only prediction is volatility. My monthly average price range is from $35 to $150. Or at least ballpark that.
So printing a bunch of money and sending it to consumers didn’t happen in 2020-2021?
I’m confused, clearly.
Shallow sand,
Giving money to people to spend is different from printing money. First understand that when the government spends money, it does not print money to do so, it borrows money from people by selling government bonds. So if the government spends more money than it collects in taxes government debt increases, that is what happened during the pandemic, money supply had little to do with it (that also increased to bring down interest rates). The important part was the government spending rather than the increase in money supply. In fact the government spending may have been overdone and that it what led to high inflation, again the money supply has very little influence on the economy.
I agree that oil prices will be volatile, but my range would be $60 to $180 per barrel in 2022 $ over the next 18 years or so with monthly average oil prices mostly in the $90 to $150/bo range (about 2/3 of the next 216 months.)
Am I wrong, or is this not, in a Keynesian world, the moment where the “government” step in and keep spending up, just on other things than consumers would?
What I’m saying is what they do doesn’t really matter. Did QE and negative interest rates ever fix Europe? Did QQQ QE in Japan fix the problem?
The answer is a resounding no. And we should have 6 more million job here in the USA right now. Just to get back to where we would have been in Covid was never a thing. Just to get back to trend.
Did massive stimulus fix the underlying problem or make it worse?
The central banks work since Lehman like slumlords : Yust tape it up somehow or do a big costly long repair?
Easy answer for them they need fast results… Just my 5 cents.
I have 100% confidence that they will do more QE and interest rate cuts and government spending.
I don’t think more debt which requires more future use of energy to pay the debt back is a solution.
We are piling on debts that can’t and won’t be serviced.
I think we will see what a loss in faith of currency and government looks like in Europe, Japan and China over next few years.
Debt is not eternal.
Debt bought by the central bank can be voided.
Spend government money, buy it from the central bank with reserves and void it. They aren’t there yet, but perhaps they will be there some day.
In old greece they made an all debt voiding a few times in the attic democracy. It gave them 30 good years when they did this.
Debt in these times included being sold to the debt holder when not able to pay, so it was a great relieve.
In a classic capitalism debt is voided by default of companies and banks. So look where to lend your money. Normally, the Lehman disaster would have defaultet most big banks in a chain reaction and voided most of the company and private debt. A chaos, and a restart with much less debt. As happend often in 19th century capitalism.
They taped it over, and now we have the consequences in the desaster you know more off.
If central banks void debt then money disappears. In large amounts. Really large amounts. That’s why it hasn’t been done.
Why it won’t be done. Currency debasement , uncontrollable currency debasement is in the cards for most. Particularly when loss of faith sets in.
HHH.
Ok, I understand where you are coming from.
I agree this cannot go on forever, but as it’s went on for so long, I’m in no position to say when the bubble bursts, so to speak.
I also don’t really know how it all plays out.
I do know that there isn’t a lot of oil out there that can pay for itself at $25. So either demand will need to drop, or governments will have to step in somehow, like they have been doing ever since before peak conventional (cheap) oil was hit in 2005.
Dollar closed at a 20 year high today. I just don’t think people get exactly how much damage a strong dollar is going to do.
And what a lot of people also don’t understand is the FED can’t really do anything about it. Cutting rates to zero and QE isn’t going to bring the dollar back down.
This is the Eurodollar market where actual dollars are created in the global economy. Not bank reserves at the FED that never see the light of day so to speak because bank reserves never actually leave the FED.
See following link for broad US dollar index, it is high currently, around 123 (2006=100), but has been around 115 plus or minus 5 for most of the past 6 years, so about 7% higher recently. This will reduce US exports and may hurt the US economy, but is not likely catastrophic at the World level.
https://fred.stlouisfed.org/series/DTWEXBGS#
We might see a mild recession if tightening by central banks cause interest rates to rise so high that the economy contracts. A severe recession is not expected by most main stream economists and the central banks can reverse their actions if recession hits.
Despite claims to the contrary, rising interest rates do have an effect on economic activity. About a year ago I refinanced at 2.25 % for a 10 year mortgage, currently mortgage rates for 10 year mortgage are about 5%, these higher rates keep many people from affording to buy a home and reduces home building. It also affects decisions to invest by businesses when borrowing costs are higher.
Claims that central bank actions have no effect on the economy are specious in my opinion.
Well all that stimulus over the last 13 or so years did help create the largest series of concentric bubbles in the history of capital markets. Trillions a month in options. Trillions in crypto. Trillions upon Trillions in the credit markets. Mega cap bubbles. Equity bubbles. Sure the bubbles seem to have lasted “forever” but it’s only been extended through increased fragility. Adding another bubble is the only play but it only increases instability. Cannot be easily unwound.
“Cannot be easily unwound.”
Yup. That is the problem with population and economic growth that has gone far beyond the underlying foundations of sustainability. They call it Overshoot.
Well OPEC+ might as well go ahead and cut their production target by 3M barrels since they don’t have the capacity anyways lol
https://oilprice.com/Energy/Crude-Oil/OPEC-Is-Now-Almost-3-Million-Bpd-Behind-Its-Production-Target.html
Dennis says: “First understand that when the government spends money, it does not print money to do so, it borrows money from people.”
Finally, I now understand. Like, when Hitler took over the destitute Germany that was in a depression. Germany owed the world more money that it could ever repay because of WWI. Germany could not borrow from any other country in the world. So, he simply borrowed money from the starving German “people” and gave it to the Military Industrial Complex in order to quickly build the world’s greatest military force at the time. Who knew that the “people” who were starving had so much money to lend!!
If the US is “borrowing” from the “people,” why has the balance sheet of the Fed expanded by over $10 trillion? Is the Fed “people?”
The first course in economics should be about money creation and destruction. Unfortunately it isn’t.
Conjectures:
1. Creating money to buy a good raises the price of the good.
2. Creating money to produce a good lowers the price of the good.
Conclusion: one cannot talk about free markets without a deep discussion about how money is created and what the money that is created is used for. Note that a lot of money has been created to support financial markets.
Many of the bonds sold by the government are bought by banks rather than by people from their savings. Banks create money, so a large proportion of government spend is freshly created money.
Every time a debt is created be it government debt or private debt it’s a call on future energy use. Obviously the private debts matter way more than the government debts.
Money is destroyed when debts are paid off.
Never enough money to pay off all the debt because the interest expense on the debt was never loan into existence. So you either need high velocity of money or expansion of money to service debts.
When there just isn’t enough energy the monetary system breaks.
That’s where we are currently at.
True with the current monetary system. The only reason the current monetary system has been successful is economic growth made possible by increasing energy supplies.
Why do we always attempt to solve socio/economic problems with growth in economic production? One reason is that our monetary system requires it. Without growth people borrow less which leads to a contraction of the money supply, loan defaults, and economic contraction. In fact our current system accentuates the direction of the economy. If the economy is growing, the system increases growth, if it is contracting the system causes the contraction to be extreme.
Empirically we know that a scarce money supply (such as the current money creation through debt and destruction on debt repayement) increases competition while an abundant money supply increases cooperation. That is why many people are in favor of a monetary system that does not preserve wealth. That is to say, many are in favor of a monetary system with inflation built in.
Wealth can not be preserved by a monetary system.
Money is all about distribution of work and ressources – the storage function is only a side effect.
Money works even without money – in history villages with very very scare real money trade between villagers was done on the base of debt. You give me a pig for the wedding feast of my daughter – I help you building a new barn next year. These kind of debt, with a lot of informal bookkeeping. “Value” of the debt was often calculated in money terms, even when never money was flowing.
And this kind of debt money system had no interrest – transforming a surplus pig into a help next year was a big help already.
And there was always risk – debt could be repaid or voided. When a pestilence or war party came into the village, some debt was never repaid.
As today. I know so many people saving pure money – and they notice how it went away this year by inflation.
Mail dog,
A military build up creates jobs and economic activity. Not the best use of resources, imo. Any spending by the government during a depression will improve the economy. Even digging holes and then refilling them can work, though there are better ways to spend the money, building roads, homes, etc.
D C
Money does not dig anything. Energy does. Without energy no debt no money no hole no economic activity.
How long have you been debating here, not knowing that basics!
What do you need alone on a lonely island? Money or energy (food for example)?
Look at Venezuela
Lot’s of energy available – oil or solar, but no activity.
It’s not that simple.
El Mar,
Water is also important, energy is not everything, despite what is claimed by some.
The government hiring people to dig holes and refill them, or to build tanks and other military hardware increases economic activity when investment spending is low during an economic recession. If you believe that is incorrect, find an introductory macroeconomics text at your local library or read Keynes’ General Theory for 60 cents.
https://www.amazon.com/General-Theory-Employment-Interest-Money/dp/1774642050
Keynes never seems to go away——
If someone would force me to study economic theories in detail, i would start with Kümmel:
https://iopscience.iop.org/article/10.1088/1367-2630/16/12/125008/pdf
He includes energy as a production factor for goods in his formulas. But he does not mention energy for energy production, so something is still missing.
Douglas Reynolds (https://www.amazon.com/Cold-War-Energy-Soviet-Union/dp/0692630619) considers
the role of oil for an economy, so its worth to read his book.
Neither Keynes, Solow, the Cobb-Douglas-function and most pre 1980 economic theories include resources or energy as production factors. They consider only technology, labor, capital and miss the most important part of the economy: energy. They are all totally outdated.
https://en.wikipedia.org/wiki/The_Coal_Question
https://ourfiniteworld.com/2022/08/23/why-no-politician-is-willing-to-tell-us-the-real-energy-story/
Water was important for hunter/gatherers as well.
Saludos
el mar
Of course, you also need access!
Well… we can officially say that they are giving away Alberta Natgas FOR FREE… LOL.
steve
Steve
Totally unbelievable while Nymex NG touched $10 last night
Ovi,
I have been checking the U.S. EIA Weekly Natgas Updates and this is what the data shows for U.S. Canadian Natgas imports.
7/27 = 6.0 bcf/d
8/4 = 5.6 bcf/d
8/10 = 5.2 bcf/d
8/17 = 4.5 bcf/d
In less than a month, U.S. Canadian Natgas imports are down 1.5 bcf/d. The next report comes out on Thursday, and I would imagine from the very low and even negative prices, imports have to be the same or less.
steve
Steve
Does that LNG plant not being operational in Texas having an impact. Too much NG going into storage in the US
Ovi,
Some strange natgas dynamics taking place. Before the Freeport LNG plant went down in Late June, Canada was exporting 6.1 bcf/d. Thus, Canada continued to export 6 bcf/d for July, even when the Freeport plant was down. So, why imports have fallen in August seems partially to be tied to the Northern Border Pipeline Force Majeure, but I don’t know the details.
Furthermore, I don’t know why we haven’t taken advantage of the low Canadian Natgas prices to import 6 bcf/d for the past month to put in storage.
Again… crazy dynamics.
steve
Recently, wasn’t the discussion that Permian is transitioning from predominantly oil production to more gas production? Thought a few people here were saying that, can’t recall who…
https://www.rigzone.com/news/west_texas_gas_export_to_mexico_in_may_hits_alltime_high-22-aug-2022-170052-article/
Sounds like US is looking to export more NG as well, so makes sense we cut back on imports…
EIA Drilling Productivity Report Funny-Money Accounting Figures.
The EIA Drilling Productivity Report may soon find its way into the Dust-bin as its forecasting ability is becoming… FUBAR.
When the May-Aug 2022 Drilling Productivity Report came out, this was the forecast for Bakken Oil Production:
June 2022 = 1,189,000 bd
July 2022 = 1,197,000 bd
Aug 2022 = 1,192,000 bd
Sep 2022 = 1,157,000 bd
Now, they updated prior months lower, but if we look at Shaleprofile, it shows 1,066,000 bd, with a few missing wells of production.
So, even if Shaleprofile shows June reaching 1,080,000 bd, that was 100,000 bd less than the EIA DPR Report for June 2022 at 1,189,000 bd. How much more will the EIA DPR have to reduce production… LOL.
steve
Steve
Attached is the ND DMR report on Bakken production for June.
Ovi,
Thanks, I was adding the 20,000+ bd of shale oil production from the mighty Montana Bakken.
steve
Steve,
Keep in mind that the DPR reports both conventional and unconventional oil from the Bakken region, that may account for some of the difference. The DPR is far from perfect, it is model based and often the model is wrong as it is only an approximation of reality.
Dennis,
Keep in mind the North Dakota Dept of Mineral Resources reports ALL PRODUCTION. They came in at 1,048,774 bd in May 2022. 🙂
steve
Steve,
It is 1059 kb/d for May 2022 for ND output, Montana was 53 kb/d so all of ND and MT was 1112 kb/d.
Steve,
Note also that shaleprofile includes only output from horizontal wells in the North Dakota Bakken/Three Forks, this would exclude output from any vertical wells and all conventional oil wells, this would be very different from what is reported in the DPR (which includes output from vertical wells and output from Montana).
Ovi,
By the way, about what day in the month does the EIA come out with the Monthly Oil Production Report?
thanks,
steve
Usually the last business day of month.
Dennis,
Thanks, it will be interesting to see June’s realistic oil production.
steve
Steve,
This month it will be August 31.
Steve
Dennis beat me to the answer. You can start looking around 11:30 on the last business day of the month? The bottom two links do not come out at the same time.
https://www.eia.gov/petroleum/production/
This one just provides two months of info
https://www.eia.gov/dnav/pet/pet_crd_crpdn_adc_mbbl_m.htm
Peak oil demand….because people can’t afford it?
Even without deep recession, this will be the case for discretionary/optional consumption that previously had been seen as routine for several billion people.
In 2014 Bakken oil was sampled 153 times, 100ish on trains and 50ish at wells. The API was quoted as 41.0, a weighted average of the samples. 100 samples 40.6 and the rest 41.7.
2017’s Equinor Assay quotes the number at 43.3.
There was a quote out of NoDak some yrs ago that Bakken oil was the same API as WTI. Events in the Permian changed that.
As of 2018, WTI became segmented into WTI sour, WTI Midland (API 38-42 (traditional WTI)) and the new WTI Light, API 45-50 (traditionally called condensate). In 2018, WTI light priced below WTI Midland.
I am looking for historical data of how much diesel per barrel of input has been available
to extract – and obviously I am interested in the change in this metric. There are tons of sites that say about X percent of a barrel of oil is made into diesel: but that does not seem to take into account the shift in API for you average barrel.
What is the right way to think about this?
Thanks
WP
Petroleum refineries in the United States produce about 19 to 20 gallons of motor gasoline and 11 to 12 gallons of ultra-low sulfur distillate fuel oil (most of which is sold as diesel fuel and in several states as heating oil) from one 42-gallon barrel of crude oil.
Shale: In commercial practice, the actual energy recoverable from the shale—and, hence, the specific break-even point in organic content—is strongly dependent upon properties of the oil shale as well as features of the process. For example, the organic matter content of prospective western and eastern U.S. oil shale is roughly the same (7.5–15 percent). However, the organic matter in western shale is “richer” in hydrogen than eastern shale, yielding 20 to 40 gallons of oil per short ton (84 to 168 litres per metric ton) compared with only 10 to 15 gallons per short ton (42 to 63 litres per metric ton) in the “leaner” eastern shale. At the same time, western oil is relatively high in paraffinic compounds, so that, with upgrading, it becomes an excellent refinery feedstock that is well suited to large yields of diesel and jet fuel.
See below, this may also be a good place to look:
https://www.chevron.com/-/media/chevron/operations/documents/diesel-fuel-tech-review.pdf
“Heating value per volume is directly proportional to density when
other fuel properties are unchanged. Each degree increase in American Petroleum Industry
(API) gravity (0.0054 specific gravity decrease) equates to approximately two percent
decrease in fuel energy content.”
Crude is typically between API of 15 – 45.
Light crude is typically in the 35-45 API range, which includes most of the highest valued crudes such as Brent and WTI. Crudes lighter than 45 are typically considered extra-light crude or condensates and are valued lower than light crude because they contain a lot of light ends such as propane and butane. A medium crude is in the 25-35 API range, and a heavy crude is in the 15-25 API range. Anything below 15 API would be considered an extra-heavy crude.
-https://www.mckinseyenergyinsights.com/resources/refinery-reference-desk/api-gravity/#:~:text=API%20gravity%20is%20a%20commonly,organization%20that%20created%20this%20measure.&text=A%20crude%20oil%20will%20typically,lighter%20(lower%20density)%20crude.
Weekendpeak
For the longest time there has been something known as the 3:2:1 crack spread.
https://www.eia.gov/todayinenergy/includes/CrackSpread_Explain.php
Three barrels of crude produced two barrels of gasoline and one barrel of crude. Not sure if the basic barrel of crude was WTI.
The 3:2:1 crack spread approximates the product yield at a typical U.S. refinery: for every three barrels of crude oil the refinery processes, it makes two barrels of gasoline and one barrel of distillate fuel. To calculate the 3:2:1 crack spread for a Gulf Coast refinery that processes Louisiana Light Sweet (LLS) crude oil, add the spot price for two barrels of Gulf Coast conventional gasoline to the spot price for one barrel of Gulf Coast ultra-low sulfur diesel.
https://www.eia.gov/todayinenergy/includes/CrackSpread_Explain.php
More Fun For Europe & Asia As Natgas Prices Explode To Record Highs
With The Dutch TTF price reaching $85 today while Japan-Korea LNG hit $70, this must have been partially due to the announcement by Freeport LNG that it’s planned reopening in October, has been pushed back to mid-November.
Furthermore, Freeport LNG WILL NOT reach full production until March 2023… LOL. Some believe this is a conspiracy to keep prices high, but Freeport was plagued with Safety Issues for years, so when it BLEW UP in June, those safety concerns came back to bite em hard.
BLOOMBERG: Natural Gas Slides in US as Blast-Hit Export Terminal Delays Restart
https://www.bloomberg.com/news/articles/2022-08-23/us-natural-gas-slides-on-restart-delay-for-key-export-terminal
steve
The Norwegians are however making serious dough now, since they got their major LNG plant up and running again, after skipping maintenance, causing fire and almost burning it to the ground, and also spraying salt water on a lot of electrics in the firefight a few years ago…
https://norwaytoday.info/news/production-at-equinors-melkoya-gas-plant-to-start-on-friday/
(maybe a clever move, you never know with Ola the Norwegian)
However they lost a bit of revenue in the meantime, but the SWF might cover it.
Can’t help you with changes over time but here’s EIA’s 2020 example:
Input (~250 billion gallons): 6.06 BBs (5.2 crude, 0.3 ethanol, 0.2 blending components, 0.2 HGLs, 0.2 other liquids)
Output (~270 billion gallons):
– 3.2 BBs of motor gasoline (134 billion gallons)
– 1.7 BBs distillate fuel oil (71 billion gallons)
– 0.4 BBs kerosene-type jet fuel (17 billion gallons)
– 1.1 BBs misc. (coke, still gas, gas liquids, asphalt and road oil, resid. fuel oil, pertrochem feedstocks, lubricants, other products). (46 billion gallons)
https://www.eia.gov/energyexplained/oil-and-petroleum-products/refining-crude-oil-inputs-and-outputs.php
Thanks – that actually was one of the sites I hit. I looked for historical data to see if/how the composition has changed (if it has) but I didn’t see it.
My theory is that as the raw material is getting lighter the fraction of diesel should be decreasing —> upwards price pressure on heavier fractions – but it would be great if I would find data which would support my little thought experiment…
rgds
WP
Bottom line is there is no correlation to be found between API and diesel content.
For most crude, 20% +/- 10% will be diesel range.
But unfortunately it’s more complicated than that. Crude oil (any oil really) is a very complex mixture of hydrocarbons (aromatic, polyaromatic/hydroaromatic, and paraffins). For diesel they are predominantly n, iso, and cycloparaffins and lesser extent aromatics – naphthalenes and alkylbenzenes). But rather than ID the actual compounds (benzene, naphthalene, cyclohexane, etc.) they use ranges of hydrocarbon chains. For diesel this translates to C9–C20, so the fuel refining process breaks the super-complex mixtures into slightly less complex mixtures (but still very complex).
I’m no expert on petroleum hydrocarbons but sometimes I pretend to be…
KenGeo,
Thanks for that. Does that mean that a barrel of (light) shale oil will, or can, give you roughly the same % diesel than say a barrel of – for example – Venezuelan crude?
Thanks
WP
Yes it does. And also means that watching API and correlating diesel content is not possible. For Venezuela, the super-heavy API of 16, extremely high sulphur content, and the acidity (naphthenic) make it a very expensive crude to process and therefore less desirable). So it gets heavily discounted compared to the others. Canada’s oil is similar (API = 20).
What does change with API is lower APIs will have less kerosene and naphtha (the lighter elements). Since diesel is a middle distillate it doesn’t really change with API.
For North American diesel, here’s a range of APIs and % diesel:
API 45: 16% volume
API 37: 17% volume
API 29: 17% volume
API 22: 18% volume
A good way to imagine API of 22 vs 45 is:
API of 22 is predominantly heavy end compounds (~60%) and very little light end elements (C4s, naphtha and kerosene).
API of 45 is almost entirely middle and light compounds (~80%) only 20% of the heavies. Diesel is still about the same but there’s double the kerosene, 4-5 times as much light-end naphthas and C4s…
Diesel is the middle man and is always ~20% +/-
I think you managed to shoot down my theory very convincingly. Clearly I need to learn more about hydrocarbon processing.
(Seriously) Thanks for the lesson(s)
WP
This is a terrific conversation. Thanks for teaching us a load.
Go down the rabbit hole if you wish:
https://cfpub.epa.gov/si/si_public_file_download.cfm?p_download_id=525041
Peak LNG Next
A prover for Mike’s assertion that a lot of the Permian acreage isn’t all that productive.
EOG just put 73,000 net acres on the market. Most of it is in Eastern Gaines County, with a small part in Western Dawson County.
When you consider EOG’s standing as a shale producer, I’d say this is a big deal. This is a lot of acres. They didn’t drill many wells on this acreage, 13 total. NRI ranges from 70-77.5%, which sure doesn’t help anyone but the mineral owners.
Shallow sand,
When I model the Permian basin I use the core acreage, the counties you cite are outside of the core areas. Of the 50 million prospective acres covered by the USGS assessments of the Permian, I use only about 25 to 30 million acres in my scenarios. I agree there are lots of areas in the Permian that are not productive, I assume that no wells are completed in those areas in my scenarios.
These two EOG leasehold packages on the market are not in a bad area… but they apparently didn’t hit the EOG minimums and are now punted. I follow the Dawson County side that EOG kept pretty closely… so far, the well performance has worked, but it’s tight hole city over there with EOG/CGS.
My point is that Dawson County could evolve into another major contributing growth county for the Midland Basin. Borden, Scurry, Fisher and Mitchell Counties are also seeing action that could evolve into something meaningful. The Permian core may be expanding a bit over there.
New posts are up
https://peakoilbarrel.com/opec-update-august-2022/
https://peakoilbarrel.com/open-thread-non-petroleum-august-25-2022/