A guest post by Ovi
Below are a number of Crude plus Condensate (C + C) production charts, usually shortened to “oil”, for Non-OPEC countries. The charts are created from data provided by the EIA’s International Energy Statistics and are updated to December 2022. This is the latest and most detailed world oil production information available. Information from other sources such as OPEC, the STEO and country specific sites such as Russia, Brazil, Norway and China is used to provide a short term outlook for future output and direction for a few of these countries and the world. The US report has an expanded view beyond production by adding rig and frac spread charts.
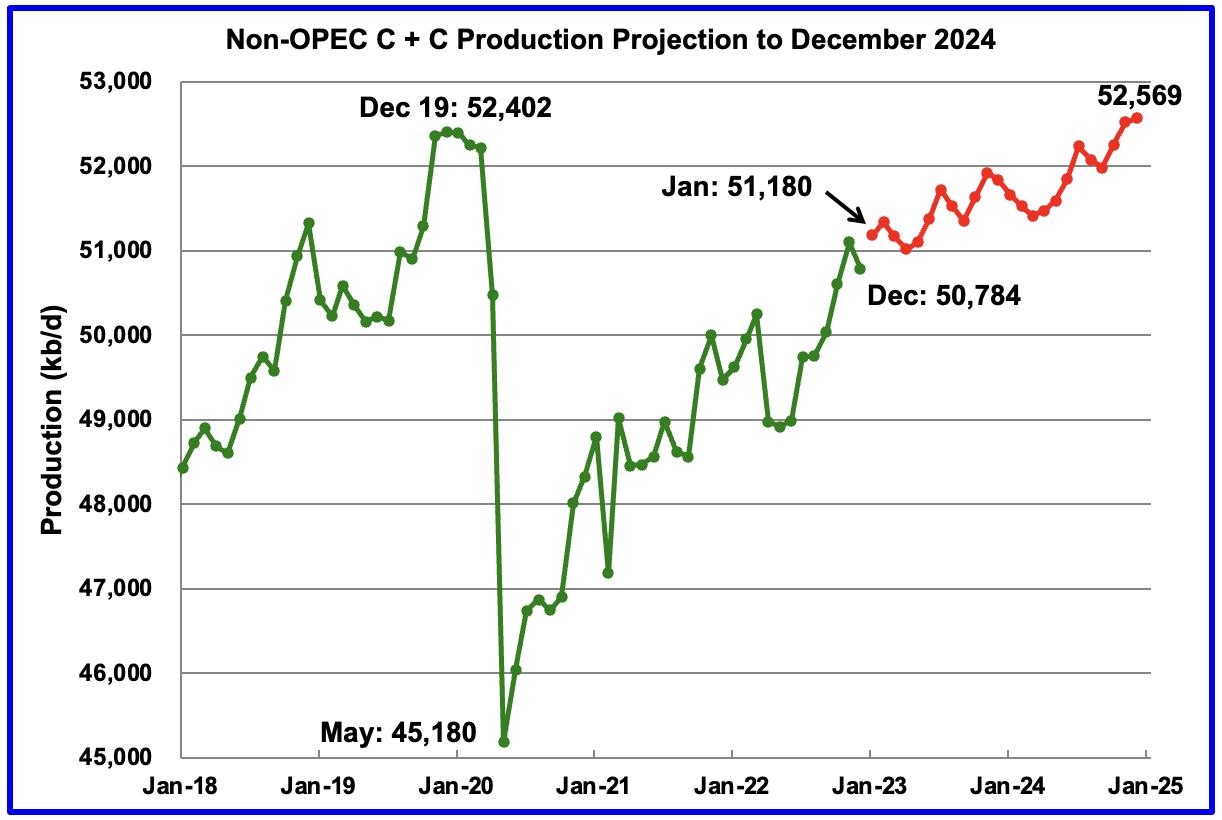
December Non-OPEC oil production decreased by 317 kb/d to 50,784 kb/d. The largest decrease came from the US, 276 kb/d.
Using data from the April 2023 STEO, a projection for Non-OPEC oil output was made for the period January 2023 to December 2024. (Red graph). Output is expected to reach 52,569 kb/d in December 2024, which is 167 kb/d higher than the December 2019 peak of 52,402 kb/d.
From January 2023 to December 2024, oil production in Non-OPEC countries is expected to increase by 1,389 kb/d. The major contributors are expected to be US, Canada, Norway and Guyana. Russia is expected to provide the largest decrease.
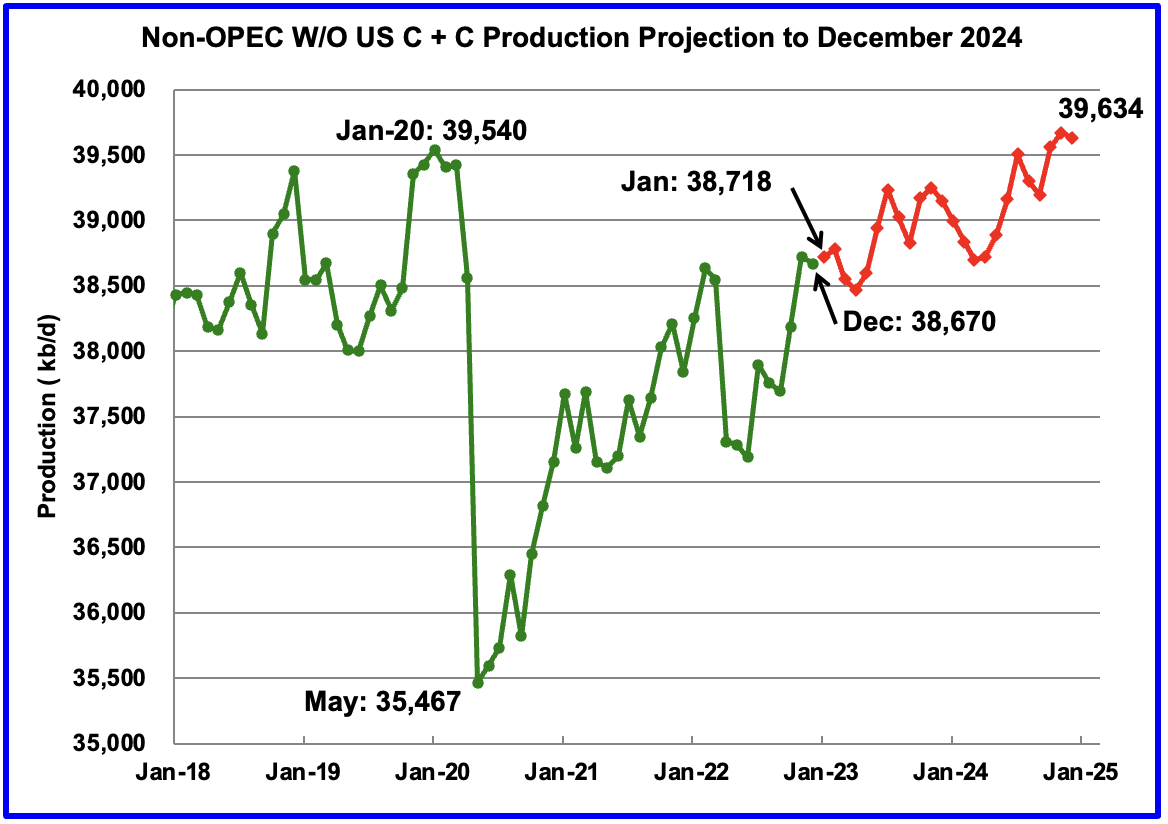
From January 2023 to December 2024, production in Non-OPEC countries W/O the US is expected to increase by 916 kb/d. This implies that 473 kb/d of the output increase seen from January 2023 to December 2024 in the previous chart is expected to come from the US.
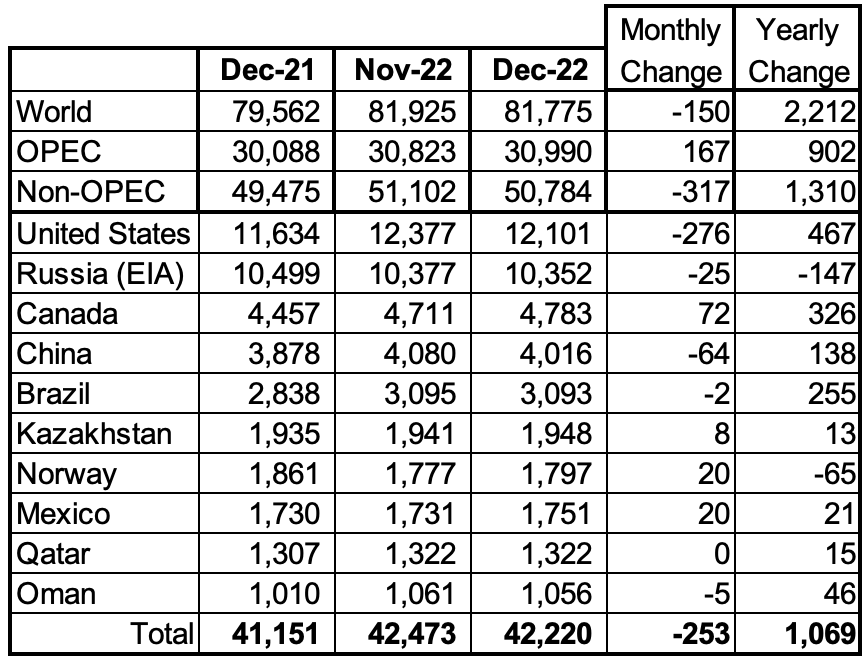
Listed above are the World’s 10 largest Non-OPEC producers. The criteria for inclusion in the table is that all of the countries produced more than 1,000 kb/d.
December saw a reversal of the previous months’ increases. The December production decrease for these ten Non-OPEC countries was 253 kb/d while as a whole the Non-OPEC countries saw a production drop of 317 kb/d. The US had the largest production drop in December, followed by China and Russia. On a YoY basis, Non-OPEC production increased by 1,310 kb/d.
In December 2022, these 10 countries produced 83.1% of the Non-OPEC oil.
OPEC C + C rose by 167 kb/d in December while increasing YoY by 902 kb/d. World MoM production decreased by 150 kb/d while YoY output increased by 2,212 kb/d.
Non-OPEC Oil Production Charts
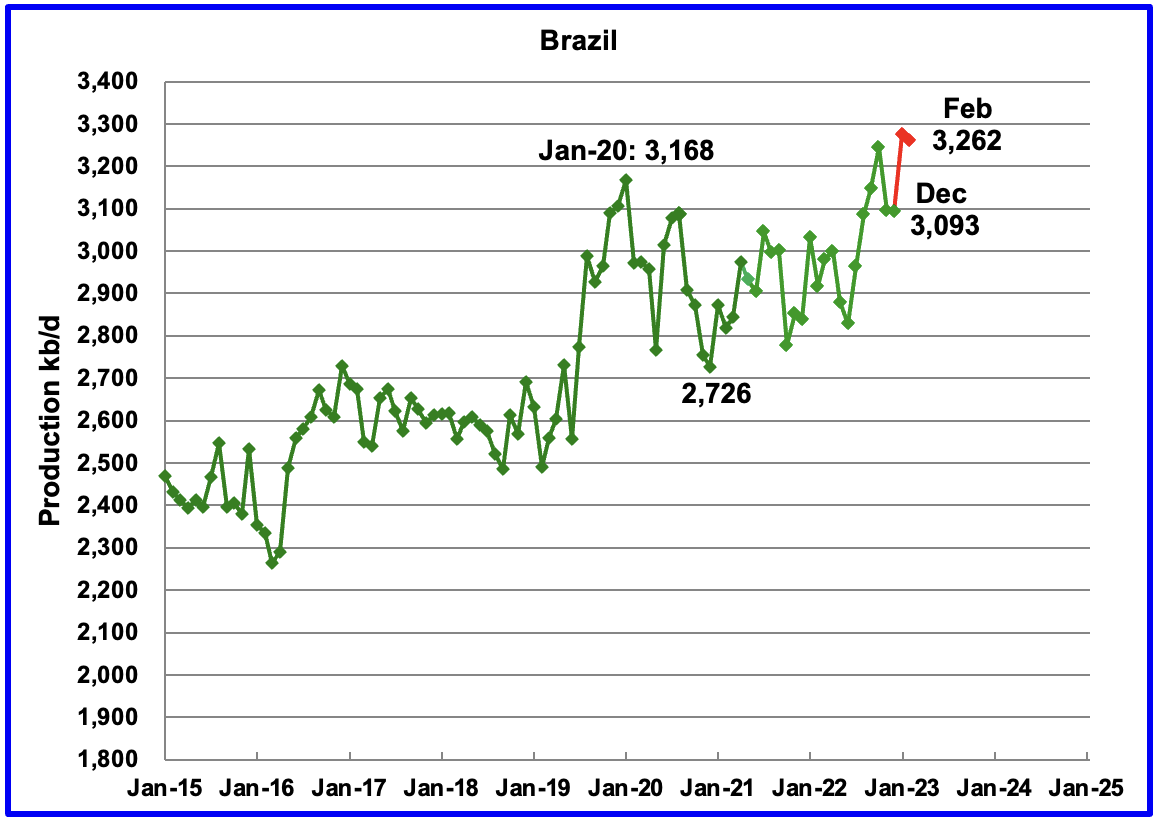
The EIA reported Brazil’s December production dropped by 2 kb/d to 3,093 kb/d.
Brazil’s National Petroleum Association (BNPA) reported that January’s output increased by 188 kb/d to 3,274 kb/d, another new record high, before dropping 12 kb/d in February to 3,262 kb/d.
Much of Brazil’s 2023 production growth will be from the highly productive pre-salt fields partially offset by maintenance interruptions.
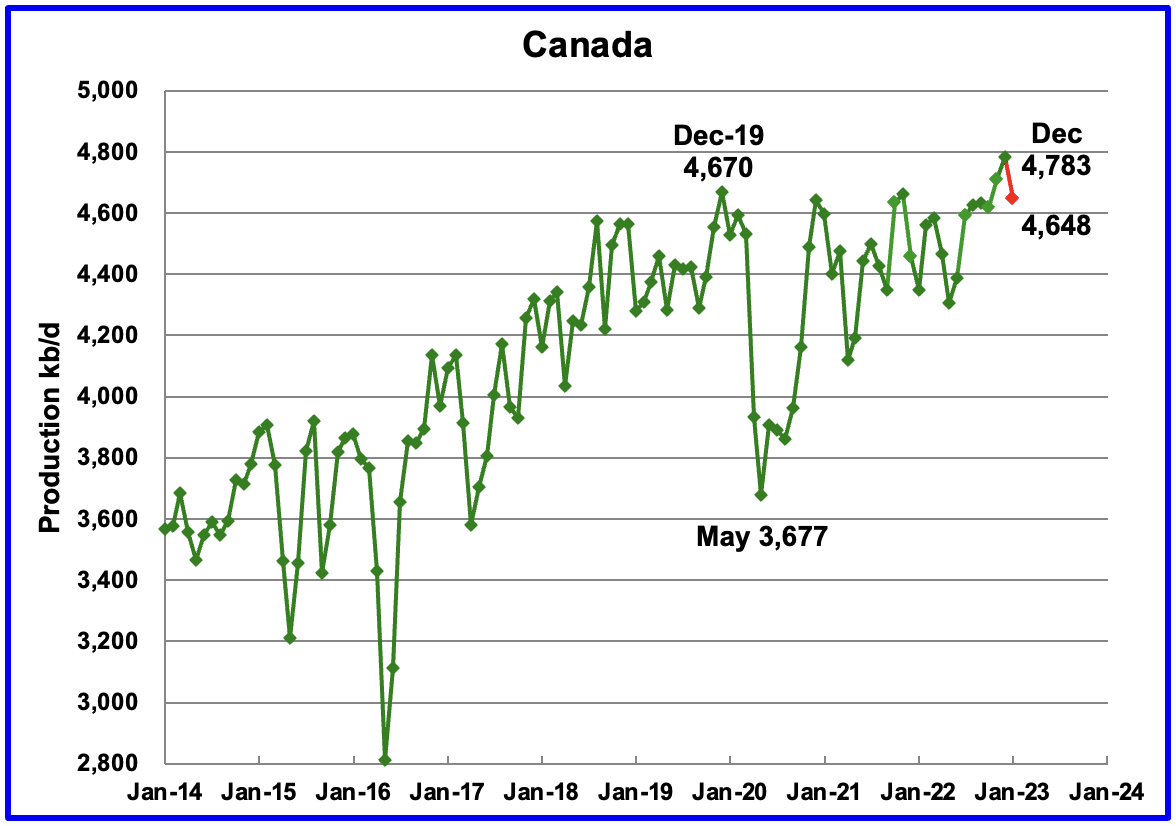
According to the EIA, Canada’s December output increased by 72 kb/d to a new record high 4,783 kb/d. Using information from the Canada Energy Regulator, January production is expected to drop by 135 kb/d to 4,648 kb/d. The drop was due to extreme cold weather and plant maintenance at an oil sands facility
Rail shipments to the US in December decreased by 6 kb/d to 120 kb/d.
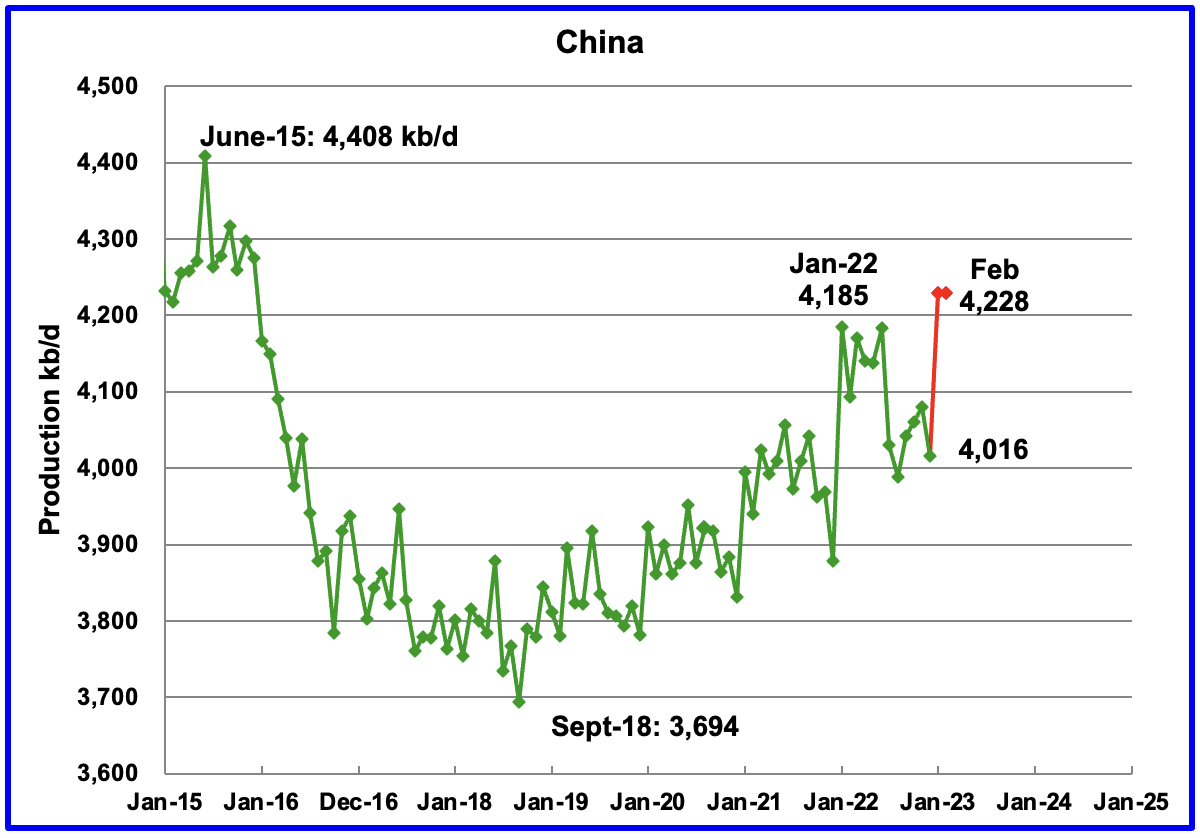
The EIA reported China’s oil output decreased by 64 kb/d to 4,016 kb/d in December. The China National Bureau of Statistics reported that the average production during January and February, red markers, was 4,228 kb/d, a significant increase over December.
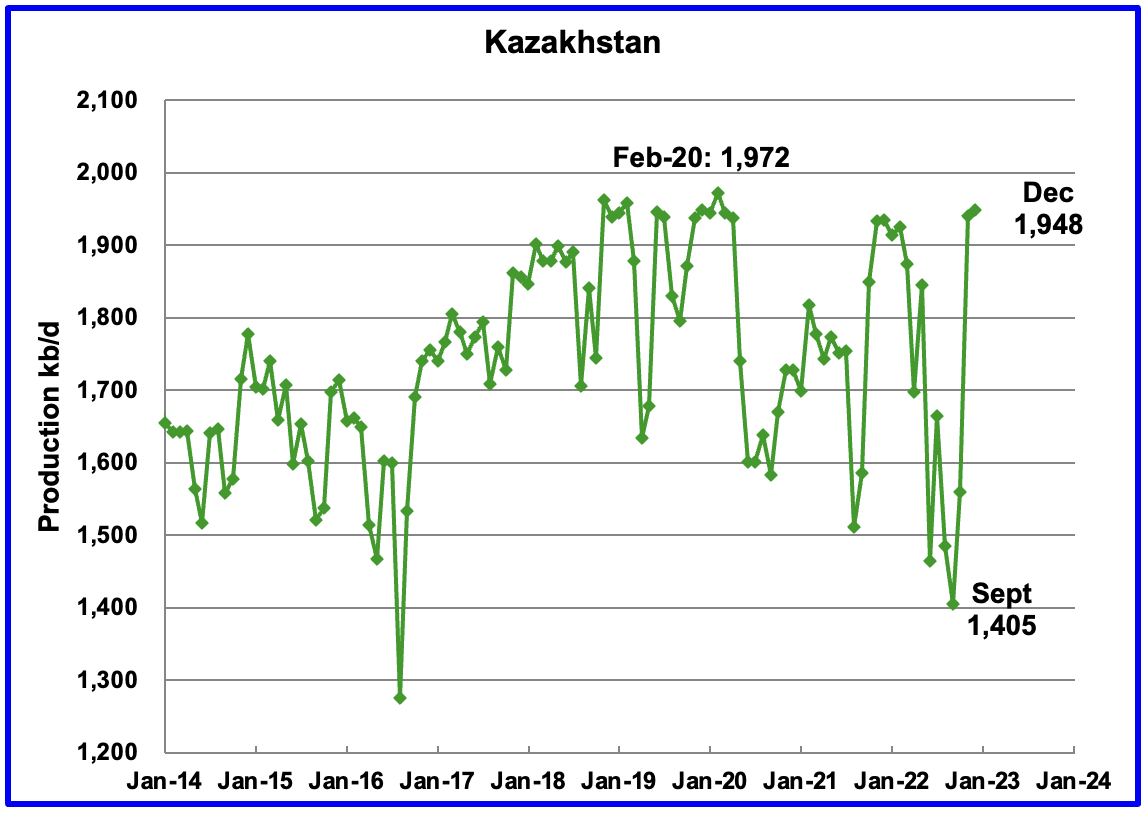
Kazakhstan’s output increased by 8 kb/d in December to 1,948 kb/d.
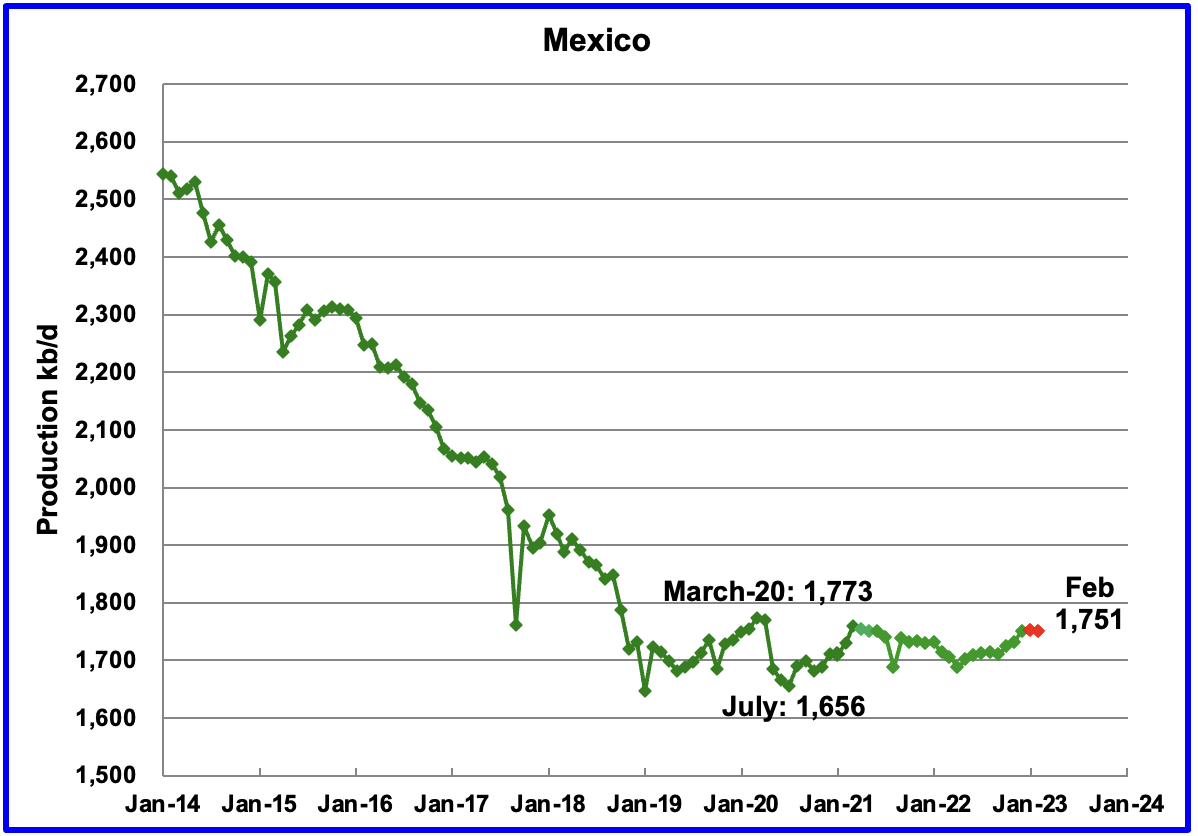
Mexico’s production as reported by the EIA for December was 1,751 kb/d an increase of 20 kb/d over November.
The January and February estimates, red markers, were obtained by using the Pemex increments over December production and adding those to the EIA’s December output because Pemex reports higher production than the EIA. January and February production was essentially the same as December.
According to OPEC, “the total crude production decline in Pemex’s mature fields is projected to outweigh production ramp-ups, mainly from Mexico’s foreign-operated fields. In its latest investor presentation, Pemex highlighted the importance of its priority fields (mainly condensate and light crude) to achieve its goal of production. However, persistent declines in Pemex’s heavy mature oil fields were set to mostly offset its other grades.”
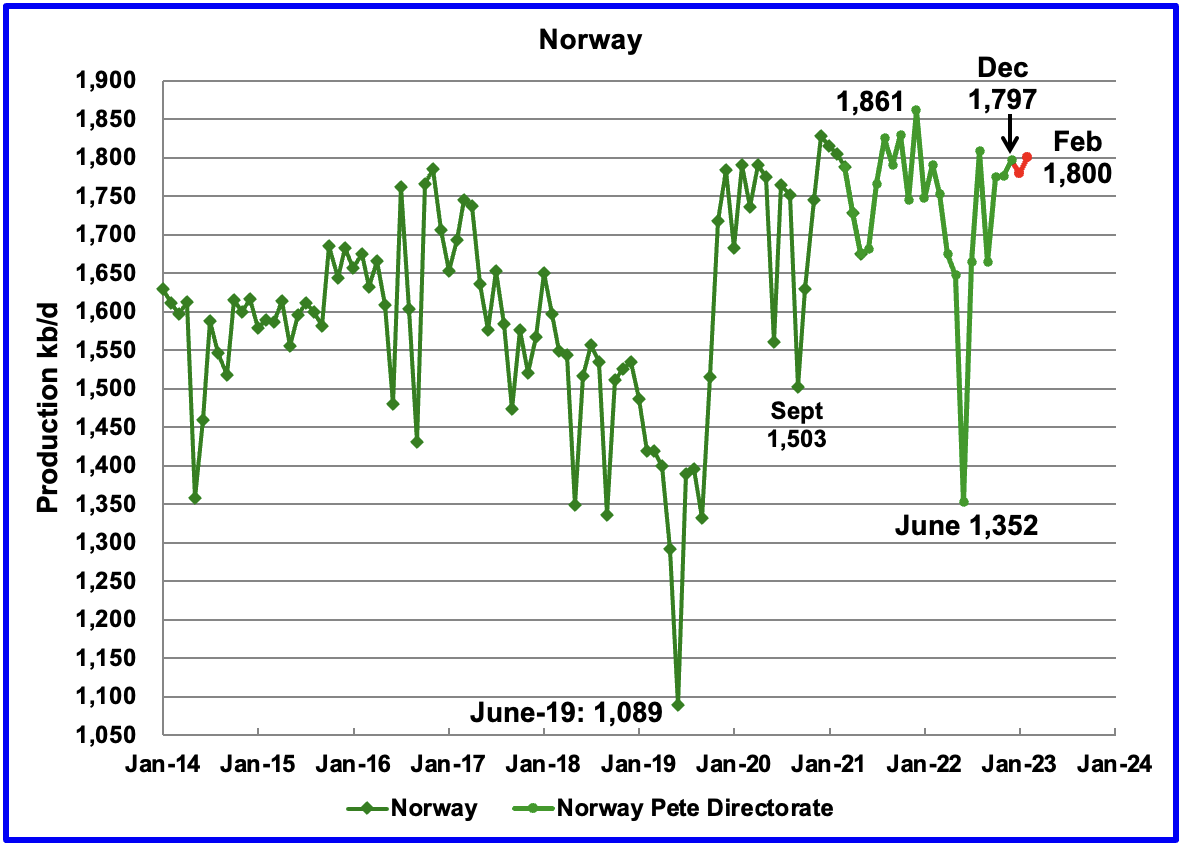
The EIA reported that Norway’s December production increased by 20 kb/d to 1,797 kb/d.
The Norway Petroleum Directorate (NPD) reported that production in January decreased by 18 kb/d to 1,779 kb/d and then increased 21 kb/d to 1,800 kb/d in February. (Red markers).
In the past, the NPD has stated that once the Johan Sverdrup 2 oil field came on stream, Norwegian oil production will hit a new post pandemic high. According to Equinor, “The entire Johan Sverdrup field is now on stream.” as of December 15, 2022. It will be interesting to see if the December 2021 post pandemic production high of 1,861 kb/d will be exceeded.
According to the NPD : “Oil production in January was 3.0 percent lower than the NPD’s forecast. For February they wrote, “Oil production in February is 2.8 percent lower than the NPD’s forecast and 2.5 percent lower than the forecast so far this year.”
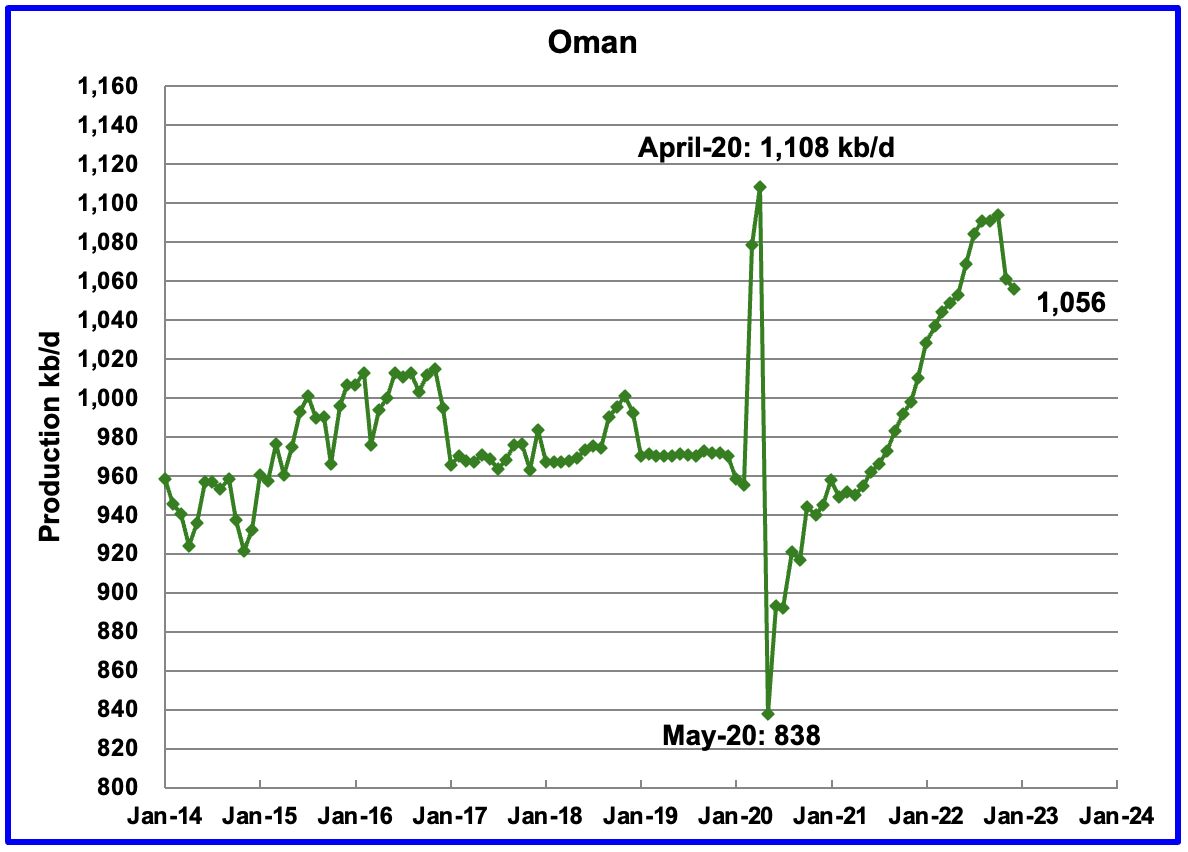
Oman’s production has risen very consistently since the low of May 2020. However Oman’s November and December production decreased by 38 kb/d to 1,056 kb/d.
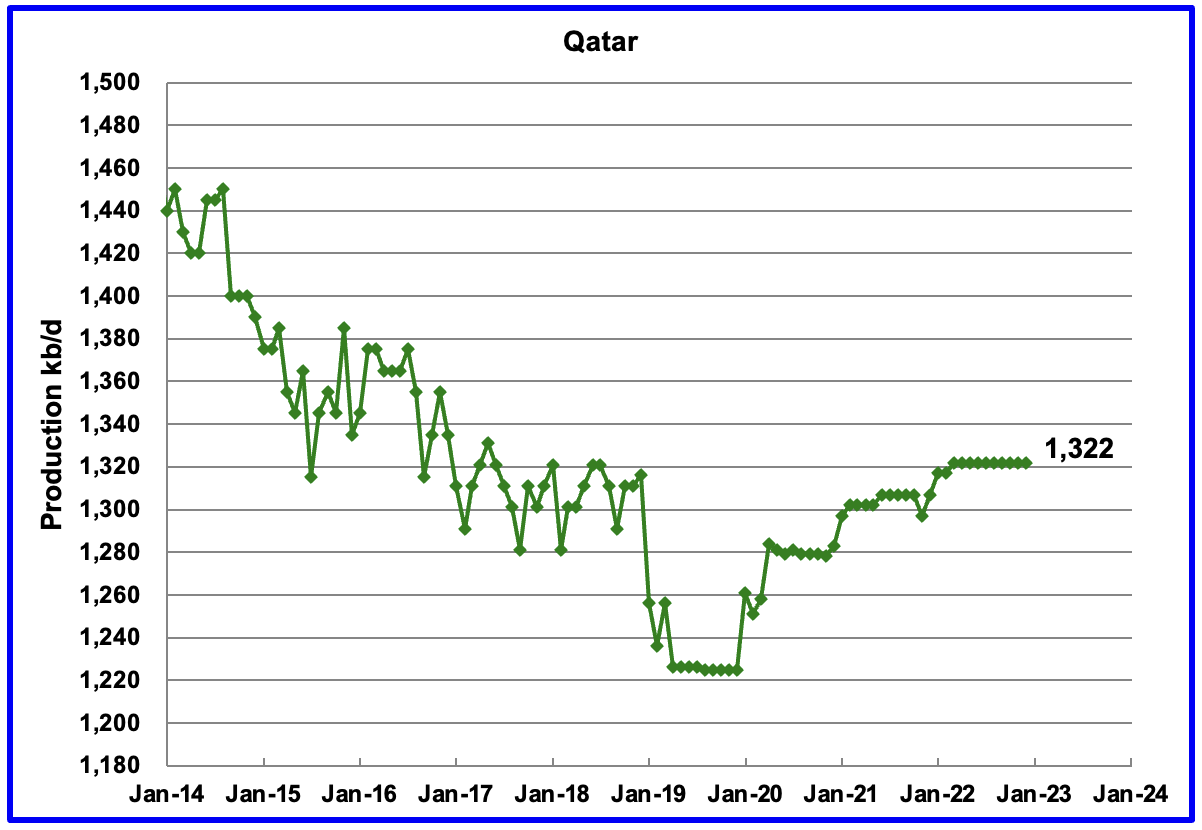
December’s output was unchanged at 1,322 kb/d. I assume the EIA is not getting monthly updated info. I also note that the OPEC MOMR shows no change in production.
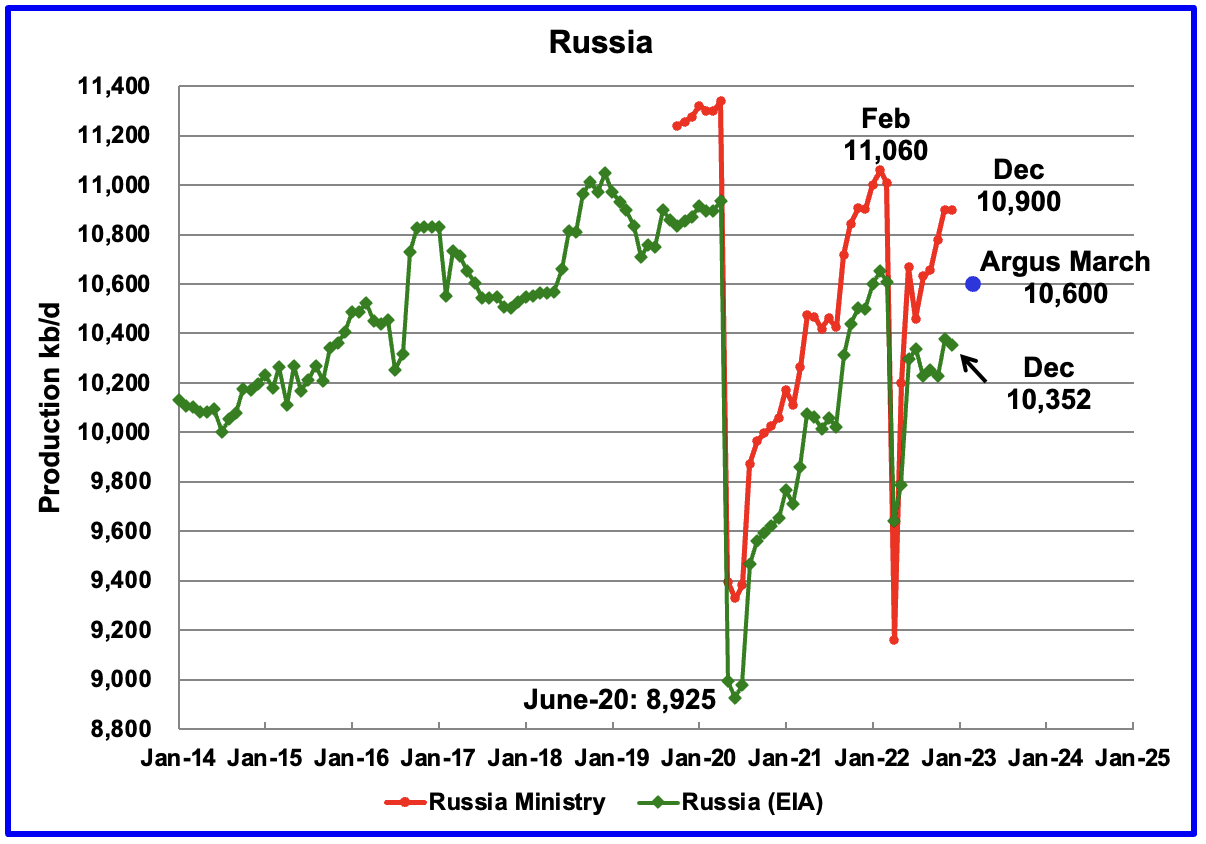
The EIA reported that Russian output decreased by 25 kb/d in December to 10,352 kb/d.
December Russia Ministry production is shown unchanged at 10,900 kb/d based on this statement: Russia will keep oil production in December at the November level amid the EU’s embargo and the price cap, Deputy Prime Minister Alexander Novak told reporters.
Argus Media is reporting that Russian crude production in March 2023 was 9,700 kb/d. If the typical Russian monthly condensate output of 900 kb/d is added to the crude production, Russian C + C in March would be close to 10,600 kb/d, blue marker. This production level is also being reported by TASS. Note the last line “We had 10.2 mln barrels per day in February,” Novak said.”
A later article by Bloomberg claimed that Russia cut its oil output by 700,000 kb/d in March. However the article further states that: “Russia watchers have started following the nation’s seaborne oil exports and domestic oil-processing rates as gauges for crude production estimates. However, both indicators showed no visible declines last month.”
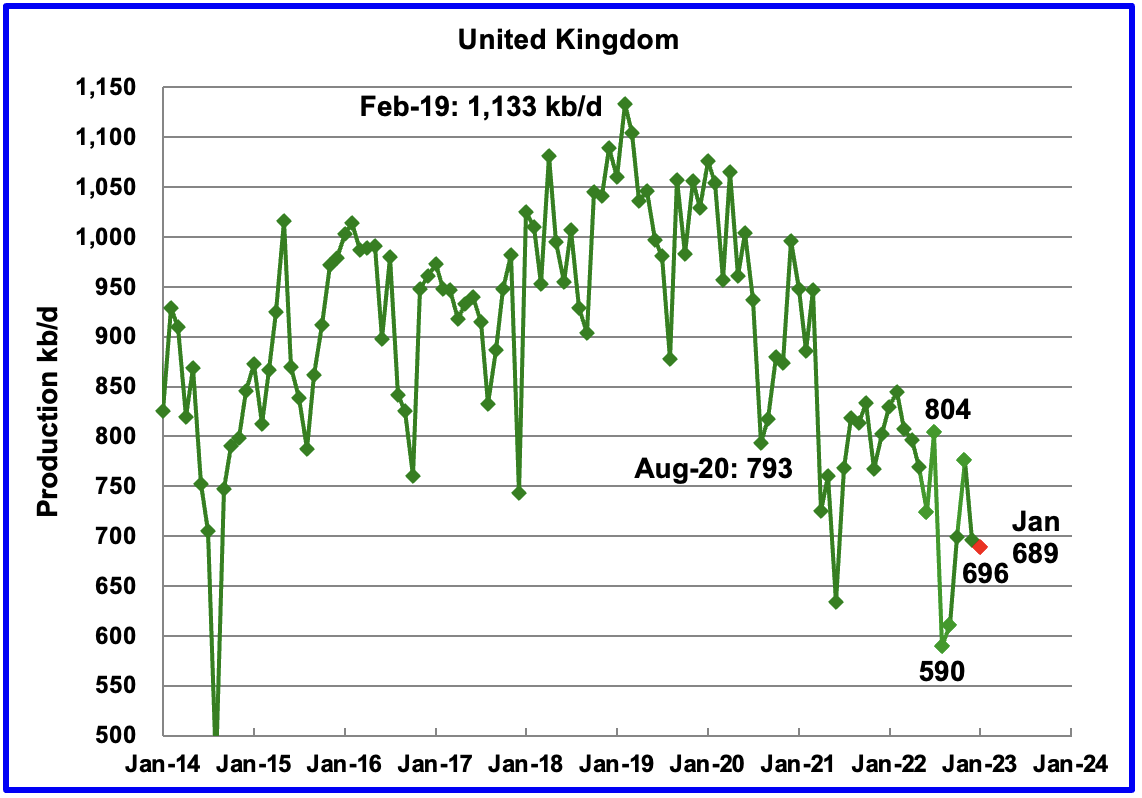
The EIA reported UK’s production decreased by 80 kb/d in December to 696 kb/d.
According to this source, January’s production dropped to 689 kb/d.
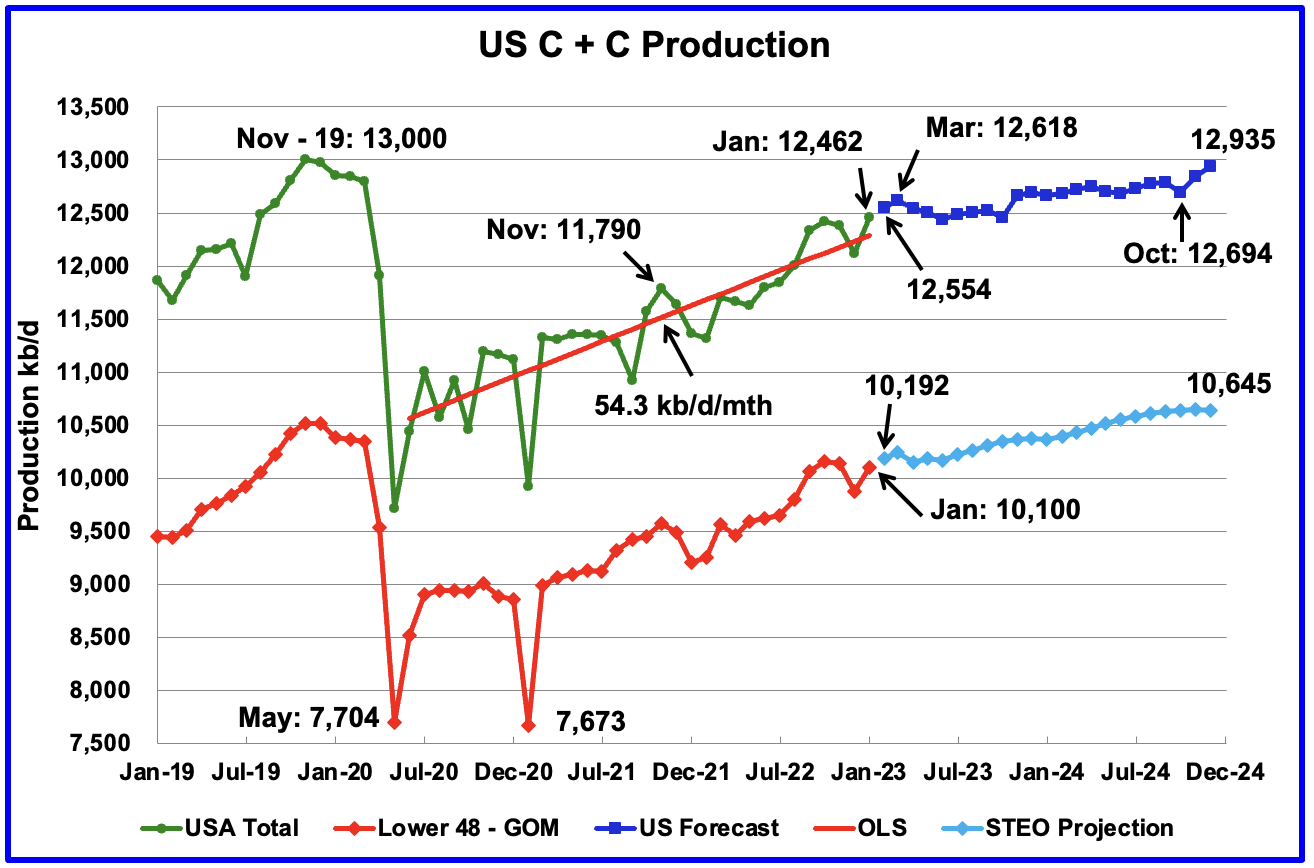
U.S. oil production in January increased by 437 kb/d to 12,462 kb/d, a post pandemic high. For January, the GOM contributed 125 kb/d to this high.
The dark blue graph, taken from the April 2023 STEO, is the forecast for U.S. oil production from February 2023 to December 2024. Output for December 2024 is expected to be 12,935 kb/d, 111 kb/d higher than posted in last week’s US update. From March 2023 to October 2024, production is forecast to increase by 76 kb/d. February’s production is expected to increase by 92 kb/d to 12,554 kb/d.
From January 2023 to December 2024, production in the lower onshore 48 states is expected to increase by 453 kb/d. Light blue graph.
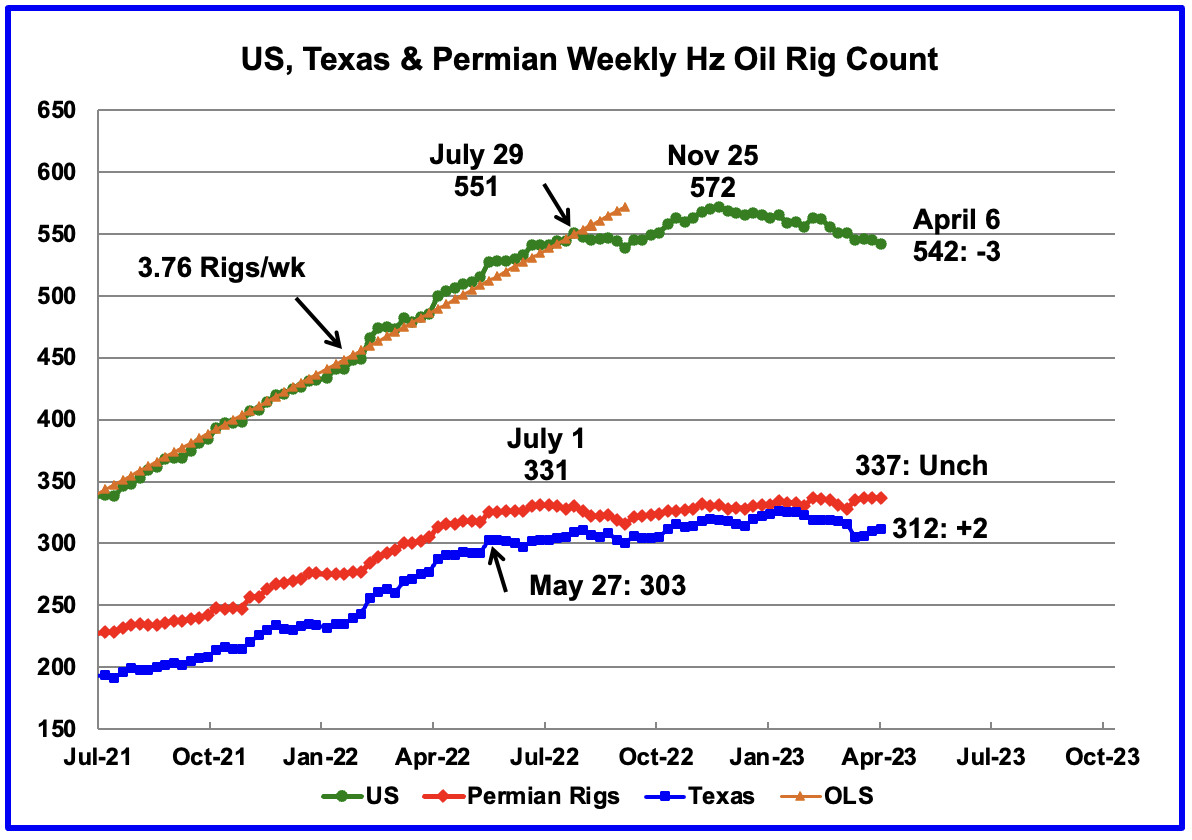
Since the beginning of April 2021 through to the week ending July 29, 2022, the US added horizontal oil rigs at a rate of close to 3.76 rigs/wk, orange OLS line, and peaked at 551 rigs in the week ending July 29. However since then the number of operational rigs has wondered primarily sideways.
A high of 572 rigs was reached in the week ending November 25, 2022. In the week ending April 6, 2023 the number of rigs decreased by 3 to 542 and are down 30 from the recent high of 572.
In the week ending April 6, Permian rigs were unchanged at 337 and Texas rigs increased by 2 to 312. Note that the trend for rigs in the Permian is showing a slow increase from September 2022 and is currently 6 above the high of 331 on July 1, 2022.
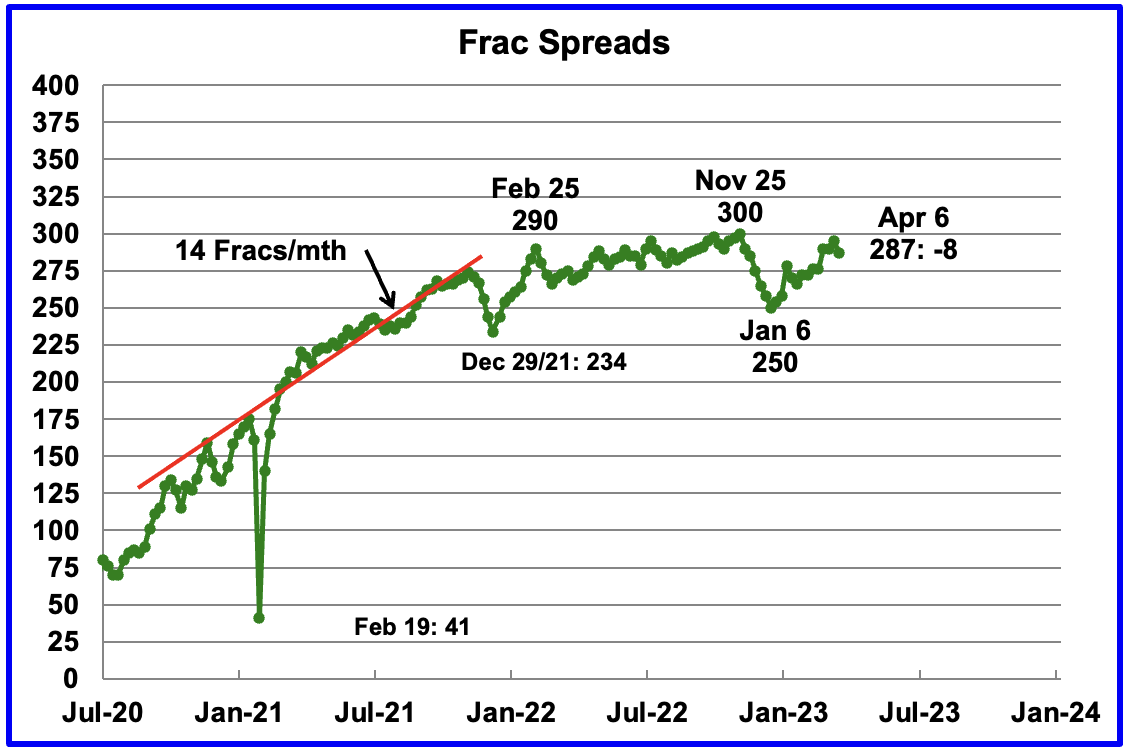
For frac spreads, the general trend since the week of January 6, 2023 can best be described as recovering from the slow down associated with the 2022 Thanksgiving and Christmas holidays. This trend is a repeat of what happened last year. However there is one difference. Last year the recovery took place over 9 weeks while this year it has taken 13 weeks so far. How far above 300 will the Frac count get in 2023.
For the week ending April 6, the Frac count decreased by 8 to 287.
Note that these 287 frac spreads include both gas and oil spreads.
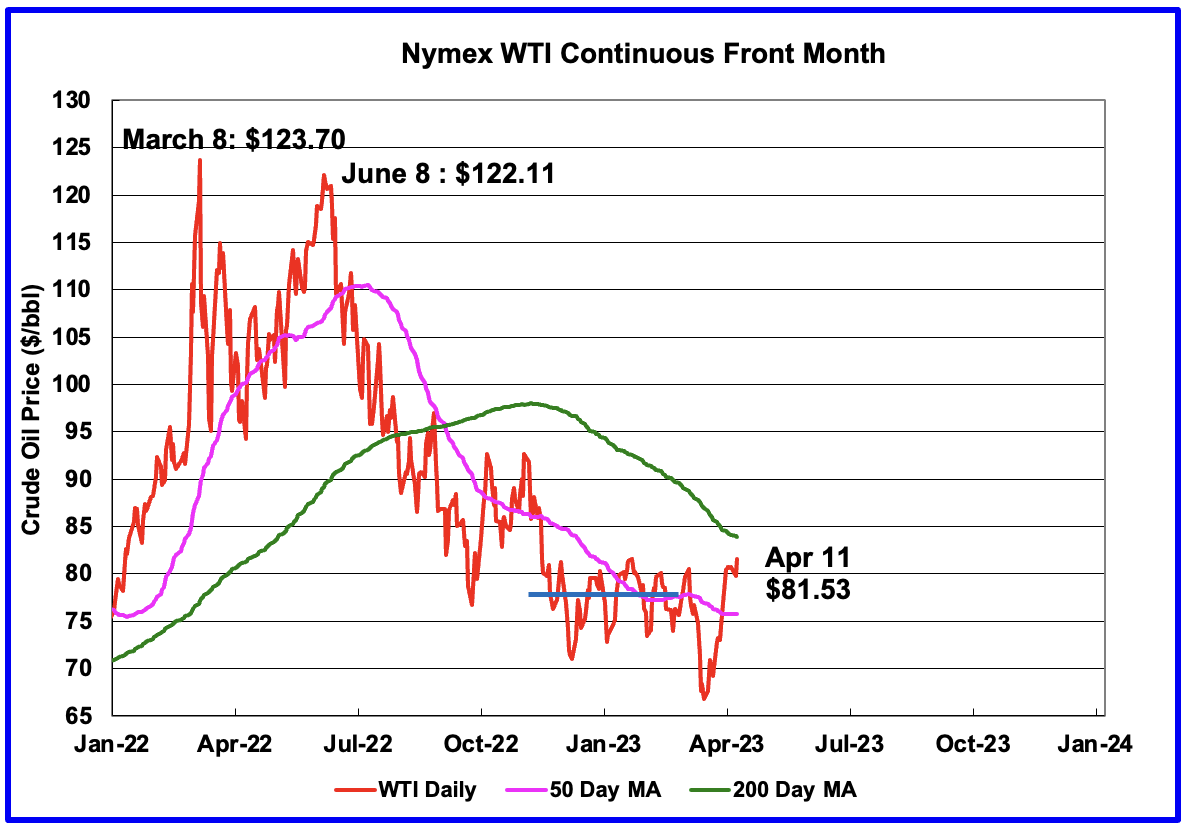
WTI settled at $81.53/b on April 11, 2023, up $1.79/b and 10¢ lower than the recent high of $81.62/b on January 23, 2023. There is a lot of resistance at $81.50/b, six mini tops.
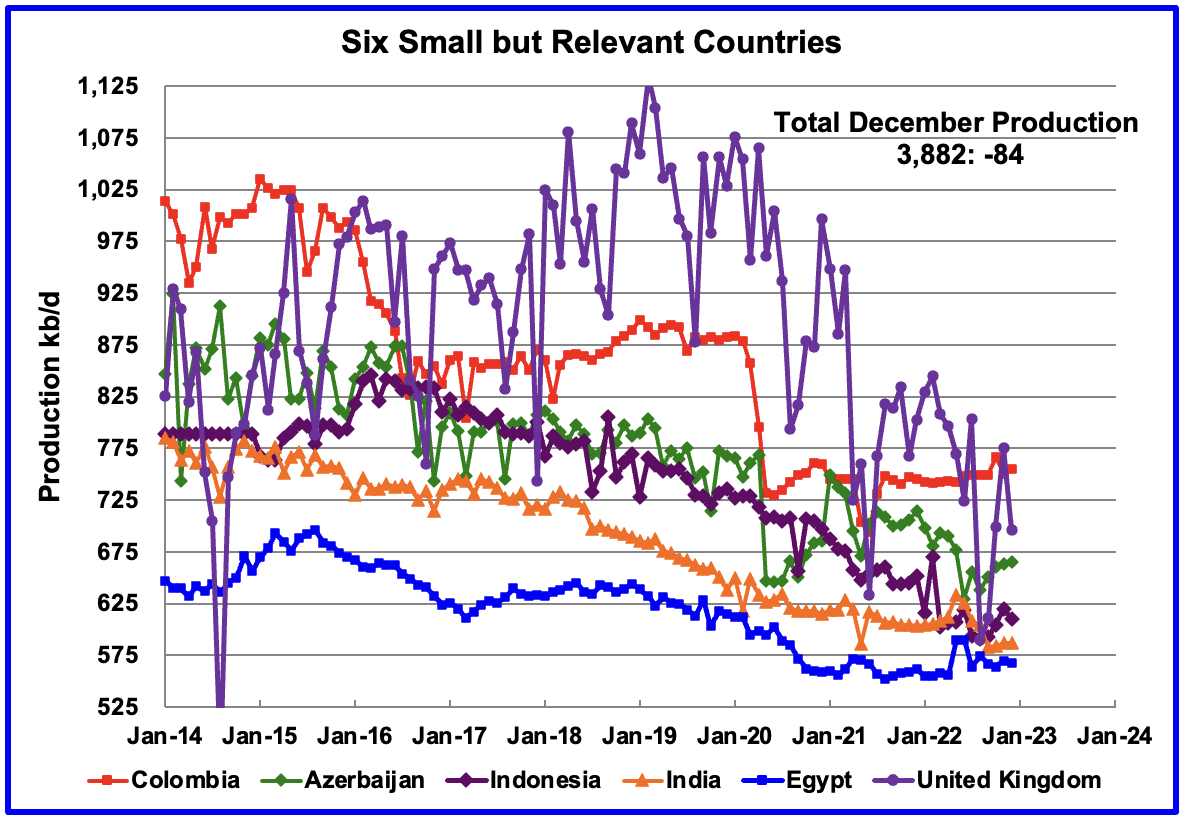
These six countries complete the list of Non-OPEC countries with annual production between 500 kb/d and 1,000 kb/d. Note that the UK has been added to this list since its production has been below 1,000 kb/d since 2020.
Their combined December production was 3,882 kb/d, down 84 kb/d from November. The UK contributed 80 kb/d of the 84 kb/d decrease.
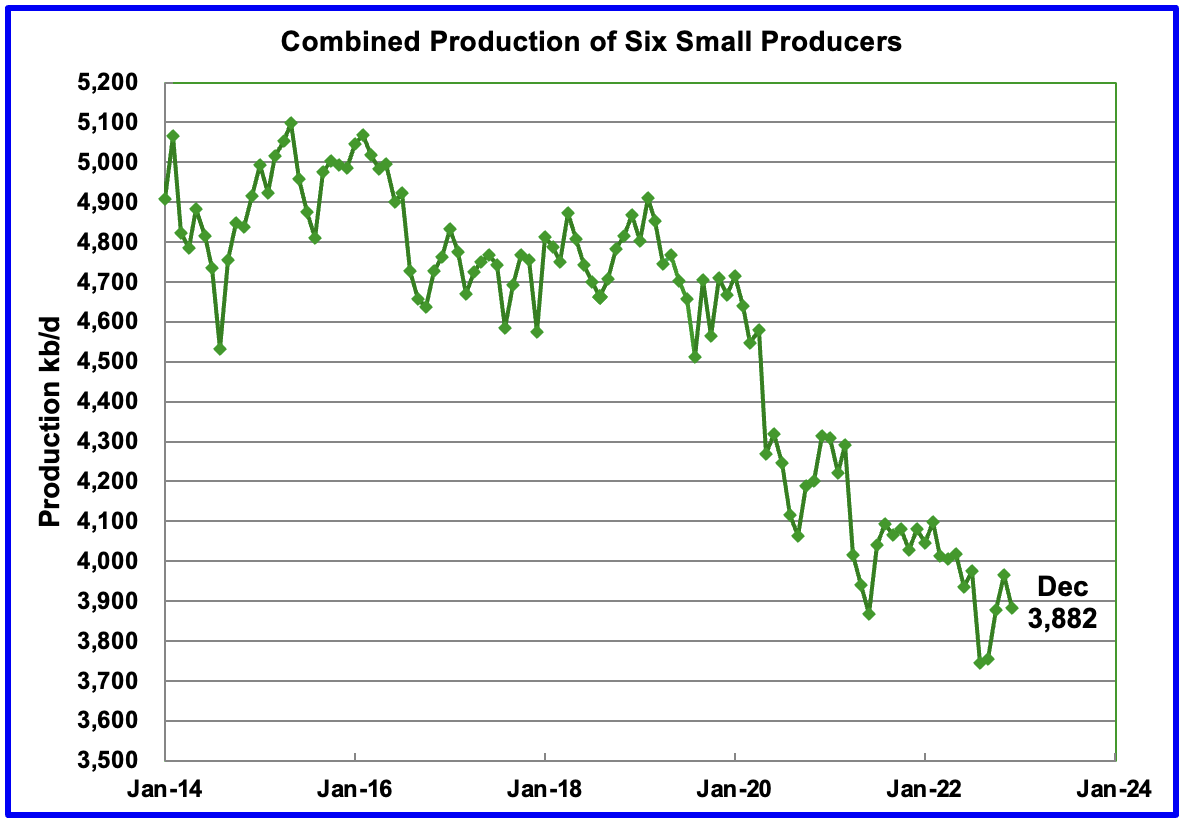
The overall output from the above six countries has been in a slow steady decline since 2014 and appears to have accelerated after 2019.
World Oil Production Ranked by Country
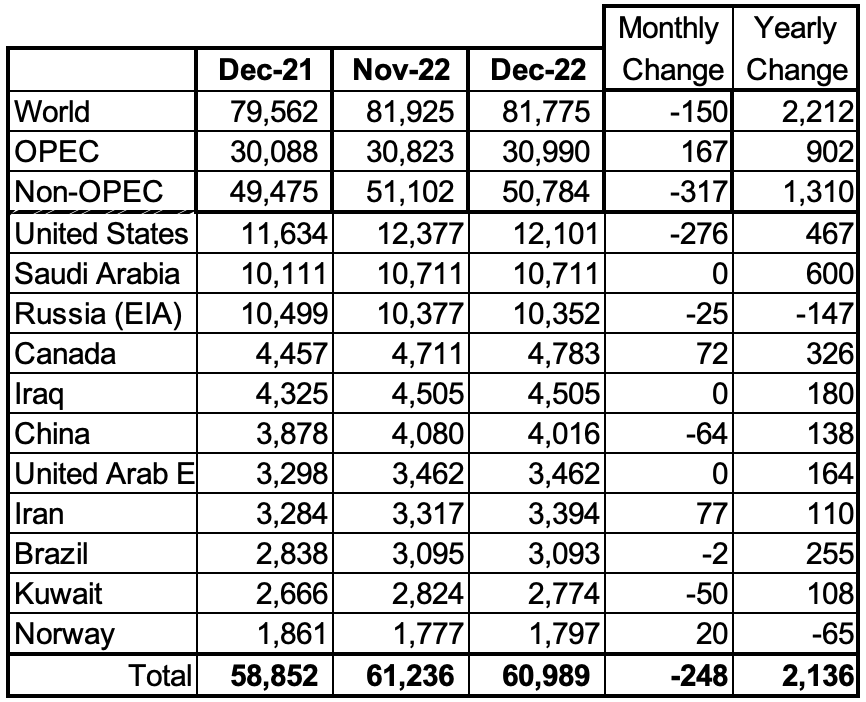
Above are listed the World’s 11th largest oil producers. In December 2022, these 11 countries produced 74.6% of the world’s oil. On a MoM basis, production fell by 248 kb/d while on a YoY basis, production increased by 2,136 kb/d.
World production decreased by 150 kb/d in December. The largest decrease came from the US, 276 kb/d while Canada and Iran added a combined increase of 149 kb/d.
World Oil Production Projection
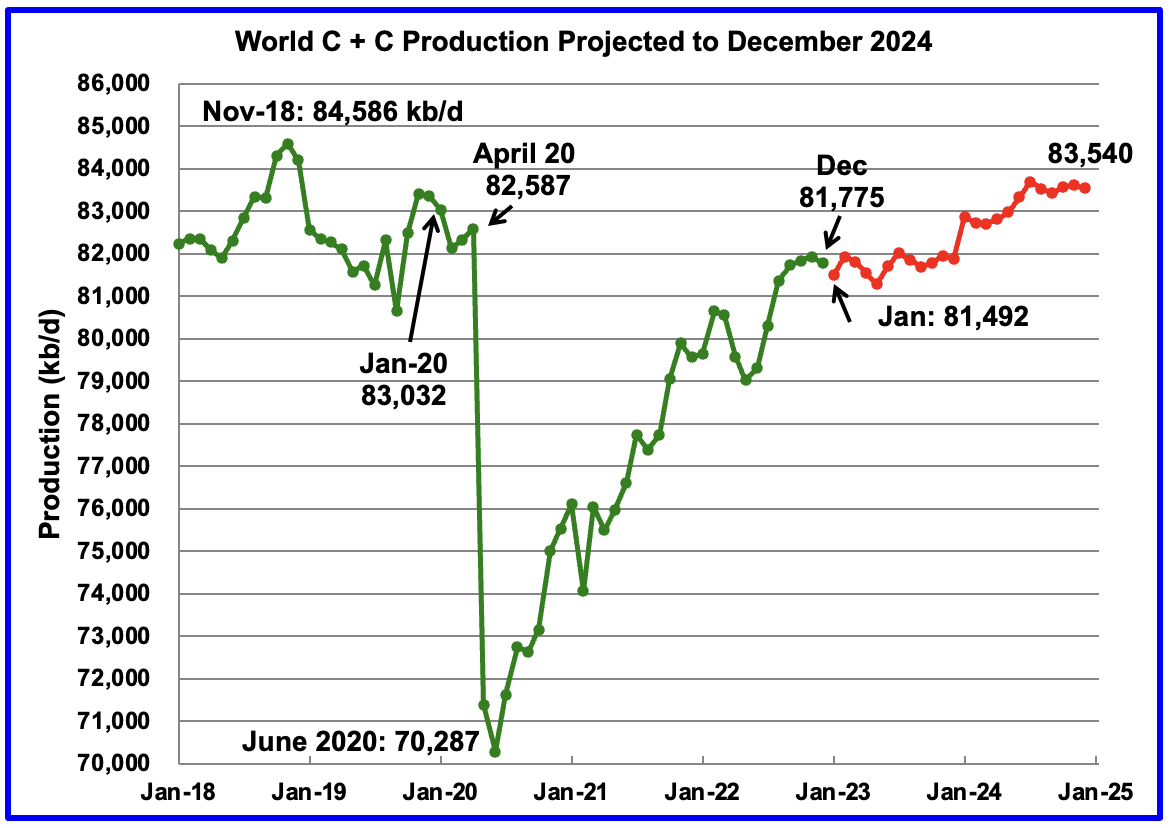
World oil production in December decreased by 150 kb/d to 81,775 kb/d according to the EIA (Green graph). January is expected to drop by an additional 283 kb/d to 81,492 kb/d.
This chart also projects World C + C production out to December 2024. It uses the April 2023 STEO report along with the International Energy Statistics to make the projection. (Red markers).
It projects that World crude production in December 2024 will be 83,540 kb/d. Note that the December 2024 production is 1,046 kb/d lower that the November 2018 high of 84,586 kb/d.
The production increase from January 2023 to December 2024 is 2,048 kb/d.
Note that the production spike between December 2023 and January 2024 is OPEC’s introduction of a production increase of 1,000 kb/d to reverse previous decreases.
I do not think that the latest March cut of 1,000 kb/d has been added to the EIA forecast.
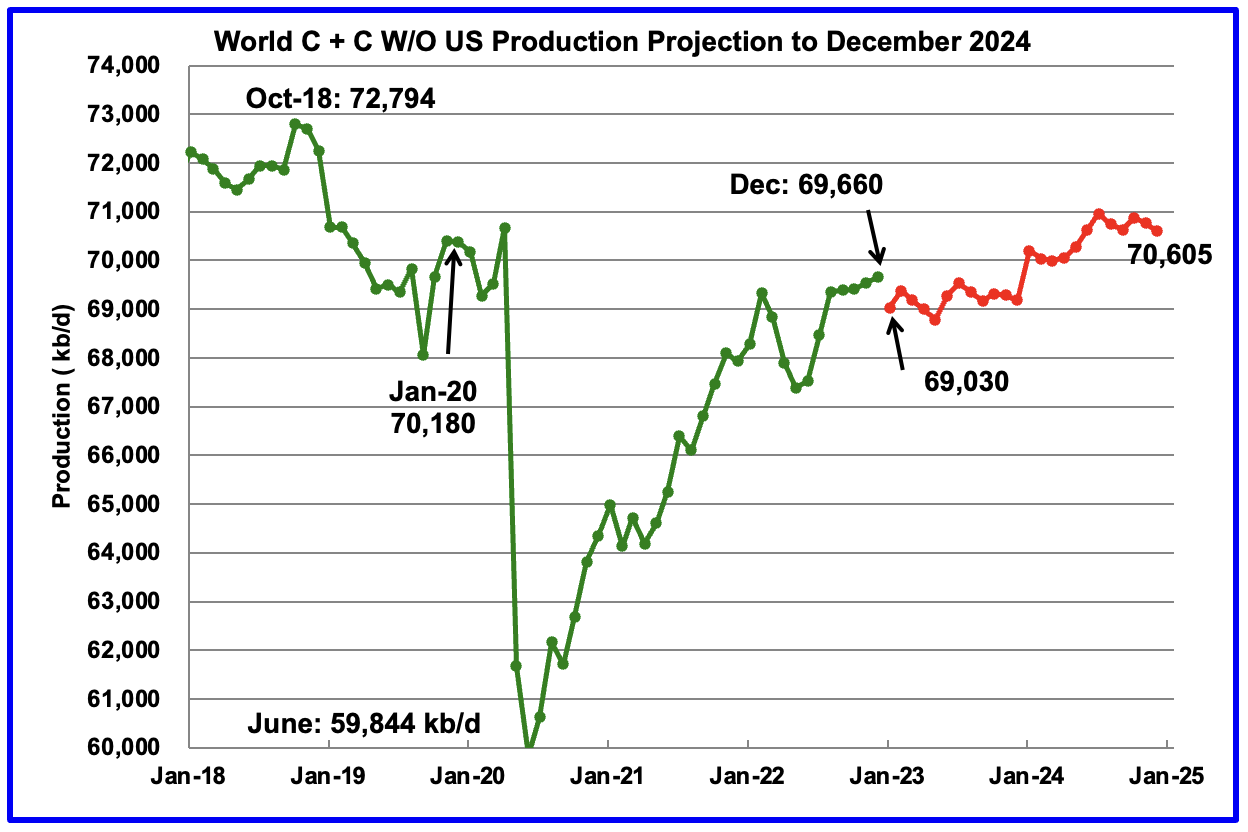
World without the US oil output increased by 115 kb/d to 69,660 kb/d in December.
World oil production W/O the U.S. from December 2022 to December 2024 increases by a total of 945 kb/d. Note the addition of 1,000 kb/d by OPEC in January 2024.
164 responses to “Non-OPEC’s December Oil Production Drops”
Let’s get this party started, Texas has finally come to its senses. This may take a bit of time, but I think I can build a case that NAT GAS WILL BE THE FUEL OF THE FUTURE.
Let’s start here: One final way to illustrate the big picture: “levelized full system costs of electricity”. An analysis from Rice University used ERCOT in Texas to analyze total system cost. The approach assumes that 95% of system load must be met from one of the following: biomass, coal, natural gas combined cycle plants, natural gas combustion turbines, or wind solar storage (allowing for a small amount of dispatchable thermal power). Once adequate capacity to meet demand is determined, the all-in cost of that capacity is computed. Using this approach, wind solar storage systems are ~2x more expensive than natural gas. While this approach has its limitations, it’s a better estimate of the true cost of wind, solar and storage than LCOE.”
https://assets.jpmprivatebank.com/content/dam/jpm-wm-aem/campaign/energy-paper-13/growing-pains-renewable-transition-in-adolescence.pdf
Now we add in this: “Texas suffered a catastrophic power grid collapse during a winter storm in 2019.
In response to the problem caused by the 2019 winter storm, the Texas Legislature proposed a plan to incentivize and finance the development of up to 10,000 MW of gas-fired peaking units.
The state plans to fund the project with $10 billion, which includes zero-interest loans and subsidies for existing gas peakers and reduce the development of wind power.”
https://oilprice.com/Energy/Natural-Gas/Texas-To-Incentivize-Gas-Fired-Peaking-Units.html
I was having a discussion this very weekend on this subject. Why in the hell are we sending LNG to china and at the same time importing solar panels made with slave labor and windmills? Now to be fair, back in the early part of the century before the Barnett was developed with horizontal drilling there was a time that there was a real question where our energy might come from. That question was answered over a decade ago but old bad habits die hard when government gets involved. But it looks like we have a clear winner. At 1/2 the cost of wind and solar, locally sourced, tax base expanded, Texas will be an energy powerhouse, god bless texas.🖖
Texasteatwo,
In 2022 about 2.6% of LNG exports went to China. Are you suggesting we should ban LNG exports or at least limit them? We might find that reduces natural gas prices to a level where new natural gas drilling is no longer profitable and it might reduce the tight oil resource that is profitable to produce as well. Even in Texas the wells won’t be drilled unless there is a reasonable expectation that there will be a profit. I suppose the Texas state government could subsidize the gas peaker plants as proposed in
recent legislation which is in effect an indirect subsidy to natural gas producers. From the Oil Price piece you linked:
All we can conclude is that politicians in Texas have accepted something resembling the early 2021 proposal from Berkshire Hathaway for 10,000 MWs of gas-fired peaking plants operating under a utility-like compensation scheme. Cheap, quick, and dirty may have been an acceptable standard for new electric power generating stations thirty years ago. But the real issue for us is that in a winter peaking electrical grid, the elevated demand lasts all winter (because people are now using more electricity for home and commercial heating)—and not just during the bad storms that spike demand to extreme levels. These new gas peakers can’t run all winter and appear to us to be an expensive, inadequate response to a clear lack of electrical capacity. Instead, it looks more like we’re getting the solutions of yesterday to the problems of tomorrow.
This seems to be a proposal for expensive electricity in Texas at least during winter. On wind power being expensive, Iowa produced 62% of its net generation of electricity in 2022 with Wind Power and its electricity price averaged 9.55 cents per kwh vs 10.32 cents per kwh in Texas, so limiting wind power may be a recipe for higher electricity prices (Texas net generation from wind was 21.7% of the total net generation of electric power).
Over the short to medium term natural gas will be important, but longer term it will be more of a backup fuel as coal and natural gas fired power output is replaced with wind, solar, and batteries, also energy demand will be reduced as ICEVs are replaced with electric transport and as the waste heat from burning fossil fuel is eliminated, there is also the possibility of better built homes that are well sealed and insulated and use passive solar design for heat, heat pumps reducing energy demand, more efficient machines and appliances that use less energy and cradle to grave manufacturing which will consider recycling by design and reduce the need for newly mined materials.
In addition better urban design woud lead to more walking and biking and reduce energy needs for transport and improve the health of the population.
On resources that are scarce, as price rises due to scarcity there will be improved designs that reduce the input of scarce resources in products or eliminate them entirely.
Dennis, No i am not suggesting anything other than nat gas is a superior, cheaper, more abundant and cleaner energy source than solar or wind. I really don’t care if people want to use solar or wind, I actually think there are reasonable and practical reason for doing so. But NOT as a substitute for nat gas when it is so abundant to run an advanced industrial economy that requires the electricity be on 24/7, and affordable. And certainly not forced by the federal government over the choices and decision of states or regional utilities.
Ira Joseph
@ira_joseph
·
5h
“Total’s Pouyanne, in the middle of a Faulknerian sentence run, talks to the bottom line on coal to gas switching, “If we replaced the world’s 9,000 coal plants with gas plants today, we’d achieve the 1.5 goal immediately.” #GlobalEnergySummit”
Texasteatwo,
Natural gas is not cheaper in general, as more is exported it will become quite expensive especially if there is little wind and solar. Also keep in mind there are a lot of methane leaks and that is a powerful greenhouse gas, as demonstated by Iowa, a state can have a lot of wind output, over 62% annually and still have cheap electricity, the key is being interconnected with other areas so that system variability is reduced.
Or a state can choose to go it alone and have lower reliability and higher prices.
Dennis I will only point you to the JPM link in my original post. We can argue forever, for texas and surrounding and states which has abundant nat gas, it is ridiculous to import windmills from china. The powers that be made their decision and the JPM paper back that decision up with facts and figures.
Now and this is not personal, but if you want to lecture someone, look a bit closer to home. My god you folks up in new england still burn oil to generate electric, it’s almost like its still the 1960 up there. Add in those who are charing the electric vehicles using oil generate electricity and it looks to be a bit of a circle jerk.
I think the big point is and I would just leave it here, there are NOT enough resources to build enough windmills and solar panels to run industrial economies. Those cost will rise if you put the pedal to the metal to build it out. So best course of action is to let various states, various counties make the best decision for themselves. I don’t need al gore or john Kerry much less some unelected bureaucrat making the decisions for all. I don’t have time to belabor this point any more.
Texastea,
I used data to back up my point as well, if you like higher electricity cost, go with natural gas. In New England, NG pipeline approvals through New York are being blocked by NY state. In winter there is not enough natural gas supply for heating and electric power so some oil is burned for electric power during winter cold snaps due to lack of natural gas supply, we don’t have facilities for storing large amounts of natural gas. LNG imports are limited due to the Jones act, also out of the control of New England.
Natural gas in 2022 provided 53% of electric power for New England with nuclear the next largest source of power at 26%, wind and solar combined about 7.3% of electric power, hydro and biomass combined about 10.3% (roughly equal shares of 5% each), oil provided 1.6 % of electric power in New England in 2022. The average price of electricity in New England is very expensive at 20.6 cents per kWhr despite very low levels of penetration of wind and solar relative to Texas and Iowa where electricity prices are lower, but net generation from wind and solar are much higher.
Is it Al Gore and Kerry that are directing things in Texas?
see
https://en.wikipedia.org/wiki/Wind_power_in_Texas
The RPS was established by elected officials in Texas.
After years of preparation,[31][32] the Texas Renewable Portfolio Standard was originally created by Senate Bill 7 and signed by Governor Bush in 1999,[33][34][35] which helped Texas eventually become the leading producer of wind powered electricity in the U.S.[36][37][38] The RPS was part of new laws that restructured the electricity industry. The Texas RPS mandated that utility companies jointly create 2000 megawatts (MW) of new renewable energy by 2009 based on their market share.[39] In 2005, Senate Bill 20, increased the state’s RPS requirement to 5,880 MW by 2015, of which, 500 MW must come from non-wind resources. The bill set a goal of 10,000 MW of renewable energy capacity for 2025, which was achieved 15 years early, in 2010.[40]
Not really a lecture, simply another point of view. I read the piece you posted, it didn’t seem correct, so I looked up some data for electricity prices for the largest wind and solar producers. The data suggests high wind penetration for the electric power sector does not result in high electricity prices, the reverse seems to be true.
In any case, wind in Texas was a smart decision by Texans. Maybe other states will be smart enough to follow.
Where does the steel for the casing on oil and gas wells come from? Does Texas have a law forbidding imports from China? That could certainly be written into the RPS (renewable portfolio standard).
Texasteatwo,
Another electricity data point for 2022 is Florida where 192.8 million MWhr of net generation of electric power came from natural gas fired power plants of 258.6 million MWh of total electric power output (74.6% of electric power was from natural gas) and average electricity price was 12.52 cents per kwh in 2022. Compare with Texas at 10.32 cents per kwh for all of 2022 and Iowa at 9.55 cents per kwh for 2022 average electricity price. Iowa had about 6% of electric power from natural gas and 63% of power from wind in 2022 and Texas had 49% of electric power from natural gas, 22% from wind, and 4% of electric power from solar.
Based on these data points this suggests higher electricity rates might be associated with higher natural gas use for electric power.
Data from https://www.eia.gov/electricity/data/browser/
What are your thoughts on exporting US LNG? Good idea? Should they be limited by US government for security reasons?
Note that if the USGS mean estimates for shale gas TRR is correct and US shale gas output continues to grow at recent annual rate of about 5 BCF/d per year, then US output peaks around 2035 at 140 BCF/d and starts to decline in 2040. Natural gas is relatively abundant at present (if USGS mean estimates are correct, many believe these are quite optimistic estimates) but it won’t last indefinitely, plans for alternative forms of energy are wise, along with conservation and perhaps slowing the growth in LNG exports.
“If we replaced the world’s 9,000 coal plants with gas plants today, we’d achieve the 1.5 goal immediately.” #GlobalEnergySummit”
Most coal capacity is in China. They aren’t much interested in importing more natural gas. On the other hand they are expected to install more than 100 GW of solar this year alone.
The utility companies of the nation and world make decisions on electricity energy source and generation with long term horizon. Kind of like the decision to build a new refinery.
Not on a whim and not based on the opinion and preconceptions of armchair cheerleaders.
The regions that will thrive over the next 50 years on energy are those that make good decisions now. Different answers for different regions, depending on their resource mix.
Maybe something we can all agree upon, regardless of partisan affiliation or financial bias-
Energy policy leadership should be based on merit and expertise rather than on loyalty to a specific leader or party, or particular industry affiliation.
Exxon has Natural Gas Production peaking around 2050.
https://corporate.exxonmobil.com/what-we-do/energy-supply/outlook-for-energy/energy-supply#Naturalgas
In 2009, a BP VP said we have about 70 years left of Natural Gas production increases **provided natural gas usage remains the same**.
Can’t find the link to the actual quote.
Short future.
TTT,
Re ‘Natgas is the fuel of the future’ …
In a few weeks, a couple of jackups will leave Ingleside, Texas, and mosey down the coast a bit just offshore Altamira, Mexico.
The modular LNG harware aboard will process ~200 Million cfd from piped US gas.
Company behind this path breaking venture is New Fortress Energy, headed by a VERY colorful, forward looking billionaire named Wes Evans.
Anyone looking to see the practical, Real World applications of natgas use – and the accompanying new LNG hardware – can check out NFE’s operations ranging from southern Baja, the massive Sergipe power plant in Brazil, also supplying LNG to the largest aluminum producer in the country in NE Brazil, several Caribbean nations, and possibly numerous smaller Asian and African countries.
Future is natty.
Coffeeguyzz,
The resource is not unlimited despite claims of unlimited resource, by 2040 US output may have peaked if we continue increasing output at 5 BCF/d annually through 2035. If the US decides not to export the bulk of its energy, then output might grow more slowly.
Dennis,
“The resource is not unlimited …”
Aw contraire, mez amee.
Actually, every single organic entity on the planet – flora and fauna – has the potential to be a methane producer upon demise, if decomposition occurs sans oxygen.
While I am not a particular fan of RNG (Renewable Natural Gas), the technical and operational strides taking place are pretty impressive.
The newly completed, mammoth RNG plant near Scranton – Assai – can annually produce ~4 Billion cubic feet ftom nearby landfills.
Municipal busses are increasingly fueled by natty with growing percentages emanating from RNG supplies which includes captured methane from municipal wastewater treatment plants.
Virtually all garbage trucks run on captured landfill gas at extremely low cost.
So, once again, Dennis, much is going on in the hydrocarbon world that gets little attention as, perhaps, it runs counter to more ‘popular ‘ narratives.
Cummins is potentially pushing the roll out of their paradigm shattering X15N engine to later this calendar year.
If it lives up to its potential, the transportation realm will be forevermore changed.
Gar. Own. Teed.
RNG is not going to get the job done.
How much was produced worldwide?
Now compare to consumption of natural gas, you will find a significant deficit. The resource is not unlimited despite delusional thinking.
If that Cummins NG engine does work out, it has the potential to make diesel supply less essential in the agriculture industry, and other heavy equipment sectors,
at least for the few regions that do have abundant and carefully conserved NG reserves.
I have a post up over on the non-petroleus thread. You can’t miss it, it is the first one posted on the thread. It simply states that it is a myth that renewables will save our ass. I would appreciate you folks reading it and commenting… over there, not here.
Ovi, great post. Thanks.
I wish every country had the same transparency on their oil and gas production and individual fields. One example is Norway where the government has established online fact pages for their production, investments and production of each field (search for norskpetroleum). Meanwhile, it’s very difficult to get reliable, new information about the Ghawar field in KSA or Russian oil and gas fields.
BTW, does anyone have the latest on Russian oil and gas exports? How much is still going to Europe? How much is going to India and China? If I was Putin, I would start building pipelines to China because the EU is probably soon going to ban all Russian oil and gas. Not that I’d trust China, but at least they are less politically sensitive than Europe right now.
Occidental Plans to Suck Carbon From the Air — So It Can Keep Pumping Oil — WSJ
9:44 am ET April 10, 2023 (Dow Jones) Print
By Benoît Morenne
About fifty miles southwest of Midland, Texas, deep in the oil-saturated Permian Basin, more than 100 workers are busy laying out roads and water lines, preparing to build an elaborate complex of fans, each as large as a tennis court.
When they start running in 2024, the fans will suck massive amounts of carbon dioxide out of the air. The carbon will be funneled thousands of feet down deep wells into geological formations, where it should remain for centuries.
The company behind this environmental moonshot is Occidental Petroleum Corp., one of the country’s most successful oil-and-gas producers. It hopes the enterprise will give it license to keep operating as a driller decades into the future.
It is spending more than $1 billion to build the first in a planned fleet of plants using direct-air capture to pull the CO2 out of the air, a budding technology with fuzzy economics. Bolstering the move are generous tax incentives included in the climate package President Biden signed into law last year that cover up to 45% of Occidental’s expected initial costs per metric ton.
Chief executive Vicki Hollub, who has the blessing of the company’s largest investor, Warren Buffett, said the plan will help it reach net-zero emissions on all its operations, its own energy use and its customers’ use of its products, by 2050, and allow it to keep investing in oil extraction.
Ms. Hollub told investors last year she also expects the clean-energy efforts to eventually become more lucrative than the company’s chemical segment, which manufactures basic chemicals and petroleum-derived products such as vinyls, and is the next-biggest revenue generator after oil and gas. OxyChem’s revenue was $6.7 billion in 2022, roughly 19% of Occidental’s revenue that year, according to the company.
Removing CO2 from the atmosphere at this scale has never been done before, and the enterprise comes with abundant commercial and scientific uncertainties. It is unclear what the appetite for carbon removal will be, how much the service will eventually cost or how massive volumes of buried carbon dioxide will affect the subsurface in the long term.
Just three years ago, the company was wobbling, after an expensive and disputed acquisition of Anadarko Petroleum Corp. saddled it with debt right before pandemic lockdowns took a swipe at oil prices. The recovery in prices righted the company’s finances, and the purchase put Occidental in position to capitalize on prized shale assets.
Occidental plans to make money with the CO2 removal plant by selling carbon-dioxide removal credits to companies such as airlines, trucking and marine companies that can’t currently switch to clean energy without breaking their business models. It also plans to turn some of the carbon dioxide into products to sell, including synthetic jet fuel, or use it in the process of pumping what the company calls net-zero oil from its own wells that it hopes to sell at a premium.
The plant’s fans will pull up to 500,000 metric tons of carbon dioxide from the air a year — about as much as 111,000 American cars spew out in a year, according to the Environmental Protection Agency.
The Houston-based company said it wants to build up to 135 such plants by 2035, depending on public incentives and demand for carbon credits. That would be more than seven times the number of CO2-removal facilities currently operating worldwide, according to the International Energy Agency. Occidental has leased more than 400 square miles from Texas to Louisiana to trap CO2 underground, and has presold carbon credits to Airbus SE, Shopify Inc. and BMO Financial Group.
To remove the emitted CO2 from one barrel of combusted oil from the atmosphere
would require what percentage of the energy initially derived from that barrel?
The cost of this process in terms of dollars and in terms of net energy efficiency
will tilt the board heavily in the direction of other energy forms, and conservation of oil,
we will likely find.
Plants not only remove CO2, but cool the planet at absolutely no cost. See (5 minutes) https://www.youtube.com/watch?v=B-oJyInmTTo
Sorry but growing additional plants and stopping their accumulated carbon from cycling in the environment is a very small and slow tool to bring to a big fight.
I could write a chapter on this, but not here.
People who are advocating this as a solution haven’t done their homework or are offering hope without substance.
OPEC+ Oil Production Sees Biggest Drop In 10 Months
In March, OPEC+ producers saw the biggest decline in their collective production in 10 months, as output fell by 680,000 barrels per day (bpd) to 37.64 million bpd, an assessment by Energy Intelligence showed this week.
Russia, which said it was cutting oil production in March, as well as Nigeria accounted for most of the OPEC+ oil production drop. Declines in Russian and Nigerian oil production accounted for 440,000 bpd, or two-thirds, of the March drop in OPEC+ output, according to Energy Intelligence.
In March, oil production from the OPEC+ group fell to levels last seen in May 2022, with the alliance 2.5 million bpd below its targeted collective production quota. That is the largest gap between overall quota and actual production since October last year, per Energy Intelligence’s assessment.
Just after the end of March, several major OPEC+ producers, led by the top producers in the Middle East, announced on April 2 a total of 1.16 million bpd of fresh production cuts between May and December this year. Saudi Arabia, OPEC’s de facto leader and top global crude exporter, will cut 500,000 bpd and said that the move was “a precautionary measure aimed at supporting the stability of the oil market.”
Apart from Saudi Arabia, OPEC heavyweights Iraq, the United Arab Emirates (UAE), and Kuwait, plus OPEC’s Algeria and Gabon, and non-OPEC Oman and Kazakhstan, announced the 1.16 million bpd cut. That’s on top of Russia’s current 500,000 bpd cut which was extended until the end of the year.
From within OPEC, Iraq is set to cut 211,000 bpd of its supply, the UAE – 144,000 bpd, and Kuwait – 128,000 bpd. Added to the Saudi cut of 500,000 bpd, nearly 1 million bpd of supply from the Middle East will disappear from the market as of next month.
By Charles Kennedy for Oilprice.com
Ron
I don’t know how we go about finding out which source is the most reliable. This March production data from all of the different sources, including Russia itself, has been all over the ice. Attached is the Argus production table. Note Nigeria and Russia are totally different than what is quoted in the article. Nigeria is up.
Argus shows that the March drop is just 90 kb/d. That is quite a difference with Energy Intelligence, the original source.
Ovi,
Maybe the EIA international data is best (though also imperfect). The OPEC data from the MOMR is probably pretty good, but the non-OPEC members of the OPEC plus agreements are more difficult to track.
Well, the OPEC Monthly Oil Market Report will be out tomorrow. That will be the final word. We will have to accept it whether we like it or not. The MOMR is often revised but seldom by more than 100 K barrels per day.
Attached is another update from Platts.
Opec crude oil production drops in March as sanctions hit Russian output
– OPEC pumps 60,000 b/d less, non-OPEC output falls 240,000 b/d
– Russian output declines 260,000 b/d as sanctions hit
– Saudi production falls 10,000 b/d to 10.45 million b/d
Crude oil production from OPEC , a coalition of OPEC and other oil producers, fell by 300,000 b/d in March as sanctions hit Russian output, the latest Platts survey by S&P Global Commodity Insights from April 11 found.
OPEC production decreased 60,000 b/d to 28.97 million b/d, while non-OPEC allies saw output fall by 240,000 b/d to 13.40 million b/d in March.
Production in the largest non-OPEC producer in the group, Russia, fell by 260,000 b/d to 9.6 million b/d in March. This followed the introduction of G7 price caps and EU import bans on most Russian crude and oil products from Dec. 5, 2022, and Feb. 5, respectively. The restrictions are part of Western sanctions imposed in response to Russia’s invasion of Ukraine.
A recovery in Kazakhstan’s production partially offset Russia’s significant drop in production on the non-OPEC side.
In contrast, OPEC’s biggest producer, Saudi Arabia, saw production hold relatively steady at 10.45 million b/d in March, down just 10,000 b/d from February. Stronger exports were supported by draws from inventories, while the Jazan refinery ramped up runs, the survey found.
Saudi Arabia is one of the OPEC countries that said April 2 that they will join Russia in introducing voluntary cuts from May until the end of 2023. Saudi Arabia plans to cut 500,000 b/d. Iraq has pledged to cut 211,000 b/d, the UAE 144,000 b/d, Kuwait 128,000 b/d, Kazakhstan 78,000 b/d, Algeria 48,000 b/d, Oman 40,000 b/d and Gabon 8,000 b/d.
The latest voluntary cuts total 1.66 million b/d and add to existing quotas.
Iraq recovery
Overall OPEC production dropped, as seven of its 13 member countries saw production decreases that more than offset increases in output in Iraq. While most of these drops were marginal, Angolan output dropped by 40,000 b/d to 1.91 million b/d as a result of maintenance at the Dalia field.
Iraqi output grew by 60,000 b/d to 4.39 million b/d, the survey found. Production recovered from disruptions linked to pipeline repairs following the major earthquake that hit Turkey and Syria in early February, as well as maintenance at the West Qurna 2 project.
https://www.spglobal.com/commodityinsights/en/market-insights/latest-news/oil/041123-opec-crude-oil-production-drops-in-march-as-sanctions-hit-russian-output-platts-survey
Note that the table below is showing Russian March production was 9.6 Mb/d vs 9.7 kb/d from Argus.
The OPEC proposed cuts don’t kick in until May. So we will not see those show up in the stats until the June MOMR.
Attached is todays inventory balance sheet.
Note how net imports are up by 1,550 kb/d while the crude draw was only down by 1.0 Mb/d.
WTI broke through all of that resistance in the WTI chart shown in the current post above. Looks like a lot of shorts had to cover to make the price increase by $1.73/b to 83.26. The next challenge is to get through the 200 day MA. Next resistance is around $92.50/b.
I am not declaring victory yet with my predictions but certainly like the odds. Lots of data points on the cuts from Russia and Opec beginning to show up as we are only a few weeks away from driving and traveling season here in the US. China did a big stimulus, and I bet the Fed is now on pause. The dollar is holding by a thread to it’s last support, when it breaks I may take a victory lap, surely I will be forgiven for doing so.🖖
Oh I almost forgot and transportation secretary gave a bit more lip service to “refilling” the SPR.
supply/demand vs macro round 69. 69 days into the year and oil has just recaptured TREND – recently $82.93. Very exciting and a win for Texas Two Teas. I don’t make decisions after a single close, but if it can close above this (always slightly changing) number for 3 days straight – I will concede Oil is Bullish.
what’s funny is that part of the reasoning for the number jumping was that cpi was only 5% YoY. So because inflation is going down we are going to bid up oil – thus increasing inflation? Got it. Also note – core prices were up 5.6%. So going to the dentist, getting lawn mowed, and service basically – that’s still pricey. And 5% more than a year ago was AFTER the fed started raising rates. So 8 rate hikes and we are still at 5% inflation. Target is 2% people.
Texas also said there was a head and shoulders pattern on dollar. Go to weekly WTI and you’ll also see a head and shoulders pattern forming.
At the end of the day you have to get the macro right. Oil is bullish because the lack of dollars has eased somewhat. If it was going to last the curves would steepen out in a good way. What we are going to get a a bear steepening. Short term rates falling faster than long term as we head into recession.
The head and shoulders is more clear on the monthly chart. If oil fails to close above the $85 handle by the end of the month. Then it will go lower. Just my 2 cents.
https://www.youtube.com/watch?v=Am1xrwHILgo
This guy agrees with HHH.
Andre the giant,
Note that the money supply fell by 30% during the Great Depression, in the past 11 months the M2 money supply has decreased by 3%, this is unusual, but note that the M2 money supply grew at about a 6% annual rate from Jan 1995 to Dec 2019 and this rate increased to an annual rate of 12% from May 2020 to Dec 2021, so there is a lot of excess money supply in the system. The comparisons to the Great Depression are a bit of hyperbole.
I don’t really believe in technical patterns (head and shoulders, moving-averages) unless its for very short term (1 hour to two days). but the machine recognizes trade (3 weeks) and trend (3 month) breakouts for sure and they are the leaders – I just follow.
Technical Patterns are absurd IMO.
It’s guys who think they can blindly predict the market by looking at graphs and not understanding the underlieing fundamentals of a company or the economy.
Its a get rich quick scam that doesn’t work other than in hindsight.
A guy I know asked me to work on some software with him to predict the stock market based on fundamentals ( an unoriginal idea ).
He was up early and then lost it all.
“based on fundamentals ( an unoriginal idea ).”
I meant technical patterns/analysis.
yea, I see what you are looking at, but I would not bet the farm on it. What is clear is we just made a 4 month high breaking above very strong resistance. Again I am not declaring victory but now you are grasping at straws technically, respectfully. Let’s look back about mid May, we will have some clarity by then.
I do agree we are going into a recession, but OPEC will not be going along for the ride this time, neither is Russia, the rules have changed.
I’ve seen probably thousands of head and shoulders or other patterns fail to play out over the years.
I think the more OPEC does to keep prices higher the more damage is being done to the overall economy. And might just speed up the process of the oncoming recession.
M2 is falling, at least here in US, Europe and U.K.
it’s falling like never before. Real wages have been negative for 23 straight months. Not keeping up with inflation at all.
Banks are pulling back lending big time. They are hoarding dollars and collateral.
If this trend continues which it likely will based on all the information the yield curves are giving us. Debts will be defaulted on in mass. And for those who might not understand I’m not talking about government debt. I’m talking and everything that’s not government debt.
Bankruptcy through the roof which lead to mass layoffs. Commercial real estate that blows up the balance sheets of all the small and mid sized banks.
Can we have a a quiet period of time where oil prices rally during all this? Sure we can. It’s just not going to last.
HHH,
M2 has been falling after rising at a much faster rate than historically over the Jan 2020 to May 2022 period.
See https://fred.stlouisfed.org/series/WM2NS
The rise in velocity of M2 counteracts this so not really a big deal
https://fredblog.stlouisfed.org/2016/04/a-plodding-dollar-the-recent-decrease-in-the-velocity-of-money/?utm_source=series_page&utm_medium=related_content&utm_term=related_resources&utm_campaign=fredblog
From 1960 to 2012 the velocity of M2 stock was typically in the 1.6 to 2.2 range, recently during the pandemic it fell to as low as 1.1 and was still at 1.22 as of 2022Q4 (most recent data point.)
Falling M2 tells us very little.
The inverted yield curves may simply be telling us that the market expects central banks will reverse course and start easing up on rates and that inflation will moderate. Perhaps there will be slower growth and a rise in the default rate (as often occurs during a recession), “massive defaults” sounds very dramatic, but you are likely overstating your case.
Government spent 5 trillion into economy during Covid. Which spurred all sorts of other lending.
So a lot of debt added in short amount of time. When you’re in a debt based economy. And there are fewer dollars to service debts what tends to happen?
HHH,
The fact that M2 velocity dropped like a rock in response to all that government spending suggests much of the money was idle on ledgers and not being loaned out. There is plenty of cash to service the debt, money supply drops by 3% and velocity of money rises by 6% and it’s a wash as far as real GDP goes (if inflation is 3%).
Well IMO that will be the ACTUAL definition of peak oil – not simply peak production. when economic stimulus (zombie economy) has inflation and wages running too hot, and they need to cool the economy down, but oil refuses to follow in the downturn.
so the fed “predicts” recession later this year. too bad we are already IN a recession, so wrong again.
https://www.cbsnews.com/news/federal-reserve-recession-minutes-fomc-bank/
and I know it’s probably “profit taking” or maybe OPEC demand warning – but oil did close below $82.93. Buy the dip anyone?
Twocats,
The CPI uses a very strange method for estimating Shelter cost with recent YOY at about 8%, if you look at national rent inflation YOY it is in the 2 to 3% range by several estimates, this estimate for shelter inflation is about 33% of the weight of total CPI and is giving a poor estimate of inflation, the BLS should fix this and develop a better method for estimating shelter cost so that inflation is not overstated. If we substitute a shelter inflation of 2.5% for the 8% estimated by the BLS, then headline inflation falls to 3.2% YOY. Why would this be positive for the economy? The FED backs off on tightening and the economy has less risk of falling into a recession. Yes the target is 2%, but the FED won’t have its panties in a bunch over 3% inflation particularly when banks ar no longer lending an we are likely to see 2% inflation (if the FED has the sense to look at market rental rates) before long.
Also there is the fact that the Eurodollar futures curve is suggesting the market thinks inflation is transitory and eventually the Central bankers will get the memo.
See this conversation with Jeff Snider where some of the reaoning is laid out clearly from July 2022.
https://www.macrovoices.com/guest-content/list-guest-transcripts/4692-2022-07-07-transcript-of-the-podcast-interview-between-erik-townsend-and-jeff-snider/file
I personally think we will go into a declared recession. So we will end up with stagnation, that has been my base case, and I have not seen anything to change it.
“Yes the target is 2%, but the FED won’t have its panties in a bunch over 3% inflation particularly when banks are no longer lending “. I agree whole heartily , I think they will declare victory even with a 4 handle. They have to give the banks time to heal and inflation will run, not as hot as it was but over the trend going back decades.
how can you be both YES on recession and YES on energy? those two typically don’t get along. unless your call on energy is more of a long term one. but then again, that’s everyone here – you know, a thing we sometimes call peak oil.
too academic for me. I have no control over how they determine inflation, but the baseline is established and that is what I’m using. you don’t have to. i seem to remember you fighting back for like a decade any time anyone brought up Shadowstats saying that inflation was HIGHER than posited. Now you’re saying inflation is LOWER than posited. I refer you to your 3,000 posts disputing your own argument.
Twocats,
Shadowstats is bunk, I stand by that assessment. The lag in the shelter index is well known, that’s why the fed would be smart to substitute a national rental index for shelter costs.
https://www.rent.com/research/average-rent-price-report/
https://www.apartmentadvisor.com/national-rent-report
The second report suggests higher rental increases YOY, but rental rates are lower than in July 2022, so we would expect the YOY rate should fall soon.
See also
https://www.zumper.com/blog/zumper-consumer-price-index/
And consider the CPI Shelter YOY % change which is about 34.4% of the weight of the overaall CPI index. Data in chart from
https://data.bls.gov/timeseries/CUUR0000SAH1
Also see
https://fred.stlouisfed.org/series/CUUR0000SA0L2
Data for CPI all items less shelter for YOY % change, it was 3.44% in March 2023.
Also see
https://www.spglobal.com/marketintelligence/en/news-insights/latest-news-headlines/rising-rents-push-up-us-inflation-data-lag-may-be-clouding-real-price-declines-74319205
Two cats some data points:
“Commodity analysts at Standard Chartered have revealed that their proprietary U.S. oil data bull-bear index climbed a sizzling 29.1 in the latest week to hit an ultra-bullish +98.4. According to the experts, this marks the second-strongest reading on record for the decade-old index and the second consecutive ultra-bullish reading. Inventories fell against the five-year average in all categories apart from jet fuel, with large draws against the average in crude oil (7.08 million barrels of which 3.21 million barrels was at Cushing), gasoline (6.04 million barrels ) and distillates (3.88 million barrels). Gasoline inventories have become particularly tight, currently hovering around an eight-year low for March.”
https://oilprice.com/Energy/Oil-Prices/What-Could-Go-Wrong-With-Chinese-Oil-Demand-Forecasts.html
“China’s crude oil imports hit the highest levels in nearly three years in March, surging by 22.5% year-over-year.
China imported 12.3 million barrels per day in March 2023 compared to just 10.1 million barrels per day a year earlier.
Refiners in China have ramped up refinery runs in recent weeks, preparing for a rise in consumption as the country’s economy recovers.”
https://oilprice.com/Energy/Energy-General/Chinas-Crude-Oil-Imports-Soar-To-Highest-Level-In-Nearly-3-Years.html
I always try to follow the underlying data points to take out the emotional aspect to making any forecast or investment regarding same. Right now it’s hard to paint a negative view on oil prices over the next several months. We now live in a much more volatile world so I will keep the caveat of any extraneous event blowing up my thesis, but I have not change my views.
The dollar broke below support and a clearly defined head and shoulder pattern going back a year to April 22.
https://www.investing.com/currencies/us-dollar-index-advanced-chart
Gold is only <1% from an all time high in US dollars. So far things are going my way, a weekly close for the dollar, gold and oil at or very near current levels leaves the trends intact. Best go get a pair of bell bottom pants and some tie died t-shirts, we are going to re-live the 1970's✌️
How about them producer prices in Europe’s largest economy Germany. Falling from 8.9% to just 2% in just one month.
Don’t sound very inflationary for global economy when a major exporter of goods is seeing price disinflation at the producer level.
I’m sure it just must be a one-off thing and prices rebound and accelerate in next months data.
But then again maybe just maybe the global economy is cooling rapidly.
Germany’s yield curve has been screaming deflation but let’s not look at that or any of the other yield curves.
Part of the reason the dollar has fallen is due to debt ceiling not being raised yet. Treasury isn’t able to issue as much debt so it’s not sucking up dollars from economy but spending still continues. This has an easing affect as liquidity is being pumped in by treasury but not taken out via debt sales. Only a temporary thing that gets resolved when ceiling is raised.
TexasTea – you are looking almost completely at basic supply/demand fundamentals. you are ignoring a vast array of data points literally too numerous to mention on the slowing overall economic situation that does not support your meager data points. and your data points?
standard chartered appears to be talking their book. and in that very article you had to scroll past entire paragraphs talking about slumping industrial metal markets. money is flooding to any lifeboat it can so energy and tech are catching bids.
china oil imports are up after being flat for three years. color me unimpressed.
now I will admit that chinese consumer demand and local economic activity is strong. but I don’t think oil will be the biggest beneficiary there, more like chinese internet companies or gaming on monaco.
we can stop arguing. only reality will resolve this disagreement. you say dollar broke support, I say oil failed at trend. we are both seeing what we want to see. I’ll say for like the fourth time, if oil can’t close above $82.93 for a couple days, I’m not “buying” it. If it does, I’ll cover my shorts and admit you were right.
commodities as a complex has been no bueno since June 2022
https://www.reuters.com/markets/quote/.TRCCRB/
Twocats, well I suppose PRICE is a meager data point. I don’t disagree that the US economy is slowing and as I said before I expect it to enter a defined and government acknowledged recession. And with all respect, the issues that are too numerous to mention have not showed up in the “basic supply/demands fundamentals”. unless and until they do you and HHH will be wrong.
There are always two side of every trade. I fully understand cyclicality of the business, I am saying the old play book has been thrown out by the Russian and OPEC actions. They are now working together in their common interest and have the market share and pricing power to enforce it. If you have a “rare commodity” do you sell more for less or less for more? If oil prices stay firm into mid May when driving season will be ramping up and we still see signs that demand and supply continues to tighten we are going to the low $90’s. See you there😎
“U.S. gasoline inventories fell by 300,000 barrels, according to the latest Energy Information Administration (EIA) report, to a total of 222.2 million barrels. This is 4.7% down compared to a year ago, and 7% below the five-year average for this time of year.
Meanwhile, gasoline supplied to the market (implied demand) clocked in at 8.94 million bpd for the week—a figure that is 360,000 bpd lower than the week prior. So far this year, however, implied gasoline demand is higher than the same time last year.”
Darn those meager data points showing that gasoline DEMAND IS HIGHER THAN AT THIS TIME LAST YEAR.
https://oilprice.com/Latest-Energy-News/World-News/US-Gasoline-Just-Waiting-For-The-Next-Price-Hike-Catalyst.html
The value of sales at gasoline stations slid 5.5% in March. Which is the most since April 2020. Which was the beginning of lockdowns.
Texas needs a quick rebound otherwise his demand theory is going to be a little off.
I see you’ve commented below. Nothing to say about this little data point?
I’m just going to take a wild guess that you had no idea about that data point.
HHH, I actually was aware of that data point. IT reinforces my thesis, invest in must haves and not want to have. It also reinforces that the consumer is trading down, is tightening their belt, is hunkering down etc. As to your point on the $ breakdown from a head and shoulder pattern is a figure of my imagination some commentary.
Big bear markets and big bull markets are “OFTEN” are signaled when that pattern is broke either up or done. I don’t trade and I make reasonably large bets, with very little diversification and usually hold for a year or much more. I play trends that can go on for years. The energy stocks I bought in 2020 I still own, I have added to, I have trimmed and increased positions. Upstream always moves first and then mid stream so I have now overweighted midstream where I was over weighted upstream.
As to the $
Expect U.S, dollar to be in a multi-year bear market, says Rockefeller’s Ruchir Sharma
BofA Chief Strategist Calls For A 20% US Dollar Selloff, Turns Bullish On Gold And The Euro
https://www.morganstanley.com/ideas/dollar-bear-market
So others are seeing what I AM SEEING. DOES NOT MEAN I AM RIGHT BUT I SLEEPING VERY WELL AT NIGHT 😎
commentary on oil prices and recessions from peter bookvar
https://www.youtube.com/watch?v=jhfB7qpGbpw
Dollar has been in a bull market since 2008. It’s had a few pullbacks but has always gone higher.
It’s having a pullback right now. But will go higher. Dollars demise doesn’t come through weakness. It will come through being too strong.
When dollar is weak it because everyone is double down and borrowing more dollars. Dollar becomes weak when the worlds economy is growing and doing well.
Dollar becomes strong when economy is not doing well and dollars are being hoarded and collateral is being hoarded.
And dollars aren’t being loaned to buy everything.
Dollars all time low was when Eurodollar system was at its peak pumping out dollars before 2008.
The Euro is up because dollars are flowing because it wasn’t the worst case scenario this winter and they didn’t freeze to death.
China’s currency should be off to the races against the dollar as they reopened and dollars started flowing again.
Eurodollar tide is going out. And it doesn’t matter what the FED does or if the US government spends trillions. They are dwarfed by Eurodollar market.
US government can spend $5 trillion into economy but if Eurodollar market contracts by $10 trillion we have a big problem. And here is the thing. They don’t know how big the hole is. They don’t know how big the dollar storage is.
Those shorting the dollar are going to get squeezed out of their positions. Violently!
When oil is paid for physical dollars aren’t put on a pallet and shipped to Saudi Arabia or whoever. A Eurodollar entry is made on the balance sheet of a bank in Saudi Aramco’s name and they are credited in Eurodollars.
They are free to use that credit in global markets as they see fit.
Saudi’s wealth is quite literally digits on the computer screen at a bank.
Australia increased its jet fuel imports from China
Australian jet fuel imports from China surge in 4 months to January 2023
http://crudeoilpeak.info/australian-jet-fuel-imports-from-china-surge-in-4-months-to-january-2023
Interesting article on cleaning up abandoned wells:
https://wapo.st/41qjMru
“Last year, researchers at EDF and McGill University published an analysis of more than 120,000 documented orphan wells in 30 states. Using census data, it detailed how 14 million people live within a mile of an orphan well, including 1.3 million adults with asthma.
According to the analysis, Ohio had the highest number of orphan wells on its books, at more than 20,000, followed closely by Pennsylvania. But state officials and the researchers behind that work acknowledge that such numbers only begin to capture how many actually exist.
“We really only know where a fraction of them are,” Peltz said.”
rgds
WP
If any of you caught the interview with Warren Buffet from Japan he made two points that I have been making, one he validated he is in oil because he knows it will be used for a long time, and two, he personally made the decision to sell Taiwan Semi because he fears a china interferences into Taiwan. So there you have it.
One more data point from a goober who I don’t care for but it is note worthy if only for the change in sentiment regarding oil:
https://www.foxbusiness.com/media/shark-tank-kevin-oleary-build-new-us-oil-refinery-america
US-Saudi Oil Pact Breaking Down as Russia Grabs Upper Hand
(Bloomberg) — Just three years ago, when OPEC+ oil giants fell out, the US found itself playing the role of peacemaker. Now it looks more like their target.
The Saudi-Russia oil alliance has the potential to cause all kinds of trouble for the US economy — and even for President Joe Biden’s re-election campaign. This month’s OPEC+ decision to cut crude output, for the second time since Biden flew to Saudi Arabia last summer seeking an increase, may be just the start.
That April 2 announcement, which lifted oil prices by about $5 a barrel, already means recession risks are bigger than they otherwise would have been — because consumers spending more on energy will have less cash left for other stuff — and inflation will be higher. Russian President Vladimir Putin, meanwhile, gets a bigger war-chest to fund his attack on Ukraine.
But more significant is what the OPEC+ move says about the likely path of oil prices over the coming years.
In a world of shifting geopolitical alliances, Saudi Arabia is breaking away from Washington’s orbit. The Saudis set oil production levels in coordination with Russia. When they wanted to ease tensions with regional rival Iran, they turned to China to broker a deal — with the US left out of the loop. Western influence over the oil cartel, in other words, is at its lowest point in decades.
Saudi Arabia’s sovereign wealth fund aims to spend $40 billion a year on the domestic economy — including the construction of Neom, a futuristic city in the desert with an estimated price-tag of $500 billion — on top of outside investments. Those figures don’t show up in the budget. To meet all these goals, the kingdom needs an oil price closer to $100.
Saudi Arabia’s sovereign wealth fund aims to spend $40 billion a year on the domestic economy — including the construction of Neom, a futuristic city in the desert with an estimated price-tag of $500 billion — on top of outside investments. Those figures don’t show up in the budget. To meet all these goals, the kingdom needs an oil price closer to $100.
it is quite a long article and shows potential for troubles ahead. I think it also says that we will see $100/b oil before we see $25/b
https://www.bnnbloomberg.ca/us-saudi-oil-pact-breaking-down-as-russia-grabs-upper-hand-1.1907040
The big reason why the U.S. is seeking the toughest-ever rules for vehicle emissions
The new standards are so strict that, according to the EPA’s estimates, up to 67% of new vehicles sold in 2032 may have to be electric in order for carmakers to be in compliance.
Note this is a proposed rule which will be open to public comment from car companies and all others. It may look different when finalized.
A question to ask here is, ls this rule really designed to reduce CO2 only, or are these regulators aware of PO and see this rule as addressing both issues without letting the cat out of the bag?
https://www.npr.org/2023/04/12/1169269936/electric-vehicles-emission-standards-tailpipes-fuel-economy
A post on the blog of Art Berman ,
https://www.artberman.com/2023/04/08/opec-in-control-and-other-dumb-memes/
OPEC is going to be selling less oil at a lower price. What they going to do then? Cut more? Or open taps?
Eurodollar tide continues going out. You find OPEC is like Credit Suisse. Swimming naked.
Again, none of the central banks are central to global monetary system. Eurodollar banks are central. Quality collateral is central to monetary system.
$100 trillion dollars worth of USD denominated debt globally that requires USD to service. Dollar is in extremely high demand.
Dealer banks like Credit Suisse are collateral constrained right now. As they pullback on their interbank lending more banks will be in the news.
I hate to say a repeat of 2008 because it will never manifest exactly the same but this is going to be like 2008.
There is about $1.5 trillion in commercial real estate loans in US that need to get rolled over over next year and a half. So they go from having a 3% loan to what? 7% maybe.
Something like 95% of theses loans are on the balance sheets of the small and mid size banks.
Which banks will be making the loans to roll these loans over?
And do the borrowers have the collateral that they will need?
HHH, you say, “OPEC is going to be selling less oil at a lower price. What they going to do then? Cut more? Or open taps?”
IEA raises 2023 global oil demand estimates as China reopens its economy
World oil demand will climb to a record 101.9 million barrels per day, the agency says”
https://www.thenationalnews.com/business/energy/2023/04/14/iea-raises-2023-global-oil-demand-estimates-as-china-reopens-its-economy/
“The International Energy Agency has raised its 2023 global oil demand estimates as top crude importer China reopens its economy after about three years of adhering to a strict zero-Covid policy.
Global oil demand will rise by two million barrels per day to a record 101.9 million bpd this year, the Paris-based agency said on Friday.”
maybe they sell more oil for more money?
China has been reopened for 3-4 months. Them constantly cutting the RRR isn’t a sign of economic strength.
China is cutting rates because economically things there continue going downhill.
Eurodollar tide goes out on China more so than anywhere else.
HHH keep that chin up here is one more.
IEA Says OPEC Cuts Could Derail Economic Growth
By Tsvetana Paraskova – Apr 14, 2023, 6:26 AM CDT
In its Oil Market Report, the IEA said that the latest OPEC cuts could exacerbate the oil supply deficit and push oil prices higher.
The rise in oil prices will add pressure on consumers, especially in emerging and developing economies, hurting the global economic recovery.
The IEA also noted that growth in the U.S. shale patch is limited by supply chain bottlenecks and higher costs.
https://oilprice.com/Energy/Energy-General/IEA-Says-OPEC-Cuts-Could-Derail-Economic-Growth.html
So basically there is a bit of panic as this time low oil prices will(may) not be there to pull the collective chestnuts out of the fire when things turn south. Can’t say that I blame them, why would anybody follow US down the tubes.
And
https://www.worldoil.com/news/2023/4/13/opec-production-cuts-to-cause-hefty-supply-deficit-to-global-market/
“But in the second half of the year, world markets stand to tighten considerably. OPEC already expected a supply deficit to emerge over the summer, and the newly unveiled cuts will make the shortfall even more pronounced.”
I am now wondering if the calculous is to PREVENT the US from ever refilling the SPR🤔
Dollar index has entered an extremely strong support zone between 101.50 and 100.00
Head and shoulders is just your imagination. 🤣
US car sales as a function of oil price
They go a little bit up, but faster than i expected. I see four possible reasons:
1. Subsidies for EVs in USA and worldwide
2. WTI is cheaper than Brent, so my Brent based price in BOE is to high for the USA
3. the downturn in mid 2022 was hefty and is compensated now
4, the SPR release has reduced gasoline prices
How much the effect of each reason is, i can’t determine.
According to the April OPEC MOMR
Russia’s liquids production in February increased m-o-m by 175 tb/d to average 11.4 mb/d. This includes 10.0 mb/d of crude oil and 1.4 mb/d of NGLs and condensate.
Russian liquids output in 2022 is estimated to have increased y-o-y by 0.2 mb/d to average 11.0 mb/d. This is broadly unchanged from the previous month’s assessment.
For 2023, Russian liquids production is forecast to drop by 0.75 mb/d to average 10.3 mb/d. It is worth noting that this expected contraction accounts for the recently announced additional voluntary production adjustments to the end of 2023. Annual growth is remained unchanged from the previous monthly assessment. In addition to a number of planned start-ups this year by Lukoil, Gazprom, Novatek, Sigma Energy and others.
Sounds like no cutbacks. All typical Russian disinformation to get the oil price to increase.
The OPEC MOMR has changed its prediction for the Russian 1st quarter 2023 oil production numbers. But they are predicting the last three quarters of 2023 to be over 1 million barrels per day below the 1st quarter as well as below the 4th quarter of 2022.
OVI, its behind paywall but you get the headline from april 11
https://www.bloomberg.com/news/articles/2023-04-11/russia-s-diving-oil-exports-suggest-output-cut-beginning-to-bite#xj4y7vzkg
and
“Bloomberg: Russia has reduced its crude oil production by 700,000 bpd in March.
Russia warned in February that it would cut crude oil production by 500,000 bpd.
Russia said its crude oil and fuel exports had been completely redirected as of late March.”
https://oilprice.com/Energy/Crude-Oil/Russia-Cuts-More-Oil-Production-Than-Anticipated.html
TexasTeaTwo
I was just trying to resolve the 700 kb/d production cut with OPEC’s statement which said Russian crude production was up at 10 Mb/d while all of the other experts were quoting 9.6 to 9.7 Mb/d.
“Russia’s liquids production in February increased m-o-m by 175 tb/d to average 11.4 mb/d. This includes 10.0 mb/d of crude oil and 1.4 mb/d of NGLs and condensate.
This is an open link to your article. Note this link is bnnbloomberg.com, the Cdn bloomberg site.
https://www.bnnbloomberg.ca/russia-s-diving-oil-exports-suggest-output-cut-beginning-to-bite-1.1906241
Oh my every morning these days the green heads explode, as energy reality “TRUMPS” energy fiction.
https://oilprice.com/Latest-Energy-News/World-News/Biden-Approves-Exports-From-Planned-Alaska-LNG-Project.html
That’s 2 big energy projects and one huge lease sale in less than two months. The times they are a changing. Broken promises everywhere, I suppose now that the dems have the transgender community in the bag they can afford to kick the greens in the nuts a few times🖖
Why are you such an asshole?
Layman certainly a question for the ages. But truth be told I enjoy saying I told you so to folks, that if they had their way would drive the US economy into a ditch, drive me and my fellow coworkers into unemployment line. I don’t know what the actual number of “green extremist” is but they are now losing the debate, as reasonable people have taken over the argument. American voters are not going to give up their way of life while at the same time watch the rich elite and foreign competitors flying, driving, and yachting around. I am not sure why this is a surprise to anyone.
I have had another thought, IF windmilsl are so good, and so cheap why does china build coal fired plants and send us the windmills. Seems like an odd thing to do if they are as advertised. Perhaps the Chinese want a fully functioning industrial economy, like ours. 🖖
Just to keep a semblance of reality in the discussion,
China does export some of their wind turbine production,
but their domestic wind energy generating capacity is far and away the largest in the world, and the margin of wining that race has been increasing over recent years.
Solar too. Coal too.
https://www.reuters.com/business/energy/china-track-hit-new-clean-dirty-power-records-2022-maguire-2022-11-23/
Yes they are setting all kinds of records. I did read that china has approximately 16% of their energy needs supplied by intermittent wind energy, that is about as high as it can get and keep the grid stable, so my assumption is that they need all the coal plants to back up their green energy, but I am no expert on china energy policy.
But to be fair, if someone holds out china as some great example you can’t get past the fact they are and will be using records amounts of coal year after year for as long as one can predict out into the future. IN other words they will use all viable and avaible resources with out respect to any potential climate impacts.
Nice to have a voice of reason in the room.
Texas tea two,
No doubt that wind energy percentage could go higher in China, along with solar. China’s CO2 emissions per capita have risen very fast, but remain about half of the level of the US.
TTT
“that is about as high as it can get and keep the grid stable, so my assumption”
Yes, you make lots of ill-informed assumptions, which serve as one of forms of basis of your tightly held fallacies.
In Iowa, as an example, they have over 60% of electricity from wind.
Its more of a data point to consider, rather than a biased assumption.
Texasteatwo,
China’s power output for wind and solar have been growing at about 25% per year from 2011 to 2021 while total electric power output has been growing at 5.7% per year over the 2011-2021 period. If those rates of growth continue, all Chinese electric power output would be from wind and solar by 2034.
Dennis and Hickory, the debate we are having here in Texas is how do we back up the huge wind energy deployed during extreme weather events. Since we do have extreme weather events here and a ever growing population and I think we have the largest wind energy development in the nation, it has become clear to policy makers that we did not have the needed back up when it was needed most. I actually lost one of my close business partners to hyperthermia as we had so much snow and it was so cold and we had no electricity for 5 days here at my house, so the debate hits close to home. I don’t care what the talking point are for either side. It is clear intermittent energy needs to be back up by something. It looks like Texas is going to back it up with standby nat gas plants if the Texas house passes the senate bill, it will be signed. The plan calls for the wind industry to split the cost and to level the playing field so the “true cost” of wind energy will no longer subsidized. Again you both can have your views, and you can argue the minutia but that looks like the way Texas is going, and I think for the better.
Texastea,
Yes for a grid that is not interconnected with other grids, backup is more important, batteries would be a far cheaper option than natural gas peaker plants. I think the problem with that winter storm was in part poor preparation by the natural gas industry which could not supply gas to the peaker plants due to freezeups. In any case more backup is needed when a grid lacks interconnection with other grids as is the case for Ercot.
Texasteatwo,
See link below for what happened in Texas during that winter storm
https://www.pbs.org/wgbh/nova/article/texas-winter-storm-uri/
TTT “here in Texas is how do we back up the huge wind energy?”
Glad to see you getting real with the discussion, acknowledging that wind energy potential in many places like Texas is huge.
And yes the variability does require different thinking and planning than, for example,
a nuclear plant which if built and is running at its best has a capacity factor of about 90%, and hopefully has few unexpected failure times.
Most places have mixed source grids and it is a juggling act to make it all work.
Baked in the cake.
It is inconvenient for us humans that we don’t have 100% cheap no fail energy constantly and indefinitely, but this is earth.
Texas tea two,
Most of the windmills in Texas are made by Siemans, GE, and Mitsubishi, not clea how many ar manufactured in China, do you have some data on this or are you just making shit up? China does produce and export a lot of solar PV.
The report below covers US imports of Wind power, some from China but most imports from Europe and about 75% (by value) was domestically produced( 69% by power capacity). See figure 7.
https://www.usitc.gov/publications/332/working_papers/id-078_wind_turbine_production_and_trade_011422-compliant.pdf
Yes China uses a lot of coal which will be more expensive than wind and solar as coal depletes, the coal will likely be replaced by cheaper forms of energy such as solar and wind.
Dennis really you get your news from PBS…..come on man😉 We lived it I don’t need it explained to me. I hate to beat a dead horse here, but we are going to back up the existing wind energy with nat gas, (rather than oil like them yankees prefer) and we are going to diminish the over all scale of wind energy in Texas as a by product. in time the existing windmills will become obsolete and useless as they will be no longer be subsidized and the true cost will be to expensive to replace them. Let’s come back to this in a decade or two. When the bill passes I will update.
Texas tea,
Yes I get my news from an objective source, I prefer news rather than opinion.
New England is limited on natural gas supply, pipelines are blocked by New York State so no supply from Marcellus, oil burned in 2022 for electric power amounted to 1.6% of the total electricity produced in 2022.
We will see what happens to prices in Texas with less wind power, it is likely they will go up to 13 cents per kWh similar to Florida (which has a higher percentage of power provided by natural gas than Texas currently). Less wind is likely to increase electricity prices in Texas, the solution for winter storms is better reliability at coal and natural gas power plants in freezing conditions which is what caused the problems in Texas.
TTT , beat you to it . Here is the news , the bill is already passed .
https://www.wsj.com/articles/texas-gas-power-subsidies-energy-wind-power-senate-dan-patrick-republicans-ae6d2367
Disclaimer : I don’t reside in USA . Just a passerby .
Holeinhead,
Seems to indicate natural gas must be the cheapest way to go as it requires subsidies for energy producers to use it. Interesting.
Looks like power prices will be going up in Texas.
Texasteatwo,
Seems some are complaining that the recent energy bill that you support amounts to socialism, interesting.
See
https://www.texastribune.org/2023/04/05/texas-senate-grid-natural-gas-energy-legislature/
excerpt from piece linked above
Critics have questioned whether state-funded plants would truly stay offline until an emergency strikes or would instead be turned on more often and interfere with market competition. Opponents have also argued it would be inefficient to let a gas plant sit dormant, and consumer advocates have raised concerns about rising bills for consumers.
The Senate Finance Committee set aside $10 billion in its budget proposal to fund at least part of the cost to build the plants proposed in Senate Bill 6, but the House version of the budget does not have the same allocation.
“It represents a costly tax on consumers that does not improve reliability,” said Michele Richmond, executive director of the Texas Competitive Power Advocates, which represents natural gas power generators. “Unfortunately, it sends a clear message that Texas does not believe in the competitive market and will result in state-owned generation systemwide.”
Note for Europeans that “state-owned” is Republican code for what Europeans would call socialism and Americans (especially more conservative citizens) would call communism. I added the bold on state-owned.
https://www.texastribune.org/2023/04/13/texas-power-natural-gas-cost-senate-bill-6/
The piece linked above suggests the cost to build the natural gas peaker plants would be about 18 billion rather than the 10 billion often cited. Could lead to rate increases, if not subsidized by the State government.
More information on Texas energy bills
https://www.utilitydive.com/news/texas-senate-passes-10b-plan-to-develop-10000-mw-of-gas-fired-insurance/647175/
Excerpt:
The Public Utility Commission of Texas in January endorsed a new performance credit mechanism as part of an overhaul of the state’s energy market. It must still be implemented by lawmakers, and critics say it could cost consumers up to $5.7 billion annually with uncertain improvements to reliability.
Rising energy costs in Texas are a major concern. A Lower Colorado River Authority slide deck obtained by Austin NPR station KUT 90.5 estimates the cost of the SB 6 energy insurance program could be as high as $18 billion.
“These bills are part of a package of legislation that could grind renewable energy development in Texas to a halt,” Environment Texas Executive Director Luke Metzger said in a statement. “That would mean more air pollution threatening our health and higher electric costs. Any one of these bills alone would hurt renewables, but together they could kneecap the entire industry. We’re counting on the state House to reject these.”
The windmills business is a black hole you can funnel cash till infinity and never make a profit .
$ 2,2 billion loss in an year from GE .
https://www.windpowermonthly.com/article/1811109/wind-turbine-maker-ge-renewable-energy-confirms-22-billion-2022-loss#:~:text=Wind%20turbine%20maker%20GE%20Renewable%20Energy%20confirms%20%242.2%20billion%202022%20loss,-24%20January%202023&text=US%20turbine%20maker%20GE%20Renewable,hit%20its%20other%20business%20units.
$ 425 million loss last quarter for Siemens .
https://www.reuters.com/business/energy/siemens-energy-cuts-profit-outlook-siemens-gamesa-woes-continue-2023-01-19/
India’s largest turbine manufacturer has never shown a profit , Now more losses .
https://www.business-standard.com/article/pti-stories/suzlon-energy-consolidated-net-loss-widens-to-rs-205-cr-in-march-quarter-122052501114_1.html
I can post here headlines for Vestas , Areva etc all loosing money . However useless fighting the true believers .
Hole in head,
Yes sometimes profits are not good, as is often the case in the oil and natural gas industry as well. Good piece discussing wind industry.
https://www.woodmac.com/news/opinion/wind-industry-faces-a-perfect-storm-of-profit-pressures/
Dennis , ” sometimes profits are not good ” . What sort of economics is that ? Things that make me go —-hmmm .
P.S : Sometimes is what times ? It is understandable for charity organisations .
Hole in head,
Have you followed the oil and gas industry? Are profits positive every year?
The answer is no. Many businesses are cyclical and sometimes businesses operate at a loss as Amazon did for many years.
Texas tea two,
In 2021 China consumed 6.18 EJ of wind power and the US consumed 3.61 EJ of wind power, so not all of their wind turbines are being exported. Over the past decade China’s wind power consumption grew at 24.7% (2011-2021), US wind power consumption grew at only 11.6% and Europe’s by 9.8% over the 2011-2021 period, data from BP Statistical Review of World Energy. Just some facts to chew on. Solar power consumption in China grew at an annual rate of 61% per year over the 2011 to 2021 period. US solar power consumption also grew fairly quickly at about 42% per year over the 2011 to 2021 period. China is making much more rapid progress on ramping wind and solar output than the US or Europe over the past 11 years.
At the World level coal use for electric power generation has slowed. From 1985 to 2014 the annual rate of increase was about 3.4% per year and from 2014 to 2021 it was only 0.6% per year. Chart below uses data from BP’s Statistical Review of World Energy.
Guyana, according to Hess Chief Executive John Hess, is on track to be pumping 1.2 million barrels per day from six FPSOs in the Stabroek Block by 2027. That represents a substantial increase over previous estimates, which put expected petroleum output at 850,000 barrels per day by the end of 2027. This significant increase in estimated production is due to Exxon fast-tracking the development of the Stabroek Block, which the supermajor outlined as a priority in early December 2021. By mid-2022, Exxon was planning to drill 35 wells in the Stabroek Block during 2023, which will likely lead to further quality oil discoveries and potentially drive production to levels higher than anticipated. The January 2023 Fangtooth SE-1 discovery, according to Hess, is so significant it will underpin another development in the Stabroek Block to support an additional FPSO. That will not only bolster the volume of oil resources but support production growth to at least 1.2 million barrels per day and likely even more.
From Oil Price, full piece at link below.
https://oilprice.com/Energy/Crude-Oil/Guyana-To-Pump-12-Million-Barrels-Of-Oil-Per-Day-By-2027.html
OIL MARKET: Crude and condensate floating storage continues to fall, down to 65.1 million barrels, according to the
@IEA
— that’s half the level of a year ago, and **lower** than before covid-19 hit in early 2020. Iran has sold **a lot* of its floating storage | #OOTT #Iran
https://mobile.twitter.com/JavierBlas/status/1646872208449368064?cxt=HHwWgMCz8Ynj7totAAAA
another data point towards a tight and tightening oil market
A long Summary of this morning’s IEA report
• Following an 80 kb/d contraction in 4Q22, world oil demand growth is set to accelerate sharply over the course of 2023, from 710 kb/d in 1Q23 to 2.6 mb/d in 4Q23. Average annual growth is forecast to ease from 2.3 mb/d in 2022 to 2 mb/d, and global oil demand to reach a record 102 mb/d. Rebounding air traffic and the release of pent-up Chinese demand dominate the recovery.
• World oil supply leapt 830 kb/d in February to 101.5 mb/d as the US and Canada rebounded strongly from winter storms and other outages. We expect non-OPEC to drive global output growth of 1.6 mb/d this year, enough to meet demand in 1H23 but falling short in the second half when seasonal trends and China’s recovery are set to boost demand to record levels.
• Russian oil exports fell by 500 kb/d to 7.5 mb/d in February as the EU embargo on refined oil products came into force. Shipments to the EU fell by 800 kb/d to 600 kb/d, compared with more than 4 mb/d at the start of 2022. Sailings to China and India also fell, while cargoes without a destination surged by 600 kb/d to 800 kb/d. Export revenues plunged another $2.7 bn to $11.6 bn, down 42% on a year-ago.
A 52.9 mb January surge in global inventories lifted known stocks to nearly 7.8 billion barrels, their highest level since September 2021 and preliminary indicators for February suggest further builds. Despite solid Asian demand growth, the market has been in surplus for three straight quarters.
While Russian oil production remained near pre-war levels in February, Russia’s exports to world markets fell by more than 500 kb/d to 7.5 mb/d. Shipments to the EU plunged by 760 kb/d to just 580 kb/d. Over the past year, 4.5 mb/d of Russian oil previously going to the EU, North America and OECD Asia Oceania has had to find alternative outlets. Willing buyers in Asia, namely India and, to a lesser extent, China, have snapped up discounted crude oil cargoes, but increasing volumes on the water suggest the share of Russian oil in their import mix may be getting too big for comfort. Russia accounted for around 40% and 20% of Indian and Chinese crude imports, respectively, in February. The two countries took in more than 70% of Russia’s crude exports last month.
While Russian crude oil shipments are almost exclusively heading to Asia, a more diverse set of buyers for products backed out of the EU is emerging. In February, Russian product exports to the EU and its G7 allies slumped by nearly 2 mb/d versus pre-war levels. At the same time, exports to Asia grew by less than 300 kb/d. Shipments to Africa, Türkiye and the Middle East rose by 300 kb/d, 240 kb/d and 175 kb/d, respectively, while Latin America received roughly the same as before the war. The lack of buyers saw oil pile up on the water and product exports drop by 650 kb/d y-o-y.
It remains to be seen if there will be sufficient appetite for Russian oil products now that the price cap is in place or if its production will start to fall under the weight of sanctions. Revenues are already dwindling. In February, Russia’s estimated oil export revenues fell to $11.6 bn – a $2.7 bn decline from January when volumes were significantly higher, and nearly half pre-war levels. Russian fiscal receipts from oil sales were up 22% from January after export taxation rules were adjusted, but at $6.9 bn, just 45% of the level from a year earlier, according to the Russian finance ministry.
At least for this month, Moscow has signalled it will cut output by 500 kb/d. Even so, world oil supply should comfortably exceed demand in the first half of the year. Building stocks today will ease tensions as the market swings into deficit during the second half of the year when China is expected to drive world oil demand to record levels. Global demand is set to surge by 3.2 mb/d from 1Q23 to 4Q23, taking average growth for the year to 2 mb/d. Matching that increase would be a challenge even if Russia were able to maintain production at pre-war levels
Note the effective spare capacity in the last line of the table.
Rigs and Fracs Update
Overall rigs were down by 2 this past week. The Permian gained 2.
Fracs were down by 4
US horizontal rig count is below where it stood in July of 2022. Even worse frac spreads are below where they stood in February of 2022, fourteen months ago.
So what does this mean? Anyone,.. anyone…Buhler… anyone?
https://www.youtube.com/watch?v=uhiCFdWeQfA
It’s “Anyone …. Anyone ….. Beuller”
Ron,
Two things, frac spreads are for oil and gas so potentially fewer gas wells are being fracked (which makes sense at $2/MCF). Second most tight oil growth has been coming from the Permian basin and there drilling rigs are up to their highest level since the pandemic. So I would say this might suggest tight oil output will continue the slow increase that has been happening since June 2020.
We would need to see a decrease in frac spreads and drilling rigs for tight oil output to either stay flat or decrease, depending on the numbers. Only a ban on US crude exports would make tight oil output decrease significantly in the near term.
Rigs by basin and state. The big bet continues to be the Permian.
Compare first and last column for Oklahoma and Texas rigs. Both are dropping. Eagle Ford is the loser in Texas.
https://www.oilystuffblog.com/single-post/x-ports-con
So sure of my 60 plus years as a Texas oil and gas operator, my real life, painful experiences with decline and depletion… and my ten years of research regarding shale oil and shale gas sustainability, I am of the opinion that ANY American advancing the hydrocarbon export agenda is akin to be a traitor to our country’s future.
America’s last remaining refuge for hydrocarbon supply, the Permian Basin, is gassing out, well productivity IS declining, and estimated ultimate recoveries per well are going down.
Yet 75-80% of all Permian HZ tight oil production is being exported to foreign countries, below other world oil price postings, while its associated natural gas is being burned up flare stacks, just to get rid of it. Save for the jobs these exports create, all the other excuses to export our remaining oil resources is a fucking lie.
If you think we have enough remaining tight oil in America to export, or enough associated gas from tight oil wells, to liquify and export, and none of that will adversely affect the future our country, our children, and our long term energy security, you need help, badly.
If natural gas is America’s “future” we should be using it a transportation fuel, or better, as a means of increasing oil recovery rates in shale oil basins. Spending hundreds of billions of dollars on more pipe, more LNG facilities, and more export capacity is stoopid. “Freedom” gas is a joke. America first !
When the Permian is drained of affordable oil, and it WILL be, soon, the list of people participating in this X-Port “Con” in June will someday belong on a post office wall.
Mike
Just wondering if there is a difference in the behaviour between small drillers vs big corporations. Do the small drillers vent the natural gas more so than the big corps? I see that XOM has modified a refinery to make use of tight oil, so I guess some companies are seeing the light.
I agree with you that it would be best to keep and use the LTO at home. However if the refineries can’t use it, what are they to do with the oil?
Would the US be better off importing more oil and reducing production and making the Permian part of the SPR. Not sure how that could be done. The government could claim that they are reducing CC emissions. However the GOP would really have a hey day roasting Biden for reducing oil production.
That would be a logical thing to do provided somebody in the CIA and the EIA would speak up and tell the administration that PO hits in 3 to 5 years from now and have some level of good intelligence to back up that claim.
Thanks Mike,
I agree that exports of oil and natural gas are not a good idea, it seems unlikely that refinery capacity for tight oil will increase, so if exports were not allowed we would need to see tight oil completion rates decrease. Not sure how that happens unless Congress reverses the 2015 decision to allow crude oil exports, any ideas on how the oil and gas industry can be convinced this is a good idea? It would tend to increase crude oil prices, I would think natural gas prices would fall as we produce much more than we consume and only low natural gas prices would reduce the shale gas completion rates to a level that would balance domestic production with domestic supply.
In any case I am on board. Tight oil scenario below assumes Congress passes legislation tomorrow banning US crude oil exports.
Sure Dennis I have a idea on how the oil industry can be convinced that is a good idea.
Let’s put a think on that idea. If we decreased oil on the world market by 5 million bpd ,oil would go up to $300 per barrel, there are a lot of oil men including Mike that would love that. Now how politicians of either party will vote for $300 oil, anyone anyone? That would be what $15 a gallon gasoline.
I have a better idea. Instead of that, because Dennis as you say, we being the US of A can’t refine it, what we need is oil that we can refine. SO lets nationalize all vertical oil wells producing 12BOPD or less. Just confiscate them, that way WE the great communist people of the USA will have the oil we can actually refine to keep the elite’s planes in the air and their limos tanks toped off. Now after we do that, we SELL the LTO for $200 a barrel so that the industry has the capacity to make the further investments.
I am not sure you guys have really though this through.
I am retired from the oil and gas industry now and no longer care what the price of oil is or how much free cash flow the shale oil industry makes, then loses, or never made in the first place. It was never “free;” only dumb people think that. Shale oil was a speed bump in the long road to depletion. My critics simply cannot accept my motives regarding conservation, prevention of waste, and exports are not about… money.
The idea that taking 4.5MM BOPD of lousy 50 API oil off the world market would raise the price of oil to $300 is fucking stupid. Sadly, it is what my industry, and assholes in it, do to make a point; it is straight out of the API manual. They lie and trust that people will believe their lies. Gawd, I wish people would get on to that dung heap.
Oil and gas exports are a direct threat to our nation’s long term energy security and our future as a nation. We now stand alone and we better wake up and keep American oil and natural gas IN America…for Americans.
Mike,
The funny thing is that Texasteatwo seems to think the USA was a communist state from 1975 to 2015 when crude oil exports were not allowed for security reasons. The World market would obviously adjust to lower US tight oil production, OPEC would produce more and oil prices might rise a bit to say $100/bo which Texasteatwo has been rooting for, $300/bo in 2022$ is not in the cards. Texas tea also doesn’t seem to be able to read a chart, my scenario proposes reducing tight oil output by about 4 Mbopd over about 2 years, most of it could be replaced by OPEC on the World market and the US does not use this tight oil, it is exported to other nations.
There is also the possibility that the US will export fewer oil products and reduce the need for the crude oil imports used to produce these, that is up to the refineries based on their profit margins.
I agree many in the oil industry will scream higher oil prices to this proposal.
In 1975 politicians had a little more backbone and chose to do what was best for the nation, they aren’t quite so smart today and have fallen for the Saudi America nonsense, hyped by the tight oil industry.
BP has announced start-up of Argos/Mad Dog II, I think about a year late, which is better than expected at one time.
Overall GoM might now be entering a slower period for EPIC activity. Anchor, Whale, Salamanca, Shenandoah and Ballymore tie-back are in later project stages heading for completion, hook-up and commissioning over the next two years. I haven’t seen any large discoveries announced. There are potential tie-backs around Appomatox, which is operating below nameplate capacity, but I’ve seen nothing new announced there either.
George
Last month you commented that you expected that February GOM production would drop and I agreed with you since the EIA was also showing a drop
https://peakoilbarrel.com/us-january-oil-production-at-post-pandemic-high/#comment-755515
Below is the latest update to the GOM and it is quite a revision. Below are two charts showing last month and the latest revision. GOM production is down 56 kb/d in December 2024. March peak moved back to April. January and February are essentially the same.
EIA numbers are still 30 to 50 higher than operator reported numbers to BOEM, and have been for about a year. February is likely to be down below 1850, maybe below 1800 if Vito start-up doesn’t go perfectly. But I don’t know why the drop after April is so steep. With 100+ from Mad Dog as it ramps up I’d expect the peak above 1950 sometime in July or August, which may be as high as it will get, depending how start-ups on the big five outstanding developments go. With El Nino conditions the hurricane losses will be less than recently, but completely unpredictable.
Previous GOM Forecast
I think the main reason reason for ExxonMobil’s interest in Pioneer is because it is running low on total 2P reserves. Proved natural gas reserves have been steadily declining and are now well below even its pre-XTO purchase numbers. Proved crude reserves and production have been maintained better. However revisions in reserves for both gas and oil have been steadily negative in recent years, implying that probable reserves are low, i.e. net probable reserves are not being converted to proved, which for a operator heavy in conventional is a problem, even if understandable given the maturity of so many of its operations, such as GoM, North Sea, Africa, East Coast Canada, Bass Strait (if it hasn’t sold up there yet) etc. ExxonMobil was recently adding reserves from new discoveries in Guyana, but that source may now be mostly played out, or from new drilling FIDs in the Permian, which may similarly be starting to wane. Since 2006 organic proved reserve replacement ratio has been around 90% and falling slightly for oil, and close to 0% for natural gas. As reserves continue to drop, and with them R/P values, fairly soon larger production drops would be likely to become apparent.
Liquids (ex bitumen).
NG
Dennis
In the last post we had a discussion on the price for WCS. I have found an interesting old chart that possibly you or others can provide insight.
The attached chart shows pricing for WCS at Hardisty, where it’s blended, and Houston and Cushing. What is interesting is the stability of the price in Cushing and Houston. Just roughly $5/b less than WTI.
Looking at Aug 19, the gap to Cushing was $6/b. In Feb 20, the gap is say $13/b. This to me means that a buyer or seller has an option of buying or selling in either place, if the shipping costs are known.
I think that a refinery that needs a heavy crude immediately would buy in Houston or Cushing. However a refinery looking ahead, say two months for delivery, could buy WCS in Hardisy and add shipping costs and it could be cheaper.
I think the same is true for a producer. They could ship their product to Cushing, pay transport and get a better return.
Ovi,
My guess would be that that cost to ship the oil changed and that is reflected in the price differentials, perhaps this has to do with changing status of pipeline projects between Alberta and Cushing, I am unsure if that guess is correct, I would need to research further.
Dennis
It is a mixture of the shipping cost and demand. The August 19 difference is close to the shipping cost. I understand it is roughly $10/b. During the SPR release the discount opened up to $30/b. It has now shrunk to $15/b. So the $15/b could a combination of $10/b shipping and $5/b for normal demand and higher processing cost.
The people who are foaming at the mouth about backup capacity for wind and solar power, insisting that this lack of sufficient backup means we’re going to be in huge trouble during the next big storm, etc, are perhaps DELIBERATELY ( ?????) missing the REAL key point.
A storm means we’re potentially without electricity for a few days.
Depletion means we’re potentially without electricity EVERY day.
You need only a third or fourth grade level of understanding of the meaning of DEPLETION, with a similar level of critical thinking to UNDERSTAND.
And people who are building wind and solar farms in places with good wind and solar resources are producing electricity cheap enough that they can SELL some of their natural gas, profitably, instead of burning it to generate their own electricity.
This is not just about dollars and cents in any case. It’s also a major national security issue.
https://www.cnbc.com/2023/04/16/the-25000-ev-is-coming-with-big-implications-for-car-buyers.html
Tony Seba may be right about the speed at which we transition to electric vehicles.
I for one personally believe that the odds of a major oil supply crisis ( brought on due to a combination of world politics and depletion ) happening within the next few years are anywhere from twenty five or thirty percent on up to maybe pretty close to one hundred percent.
Such a crisis would mean an economic recession for sure, possibly even a depression.
But at the same time it would mean we would be buying electric cars as fast as they can be pushed out of factories.
There is a problem: 60% of global lithium, 47% of the copper, and 95% of the cobalt needed for EV’s is processed in China.
Use more nickel and less cobalt in a lithium-ion battery and you have an unstable system liable to everlasting fire and short trips between recharging. An EV needs 3X the amount of copper as an ICE vehicle of equal size; the U.S. processes only 4% of the copper used.
It would require years to duplicate the processing supply line that China has methodically constructed. Not to be too negative, but eyes-wide-open realistic, China also controls 80% of the precursors used in global pharmaceuticals and almost all the disease-testing kits and reagents.
This is somewhat serious.
If you are interested in the subject of China I’ll recommend this book-
The Chip War-The Fight for the World’s Most Critical Technology
https://www.amazon.com/Chip-War-Worlds-Critical-Technology/dp/1982172002
Its an eye opening education, in many ways.
Or you can listen to a podcasts interviewing the author.
https://podcasts.apple.com/us/podcast/the-most-amazing-and-dangerous-technology-in-the-world/id1548604447?i=1000607306353
Thats how I decided to grab the book to fully digest.
Peak Global Combustion Day…what is your guess?
The day when combined combustion of wood, biofuels, peat dung, coal, nat gas, oil derivatives, etc
reaches an all time maximum.
Certainly it will be a landmark day in the history of humanity.
Many competing factors are at play- from depletion to sanctions, war to incentives, population growth to poverty rates, and a dozen more.
My guess is July 27, 2033
subject to change daily.
btw- take note that all of the earths combustion feedstock energy came from the light emitted by the local yellow dwarf star.
Hickory,
Your guess is a good one in my opinion, though mine would be about 3 years earlier as I expect high fossil fuel prices will hasten the transition to alternatives to fossil fuel, the biofuel use is a relatively small part of the overall mix and I doubt that will grow much in absolute use (rather than share of total) as it is more expensive than alternatives.
Much more pessimistic, but that is just me.
Oil, slowly going down. Gas, at least holding output, but probably going up for a long time. Coal; going down in western nations and up some other places. A bit of an economic issue probably. Has to keep growing until it is not possible. About 2030 I would say – highly uncertain due to the health of the world economy.
Patrick De Haan ⛽️📊
@GasBuddyGuy
·
2h
BREAKING: According to GasBuddy data, weekly (Sun-Sat) US gasoline demand rose 1.4% from the prior week and was 0.5% above the four week moving average. We model consumption at 8.71 million barrels per day.
and
Javier Blas
@JavierBlas
·
4h
CHART OF THE DAY: More signs of the recovery in global aviation, via
@flightradar24
data. The 7-day moving average for 2023 is now 4% above this time in 2019. Domestic / regional leading the way. Still missing quite a lot of jet-guzzling long-haul travelling, however. #OOTT
https://youtu.be/PYmnriCJ18I
As predicted
Mark Jones
Rice University
Houston
In sharp contrast to the Argentine national government, where political leadership and policies have been quite volatile over the course of the past two decades, during this same time period the Neuquén provincial government leadership has been a familiar and reliable partner for the oil and natural gas industry in Argentina’s Vaca Muerta. This status quo could soon be disrupted by the most competitive Neuquén gubernatorial race in memory.
The Vaca Muerta is centered in the province of Neuquén which has allowed the province to become Argentina’s unrivalled producer of natural gas (63% of Argentine production) and petroleum (50% of Argentine production).
On Apr. 16 Neuquén’s 546,000 voters will choose between three viable gubernatorial candidates. If victorious, one of these candidates (Marcos Koopmann) is near-certain to maintain the provincial status quo to which companies operating in the Vaca Muerta have become accustomed over the past two decades. Victory by either of the other two viable candidates (Rolo Figueroa and Ramón Rioseco) could potentially alter this status quo in significant ways, and in doing so generate considerable uncertainty regarding investments and operations in the Vaca Muerta.
https://oilprice.com/Latest-Energy-News/World-News/Hedge-Funds-Dropping-China-Stocks-For-American-Oil.html
hmm selling china and buying american oil, who would have thought that?
“As concerns heightened around geopolitics, Chinese equities were net sold for the first time in a month, driven by risk unwinds with long sales outpacing short covers,” Reuters cited Goldman Sachs as saying, noting that between April 7 and April 13, gross exposure to China shed 2.6%.
At the same time, the surprise oil production cuts by OPEC have rendered American energy shares far more attractive, with investors scooping up shares at a pace that has rarely been seen over the past five years.
What happens when the oil longs have to sale? You know because banks are having to de-risk. We aren’t far from a top 10 US bank going the route of SVB and Credit Suisse.
All the talking heads will say they never saw it coming. But that’s because they ignored the yield curves.
Buffet is even selling banks he has owned for 25-30 years.
HHH
“Buffet is even selling banks he has owned for 25-30 years.”
ok and he is buying oil, maybe you can reconcile those two data points
https://www.nasdaq.com/articles/warren-buffett-continues-to-buy-this-oil-stock-hand-over-fist
North Dakota February Production
It is back to its plateau level between 1,100 kb/d and 1,150 kb/d now that the severe cold weather effects have been restored. February production was up by 96 kb/d over January.
Rig Count
January 46
February 46
March 45
Today 41
The drilling rig count has stalled in the mid-forties, with a gradual increase expected over the next two years.
There are 21 frac crews currently active. Slightly less than 1/2 of rigs.
Ovi,
Interesting start to 2023 as North Dakota Bakken oil production did jump in Feb. However, it should have because JAN-FEB 2022 there was only a total of 68 completed wells vs. 120 completed wells for JAN-FEB 2023. And, now they are doing a lot more 3-mile laterals.
We wish the BAKKEN DRILLING HAMSTERS all the luck in 2023.
steve
Here we are just TWO WEEKS after the OPEC cuts which were supposed to send oil prices into the stratosphere, and oil prices are up…. 50 cents. That shit is Sizzling HOT – Look out!!
https://www.reuters.com/business/energy/oil-holds-above-80bbl-opec-cuts-traders-eye-china-recovery-2023-04-17/
but what’s even funnier is that a lot of stuff is reinflating (food, but who needs that) due to bank bailout and now suddenly dovish fed expectations? this is like an episode of Succession only somehow the people involved are even stupider.
https://tradingeconomics.com/commodity/soybeans
but wait – PPI and CPI ARE DOWN?!?!? could it be because half of california is underwater? I’m sure that’s bullish for global economy and will lead to 0.5% rate CUT.
Russia’s Seaborne Crude Oil Exports Rebound To Above 3 Million Bpd
Russian weekly crude oil exports by sea returned to above 3 million barrels per day (bpd) in the week to April 14, bouncing back from an eight-week low in the previous week, data from vessel-tracking services compiled by Bloomberg showed on Monday.
Last week’s jump in observed Russian crude oil shipments is not reflective of the ongoing production cut of 500,000 bpd and Moscow’s claims that it had cut its output in March by 700,000 bpd.
The latest data showed that the fall in exports in early April may have been short-lived, Bloomberg’s Julian Lee noted, commenting on the tanker-tracking data
Can you really believe what the Russians say
https://oilprice.com/Latest-Energy-News/World-News/Russias-Seaborne-Crude-Oil-Exports-Rebound-To-Above-3-Million-Bpd.html
China’s Refinery Throughput Surges To Record High
By Charles Kennedy – Apr 18, 2023, 2:55 AM CDT
China’s refinery throughput rates climbed to 14.9 million barrels per day in March, the highest level on record.
The rise in throughput was driven by strong demand for fuels from overseas and the need to stock up on fuel ahead of maintenance season.
As well as higher refinery runs, fresh data out of China showed the country’s economy had expanded by 4.5% in the first quarter, adding upward pressure to oil prices.
At some14.9 million bpd, according to data released this week and cited by Reuters, China’s March refinery runs could add upside potential to oil prices as indicative of the country’s continued recovery from pandemic lockdowns.
https://oilprice.com/Energy/Energy-General/Chinas-Refinery-Throughput-Surges-To-Record-High.html
https://www.zerohedge.com/markets/recovery-track-china-economy-rebounds-strongly-45-gdp-jump-q1
looks like oil demand picking up in asia right before the latest rounds of opec plus production cuts start in may and before us driving season picks up, I wonder what that will do to oil prices?
Producer prices are falling like a rock in China. Demand in China isn’t what we are led to believe.
Producer prices in Germany are falling because demand from China isn’t what we are led to believe.
but yet sell china and buy oil? how about sell oil and buy china? 🤣🤣🤣
H.I.S.T.O.R.Y
https://finance.yahoo.com/news/prepare-oil-rally-fed-gets-230834718.html
Filip De Mott
Mon, April 17, 2023, 6:08 PM CDT
In this article:
Since 1988, the final Fed rate hike has been followed by increases in the price of Brent crude three months later.
In those instances, oil has returned 9% on average, according to a note from JPMorgan.
Markets expect the Fed to raise rates one more time in May then pause.
Oil prices are poised to rally soon as the Federal Reserve is expected to pause its rate hikes, analysts at JPMorgan said.
What if you get what you are clamoring for ?
https://wolfstreet.com/2023/04/16/what-would-happen-if-the-fed-caves-to-4-5-core-pce-inflation-and-gives-up-on-2-as-some-folks-are-clamoring-for/
The rent component of CPI is about to fall off a cliff. CPI will be well within FED’s target range shortly.
And no it’s not a good thing. And no it’s not because FED’s rate hikes managed to get inflation under control. It’s because shit broke in monetary system.
Oil prices are poised to fall soon as the FED is expected to cut rates fast and furious back to zero as yield curves and HHH said
https://www.bloomberg.com/news/articles/2023-04-18/china-s-crude-oil-refiners-smash-record-on-recovery-expansion?sref=f2E6A62x&leadSource=uverify%20wall
I wonder if China is doing what India is doing – buying Russian oil on the cheap and exporting the refined products. One thing is for sure, China’s economy has not recovered – not even close.
Even Saudi Arabia and the UAE are doing the same.
https://ca.finance.yahoo.com/news/russian-oil-products-heading-crude-214819552.html
API inventory
Crude -2.675mm (-500k exp)
Cushing -600k
Gasoline -1.00mm (-1.2mm exp)
Distillates -1.9mm (-900k exp)
https://www.zerohedge.com/energy/wti-rises-after-bigger-expected-crude-draw
Oil “rose” 7 cents.
Not very exciting.
In very near term prices likely close the trade gap created by the OPEC cut announcement. Which in technical terms is like putting a tombstone on oil prices.
Oil down $1.58/b to $79.28 this morning.
Down on absolutely no news whatsoever. WTI first few contracts are again a few pennies in contango.
If supply and demand were as tight as we are led to believe contango shouldn’t be a word we are using currently.
a little something for everyone
https://oilprice.com/Energy/Energy-General/The-Hidden-Costs-Of-The-Renewables-Boom.html
Investments in low-carbon energy hit $1.1 trillion in 2022.
“Shortages in crucial industrial metals and rare earth metals could lead to rising prices for renewables.
Hydrocarbons remain very crucial for our energy security.
Something doesn’t seem to be adding up. This something is the hidden cost of renewable energy. It is not something widely talked about because it has the potential to derail transition efforts by casting doubts over the viability of the transition.
Yet the issue is very much clear and present. Why else would China be building as many coal power plants as the rest of the world despite boasting the world’s most wind and solar capacity?”
Oh who said this just last week oh yes ME!
“Everything is getting much more expensive in an already stretched wind industry supply chain,” a senior Siemens Gamesa executive told the FT late last year. In the U.S., the Biden administration last suspended exorbitant tariffs on Asian import solar panels after these caused a slew of new project delays and cancellations because of higher costs.
And who said this exact thing last month, oh yea ME!
argue with the hand boys when the press is covering it it can NO LONGER BE IGNORED🖖
Nobody seems to talk about the replacement issue for renewables. According to EPA, a wind turbine’s life is 20 years. Some say 25, but that’s still not very long. Similar with solar panels, thought the life span there seems to be 30 to 35 years.
Can you imagine if wind and solar were to replace coal and natural gas, as some seem to see as the future, how many turbines and panels would need to be replaced each year? How many of those gigantic blades would need to be disposed of somehow? Where would all those panels go? What would the impact on the environment be? What the cost would be? Has anyone done the math?
My opinion is that the only nuclear power has the potential to replace the energy currently produced by fossil fuels. And that it would be the most environmentally friendly.
Omg what if you had to replace your car in 15 years? And then of course every other American would have to replace their car in 15 years. So they’ll come a day in 15 years when everyone will need a new car and society will collapse! It can’t be done!
Consider – the PV panels and turbines that replace the ones that will become obsolete will likely be 2-3 times as powerful.
Watch the Shanghai auto show. New EVs hitting the market with 200 miles of range for $11K. Then wonder why oil prices can’t go up even when OPEC+ takes millions off the market.
https://www.reuters.com/business/autos-transportation/shanghai-auto-show-crowds-flock-byds-seagull-2023-04-19/
I surely hope that was with the /s missing. So what do you think of uranium mining operations, and where are the resources?
Also, have you thought about the not so small disposal issue?
I think not!
But you could of course give a heads up to SKB, the Swedish agency that plans for long, long, long term storage of the waste that they don´t need copper for the storage capsules, they can just use old windmill blades… /s
https://www.skb.com/future-projects/the-spent-fuel-repository/our-methodology/
Btw. I´ve been involved in and written reports in several SE national and EU funded research projects, and came up with much more polished/tweaked results…
New posts are up
https://peakoilbarrel.com/opec-update-april-2023/
and
https://peakoilbarrel.com/open-thread-non-petroleum-april-19-2023/